Miljø- og Fødevareudvalget 2023-24
MOF Alm.del
Offentligt
Life Cycle Assessment of Packaging
Materials in relation to Extended
Producer Responsibility
Report for the Danish Environmental Protection Agency
Gloria Moscateli
Manon Liscieki
Concetta Lodato
Thomas Fruergaard Astrup
February 2023
MOF, Alm.del - 2023-24 - Endeligt svar på spørgsmål 393: MFU spm. om oversendelse af de i MOF alm. del - svar på spm. 277 omtalte livscyklusanalyser fra DTU, branchen og EU-Kommissionen
Life Cycle Assessment of Packaging Materials in relation to Extended Producer
Responsibility
Report to the Danish Environmental Protection Agency
February 2023
By
Gloria Moscateli
Manon Liscieki
Concetta Lodato
Thomas Fruergaard Astrup
Copyright:
Published by:
Reproduction of this publication in whole or in part must include the customary bibliographic
citation, including author attribution, report title, etc.
DTU, Department of Environmental and Resource Engineering, Bygningstorvet, Building
115, 2800 Kgs. Lyngby Denmark
www.sustain.dtu.dk
2
MOF, Alm.del - 2023-24 - Endeligt svar på spørgsmål 393: MFU spm. om oversendelse af de i MOF alm. del - svar på spm. 277 omtalte livscyklusanalyser fra DTU, branchen og EU-Kommissionen
Contents
1.
2.
2.1
2.2
3.
3.1
3.2
4.
4.1
4.2
4.3
4.4
4.5
4.6
4.7
4.8
5.
5.1
5.2
5.3
5.3.1
5.3.2
5.3.3
5.3.4
6.
6.1
6.2
6.3
7.
7.1
7.2
7.3
7.4
7.5
7.6
7.7
7.8
7.1
7.2
7.3
3
Abstract
Introduction
Background
Objectives
Packaging overview
Materials
Packaging type
LCA goal and scope
Functional unit
Reference flow
Consequential modelling
Geographical and temporal scope
Data collection
Circular Footprint Formula (CFF) formula
Modelling tool - EASETECH
Impact categories
Model set-up
Production Scenario
Use stage
End-of-life Scenarios
Reuse Scenario
Recycling Scenario
Incineration Scenario
Current end-of-life practices
Life Cycle Inventory
Data sources, inventory data and uncertainties
Number of cycles
Weight of packaging products
Interpretation of the results
PET
PE
PP
PS
PLA
Cartonboard
Corrugated board
Aluminium
Paper
Steel
Glass
5
6
6
7
8
8
9
11
11
12
12
12
13
13
13
14
15
16
17
17
17
18
18
19
21
21
21
22
24
24
25
26
27
28
29
29
30
31
31
32
MOF, Alm.del - 2023-24 - Endeligt svar på spørgsmål 393: MFU spm. om oversendelse af de i MOF alm. del - svar på spm. 277 omtalte livscyklusanalyser fra DTU, branchen og EU-Kommissionen
8.
9.
10.
10.1
10.2
11.
11.1
11.2
11.2.1
11.2.2
11.2.3
11.2.4
11.2.5
11.2.6
11.2.7
11.2.8
11.2.9
11.2.10
11.2.11
Conclusion
References
Appendix I
LCI – Electricity modelling update
LCI – Process modelling update
Appendix II
Overview of the climate change potential results
Characterised results for all impact cathegories
PET
PE
PP
PS
PLA
Paper
Cartonboard
Corrugated board
Aluminium
Steel
Glass
34
35
38
38
39
40
41
42
43
44
46
48
50
52
53
54
55
57
58
4
MOF, Alm.del - 2023-24 - Endeligt svar på spørgsmål 393: MFU spm. om oversendelse af de i MOF alm. del - svar på spm. 277 omtalte livscyklusanalyser fra DTU, branchen og EU-Kommissionen
1.
Abstract
Packaging products play a crucial role in protecting, preserving, and promoting products. However, the rapid growth
in packaging material consumption and single-use packaging designs contribute significantly to waste generation.
To address this issue, the European Union has established targets and directives for reducing packaging waste
and increasing reusable packaging in the market through a set of measures to promote a circular economy through
targets on waste reduction, reuse, and minimum recycled content; an example is the Revision of Directive 94/62/EC
on Packaging and Packaging Waste . Denmark also aims for faster implementation of circularity and reusability by
introducing Extended Producer Responsibility (EPR) programs. Implementing EPR policies requires systematic
assessments of a product's environmental impact. Life Cycle Assessment (LCA) is a tool that evaluates a product's
impact throughout its entire life cycle. Conducting an LCA for a product is essential for identifying the most impactful
alternatives, encouraging sustainable design, recycling and reuse, and tracking progress in reducing overall
environmental impacts. This study provides an LCA of selected packaging materials considering three end-of-life
scenarios: i) multiple-loop reuse, ii) multiple-loop recycling and iii) incineration as a reference. The aim is to support
the Danish EPA in implementing EPR policies.
The study found that reuse is the most favourable option for all selected materials and packaging types. Recycling
was the second-best option, with the highest benefits observed for energy-intensive materials like metals and glass.
The incineration scenario was found to be the least desirable option, presenting the highest emissions on the
environment for all materials and scenarios. The report provides comparable impact calculations for the three
scenario types across the selected materials.
Keywords: Life Cycle Assessment, packaging, reuse, recycling, Circular Footprint Formula, Extended Producer
responsibility
5
MOF, Alm.del - 2023-24 - Endeligt svar på spørgsmål 393: MFU spm. om oversendelse af de i MOF alm. del - svar på spm. 277 omtalte livscyklusanalyser fra DTU, branchen og EU-Kommissionen
2.
Introduction
2.1 Background
Packaging products, such as boxes, bottles, and bags, are essential in everyday life. The term "packaging" refers
to the material used to contain a product or item (EC, 2021; EEA, 2018); some examples are bottles, boxes and
bags. The main functionalities of packaging include protecting the product from damage, tampering, and
contamination, e.g. during transportation, distribution and storage (Williams et al., 2020). Even if packaging often
eases our daily challenges, the rapid and continuous growth in material consumption, such as plastics, paper, and
metals, and material complexity significantly contribute to waste generation (EMF, 2021). In addition, most of the
packaging today is designed for single-use, or in other words, to be disposed of after a single use-phase.
According to data from the Danish Environmental Protection Agency (EPA, 2019), in 2019, households in Denmark
generated approximately 474,000 tonnes of packaging waste (EPA, 2020). This accounted for about 31% of the
total household waste generated in Denmark that year. With a recycling rate of packaging waste of 69% in 2019,
Denmark performed slightly better than the European average recycling rate, estimated at around 64% (Eurostat,
2019).
Packaging waste has been addressed in Europe through international, national and local directives and legislation
(EEA, 2022). The recent revision of the European Union's Packaging and Packaging Waste Directive encourages
the reduction of packaging waste and the share increase of reusable packaging in the market (EC, 2022). The
directive also includes recycling rate targets for packaging waste which all Member States should attain: by 2025,
a minimum of 65% by weight of all packaging waste must be recycled, and a minimum of 70% by 2030 (EU, 2018;
EC, 2022).
Denmark, among other countries, advocates for fast implementation of reusability and circularity in packaging.
Currently, the focus is on implementing Extended Producer Responsibility (EPR) programs, which require
manufacturers and retailers to take responsibility for the end-of-life management, such as recycling or incineration,
of their packaging products (Andreasi Bassi et al., 2020). For a practical application of the EPR policy, systematic
assessments for quantification of environmental impacts are needed from production to end-of-life to avoid rebound
effects, e.g. implementing measures that only shift the impact to another product chain.
An LCA is a standardized methodology for quantifying the environmental impacts of products, systems and services
within the system boundaries, for example, from raw material extraction to end-of-life management, providing a
comprehensive understanding of its associated impacts and opportunities for reduction (ISO, 2006a, 2006b). In
this context, one life cycle or single loop refers to the material being extracted, the product manufactured, used by
the customer after purchase at the point of being discarded, and entering the end-of-life stage. The concept of
multiple loops or cycles considers all stages of a product's existence and the potential for materials to be reused
or recycled in subsequent cycles. The number of cycles or loops in the reuse scenario indicates the number of
times a product can be used before it breaks and becomes unusable. Similarly, in the recycling scenario, the
number of cycles reflects the number of times a material can be processed into a new product before it becomes
too degraded to be recycled again. Recycling and reuse are crucial end-of-life scenarios as they promote the
recirculation of materials and products. By minimizing waste and environmental damage, such as CO
2
emissions
and resource depletion, these scenarios aim to extend the life of materials as much as possible. This circular
approach recognizes that the available materials are finite, and their continued use is essential for sustainable
development.
In the context of EPR programs, conducting an LCA that assesses the multiple cycles of a product is essential for
several reasons: 1) Identifying the hotspots, as a consequence, where the most significant improvements can be
6
MOF, Alm.del - 2023-24 - Endeligt svar på spørgsmål 393: MFU spm. om oversendelse af de i MOF alm. del - svar på spm. 277 omtalte livscyklusanalyser fra DTU, branchen og EU-Kommissionen
made; 2) encouraging sustainable design, such as including durability, reparability, and recyclability; 3) tracking
progress and evaluate the effectiveness of the programs in reducing the environmental impact of a product.
2.2 Objectives
The overall goal of this study is to provide the Danish EPA with the potential life cycle environmental impacts
associated with the production, use and disposal of selected packaging products made from various materials.
Three end-of-life scenarios are considered, i.e., multiple-loop reuse, multiple-loop recycling and incineration. The
results are intended for internal decision support at the Danish EPA as part of a broader range of assessments to
define EPR recommendations.
In particular, this study aims to:
•
Collect and review life cycle inventory data for selected packaging products type purchased, used and discarded
in a Danish context;
•
Estimate the number of times the selected packaging products can be reused and recycled;
•
Model the life cycle scenarios for each packaging product in the LCA modelling software EASETECH adopting
a multiple-loop approach;
•
Analyse the potential environmental impacts of each packaging product's end-of-life scenarios.
The study is based on a life cycle assessment (LCA) modelling framework for packaging materials provided in a
previous EPA project from 2021, "Environmental profiles of packaging materials".
7
MOF, Alm.del - 2023-24 - Endeligt svar på spørgsmål 393: MFU spm. om oversendelse af de i MOF alm. del - svar på spm. 277 omtalte livscyklusanalyser fra DTU, branchen og EU-Kommissionen
3.
Packaging overview
3.1 Materials
In this report, the selected packaging is from the post-consumer stage after the use phase. Two types of post-
consumer packaging are studied: 1) primary packaging representing packaging in direct contact with the product,
and 2) secondary packaging representing additional packaging used to protect and contain individual units during
storage, transport, and distribution (Miljø- Og Fødevareministeriet, 2015).
Packaging comprises various materials, from cellulose fibres to plastic or other alloys. The project includes the
most frequently used packaging materials in Danish households and alternative packaging materials as
biomaterials.
More specifically:
•
Fossil plastic (PET, PE, PP, PS);
•
Bio-based plastic (PLA);
•
Metals (aluminium, steel);
•
Fibre-based materials (paper, cartonboard, corrugated board);
•
Glass
The included materials associated with each packaging group are shown in Table 1.
Table 1 - Overview of packaging groups and included materials assessed in this study.
Packaging
group
Fossil-
based
plastic
Material
PET
Full name
Polyethylene
terephthalate
Description
PET plastic is a durable, lightweight material
commonly used in primary packaging products
such as bottles, food containers (Andreasi Bassi et
al., 2021).
PE plastics are included in the polyolefin polymer,
a broad family of polymers with moisture barrier and
toughness properties (Bauer et al., 2021). Low-
Density Polyolefin (LDPE) is used in flexible
applications, e.g. in food bags, whereas High-
Density Polyolefin (HDPE) is a stiff material often
used in applications where rigidity is required, e.g.
boxes (Bauer et al., 2021; Cecon et al., 2021).
PP plastic is included in the polyolefin polymers. It
is often used in primary packaging for flexible and
rigid applications (Chappell et al., 2022; Horodytska
et al., 2018)
PS can be rigid or expended as foam. This study
assesses the rigid PS used for packagings, such as
food trays or cups (Ingrao et al., 2015).
Bio-based plastic is made from a feedstock derived
from a renewable resource (Ali et al., 2023). It is a
niche market representing an emerging alternative
to fossil-based plastics (Rosenboom et al., 2022).
Aluminium packaging comprises>90% aluminium
alloys with other metals, such as copper, zinc, and
PE
Polyethylene
PP
Polypropylene
PS
Polystyrene
Bio-based
plastic
PLA
Polylactide Acid
Metals
Aluminium
-
8
MOF, Alm.del - 2023-24 - Endeligt svar på spørgsmål 393: MFU spm. om oversendelse af de i MOF alm. del - svar på spm. 277 omtalte livscyklusanalyser fra DTU, branchen og EU-Kommissionen
manganese (Zink et al., 2018). Cans and trays
made of aluminium are commonly found in
household packaging.
Steel
-
Steel cans are produced from tin-coated steel,
tinplate, or electrolytic chromium-coated steel (Zink
et al., 2018). Steel packaging is resistant material
mainly used for canned goods (Van Caneghem et
al., 2019).
Paper packaging consists of cellulosic fibres
forming the structure of the material. Various
additives are used during production for
customizing the technical properties, e.g., fillers,
coatings, biocides, and synthetic binders (Hage,
2007; Ma et al., 2023; Zambrano et al., 2021).
Paper is a flexible material often used for dry foods,
e.g. pastries.
Paper and board consist of cellulosic fibres forming
the structure of the material. Various additives are
used during production and for customizing the
technical properties of paper and board, e.g., fillers,
coatings, biocides, and synthetic binders. (Hage,
2007; Ma et al., 2023; Zambrano et al., 2021)
Cartonboard is often used as secondary packaging,
e.g. cartonboard boxes containing a plastic bag.
Creating a corrugated board involves combining
multiple sheets of paper, which are corrugated
before being adhered to a sturdy board and
trimmed into the desired shape (FEFCO, 2019). A
corrugated board is broadly applied as secondary
packaging, for example, for product storage,
transport, and delivery.
Glass consists of a random structure of silicon
dioxide and metal oxides (Zero Waste Europe,
2022). It is commonly used in packaging, e.g., jars,
bottles, and containers.
Fibre-
based
materials
Paper
-
Cartonboard
-
Corrugated
board
-
Glass
-
-
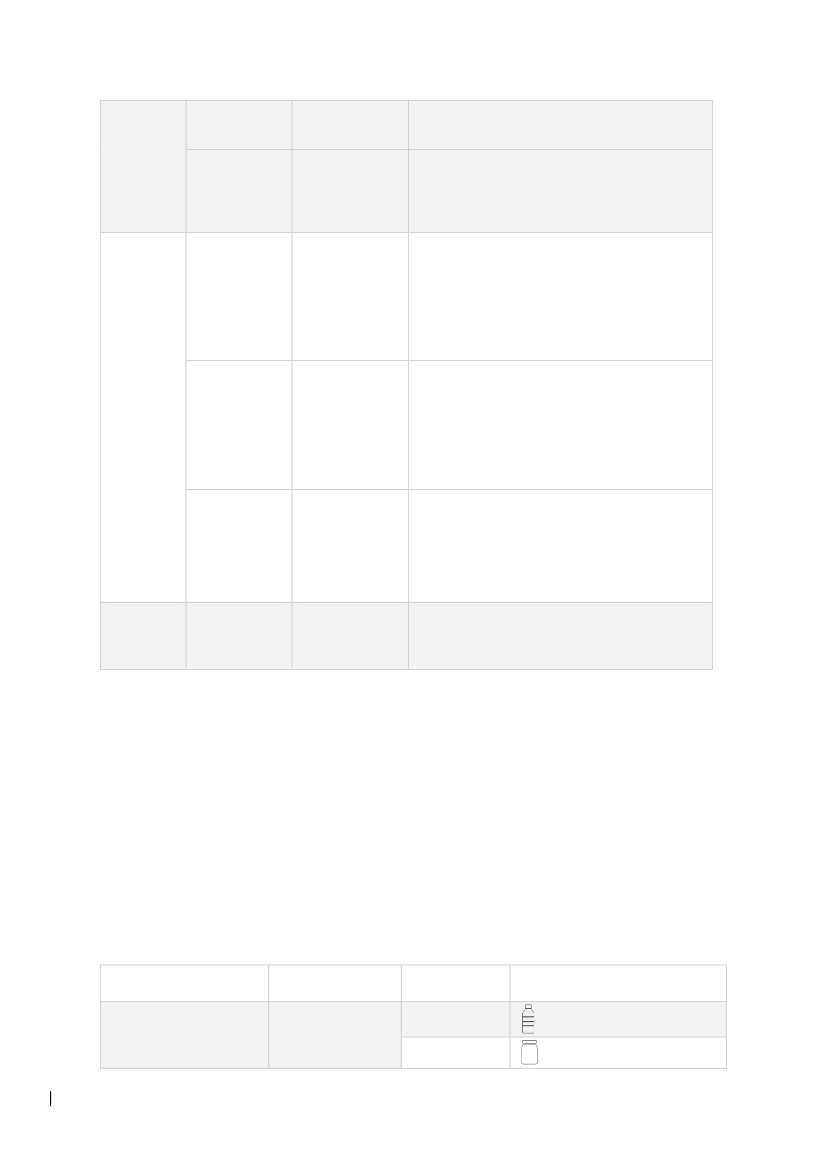
3.2 Packaging type
This study assesses post-consumer primary and secondary packaging, with no specified usage or application,
which can be found in the form of rigid or flexible packaging:
•
Rigid packaging: solid, firm and not easily distorted or deformed. It is typically made from glass, metal,
cartonboard, plastic, or paperboard. Examples include cans, bottles, jars, and boxes – see Table 2.
•
Flexible packaging: soft and pliable packaging can be easily bent, folded and twisted. It is typically made from
plastic, paper, or foil. Often a layer of plastic film or coating is included, but this product-specific option is not
considered in this study. Examples include bags and films
– see
Table 2.
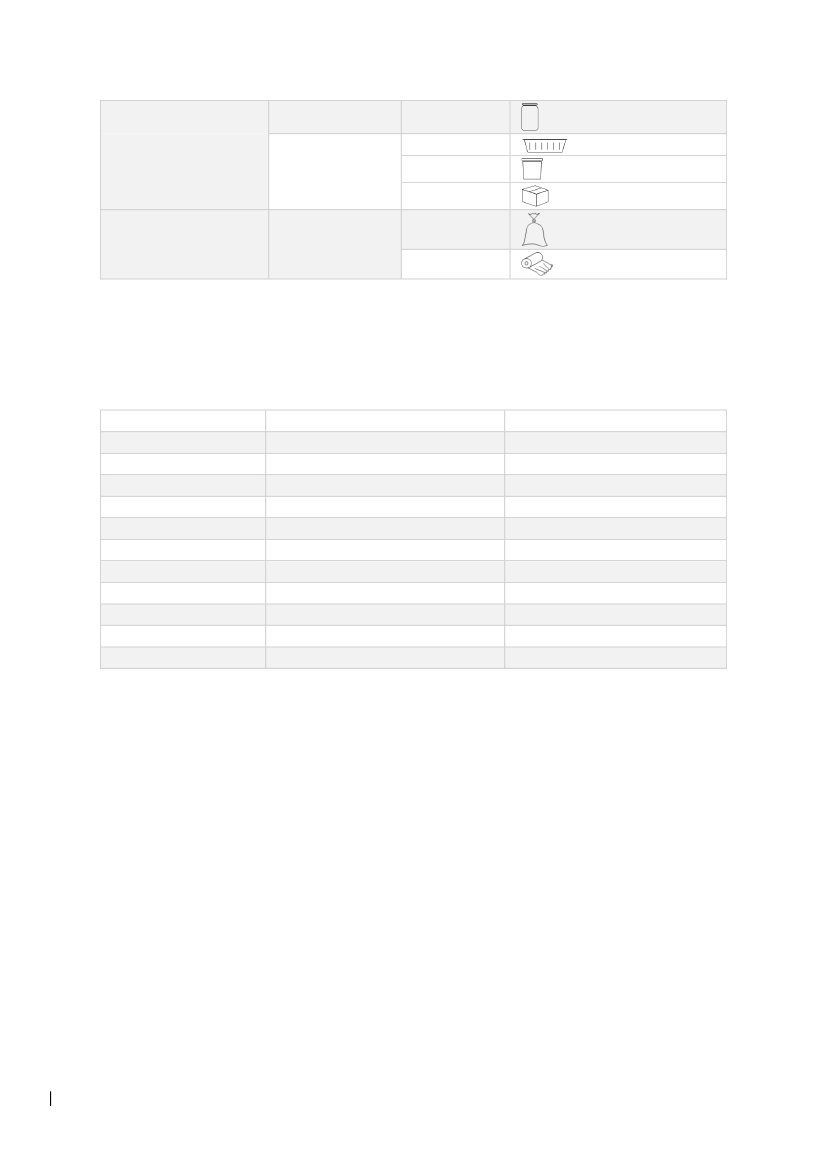
Table 2 - Illustrative example of rigid and flexible packaging.
Packaging design type
Category
Bottle/jar/
can/brick
Product type
examples
Bottle
Jar
Illustration
Rigid
9
MOF, Alm.del - 2023-24 - Endeligt svar på spørgsmål 393: MFU spm. om oversendelse af de i MOF alm. del - svar på spm. 277 omtalte livscyklusanalyser fra DTU, branchen og EU-Kommissionen
Can
Tray
Container
(tray/tub/box)
Tub
Box
Bag
Flexible
Bag/film
Film
Note that not all materials are considered to be used to produce both rigid and flexible products. The combination
of packaging design type-material, as considered in this study, is presented in Table 3.
Table 3 - Materials included in the study for flexible and rigid packaging types.
Rigid
PET
PE
PP
PS
PLA
Aluminium
Steel
Paper
Cartonboard
Corrugated board
Glass
R
R
R
R
R
R
R
T
R
R
R
Flexible
T
R
R
R
R
R
T
R
T
T
T
Both rigid and flexible packaging has the potential to be used multiple times or recycled multiple times. Examples
of reusable packaging are refillable water bottles or reusable shopping bags, which can undergo many uses,
whereas examples of single-use packaging are disposable coffee cups designed to be used once and then
disposed of. Typically, reusable packaging is heavier than the corresponding single-use option made of the same
material, as it is designed to be durable and withstand multiple uses; therefore, more material is needed to make
the same packaging product (Greenwood et al., 2021).
10
MOF, Alm.del - 2023-24 - Endeligt svar på spørgsmål 393: MFU spm. om oversendelse af de i MOF alm. del - svar på spm. 277 omtalte livscyklusanalyser fra DTU, branchen og EU-Kommissionen
4.
LCA goal and scope
This study aims to provide the potential impacts on the environment associated with the production, use and waste
management of selected design options for packaging. As mentioned above, the considered materials are fossil-
based plastic (PET, PE, PP, PS), bio-based plastic (PLA), fibre-based materials (paper, cartonboard, corrugated
board), metals (aluminium, steel), and glass. Only the primary material constituting the packaging is considered,
while other packaging components, such as labels, ink and glue, are not included in the assessment.
The target audience of the study is the Danish EPA. The study aims to be used for internal decision support at the
Danish EPA as part of the background material for implementing Extended Producer Responsibility of packaging
materials. Note that the results presented in the report provide an overview of the environmental performance of
selected packaging materials; they are intended as "baseline results" to support decision-making.
The scope of this LCA includes all stages of the packaging life cycle, from raw material extraction to end-of-life
management. More specifically, the considered life cycle phases are:
•
Raw material extraction: includes all the extraction activities of any raw material constituting the packaging
product, like metal ore mining and oil drilling;
•
Manufacturing: includes all processes required to convert the raw materials into packaging, such as
assembling;
•
Use: includes the usage of packaging by the end-user, in this case, consumers. No process or activity is
included in this stage, as the packaging does not require any resource or energy consumption during the
use stage.
•
End-of-life: includes three end-of-life scenarios, i.e. reuse, recycling, and incineration.
While raw material extraction, manufacturing and use are the same for each product within the material and the
packaging type selected, the end-of-life considers one option at a time, making three different LCA comparable
pathways.
4.1 Functional unit
In LCA, the Functional Unit (FU) represents the object of the assessment and provides the basis for a fair and
quantitative comparison of alternative ways of providing a function or service (ISO, 2006a, 2006b). This unit defines
the function's qualitative and quantitative aspects, like temporal and geographical scope.
This study considers a wide range of materials which can provide different functionalities in terms of the number of
cycles (see Section 6.2), preservation of mechanical properties after recycling, etc. Moreover, packaging of the
same volume has different weights according to their material (see Section 6.3). Reusable packaging is usually
heavier than the corresponding single-use one made of the same material, as it has been designed to be durable
and to withstand multiple uses; hence, more material is required to satisfy the same functionality. Single-use
products are sent to recycling or incineration.
This assessment intends to compare the potential environmental impacts of different packaging materials and
types. The functional unit is defined as:
The amount of rigid and flexible packaging material, expressed in kilograms (kg), needed to contain 1 liter (L) of
volume of an available product used in Denmark between 2020 and 2030.
11
MOF, Alm.del - 2023-24 - Endeligt svar på spørgsmål 393: MFU spm. om oversendelse af de i MOF alm. del - svar på spm. 277 omtalte livscyklusanalyser fra DTU, branchen og EU-Kommissionen
The above-described functional unit allows for a functionally equivalent comparison across packaging materials,
e.g., a 700 g aluminium can serve the same functionality as a 500 g plastic bottle; thus, the results of the LCA can
be compared and aggregated.
4.2 Reference flow
The reference flow represents the amount of material required to fulfil the defined functional unit. The reference
flow varies depending on the material (e.g. steel, PET), the type of packaging design (rigid or flexible), and whether
the packaging is intended for reuse. The reference flows defined in this study are presented in Section 6.3 as the
amount of packaging material required to contain 1 liter of a product used in Denmark between 2020 and 2030.
4.3 Consequential modelling
This LCA follows a consequential modelling approach for evaluating the environmental consequences of changing
the management of the selected materials from the reference scenario representing the current system to several
alternative scenarios (Brandão et al., 2022). It allows for identifying opportunities to reduce those impacts through
product design or selecting more sustainable materials and production processes. Multi-functionality in the model
is handled by system expansion when co-products are used in specific markets and for specific applications (Ekvall
and Weidema, 2004; Weidema, 2003) under the assumption of unconstrain and fully elastic markets (Wernet et
al., 2016).
4.4 Geographical and temporal scope
The production of both primary and secondary raw materials and the manufacturing of packaging products depend
on the market situation of a country. This depends on market factors such as the demand for the materials, pricing,
the accessibility of resources, and the level of technological advancements. In this study, raw material production
is assumed to happen in Europe. In line with the project scope, processes related to converting virgin raw materials
into packaging products, sorting before recycling, reuse and incineration are assumed to happen in Denmark.
Reprocessing in the recycling pathway is handled in Europe except for glass packaging, which is assumed to occur
in Denmark.
An overview of the specific geographical scope for each modelled scenario option for all packaging materials is
presented in Table 5.
Table 4 - Geographical scope of production and end-of-life scenarios for the selected packaging materials.
Raw
material
production
Europe
Europe
Europe
Europe
Europe
Europe
Europe
Europe
Europe
Conversion
into packaging
Denmark
Denmark
Denmark
Denmark
Denmark
Denmark
Denmark
Denmark
Denmark
Recycling-
reprocessing
Europe
Europe
Europe
Europe
Europe
Europe
Europe
Europe
Europe
Material
PET
PE
PP
PS
PLA
Paper
Cartonboard
Corrugated
board
Aluminium
12
Reuse
Denmark
Denmark
Denmark
Denmark
Denmark
Denmark
Denmark
Denmark
Denmark
Sorting
Denmark
Denmark
Denmark
Denmark
Denmark
Denmark
Denmark
Denmark
Denmark
Incineration
Denmark
Denmark
Denmark
Denmark
Denmark
Denmark
Denmark
Denmark
Denmark
MOF, Alm.del - 2023-24 - Endeligt svar på spørgsmål 393: MFU spm. om oversendelse af de i MOF alm. del - svar på spm. 277 omtalte livscyklusanalyser fra DTU, branchen og EU-Kommissionen
Steel
Glass
Europe
Europe
Denmark
Denmark
Denmark
Denmark
Denmark
Denmark
Europe
Denmark
Denmark
Denmark
The temporal scope of the study has been set to cover the period from 2020 to 2030. To ensure that the LCA
accurately reflects this time frame, the current and future technology data has been specifically adapted for this
period.
4.5 Data collection
The modelling and input data are based on the life cycle assessment modelling framework for packaging materials
included in the EPA project "Environmental profiles of packaging materials" (EPA, 2022), including a thorough data
quality assessment of the input data. Most external processes are imported from the Ecoinvent database, version
3.6, and updated to version 3.8 for use in this study. Data for material composition and the incineration process
are obtained from the library of the LCA software EASETECH (Section 4.7).
Several assumptions are made due to insufficient data availability in literature, mainly about multiple-loop
information on recycling and reuse (see Chapter 6 about Life Cycle Inventory).
4.6 Circular Footprint Formula (CFF) formula
When modelling multiple product cycles, the distribution of the environmental impacts among the individual cycles
may be relevant (Rigamonti et al., 2020). Although the modelling in this study assesses the packaging product life
cycle in its entity, the Circular Footprint Formula (CFF) developed by the European Commission is applied to
distribute impacts between individual parts of the product life cycle and to avoid double-counting (EC, 2018). The
circular footprint formula involves a range of parameters, including the “A” factor distributing the environmental
impacts between the upstream production and the downstream end-of-life phases. Thus the impacts are modelled
in two parts (upstream part, i.e. production scenario, and downstream parts, i.e. end-of-life scenario) according to
the A factor (following the recommendations from European Commission for its values):
-
0.2
is used when there is a greater demand for high-quality secondary material than what is being
produced. This study uses this value for metals, fibre-based packaging and glass.
0.5
is used when there is an equilibrium between offer and demand. This study uses this value for plastic
(fossil and bio-based).
0.8
is used when less high-quality secondary material is demanded than produced.
-
-
For more information regarding applying the CFF formula in this project, refer to Section 3.3 in the EPA project
"Environmental profiles of packaging materials – LCA model documentation".
4.7 Modelling tool - EASETECH
This study uses the software EASETECH (Environmental Assessment System for Environmental Technologies)
for the LCA modelling (Clavreul et al., 2014). EASETECH is a process-oriented tool developed at the Technical
University of Denmark to support LCA studies in waste management. When modelling environmental technologies,
the material flows can consist of a very heterogeneous mix of materials; it is crucial to maintain this information
throughout the modelling process. EASETECH is a material flow-based tool where the material flow is defined as
different fractions having physical, chemical, biochemical and nutritional properties associated and tracked in the
model across the entire system, considering material transformation and transition from one process to another
13
MOF, Alm.del - 2023-24 - Endeligt svar på spørgsmål 393: MFU spm. om oversendelse af de i MOF alm. del - svar på spm. 277 omtalte livscyklusanalyser fra DTU, branchen og EU-Kommissionen
within the system boundaries (Lodato et al., 2021). Recently, more features have been implemented into
EASETECH, expanding the application of LCA on more complex systems within waste management (Lodato et
al., 2021).
4.8 Impact categories
The potential environmental results are generated in EASETECH using the Environmental Footprint (EF) 3.0
methodology without Long Term impacts, thereby focusing only on the impacts that occur during the life cycle of
the products, i.e. short-term impacts.
The final results of the LCA are presented as characterized impacts, i.e., direct and indirect emissions associated
with the modelled scenarios are converted into standard units and aggregated within each impact category. The
short name and characterized unit for each impact category are listed in Table 5.
A non-zero characterisation factor is applied for biogenic CO
2
-emissions to reflect the temporal effects from an
instant release of CO2 in the case of waste incineration of biogenic materials such as wood relative to the much
slower uptake of CO
2
from regrowing of the corresponding biomass (e.g. through forestry). For details, please refer
to Faraca et al., 2019.
Table 5 - Overview of selected impact categories included in the EF 3.0 methodology.
Impact category
Climate change
Ozone depletion
Human toxicity, cancer effects
Human toxicity, non-cancer effects
Particulate matter/respiratory inorganics
Ionizing radiation, human health
Photochemical ozone formation, human health
Acidification
Eutrophication terrestrial
Eutrophication freshwater
Eutrophication marine
Ecotoxicity freshwater
Land use
Resource use, minerals and metals
Resource use, energy carrier
Short name
CC
OD
HT-C
HT-nC
PM
IR
POF
TA
ET
EF
EM
EcoF
LU
RUMM
RUEC
Characterized unit (CU)
kg CO
2 eq
kg CFC
-11 eq
CTUh
CTUh
Disease incidences
kBq U
235 eq
(to air)
mol H
+ eq
mol N
eq
kg N
eq
kg P
eq
kg N
eq
CTU
e
-
kg SB
eq
MJ
14
MOF, Alm.del - 2023-24 - Endeligt svar på spørgsmål 393: MFU spm. om oversendelse af de i MOF alm. del - svar på spm. 277 omtalte livscyklusanalyser fra DTU, branchen og EU-Kommissionen
5.
Model set-up
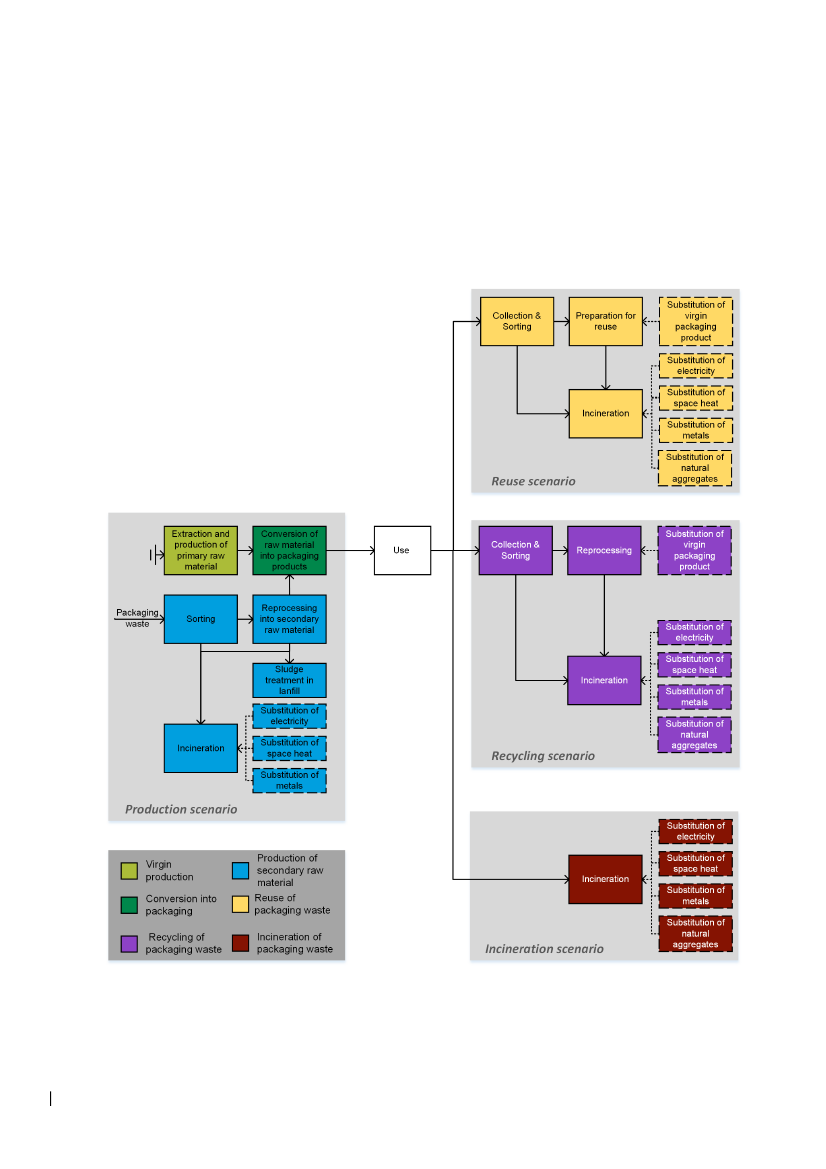
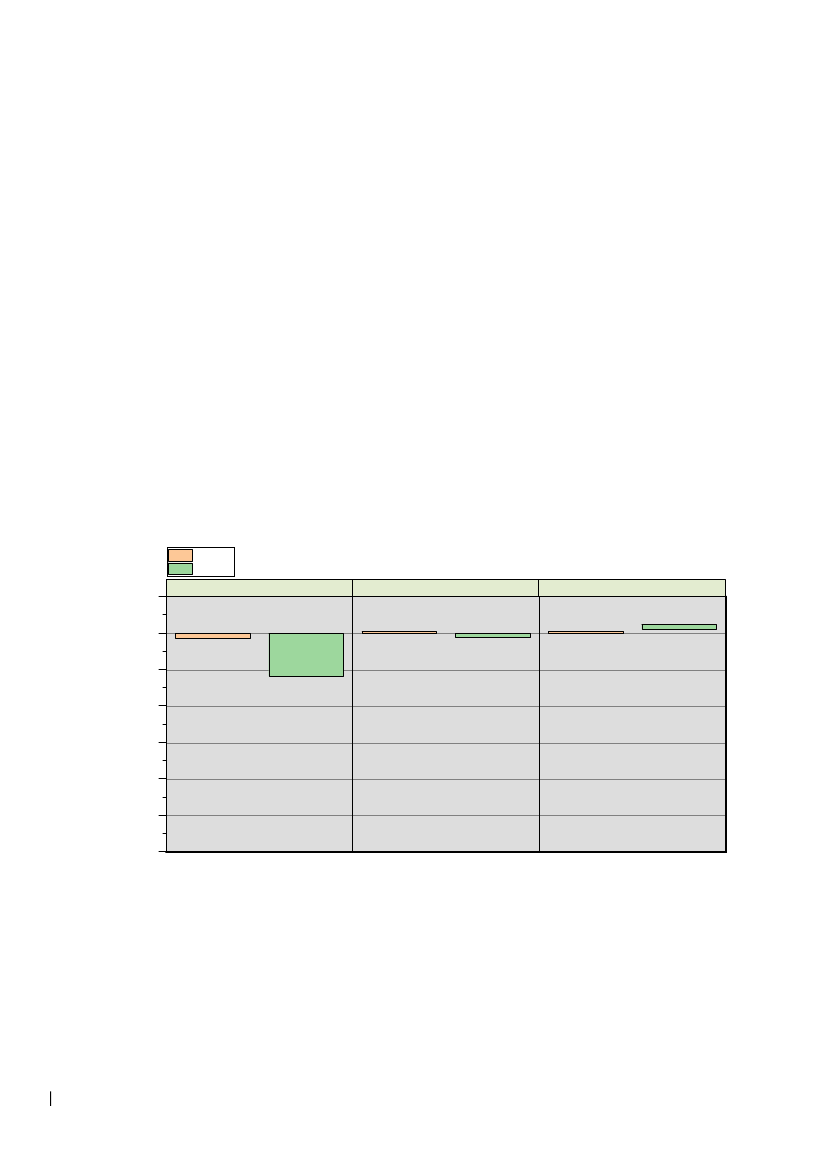
An overview of the process flow diagram for the selected packaging products is illustrated in Figure 1 and described
in more detail in the sections hereafter. Primary raw material extraction and production (light green) and secondary
raw material production (blue) are followed by the conversion into packaging step (dark green). After the use stage,
the model considers three end-of-life scenarios: the reuse scenario (yellow), the recycling scenario (violet) and the
incineration scenario (red). Note that the transportation of the products is not included in this assessment.
Figure 1 - Process flow diagram for selected packaging products: production scenario, use stage, and end-
of-life scenarios. Dotted lines refer to material and energy substitution.
15
MOF, Alm.del - 2023-24 - Endeligt svar på spørgsmål 393: MFU spm. om oversendelse af de i MOF alm. del - svar på spm. 277 omtalte livscyklusanalyser fra DTU, branchen og EU-Kommissionen
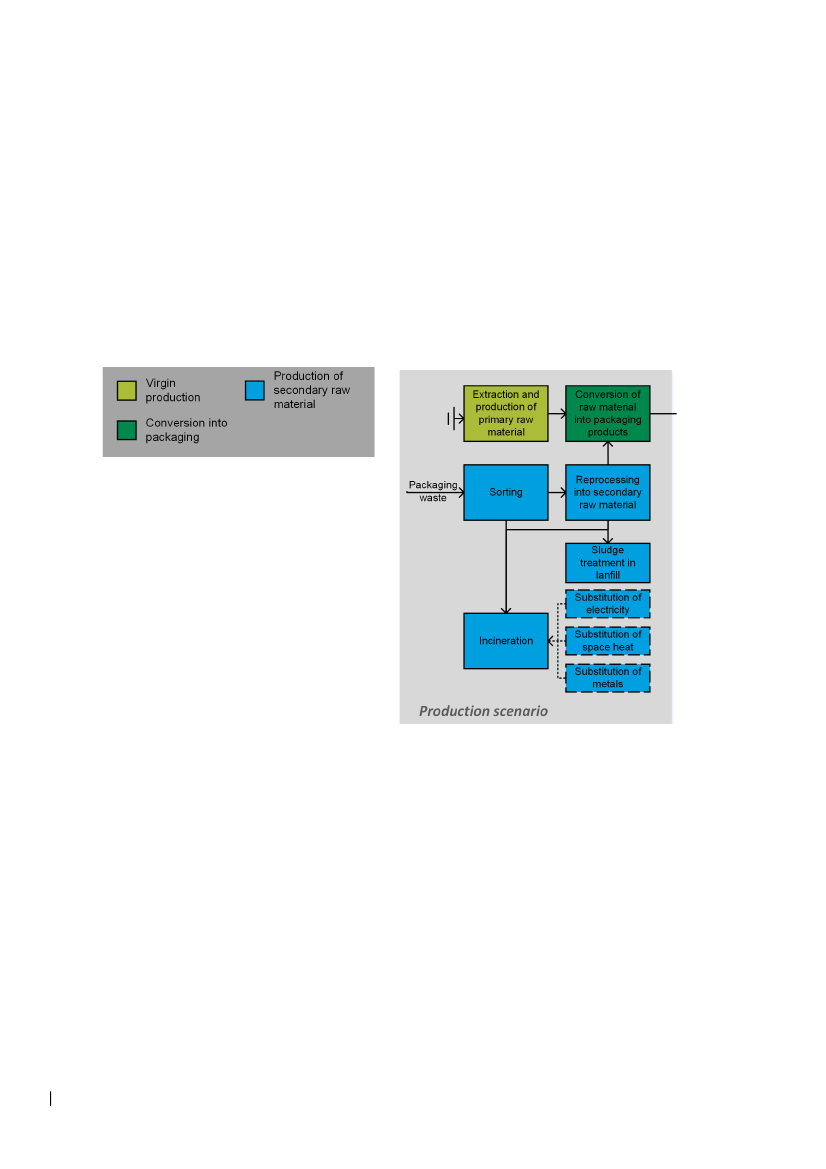
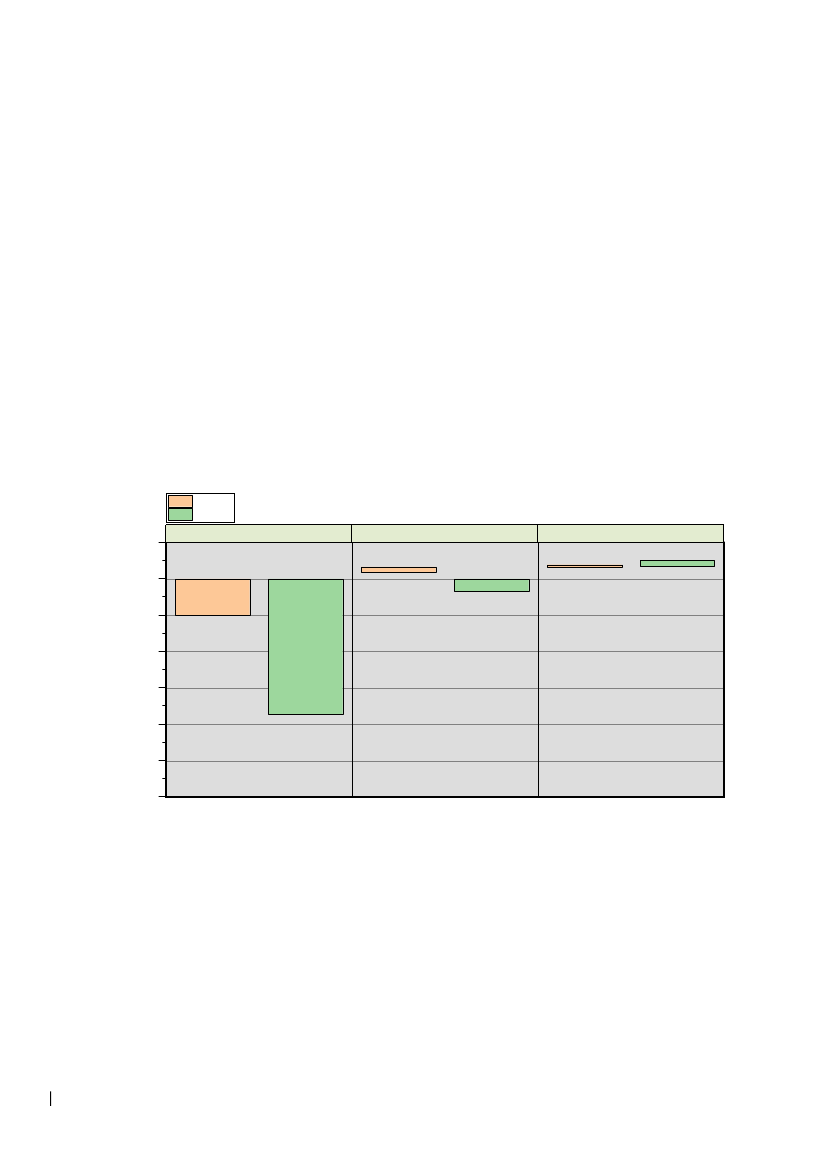
5.1 Production Scenario
The processes modelled in the production scenario are presented in Figure 2Error!
Reference source not found..
The model includes the following production scenario alternatives:
•
Primary raw material production (light green in Figure 2Error!
Reference source not found.):
refers to the
extraction and production of plastic from virgin resources;
•
Secondary raw material production (light blue in Figure 2Error!
Reference source not found.):
refers to the
recovery process of materials from existing products, i.e. in this study, packaging products, through mechanical
recycling. For example, when a plastic bottle reaches its end of life can be processed into plastic pellets. More
information related to the recycling process can be found in Section 4.3.2.
Primary and secondary raw materials are then converted into finished packaging products (dark green in Figure
2).
Figure 2 - Overview of processes modelled in the production scenario. Dotted lines refer to material and
energy substitution.
The recycled content (RC) at the “conversion of raw material into packaging products” in Figure, when the virgin
production flow merges with the secondary material production flow, varies between 0% and 100%, with RC=0%
indicating a product made only of virgin materials, and RC=100% indicating a product entirely made of recycled
materials. In this study, in order to display an intermediate situation, the final results are presented for a recycled
content of 50%, i.e. half from virgin and half from recycled materials (EU, 2018). In reality, the share of recycled
content in a packaging product varies depending on the material type and its end-of-use, e.g. for safety and hygiene
reasons, packaging for certain products, such as medical supplies or food, may require higher levels of recycled
content to be excluded to ensure the safety of the end user (Franz and Welle, 2022). On the other hand, products
with less stringent requirements may use a higher percentage of recycled content without compromising product
quality or safety (BRF, 2020). Therefore, the share of recycled content in a packaging product may vary depending
on the specific end use of the product.
16
MOF, Alm.del - 2023-24 - Endeligt svar på spørgsmål 393: MFU spm. om oversendelse af de i MOF alm. del - svar på spm. 277 omtalte livscyklusanalyser fra DTU, branchen og EU-Kommissionen
5.2 Use stage
The use stage is assumed to be burden free. No processes are associated with this stage.
5.3 End-of-life Scenarios
The model includes the following end-of-life scenarios:
•
Reuse
•
Recycling
•
Incineration
5.3.1
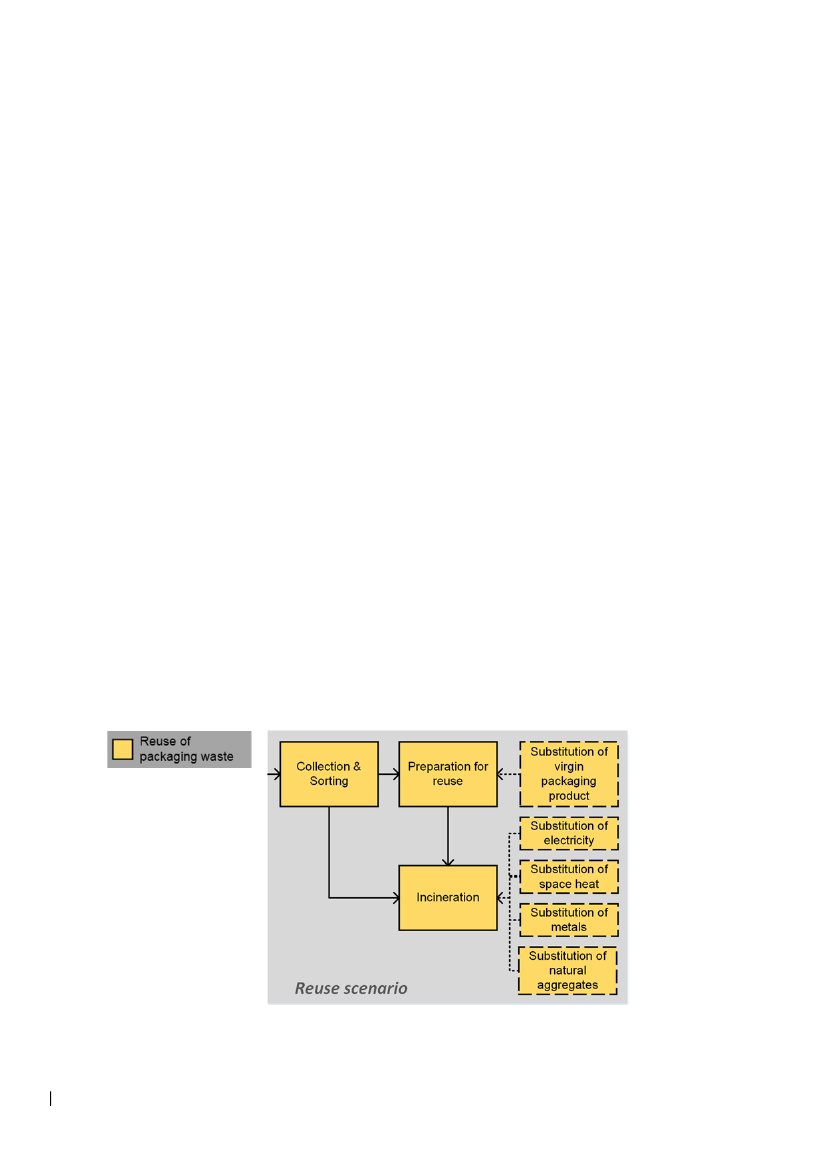
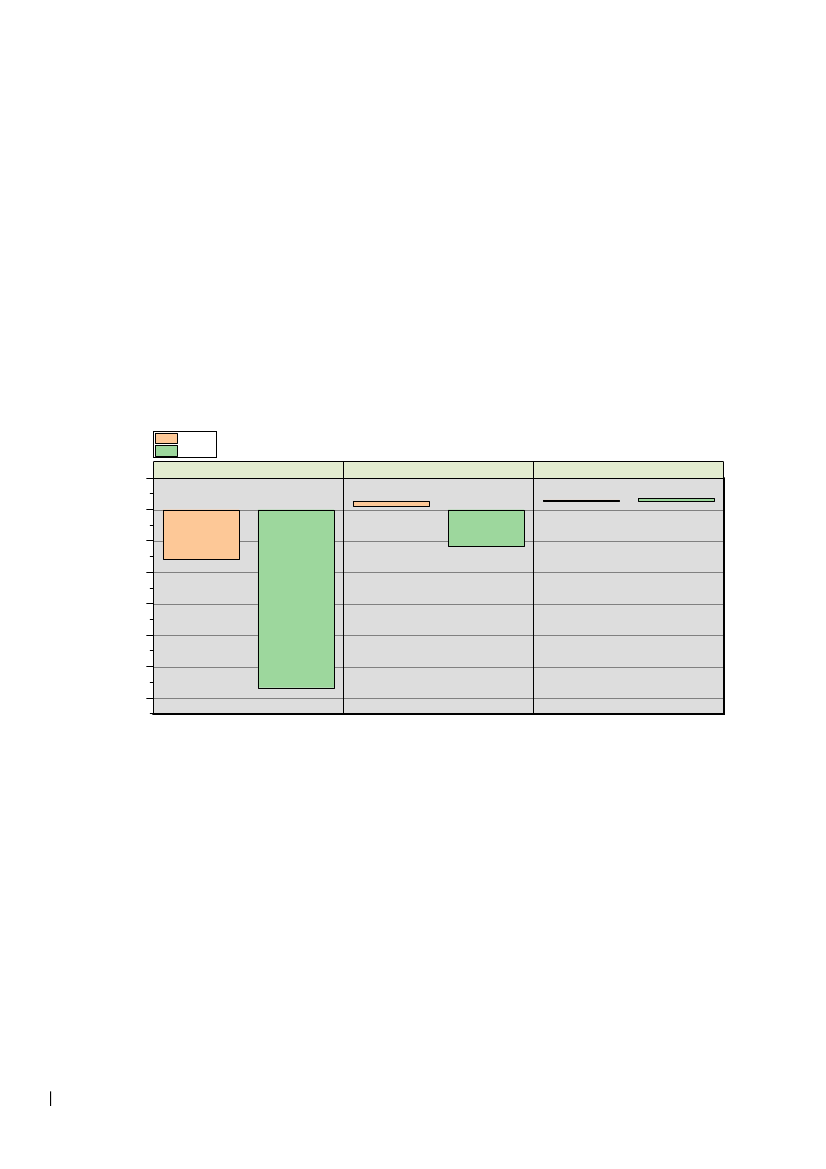
Reuse Scenario
After being used, the packaging waste undergoes a sorting activity at Material Recycling Facilities (MRFs), where
the broken or deformed packaging is discarded and sent to incineration (see Section 0). The remaining waste can
be prepared for being used again through cleaning and sanitizing processes. This process can slightly differ from
one material to another. For instance, the washing activity is performed for most products while not included in
paper and cartonboard. Moreover, differences may occur in the kind of detergent and solvent used to clean and
sanitize the types of packaging. However, for simplicity, such variations are not considered in this study.
The reuse scenario has the main advantage of reducing waste and conserving resources by avoiding production
of the virgin raw materials and the activities involved in the conversion into packaging, which in this study are
assumed to be substituted at every cycle.
The packaging product could be sent for recycling when packaging reuse is impossible. This option is not
considered, as the three end-of-life scenarios are compared directly in this study. Consequently, the residues from
the sorting and preparation for reuse stages are sent to incineration.
The above-described processes, represented in Figure 3Figure 3 - Overview of processes modelled in the
reuse scenario. Dotted lines refer to material and energy substitution.
, are referred to in this report as the "Reuse" scenario.
Figure 3 - Overview of processes modelled in the reuse scenario. Dotted lines refer to material and energy
substitution.
17
MOF, Alm.del - 2023-24 - Endeligt svar på spørgsmål 393: MFU spm. om oversendelse af de i MOF alm. del - svar på spm. 277 omtalte livscyklusanalyser fra DTU, branchen og EU-Kommissionen
5.3.2
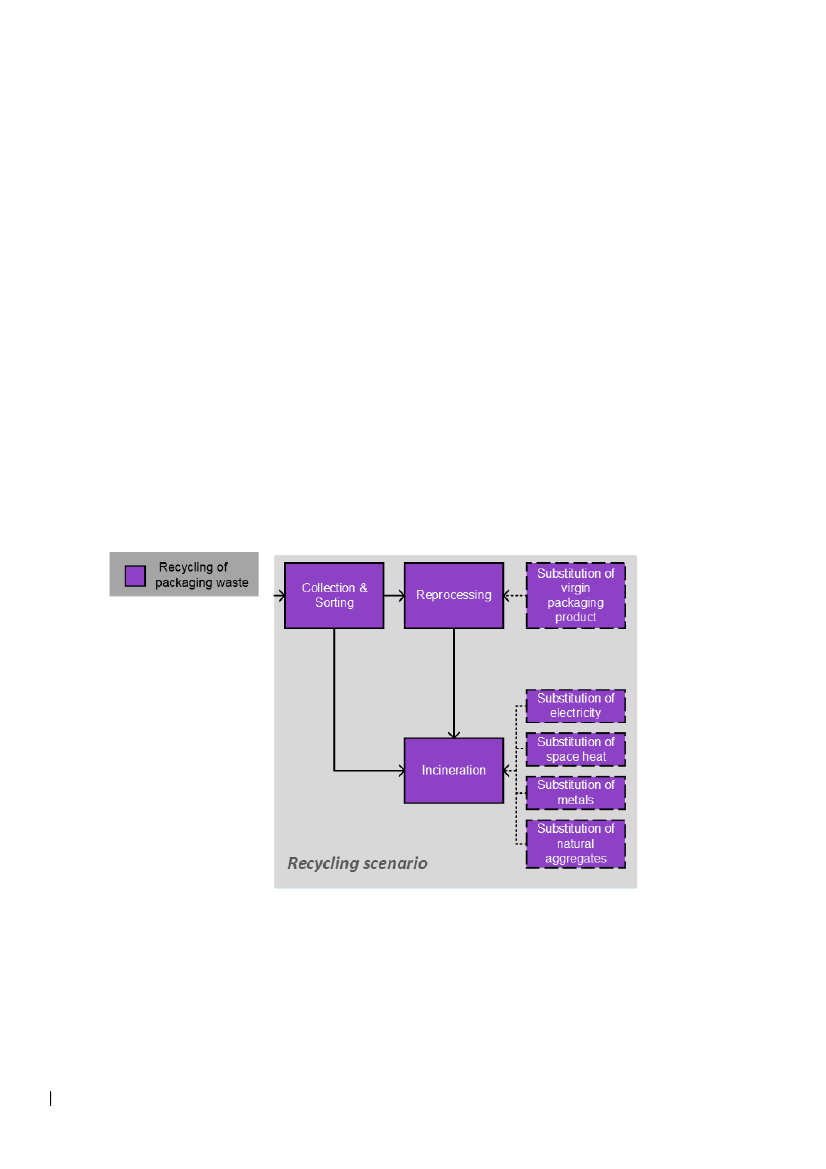
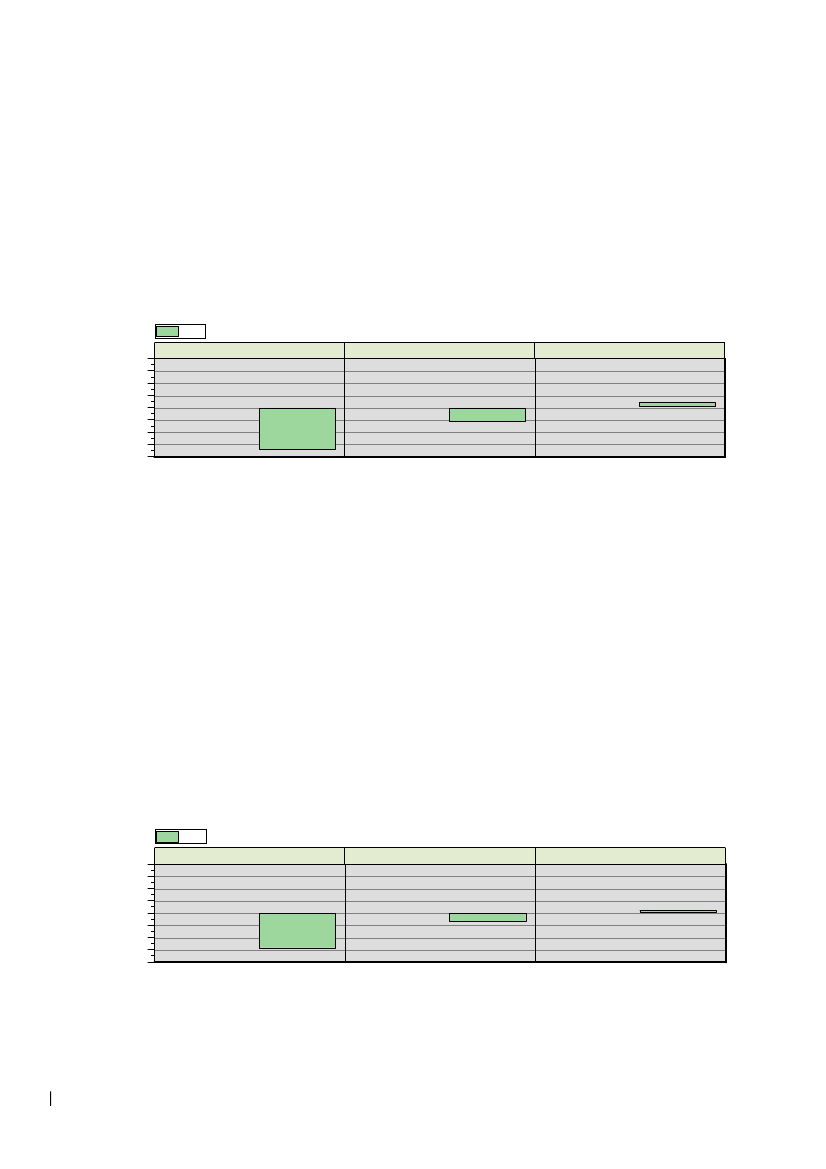
Recycling Scenario
Packaging recycling refers to handling packaging waste and converting it into raw materials. The recycling process
can change depending on the type and material being treated; however, it generally includes the following steps:
collection and sorting, reprocessing and treatment of the residues.
After being used for its primary function, the packaging is collected from households, businesses, and other sources
and brought to MRFs, where material types separate the waste, such as metals, paperboard and plastics, either
manually or through sorting machines. The sorted materials are then reprocessed and, in this study, assumed to
substitute virgin raw material to produce single-use packaging. This work considers mechanical recycling as a
reference for reprocessing the selected packaging materials; therefore, activities like grinding and shredding are
the main modelled processes.
The residues from the sorting and reprocessing activities are treated through incineration. Section 0 provides more
information.
The processed materials are then used to manufacture new products, such as other packaging, distributed to
consumers and businesses. These two last steps are out of the scope of this study and thus not included in the
model set-up.
The above-described processes, graphically represented in Figure 4, are referred to in this report as the "Recycling"
scenario.
Figure 4 - Overview of steps modelled in the recycling scenario. Dotted lines refer to material and energy
substitution.
5.3.3
Incineration Scenario
Packaging products and their residues from other processes can be disposed of through incineration. The
incineration process involves combusting waste materials at high temperatures in incineration plants, typically
within the temperature range of 850 to 1100°C (EC, 2020). This converts the heat produced into electricity and
18
MOF, Alm.del - 2023-24 - Endeligt svar på spørgsmål 393: MFU spm. om oversendelse af de i MOF alm. del - svar på spm. 277 omtalte livscyklusanalyser fra DTU, branchen og EU-Kommissionen
heat (Ekvall et al., 2021). Once the waste is combusted, it is possible to recover metals from the ashes through
manual sorting, magnetic separation, and eddy current separation (Christensen, 2010). Furthermore, incinerator
ash can be recovered as natural aggregates, substituting for filler materials used in road construction or aggregates
in building materials (Christensen, 2010).
Incineration with energy recovery is a well-established waste treatment in Denmark with Amager Bakke in
Copenhagen as a recent example. The plant has high energy recovery efficiencies and uses advanced air pollution
control technology to minimize emissions of pollutants such as nitrogen oxides, sulfur dioxide, and dioxins (ARC,
2020).
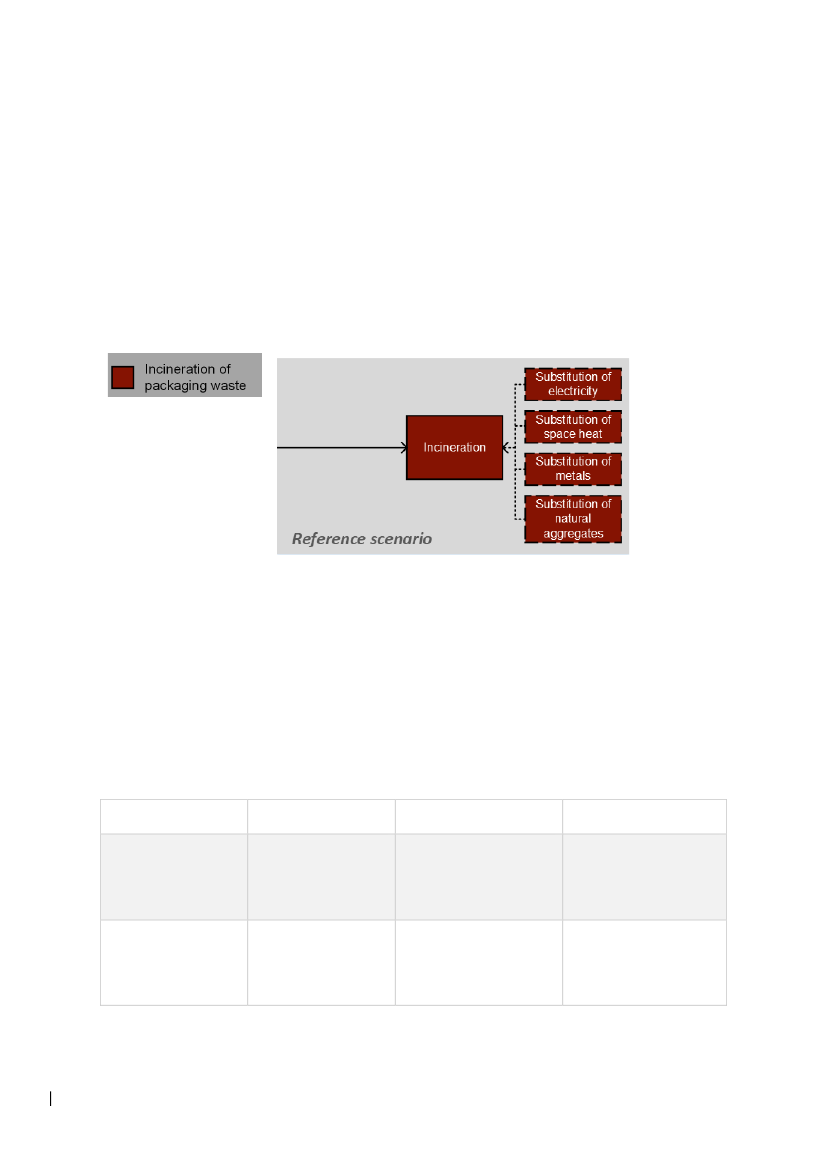
The above-described processes, graphically represented in Figure 5, are referred to in this report as the
"Incineration" scenario.
Figure 5 - Overview of processes modelled in the incineration scenario. Dotted lines refer to material and
energy substitution.
5.3.4
Current end-of-life practices
An outline of the present state of technology development for all packaging materials' three end-of-life options is
provided in the following table.
Table 6 - An overview of the current practices for managing the end-of-life of the chosen packaging
materials - adapted from the EPA project "Environmental profiles of packaging materials"
Material
Fossil plastic types
(PET, PE, PP, PS)
(Abbasi et al., 2022;
EPA, 2019)
Biobased
plastic
types (PLA)
(Razza et al., 2020;
Rosenboom et al.,
2022)
Reuse
Packaging made from
fossil plastic is not
currently reused
Recycling
Source separation is still
maturing in Denmark.
Recycling in Europe with
established technologies
PLA:
Neither
source
separation nor recycling is
well-established
Incineration
Incineration is the default
treatment, if not directed
to
recycling
through
source-separation
Incineration is the default
treatment, if not directed
to
recycling
through
source-separation
Biobased
plastic
packaging
is
not
currently reused
19
MOF, Alm.del - 2023-24 - Endeligt svar på spørgsmål 393: MFU spm. om oversendelse af de i MOF alm. del - svar på spm. 277 omtalte livscyklusanalyser fra DTU, branchen og EU-Kommissionen
Fibre-based
materials
(Paper, cartonboard,
corrugated board)
(EPA,
2007)
2019;
Hage,
Fibre-based
packaging
is
currently reused
not
Well-established source
separation
and
technologies for recycling
fibre-based materials
Incineration is the default
treatment, if not directed
to
recycling
through
source-separation
Metals
(aluminium, steel)
(Van
Caneghem et al.,
2019)
Glass
(Agnusdei et al., 2022)
Metal packaging is not
currently reused
Well-established
technologies for recycling
metals. Source separation
is still growing in Denmark
Well-established source
separation
and
technologies for recycling
glass
Incineration is the default
treatment, if not directed
to
recycling
through
source-separation
Incineration is the default
treatment, if not directed
to
recycling
through
source-separation
From unbroken glass
packaging collected at
glass cubes
20
MOF, Alm.del - 2023-24 - Endeligt svar på spørgsmål 393: MFU spm. om oversendelse af de i MOF alm. del - svar på spm. 277 omtalte livscyklusanalyser fra DTU, branchen og EU-Kommissionen
6.
Life Cycle Inventory
6.1 Data sources, inventory data and uncertainties
Data and processes are modelled predominantly based on primary data, when available, or data from literature.
While extensive data collection has not been part of this study, the inventory data are primarily based on a previous
EPA report "Environmental profiles of packaging materials - LCA model documentation” (EPA, 2022), including
appendices with relevant data for the selected packaging materials in context of the three end-of-life scenarios.
Production and conversion of raw materials into packaging were modelled mainly based on processes from the
Ecoinvent database, amended with data from other sources, such as literature and primary data, if data were not
available in Ecoinvent.
End-of-life options were modelled as distinct processes, relying on data from literature or primary sources. As
outlined in the documentation, these flow values were either added as individual values or data ranges based on
the available data (EPA, 2022). The values presented as ranges allow for the inclusion of potential variations in
flow values, e.g., sorting and reprocessing efficiency for the packaging products and different process/technology
uses. Data on material composition and incineration processes were obtained from the library of the LCA model
EASETECH.
In this study, additional focus was placed on estimating the number of cycles for the reuse and recycling scenario
(see Section 6.2) as well as the packaging product weight (see Section 6.3). Additionally, the Ecoinvent data were
updated to version 3.8 relative to version 3.6 in the previous EPA report (EPA, 2022). Changes were applied
primarily to marginal electricity in Europe and a few other processes, as outlined in Appendix I.
The EASETECH modelling software uses parameters with defined data intervals assigned a uniform probability
distribution for equal probability within the data range. For the uncertainty analysis, 1000 Monte Carlo simulations
were included: at every simulation, the model extracts a value for each parameter within the defined data interval
following the assigned probability distribution. The results are presented with a 95% confidence interval.
6.2 Number of cycles
The number of cycles or loops is identified for the reuse and the recycling end-of-life scenarios. In the reuse
scenario, the number of cycles indicates the number of times a product can be used before it breaks and becomes
unusable. Similarly, in the recycling scenario, the number of cycles reflects the number of times a material can be
processed into a new product before it becomes too degraded to be recycled again. These two values refer to
different life cycle stages of a product.
In both cases, the number of cycles varies depending on factors related to the product or the involved processes
(Geueke et al., 2018). Generally, packaging made of metals or specific types of plastic has a lower integrity loss
than packaging made of other materials, such as paper (Rigamonti et al., 2020). This is highly affected by the
product's intended use and how this is used and maintained. For instance, paper and cartonboard are relatively
durable materials but easily weakened by moisture, while UV rays can cause the plastic to degrade over time
(Albrecht et al., 2022). Another critical parameter to consider is the thickness of the packaging. Overall, heavier
packaging is more durable than lightweight products of the same type and material as they can withstand repeated
uses with more limited damage (Schroeer et al., 2020). The quality and efficiency of the reuse system and the
recycling plants also play an essential role in the lifespan. For example, if poorly maintained or handled, reusable
products may experience fewer loops than better-preserved products. Thus, variations in the number of cycles
depend on a wide range of factors affecting the product’s life (Lu et al., 2022). Recycling often involves “breaking
down” the product through shredding, washing and extruding it into flakes and reprocessing its materials to make
21
MOF, Alm.del - 2023-24 - Endeligt svar på spørgsmål 393: MFU spm. om oversendelse af de i MOF alm. del - svar på spm. 277 omtalte livscyklusanalyser fra DTU, branchen og EU-Kommissionen
new packaging (Berg et al., 2016; Spinacé and De Paoli, 2001). On the contrary, reusing a product often involves
extensive washing, drying and decontamination processes which have fewer degradation effects at the material
level (Coelho et al., 2020).
Very few studies in literature, based on experimental data, have defined the potential number of cycles that a
packaging product could undergo both in the reuse and recycling scenario; however, in most of the cases, the main
focus has been on plastic packaging and often not all the combinations of parameters affecting the condition of the
product are considered (Bø et al., 2013; Simon et al., 2016). Due to substantial uncertainties and variability, the
number of cycles for the reuse and recycling option is included as ranges in this study (Bradley and Corsini, 2023).
The model considers "default" ranges for rigid and flexible packaging products are defined. However, these might
vary slightly depending on the material (Zink et al., 2018). For assessment of specific packaging products the
number of cycles needs to be addressed in detail for the case-study in question.
For this study, a uniform distribution is applied in the model with the ranges representing the minimum and
maximum number of cycles for every packaging material reported in Table 8.
Table 7 – The potential number of cycles a packaging product assumed for reuse and recycling as
represented by a minimum and maximum limit for the selected packaging type and materials. The minimum
of two cycles represents a first cycle followed by a single reuse/recycling phase.
Reuse
Packaging material
Packaging type
Cycles
(min – max)
2 - 50
2 - 25
2-5
2 - 25
2 - 50
2 - 25
2 - 50
Recycling
Cycles
(min – max)
2 – 25
2–5
2–5
2 – 15
2 – 50
2 – 25
2 – 50
Plastic
(conventional, bio-based)
Fibre-based materials
(paper, cartonboard,
board)
Rigid
Flexible
Flexible
corrugated
Rigid
Rigid
Metal (steel, aluminium)
Glass
Flexible
Rigid
Every reuse and recycling phase is assumed to be associated with a mass loss, e.g. from discarding broken
packaging in the reuse scenario and processing losses in the recycling scenario. Thus the mass loss rate refers to
the rate at which a product losses mass over its life, in this case, quantified through the number of cycles. The loss
rate value is expressed in percentage and is assumed constant for every cycle. Moreover, being a function of the
number of cycles, it is included in the model as a variable parameter. Therefore, the mass loss rate at the individual
cycles is determined as follows:
Mass loss rate =
$%&'() +, -.-/(0
!""%
6.3 Weight of packaging products
In this study, data on the packaging weight was obtained from the literature and supplemented with sample
measurements of packaging products from Danish retail. To determine the weights of the selected packaging
22
MOF, Alm.del - 2023-24 - Endeligt svar på spørgsmål 393: MFU spm. om oversendelse af de i MOF alm. del - svar på spm. 277 omtalte livscyklusanalyser fra DTU, branchen og EU-Kommissionen
products, a regular kitchen scale was used, and only the weight of the main material was considered while
excluding other packaging components such as lids and labels. The weights were then scaled linearly to
correspond with a standard volume of 1 litre following the defined FU. The scaling for packaging containing liquids
was done based on a linear correlation between material weight and volume. If the volume was not expressed in
litres, the packaging dimensions were measured to determine its capacity, which was then scaled to 1 liter. This
method ensured accurate and comparable estimates of the weight of the selected packaging products. Five
packaging products, e.g., bottle, jar, bag, per packaging type, were weighed per packaging material. The weight of
a product can vary due to its material and the manufacturing process. Therefore, the weight data are provided in
ranges.
In general, reusable packaging tends to be heavier than single-use packaging as it is designed to withstand multiple
uses and thus requires manufacturing with more material. Moreover, the estimated mass for single-use packaging
is an input for the recycling and incineration scenario, whereas the estimated mass for the multi-use packaging is
considered for the reuse scenario.
Table 8 outlines the weight data for packaging in line with the functional unit defined in this assessment, as
referenced in Chapter 4.1. The weight is expressed in kilograms per liter of contained packaging product.
Table 8 - Overview of packaging weight expressed in kg/L of contained packaging product.
Flexible
Recycling
and
Incineration
kg/L
(min-max)
0.01 – 0.08
0.01 – 0.05
-
-
0.01 – 0.08
-
-
Reuse
kg/L
(min-max)
0.01 – 0.1
0.01 – 0.08
-
-
0.01 – 0.1
-
-
Rigid
Recycling
Incineration
kg/L
(min-max)
0.02 – 0.2
-
0.02 – 0.08
0.02 – 0.1
0.1 – 0.3
0.1 – 0.3
0.4 – 1.7
and
Reuse
kg/L
(min-max)
0.02 – 0.4
-
0.02 – 0.1
0.02 – 0.2
0.1 – 0.4
0.1 – 0.4
0.4 – 2
Packaging Material
Plastic
Paper
Cartonboard
Corrugated board
Aluminium
Steel
Glass
23
MOF, Alm.del - 2023-24 - Endeligt svar på spørgsmål 393: MFU spm. om oversendelse af de i MOF alm. del - svar på spm. 277 omtalte livscyklusanalyser fra DTU, branchen og EU-Kommissionen
7.
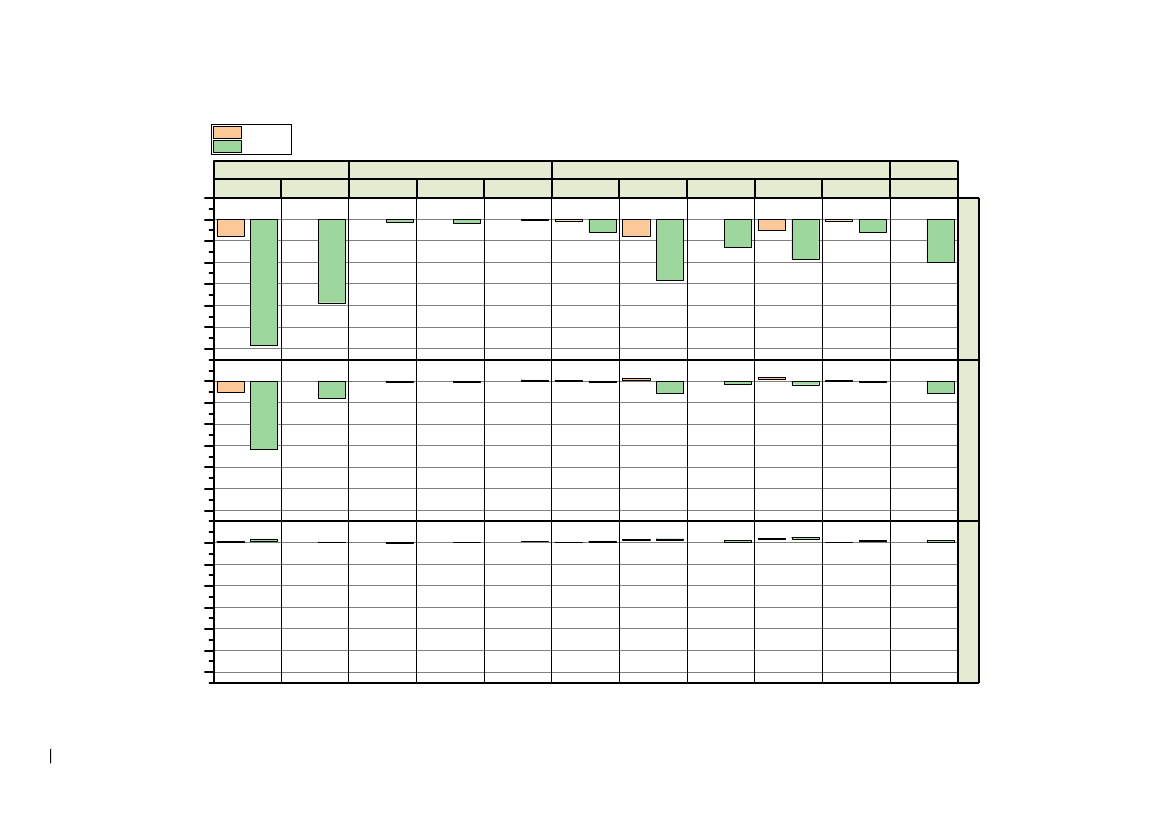
Interpretation of the results
This chapter presents the potential environmental impacts, focusing on climate change impacts expressed as
kg CO
2_eq
/ FU by individual materials. The potential impacts for the other impact cathegories are presented in
tables in Appendix II, using characterized units.
In this chapter, the results are presented as intervals, one for each of the three end-of-life scenarios. These results
intervals represent 95% confidence intervals based on Monte Carlo simulations of the model with the included
parameter data and probability distributions. As such, the “bars” representing results for reuse and recycling in the
following figures are reflecting the ranges in potential number of cycles, i.e. if only a few reuse cycles take place
then the corresponding climate change impact will be in the higher end of the “bar” (see Table 7 for the included
ranges in number of cycles). No additional cycles (or loops) are included in the incineration scenario.
For each packaging material, the results are presented, comparing reuse, recycling, and incineration, with a
recycled content of 50%. This means that 50% of the plastic in the packaging is assumed from primary material,
while the other 50% is from recycled material. The green and orange bars represent rigid and flexible packaging
types, respectively. Moreover, note that numerically negative values in the LCA results indicate environmental
benefits or avoided environmental impacts, while positive values indicate environmental loads.
While evaluating the results in the following sections, it is important to note that potential savings or impacts related
to energy in all scenarios are limited due to the renewable energy sources applied in the modelled energy mix, in
alignment with the electricity and heat targets and forecasts for the temporal scope of 2020-2030 in the study.
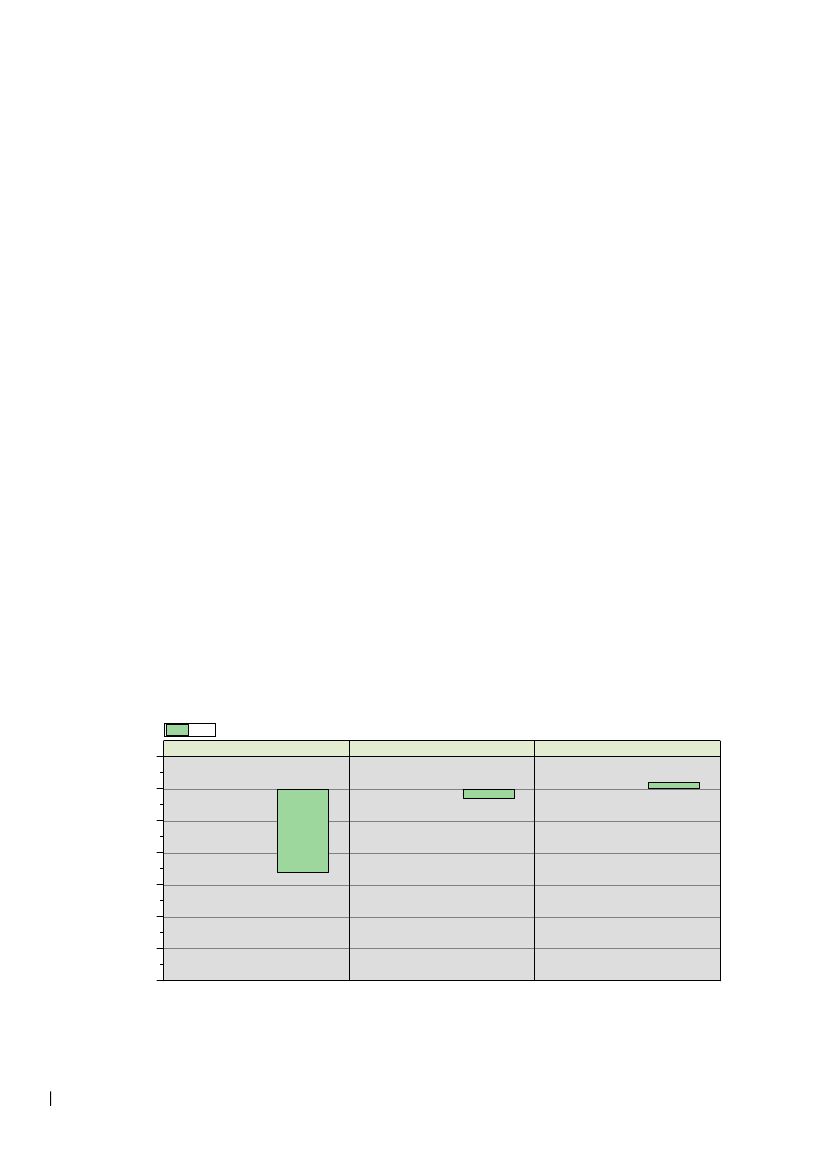
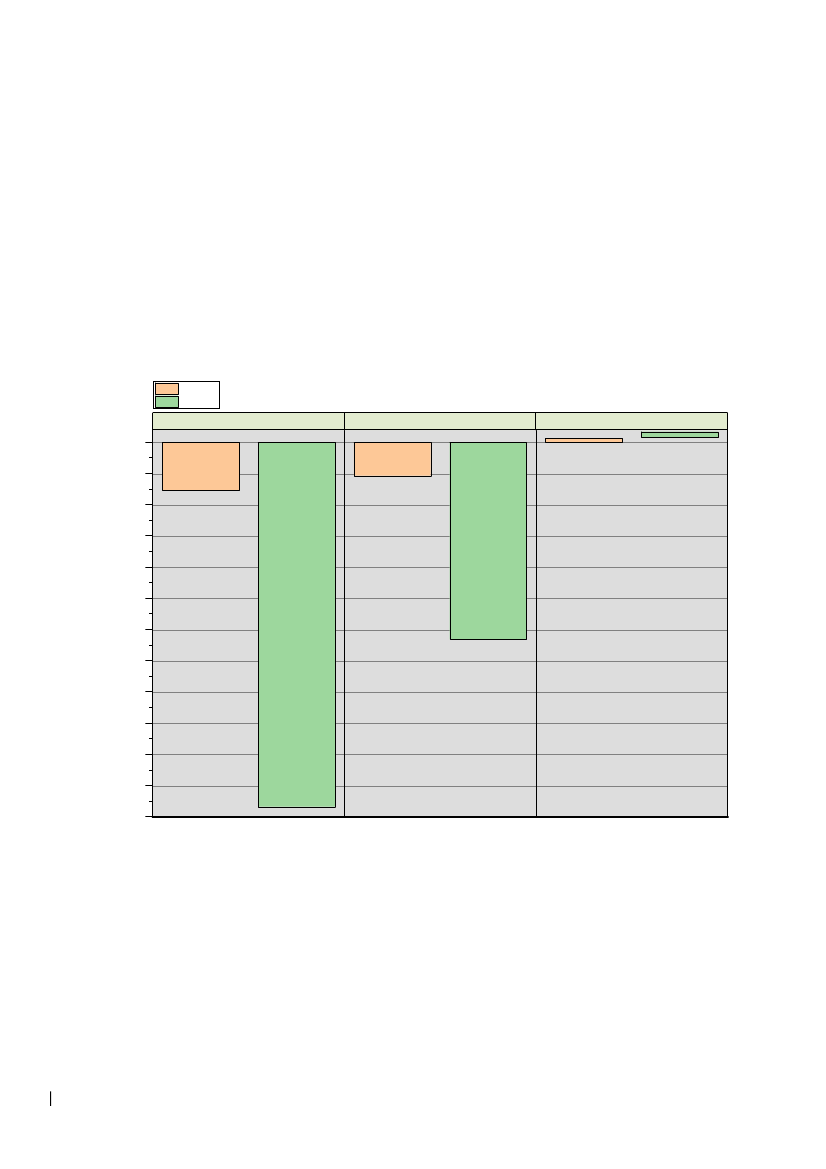
7.1 PET
The impact of climate change caused by the full life cycle of rigid packaging products made of PET plastic is
depicted in Figure 6. The result intervals of the life cycle assessment indicate that both reuse and recycling result
in environmental benefits, while incineration represents an environmental load.
Rigid
5
0
-5
kg CO
2
-eq/FU
Reuse
Recycling
Incineration
-10
-15
-20
-25
-30
Figure 6 - Potential environmental impacts within climate change related to the production and end-of-life
management of rigid packaging products made of PET. The result intervals represent a 95% confidence
interval and are presented characterized as kg CO
2
equivalent per functional unit (FU).
24
MOF, Alm.del - 2023-24 - Endeligt svar på spørgsmål 393: MFU spm. om oversendelse af de i MOF alm. del - svar på spm. 277 omtalte livscyklusanalyser fra DTU, branchen og EU-Kommissionen
Reusing rigid PET plastic packaging leads to the highest climate change impact savings, as this scenario reduces
the need for resource extraction and production of virgin PET packaging within every cycle. The high savings
observed in this reuse scenario can be attributed to the efficient recovery rate, which ranges between 89% to 93%.
Moreover, the preparation activities for reuse have a limited contribution to climate change.
Recycling rigid PET plastic packaging also results in climate change savings by avoiding the production of virgin
PET plastic due to the net benefits from recycling of secondary raw materials relative to the sorting and
reprocessing activities. Reprocessing requires more energy and resources than those involved in the reuse
scenario, resulting in lower overall environmental benefits. This difference in the results can be also attributed to
the fact that PET packaging has potential for more reuse cycles (2 to 50) than recycling cycles (2 to 25); the lowest
end of the result intervals illustrate the impact savings associated with the highest number of cycles in the two
scenarios.
Incineration of PET plastic packaging is the least favourable option causing net climate change loads to the
environment, mainly due to the relatively high concentration of fossil carbon converted into CO
2
during incineration.
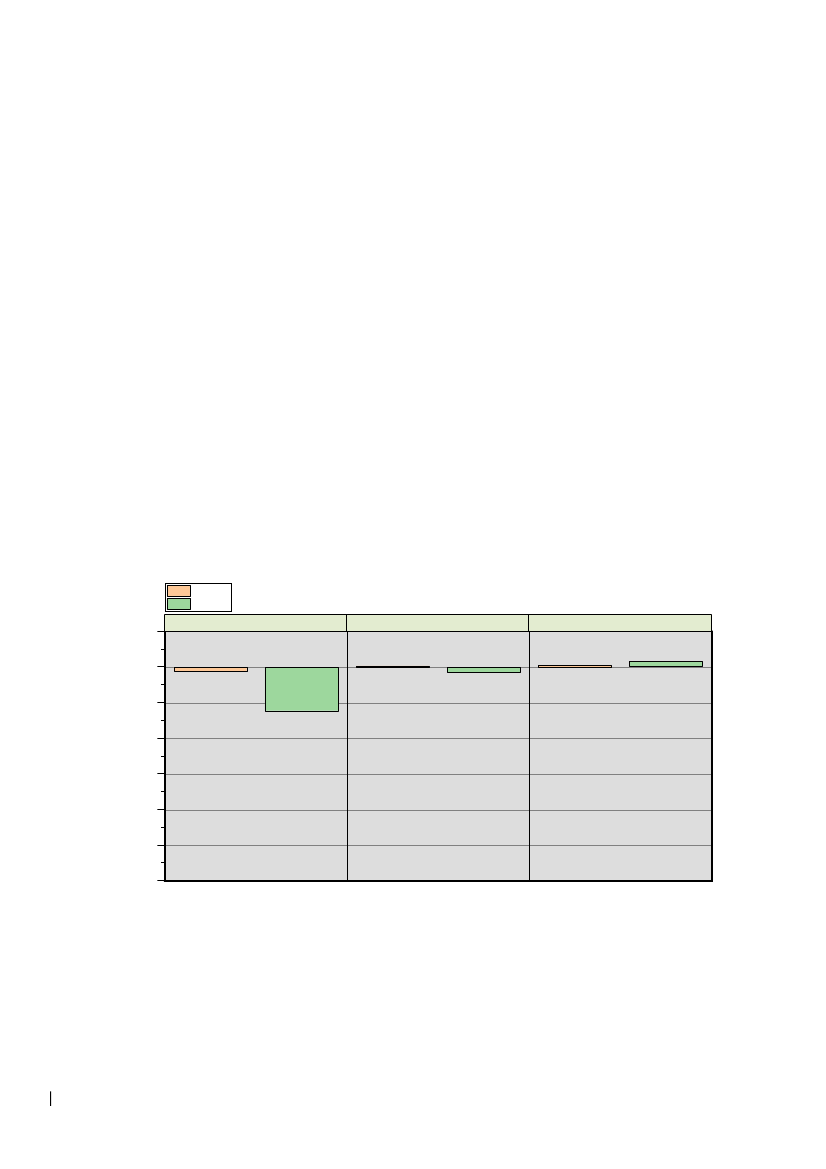
7.2 PE
The environmental impact on climate change of the full life cycle of both rigid and flexible packaging products made
of PE plastic is presented in Figure 7. Overall, the results indicate that reusing the packaging benefits the
environment the most, for both flexible and rigid plastic packaging. Recycling flexible packaging results in net-
positive impacts on the climate change potential score, and net-negative impacts for rigid packaging. The
incineration scenario has a harmful effect on climate change potential for both packaging types.
Flexible
Rigid
5
0
-5
kg CO
2
-eq/FU
Reuse
Recycling
Incineration
-10
-15
-20
-25
-30
Figure 7 - Potential environmental impacts within climate change related to the production and end-of-life
management of rigid and flexible packaging products made of PE. The result intervals represent a 95%
confidence interval and are presented as kg CO
2
equivalent per functional unit (FU).
Reusing PE packaging has a preferable climate change performance than recycling, both for rigid and flexible due
to: 1) reusing PE packaging is assumed to replace the production of new packaging from virgin materials at every
rotation, while recycling only avoids producing raw materials. In recycling, secondary materials are combined with
primary materials to produce new products, avoiding using only primary materials, promoting material circulation,
and partially lowering environmental emissions; 2) reuse has a higher recovery rate than recycling, ranging
25
MOF, Alm.del - 2023-24 - Endeligt svar på spørgsmål 393: MFU spm. om oversendelse af de i MOF alm. del - svar på spm. 277 omtalte livscyklusanalyser fra DTU, branchen og EU-Kommissionen
between 89% and 93% for reuse versus 36% to 81% for recycling. With this regard, note that PE has a high fossil
carbon content, meaning that significant amounts of CO
2
are potentially released during the incineration of recycling
residues, reducing even more the benefits of recycling; 3) the CO
2
emissions released during the washing and
preparation processes are less than those for PE recycling. Recycling flexible packaging results in impacts on the
climate change score, while it is beneficial for rigid packaging. Although the production of flexible packaging has
an overall lower environmental impact compared to rigid packaging, rigid PE packaging is associated with the
lowest climate change potential due to its higher assumed number of cycles both in reuse (2 to 50 cycles) and
recycling (2 to 25 cycles) scenarios, compared to flexible packaging (2 to 25 cycles are assumed for the reuse
scenario and 2 to 5 cycles for the recycling scenario).
A significant distinction between the impacts caused by flexible and rigid PE packaging in every scenario also lies
in the amount of material required to fulfil the functional unit of this study. Specifically, less material is required for
flexible PE products resulting, depending on the scenario, in reduced climate change impacts or savings at every
rotation.
7.3 PP
The impact of climate change caused by the full life cycle of both rigid and flexible packaging products made of PP
plastic is depicted in Figure 8. The results show that the reuse of PP packaging offers the largest contribution to
avoiding climate change impacts for both rigid and flexible plastic packaging. While recycling contributes with net
climate change impacts for flexible PP packaging, rigid PP packaging represents net benefits. The incineration
scenario results in climate change loads for both types of packaging.
Flexible
Rigid
5
0
-5
kg CO
2
-eq/FU
Reuse
Recycling
Incineration
-10
-15
-20
-25
-30
Figure 8 - Potential environmental impacts within climate change related to the production and end-of-life
management of rigid and flexible packaging products made of PP. The result intervals represent a 95%
confidence interval and are presented characterized expressed as kg CO
2
equivalent per functional unit
(FU).
Reusing PP packaging has the highest climate change savings among the three scenarios due to the high
estimated recovery rate of 89% to 93%, versus 48% to 86% for recycling, and the low climate change potential
associated with washing and preparation activities. Recycling PP packaging results in savings in the case of rigid
products and in net positive impacts in case of flexible products, due to the different number of cycles. Both in the
reuse and recycling scenarios, PP rigid packaging has the lowest potential score for climate change due to its
higher estimated number of cycles, i.e. 2 to 50 for reuse and 2 to 25 for recycling of rigid PP packaging, compared
26
MOF, Alm.del - 2023-24 - Endeligt svar på spørgsmål 393: MFU spm. om oversendelse af de i MOF alm. del - svar på spm. 277 omtalte livscyklusanalyser fra DTU, branchen og EU-Kommissionen
to 2 to 25 for reuse and 2 to 5 for recycling of flexible PP packaging. In addition, PP also has a high fossil carbon
content, meaning that significant amounts of CO
2
are potentially released during the incineration of recycling
residues, reducing the benefits of recycling. Reusing packaging avoids the need for producing new packaging while
recycling only reduces the demand for virgin raw materials. In the incineration scenario, PP rigid packaging is found
to result in a greater climate change potential emissions..
A significant distinction between the impacts caused by flexible and rigid PP packaging in every scenario also lies
in the amount of material required to fulfil the functional unit of this study. Specifically, less material is required for
flexible PP products resulting, depending on the scenario, in reduced climate change impacts or savings at every
rotation.
7.4 PS
The environmental impact on climate change of the full life cycle of both rigid and flexible packaging products made
of PS plastic is presented in Figure 9. Overall, the results indicate that the reuse of packaging has the most
significant savings on the climate change score, both for flexible and rigid plastic packaging. Recycling has net
positive emissions for flexible packaging, and net-negative emissions for rigid packaging regarding climate change.
The incineration of PS packaging has a damaging effect on the climate change potential for both types of
packaging.
Flexible
Rigid
5
0
-5
kg CO
2
-eq/FU
Reuse
Recycling
Incineration
-10
-15
-20
-25
-30
Figure 9 - Potential environmental impacts within climate change related to the production and end-of-life
management of rigid and flexible packaging products made of PS. The result intervals represent a 95%
confidence interval and are presented characterized expressed as kg CO
2
equivalent per functional unit
(FU).
Reusing both rigid and flexible PS packaging has the highest climate change savings compared to the other two
scenarios, due to the high estimated recovery rate, ranging from 89% to 93%, %, versus 34% to 64% for recycling,
and the limited climate change impacts associated with washing and preparation activities. Recycling PS packaging
results in net- negative impacts in the case of rigid products and in net positive impacts in the case of flexible
products. Both in the reuse and recycling scenarios, PP rigid packaging has the lowest potential score for climate
change due to its higher number of cycles, estimated to range between 2 and 50 for reuse and between 2 and 25
for recycling of rigid PS packaging, compared to 2 and 25 for reuse and 2 and 5 for recycling of flexible PS
packaging. In addition, PS has a high fossil carbon content, so a significant amount of CO
2
is released during the
27
MOF, Alm.del - 2023-24 - Endeligt svar på spørgsmål 393: MFU spm. om oversendelse af de i MOF alm. del - svar på spm. 277 omtalte livscyklusanalyser fra DTU, branchen og EU-Kommissionen
incineration of the recycling residues, significantly reducing the benefits of recycling. Reusing also replaces the
need for producing new packaging, while recycling only reduces the demand for virgin raw materials. In the
incineration option, PS rigid packaging is observed to cause larger climate change impacts than flexible PS
packaging.
A significant distinction between the impacts caused by flexible and rigid PS packaging in every scenario also lies
in the amount of material required to fulfil the functional unit of this study. Specifically, less material is required for
flexible PS products resulting, depending on the scenario, in reduced climate impacts or savings at every rotation.
7.5 PLA
The environmental impact on climate change of the full life cycle of both rigid and flexible packaging products made
of PLA plastic is presented in Figure 10. Overall, the results indicate that reusing bio-based PLA packaging
represents climate change savings for both flexible and rigid types, while recycling of flexible packaging results in
net impacts on climate change, and savings for recycling of rigid packaging. Incineration of PLA packaging causes
burdens on the environment, albeit limited.
Flexible
Rigid
5
0
-5
kg CO
2
-eq/FU
Reuse
Recycling
Incineration
-10
-15
-20
-25
-30
Figure 10 - Potential environmental impacts within climate change related to the production and end-of-life
management of rigid and flexible packaging products made of PLA. The result intervals represent a 95%
confidence interval and are presented characterized as kg CO
2
equivalent per functional unit (FU).
Reusing PLA plastic packaging, both rigid and flexible, leads to the highest savings in the climate change, as it
reduces the need for resource extraction and production of PLA packaging at every cycle. Moreover, the
preparation activities for reuse have a limited impact on climate change.
Compared to flexible PLA packaging, PLA rigid packaging has the highest net-negative potential for climate
change. One of the reasons is its higher assumed number of cycles in both reuse and recycling scenarios (2 to 50
and 2 to 25, respectively) compared to flexible packaging (2 to 25 for the reuse scenario and 2 to 5 for the recycling
scenario).
PLA packaging is assumed to contain only biogenic carbon; no fossil CO
2
is released during incineration. Thus, the
benefits are associated with substituting marginal electricity and heat generated during incineration. However, the
net climate change impacts of the incineration scenario are still positive due to the impacts from producing the PLA
packaging.
28
MOF, Alm.del - 2023-24 - Endeligt svar på spørgsmål 393: MFU spm. om oversendelse af de i MOF alm. del - svar på spm. 277 omtalte livscyklusanalyser fra DTU, branchen og EU-Kommissionen
A significant difference between the impacts of flexible and rigid PLA packaging in each scenario is related to the
quantity of material necessary to meet the functional unit criteria of this study. In particular, flexible PLA packaging
needs less material, which can lead to a cumulative decrease in climate change effects or savings at every rotation.
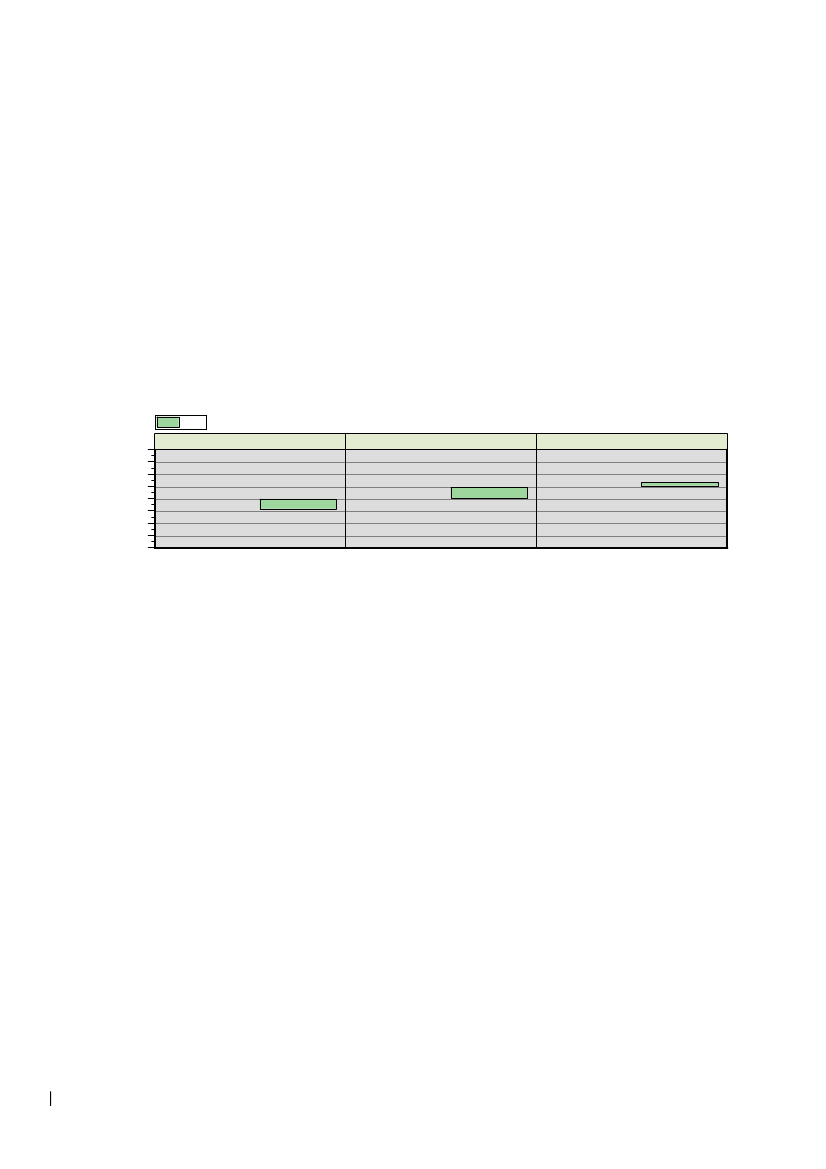
7.6 Cartonboard
The environmental impact on climate change of the full life cycle of rigid packaging products made of cartonboard
is presented in Figure 11. Overall, the life cycle analysis findings indicate that reusing and recycling cartonboard
packaging provide net-negative climate change potential emissions while the incineration of cartonboard packaging
causes burdens on the climate change score, albeit limited.
Rigid
2.0
1.5
1.0
0.5
0.0
-0.5
-1.0
-1.5
-2.0
Reuse
Recycling
Incineration
Figure 11 - Potential environmental impacts of climate change related to the production and end-of-life
management of rigid packaging products made of cartonboard. The result intervals represent a 95%
confidence interval and are presented characterized as kg CO
2
equivalent per functional unit (FU).
The repeated use of cartonboard packaging significantly reduces climate change, as it prevents consequtive
emissions from the production activities of virgin cartonboard packaging, such as deforestation and virgin pulp,
production and conversion into packaging processes. Recycling cartonboards has environmental benefits, as the
CO
2
emissions from the recycling processes are lower than producing new cartonboard packaging. Note that the
results between these two waste management options can vary due to the fact that corrugated packaging can be
reused more frequently (2 to 25 times) than it can be recycled (2 to 15 times).
kg CO
2
-eq/FU
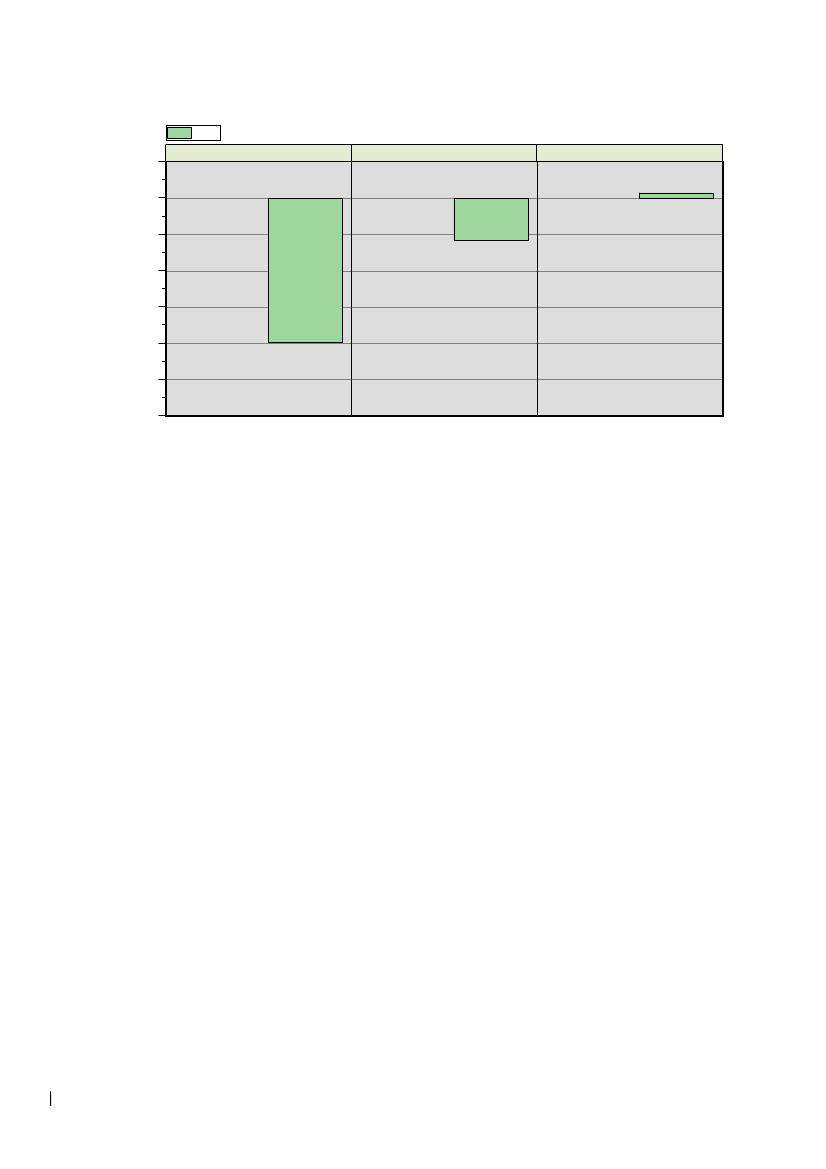
7.7 Corrugated board
The impact of the full life cycle of rigid packaging products made of the corrugated board on climate change is
Carton board
illustrated in Figure 12. The analysis shows that reusing and recycling corrugated board packaging results in climate
change savings, while incineration of corrugated packaging has a relatively small impact on climate change.
Rigid
2.0
1.5
1.0
0.5
0.0
-0.5
-1.0
-1.5
-2.0
Reuse
Recycling
Incineration
Figure 12 - Potential environmental impacts within climate change related to the production and end-of-life
management of rigid packaging products made of corrugated board. The result intervals represent a 95%
confidence interval and are presented characterized as kg CO
2
equivalent per functional unit (FU).
29
kg CO
2
-eq/FU
MOF, Alm.del - 2023-24 - Endeligt svar på spørgsmål 393: MFU spm. om oversendelse af de i MOF alm. del - svar på spm. 277 omtalte livscyklusanalyser fra DTU, branchen og EU-Kommissionen
The repeated use of corrugated packaging significantly reduces climate change, as it avoids multiple times
production of new corrugated packaging, more specifically, the emissions from the production activities of virgin
cartonboard packaging, such as deforestation and virgin pulp, production and conversion into packaging
processes. Recycling corrugated packaging is also environmentally beneficial as the CO
2
emissions from recycling
machinery and equipment are lower than producing virgin materials for corrugated packaging. It is noteworthy that
the results between these two waste management options can vary because corrugated packaging can be reused
more frequently (2 to 25 times) than it can be recycled (2 to 15 times).
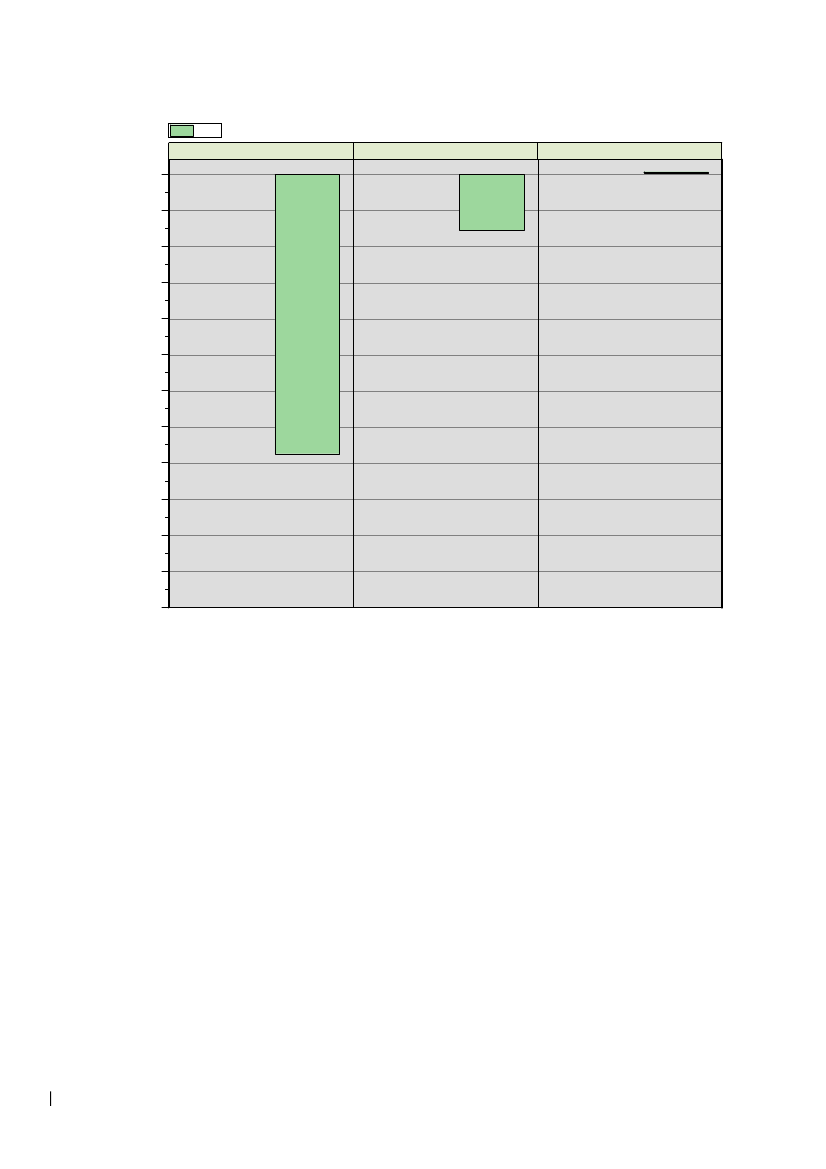
7.8 Aluminium
The climate change potential for aluminium packaging products is presented in Figure 13. The life cycle
assessment results indicate that reusing and recycling rigid and flexible aluminium packaging has environmental
benefits, whereas incineration causes net climate change impacts.
Flexible
Rigid
Reuse
0
-5
-10
-15
-20
Recycling
Incineration
kg CO
2
-eq/FU
-25
-30
-35
-40
-45
-50
-55
-60
Figure 13 - Potential environmental impacts of climate change related to the production and waste
management of flexible and rigid aluminium packaging products made of aluminium. The result intervals
represent a 95% confidence interval and are presented characterized as kg CO
2
equivalent per functional
unit (FU).
Reusing rigid and flexible aluminium packaging leads to the highest savings in climate change potential due to its
high recovery rate ranging between 89% and 93% versus 60% and 99% for recycling and the limited environmental
impact associated with washing and preparation activities. Reusing both types of aluminium packaging replaces
the need for new virgin packaging, which typically involves energy-intensive processes.
From Figure 13, it can also be observed that rigid packaging has a higher net-negative potential for climate change
than flexible packaging due to its higher assumed number of cycles in both the reuse and recycling scenarios. The
30
MOF, Alm.del - 2023-24 - Endeligt svar på spørgsmål 393: MFU spm. om oversendelse af de i MOF alm. del - svar på spm. 277 omtalte livscyklusanalyser fra DTU, branchen og EU-Kommissionen
number of potential cycles for the reuse and recycling scenario ranges between 2 and 50 for rigid packaging and
between 2 and 25 for flexible packaging.
In the incineration option, aluminium packaging causes an environmental burden, although limited due to recycling
of aluminium scrap recovered from bottom ashes.
Finally, consider that the amount of material required to fulfil the functional unit of this study also varies between
flexible and rigid aluminium packaging, with flexible products requiring less material and resulting at every rotation,
in reduced climate change impacts or savings depending on the scenario.
7.1 Paper
The environmental impact on climate change of the full life cycle of flexible packaging products made of paper is
presented in Figure 14. Overall, the life cycle analysis results show that the reuse and recycling of paper packaging
contribute to decreased emissions with a net positive impact on climate change, while the incineration of paper
packaging has a limited impact on climate change.
Rigid
2.0
1.5
1.0
0.5
0.0
-0.5
-1.0
-1.5
-2.0
Reuse
Recycling
Incineration
Figure 14 - Potential environmental impacts within climate change related to the production and end-of-life
management of flexible packaging products made of paper. The result intervals represent a 95%
confidence interval and are presented characterized as kg CO
2
equivalent per functional unit (FU).
Reusing paper packaging results in the highest savings in the climate change potential, as it prevents repeated
emissions from the production activities of virgin cartonboard packaging, such as deforestation and virgin pulp
production and related processes. Recycling cartonboard also has environmental benefits, as the CO
2
emissions
from using processing equipment during recycling are lower than producing new paper. Despite having the same
cycles (ranging between 2 and 5) for both the reuse and recycling scenarios, recycling still requires energy and
resources to process, thus leading to higher impacts on climate change potential than the reuse scenario.
kg CO
2
-eq/FU
7.2 Steel
The impact of the entire life cycle of rigid packaging products made of steel on climate change is illustrated for
three end-of-life scenarios in Figure 15. The analysis results show that both reusing and recycling steel packaging
Paper
result in savings on the climate change potential score, while the incineration scenario has only few impacts within
climate change.
31
MOF, Alm.del - 2023-24 - Endeligt svar på spørgsmål 393: MFU spm. om oversendelse af de i MOF alm. del - svar på spm. 277 omtalte livscyklusanalyser fra DTU, branchen og EU-Kommissionen
Rigid
Reuse
0
-5
-10
-15
-20
-25
-30
-35
-40
-45
-50
-55
-60
Recycling
Incineration
Figure 15 - Potential environmental impacts within climate change related to the production and end-of-life
management of rigid packaging products made of steel. The result intervals represent a 95% confidence
interval and are presented characterized as kg CO
2
equivalent per functional unit (FU).
Reusing steel has the most significant impact on reducing climate change because each reuse cycle is assumed
to substitute the need for resource extraction and manufacturing of steel packaging, which involves significant
energy-intensive activities. Recycling steel also saves the climate change potential score, as the emissions during
sorting and processing are lower than those from producing new steel. However, even though the potential number
of cycles is the same for both reuse and recycling scenarios, i.e. ranging between 2 and 50, recycling requires
more energy and other resources to reprocess the materials, resulting in lower savings on climate change
compared to reusing steel packaging. Additionally, the recovery rate for reused steel packaging is generally higher,
of 89% to 93%, compared to recycling, which typically has a recovery rate of 77% to 81%. Efficient recycling,
however, may still result in more significant savings than reusing steel packaging with a lower recovery rate.
The environmental impact on climate change of the entire life cycle of rigid packaging made of glass is depicted in
Figure 16. Overall, the life cycle analysis findings indicate that the reuse and recycling of glass packaging result in
savings on the climate change potential score, while the incineration scenario results in climate change potential
emissions.
32
kg CO
2
-eq/FU
7.3 Glass
MOF, Alm.del - 2023-24 - Endeligt svar på spørgsmål 393: MFU spm. om oversendelse af de i MOF alm. del - svar på spm. 277 omtalte livscyklusanalyser fra DTU, branchen og EU-Kommissionen
Rigid
5
0
-5
kg CO
2
-eq/FU
Reuse
Recycling
Incineration
-10
-15
-20
-25
-30
Figure 16 - Potential environmental impacts within climate change related to the production and waste
management of rigid packaging made of glass. The result intervals represent a 95% confidence interval
and are presented characterized as kg CO
2
equivalent per functional unit (FU).
Glass packaging that is reused has the lowest climate change impact due to the limited climate change potential
associated with the sorting process and the washing and preparation activities compared to the production
activities. Indeed, reusing glass packaging avoids the need to extract new virgin minerals and the potential global
emissions associated with melting and conversion into packaging processes. Savings in the potential global score
are also observed in the recycling scenario. However, recycling is assumed to substitute only the demand for virgin
raw materials within every cycle.
The potential number of cycles is the same for the reuse and recycling scenario, i.e. between 2 and 50. The
significant differences in the results are attributed to the processes associated with the two waste management
options and the relative substitution assumptions.
Overall, glass packaging contains minimal amounts of carbon; therefore, causing few CO
2
emissions when
incinerated. However, since glass contribute with no net energy production, no savings in climate change impacts
can be associated with incineration. As a result, incineration of glass packaging results in a small burden.
33
MOF, Alm.del - 2023-24 - Endeligt svar på spørgsmål 393: MFU spm. om oversendelse af de i MOF alm. del - svar på spm. 277 omtalte livscyklusanalyser fra DTU, branchen og EU-Kommissionen
8.
Conclusion
This study provides a comparative LCA of selected packaging materials, from raw material production to different
end-of-life options. The considered end-of-life scenarios are multiple-loop reuse, multiple-loop recycling and
incineration. The results are intended for internal decision support at the Danish EPA as part of a broader range of
evaluations about implementing the Extended Producer Responsibility (EPR) system.
Environmental impacts throughout the life cycle of various packaging products, considering different packaging
materials and types, are modelled. The selected packaging materials are fossil plastics (PET, PE, PP, PS), bio-
based plastic (PLA), metals (aluminium, steel), fibre-based materials (paper, cartonboard, corrugated board), and
glass. The environmental impacts of packaging products, among other aspects, depending on the material, the
packaging type and the end-of-life scenarios options.
The LCA results show that multiple-loop reuse and multiple-loop recycling are environmentally beneficial relative
to the incineration of the same packaging products. The reuse scenario for all materials and packaging types always
provided the most significant potential climate change savings. Reuse extends a product's life, reducing the need
for resource extraction and conversion into packaging processes at every cycle and the overall amount of waste
sent to incineration. The higher the environmental impacts associated with resource extraction and packaging
product manufacturing, the more significant the potential savings from reuse. The reusability of aluminium and steel
packaging offered the most significant potential for savings.
Generally, recycling provides fewer climate change benefits than reuse, partly because only the material
conversion into the packaging product was substituted. As for the reuse scenario, the most significant benefits are
observed for energy-intensive materials. However, the quality degradation of recycling packaging materials is
essential to consider. Each time a material is recycled, it undergoes some degree of degradation, which can
decrease its strength, flexibility, and overall quality. Some materials, like glass and aluminium, can be recycled
multiple times with relatively little degradation in quality, while others, like some types of plastic, may degrade more
quickly with each recycling cycle.
The LCA results highlight that for most materials, reusing packaging products only a few times may be less
environmentally beneficial than recycling the same materials many times. Thus, the number of product cycles can
be decisive for the overall environmental impacts of the packaging product, albeit with some uncertainty. Similarly,
reuse systems should be associated with some level of documentation for the number of cycles, as recycling
systems should document the recycling rate of the materials.
Product-specific LCA modelling is necessary to quantify and understand the environmental impacts associated
with packaging products in an EPR context. The results provided in this study evaluate a range of generic
packaging products in the context of a range of generic end-of-life scenarios. For specific implementation of EPR
regulations, further aspects should be considered, e.g., compliance with product-specific regulations, type and
combinations of materials, amounts of recycled content in packaging products, reprocessing methods, and the
presence of labels, lids, and caps. These aspects have not been addressed in this study, and their end-of-life
management may affect the overall environmental impacts of the packaging products.
34
MOF, Alm.del - 2023-24 - Endeligt svar på spørgsmål 393: MFU spm. om oversendelse af de i MOF alm. del - svar på spm. 277 omtalte livscyklusanalyser fra DTU, branchen og EU-Kommissionen
9.
References
Abbasi, G., Hauser, M., Peter Baldé, C., Bouman, E.A., 2022. A high-resolution dynamic probabilistic material flow
analysis of seven plastic polymers; A case study of Norway. Environment International 107693.
https://doi.org/10.1016/j.envint.2022.107693
Agnusdei, G.P., Gnoni, M.G., Sgarbossa, F., 2022. Are deposit-refund systems effective in managing glass
packaging? State of the art and future directions in Europe. Science of The Total Environment 851,
158256. https://doi.org/10.1016/j.scitotenv.2022.158256
Albrecht, S., Bertling, J., Fischer, M., Gehring, F., Kabasci, S., Prescher, T., Schulte, A., 2022. Reusable Plastic
Crates vs. Single-Use Cardboard Boxes.
Ali, S.S., Abdelkarim, E.A., Elsamahy, T., Al-Tohamy, R., Li, F., Kornaros, M., Zuorro, A., Zhu, D., Sun, J., 2023.
Bioplastic production in terms of life cycle assessment: A state-of-the-art review. Environmental Science
and Ecotechnology 100254. https://doi.org/10.1016/j.ese.2023.100254
Andreasi Bassi, S., Boldrin, A., Faraca, G., Astrup, T.F., 2020. Extended producer responsibility: How to unlock
the environmental and economic potential of plastic packaging waste? Resources, Conservation and
Recycling 162, 105030. https://doi.org/10.1016/j.resconrec.2020.105030
Andreasi Bassi, S., Tonini, D., Ekvall, T., Astrup, T.F., 2021. A life cycle assessment framework for large-scale
changes
in
material
circularity.
Waste
Management
135,
360–371.
https://doi.org/10.1016/j.wasman.2021.09.018
ARC, 2020. Amager Bakkes Teknik. ARC. URL http://a-r-c.dk/amager-bakke/teknik/ (accessed 2.23.23).
Bauer, A.-S., Tacker, M., Uysal-Unalan, I., Cruz, R.M.S., Varzakas, T., Krauter, V., 2021. Recyclability and
Redesign Challenges in Multilayer Flexible Food Packaging—A Review. Foods 10, 2702.
https://doi.org/10.3390/foods10112702
Berg, D., Schaefer, K., Koerner, A., Kaufmann, R., Tillmann, W., Moeller, M., 2016. Reasons for the Discoloration
of Postconsumer Poly(ethylene terephthalate) during Reprocessing. Macromolecular Materials and
Engineering 301, 1454–1467. https://doi.org/10.1002/mame.201600313
Bø, E., Hammervoll, T., Tvedt, K., 2013. Environmental impact of refillable vs. non-refillable plastic beverage bottles
in Norway. International Journal of Environment and Sustainable Development 12, 379–395.
https://doi.org/10.1504/IJESD.2013.056343
Bradley, C.G., Corsini, L., 2023. A literature review and analytical framework of the sustainability of reusable
packaging.
Sustainable
Production
and
Consumption
37,
126–141.
https://doi.org/10.1016/j.spc.2023.02.009
Brandão, M., Weidema, B.P., Martin, M., Cowie, A., Hamelin, L., Zamagni, A., 2022. Consequential Life Cycle
Assessment: What, Why and How?, in: Reference Module in Earth Systems and Environmental Sciences.
Elsevier. https://doi.org/10.1016/B978-0-323-90386-8.00001-2
BRF, B.P., 2020. Recycled Content Guidance.
Cecon, V.S., Da Silva, P.F., Curtzwiler, G.W., Vorst, K.L., 2021. The challenges in recycling post-consumer
polyolefins for food contact applications: A review. Resources, Conservation and Recycling 167, 105422.
https://doi.org/10.1016/j.resconrec.2021.105422
Chappell, B., Pramanik, A., Basak, A.K., Sarker, P.K., Prakash, C., Debnath, S., Shankar, S., 2022. Processing
household
plastics
for
recycling
–
A
review.
Cleaner
Materials
6,
100158.
https://doi.org/10.1016/j.clema.2022.100158
Christensen, T.H. (Ed.), 2010. Solid Waste Technology & Management: Christensen/Solid Waste Technology &
Management. John Wiley & Sons, Ltd, Chichester, UK. https://doi.org/10.1002/9780470666883
Clavreul, J., Baumeister, H., Christensen, T.H., Damgaard, A., 2014. An environmental assessment system for
environmental
technologies.
Environmental
Modelling
&
Software
60,
18–30.
https://doi.org/10.1016/j.envsoft.2014.06.007
Coelho, P.M., Corona, B., ten Klooster, R., Worrell, E., 2020. Sustainability of reusable packaging–Current situation
and
trends.
Resources,
Conservation
&
Recycling:
X
6,
100037.
https://doi.org/10.1016/j.rcrx.2020.100037
EC, 2022. Circular economy: new rules on packaging and packaging waste.
EC, 2021. Revision of Directive 94/62/EC on Packaging and Packaging Waste.
35
MOF, Alm.del - 2023-24 - Endeligt svar på spørgsmål 393: MFU spm. om oversendelse af de i MOF alm. del - svar på spm. 277 omtalte livscyklusanalyser fra DTU, branchen og EU-Kommissionen
EC, 2020. Best Available Techniques (BAT) reference document for waste incineration: Industrial Emissions
Directive 2010/75/EU (Integrated Pollution Prevention and Control), Joint Research Centre, Cusano, G.,
Roudier, S., Neuwahl, F., et al. Publications Office of the European Union.
EC, 2018. Product Environmental Footprint Category Rules Guidance. Version 6.3.
EEA, 2022. Reaching 2030’s residual municipal waste target — why recycling is not enough — European
Environment Agency [WWW Document]. URL https://www.eea.europa.eu/publications/reaching-2030s-
residual-municipal-waste (accessed 2.26.23).
EEA,
2018.
packaging
—
European
Environment
Agency
[WWW
Document].
URL
https://www.eea.europa.eu/help/glossary/eea-glossary/packaging (accessed 2.26.23).
Ekvall, T., Gottfridsson, M., Nellström, M., Nilsson, J., Rydberg, M., Rydberg, T., 2021. Modelling incineration for
more accurate comparisons to recycling in PEF and LCA. Waste Management 136, 153–161.
https://doi.org/10.1016/j.wasman.2021.09.036
Ekvall, T., Weidema, B.P., 2004. System boundaries and input data in consequential life cycle inventory analysis.
Int. J. LCA 9, 161–171. https://doi.org/10.1007/BF02994190
EMF, 2021. Extended Producer Responsibility: a necessary part of the solution to packaging waste and pollution.
EPA, 2022. Environmental profiles of packaging materials.
EPA, 2020. Affaldsstatistik 2019, Miljøprojekt nr. 2152.
EPA, 2019. Preliminary assessment of plastic material flows in Denmark. The Danish Environmental Protection
Agency Kostyantyn Pivnenko, Technical University of Denmark Anders Damgaard, Technical University
of Denmark Thomas Fruergaard Astrup, Technical University of Den mark.
EU, 2018. Directive (EU) 2018/852 of the European Parliament and of the Council of 30 May 2018 amending
Directive 94/62/EC on packaging and packaging waste 150.
Eurostat, 2019. Packaging waste statistics [WWW Document]. URL https://ec.europa.eu/eurostat/statistics-
explained/index.php?title=Packaging_waste_statistics (accessed 2.26.23).
Faraca, G., Tonini, D., Astrup, T.F., 2019. Dynamic accounting of greenhouse gas emissions from cascading
utilisation of wood waste. Science of The Total Environment 651, 2689–2700.
https://doi.org/10.1016/j.scitotenv.2018.10.136
FEFCO, 2019. Paper based Packaging - Recyclability Guidelines for Corrugated Production process.
Franz, R., Welle, F., 2022. Recycling of Post-Consumer Packaging Materials into New Food Packaging
Applications—Critical Review of the European Approach and Future Perspectives. Sustainability 14, 824.
https://doi.org/10.3390/su14020824
Geueke, B., Groh, K., Muncke, J., 2018. Food packaging in the circular economy: Overview of chemical safety
aspects for commonly used materials. Journal of Cleaner Production 193, 491–505.
https://doi.org/10.1016/j.jclepro.2018.05.005
Greenwood, S.C., Walker, S., Baird, H.M., Parsons, R., Mehl, S., Webb, T.L., Slark, A.T., Ryan, A.J., Rothman,
R.H., 2021. Many Happy Returns: Combining insights from the environmental and behavioural sciences
to understand what is required to make reusable packaging mainstream. Sustainable Production and
Consumption 27, 1688–1702. https://doi.org/10.1016/j.spc.2021.03.022
Hage, O., 2007. The Swedish producer responsibility for paper packaging: An effective waste management policy?
Resources, Conservation and Recycling 51, 314–344. https://doi.org/10.1016/j.resconrec.2006.10.003
Horodytska, O., Valdés, F.J., Fullana, A., 2018. Plastic flexible films waste management – A state of art review.
Waste Management 77, 413–425. https://doi.org/10.1016/j.wasman.2018.04.023
Ingrao, C., Lo Giudice, A., Bacenetti, J., Mousavi Khaneghah, A., Sant’Ana, A.S., Rana, R., Siracusa, V., 2015.
Foamy polystyrene trays for fresh-meat packaging: Life-cycle inventory data collection and environmental
impact
assessment.
Food
Research
International
76,
418–426.
https://doi.org/10.1016/j.foodres.2015.07.028
ISO, 2006a. International Organization for Standardization (ISO) EN ISO14040 Environmental management—Life
cycle assessment— Principles and framework.
ISO, 2006b. International Organization for Standardization (ISO). (2006b). EN ISO14044 Environmental
management—Life cycle assessment— Requirements and guidelines.
Joint Letter, 2022. Upcoming Revision of the Packaging and Packaging Waste Directive. Joint letter by Austria,
Denmark, Luxembourg, Netherlands and Sweden to publicly support the Commission to work on an
ambitious revision of the Packaging and Packaging Waste Directive.
Lodato, C., Zarrin, B., Damgaard, A., Baumeister, H., Astrup, T.F., 2021. Process-oriented life cycle assessment
modelling
in
EASETECH.
Waste
Management
127,
168–178.
https://doi.org/10.1016/j.wasman.2021.04.026
36
MOF, Alm.del - 2023-24 - Endeligt svar på spørgsmål 393: MFU spm. om oversendelse af de i MOF alm. del - svar på spm. 277 omtalte livscyklusanalyser fra DTU, branchen og EU-Kommissionen
Lu, Z., Hasselström, L., Finnveden, G., Johansson, N., 2022. Cost-benefit analysis of two possible deposit-refund
systems for reuse and recycling of plastic packaging in Sweden. Cleaner Waste Systems 100048.
https://doi.org/10.1016/j.clwas.2022.100048
Ma, J., He, J., Kong, X., Zheng, J., Han, L., Liu, Y., Zhu, Z., Zhang, Z., 2023. From agricultural cellulosic waste to
food
delivery
packaging:
A
mini-review.
Chinese
Chemical
Letters
34,
107407.
https://doi.org/10.1016/j.cclet.2022.04.005
Miljø- Og Fødevareministeriet, 2015. Miljø- Og Fødevareministeriet / Årsrapport 2015 - Miljøministeriets
departement.
Razza, F., Briani, C., Breton, T., Marazza, D., 2020. Metrics for quantifying the circularity of bioplastics: The case
of bio-based and biodegradable mulch films. Resources, Conservation and Recycling 159, 104753.
https://doi.org/10.1016/j.resconrec.2020.104753
Rigamonti, L., Taelman, S.E., Huysveld, S., Sfez, S., Ragaert, K., Dewulf, J., 2020. A step forward in quantifying
the substitutability of secondary materials in waste management life cycle assessment studies. Waste
Management 114, 331–340. https://doi.org/10.1016/j.wasman.2020.07.015
Rosenboom, J.-G., Langer, R., Traverso, G., 2022. Bioplastics for a circular economy. Nat Rev Mater 1–21.
https://doi.org/10.1038/s41578-021-00407-8
Schroeer, A., Wilts, H., Littlejohn, M., 2020. Oceana report: Soft drink industry can stop billions of plastic bottles
from polluting the ocean by switching from single-use, throwaway bottles to refillables. Oceana.
https://doi.org/10.5281/zenodo.3687106
Simon, B., Amor, M.B., Földényi, R., 2016. Life cycle impact assessment of beverage packaging systems: focus
on the collection of post-consumer bottles. Journal of Cleaner Production 112, 238–248.
https://doi.org/10.1016/j.jclepro.2015.06.008
Spinacé, M.A.S., De Paoli, M.A., 2001. Characterization of poly(ethylene terephtalate) after multiple processing
cycles. Journal of Applied Polymer Science 80, 20–25. https://doi.org/10.1002/1097-
4628(20010404)80:1<20::AID-APP1069>3.0.CO;2-S
Van Caneghem, J., De Coster, E., Vandenbergh, K., De Broyer, S., Lambrix, N., Weemaels, L., 2019. Closing the
household metal packaging cycle through recovery of scrap from waste-to-energy bottom ash: The case
study
of
Flanders.
Resources,
Conservation
and
Recycling
144,
115–122.
https://doi.org/10.1016/j.resconrec.2019.01.028
Weidema, B., 2003. Market information in life cycle assessment.
Wernet, G., Bauer, C., Steubing, B., Reinhard, J., Moreno-Ruiz, E., Weidema, B., 2016. The ecoinvent database
version 3 (part I): overview and methodology. Int J Life Cycle Assess 21, 1218–1230.
https://doi.org/10.1007/s11367-016-1087-8
Williams, H., Lindström, A., Trischler, J., Wikström, F., Rowe, Z., 2020. Avoiding food becoming waste in
households – The role of packaging in consumers’ practices across different food categories. Journal of
Cleaner Production 265, 121775. https://doi.org/10.1016/j.jclepro.2020.121775
Zambrano, F., Marquez, R., Jameel, H., Venditti, R., Gonzalez, R., 2021. Upcycling strategies for old corrugated
containerboard to attain high-performance tissue paper: A viable answer to the packaging waste
generation
dilemma.
Resources,
Conservation
and
Recycling
175,
105854.
https://doi.org/10.1016/j.resconrec.2021.105854
Zero Waste Europe, 2022. How Circular Is Glass? A report on the circularity of single-use glass packaging, using
Germany, France, the UK, and the USA as case studies. Zero Waste Europe Eunomia.
Zink, T., Geyer, R., Startz, R., 2018. Toward Estimating Displaced Primary Production from Recycling: A Case
Study of U.S. Aluminum. Journal of Industrial Ecology 22, 314–326. https://doi.org/10.1111/jiec.12557
37
MOF, Alm.del - 2023-24 - Endeligt svar på spørgsmål 393: MFU spm. om oversendelse af de i MOF alm. del - svar på spm. 277 omtalte livscyklusanalyser fra DTU, branchen og EU-Kommissionen
10. Appendix I
10.1
LCI – Electricity modelling update
Table A 1 – Marginal electricity for Europe update: the left column displays the processes used in the EPA
report 'Environmental profiles of packaging materials', while the right column presents the updates made
to these processes for this study.
Marginal Electricity for Europe
Process name as modelled in the EPA report
“Environmental profiles of packaging materials”
electricity, high voltage,electricity production,
wood, future,GLO
electricity, hard coal, RER
electricity, lignite, RER
electricity, geothermal, RER
electricity, hydro-lakes, RER
electricity, hydro-river, RER
electricity, natural gas conventional, RER
electricity, natural gas combined, RER
electricity, nuclear, RER
electricity, oil, RER
electricity, solar panels, RER
Process update in this study (source: Ecoinvent)
electricity, high voltage,electricity production, hard
coal,RoW
electricity, high voltage,electricity production, lignite,RoW
electricity, high voltage,electricity production, deep
geothermal,RoW
electricity, high voltage,electricity production, hydro,
reservoir, alpine region,RoW
electricity, high voltage,electricity production, hydro, run-
of-river,RoW
electricity, high voltage,electricity production, natural gas,
conventional power plant,RoW
electricity, high voltage,electricity production, natural gas,
combined cycle power plant,RoW
electricity, high voltage,electricity production, nuclear,
pressure water reactor,RoW
electricity, high voltage,electricity production, oil,RoW
electricity, low voltage,electricity production, photovoltaic,
3kWp
slanted-roof
installation,
multi-Si,
panel,
mounted,RoW
electricity, high voltage,electricity production, solar tower
power plant, 20 MW,RoW
electricity, high voltage,electricity production, wind, >3MW
turbine, onshore,RoW
electricity, high voltage,electricity production, wind, 1-
3MW turbine, offshore,RoW
electricity, solar plant, RER
electricity, wind onshore, RER
electricity, wind offshore, RER
38
MOF, Alm.del - 2023-24 - Endeligt svar på spørgsmål 393: MFU spm. om oversendelse af de i MOF alm. del - svar på spm. 277 omtalte livscyklusanalyser fra DTU, branchen og EU-Kommissionen
10.2
LCI – Process modelling update
Table A 2 - Process update: the left column displays the processes used in the EPA report 'Environmental
profiles of packaging materials', while the right column presents the updates made to these processes for
this study.
Process name as modelled in the EPA report
“Environmental profiles of packaging materials”
diesel,
low-sulfur,diesel
production,
low-
sulfur,Europe without Switzerland
chromite ore concentrate,chromite ore concentrate
production,GLO
steel, chromium steel 18/8,steel production,
converter, chromium steel 18/8,RER
ammonia, liquid,market for ammonia, liquid,RER
iron scrap, sorted, pressed,market for iron scrap,
sorted, pressed,GLO
Process update in this study (source: Ecoinvent)
diesel production, low-sulfur, petroleum refinery
operation_Europe without Switzerland
chromite ore concentrate, market for chromite ore
concentrate
steel
production,
electric,
chromium
steel
18_8_RER_2023_Consequential
market for ammonia, anhydrous, liquid
iron scrap, sorted, pressed,market for iron scrap, sorted,
pressed,RER
39
MOF, Alm.del - 2023-24 - Endeligt svar på spørgsmål 393: MFU spm. om oversendelse af de i MOF alm. del - svar på spm. 277 omtalte livscyklusanalyser fra DTU, branchen og EU-Kommissionen
11. Appendix II
40
MOF, Alm.del - 2023-24 - Endeligt svar på spørgsmål 393: MFU spm. om oversendelse af de i MOF alm. del - svar på spm. 277 omtalte livscyklusanalyser fra DTU, branchen og EU-Kommissionen
11.1
Overview of the climate change potential results
Flexible
Rigid
Metal
10
0
-10
-20
-30
-40
-50
-60
0
Fiber
Steel
Corrug
Cartonboard
Paper
PE
PLA
Plastic
PET
PS
PP
Glass
Glass
Alu
Reuse
kg CO
2
-eq/FU
-10
Recycling
-20
-30
-40
-50
-60
0
-10
Incineration
-20
-30
-40
-50
-60
Figure A 1 - Comparison of the climate change potential results for all selected materials for rigid packaging
41
MOF, Alm.del - 2023-24 - Endeligt svar på spørgsmål 393: MFU spm. om oversendelse af de i MOF alm. del - svar på spm. 277 omtalte livscyklusanalyser fra DTU, branchen og EU-Kommissionen
11.2
Characterised results for all impact cathegories
Table A 3 - Impact categories considered in this model and their corresponding short names used in the following tables.
Impact category
Climate change
Ozone depletion
Human toxicity, cancer effects
Human toxicity, non-cancer effects
Particulate matter/respiratory inorganics
Ionizing radiation, human health
Photochemical ozone formation, human health
Acidification
Eutrophication terrestrial
Eutrophication freshwater
Eutrophication marine
Ecotoxicity freshwater
Land use
Resource use, minerals and metals
Short name
CC
OD
HT-C
HT-nC
PM
IR
POF
TA
ET
EF
EM
EcoF
LU
RUMM
42
MOF, Alm.del - 2023-24 - Endeligt svar på spørgsmål 393: MFU spm. om oversendelse af de i MOF alm. del - svar på spm. 277 omtalte livscyklusanalyser fra DTU, branchen og EU-Kommissionen
11.2.1 PET
Rigid packaging - Reuse scenario
Table A 4 - Characterized result scores for all the selected impact categories - Reuse scenario of PET rigid packaging product.
RC = 50%
Median
Mean
5%
95%
CC
-3.15
-4.23
0.45
-13.06
OZ
0.00
0.00
0.00
0.00
HTc
0.00
0.00
0.00
0.00
HTnc
0.00
0.00
0.00
0.00
PM
0.00
0.00
0.00
0.00
IR
-0.03
-0.04
0.00
-0.11
POM
-0.01
-0.01
0.00
-0.04
Ac
-0.01
-0.02
0.00
-0.05
ET
-0.03
-0.03
0.00
-0.11
EF
0.00
0.00
0.00
0.00
EM
0.00
0.00
0.00
-0.01
Eco
-51.95
-69.89
5.00
-214.42
LU
-27.49
-37.73
3.76
-116.59
WU
-2.47
-3.36
0.30
-11.09
Rumm
0.00
0.00
0.00
0.00
Ruec
-75.71
-101.39
6.92
-311.50
Table A 5 - Characterized result scores for all the selected impact categories - Recycling scenario of PET rigid packaging product.
RC = 50%
Median
Mean
5%
95%
CC
-0.12
-0.21
0.52
-1.43
OZ
0.00
0.00
0.00
0.00
HTc
0.00
0.00
0.00
0.00
HTnc
0.00
0.00
0.00
0.00
PM
0.00
0.00
0.00
0.00
IR
0.00
-0.01
0.00
-0.02
POM
0.00
0.00
0.00
0.00
Ac
0.00
0.00
0.00
-0.01
ET
0.00
0.00
0.00
-0.01
EF
0.00
0.00
0.00
0.00
EM
0.00
0.00
0.00
0.00
Eco
-1.48
-2.64
6.90
-16.38
LU
0.80
0.91
6.85
-4.60
WU
-0.07
-0.13
0.38
-0.89
Rumm
0.00
0.00
0.00
0.00
Ruec
-5.20
-8.34
8.67
-38.71
Table A 6 - Characterized result scores for all the selected impact categories - Incineration scenario of PET rigid packaging product.
RC = 50%
Median
Mean
5%
95%
CC
0.59
0.58
1.03
0.14
OZ
0.00
0.00
0.00
0.00
HTc
0.00
0.00
0.00
0.00
HTnc
0.00
0.00
0.00
0.00
PM
0.00
0.00
0.00
0.00
IR
0.00
0.00
0.00
0.00
POM
0.00
0.00
0.00
0.00
Ac
0.00
0.00
0.00
0.00
ET
0.00
0.00
0.00
0.00
EF
0.00
0.00
0.00
0.00
EM
0.00
0.00
0.00
0.00
Eco
2.65
2.62
4.92
0.65
LU
2.88
2.87
5.49
0.70
WU
0.24
0.25
0.51
0.05
Rumm
0.00
0.00
0.00
0.00
Ruec
7.92
7.88
13.87
1.93
43
MOF, Alm.del - 2023-24 - Endeligt svar på spørgsmål 393: MFU spm. om oversendelse af de i MOF alm. del - svar på spm. 277 omtalte livscyklusanalyser fra DTU, branchen og EU-Kommissionen
11.2.2 PE
Table A 7 - Characterized result scores for all the selected impact categories - Reuse scenario of PE flexible packaging product.
RC = 50%
Median
Mean
5%
95%
CC
-0,13
-0,18
0,08
-0,61
OZ
0,00
0,00
0,00
0,00
HTc
0,00
0,00
0,00
0,00
HTnc
0,00
0,00
0,00
0,00
PM
0,00
0,00
0,00
0,00
IR
0,00
0,00
0,00
0,00
POM
0,00
0,00
0,00
0,00
Ac
0,00
0,00
0,00
0,00
ET
0,00
0,00
0,00
0,00
EF
0,00
0,00
0,00
0,00
EM
0,00
0,00
0,00
0,00
Eco
-1,78
-2,27
0,26
-6,82
LU
-1,15
-1,44
0,21
-4,46
WU
-0,17
-0,22
0,05
-0,71
Rumm
0,00
0,00
0,00
0,00
Ruec
-6,12
-7,97
1,36
-25,04
Table A 8 - Characterized result scores for all the selected impact categories - Recycling scenario of PE flexible packaging product.
RC = 50%
Median
Mean
5%
95%
CC
0,09
0,09
0,20
0,02
OZ
0,00
0,00
0,00
0,00
HTc
0,00
0,00
0,00
0,00
HTnc
0,00
0,00
0,00
0,00
PM
0,00
0,00
0,00
0,00
IR
0,00
0,00
0,00
0,00
POM
0,00
0,00
0,00
0,00
Ac
0,00
0,00
0,00
0,00
ET
0,00
0,00
0,00
0,00
EF
0,00
0,00
0,00
0,00
EM
0,00
0,00
0,00
0,00
Eco
-0,10
-0,12
0,56
-0,81
LU
-0,25
-0,39
1,03
-2,27
WU
0,06
0,06
0,13
0,02
Rumm
0,00
0,00
0,00
0,00
Ruec
0,99
1,09
2,62
0,12
Table A 9 - Characterized result scores for all the selected impact categories - Incineration scenario of PE flexible packaging product.
RC = 50%
Median
Mean
5%
95%
CC
0,18
0,18
0,31
0,05
OZ
0,00
0,00
0,00
0,00
HTc
0,00
0,00
0,00
0,00
HTnc
0,00
0,00
0,00
0,00
PM
0,00
0,00
0,00
0,00
IR
0,00
0,00
0,00
0,00
POM
0,00
0,00
0,00
0,00
Ac
0,00
0,00
0,00
0,00
ET
0,00
0,00
0,00
0,00
EF
0,00
0,00
0,00
0,00
EM
0,00
0,00
0,00
0,00
Eco
-1,03
-1,04
-0,26
-1,97
LU
-0,12
-0,19
0,20
-0,84
WU
0,04
0,04
0,08
0,01
Rumm
0,00
0,00
0,00
0,00
Ruec
1,89
1,90
3,26
0,50
44
MOF, Alm.del - 2023-24 - Endeligt svar på spørgsmål 393: MFU spm. om oversendelse af de i MOF alm. del - svar på spm. 277 omtalte livscyklusanalyser fra DTU, branchen og EU-Kommissionen
Table A 10 - Characterized result scores for all the selected impact categories - Reuse scenario of PE rigid packaging product.
RC = 50%
Median
Mean
5%
95%
CC
-1.44
-1.94
0.16
-6.09
OZ
0.00
0.00
0.00
0.00
HTc
0.00
0.00
0.00
0.00
HTnc
0.00
0.00
0.00
0.00
PM
0.00
0.00
0.00
0.00
IR
-0.01
-0.01
0.00
-0.02
POM
-0.01
-0.01
0.00
-0.02
Ac
0.00
-0.01
0.00
-0.02
ET
-0.01
-0.01
0.00
-0.04
EF
0.00
0.00
0.00
0.00
EM
0.00
0.00
0.00
0.00
Eco
-14.06
-18.69
0.64
-57.24
LU
-4.92
-6.71
0.34
-25.31
WU
-1.38
-1.90
0.15
-6.81
Rumm
0.00
0.00
0.00
0.00
Ruec
-55.75
-73.55
2.27
-221.17
Table A 11 - Characterized result scores for all the selected impact categories - Recycling scenario of PE rigid packaging product.
RC = 50%
Median
Mean
5%
95%
CC
-0.03
-0.07
0.37
-0.68
OZ
0.00
0.00
0.00
0.00
HTc
0.00
0.00
0.00
0.00
HTnc
0.00
0.00
0.00
0.00
PM
0.00
0.00
0.00
0.00
IR
0.00
0.00
0.00
0.00
POM
0.00
0.00
0.00
0.00
Ac
0.00
0.00
0.00
0.00
ET
0.00
0.00
0.00
-0.01
EF
0.00
0.00
0.00
0.00
EM
0.00
0.00
0.00
0.00
Eco
-2.25
-2.73
0.39
-8.01
LU
-1.29
-1.73
1.50
-6.38
WU
0.01
0.01
0.28
-0.26
Rumm
0.00
0.00
0.00
0.00
Ruec
-6.48
-8.68
3.98
-32.96
Table A 12 - Characterized result scores for all the selected impact categories - Incineration scenario of PE rigid packaging product.
RC = 50%
Median
Mean
5%
95%
CC
0.46
0.45
0.80
0.10
OZ
0.00
0.00
0.00
0.00
HTc
0.00
0.00
0.00
0.00
HTnc
0.00
0.00
0.00
0.00
PM
0.00
0.00
0.00
0.00
IR
0.00
0.00
0.00
0.00
POM
0.00
0.00
0.00
0.00
Ac
0.00
0.00
0.00
0.00
ET
0.00
0.00
0.00
0.00
EF
0.00
0.00
0.00
0.00
EM
0.00
0.00
0.00
0.00
Eco
-2.60
-2.56
-0.52
-4.81
LU
-0.67
-0.85
0.15
-2.58
WU
0.08
0.09
0.24
0.01
Rumm
0.00
0.00
0.00
0.00
Ruec
4.78
4.73
8.41
1.08
45
MOF, Alm.del - 2023-24 - Endeligt svar på spørgsmål 393: MFU spm. om oversendelse af de i MOF alm. del - svar på spm. 277 omtalte livscyklusanalyser fra DTU, branchen og EU-Kommissionen
11.2.3 PP
Table A 13 - Characterized result scores for all the selected impact categories - Reuse scenario of PP flexible packaging product.
RC = 50%
Median
Mean
5%
95%
CC
-0,12
-0,17
0,09
-0,60
OZ
0,00
0,00
0,00
0,00
HTc
0,00
0,00
0,00
0,00
HTnc
0,00
0,00
0,00
0,00
PM
0,00
0,00
0,00
0,00
IR
0,00
0,00
0,00
0,00
POM
0,00
0,00
0,00
0,00
Ac
0,00
0,00
0,00
0,00
ET
0,00
0,00
0,00
0,00
EF
0,00
0,00
0,00
0,00
EM
0,00
0,00
0,00
0,00
Eco
-1,38
-1,73
0,16
-5,29
LU
-0,53
-0,71
0,58
-2,81
WU
-0,11
-0,15
0,05
-0,49
Rumm
0,00
0,00
0,00
0,00
Ruec
-5,63
-7,36
1,80
-23,61
Table A 14 - Characterized result scores for all the selected impact categories - Recycling scenario of PP flexible packaging product.
RC = 50%
Median
Mean
5%
95%
CC
0,11
0,12
0,25
0,03
OZ
0,00
0,00
0,00
0,00
HTc
0,00
0,00
0,00
0,00
HTnc
0,00
0,00
0,00
0,00
PM
0,00
0,00
0,00
0,00
IR
0,00
0,00
0,00
0,00
POM
0,00
0,00
0,00
0,00
Ac
0,00
0,00
0,00
0,00
ET
0,00
0,00
0,00
0,00
EF
0,00
0,00
0,00
0,00
EM
0,00
0,00
0,00
0,00
Eco
-0,32
-0,41
0,27
-1,34
LU
-0,11
-0,17
0,67
-1,34
WU
0,05
0,05
0,12
0,01
Rumm
0,00
0,00
0,00
0,00
Ruec
1,36
1,44
3,06
0,33
Table A 15 - - Characterized result scores for all the selected impact categories - Incineration scenario of PP flexible packaging product.
RC = 50%
Median
Mean
5%
95%
CC
0,18
0,18
0,31
0,05
OZ
0,00
0,00
0,00
0,00
HTc
0,00
0,00
0,00
0,00
HTnc
0,00
0,00
0,00
0,00
PM
0,00
0,00
0,00
0,00
IR
0,00
0,00
0,00
0,00
POM
0,00
0,00
0,00
0,00
Ac
0,00
0,00
0,00
0,00
ET
0,00
0,00
0,00
0,00
EF
0,00
0,00
0,00
0,00
EM
0,00
0,00
0,00
0,00
Eco
-1,00
-1,03
-0,26
-1,88
LU
0,13
0,18
0,62
0,01
WU
0,03
0,03
0,06
0,01
Rumm
0,00
0,00
0,00
0,00
Ruec
1,99
2,00
3,53
0,54
46
MOF, Alm.del - 2023-24 - Endeligt svar på spørgsmål 393: MFU spm. om oversendelse af de i MOF alm. del - svar på spm. 277 omtalte livscyklusanalyser fra DTU, branchen og EU-Kommissionen
Table A 16 - Characterized result scores for all the selected impact categories - Reuse scenario of PP rigid packaging product.
RC = 50%
Median
Mean
5%
95%
CC
-1.34
-1.78
0.33
-5.87
OZ
0.00
0.00
0.00
0.00
HTc
0.00
0.00
0.00
0.00
HTnc
0.00
0.00
0.00
0.00
PM
0.00
0.00
0.00
0.00
IR
0.00
-0.01
0.00
-0.02
POM
0.00
-0.01
0.00
-0.02
Ac
0.00
0.00
0.00
-0.01
ET
-0.01
-0.01
0.00
-0.04
EF
0.00
0.00
0.00
0.00
EM
0.00
0.00
0.00
0.00
Eco
-15.62
-20.32
0.45
-63.24
LU
-7.93
-10.99
1.41
-39.56
WU
-1.72
-2.57
0.19
-9.88
Rumm
0.00
0.00
0.00
0.00
Ruec
-51.06
-66.25
6.48
-207.82
Table A 17 - Characterized result scores for all the selected impact categories - Recycling scenario of PP rigid packaging product.
RC = 50%
Median
Mean
5%
95%
CC
0.08
0.07
0.52
-0.56
OZ
0.00
0.00
0.00
0.00
HTc
0.00
0.00
0.00
0.00
HTnc
0.00
0.00
0.00
0.00
PM
0.00
0.00
0.00
0.00
IR
0.00
0.00
0.00
0.00
POM
0.00
0.00
0.00
0.00
Ac
0.00
0.00
0.00
0.00
ET
0.00
0.00
0.00
0.00
EF
0.00
0.00
0.00
0.00
EM
0.00
0.00
0.00
0.00
Eco
-2.16
-2.42
0.10
-6.22
LU
-0.70
-0.96
1.19
-4.31
WU
0.04
0.05
0.28
-0.14
Rumm
0.00
0.00
0.00
0.00
Ruec
-2.60
-5.09
5.82
-28.72
Table A 18 - Characterized result scores for all the selected impact categories - Incineration scenario of PP rigid packaging product.
RC = 50%
Median
Mean
5%
95%
CC
0.44
0.44
0.77
0.10
OZ
0.00
0.00
0.00
0.00
HTc
0.00
0.00
0.00
0.00
HTnc
0.00
0.00
0.00
0.00
PM
0.00
0.00
0.00
0.00
IR
0.00
0.00
0.00
0.00
POM
0.00
0.00
0.00
0.00
Ac
0.00
0.00
0.00
0.00
ET
0.00
0.00
0.00
0.00
EF
0.00
0.00
0.00
0.00
EM
0.00
0.00
0.00
0.00
Eco
-2.35
-2.35
-0.47
-4.48
LU
0.13
0.22
1.37
-0.37
WU
0.08
0.10
0.28
0.01
Rumm
0.00
0.00
0.00
0.00
Ruec
5.01
4.91
8.64
1.12
47
MOF, Alm.del - 2023-24 - Endeligt svar på spørgsmål 393: MFU spm. om oversendelse af de i MOF alm. del - svar på spm. 277 omtalte livscyklusanalyser fra DTU, branchen og EU-Kommissionen
11.2.4 PS
Table A 19 - Characterized result scores for all the selected impact categories - Reuse scenario of PS flexible packaging product.
RC = 50%
Median
Mean
5%
95%
CC
-2.08
-2.05
0.74
-4.97
OZ
0.00
0.00
0.00
0.00
HTc
0.00
0.00
0.00
0.00
HTnc
0.00
0.00
0.00
0.00
PM
0.00
0.00
0.00
0.00
IR
0.00
0.00
0.00
0.00
POM
-0.01
-0.01
0.00
-0.01
Ac
-0.01
-0.01
0.00
-0.02
ET
-0.01
-0.01
0.00
-0.03
EF
0.00
0.00
0.00
0.00
EM
0.00
0.00
0.00
0.00
Eco
-3.55
-3.50
0.08
-7.45
LU
-3.62
-3.62
0.96
-8.32
WU
-1.62
-1.61
0.53
-3.80
Rumm
0.00
0.00
0.00
0.00
Ruec
-48.04
-47.62
13.98
-111.91
Table A 20 - Characterized result scores for all the selected impact categories - Recycling scenario of PS flexible packaging product.
RC = 50%
Median
Mean
0,05
0,95
CC
1.37
1.35
1.66
0.95
OZ
0.00
0.00
0.00
0.00
HTc
0.00
0.00
0.00
0.00
HTnc
0.00
0.00
0.00
0.00
PM
0.00
0.00
0.00
0.00
IR
0.00
0.00
0.00
0.00
POM
0.00
0.00
0.00
0.00
Ac
0.00
0.00
0.00
0.00
ET
0.00
0.00
0.00
0.00
EF
0.00
0.00
0.00
0.00
EM
0.00
0.00
0.00
0.00
Eco
-4.57
-4.55
-1.57
-7.35
LU
-2.92
-3.18
0.68
-8.16
WU
0.66
0.66
0.80
0.54
Rumm
0.00
0.00
0.00
0.00
Ruec
17.42
17.00
20.80
11.65
Table A 21 - Characterized result scores for all the selected impact categories - Incineration scenario of PS flexible packaging product.
RC = 50%
Median
Mean
5%
95%
CC
1.80
1.81
1.97
1.66
OZ
0.00
0.00
0.00
0.00
HTc
0.00
0.00
0.00
0.00
HTnc
0.00
0.00
0.00
0.00
PM
0.00
0.00
0.00
0.00
IR
0.00
0.00
0.00
0.00
POM
0.00
0.00
0.00
0.00
Ac
0.00
0.00
0.00
0.00
ET
0.00
0.00
0.00
0.00
EF
0.00
0.00
0.00
0.00
EM
0.00
0.00
0.00
0.00
Eco
-8.77
-8.79
-7.25
-10.49
LU
-0.80
-0.88
-0.39
-1.68
WU
0.63
0.63
0.69
0.58
Rumm
0.00
0.00
0.00
0.00
Ruec
20.89
20.90
22.21
19.68
48
MOF, Alm.del - 2023-24 - Endeligt svar på spørgsmål 393: MFU spm. om oversendelse af de i MOF alm. del - svar på spm. 277 omtalte livscyklusanalyser fra DTU, branchen og EU-Kommissionen
Table A 22 - Characterized result scores for all the selected impact categories - Reuse scenario of PS rigid packaging product.
RC = 50%
Median
Mean
5%
95%
CC
-7.44
-7.58
0.88
-18.62
OZ
0.00
0.00
0.00
0.00
HTc
0.00
0.00
0.00
0.00
HTnc
0.00
0.00
0.00
0.00
PM
0.00
0.00
0.00
0.00
IR
0.00
0.00
0.00
-0.01
POM
-0.02
-0.02
0.00
-0.05
Ac
-0.03
-0.03
0.00
-0.07
ET
-0.05
-0.05
0.00
-0.11
EF
0.00
0.00
0.00
0.00
EM
0.00
0.00
0.00
-0.01
Eco
-13.35
-13.68
-0.49
-30.98
LU
-2.55
-3.41
4.13
-15.43
WU
-4.47
-4.59
0.38
-11.32
Rumm
0.00
0.00
0.00
0.00
Ruec
-167.56
-172.05
13.98
-419.27
Table A 23 - Characterized result scores for all the selected impact categories - Recycling scenario of PS rigid packaging product.
RC = 50%
Median
Mean
5%
95%
CC
0.64
0.48
1.98
-1.72
OZ
0.00
0.00
0.00
0.00
HTc
0.00
0.00
0.00
0.00
HTnc
0.00
0.00
0.00
0.00
PM
0.00
0.00
0.00
0.00
IR
0.00
0.00
0.00
0.00
POM
0.00
0.00
0.00
-0.01
Ac
0.00
0.00
0.00
-0.01
ET
0.00
0.00
0.00
-0.02
EF
0.00
0.00
0.00
0.00
EM
0.00
0.00
0.00
0.00
Eco
-6.36
-6.35
-2.38
-10.40
LU
-5.56
-5.98
-0.74
-13.98
WU
-0.02
-0.09
0.63
-1.26
Rumm
0.00
0.00
0.00
0.00
Ruec
-2.35
-5.46
22.83
-50.92
Table A 24 - Characterized result scores for all the selected impact categories - Incineration scenario of PS rigid packaging product.
RC = 50%
Median
Mean
5%
95%
CC
2.14
2.14
2.57
1.73
OZ
0.00
0.00
0.00
0.00
HTc
0.00
0.00
0.00
0.00
HTnc
0.00
0.00
0.00
0.00
PM
0.00
0.00
0.00
0.00
IR
0.00
0.00
0.00
0.00
POM
0.00
0.00
0.00
0.00
Ac
0.00
0.00
0.01
0.00
ET
0.00
0.00
0.01
0.00
EF
0.00
0.00
0.00
0.00
EM
0.00
0.00
0.00
0.00
Eco
-10.27
-10.40
-7.34
-13.97
LU
-3.22
-3.43
-1.62
-6.20
WU
0.51
0.51
0.62
0.42
Rumm
0.00
0.00
0.00
0.00
Ruec
23.86
23.87
27.72
20.49
49
MOF, Alm.del - 2023-24 - Endeligt svar på spørgsmål 393: MFU spm. om oversendelse af de i MOF alm. del - svar på spm. 277 omtalte livscyklusanalyser fra DTU, branchen og EU-Kommissionen
11.2.5 PLA
Table A 25 - Characterized result scores for all the selected impact categories - Reuse scenario of PLA flexible packaging product.
RC = 50%
Median
Mean
5%
95%
CC
-3.27
-3.27
0.99
-7.88
OZ
0.00
0.00
0.00
0.00
HTc
0.00
0.00
0.00
0.00
HTnc
0.00
0.00
0.00
0.00
PM
0.00
0.00
0.00
0.00
IR
0.04
0.04
0.09
-0.01
POM
-0.01
-0.01
0.00
-0.02
Ac
-0.01
-0.01
0.00
-0.03
ET
-0.06
-0.06
0.02
-0.14
EF
0.00
0.00
0.00
0.00
EM
0.00
0.00
0.00
-0.01
Eco
-81.49
-81.41
23.88
-195.85
LU
-15.46
-15.39
5.28
-37.58
WU
-3.68
-3.68
1.19
-8.91
Rumm
0.00
0.00
0.00
0.00
Ruec
-26.20
-26.20
7.74
-63.06
Table A 26 - Characterized result scores for all the selected impact categories - Recycling scenario of PLA flexible packaging product.
RC = 50%
Median
Mean
5%
95%
CC
1.12
1.07
1.41
0.50
OZ
0.00
0.00
0.00
0.00
HTc
0.00
0.00
0.00
0.00
HTnc
0.00
0.00
0.00
0.00
PM
0.00
0.00
0.00
0.00
IR
-0.01
-0.01
0.00
-0.02
POM
0.00
0.00
0.00
0.00
Ac
0.00
0.00
0.01
0.00
ET
0.02
0.02
0.03
0.01
EF
0.00
0.00
0.00
0.00
EM
0.00
0.00
0.00
0.00
Eco
26.08
25.43
33.34
13.42
LU
7.62
7.95
12.25
4.97
WU
1.40
1.36
1.73
0.83
Rumm
0.00
0.00
0.00
0.00
Ruec
8.55
8.29
10.86
4.30
Table A 27 - Characterized result scores for all the selected impact categories - Incineration scenario of PLA flexible packaging product.
RC = 50%
Median
Mean
5%
95%
CC
1.45
1.45
1.54
1.36
OZ
0.00
0.00
0.00
0.00
HTc
0.00
0.00
0.00
0.00
HTnc
0.00
0.00
0.00
0.00
PM
0.00
0.00
0.00
0.00
IR
-0.02
-0.02
-0.02
-0.02
POM
0.00
0.00
0.00
0.00
Ac
0.01
0.01
0.01
0.01
ET
0.03
0.03
0.03
0.03
EF
0.00
0.00
0.00
0.00
EM
0.00
0.00
0.00
0.00
Eco
30.17
30.27
32.47
28.44
LU
5.31
5.31
6.04
4.56
WU
1.66
1.66
1.77
1.55
Rumm
0.00
0.00
0.00
0.00
Ruec
10.25
10.27
11.02
9.64
50
MOF, Alm.del - 2023-24 - Endeligt svar på spørgsmål 393: MFU spm. om oversendelse af de i MOF alm. del - svar på spm. 277 omtalte livscyklusanalyser fra DTU, branchen og EU-Kommissionen
Table A 28 - Characterized result scores for all the selected impact categories - Reuse scenario of PLA rigid packaging product.
RC = 50%
Median
Mean
5%
95%
CC
-10.14
-11.12
0.95
-28.32
OZ
0.00
0.00
0.00
0.00
HTc
0.00
0.00
0.00
0.00
HTnc
0.00
0.00
0.00
0.00
PM
0.00
0.00
0.00
0.00
IR
0.11
0.12
0.31
-0.01
POM
-0.02
-0.03
0.00
-0.07
Ac
-0.03
-0.04
0.00
-0.09
ET
-0.18
-0.20
0.02
-0.51
EF
0.00
0.00
0.00
0.00
EM
-0.01
-0.02
0.00
-0.04
Eco
-253.00
-277.97
23.27
-705.11
LU
-42.16
-45.78
4.32
-113.17
WU
-11.88
-12.90
1.31
-32.39
Rumm
0.00
0.00
0.00
0.00
Ruec
-79.80
-87.60
7.12
-221.87
Table A 29 - Characterized result scores for all the selected impact categories - Recycling scenario of PLA rigid packaging product.
RC = 50%
Median
Mean
5%
95%
CC
-0.79
-1.22
1.46
-5.85
OZ
0.00
0.00
0.00
0.00
HTc
0.00
0.00
0.00
0.00
HTnc
0.00
0.00
0.00
0.00
PM
0.00
0.00
0.00
0.00
IR
0.01
0.01
0.07
-0.02
POM
0.00
0.00
0.00
-0.01
Ac
0.00
0.00
0.01
-0.02
ET
-0.01
-0.02
0.03
-0.11
EF
0.00
0.00
0.00
0.00
EM
0.00
0.00
0.00
-0.01
Eco
-22.14
-32.11
33.96
-147.78
LU
-0.63
-1.49
10.16
-17.48
WU
-0.46
-0.87
1.93
-5.77
Rumm
0.00
0.00
0.00
0.00
Ruec
-6.89
-10.15
10.31
-46.21
Table A 30 - Characterized result scores for all the selected impact categories - Incineration scenario of PLA rigid packaging product.
RC = 50%
Median
Mean
5%
95%
CC
1.60
1.60
1.83
1.40
OZ
0.00
0.00
0.00
0.00
HTc
0.00
0.00
0.00
0.00
HTnc
0.00
0.00
0.00
0.00
PM
0.00
0.00
0.00
0.00
IR
-0.02
-0.02
-0.02
-0.03
POM
0.00
0.00
0.00
0.00
Ac
0.01
0.01
0.01
0.01
ET
0.03
0.03
0.03
0.03
EF
0.00
0.00
0.00
0.00
EM
0.00
0.00
0.00
0.00
Eco
32.64
32.86
37.94
29.20
LU
4.16
4.12
6.32
1.44
WU
1.89
1.91
2.40
1.51
Rumm
0.00
0.00
0.00
0.00
Ruec
10.89
10.94
12.56
9.65
51
MOF, Alm.del - 2023-24 - Endeligt svar på spørgsmål 393: MFU spm. om oversendelse af de i MOF alm. del - svar på spm. 277 omtalte livscyklusanalyser fra DTU, branchen og EU-Kommissionen
11.2.6 Paper
Table A 31 - Characterized result scores for all the selected impact categories - Reuse scenario of a rigid paper packaging product.
RC = 50%
Median
Mean
5%
95%
CC
-0.03
-0.04
0.30
-0.40
OZ
0.00
0.00
0.00
0.00
HTc
0.00
0.00
0.00
0.00
HTnc
0.00
0.00
0.00
0.00
PM
0.00
0.00
0.00
0.00
IR
0.00
0.00
0.00
0.00
POM
0.00
0.00
0.00
0.00
Ac
0.00
0.00
0.00
0.00
ET
0.00
0.00
0.00
0.00
EF
0.00
0.00
0.00
0.00
EM
0.00
0.00
0.00
0.00
Eco
-2.24
-2.31
2.19
-6.98
LU
9.95
9.14
60.74
-43.24
WU
-0.03
-0.03
0.06
-0.14
Rumm
0.00
0.00
0.00
0.00
Ruec
-1.33
-1.45
1.25
-4.57
Table A 32 - Characterized result scores for all the selected impact categories - Recycling scenario of rigid paper packaging product.
RC = 50%
Median
Mean
5%
95%
CC
0.26
0.26
0.48
0.03
OZ
0.00
0.00
0.00
0.00
HTc
0.00
0.00
0.00
0.00
HTnc
0.00
0.00
0.00
0.00
PM
0.00
0.00
0.00
0.00
IR
0.00
0.00
0.00
0.00
POM
0.00
0.00
0.00
0.00
Ac
0.00
0.00
0.00
0.00
ET
0.00
0.00
0.01
0.00
EF
0.00
0.00
0.00
0.00
EM
0.00
0.00
0.00
0.00
Eco
7.03
7.05
8.29
5.93
LU
27.98
27.97
72.00
-18.69
WU
0.25
0.25
0.29
0.20
Rumm
0.00
0.00
0.00
0.00
Ruec
2.82
2.83
3.77
1.93
Table A 33 - Characterized result scores for all the selected impact categories - Incineration scenario of rigid paper packaging product.
RC = 50%
Median
Mean
5%
95%
CC
0.60
0.60
0.67
0.54
OZ
0.00
0.00
0.00
0.00
HTc
0.00
0.00
0.00
0.00
HTnc
0.00
0.00
0.00
0.00
PM
0.00
0.00
0.00
0.00
IR
0.00
0.00
0.00
0.00
POM
0.00
0.00
0.00
0.00
Ac
0.00
0.00
0.00
0.00
ET
0.01
0.01
0.01
0.01
EF
0.00
0.00
0.00
0.00
EM
0.00
0.00
0.00
0.00
Eco
1.17
1.16
1.62
0.68
LU
96.47
96.45
98.70
94.25
WU
0.05
0.05
0.07
0.03
Rumm
0.00
0.00
0.00
0.00
Ruec
2.11
2.11
2.67
1.53
52
MOF, Alm.del - 2023-24 - Endeligt svar på spørgsmål 393: MFU spm. om oversendelse af de i MOF alm. del - svar på spm. 277 omtalte livscyklusanalyser fra DTU, branchen og EU-Kommissionen
11.2.7 Cartonboard
Table A 34 - Characterized result scores for all the selected impact categories - Reuse cartonboard rigid packaging product scenario.
RC = 50%
Median
Mean
5%
95%
CC
-0.48
-0.58
0.05
-1.69
OZ
0.00
0.00
0.00
0.00
HTc
0.00
0.00
0.00
0.00
HTnc
0.00
0.00
0.00
0.00
PM
0.00
0.00
0.00
0.00
IR
0.00
0.00
0.00
-0.02
POM
0.00
0.00
0.00
-0.01
Ac
0.00
0.00
0.00
-0.01
ET
-0.01
-0.01
0.00
-0.02
EF
0.00
0.00
0.00
0.00
EM
0.00
0.00
0.00
0.00
Eco
-13.26
-16.09
1.94
-46.69
LU
-42.67
-50.52
5.62
-142.47
WU
-0.44
-0.54
0.06
-1.69
Rumm
0.00
0.00
0.00
0.00
Ruec
-5.58
-6.87
0.74
-21.70
Table A 35 - Characterized result scores for all the selected impact categories - Recycling cartonboard rigid packaging product scenario.
RC = 50%
Median
Mean
5%
95%
CC
-0.12
-0.15
0.09
-0.56
OZ
0.00
0.00
0.00
0.00
HTc
0.00
0.00
0.00
0.00
HTnc
0.00
0.00
0.00
0.00
PM
0.00
0.00
0.00
0.00
IR
0.00
0.00
0.00
0.00
POM
0.00
0.00
0.00
0.00
Ac
0.00
0.00
0.00
0.00
ET
0.00
0.00
0.00
0.00
EF
0.00
0.00
0.00
0.00
EM
0.00
0.00
0.00
0.00
Eco
-3.23
-4.07
2.96
-15.20
LU
-14.48
-18.02
6.25
-56.22
WU
-0.13
-0.17
0.11
-0.65
Rumm
0.00
0.00
0.00
0.00
Ruec
-0.90
-1.34
1.37
-6.25
Table A 36 - Characterized result scores for all the selected impact categories - Incineration scenario of cartonboard rigid packaging product.
RC = 50%
Median
Mean
5%
95%
CC
0.12
0.13
0.21
0.06
OZ
0.00
0.00
0.00
0.00
HTc
0.00
0.00
0.00
0.00
HTnc
0.00
0.00
0.00
0.00
PM
0.00
0.00
0.00
0.00
IR
0.00
0.00
0.00
0.00
POM
0.00
0.00
0.00
0.00
Ac
0.00
0.00
0.00
0.00
ET
0.00
0.00
0.00
0.00
EF
0.00
0.00
0.00
0.00
EM
0.00
0.00
0.00
0.00
Eco
2.85
2.87
4.88
1.26
LU
10.14
10.23
16.57
4.58
WU
0.10
0.10
0.18
0.04
Rumm
0.00
0.00
0.00
0.00
Ruec
1.26
1.31
2.36
0.51
53
MOF, Alm.del - 2023-24 - Endeligt svar på spørgsmål 393: MFU spm. om oversendelse af de i MOF alm. del - svar på spm. 277 omtalte livscyklusanalyser fra DTU, branchen og EU-Kommissionen
11.2.8 Corrugated board
Table A 37 - Characterized result scores for all the selected impact categories - Reuse scenario of corrugated board rigid packaging product.
RC = 50%
Median
Mean
5%
95%
CC
-0.36
-0.47
0.06
-1.41
OZ
0.00
0.00
0.00
0.00
HTc
0.00
0.00
0.00
0.00
HTnc
0.00
0.00
0.00
0.00
PM
0.00
0.00
0.00
0.00
IR
0.00
-0.01
0.00
-0.02
POM
0.00
0.00
0.00
0.00
Ac
0.00
0.00
0.00
-0.01
ET
0.00
0.00
0.00
-0.01
EF
0.00
0.00
0.00
0.00
EM
0.00
0.00
0.00
0.00
Eco
-5.64
-7.48
0.95
-24.54
LU
-47.46
-61.00
6.27
-184.08
WU
-0.13
-0.16
0.02
-0.50
Rumm
0.00
0.00
0.00
0.00
Ruec
-3.75
-4.86
0.51
-14.81
Table A 38 - Characterized result scores for all the selected impact categories - Recycling scenario of corrugated board rigid packaging product.
RC = 50%
Median
Mean
5%
95%
CC
-0.09
-0.11
0.05
-0.33
OZ
0.00
0.00
0.00
0.00
HTc
0.00
0.00
0.00
0.00
HTnc
0.00
0.00
0.00
0.00
PM
0.00
0.00
0.00
0.00
IR
0.00
0.00
0.00
0.00
POM
0.00
0.00
0.00
0.00
Ac
0.00
0.00
0.00
0.00
ET
0.00
0.00
0.00
0.00
EF
0.00
0.00
0.00
0.00
EM
0.00
0.00
0.00
0.00
Eco
-8.43
-10.01
-0.17
-25.81
LU
-13.62
-16.52
5.38
-50.08
WU
-0.01
-0.01
0.05
-0.08
Rumm
0.00
0.00
0.00
0.00
Ruec
-0.88
-1.07
0.49
-3.41
Table A 39 - Characterized result scores for all the selected impact categories - Incineration scenario of corrugated board rigid packaging product.
RC = 50%
Median
Mean
5%
95%
CC
0.07
0.07
0.12
0.03
OZ
0.00
0.00
0.00
0.00
HTc
0.00
0.00
0.00
0.00
HTnc
0.00
0.00
0.00
0.00
PM
0.00
0.00
0.00
0.00
IR
0.00
0.00
0.00
0.00
POM
0.00
0.00
0.00
0.00
Ac
0.00
0.00
0.00
0.00
ET
0.00
0.00
0.00
0.00
EF
0.00
0.00
0.00
0.00
EM
0.00
0.00
0.00
0.00
Eco
0.37
0.42
0.97
0.09
LU
8.09
8.12
13.22
3.09
WU
0.01
0.01
0.02
0.01
Rumm
0.00
0.00
0.00
0.00
Ruec
0.52
0.52
0.85
0.19
54
MOF, Alm.del - 2023-24 - Endeligt svar på spørgsmål 393: MFU spm. om oversendelse af de i MOF alm. del - svar på spm. 277 omtalte livscyklusanalyser fra DTU, branchen og EU-Kommissionen
11.2.9 Aluminium
Table A 40 - Characterized result scores for all the selected impact categories - Reuse scenario of aluminium flexible packaging product.
RC = 50%
Median
Mean
5%
95%
CC
-2.07
-2.61
0.19
-7.69
OZ
0.00
0.00
0.00
0.00
HTc
0.00
0.00
0.00
0.00
HTnc
0.00
0.00
0.00
0.00
PM
0.00
0.00
0.00
0.00
IR
0.01
0.01
0.02
0.00
POM
-0.01
-0.01
0.00
-0.03
Ac
-0.01
-0.01
0.00
-0.04
ET
-0.03
-0.04
0.00
-0.11
EF
0.00
0.00
0.00
0.00
EM
0.00
0.00
0.00
-0.01
Eco
-73.40
-93.50
3.83
-274.26
LU
-120.58
-154.45
-0.01
-465.44
WU
-0.29
-0.36
0.02
-1.06
Rumm
0.00
0.00
0.00
0.00
Ruec
-29.64
-37.27
2.54
-109.00
Table A 41 - Characterized result scores for all the selected impact categories - Recycling scenario of aluminium flexible packaging product.
RC = 50%
Median
Mean
5%
95%
CC
-1.46
-1.79
0.23
-5.32
OZ
0.00
0.00
0.00
0.00
HTc
0.00
0.00
0.00
0.00
HTnc
0.00
0.00
0.00
0.00
PM
0.00
0.00
0.00
0.00
IR
0.01
0.01
0.03
0.00
POM
0.00
0.00
0.00
-0.01
Ac
0.00
-0.01
0.00
-0.02
ET
-0.01
-0.01
0.00
-0.03
EF
0.00
0.00
0.00
0.00
EM
0.00
0.00
0.00
0.00
Eco
-25.33
-30.85
8.64
-95.47
LU
20.20
22.40
50.69
5.10
WU
-0.15
-0.19
0.02
-0.57
Rumm
0.00
0.00
0.00
0.00
Ruec
-21.13
-25.88
2.78
-76.23
Table A 42 - Characterized result scores for all the selected impact categories - Incineration scenario of aluminium flexible packaging product.
RC = 50%
Median
Mean
5%
95%
CC
0.38
0.38
0.69
0.11
OZ
0.00
0.00
0.00
0.00
HTc
0.00
0.00
0.00
0.00
HTnc
0.00
0.00
0.00
0.00
PM
0.00
0.00
0.00
0.00
IR
0.00
0.00
0.00
0.00
POM
0.00
0.00
0.00
0.00
Ac
0.00
0.00
0.00
0.00
ET
0.00
0.00
0.01
0.00
EF
0.00
0.00
0.00
0.00
EM
0.00
0.00
0.00
0.00
Eco
10.29
10.51
18.86
2.92
LU
9.24
9.40
16.71
2.59
WU
0.04
0.04
0.08
0.01
Rumm
0.00
0.00
0.00
0.00
Ruec
5.28
5.38
9.68
1.49
55
MOF, Alm.del - 2023-24 - Endeligt svar på spørgsmål 393: MFU spm. om oversendelse af de i MOF alm. del - svar på spm. 277 omtalte livscyklusanalyser fra DTU, branchen og EU-Kommissionen
Table A 43 - Characterized result scores for all the selected impact categories - Reuse scenario of aluminium rigid packaging product.
RC = 50%
Median
Mean
5%
95%
CC
-21.02
-22.99
0.33
-58.35
OZ
0.00
0.00
0.00
0.00
HTc
0.00
0.00
0.00
0.00
HTnc
0.00
0.00
0.00
0.00
PM
0.00
0.00
0.00
0.00
IR
0.07
0.07
0.19
0.00
POM
-0.08
-0.09
0.00
-0.23
Ac
-0.10
-0.11
0.00
-0.28
ET
-0.28
-0.31
-0.01
-0.78
EF
0.00
0.00
0.00
0.00
EM
-0.02
-0.02
0.00
-0.06
Eco
-720.47
-784.67
-8.06
-2007.20
LU
-1136.53
-1238.60
-49.93
-3074.54
WU
-2.87
-3.20
0.01
-8.30
Rumm
0.00
0.00
0.00
0.00
Ruec
-302.49
-329.63
4.35
-845.98
Table A 44 - Characterized result scores for all the selected impact categories - Recycling scenario of aluminium rigid packaging product.
RC = 50%
Median
Mean
5%
95%
CC
-12.51
-13.31
0.53
-31.54
OZ
0.00
0.00
0.00
0.00
HTc
0.00
0.00
0.00
0.00
HTnc
0.00
0.00
0.00
0.00
PM
0.00
0.00
0.00
0.00
IR
0.07
0.08
0.19
0.00
POM
-0.04
-0.04
0.00
-0.09
Ac
-0.04
-0.05
0.00
-0.11
ET
-0.07
-0.08
0.01
-0.19
EF
0.00
0.00
0.00
0.00
EM
-0.01
-0.01
0.00
-0.02
Eco
-231.09
-245.76
12.69
-593.08
LU
102.03
107.87
223.32
30.90
WU
-1.28
-1.38
0.02
-3.44
Rumm
0.00
0.00
0.00
0.00
Ruec
-180.45
-191.81
6.36
-456.60
Table A 45 - Characterized result scores for all the selected impact categories - Incineration scenario of aluminium rigid packaging product.
RC = 50%
Median
Mean
5%
95%
CC
1.29
1.29
1.74
0.88
OZ
0.00
0.00
0.00
0.00
HTc
0.00
0.00
0.00
0.00
HTnc
0.00
0.00
0.00
0.00
PM
0.00
0.00
0.00
0.00
IR
-0.01
-0.01
0.00
-0.01
POM
0.00
0.00
0.01
0.00
Ac
0.01
0.01
0.01
0.00
ET
0.01
0.01
0.02
0.01
EF
0.00
0.00
0.00
0.00
EM
0.00
0.00
0.00
0.00
Eco
33.05
32.99
44.08
22.41
LU
23.01
23.09
31.39
15.38
WU
0.12
0.13
0.21
0.07
Rumm
0.00
0.00
0.00
0.00
Ruec
18.02
18.02
24.13
12.23
56
MOF, Alm.del - 2023-24 - Endeligt svar på spørgsmål 393: MFU spm. om oversendelse af de i MOF alm. del - svar på spm. 277 omtalte livscyklusanalyser fra DTU, branchen og EU-Kommissionen
11.2.10
Steel
Table A 46 - Characterized result scores for all the selected impact categories - Reuse scenario of steel rigid packaging product.
RC
= 50%
Median
Mean
5%
95%
CC
-16.56
-16.86
0.77
-38.69
OZ
0.00
0.00
0.00
0.00
HTc
0.00
0.00
0.00
0.00
HTnc
0.00
0.00
0.00
0.00
PM
0.00
0.00
0.00
0.00
IR
0.12
0.12
0.28
0.00
POM
-0.08
-0.08
0.00
-0.18
Ac
-0.05
-0.05
0.00
-0.12
ET
-0.19
-0.19
0.00
-0.44
EF
0.00
0.00
0.00
0.00
EM
-0.02
-0.02
0.00
-0.04
Eco
-531.27
-540.70
11.71
-1229.02
LU
-165.10
-170.64
8.09
-399.67
WU
-5.68
-5.93
0.25
-14.01
Rumm
0.00
0.00
0.00
0.00
Ruec
-181.80
-185.97
7.74
-430.95
Table A 47 - Characterized result scores for all the selected impact categories - Recycling scenario of steel rigid packaging product.
RC = 50%
Median
Mean
5%
95%
CC
-3.50
-3.44
0.25
-7.77
OZ
0.00
0.00
0.00
0.00
HTc
0.00
0.00
0.00
0.00
HTnc
0.00
0.00
0.00
0.00
PM
0.00
0.00
0.00
0.00
IR
0.00
0.00
0.01
0.00
POM
-0.02
-0.02
0.00
-0.04
Ac
-0.01
-0.01
0.00
-0.03
ET
-0.03
-0.03
0.00
-0.06
EF
0.00
0.00
0.00
0.00
EM
0.00
0.00
0.00
-0.01
Eco
-77.16
-75.47
10.42
-173.58
LU
-4.24
-5.03
6.12
-21.43
WU
-0.49
-0.48
0.21
-1.30
Rumm
0.00
0.00
0.00
0.00
Ruec
-42.63
-42.02
2.58
-93.78
Table A 48 - Characterized result scores for all the selected impact categories - Incineration scenario of steel rigid packaging product.
RC = 50%
Median
Mean
5%
95%
CC
0.28
0.28
0.36
0.20
OZ
0.00
0.00
0.00
0.00
HTc
0.00
0.00
0.00
0.00
HTnc
0.00
0.00
0.00
0.00
PM
0.00
0.00
0.00
0.00
IR
0.00
0.00
0.00
0.00
POM
0.00
0.00
0.00
0.00
Ac
0.00
0.00
0.00
0.00
ET
0.00
0.00
0.01
0.00
EF
0.00
0.00
0.00
0.00
EM
0.00
0.00
0.00
0.00
Eco
9.79
9.84
12.77
7.19
LU
5.74
5.75
7.58
4.12
WU
0.20
0.20
0.26
0.15
Rumm
0.00
0.00
0.00
0.00
Ruec
2.26
2.27
3.06
1.58
57
MOF, Alm.del - 2023-24 - Endeligt svar på spørgsmål 393: MFU spm. om oversendelse af de i MOF alm. del - svar på spm. 277 omtalte livscyklusanalyser fra DTU, branchen og EU-Kommissionen
11.2.11
Glass
Table A 49 - Characterized result scores for all the selected impact categories - Reuse scenario of glass rigid packaging product.
RC = 50%
Median
Mean
5%
95%
CC
-6.11
-7.32
0.37
-19.89
OZ
0.00
0.00
0.00
0.00
HTc
0.00
0.00
0.00
0.00
HTnc
0.00
0.00
0.00
0.00
PM
0.00
0.00
0.00
0.00
IR
0.00
0.01
0.03
0.00
POM
-0.02
-0.02
0.00
-0.06
Ac
-0.04
-0.05
0.00
-0.14
ET
-0.11
-0.13
0.01
-0.37
EF
0.00
0.00
0.00
0.00
EM
-0.01
-0.01
0.00
-0.02
Eco
-311.22
-380.08
16.49
-1049.16
LU
-209.42
-262.42
17.55
-811.76
WU
-5.95
-7.26
0.46
-20.24
Rumm
0.00
0.00
0.00
0.00
Ruec
-90.71
-114.11
6.44
-349.29
Table A 50 - Characterized result scores for all the selected impact categories - Recycling scenario of glass rigid packaging product.
RC = 50%
Median
Mean
5%
95%
CC
-2.08
-2.23
0.34
-5.73
OZ
0.00
0.00
0.00
0.00
HTc
0.00
0.00
0.00
0.00
HTnc
0.00
0.00
0.00
0.00
PM
0.00
0.00
0.00
0.00
IR
0.04
0.05
0.11
0.01
POM
0.00
-0.01
0.00
-0.01
Ac
-0.02
-0.02
0.00
-0.05
ET
-0.05
-0.05
0.00
-0.13
EF
0.00
0.00
0.00
0.00
EM
0.00
0.00
0.00
0.00
Eco
-169.93
-180.48
12.49
-443.52
LU
-57.62
-61.24
15.37
-163.27
WU
-3.67
-3.90
0.17
-9.52
Rumm
0.00
0.00
0.00
0.00
Ruec
-19.26
-21.02
7.90
-58.38
Table A 51 - Characterized result scores for all the selected impact categories - Incineration scenario of glass rigid packaging product.
RC = 50%
Median
Mean
5%
95%
CC
0.59
0.61
1.05
0.31
OZ
0.00
0.00
0.00
0.00
HTc
0.00
0.00
0.00
0.00
HTnc
0.00
0.00
0.00
0.00
PM
0.00
0.00
0.00
0.00
IR
0.00
0.00
0.00
0.00
POM
0.00
0.00
0.00
0.00
Ac
0.00
0.00
0.01
0.00
ET
0.01
0.01
0.02
0.01
EF
0.00
0.00
0.00
0.00
EM
0.00
0.00
0.00
0.00
Eco
30.53
31.28
48.39
17.69
LU
20.83
21.73
36.98
10.80
WU
0.57
0.59
0.90
0.34
Rumm
0.00
0.00
0.00
0.00
Ruec
8.96
9.70
18.69
3.78
58