Transportudvalget 2023-24
TRU Alm.del Bilag 52
Offentligt
Welkom
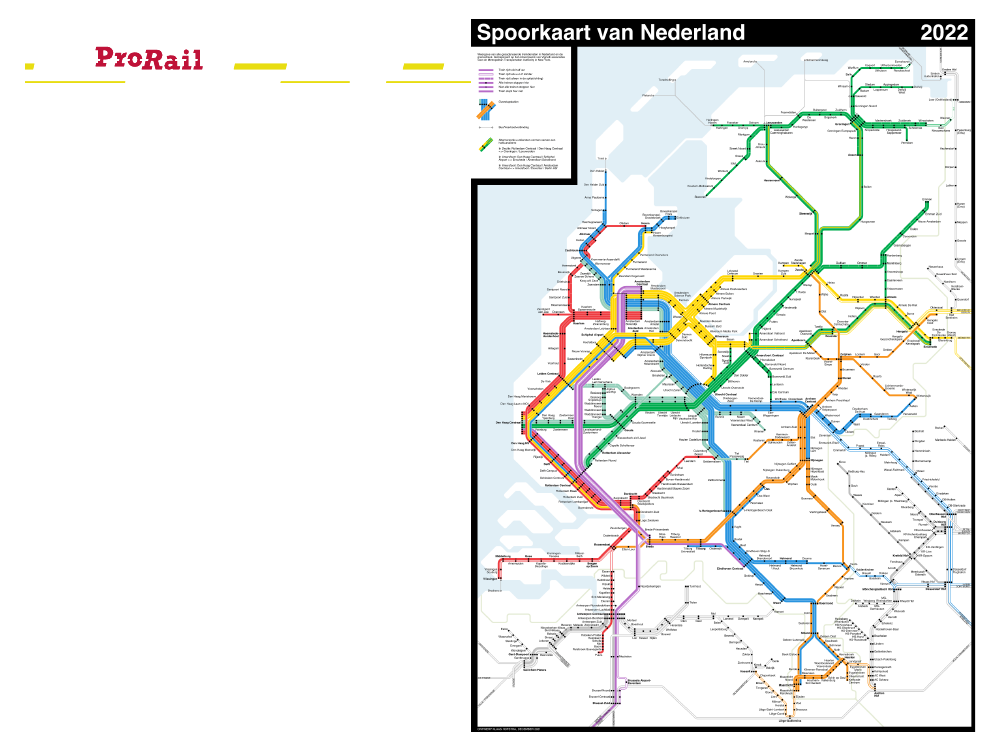
Redesigning the
railways of the
Netherlands
Wout Knijnenburg
Klaas Hofstra
Utrecht, October 2023
Eigenaar: Klaas Hofstra
14 april 2016
Status: Definitief