Ligestillingsudvalget 2019-20
LIU Alm.del Bilag 65
Offentligt
2164293_0001.png
ANNEX List of issues in relation to the ninth periodic report of Denmark:
Replies of Denmark
Table 1. Women in the workforce: Participation rate by gender, 2008-2018
1
2008
Men
Women
Difference
80,3
75,3
5,0
2009
78,4
74,4
4,0
2010
77,8
73,8
4,0
2011
77,4
73,3
4,1
2012
77
73,1
3,9
2013
76,7
72,9
3,8
2014
76,5
72,8
3,7
2015
76,8
73
3,8
2016
77,6
73,5
4,1
2017
78,3
74,4
3,9
2018
79
75,2
3,8
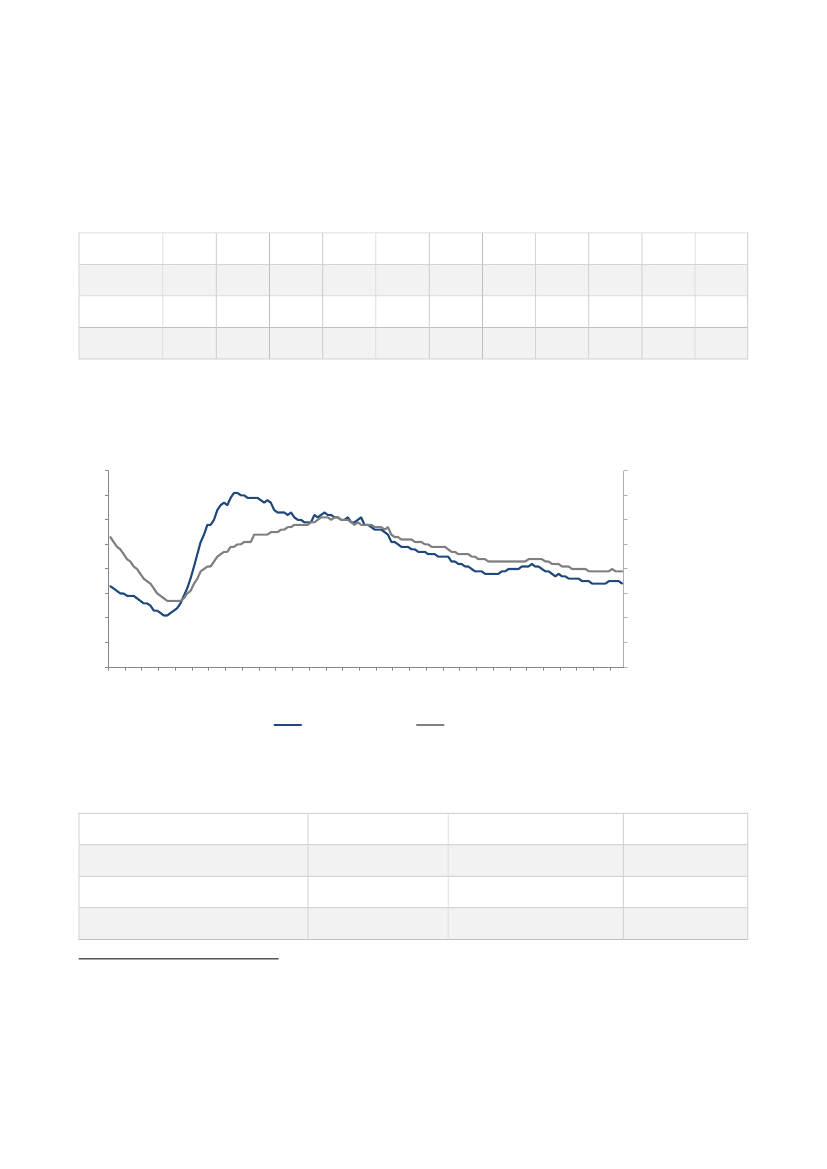
Figure 1. Unemployment rate in per cent by gender
2
Statistics Denmark (AUS07)
Pct.
8
7
6
5
4
3
2
1
0
January 2007
October 2019
Pct.
8
7
6
5
4
3
2
1
0
jan-07
jun-07
nov-07
apr-08
sep-08
feb-09
jul-09
dec-09
Table 2. Part-time employment, divided by voluntary and involuntary, as percentage of total
employment.
Age 15 to 64 years. By sex (2018). Source: Statistics Denmark (AKU)
Percent
Part-time work
Hereby:
Voluntary
13.0
30.1
21.1
Males
14.5
Females
34.3
Total
23.9
1
Statistics Denmark (RAS200
maj-10
okt-10
mar-11
aug-11
jan-12
jun-12
nov-12
apr-13
sep-13
feb-14
jul-14
dec-14
maj-15
okt-15
mar-16
aug-16
jan-17
jun-17
nov-17
apr-18
sep-18
feb-19
jul-19
Men
Women
LIU, Alm.del - 2019-20 - Bilag 65: Den danske besvarelse af CEDAW-komitéens list of issues om Danmarks efterlevelse af FN's Kvindekonvention (CEDAW), fra ministeren for fødevarer, fiskeri og ligestilling
2164293_0002.png
Involuntary
1.5
4.2
2.8
Elementary school, results
Figure 2. The average grade score of the final examination in the public school in 9
th
grade, 2018/19, by
descent and gender
The average grade score
9,0
8,0
7,0
6,0
5,0
4,0
3,0
2,0
1,0
0,0
Immigrant
Descendant
Boys
Girls
Danish
4,7
5,7
5,4
6,3
7,7
6,9
N.B. Pupils in special schools and special classes are not included in the results.
Source: The Danish Ministry of Education.
Elementary school, well-being
Figure 3.
Pupils’ well-being
in the public school, distributed by descent and gender, 2018/2019
Average well-being score
4,00
3,50
3,00
2,50
2,00
1,50
1,00
0,50
0,00
Immigrant
Descendant
Boys
Girls
Danish
3,77
3,71
3,76
3,68
3,74
3,70
N.B.
The 'General Well-being' indicator is an overall indicator of 29 questions. The average ranges from 1 to 5, where 1 represents the least possible
well-being, and 5 represent the best possible well-being. The report shows an average score of the students' average.
Source: Ministry of Education.
LIU, Alm.del - 2019-20 - Bilag 65: Den danske besvarelse af CEDAW-komitéens list of issues om Danmarks efterlevelse af FN's Kvindekonvention (CEDAW), fra ministeren for fødevarer, fiskeri og ligestilling
2164293_0003.png
General upper secondary education
Figure 4. Transition from elementary school to general upper secondary education, 2017/2018. Pupils are
attending a general upper secondary education 15 months after finishing elementary school? Distributed
by descent and gender
80 %
70 %
60 %
50 %
40 %
30 %
20 %
10 %
0%
Immigrant
Descendant
Men
Source: Ministry of Education.
71 %
59 %
58 %
73 %
33 %
24 %
Danish
Women
Vocational education and training (VET)
Distributed by descent and gender
Figure 5. Transition from elementary school to vocational education and training , 2017/2018. How many
pupils are attending vocational education and training 15 months after finishing elementary school?
30 %
26 %
25 %
20 %
15 %
10 %
5%
0%
Immigrant
Descendant
Men
Women
Danish
18 %
14 %
10 %
10 %
12 %
Source: Ministry of Education.
LIU, Alm.del - 2019-20 - Bilag 65: Den danske besvarelse af CEDAW-komitéens list of issues om Danmarks efterlevelse af FN's Kvindekonvention (CEDAW), fra ministeren for fødevarer, fiskeri og ligestilling
2164293_0004.png
Primary and lower secondary education
Figure 6. The average grade score of the final examination in the public school, 2006/2007-2018/2019,
distributed by gender
8,0
7,0
6,0
5,0
4,0
3,0
2,0
1,0
0,0
6,4
5,9
6,6
6,1
6,3
5,9
6,7
6,2
6,6
6,0
6,8
6,2
7,0
6,4
7,1
6,4
7,4
6,7
7,5
6,7
7,5
6,7
7,4
6,6
7,5
6,6
Boys
Girls
N.B. The results show the final grade average of public school pupils in 9th grade in the bound exam subjects. Pupils in special schools and special
classes are not included in the results.
Source: Ministry of Children and Education.
Pupils’ well-being
in the public school
Figure 7.
Pupils’ well-being
in the public school
70,0 %
60,0 %
50,0 %
40,0 %
30,0 %
20,0 %
10,0 %
0,0 %
1-2
2,1-3
3,1-4
4,1-5
1-2
2,1-3
3,1-4
4,1-5
1-2
2,1-3
3,1-4
4,1-5
2016/2017
2017/2018
Boys
Girls
2018/2019
N.B.
The 'General Well-being' indicator is an overall indicator of 29 questions.. The average ranges from 1 to 5, where 1 represents the least possible
well-being, and 5 represent the best possible well-being. The report shows an average score of the students' average.
Source: Ministry of Children and Education.
LIU, Alm.del - 2019-20 - Bilag 65: Den danske besvarelse af CEDAW-komitéens list of issues om Danmarks efterlevelse af FN's Kvindekonvention (CEDAW), fra ministeren for fødevarer, fiskeri og ligestilling
2164293_0005.png
General upper secondary education
General upper secondary education in Denmark comprises four different programmes. A majority of male
students choose programmes containing a more technical (htx) and commercial profile (hhx) whereas
female students tend to choose programmes that have a broader common profile containing for instance
more foreign languages (stx and hf).
Figure 8. The male-female ratio of the 4 programmes in the genreal upper secondary education in
2018/2019
100%
90%
80%
70%
60%
50%
40%
30%
20%
10%
0%
Htx
Hhx
Male
Hf
Female
Stx
Total
72%
60%
41%
39%
46%
28%
40%
59%
61%
54%
Source: Ministry of Children and Education.
Vocational Education and Training (VET)
Figure 9. Proportion of males and females who have completed the main course of vocational education
and training
60%
55%
50%
45%
40%
35%
30%
2012
2013
2014
Male
2015
Female
2016
2017
2018
N.B. Only students who completed the main course (VET) is included in the figure.
Source: Ministry of Children and Education.
LIU, Alm.del - 2019-20 - Bilag 65: Den danske besvarelse af CEDAW-komitéens list of issues om Danmarks efterlevelse af FN's Kvindekonvention (CEDAW), fra ministeren for fødevarer, fiskeri og ligestilling
2164293_0006.png
Table 3. Academic staff by gender
2013
Women %
18,4%
30,6%
42,3%
39,7%
31,5%
2014
Women %
18,8%
31,7%
42,5%
38,3%
31,9%
2015
Women %
19,8%
32,6%
41,9%
38,2%
32,4%
2016
Women %
20,9%
32,9%
42,4%
40,2%
33,2%
2017
Women %
22,2%
33,3%
41,3%
40,0%
33,6%
2018
Women %
23,0%
33,9%
39,8%
42,2%
34,3%
Level
Professor
Associate Professor
Assistant Professor
Postdoc
Total
Table 4. Success rates for applicants to the Independent Research Fund Denmark
Independent Research Fund
Denmark (DFF)
Success rates for number of
applicants
Success rates for amounts applied
for
Main Applicant
Women
Men
Women
Men
2013
18
20
14
17
2014
11
16
7
13
2015
14
15
9
11
2016
13
14
8
10
2017
17
17
13
14
2018
17
18
14
15
Table 5. Human Trafficking
Female victims of trafficking 2015-2019
disaggregated by age and nationality
Over 18
Nigeria
Thailand
Romania
Uganda
Kenya
Congo
Cameroun
Albania
Vietnam
China
Poland
222
35
8
7
5
3
2
2
2
2
2
Brazil
Zambia
Russia
Bulgaria
Ethiopia
Burundi
Sudan
Nicaragua
Tanzania
Egypt
Colombia
1
1
1
1
1
1
1
1
1
1
1
Number
Number
LIU, Alm.del - 2019-20 - Bilag 65: Den danske besvarelse af CEDAW-komitéens list of issues om Danmarks efterlevelse af FN's Kvindekonvention (CEDAW), fra ministeren for fødevarer, fiskeri og ligestilling
2164293_0007.png
Sierra Leone
Ghana
Ukraine
Syriah
Serbia
Bangladesh
Guinea
Somalia
Total
Under 18
Nigeria
Serbia
Somalia
Total
2
2
2
1
1
1
1
1
Eritrea
Afghanistan
Mali
Bosnia
Kirgisistan
Macedonia
Dominican Republic
1
1
1
1
1
1
1
319
4
2
1
Kenya
Ethiopia
1
1
9
Total
328
Table 6.
Female victims of trafficking 2015-2019
disaggregated by age and exploitation
Over 18
Sexual exploitation
N/A
Forced labour
Criminal actions
Other
Sexual expl. and forced labour
Under 18
Sexual exploitation
Other
Total
Number
319
295
7
5
4
4
4
9
7
2
328
LIU, Alm.del - 2019-20 - Bilag 65: Den danske besvarelse af CEDAW-komitéens list of issues om Danmarks efterlevelse af FN's Kvindekonvention (CEDAW), fra ministeren for fødevarer, fiskeri og ligestilling
2164293_0008.png
Table 7.
Female victims of trafficking 2015-2019
disaggregated by age, exploitation and nationality
Over 18
Criminal actions
Romania
Somalia
Syriah
Forced labour
Ethiopia
Kenya
Nicaragua
Poland
N/A
Bosnia
Cameroun
Congo
Mali
Sierra Leone
Thailand
Other
China
Nigeria
Serbia
Thailand
Sexual expl and forced labour
Afghanistan
Nigeria
Thailand
Sexual exploitation
Albania
Bangladesh
Brazil
Number
319
4
2
1
1
5
1
2
1
1
7
1
1
2
1
1
1
4
1
1
1
1
4
1
2
1
295
2
1
1
LIU, Alm.del - 2019-20 - Bilag 65: Den danske besvarelse af CEDAW-komitéens list of issues om Danmarks efterlevelse af FN's Kvindekonvention (CEDAW), fra ministeren for fødevarer, fiskeri og ligestilling
2164293_0009.png
Bulgaria
Burundi
Cameroun
China
Colombia
Congo
Dominican Republic
Egypt
Eritrea
Ghana
Guinea
Kenya
Kirgisistan
Macedonia
Nigeria
Poland
Romania
Russia
Sierra Leone
Sudan
Tanzania
Thailand
Uganda
Ukraine
Vietnam
Zambia
Under 18
Other
Serbia
Sexual exploitation
Ethiopia
Kenya
Nigeria
1
1
1
1
1
1
1
1
1
2
1
3
1
1
219
1
6
1
1
1
1
32
7
2
2
1
9
2
2
7
1
1
4
LIU, Alm.del - 2019-20 - Bilag 65: Den danske besvarelse af CEDAW-komitéens list of issues om Danmarks efterlevelse af FN's Kvindekonvention (CEDAW), fra ministeren for fødevarer, fiskeri og ligestilling
2164293_0010.png
Somalia
Hoved total
1
328
Greenland
Table 8. Number of students actively enrolled in vocational education 2003-2018
2015
2016
2017
2018
Men
582
560
549
559
Women
515
537
521
526
Table 9. Number of students actively enrolled in higher education 2003-2018 by degree level
2015 2016 2017 2018
37
40
41
53
61
58
65
72
59
61
69
62
111 106 101 132
113 101
91
99
391 355 355 374
22
19
21
26
44
60
69
75
Academy profession
University bachelor
Professional bachelors
Master
Men
Women
Men
Women
Men
Women
Men
Women
Faroe Islands Statistical Data
The Faroe Islands do not have statistics disaggregated by sex, age, disability, ethnicity, national minority
status and nationality, but only disaggregated on sex, age and nationality.
Table 10. Distribution by gender in Government
3
The Faroese Executive
2019
2015
Total
7
8
Women
1
4
Women in %
14%
50%
Table 11. Distribution by gender in Government Commissions and Boards 2020
4
Governmental Ministries
Women in %
Men in %
3
4
Source: Council of Gender Equality
Source: Pri e Mi ister’s Office
LIU, Alm.del - 2019-20 - Bilag 65: Den danske besvarelse af CEDAW-komitéens list of issues om Danmarks efterlevelse af FN's Kvindekonvention (CEDAW), fra ministeren for fødevarer, fiskeri og ligestilling
2164293_0011.png
Prime Minister`s Office
Ministry of Social Affairs
Ministry of Fisheries
Ministry of Finance
Ministry of Health
Ministry of Foreign Affairs and Culture
Ministry of Environment, Industry and Trade
Total
40
47,5
26
33
43,5
41
34
37
60
52.5
74
67
56,5
59
66
63
Table 12. Gender Distribution in the Faroese Public School System 2019/20
[1]
Class level
1
2
3
4
5
6
7
8
9
10
Total
Girls
321
318
347
312
349
375
350
362
382
198
3314
Boys
346
339
355
356
374
342
359
410
385
260
3526
Girls % of total
48,1
48,4
49,4
46,7
48,3
52,3
49,4
46,9
49,8
43,2
48,5
[1]
Source: Statistics Faroe Islands
LIU, Alm.del - 2019-20 - Bilag 65: Den danske besvarelse af CEDAW-komitéens list of issues om Danmarks efterlevelse af FN's Kvindekonvention (CEDAW), fra ministeren for fødevarer, fiskeri og ligestilling
2164293_0012.png
Table 13. Secondary Education Sep 2019 - by Gender
[2]
Girls
Students
1145
Boys
668
Total
1813
Girls % of total
63%
Table 14. Higher Education
by Gender and Place of Education
[3]
2015/16
Women
Faroes
Abroad
Total
502
837
1339
Women in %
52%
57%
55%
Men
471
622
1093
Total
973
1459
2432
2016/17
Women
539
773
1312
Women in %
53%
58%
56%
Men
484
564
1048
Total
1023
1337
2360
Figure 10. Duration of unemployment
5
Duration of unemployment (%) October 2019
35
30
25
20
15
10
5
0
< 1 month
1-3 months
3-6 months
Men
Women
6-12 months
< 12 months
5
Source: Statistics Faroe Islands
LIU, Alm.del - 2019-20 - Bilag 65: Den danske besvarelse af CEDAW-komitéens list of issues om Danmarks efterlevelse af FN's Kvindekonvention (CEDAW), fra ministeren for fødevarer, fiskeri og ligestilling
2164293_0013.png
Table 15. Total Wages payments in 2019
(Of the total wages paid in 2019, 37% were paid to women)
6
Wage payments 2019
(DKK 1,000)
Agriculture
Fisheries
Fish farming
Natural resources
Fish productions
Shipyard, smithy
Other industry
Construction
Energy production
Commerce and maintenance
Hotels and restaurants
Maritime transport
Other transport
Post and telecommunication
Finance and insurance
Commercial services
Domestic services
Government
Municipal and other institutions
Education
Health and social services
Organisations, culture etc,
16.745
1.060.682
306.763
54.947
268.895
312.510
216.113
875.126
66.513
541.720
70.616
398.962
273.024
99.325
168.929
299.566
49.679
1.078.964
154.325
365.164
311.158
248.317
8.425
17.169
125.251
2.326
146.651
19.569
72.810
55.711
11.796
337.593
93.409
53.606
89.291
39.522
186.680
112.963
55.931
2.229.700
135.720
727.346
392.769
973.866
25.169
1.077.852
432.014
57.273
415.545
332.079
288.923
930.837
78.309
879.313
164.025
452.567
362.315
138.847
355.609
412.529
105.610
3.308.664
290.044
1.092.510
703.927
1.222.183
32.6%
1.0%
26.5%
3.8%
35.7%
6.5%
24.8%
5.7%
14.7%
38.9%
56.3%
12.5%
24.3%
29.2%
51.1.3%
27.6%
53.5%
46.2%
65.9%
55.1%
79.1%
38.5%
Men
Women
Total
Women in
%
6
Source: Statistics Faroe Islands
LIU, Alm.del - 2019-20 - Bilag 65: Den danske besvarelse af CEDAW-komitéens list of issues om Danmarks efterlevelse af FN's Kvindekonvention (CEDAW), fra ministeren for fødevarer, fiskeri og ligestilling
2164293_0014.png
Undisclosed
Total
151.227
6.317.076
84.352
3.746.438
235.579
10.063.514
50.6%
37%
Table 16. Average wage 2018 (DKK 1,000)
7
Men
Agriculture
Fisheries
Fish farming
Natural resources
Fish productions
Boat building
Other industry
Construction
Energy production
Commerce and maintenance
Hotels and restaurants
Maritime transport
Other transport
Post and telecommunication
Finance and insurance
Commercial services
Domestic services
395
976
517
601
433
425
428
418
493
395
289
571
534
465
624
573
415
Women
362
367
361
344
300
297
306
366
416
250
233
333
376
357
425
410
319
Total average
384
955
464
581
373
414
389
415
480
323
254
527
484
427
503
516
357
Wage difference
9.2%
166.2%
43.2%
74.6%
44.4%
43.1%
39.9%
14.2%
18.4%
58.4%
24.0%
71.4%
42.3%
30.3%
46.9%
39.9%
30.1%
7
Source: Statistics Faroe Islands.
The figures include Faroese citizens aged 16 to 74 years who receive wages over the pay-as-you-earn tax system,
including those who have at least a monthly wage, as well as those on leave because of childbirth or illness. Since
payment to sailors in particular tend to vary, employees are included if they receive no salary for one or two months
provided that they receive a salary again the following month. To prevent double counting, workers are grouped by
the industry where the biggest payment originated each respective month. These rules have been applied in order to
comply in the best possible way with the rules of ILO and hence to be comparable with data from other countries.
LIU, Alm.del - 2019-20 - Bilag 65: Den danske besvarelse af CEDAW-komitéens list of issues om Danmarks efterlevelse af FN's Kvindekonvention (CEDAW), fra ministeren for fødevarer, fiskeri og ligestilling
2164293_0015.png
Government
Municipal and other institutions
Education
Health and social services
Organisations. culture etc.
Undisclosed
Total
549
421
499
528
436
1058
514
425
317
423
348
372
443
337
483
346
454
373
410
875
429
29.3%
33.0%
18.1%
51.6%
17.2%
138.9%
52.3%
Table 17. Population 2015-2019
8
2015
Male
Female
Total
Female in %
25.113
23.504
48.617
48,3
2016
25.378
23.743
49.121
48,3
2017
25.698
24.112
49.810
48,4
2018
26.015
24.466
50.481
48,5
2019
26.534
24.802
51.336
48,3
Table 18. Average Life Expectancy
Male
Female
Average
2012/2013
79.0
83.8
81,4
2015/2016
79.9
84.3
82,0
2017/2018
80,5
84,7
82,3
Table 19. Free HPV-vaccinations (to girls from 2016, to both girls and boys from 2019)
Age
0-11
Girls
Boys
12-20
Girls
Boys
8
2016
4
2017
3
2018
4
119
286
563
2019
5
4
1
888
647
241
Total
16
1856
Source: Statistics Faroe Islands
LIU, Alm.del - 2019-20 - Bilag 65: Den danske besvarelse af CEDAW-komitéens list of issues om Danmarks efterlevelse af FN's Kvindekonvention (CEDAW), fra ministeren for fødevarer, fiskeri og ligestilling
2164293_0016.png
21-65
Women
Men
Total
5
7
13
128
296
580
13
12
1
906
25
1910
Table 20. Number of abortions the last five years
Total
2018
2017
2016
2015
2014
25
19
26
21
30
For every 1.000 born alive
37
29
39
35
47