Klima-, Energi- og Forsyningsudvalget 2018-19 (2. samling)
KEF Alm.del Bilag 88
Offentligt
2079937_0001.png
Report about Danish and European Production and Consumption
of Electricity, mainly Wind and Solar energy
Worked out by Sören Kjärsgaard
Chemical Engineer, M.Sc.
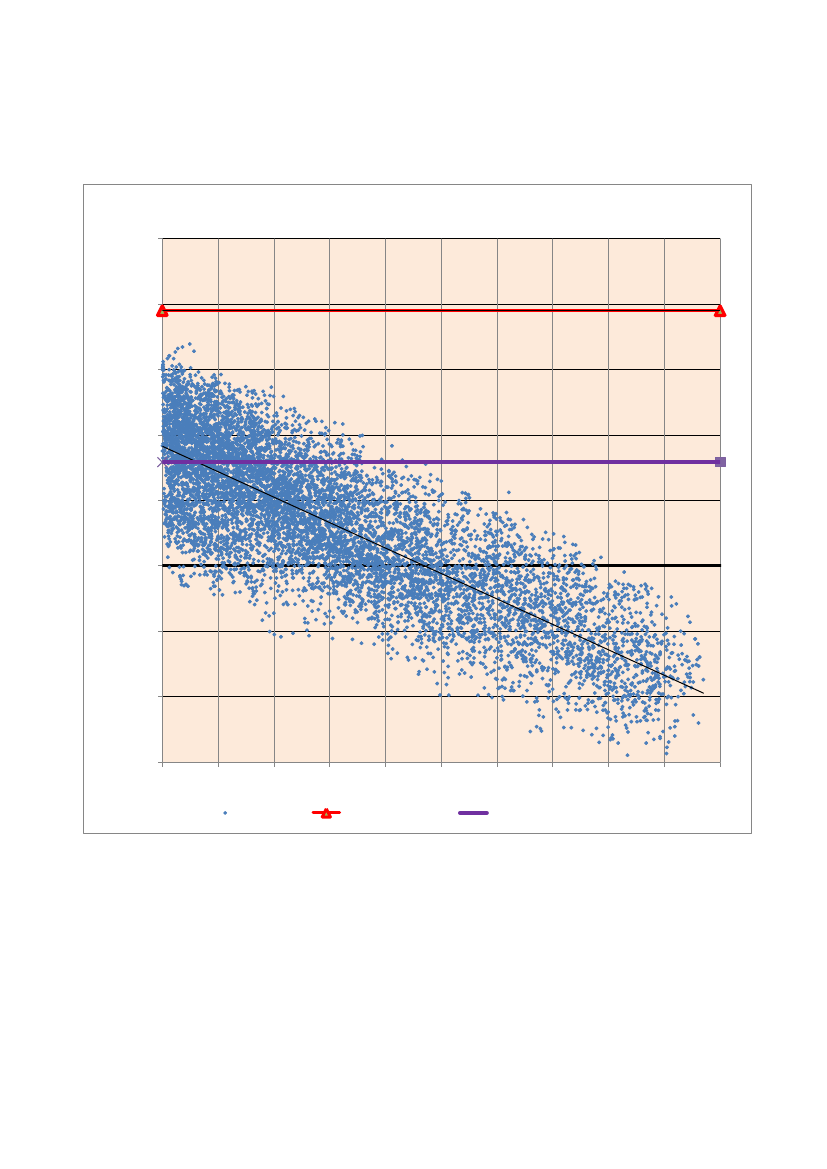
Danish wind Power, Electricity Consumption and import and Export, MW,
2018
5000
4000
3000
2000
Import
and
Export
MW
1000
0
-1000
-2000
y = -0,7778x + 1830,3
R² = 0,6714
-3000
0
500
1000
1500
2000
2500
3000
Wind Power MW
3500
4000
4500
5000
Wind
Load average
Lineær (Wind average)
The graph above shows how dependant Denmark has become of electricity
exchange with our neighbours. When the wind power is less than about 1500 MW
we import a lot of our electricity, and when the wind power is higher than 4000
MW about a third of the wind power is exported.
(Import is positive, and export
negative. The graph contains 8760 points, one for every hour in the year) It will be
shown later that the exchange with Germany is very weak. Germany can neither
use nor store Danish wind power.
Søren Kjærsgård, July , 2019
1 of 111
2018. Danish and European Energy 2018
KEF, Alm.del - 2018-19 (2. samling) - Bilag 88: Henvendelse af 20/9-19 fra Søren Kjærsgård, Grenaa, om synspunkter fra 'Danish and European Energy 2018'
INTRODUCTION
The report is based on data open to the public among others from Danmarks
Statistik, Energistyrelsens Stamdata for Vindmøller, Energinet.dk, BP.s Yearly
Energy Statistics, and others mentioned at the end of this report.
It has been the author’s
purpose with the report to enlighten the consequences of
the present political and public wish to create a
”Green Society”.
According to the Authors opinion a ”Green” energy system will at first have
the consequence that industrial production will be transferred to other parts
of the world who don’t care about green energy. This will be followed by an
enormous waste of money in an experiment which impossibly can lead to the
goal: A “green” society. And finally will follow a deep
impoverishment of
Europe.
At the same time the rest of the world will for many years to come continue
to use more fossile energy. So even if the hypothesis that carbon dioxide
plays an important role for the climate should be true our efforts to reduce
carbon dioxide emissions will have no measurable effect at all.
According to data given by Vattenfall and the weekly periodical “Ingeniøren” it is
even shown that off shore
wind power costs more than nuclear power.
Not to
speak of what wind power would cost if the price for the necessary storages for the
uncontrollably varying wind power were included in the price.
The report is divided in sections (See
”Contents”
page 3) containing 49 tables and
104 figures. Before each of the sections the reader will find a “Summary”.
The main conclusions from each section are shown immediately after the list of
Contents (p.4-8)
Thereafter follows an over view of the most important definitions and a short
curriculum vitae for the author.
The author wants already at this place to draw the reader’s
attention to the much
used word
”Load”
which means consumption of electricity.
The author has chosen
where possible - to use the unit Watt (joule/second)
instead of the unit Joule/Year. The change is made by dividing the number of
joule/year by the number of seconds per year.
Søren Kjærsgård, July , 2019
2 of 111
2018. Danish and European Energy 2018
KEF, Alm.del - 2018-19 (2. samling) - Bilag 88: Henvendelse af 20/9-19 fra Søren Kjærsgård, Grenaa, om synspunkter fra 'Danish and European Energy 2018'
Contents
Summaries ............................................................................................................................................................ 4
Fore word ............................................................................................................................................................. 9
Numbers. ............................................................................................................................................................ 10
Units.................................................................................................................................................................... 10
World Energy and Population ............................................................................................................................ 11
Danish Energy Production 2000-2017 ................................................................................................................ 19
Danish Consumption of Energy 2000-2017 ........................................................................................................ 25
Sustainable Energy ............................................................................................................................................. 34
Increasing Wind Power, Increasing Import and declining Electricity consumption ........................................ 38
How do we get our electricity ............................................................................................................................ 41
Variation in Consumption (Load)........................................................................................................................ 43
Thermal Electricity Production ........................................................................................................................... 45
Danish Wind Energy 2012-18 ............................................................................................................................ 47
On and Off Shore Wind Denmark East and West 2018 ..................................................................................... 49
Off shore wind parks .......................................................................................................................................... 51
Variation Wind Power 2018 ............................................................................................................................... 55
Monthly Averages Wind Power 2012-18 ........................................................................................................... 57
Wind Power variation from Week to Week in 2018 .......................................................................................... 59
Wind and Solar Power Monthly Variation.......................................................................................................... 60
Wind Power and Load ........................................................................................................................................ 62
Useful Wind Power ............................................................................................................................................. 64
Wind Power and Exchange. ................................................................................................................................ 67
Power Exchange with Norway, Sweden and Germany ...................................................................................... 72
Wind AND Solar Power in Denmark, Germany, Norway and Sweden ............................................................... 74
Expanding and Storing off Shore Wind
VI
............................................................................................................ 78
North Sea Cable. Viking Link
IX
, .......................................................................................................................... 82
Die Energiewende
IX
............................................................................................................................................ 92
It always blows and the sun shines somewhere
IX, X
........................................................................................... 94
Wind + Solar Power % of load in Belgium, Germany, France, Spain, UK and the Netherlands ......................... 96
Some Data from Belgium, Germany, Spain, France, United Kingdom and The Netherlands iX, X, ................ 98
Storing of Green Energy ................................................................................................................................... 100
Wind and Nuclear Power
xii
.............................................................................................................................. 105
Danish Plans and Swedish nuclear power.
IX
..................................................................................................... 107
Søren Kjærsgård, July , 2019
3 of 111
2018. Danish and European Energy 2018
KEF, Alm.del - 2018-19 (2. samling) - Bilag 88: Henvendelse af 20/9-19 fra Søren Kjærsgård, Grenaa, om synspunkter fra 'Danish and European Energy 2018'
Summaries
A condensed summary for each of the sections is shown below. It is the author´s
hope, that these summaries will ease the reading and that they will be an appetizer
for those wishing to look at the details.
World Energy and Population
The World’s population
is increasing steadily, in the years 2006-2017 from 6600
million to 7550 million i.e. ca. 80 million per year and the growth rate seems to be
surprisingly constant.
The energy or effect consumption is increasing steadily too, from 14,9 TW in 2006
to 17,9 TW in 2017. The growth rate is on average 0,254 TW/year or 254
GW/year. In 2017 wind and solar power delivered 179 GW. Less than the yearly
growth in consumption.
In 2006 Oil, Coal and gas supplied 90,5 % of the Worlds energy consumption, in
2017 the figure was 88,5 %.
It should be evident, that the idea of a World without fossil fuels is nonsense,
at
least until a drastic reduction of the World’s population has taken place.
Danish Energy Production 2000-2017
The total Danish energy production rose from 36845 MW (1162 PJ) in the year
2000 to 41603 MW (1316 PJ) in 2005 and fell to 20879 MW (660 PJ) in 2017.
In 2017 wind + solar power yielded on average 1847 MW corresponding to 8,2 % of
our gross energy consumption.
Danish Consumption of Energy 2000-2017
It is remarkable, that the net energy consumption is practically constant (table 6),
whereas the loss in the transformation sector has decreased from 18% to 10% of
the total energy consumption. It should be observed too that the population has
increased by 6% in the period.
Imported biomass including imported garbage is the largest single contributor to
the Danish green energy. How sustainable this is is for the reader to wonder.
Sustainable Energy
Contrary to what most people seem to think
wind power so far isn’t the dominant
part of the “sustainable” energy.
The
“sustainable”
energy has grown from 12 to
37% of the gross energy consumption in the period from 2000 to 2017. (The wind
power fell from 1687 MW in 2017 to 1587 MW in 2018).
Domestically produced biomass and heat pumps yielded 9,6% in 2000 and 18,2%
in 2017.
According to “Energistyrelsen”
the potential for Danish bioenergy is 162 PJ/Year
corresponding to 5100 MW so there remains 1300 MW to be used.
Far from
enough.
Søren Kjærsgård, July , 2019
4 of 111
2018. Danish and European Energy 2018
KEF, Alm.del - 2018-19 (2. samling) - Bilag 88: Henvendelse af 20/9-19 fra Søren Kjærsgård, Grenaa, om synspunkter fra 'Danish and European Energy 2018'
Increasing Wind Power, Increasing Import and declining
Electricity consumption
It is generally accepted, that a fossil free society presupposes a very much increased
use of electricity.
It seems, however, that Denmark is moving in the wrong direction. We import much
more electricity today than 18 years ago, and the consumption falls.
How do we get our electricity
It is generally accepted that a fossile free society means much more electric power
produced from lasting resources like solar, wind and hydropower. The wind and
even the solar power have increased from 2000-2018, and so has the population
(by 6,5%). Wind power is even told to be cheap. Why is it then that the electricity
consumption has fallen by 2% and the import, which was close to zero 18 years
ago in 2017 and 2018 was 13 % and 15 % of the consumption?
Thermal Electricity Production
The average production from thermal power stations was 1607 MW in 2015, and
the maximal production was 4922 MW. So the capacity is exploited only by about
30%. It must be justified to ask who should pay for this back up capacity. The
wind power has a privileged access to the market and
the wind power can’t
function without back up, then the cost for the back up must be added to the price
for wind power,
Danish Wind Energy 2012-18
In 2018 the wind power amounted to
7,1%
of the Danish energy consumption.
However this is not quite true, because a lot of the wind power must be exported
when it blows.
According to the author’s calculations
he wind power share of the
Danish energy is then reduced to
5,9%.
On and Off Shore Wind Denmark East and West 2018
Off shore wind power is nearly just as variable as on shore wind power, and often
comes very close to zero. Thus off shore wind needs just as much back up as on
shore wind.
Off shore wind parks
The age, number of turbines, capacities, production for each of the 6 off shore
parks in East Denmark and the 8 parks in West are shown in table 20 and 21. The
author suspects that the efficiency is declining with time but has not been able
prove it.
Variation Wind Power 2018
The graphs 44-47 below illustrate the wind power variation from hour to hour.
Søren Kjærsgård, July , 2019
5 of 111
2018. Danish and European Energy 2018
KEF, Alm.del - 2018-19 (2. samling) - Bilag 88: Henvendelse af 20/9-19 fra Søren Kjærsgård, Grenaa, om synspunkter fra 'Danish and European Energy 2018'
It must be admitted, that there is an - although unclear - pattern in the variations
form month to month (Table 22 and figure 48). Anyway it seems that you can’t rely
on a car powered by wind power for your summer holiday tour to Italy.
Wind Power and Load
It should be observed that we import up to 88 % of the load and export up to 83%
of the load. These high figures are caused by the large amount of wind power in
the Danish system, and are surely a special case. Other countries are not so lucky
that they can draw on the abundant water power from their neighbours.
Useful Wind Power
The wind power was on average 1586 MW in 2018 and the load 3900 MW, so a
rough calculation indicate that
40,8% of our electricity
is supplied by wind
power. After correction for export and the fact that the wind power is sometimes
higher than the load, the figure is reduced to
34% of the average load.
Wind Power and Exchange.
There is a clear relation between wind power and export. When the wind power
surpasses 2500 MW we begin to export wind power. By a wind effect of 3000 MW
about 16% of the wind power is exported and by 5000 MW 40%. You may wonder
what will happen when the wind power according to plans will increase to on
average 7000 MW and maximum 17000 MW.
Power Exchange with Norway, Sweden and Germany
There is a clear correlation between the wind power and the exchange with Norway
and Sweden and only a very weak correlation between the wind power and the
exchange with Germany. That is no wonder. Germany has plenty of wind power
and there is a high degree of simultaneousness between the wind in Denmark and
in Germany.
Wind and Solar Power in Denmark, Germany, Norway and Sweden
Generally
speaking neighbours can’t assist each other to secure a stable
supply of
wind and solar power, because the wind follows the same pattern over very large
distances. The sun of course too.
Expanding and Storing off Shore Wind
The political system talks about adding 12000 MW to the present abt. 1700 MW of
off shore capacity. This will result in a wind power with an average effect about
7000 MW varying between approximately zero and 17000 MW, whereas the
average Danish load was 3900 MW in 2018.
We have been presented for numerous ideas about storing superfluous wind
power. But for very good reasons we never see a calculation of the costs.
Søren Kjærsgård, July , 2019
6 of 111
2018. Danish and European Energy 2018
KEF, Alm.del - 2018-19 (2. samling) - Bilag 88: Henvendelse af 20/9-19 fra Søren Kjærsgård, Grenaa, om synspunkter fra 'Danish and European Energy 2018'
North Sea Cable. Viking Link
Justification for the Viking Link.
The author has seen reports assuming that there in the future will be a price
difference for electricity between Denmark and the UK and that these assumed
differences in a distant future could make the Viking Link profitable.
The author has chosen another assumptions reasoning:
When the wind power in a country is higher than a constant times the average
wind power, export might be interesting, and import might be interesting if the
wind power is less than the constant times the average wind power.
The Viking Link will have a transfer capacity of 1400 MW. No matter which wind
power level is chosen for import/export
we can’t
get higher than an average
transfer of about 20% of the capacity. The Viking Link seems to be a
Waste of
Money.
Die Energiewende
Germany has during the last 10 years expanded her wind and solar power
dramatically, so that wind and solar power in 2018 accounted for 29,5% of the
electric load. However that is only partly true. It seems that Germany must export
on average about a third of her wind and solar power. At very low and often
negative prices, and mainly to Poland and Holland, which should not surprise
anybody since Holland and Poland have a wind power share in their electricity
supply of only 9,4% and 7,2% respectively.
The Poles and the Dutch get a good
laugh.
It always blows and the sun shines somewhere
Alas, that is not true.
The author has compared the wind power in Belgium,
Germany, Spain, France, UK and the Netherlands based on hourly registrations of
the wind power in each of the six mentioned countries.
Wind + Solar Power % of load in Belgium, Germany, France, Spain,
UK and the Netherlands
The proportion of wind and solar power in these countries varies between 3% and
43% with an average of 19%. The demand for back up decreases not very much by
adding wind and solar power in this huge area.
Some Data from Belgium, Germany, Spain, France, United
Kingdom and The Netherlands
It is remarkable that Germany in spite of
Die Energiewende
and in spite of the
highest proportion of wind and solar energy in the energy consumption has both
the highest carbon dioxide emission per produced unit of energy (kWyear) and per
capita. France has the highest share of nuclear power in her energy supply, 14,5 %
and by far the lowest carbon dioxide emission both per capita and per consumed
kWyear.
Søren Kjærsgård, July , 2019
7 of 111
2018. Danish and European Energy 2018
KEF, Alm.del - 2018-19 (2. samling) - Bilag 88: Henvendelse af 20/9-19 fra Søren Kjærsgård, Grenaa, om synspunkter fra 'Danish and European Energy 2018'
Storing of Green Energy
It is evident that the most severe limitation for usage of wind and solar power is
their instability and that this limits their usefulness until a storage method has
been found.
If the present production of wind and solar power in Germany + France + Spain +
Belgium + Great Britain + The Netherlands should be kept stable you can calculate
a storage need of 18 TWh. Corresponding to 180 million Tesla Batteries or 3600
pumped storage
units at the same capacity as Europe’s largest pumped storage
system, Vianden in Luxembourg with a storage capacity of 5 GW.
To support an
energy system delivering 2,3% of the total energy in the mentioned
countries.
Wind and Nuclear Power.
Most politicians, journalists and a large majority among common people seem to
believe that nuclear power is prohibitively expensive.
Vattenfall informs that the cost for the latest Danish of shore wind power park
Horns rev 3 commissioned by the end of 2018 was 9 billion DKK and that the
production is expected to be on average 194 MW. I.e.
46 million DKK/MW
capacity.
“Ingeniören”
informed us on April 15, 2019 that the still not commissioned Finnish
Reactor Oulkiluoto 3 will cost 41 billion DKK and on average deliver 1484 MW. I.e.
27 mio DKK/MW capacity.
The operational costs for off shore wind power can impossibly be lower than
for nuclear power. So nuclear power even from a new and still unpaid reactor
is inevitably much cheaper than off shore wind power, and it is reliable,
which means that we will not have to build still not invented storage systems
with low efficiency and at an unpayable price
Danish plans and Swedish nuclear power.
Swedish nuclear power is reliable, Wind power is not. Danish wind power plans
will give us much more wind power than we could possibly use before huge and
unknown investments have been made.
The author finds it completely impossible to understand that the wind power
lobby has been able to sell the idea of building a huge off shore wind capacity
without having presented any sensible idea of how to use this wind power.
Søren Kjærsgård, July , 2019
8 of 111
2018. Danish and European Energy 2018
KEF, Alm.del - 2018-19 (2. samling) - Bilag 88: Henvendelse af 20/9-19 fra Søren Kjærsgård, Grenaa, om synspunkter fra 'Danish and European Energy 2018'
2079937_0009.png
Conclusion.
We will give the word to the Swedish chancellor Axel Oxenstierne whose son
worried if he was qualified to be Sweden´s chief negotiator at the “Westphalian
Peace” in 1648:
“My son, if you knew with how little wisdom the World is governed.”
Fore word
The author:
Chemical Engineer, M.Sc. , Sören Kjärsgaard
Ludvig Holbergsvej 16, DK 8500 Grenaa
Telf. +0045 2015 4496// +0045 8632 0760. Mail: [email protected]
is retired since more than 10 years and has neither any obligations to anybody nor
any economic interests in energy production or distribution, so the views
expressed in this report are fully his own.
The author was production manager in an energy intensive chemical plant when
Denmark as the first country in the World introduced a carbon dioxide tax in
January 1992. The author was asked to be responsible for handling the problems
this tax would give.
The one overwhelming problem was, that after a couple of years it became evident,
that the production could not be kept in Denmark because of the steadily
increasing energy taxes.
Therefore the production was transferred to Asia where the energy consumption
per produced ton surely was higher than in Denmark.
Thus the carbon dioxide
tax was counterproductive and a lie.
In 2008 the prime minister Anders Fogh Rasmussen promised us a “Fossil free
Denmark in 2050.”
This nonsense is now generally adopted as Denmark’s energy policy. So you may
wonder why the politicians and the rest of the talking establishment are so fond of
the term of abuse,
populism,
when talking about persons who do not agree with
them.
Søren Kjærsgård, July , 2019
9 of 111
2018. Danish and European Energy 2018
KEF, Alm.del - 2018-19 (2. samling) - Bilag 88: Henvendelse af 20/9-19 fra Søren Kjærsgård, Grenaa, om synspunkter fra 'Danish and European Energy 2018'
Numbers.
Decimal division is indicated by a , and not a .
The . (point) is used to separate large numbers thus making them more readable.
Example: 1 million is written as
1.000.000
and a quarter as
0,25.
Units.
Generally there exists a severe confusion about
Energy
and
Effect.
Energy is measured in J(oule)
and
Effect in joule per a unit of time.
If the time
is a second the unit is named
W(att)
which is defined as
joule/second.
Most statistics indicate a country’s energy consumption as
PJ/year, (10^15
Joule/year).
1 PJ
roughly corresponds to
25.000 tons of oil
and a
TJ
to
25 tons oil.
PJ
is an
Energy unit. PJ/Year
is
energy/time
i.e. an
Effect unit,
like
Watt.
So
you can divide
PJ/year
with the
number of seconds per year
(31.536.000 in a
normal year and 31.622.400 in a leap year) to obtain the Consumption in
Watt.
The author prefers to use this unit where possible, because electric effect and
capacity always is expressed in watt.
(The wind power industry generally prefers to express the production in MWh or
GWh per year, to hide the discrepancy between nominal capacity and production.)
Prefixes
Kilo
Mega
Giga
Tera
Peta
Exa
k
M
G
T
P
E
1000
1.000.000
1.000.000.000
1.000.000.000.000
1.000.000.000.000.000
1.000.000.000.000.000.000
10^3
10^6
10^9
10^12
10^15
10^18
Søren Kjærsgård, July , 2019
10 of 111
2018. Danish and European Energy 2018
KEF, Alm.del - 2018-19 (2. samling) - Bilag 88: Henvendelse af 20/9-19 fra Søren Kjærsgård, Grenaa, om synspunkter fra 'Danish and European Energy 2018'
World Energy and Population
Summary
The
World’s population
is increasing steadily, in the years 2006-2017 from 6600
million to 7550 million i.e. ca. 80 million per year and the growth rate seems to be
i
surprisingly constant.
The energy or effect consumption is increasing steadily too, from 14,9 TW in 2006
to 17,9 TW in 2017, an increase of 3042 GW or 254 GW/year. For comparison the
ii
Danish effect consumption was 22 GW in 2017
.
So the increase in the World’s energy consumption per year is about 11 times the
Danish consumption.
Wind + Solar power grew from 16 GW in 2006 to 179 GW in 2017. A growth rate of
about 14 GW/year, which should be compared with a growth rate for the World
effect consumption of about 250 GW/year!
In 2006 oil, coal and gas supplied 90,5 % of the Worlds energy consumption, in
2017 the figure was 88,5 %.
It should be evident, that the idea of a World without fossil fuels is nonsense,
at least until a drastic reduction of the World’s population has taken place.
The sources for this section are UN.s population statistics and BP.s yearly energy
statistics.
Søren Kjærsgård, July , 2019
11 of 111
2018. Danish and European Energy 2018
KEF, Alm.del - 2018-19 (2. samling) - Bilag 88: Henvendelse af 20/9-19 fra Søren Kjærsgård, Grenaa, om synspunkter fra 'Danish and European Energy 2018'
2079937_0012.png
Tabel 1
Source: BP 2017
Total World
Oil+coal+naural gas
Nuclear
Hydro
Solar
Wind
Geotermal, Biomass, Other
Biofuels
Sum
Wind+solar
Sum Non fossile
Increase fossile
Increase Wind +Solar
Total World increase
Energy influx
2006
2007
14.896 15.385
13.021 13.493
320
314
910
925
1
1
15
19
82
88
37
50
14.385 14.890
16
20
1.365
1.397
472
5
489
470
485
World Energy Consumption 2006-2017
2008
2009
2010
2011
2012
2013
2014
2015
2016
2017
GW
15.542 15.334 16.090 16.482 16.668 17.032 17.198 17.339 17.554 17.938
13.580 13.355 14.000 14.362 14.511 14.768 14.842 14.907 15.010 15.280
312
308
316
303
281
284
290
294
297
301
978
977
1.032
1.052
1.100
1.141
1.168
1.169
1.209
1.220
1
2
4
7
11
16
23
30
37
51
25
31
39
50
60
74
81
95
109
128
94
102
114
119
129
139
152
162
167
176
66
74
85
87
89
96
106
106
108
112
15.056 14.850 15.590 15.981 16.181 16.518 16.661 16.762 16.938 17.267
27
34
43
57
71
90
104
125
147
179
1.477
1.495
1.589
1.619
1.670
1.750
1.820
1.855
1.928
1.987
87
-225
645
362
149
257
74
65
103
270
6
7
9
14
14
18
14
21
22
32
157
-208
756
392
186
365
166
141
215
384
EJ
491
484
507
520
527
537
542
547
555
566
It is observed, that the consumption is increasing steadily by about 260 GW/year, and that Wind and Solar increased
with 31 GW/year in 2017.
It is observed too, that there is a slight discrepancy between the sum for the total world in the first line of the table and
the sum for the singles fuels. The most of this difference is due to the fact, that the energy from nuclear power is
calculated in two different ways. 1. The heat developed in the reactors is part
of the “Total World, whereas in the line
“Nuclear Power” contains the output of electricity only. I.e. ca. 38% of the energy developed by the nuclear reactors.
BP’s statistic give the energy consumptions in different units for each type of energy, and
the author has chosen to
transform all these units to watts i.e Joule/second.
Søren Kjærsgård, July , 2019
12 of 111
2018. Danish and European Energy 2018
KEF, Alm.del - 2018-19 (2. samling) - Bilag 88: Henvendelse af 20/9-19 fra Søren Kjærsgård, Grenaa, om synspunkter fra 'Danish and European Energy 2018'
2079937_0013.png
Tabel 2
Population
Oil+coal+naural gas
Nuclear
Hydro
Solar
Vind
Geotermal, Biomass, Other
Biofuels
Total World Population
Mio
Increase per year
Mio
Consumption per capita kW
Pop Growth* kW/capita GW
2006
90,51
2,22
6,33
0,00
0,11
0,57
0,26
6600
2,26
World Energy Consumption and population 2006-2017
2007
2008
2009
2010
2011
2012
2013
% of World Energy Consumption
90,62 90,19 89,93 89,80 89,87 89,68 89,40
2,11
2,07
2,07
2,03
1,89
1,74
1,72
6,21
6,49
6,58
6,62
6,59
6,80
6,91
0,01
0,01
0,02
0,02
0,05
0,07
0,10
0,13
0,17
0,21
0,25
0,31
0,37
0,45
0,59
0,63
0,68
0,73
0,75
0,80
0,84
0,33
0,44
0,50
0,54
0,55
0,55
0,58
6682
6764
6846
6930
7013
7098
7182
81
82
83
83
84
84
84
2,30
2,30
2,24
2,32
2,35
2,35
2,37
187
189
185
193
197
197
200
2014
89,08
1,74
7,01
0,14
0,49
0,91
0,64
7266
84
2,37
199
2015
88,93
1,75
6,97
0,18
0,57
0,96
0,63
7349
84
2,36
197
2016
88,62
1,76
7,14
0,22
0,64
0,99
0,64
7467
117
2,35
276
2017
88,49
1,74
7,06
0,29
0,74
1,02
0,65
7550
83
2,38
198
The consumption per capita is surprisingly constant 2,35 - 2,38 kW, but by a population growth of about 85-90 million
per year the growth in the global energy consumption is about 250 -300 GW/year.
Wind and Solar increased with 32 GW/year in 2017.
However, it may be argued that 1 kW of wind or solar effect replaces about 1/0,38 = 2,6 kW fossil fuel, so you may say
that the yearly increase in wind and solar power replaces about 2,6*32 = 83 GW of fossil effect.
Still only about a
third of the increase in the World’s effect consumption.
Søren Kjærsgård, July , 2019
13 of 111
2018. Danish and European Energy 2018
KEF, Alm.del - 2018-19 (2. samling) - Bilag 88: Henvendelse af 20/9-19 fra Søren Kjærsgård, Grenaa, om synspunkter fra 'Danish and European Energy 2018'
2079937_0014.png
Figure 1
18.000
17.000
16.000
Growth World Population and Energy Consumption,
GW, 2006-2017
7600
7400
7200
Mio
GW
15.000
7000
6800
14.000
13.000
2006
6600
6400
2008
2010
2012
2014
2016
Year
Total World
Total World Population Mio
Oil+coal+naural gas
Figure 13 above illustrates the growth in population and energy consumption.
The World’s population is growing steadily by about 85 million per year.
The consumption of energy is growing steadily too14.900 GW in 2006 to nearly
17.900 GW in 2017 i.e. by 250 GW/year.
The consumption of fossil fuel is growing a little slower, by 2300 GW in the same
period. But it is still growing considerably. On average 188 GW/year.
A fossil free World seems to be very far away.
Søren Kjærsgård, July , 2019
14 of 111
2018. Danish and European Energy 2018
KEF, Alm.del - 2018-19 (2. samling) - Bilag 88: Henvendelse af 20/9-19 fra Søren Kjærsgård, Grenaa, om synspunkter fra 'Danish and European Energy 2018'
2079937_0015.png
Figure 2
World Energy Consumption, 14.900 GW in 2006
320
1
15
82
37
Oil+coal+naural gas
Nuclear
Hydro
Solar
Wind
13.021
Geotermal,
Biomass, Other
Biofuels
910
Figure 3
51
World Energy Consumption, 17.900 GW in 2017
301
1.220
128 176
112
Oil+coal+naural gas
Nuclear
Hydro
Solar
Wind
15.280
Geotermal,
Biomass, Other
Biofuels
Figure 14 and 15 above illustrate the World Energy Consumption in 2006 and
2017. There has been a considerable increase in the consumption of fossil energy.
2259 GW. This could also be expressed: In 2017 the World consumes nearly 1,7
billion tons oil equivalents of fossil fuel more than in 2006 . (1 GW = 0,75 mio tons
of oil equivalent per year)
Søren Kjærsgård, July , 2019
15 of 111
2018. Danish and European Energy 2018
KEF, Alm.del - 2018-19 (2. samling) - Bilag 88: Henvendelse af 20/9-19 fra Søren Kjærsgård, Grenaa, om synspunkter fra 'Danish and European Energy 2018'
2079937_0016.png
Figure 4
Non fossile energy % of total 2006
0,11
0,00
0,57 0,26
2,22
Nuclear
Hydro
Solar
Vind
Geotermal, Biomass, Other
6,33
Biofuels
Figure 5
Non fossile energy % of total 2017
0,65
1,02
1,74
Nuclear
Hydro
Solar
Vind
Geotermal, Biomass, Other
0,29
0,74
7,06
Biofuels
Figure 16 and 17 illustrate the increasing role of non fossil energy. Wind+solar
supply only a little more than 1%,
of the World’s energy supply.
Søren Kjærsgård, July , 2019
16 of 111
2018. Danish and European Energy 2018
KEF, Alm.del - 2018-19 (2. samling) - Bilag 88: Henvendelse af 20/9-19 fra Søren Kjærsgård, Grenaa, om synspunkter fra 'Danish and European Energy 2018'
2079937_0017.png
Figure 6
World Energy Consumption, %, different sources
2006-2017
100
99
98
97
96
95
94
93
92
Biofuels
Geotermal, Biomass,
Other
Vind
Solar
Hydro
91
90
89
88
87
86
85
2006 2007 2008 2009 2010 2011 2012 2013 2014 2015 2016 2017
Nuclear
Oil+coal+naural gas
Søren Kjærsgård, July , 2019
17 of 111
2018. Danish and European Energy 2018
KEF, Alm.del - 2018-19 (2. samling) - Bilag 88: Henvendelse af 20/9-19 fra Søren Kjærsgård, Grenaa, om synspunkter fra 'Danish and European Energy 2018'
2079937_0018.png
Figure 7
World Energy consumption, GW, 2006-2017
16.000
14.362 14.511
15.010
14.768 14.842 14.907
15.280
14.000
14.000
13.021
12.000
13.493 13.580 13.355
10.000
8.000
6.000
4.000
1.989 2.059
2.167 2.279
2.000
1.391
42
1.430
54
2007
1.520 1.551 1.659
1.713
1.786
1.897
70
2008
89
2009
113
2010
151
2011
187
2012
236
2013
273
2014
328
2015
386
2016
470
2017
0
2006
Year
Oil+coal+naural gas
Sum Non fossile
Wind+solar
Figure 7 illustrates the distribution of energy types in another way. It must be
admitted, that the alternative energy is an increasing part of the energy
consumption. But the progress is slow, and it can’t keep pace with the increase in
demand.
Søren Kjærsgård, July , 2019
18 of 111
2018. Danish and European Energy 2018
KEF, Alm.del - 2018-19 (2. samling) - Bilag 88: Henvendelse af 20/9-19 fra Søren Kjærsgård, Grenaa, om synspunkter fra 'Danish and European Energy 2018'
Danish Energy Production 2000-2017
iii
Summary
The total Danish energy production rose from
36845 MW
(1162 PJ) in the year
2000 to
41603 MW
(1316 PJ) in 2005 and fell to
20879 MW
(660 PJ) in 2017.
The production in 2000 corresponded to 151% of the consumption, 167 % of the
consumption in 2005 and only 93 % of the consumption in 2017.
However, this is still a high degree of self-sufficiency which in Western Europe is
only surpassed by Norway. And with the planned investments in the North Sea oil
and gas fields we will probably regain more than 100 % self-sufficiency.
This presupposes of course that the political system realizes that our energy
demand can’t be covered by wind power.
In 2017 wind + solar power yielded on average 1847 MW corresponding to 8,2 % of
our gross energy consumption.
It is planned to build 12 GW new off shore wind power capacity so we can expect
an average wind power of about 7 GW (table 27) corresponding to a little more than
25% of the Danish energy demand. It should be remarked too that the average
Danish electricity load was only 3900 MW in 2018. However, most people seem to
have forgotten that the output will vary uncontrollably between zero and 17 GW.
So unless we can obtain a very good
and unlikely
cooperation with the
Norwegian hydro system, or which is absolutely unlikely invent and build new
storage systems for electricity we will in the foreseeable future still be dependant of
fossil energy.
Søren Kjærsgård, July , 2019
19 of 111
2018. Danish and European Energy 2018
KEF, Alm.del - 2018-19 (2. samling) - Bilag 88: Henvendelse af 20/9-19 fra Søren Kjærsgård, Grenaa, om synspunkter fra 'Danish and European Energy 2018'
2079937_0020.png
Tabel 3
Danish Energy Productio, MW, 2000- 2017, Detailed
MW
Crude Oil
Waste Oil
Natural Gas
Solar
Wind
Hydro
Geothermal
Straw
Wood Chips
Firewood
Wood Pellets
Wood Waste
Biogas, Landfill
Biogas, Sludge
Biogas, Other
Wastes, Non-
renewable
Wastes,
Renewable
Bioethanol
Biodiesel
Biooil
Heat Pumps
SUM MW
Sum PJ
2000
24177
19
9813
11
483
3
2
386
87
393
94
218
19
27
46
432
529
0
0
2
104
36845
1162
2001
23025
22
10076
11
492
3,2
2,3
434
101
420
97
213
18
27
52
460
562
0
0
6
107
36128
1142
2002
24738
22
10094
11
557
3,6
2,7
496
119
413
93
191
20
27
59
483
591
0
0
4
108
38033
1199
2003
24738
13
9562
12
635
2,4
2,6
535
201
471
98
200
14
28
72
522
638
0
0
13
109
37868
1194
2004
26193
9
11243
12
749
3
3
567
220
495
104
202
19
26
73
530
648
0
0
21
110
41228
1300
2005
25248
10
12458
13
755
2,6
5,5
586
193
560
103
206
17
29
75
539
659
0
0
24
118
41603
1316
2006
22960
12
12378
14
697
2,7
9,1
588
215
603
74
220
10
28
87
548
670
0
0
36
132
39283
1239
2007
20683
5
10976
15
819
3,2
9,1
595
229
793
78
242
10
27
87
567
693
0
0
38
141
36011
1136
2008
19085
2
11939
16
789
3
8
501
260
760
76
231
9
27
89
591
722
0
0
57
153
35318
1114
2009
17593
1
9988
19
767
2,2
7,7
550
311
731
77
219
8
27
98
561
686
0
0
51
166
31865
1008
2010
16576
1
9748
21
891
2,4
6,7
740
360
754
76
270
10
27
101
544
665
0
0
62
179
31033
979
2011
14918
1
7819
25
1116
1,9
5,3
641
362
649
77
248
7
26
97
548
670
0
0
25
192
27428
865
2012
13571
1
6831
40
1169
2
9
579
393
622
55
221
6
29
104
507
620
0
0
30
205
24993
788
2013
11839
1
5685
92
1270
1,5
7,3
644
341
623
58
228
7
30
109
498
609
0
0
28
219
22289
705
2014
11087
0
5494
109
1493
1,7
5,3
589
359
567
61
224
5
33
138
503
615
0
0
23
230
21537
679
2015
10485
2
5502
118
1613
2,1
4,4
627
468
696
85
354
6
29
165
497
607
0
0
20
254
21532
679
2016
9416
1
5368
147
1455
2
7
622
541
711
89
270
6
33
247
488
596
0
0
9
280
20287
640
2017
9186
1
5776
160
1687
2,0
4,8
641
616
713
89
227
6
35
313
508
621
0
0
6,0
288
20879
660
Søren Kjærsgård, July , 2019
20 of 111
2018. Danish and European Energy 2018
KEF, Alm.del - 2018-19 (2. samling) - Bilag 88: Henvendelse af 20/9-19 fra Søren Kjærsgård, Grenaa, om synspunkter fra 'Danish and European Energy 2018'
2079937_0021.png
Tabel 4
Danish Energy Production, MW, 2000-2017
Year
2000 2001 2002 2003 2004 2005 2006 2007 2008 2009 2010 2011 2012 2013 2014 2015 2016 2017
Sum Fossile
34009 33123 34854 34314 37445 37715 35349 31664 31027 27583 26325 22738 20403 17525 16581 15989 14784 14962
Solar
11
11
11
12
12
13
14
15
16
19
21
25
40
92
109
118
147
160
Wind
483
492
557
635
749
755
697
819
789
767
891 1116 1169 1270 1493 1613 1455 1687
Hydro
3,4
3,2
3,6
2,4
3,0
2,6
2,7
3,2
2,9
2,2
2,4
1,9
2,0
1,5
1,7
2,1
2,2
2,0
Geothermal
2
2
3
3
3
5
9
9
8
8
7
5
9
7
5
4
7
5
Bio+ Heat
2338 2497 2605 2902 3016 3111 3211 3501 3475 3486 3786 3542 3370 3394 3347 3806 3892 4063
Pumps
Sum
36845 36128 38033 37868 41228 41603 39283 36011 35318 31865 31033 27428 24993 22289 21537 21532 20287 20879
Sum Non
2836 3004 3179 3554 3783 3887 3934 4347 4291 4282 4707 4690 4590 4764 4956 5544 5503 5917
Fossile
It can easily be seen from fig. 8 and fig. 9 here under that the increase in non fossil production is far less than the decrease in
oil and gas production. It is remarkable too that the increase in wind power has only been about 1200 MW whereas the
increase in other non fossile energy has been about 1700 MW from 2000-2017.
Søren Kjærsgård, July , 2019
21 of 111
2018. Danish and European Energy 2018
KEF, Alm.del - 2018-19 (2. samling) - Bilag 88: Henvendelse af 20/9-19 fra Søren Kjærsgård, Grenaa, om synspunkter fra 'Danish and European Energy 2018'
2079937_0022.png
Figure 8
Danish Energy Production, MW, 2000-2017
45000
40000
35000
30000
25000
20000
15000
10000
5000
0
2000
2005
Sum Fossile
Sum
2010
Sum Non Fossile
2015
Figure 9
Dansk non fossile Energy Production, MW, 2000-2017
6000
5000
4000
3000
2000
1000
0
2000
Wind
2005
Sum Non Fossile
2010
Bio+ Heat Pumps
2015
Søren Kjærsgård, July , 2019
22 of 111
2018. Danish and European Energy 2018
KEF, Alm.del - 2018-19 (2. samling) - Bilag 88: Henvendelse af 20/9-19 fra Søren Kjærsgård, Grenaa, om synspunkter fra 'Danish and European Energy 2018'
2079937_0023.png
Production versus consumption
Tabel 5
Year
Gros Domestic
Consumption
Net Domestic Consumption
Energy production % of
gross domestic
consumption
Year
Gros Domestic
Consumption
Net Domestic Consumption
Energy production % of
gross domestic
consumption
Figure 10
Domestic Energy consumption and % self supply
2000 2001 2002 2003 2004 2005
2006
2007
2008
24462 25168 24826 26179 25287 24860 26651 25860 25064
20003 20507 20019 20393 20660 20879 21100 21116 20773
151
2009
144
2010
153
2011
145
2012
163
2013
167
2014
147
2015
139
2016
141
2017
24248 25382 23636 22567 22875 21666 21606 22349 22373
19891 20921 20002 19557 19433 18718 19352 19769 20061
131
122
116
111
97
99
100
91
93
170
160
150
140
130
120
110
100
90
80
Domestic energy supply versus gros consumption, %, Denmark
2000-2017
2000
2002
2004
2006
2008
2010
2012
2014
2016
Hardly any other European country, except Norway and Russia, enjoys such a
high degree of energy self supply. The production is 20,9 GW and the gross
consumption is 22,4 GW. So if we were smart enough to by the two 900-1000 MW
nuclear reactors at Ringhals that the Swedes plan to shut down no energy crisis
could harm us.
Søren Kjærsgård, July , 2019
23 of 111
2018. Danish and European Energy 2018
KEF, Alm.del - 2018-19 (2. samling) - Bilag 88: Henvendelse af 20/9-19 fra Søren Kjærsgård, Grenaa, om synspunkter fra 'Danish and European Energy 2018'
2079937_0024.png
Figure 11
Figure 12
9,6
Danish Energy Production % of
Gross Consumption 2000,
Totally 151 %
Danish Energy Production % of
gross Consumption 2017
Totally 93 %
2,0
Sum Fossile
18,2
8,3
66,9
Sum Fossile
139,0
Solar, Wind,
Hydro,
Geothermal
Bio+ Heat
Pumps
Solar, Wind,
Hydro,
Geothermal
Bio+ Heat
Pumps
Denmark imports electricity and biomass and exports fossil fuels.
Figure 13
Danish Production of "Green Energy" and imported Biomass, % of gross
Consumption
20
15
10
5
0
2000 2001 2002 2003 2004 2005 2006 2007 2008 2009 2010 2011 2012 2013 2014 2015 2016 2017
Solar, Wind, Hydro, Geothermal
Bio+ Heat Pumps
Sum Imported Bimass
It must be justified to wonder how Denmark should
be “fossil free” in 31 years.
There is not much more domestic biofuel to exploit and no more hydro power so
wind and solar must be extended by a factor about 10 unless we can count on
forests around the World.
By the way Danish Wind and Solar Power varied between 11 MW and 5168 MW
with an average of 1702 MW in 2018. So there is a not quite small energy storage
task to perform too.
Søren Kjærsgård, July , 2019
24 of 111
2018. Danish and European Energy 2018
KEF, Alm.del - 2018-19 (2. samling) - Bilag 88: Henvendelse af 20/9-19 fra Søren Kjærsgård, Grenaa, om synspunkter fra 'Danish and European Energy 2018'
Danish Consumption of Energy 2000-2017
Summary
It is remarkable, that the net energy consumption is practically constant (table 6),
whereas the loss in the transformation sector has decreased from 18% to 10% of
the total energy consumption. (Figure 14)
It should be observed too that the population has increased by 6% in the period.
(Table 7 and Figure 15)
Imported biomass including imported garbage is the largest single contributor to
the Danish green energy. How sustainable this is is for the reader to wonder.
(Table 11 and Fig 16)
Transport
(Table 8 and Figure 18). In 2000 the consumption was 6,3 GW and in
2017 it was 6,9 GW. An increase of 558 MW or an increase of 8,3%. Only slightly
more than the increase in the population. The aviation increased by 239 MW, and
the road transport by 325 MW.
Production
(Table 9 and Figure 19) In 2000 the consumption was 5,2 GW and in
2017 it was 4,1 GW. A reduction of 1112 MW or 21%.
The most remarkable
figures are the consumption for Agriculture, Forestry and Horticulture
which fell from 985 to 823 MW or by 16% by an increasing production. The
823 MW corresponds to 3,7% of the gross energy consumption in 2017.
It should be noted too, that agriculture and forestry delivers 2599 MW
“green energy” back in the form of wood, straw and biogas. (Table 3)
However, it is a well known fact that the talking classes despise production and
hate the famers, so they have invented the idea, that the gas produced by
animals should be taken into account, although the only carbon slipping out
from a cow or pig is the carbon in their food, which is taken out from the
atmosphere by the plants eaten by cows and pigs.
The manufacturing industry
has reduced its’ energy usage
from 3,68 GW to
2,89 GW or by 794 MW. The author is living in the small community Grenaa,
which in the last 20 years has lost about 1000 work places in the energy
intensive industry, chemicals, textiles and paper. They have been transferred to
without any doubt less energy efficient countries. The former EU commissar for
The Environment Connie Hedegaard in 2008 wrote a book “When
the Climate
became hot” page 115: “In China you
use 6-7 times as much energy per produced
item as in the USA or the EU.”
So you might think that our energy policy
by heavily taxation to get rid of
energy intensive industries
is counterproductive.
Søren Kjærsgård, July , 2019
25 of 111
2018. Danish and European Energy 2018
KEF, Alm.del - 2018-19 (2. samling) - Bilag 88: Henvendelse af 20/9-19 fra Søren Kjærsgård, Grenaa, om synspunkter fra 'Danish and European Energy 2018'
2079937_0026.png
Trade, Service and Housing.
(Table 10 and Figure 20) The consumption has
risen from 8,3 GW in 2000 to 8,9 GW in 2017, or by 672 MW corresponding to
8,1%, so the consumption per capita, 1,05 kW, is constant.
The author might save maximum 1 kW heat or 8,960 MWh per year by spending
250.000 DKK or 19.000 € for better insulation and new doors and windows.
The energy price without tax should not exceed 500 DKK/MWh. The saving would
be max 9 MWh per year corresponding to 4500 DKK. So it would take 55 years to
get the money back under the condition that you pay no interest for the
investment. And that the investment will need no maintenance.
Figure 14
Gross and net Consumption, MW, Denmark 2000-2017
25 000
20 000
15 000
10 000
5 000
-
2000
The net consump-
tion is the gross
consumption minus
losses
in
power
stations, refineries
and district heating
systems.
2005
Net consumption
Total consumptiomn
2010
2015
Loss Transformation Sector
Figure 15
Net and gros Consumption, kW/person, and population, Denmark 2000- 2017
5,00
4,50
kW/
4,00
person
3,50
3,00
2000
5800
5700
5600
5500
5400
5300
2005
kW Net/Person
2010
kW Gross/Person
2015
Inhabitants t
Inhabitants
Thousand
Søren Kjærsgård, July , 2019
26 of 111
2018. Danish and European Energy 2018
KEF, Alm.del - 2018-19 (2. samling) - Bilag 88: Henvendelse af 20/9-19 fra Søren Kjærsgård, Grenaa, om synspunkter fra 'Danish and European Energy 2018'
2079937_0027.png
Figure 16
Domestic Energy Production and Consumption, MW. Denmark, 2000-2017
45000
40000
35000
30000
25000
20000
15000
10000
5000
0
2000
2002
2004
2006
2008
2010
2012
2014
2016
Solar
Hydro
Wind
Geothermal
Sum Fossilt
Bio+ varmepumper
Søren Kjærsgård, July , 2019
27 of 111
2018. Danish and European Energy 2018
KEF, Alm.del - 2018-19 (2. samling) - Bilag 88: Henvendelse af 20/9-19 fra Søren Kjærsgård, Grenaa, om synspunkter fra 'Danish and European Energy 2018'
2079937_0028.png
Usage of Energy
Tabel 6
Consumption after Usages, MW
Year
2000 2001 2002 2003 2004 2005 2006 2007 2008 2009 2010 2011 2012 2013 2014 2015 2016 2017
White Spirit,
Lubricants,
399
354
357
369
408
383
387
411
349
333
350
392
364
369
335
334
332
328
Bitumen
Transport sum
6363 6378 6261 6402 6662 6843 6904 7104 7006 6607 6651 6666 6554 6509 6572 6636 6762 6921
Agriculture,
Fishing,
5209 5310 5048 5043 5026 4990 5101 4935 4776 4293 4430 4367 4113 3969 3835 3943 3997 4097
Forestry,
Manufactoring,
Construction
Trade and
2439 2526 2556 2631 2641 2650 2693 2651 2662 2651 2826 2587 2615 2613 2452 2521 2576 2661
service
Housing
5592 5939 5797 5948 5922 6014 6014 6015 5979 6007 6664 5990 5911 5974 5524 5919 6103 6054
Net
20003 20507 20019 20393 20660 20879 21100 21116 20773 19891 20921 20002 19557 19433 18718 19352 19769 20061
consumption
Loss
Transformation
4460 4661 4807 5786 4627 3981 5552 4744 4291 4357 4461 3633 3009 3442 2948 2254 2580 2312
Sector
Gross
24462 25168 24826 26179 25287 24860 26651 25860 25064 24248 25382 23636 22567 22875 21666 21606 22349 22373
consumption
Transformation
sector delivery
4002 4314 4297 4444 4465 4502 4489 4413 4523 4630 5290 4745 4859 4808 4468 4788 4921 5000
district heating
Søren Kjærsgård, July , 2019
28 of 111
2018. Danish and European Energy 2018
KEF, Alm.del - 2018-19 (2. samling) - Bilag 88: Henvendelse af 20/9-19 fra Søren Kjærsgård, Grenaa, om synspunkter fra 'Danish and European Energy 2018'
2079937_0029.png
Tabel 7
Year
Inhabitants*1000
White Spirit,
Lubricants,
Bitumen
Transport sum
Agriculture, Fishing,
Forestry,
Manufactoring,
Construction
Trade and service
Housing
Net consumption
Loss
Transformation
Sector
Gross
consumptiomn
Transformation
sector delivery
district heating
2000
5341
0,07
1,19
0,98
0,46
1,05
3,74
0,83
4,58
0,75
2001
5358
0,07
1,19
0,99
0,47
1,11
3,83
0,87
4,70
0,81
2002
5373
0,07
1,17
0,94
0,48
1,08
3,73
0,89
4,62
0,80
2003
5387
0,07
1,19
0,94
0,49
1,10
3,79
1,07
4,86
0,83
2004
5403
0,08
1,23
0,93
0,49
1,10
3,82
0,86
4,68
0,83
kW/Inhabitant. Denmark 2000- 2017
2005 2006 2007 2008 2009
5422 5444 5470 5498 5526
0,07
1,26
0,92
0,49
1,11
3,85
0,73
4,59
0,83
0,07
1,27
0,94
0,49
1,10
3,88
1,02
4,90
0,82
0,08
1,30
0,90
0,48
1,10
3,86
0,87
4,73
0,81
0,06
1,27
0,87
0,48
1,09
3,78
0,78
4,56
0,82
0,06
1,20
0,78
0,48
1,09
3,60
0,79
4,39
0,84
2010
5555
0,06
1,20
0,80
0,51
1,20
3,77
0,80
4,57
0,95
2011
5583
0,07
1,19
0,78
0,46
1,07
3,58
0,65
4,23
0,85
2012
5611
0,06
1,17
0,73
0,47
1,05
3,49
0,54
4,02
0,87
2013
5638
0,07
1,15
0,70
0,46
1,06
3,45
0,61
4,06
0,85
2014
5664
0,06
1,16
0,68
0,43
0,98
3,30
0,52
3,83
0,79
2015
5689
0,06
1,17
0,69
0,44
1,04
3,40
0,40
3,80
0,84
2016
5716
0,06
1,18
0,70
0,45
1,07
3,46
0,45
3,91
0,86
2017
5743
0,06
1,21
0,71
0,46
1,05
3,49
0,40
3,90
0,87
Søren Kjærsgård, July , 2019
29 of 111
2018. Danish and European Energy 2018
KEF, Alm.del - 2018-19 (2. samling) - Bilag 88: Henvendelse af 20/9-19 fra Søren Kjærsgård, Grenaa, om synspunkter fra 'Danish and European Energy 2018'
2079937_0030.png
Figure 17
Energy Consumption after Usage, MW, Denmnark 2000-2017
7500
7000
6500
6000
5500
5000
4500
4000
3500
3000
2500
2000
1500
1000
500
0
2000
2002
2004
2006
2008
2010
2012
2014
2016
White Spirit, Lubricants, Bitumen
Transport sum
Agriculture, Fishing, Forestry, Manufactoring, Construction
Trade and service
Housing
Loss Transformation Sector
The most remarkable development is that the loss from the transformation sector
has decreased significantly. The electricity production from thermal power stations
has decreased significantly and thus the internal power consumption in these. The
district heating systems have been improved and more homes are heated by
natural gas.
The energy consumption in manufacturing, agriculture etc. has fallen drastically
(table 6) from 5209 to 4097 MW.
Trade and service shows a small increase, so our civil servants and bureaucrats
and the Chinese and other to whom we have transferred our production of textiles,
paper, chemicals and steel can be satisfied. Housing is nearly constant, but until
now the transport sector has had a slightly increasing energy consumption, so it is
evident that it is a popular target for those who will save the World.
White spirit, lubricants and bitumen demands about 325 MW. 325 MW
corresponds to about 244.000 tons of oil per year.
So the thoughtful reader may
ask how we shall build and maintain our roads when the fossil free Paradise has
come true.
Søren Kjærsgård, July , 2019
30 of 111
2018. Danish and European Energy 2018
KEF, Alm.del - 2018-19 (2. samling) - Bilag 88: Henvendelse af 20/9-19 fra Søren Kjærsgård, Grenaa, om synspunkter fra 'Danish and European Energy 2018'
2079937_0031.png
Consumption Transport
Tabel 8
Year
Sum Military and
Road
Railway
Domestic Sea
Transport
Domestic Aviation
International
Aviation
Sum
Road Transport per
inhabitant MW
Figure 18
2000
4 908
137
217
57
1 044
6 363
878
2001
4 899
130
226
58
1 065
6 378
825
2002
4 908
132
251
47
923
6 261
847
Effect Consumption, Transport, MW, Denmark 2000- 2017
2003 2004 2005 2006 2007 2008 2009 2010 2011
5 015
134
248
47
958
6 402
843
5 177
135
219
39
1 093
6 662
874
5 253
142
255
41
1 152
6 843
873
5 334
140
230
43
1 157
6 904
887
5 528
138
201
51
1 185
7 104
919
5 372
144
257
54
1 180
7 006
898
5 137
144
239
53
1 034
6 607
855
5 159
150
207
57
1 077
6 651
774
5 150
152
202
55
1 107
6 666
860
2012
5 047
150
197
47
1 114
6 554
854
2013
5 008
150
200
46
1 105
6 509
838
2014
5 020
152
159
43
1 197
6 572
909
2015
5 092
152
179
41
1 172
6 636
860
2016
5 105
156
202
42
1 257
6 762
836
2017
5 233
151
197
40
1 300
6 921
864
Effect consumption, Transport, Denmark 2000-2017
8 000
7 000
6 000
5 000
4 000
3 000
2 000
1 000
-
2000
2005
Sum Military and Road
Domestic Sea Transport
2010
2015
Railway
Domestic Aviation
Road transport is the largest factor, so it is evident that
all good people are eager to reduce it. The energy
consumption for road transport has increased by 6%. So
has the population. So if anybody wants to limit our
energy consumption it is recommendable to put limits on
the immigration.
Søren Kjærsgård, July , 2019
31 of 111
2018. Danish and European Energy 2018
KEF, Alm.del - 2018-19 (2. samling) - Bilag 88: Henvendelse af 20/9-19 fra Søren Kjærsgård, Grenaa, om synspunkter fra 'Danish and European Energy 2018'
2079937_0032.png
Consumption Production
Tabel 9
Year
Agriculture, Forestry
and Horticulture
Fishing
Manufacturing
Industry
Construction
Sum
Figure 19
2000
985
299
3684
240
5209
2001
975
283
3798
254
5310
2002
952
283
3560
253
5048
Effect Consumption, Production, MW, Denmark 2000- 2017
2003 2004 2005 2006 2007 2008 2009 2010 2011
941
271
3581
251
5043
921
234
3620
251
5026
916
237
3579
258
4990
958
237
3646
260
5101
920
218
3527
269
4935
952
199
3358
267
4776
950
194
2918
231
4293
967
192
3043
229
4430
920
182
3030
234
4367
2012
894
148
2859
212
4113
2013
893
165
2701
210
3969
2014
850
154
2627
205
3835
2015
860
165
2710
207
3943
2016
855
164
2764
213
3997
2017
823
155
2890
229
4097
Agriculture, Fishing, Industry and Construction, MW,
Denmark 2000-2018
4 000
3 500
3 000
2 500
2 000
1 500
1 000
500
-
2000
Agriculture, forestry and horticulture has
reduced its’ energy
consumption from 985 to
823 MW. A reduction of 16% by increasing
production. So it is evident that the farmers by
the political establishment are considered to
be severe climate sinners.
The
the
The
and
decline in the consumption of energy in
manufacturing industry is considerable.
author is a former production manager
thinks:
”Untergang des Abendlandes.”
2002
2004
2006
2008
2010
2012
2014
2016
Agriculture, Forestry and Horticulture
Manufacturing Industry
Fishing
Construction
Søren Kjærsgård, July , 2019
32 of 111
2018. Danish and European Energy 2018
KEF, Alm.del - 2018-19 (2. samling) - Bilag 88: Henvendelse af 20/9-19 fra Søren Kjærsgård, Grenaa, om synspunkter fra 'Danish and European Energy 2018'
2079937_0033.png
Trade, Service and Housing
Tabel 10
Year
Wholesale +
Retail Trade
Private Service
Public Service
Single and
Multi-family
Houses
Sum
Housing kW per
inhabitant
Figure 20
2000
708
996
735
5592
8272
1,05
2001
716
1044
766
5939
8719
1,11
2002
717
1089
750
5797
8605
1,08
2003
723
1121
787
5948
8830
1,10
Trade, service and housing, MW, Denmark 200-2017
2004 2005 2006 2007 2008 2009 2010 2011
725
1122
794
5922
8815
1,10
716
1129
805
6014
8922
1,11
739
1157
797
6014
8967
1,10
731
1145
775
6015
8935
1,10
720
1187
756
5979
8909
1,09
705
1150
796
6007
8889
1,09
746
1235
845
6664
9719
1,20
690
1137
760
5990
8811
1,07
2012
691
1148
776
5911
8738
1,05
2013
689
1148
776
5974
8797
1,06
2014
652
1083
717
5524
8181
0,98
2015
661
1102
757
5919
8647
1,04
2016
665
1132
778
6103
8892
1,07
2017
675
1193
793
6054
8944
1,05
7 000
6 000
5 000
4 000
3 000
2 000
1 000
-
2000
Trade, Service and Housing, MW, Denmark 2000-2017
Private and public service shows a slight
increase. Single and multi-family houses show
a significant increase from 5592 to 6054 MW.
But per inhabitant there is no significant
increase.
2002
2004
2006
Wholesale + Retail Trade
2008
2010
2012
Private Service
2014
2016
Public Service
Single and Multi-family Houses
Søren Kjærsgård, July , 2019
33 of 111
2018. Danish and European Energy 2018
KEF, Alm.del - 2018-19 (2. samling) - Bilag 88: Henvendelse af 20/9-19 fra Søren Kjærsgård, Grenaa, om synspunkter fra 'Danish and European Energy 2018'
Sustainable Energy
Summary
Contrary to what most people seem to think wind power so far isn’t
the dominant
part of
the “sustainable” energy (table 4 above, table 11 hereunder and figure 22.)
The sustainable energy has grown from 12 to 37% of the gross energy
consumption in the period from 2000 to 2017. (The wind power fell from 1687 MW
in 2017 to 1587 MW in 2018, ref. table 13).
Wind, solar, hydro and geothermal rose from 2,0% of the gross consumption in
2000 to 8,3 % in 2017. Domestically produced biomass and heat pumps yielded
9,6% in 2000 and 18,2% in 2017.
These 18,2 % corresponds to 4063 MW. The heat pumps yielded 288 MW in 2018,
so the biomass corresponded to 3845 MW in 2018.
iv
According to “Energistyrelsen”
the potential for Danish bioenergy is 162 PJ/Year
corresponding to 5,1 GW so there remains 1,3 GW to be used.
At the moment there is much talk of bio fuel for aviation. In 2017 the aviation used
1,34 GW of fuel. So it can hardly be made by Danish biomass. (There will always
be heavy losses by transforming straw or tree to liquid fuel, so we must hope that
forests in Sibiria or Africa can supply the necessary biomass.)
Figure 21-23 below illustrate the development of sustainable energy. And it is
illustrated that hydropower and geothermal hardly ever will obtain any great
importance. Figure 23 and 24 illustrate the solar power. It must be admitted that
this is increasing fast, and figure 24 illustrate it’s problem. It yields practically
nothing in half of the year.
The remarks about
Bio Oil
illustrate that EU is in a hurry if the plans to cover up
to 10% of the fuel used for transportation shall be fulfilled. But if the price is high
enough we may of course to the benefit of the climate import it from USA or Brazil!
Søren Kjærsgård, July , 2019
34 of 111
2018. Danish and European Energy 2018
KEF, Alm.del - 2018-19 (2. samling) - Bilag 88: Henvendelse af 20/9-19 fra Søren Kjærsgård, Grenaa, om synspunkter fra 'Danish and European Energy 2018'
2079937_0035.png
Tabel 11
Year
Solar, Wind, Hydro,
Geothermal
Bio+ Heat Pumps
Sum Imported
Bimass
Sum sustainable
2000
2,0
9,6
0,3
12
Solar Wind Hydro Geothermal, Bio+ Heatpumps and imported biomass % of gross consumption
2001 2002 2003 2004 2005 2006 2007 2008 2009 2010 2011 2012 2013
2,0
9,9
0,7
13
2,3
10,5
0,9
14
2,5
11,1
1,2
15
3,0
11,9
1,8
17
3,1
12,5
2,4
18
2,7
12,0
2,4
17
3,3
13,5
2,6
19
3,3
13,9
3,2
20
3,3
14,4
3,6
21
3,6
14,9
4,9
23
4,9
15,0
6,1
26
5,4
14,9
7,5
28
6,0
14,8
7,6
28
2014
7,4
15,4
8,5
31
2015
8,0
17,6
8,0
34
2016
7,2
17,4
8,8
33
2017
8,3
18,2
10,9
37
Sum Fossile
34009 33123 34854 34314 37445
Solar
11
11
11
12
12
Wind
483
492
557
635
749
Hydro
3,4
3,2
3,6
2,4
3,0
Geothermal
2
2
3
3
3
Bio+ Heat
2338 2497 2605 2902 3016 3111 3211 3501 3475 3486 3786 3542 3370 3394 3347 3806 3892 4063
Pumps
Sum
36845 36128 38033 37868 41228 41603 39283 36011 35318 31865 31033 27428 24993 22289 21537 21532 20287 20879
Sum Non
2836 3004 3179 3554 3783 3887 3934 4347 4291 4282 4707 4690 4590 4764 4956 5544 5503 5917
Fossile
Danish Energy Production, MW, 2000-2017
37715 35349 31664 31027 27583 26325 22738 20403 17525 16581 15989 14784 14962
13
14
15
16
19
21
25
40
92
109
118
147
160
755
697
819
789
767
891 1116 1169 1270 1493 1613 1455 1687
2,6
2,7
3,2
2,9
2,2
2,4
1,9
2,0
1,5
1,7
2,1
2,2
2,0
5
9
9
8
8
7
5
9
7
5
4
7
5
Søren Kjærsgård, July , 2019
35 of 111
2018. Danish and European Energy 2018
KEF, Alm.del - 2018-19 (2. samling) - Bilag 88: Henvendelse af 20/9-19 fra Søren Kjærsgård, Grenaa, om synspunkter fra 'Danish and European Energy 2018'
2079937_0036.png
Figure 21
Sustainable energy as % of gross Consumption
20
17,6 17,4 18,2
18
15,4
16
14,4 14,9 15,0 14,9 14,8
13,5 13,9
14
11,9 12,5 12,0
11,1
12
10,5
9,6 9,9
10
8,3
7,4 8,0 7,2
8
6,0
4,9 5,4
6
3,6
4 2,0 2,0 2,3 2,5 3,0 3,1 2,7 3,3 3,3 3,3
2
0
200020012002200320042005200620072008200920102011201220132014201520162017
Solar, Wind, Hydro, Geothermal
Bio+ Heat Pumps
Sum Imported Bimass
It will pro-
bably sur-
prise most
of the rea-
ders how
small a
role the
wind
power
plays.
7,5% of
our energy
supply in
2017, and
somewhat less in 2018.
Figure 22
"Sustainable" energy as % of the Danish Energy
consumption 2000-2017
40
%
20
0
2000
2005
Year
2010
2015
Bio+ Heat Pumps
Sum "sustainable"
Figure 23
Imported Biomass
Wind
0,80
0,60
0,40
"Sustainable" energy as % of the Danish Energy consumption
2000-2017
0,20
0,00
2000
2005
2010
2015
Solar
Hydro
Geothermal
Søren Kjærsgård, July , 2019
36 of 111
2018. Danish and European Energy 2018
KEF, Alm.del - 2018-19 (2. samling) - Bilag 88: Henvendelse af 20/9-19 fra Søren Kjærsgård, Grenaa, om synspunkter fra 'Danish and European Energy 2018'
2079937_0037.png
Solar Power
may have a potential for an essential increase
in the summer
months.
Figure 24
Sun total Denmark, MW, 2018
250
200
150
100
49
50
0
Jan
Feb Mar Apr Maj
Jun
Jul
Aug Sep
Okt Nov Dec
22
70
147
143
115
74
25
11
228
212 216
Contrary to wind power it is reasonably predictable but of no use half of the year.
And the panels are ugly to look at.
Bio oil.
About 10 years ago DONG, now Oersted, built a plant for producing
ethanol from straw. Cost about 1 billion DKK, 135 million €. From
the very scarce
information given to the public, the involuntary investors, it can be concluded that
it was a complete fiasco. However 6 MW of Bio oil was produced in 2017.
According to
https://www.eia.gov/todayinenergy/detail.php?id=32152
The USA produced 1025 barrels of bioethanol/day in 2017
And according to
https://gain.fas.usda.gov/Recent%20GAIN%20Publications/Biofuels%20Annual_T
he%20Hague_EU-28_6-19-2017.pdf
table 3 the EU produced 5380 mio liter
bieoethanol for fuel in 2017.
We can calculate the effect and get an American bioethanol effect of 39,8 GW and a
European of 3,6 GW. So the American bioethanol production corresponds to about
twice the Danish energy consumption, and the European production a tenth of
that.
The figures talk for themselves. The Americans act, the Europeans talk. The
European production of bioethanol corresponds to less than half of the Danish
demand for energy for transportation. The American to about six times the Danish
demand for transportation.
No wonder that the Europeans talk about abandoning diesel and petrol cars and
talk a lot of electric cars. They seem to have forgotten that electric cars need a
reliable electricity production, which the politicians seem to believe they can get
from wind and solar.
Søren Kjærsgård, July , 2019
37 of 111
2018. Danish and European Energy 2018
KEF, Alm.del - 2018-19 (2. samling) - Bilag 88: Henvendelse af 20/9-19 fra Søren Kjærsgård, Grenaa, om synspunkter fra 'Danish and European Energy 2018'
2079937_0038.png
Increasing Wind Power, Increasing Import and declining Electricity
v
consumption
Summary
It is generally accepted, that a fossil free society presupposes a very much increased
use of electricity.
It seems, however, that Denmark is moving in the wrong direction as illustrated in
figure 25. The net consumption of electricity (i.e. the electricity supply exclusive the
electricity consumed in power stations) was on average 4100 MW in 2005 and 3900
MW in 2018. The net consumption was reduced by 200 MW too in the period.
If we look at the consumption per capita (figure 26) we find a decline from 741 W to
680 W. It is remarkable that this development has taken place simultaneously with
an increase in the wind power from on average 755 MW to 1587 MW in 2018.
Table 12 and figure 27 show the development in wind power and in im- and export
of electricity.
The author can’t explain this development. But wonders, how an
increasing amount of wind power can result in both a decline in the use of
electricity and an increase in the import.
And wonders too how a drastic expansion of the off shore wind power will fit into
the Danish system.
Søren Kjærsgård, July , 2019
38 of 111
2018. Danish and European Energy 2018
KEF, Alm.del - 2018-19 (2. samling) - Bilag 88: Henvendelse af 20/9-19 fra Søren Kjærsgård, Grenaa, om synspunkter fra 'Danish and European Energy 2018'
2079937_0039.png
Figure 25
Consumption of Electricity, MW, Denmark, 2005-2018
4 200
4 100
4 000
3 900
3 800
3 700
3 600
3 500
3 400
2 005
2 007
El brutto
2 009
El netto
2 011
2 013
Lineær (El brutto)
2 015
2 017
Lineær (El netto)
y = -24,746x + 4160,7
R² = 0,7405
y = -26,158x + 4075,8
R² = 0,7734
Denmark’s population has due to uncontrolled immigration increased considerably
in the period from 5398 t inhabitants in 2005 to 5749 in 2018 i.e. by 27 t per year.
Figure 26
Wind Power, MW, and electricity consumption W/inhabitant,
Denmark 2005-2018
1 800
1 613
1 600
1 400
1 200
1 000
800
600
400
200
-
2 005 2 006 2 007 2 008 2 009 2 010 2 011 2 012 2 013 2 014 2 015 2 016 2 017 2 018
Wind
Nett W/person
755 697
741 754
819
791 767
751 740 709
891
718
696
686
680
666
666
668
661
660
1 116
1 172
1 270
1 493
1 459
1 687
1 587
Søren Kjærsgård, July , 2019
39 of 111
2018. Danish and European Energy 2018
KEF, Alm.del - 2018-19 (2. samling) - Bilag 88: Henvendelse af 20/9-19 fra Søren Kjærsgård, Grenaa, om synspunkter fra 'Danish and European Energy 2018'
2079937_0040.png
Increasing Wind Power and increasing Electricity Import
Tabel 12
Wind Power and Electricity Import,
MW
Denmark 2005-2018
Year
Import MW
Wind MW
2 005
156
755
2 006
- 792
697
2 007
- 108
819
2 008
166
791
2 009
38
767
2 010
- 130
891
2 011
151
1 116
2 012
594
1 172
2 013
123
1 270
2 014
326
1 493
2 015
675
1 613
2 016
576
1 459
2 017
521
1 687
2 018
596
1 587
Figure 27
Wind Power and Electriciy Import, MW, Denmark
2005-2018l
2 000
1 500
1 000
500
0
- 500
-1 000
2 005
2 007
2 009
2 011
2 013
2 015
2 017
Import MW
Wind MW
The Danish wind power was on average 1586 MW in 2018, The load 3900 MW and
the import on average 569 MW. There may be many explanations, some of them
even good. Still a little bit strange that the import has increased at the same time
as the wind power has increased.
10 years ago the Danish coal fired power stations were the most efficient in the
world. But they were hardly suited to operate as the wind blows, and most of them
have been closed. The author finds it very risky to rely on imported electricity.
Søren Kjærsgård, July , 2019
40 of 111
2018. Danish and European Energy 2018
KEF, Alm.del - 2018-19 (2. samling) - Bilag 88: Henvendelse af 20/9-19 fra Søren Kjærsgård, Grenaa, om synspunkter fra 'Danish and European Energy 2018'
2079937_0041.png
How do we get our electricity
Summary
It is generally accepted that a fossile free society means much more electric power
produced from lasting ressources like solar, wind and hydropower. The wind and
even the solar power have increased from 2000-2018, and so has the population
(by 6,5%). Wind power is even told to be cheap. Why is it then that the electricity
consumption has fallen by 2% and the import, which was close to zero 18 years
ago in 2017 and 2018 was 13 % and 15 % of the consumption?
Figure 64 below illustrate, that Denmark has made herself very dependant of the
import of electricity. That is not necessarily wrong. But since the suppliers are
mainly Norway and Sweden it may be risky. Sweden plans to close her nuclear
power stations and expand the wind energy. Thus Sweden will be unable to deliver
electricity to Denmark, when there is no wind, and Norway build cables to
England, The Netherlands and Germany which means that we will have to compete
with other countries about the Norwegian hydropower.
Tabel 13
Electricity consumption and Supply, MW, Denmark 2000-2018
Use
of
Electri
city in
Electri
city
Gener
ation
174
182
210
255
214
192
256
209
191
200
206
177
156
185
147
117
132
111
120
Cen-
Indu-
Public
Solar
tral
strial Wind
Power
Hydro Photo
Power
Auto- Turbi-
Sta-
power voltaic
Sta-
produ nes
tions
**
tions
cers
2410
2538
2625
3289
2550
2152
3289
2595
2339
2393
2406
1933
1527
1885
1481
1051
1270
1086
1093
632
714
714
706
713
629
621
553
563
527
647
530
398
363
269
242
298
317
336
371
364
354
363
354
382
339
299
261
244
250
230
209
183
182
186
183
182
178
483
492
557
635
749
755
697
819
789
767
891
1116
1169
1270
1493
1613
1455
1687
1587
3
3
4
2
3
3
3
3
3
2
2
2
2
2
2
2
2
2
2
0
0
0
0
0
0
0
0
0
0
0
0
12
59
68
69
85
86
109
Total Domestic
Supply of Electricity
Net
Ex-
ports
Year
Gross
Pro-
duc-
tion
Net
Pro-
duc-
tion
Total
West
East
2000
2001
2002
2003
2004
2005
2006
2007
2008
2009
2010
2011
2012
2013
2014
2015
2016
2017
2018
4074
4293
4463
5250
4583
4113
5204
4478
4145
4133
4403
3987
3473
3948
3642
3280
3425
3471
3424
3900
4111
4253
4995
4369
3921
4949
4269
3954
3933
4197
3811
3317
3762
3495
3163
3293
3360
3304
-76
66
236
975
327
-156
792
108
-166
-38
130
-151
-594
-123
-326
-675
-576
-521
-596
3976
4045
4017
4020
4042
4077
4157
4160
4120
3971
4067
3961
3911
3886
3821
3837
3869
3881
3900
2353
2383
2381
2402
2419
2433
2488
2499
2471
2358
2421
2370
2341
2329
2300
2322
2338
2353
2392
1623
1662
1636
1618
1623
1644
1668
1661
1649
1613
1646
1591
1570
1557
1520
1516
1532
1527
1508
Søren Kjærsgård, July , 2019
41 of 111
2018. Danish and European Energy 2018
KEF, Alm.del - 2018-19 (2. samling) - Bilag 88: Henvendelse af 20/9-19 fra Søren Kjærsgård, Grenaa, om synspunkter fra 'Danish and European Energy 2018'
2079937_0042.png
Figure 28
Electric Power Production, MW, Denmark 2000-2018
6000
4000
2000
0
2000
2005
Gross Production
Central Power Stations
Public Power Stations
2010
2015
Net Production
Wind Turbines
Industrial Autoproducers
Figure 29
Hydro and Solar Power and Export, MW, Denmark
2000-2018
2000
1000
0
2000
-1000
Wind Turbines
Solar Photovoltaic**
Figure 30
2005
2010
2015
Hydropower
Net Exports
6000
Domestic supply of electricity,MW, Denmark 2000-
2018
4000
2000
0
2000
2005
2010
2015
Total Domestic Supply of Electricity Total
Total Domestic Supply of Electricity West
Total Domestic Supply of Electricity East
Søren Kjærsgård, July , 2019
42 of 111
2018. Danish and European Energy 2018
KEF, Alm.del - 2018-19 (2. samling) - Bilag 88: Henvendelse af 20/9-19 fra Søren Kjærsgård, Grenaa, om synspunkter fra 'Danish and European Energy 2018'
2079937_0043.png
Variation in Consumption (Load)
vi
This variation is seen from table hereunder.
Tabel 14
Average
Max
Min
Stddev
Stddev % of av
Load ,MW, Denmark 2018
2018
Jan Mar
Apr-Jun
3900
4393
3610
6076
6076
5126
2294
2858
2391
782
747
633
20
17
18
Jul-Sep
3519
4968
2294
632
18
Oct-Dec
4085
6015
2632
767
19
It is observed, that the load varies with a high degree of predictability, and that the
load varies considerably from summer to winter.
Figure 31
Load, MW, Jan - Mar, Denmark 2018
6000
5000
4000
3000
2000
1000
0
0
730
1460
Hours from Beginning of year
Figure 32
Load, MW, Apr - Jun, Denmark 2018
6000
5000
4000
3000
2000
1000
0
2161
2891
3621
Hours from Beginning of year
Søren Kjærsgård, July , 2019
43 of 111
2018. Danish and European Energy 2018
KEF, Alm.del - 2018-19 (2. samling) - Bilag 88: Henvendelse af 20/9-19 fra Søren Kjærsgård, Grenaa, om synspunkter fra 'Danish and European Energy 2018'
2079937_0044.png
Figure 33
Load, MW, Jul - Sep, Denmark 2018
6000
5000
4000
3000
2000
1000
0
4345
5075
5805
6535
Hours from Beginning of year
Figure 34
Load, MW, Oct- Dec, Denmark 2018
6000
5000
4000
3000
2000
1000
0
6553
7283
8013
8743
Hours from Beginning of year
Søren Kjærsgård, July , 2019
44 of 111
2018. Danish and European Energy 2018
KEF, Alm.del - 2018-19 (2. samling) - Bilag 88: Henvendelse af 20/9-19 fra Søren Kjærsgård, Grenaa, om synspunkter fra 'Danish and European Energy 2018'
2079937_0045.png
Thermal Electricity Production
Summary
Tabel 13 and fig 28 above shows that the consumption of electricity is slightly
reduced since the year 2000. They show too that the production from central
power stations, in the year 2000 Central, Public and Industrial producers yielded
2410, 632 and 371 total 3413 MW, and in 2018 only 1607 MW. Table 15
hereunder shows that the maximum output in 2018 was 4922 MW thermal power
and the average only 1607 MW. So we have a capacity of about 5000 MW thermal
and produce on average only 1607 MW. The capacity exploitation is only about
32%. From table 19 below we can see that the wind turbines capacity exploitation
is only 27,6 % (276 kW/MW).
It costs an undisclosed but surely large amount
of money to possess so much unused capacity.
Tabel 15
Thermal Power MW, Denmark 2018
2018 Jan Mar
Apr-Jun
Jul-Sep
Average
1607
2707
1073
812
Max
4922
4922
3375
1945
Min
292
933
292
323
Stddev
948
694
691
232
Stddev % of av
59
26
64
29
Oct-Dec
1856
3695
627
640
34
Table 15 above shows the variations in the thermal power production. The
variations are considerable, which means that the operation of the power plants
can’t be efficient and on average less than 30% of the capacity is used. This will
necessarily result in a higher cost than if the production more smooth. The
variation is necessitated by the varying wind power. An honest calculation of the
cost for wind power should take this into consideration.
The miserable operation of the thermal power stations are illustrated by the figures
30-33 below.
Figure 35
Thermal Power, MW, Jan - Mar, Denmark 2018
5000
4000
3000
2000
1000
0
0
730
1460
Hours from Beginning of year
Søren Kjærsgård, July , 2019
45 of 111
2018. Danish and European Energy 2018
KEF, Alm.del - 2018-19 (2. samling) - Bilag 88: Henvendelse af 20/9-19 fra Søren Kjærsgård, Grenaa, om synspunkter fra 'Danish and European Energy 2018'
2079937_0046.png
Figure 36
Thermal Power, MW, Apr - Jun, Denmark 2018
5000
4000
3000
2000
1000
0
2161
2891
3621
Hours from Beginning of year
Figure 37
Thermal Power, MW, Jul - Sep, Denmark 2018
5000
4000
3000
2000
1000
0
4345
5075
5805
6535
Hours from Beginning of year
Figure 38
Thermal Power, MW, Oct- Dec , Denmark 2018
5000
4000
3000
2000
1000
0
6553
7283
8013
8743
Hours from Beginning of year
Søren Kjærsgård, July , 2019
46 of 111
2018. Danish and European Energy 2018
KEF, Alm.del - 2018-19 (2. samling) - Bilag 88: Henvendelse af 20/9-19 fra Søren Kjærsgård, Grenaa, om synspunkter fra 'Danish and European Energy 2018'
2079937_0047.png
Danish Wind Energy 2012-18
VII
Summary
In 2009 the Danish prime minister Anders Fogh
Rasmussen promised us a “Fossil
free Society in 2050.” Most people think that wind power should play an essential
role in this process. So let us look at the realities.
Table 16 and figure 39 illustrate how small a part of our energy consumption we
get from the windpower. In 2018 it amounted to 7,1 %. Which is even not quite
true, because a lot of the wind power must be exported, when it blows. Table 25
below indicates that only 1337 MW of the produced 1586 MW in 2018 are useful
for the Danish market, which reduces the wind power share of the Danish energy
consumption from 7,1% to 5,9%.
The wind power variations from month to month are shown in the tables 17 to 21
below and in the figures 40-43. This fact should interest not only consumers and
producers but even the gentlemen of the press and the political system
Table 20-21 and figure 40-42 below illustrate the performance of the different off
shore wind parks. The planned increase of the off shore wind capacity by a factor
of about 7, ought to be a nightmare for responsible planners.
Tabel 16
Danish Wind Power and Energy Consumption, MW, 2012-18
Wind
Consumption , gross
% Wind
2012
1165
22567
5,2
2013
1265
22875
5,5
2014
1.491
21666
6,9
2015
1611
21606
7,5
2016
1469
22349
6,6
2017
1640
22373
7,3
2018
1585
22300
7,1
Figure 39
Wind Power and Total Energy Consumption, MW,
Denmark 2012-2018
25000
20000
15000
MW
22567
22875
21666
21606
22349
22373
22300
10000
5000
1165
1265
2013
1.491
2014
1611
2015
1469
2016
1640
2017
1585
2018
0
2012
Wind
Consumption
Søren Kjærsgård, July , 2019
47 of 111
2018. Danish and European Energy 2018
KEF, Alm.del - 2018-19 (2. samling) - Bilag 88: Henvendelse af 20/9-19 fra Søren Kjærsgård, Grenaa, om synspunkter fra 'Danish and European Energy 2018'
2079937_0048.png
Wind Power Variation 2016-2018
Tabel 17
On
shore
Average MW
Max MW
Min MW
Stddev MW
Stddev % of Average
GWh
PJ
1192
3632
2
1028
86,3
2575
9,3
Jan-Mar
Off
shore
585
1206
3
384
65,7
1263
4,5
Total
1777
4806
12
1381
77,7
3838
13,8
On
shore
863
3545
1
805
93,3
1884
6,8
Danish Windpower, MW,
2018
Apr-Jun
Juli-Sep
Off
On
Off
Total
Total
shore
shore
shore
447
1234
0
344
77,0
975
3,5
1309
4730
5
1123
85,8
2860
10,3
944
3491
2
801
84,9
2083
7,5
465
1239
0
350
75,3
1026
3,7
1408
4730
4
1121
79,6
3109
11,2
On
shore
1233
3759
1
894
72,5
2723
9,8
Okt-Dec
Off
shore
618
1217
1
331
53,5
1366
4,9
Total
1852
4850
1
1195
64,5
4088
14,7
On
shore
1058
3759
1
900
85,1
9266
33,4
Jan-Dec
Off
shore
529
1239
0
360
68,2
4630
16,7
Total
1586
4850
1
1231
77,6
13896
50,0
Average MW
Max MW
Min MW
Stddev MW
Stddev % of Average
GWh
PJ
1170
3609
5
895
76,5
2526
9,1
Jan-Mar
630
1227
2
373
59,1
1361
4,9
Jan-Mar
572
1220
2
396
69,2
1250
4,5
1800
4812
31
1236
68,7
3888
14,0
1115
3455
3
904
81,1
2436
8,8
Average MW
Max MW
Min MW
Stddev MW
Stddev % of Average
GWh
PJ
1063
3485
1
969
91,1
2321
8,4
1633
4654
9
1331
81,5
3566
12,8
724
3331
1
638
88,2
1580
5,7
Danish Windpower, MW,
2017
Apr-Jun
July-Sep
563
1678
764
442
1222
4639
3014
1189
0
12
1
0
383
1253
652
332
68,0
74,7
85,3
75,0
1230
3666
1687
976
4,4
13,2
6,1
3,5
Danish Windpower, MW,
2016
Apr-Jun
Juli-Sep
443
1163
740
428
1222
4541
3086
1202
0
1
8
0
321
921
658
322
72,6
79,2
88,9
75,2
967
2539
1633
944
3,5
9,1
5,9
3,4
1206
4177
4
953
79,0
2664
9,6
1335
5005
5
916
68,6
2947
10,6
Okt-Dec
732
1216
1
347
47,4
1617
5,8
Okt-Dec
675
1321
1
356
52,8
1490
5,4
2067
5487
21
1219
59,0
4564
16,4
1096
5005
1
874
79,7
9597
34,5
Jan-Dec
592
1227
0
374
63,2
5184
18,7
Jan-Dec
530
1321
0
364
68,8
4651
16,7
1687
5487
4
1212
71,8
14781
53,2
1167
4235
18
951
81,5
2577
9,3
1169
3338
9
803
68,7
2582
9,3
1844
4557
26
1117
60,6
4072
14,7
924
3485
1
802
86,8
8117
29,2
1452
4654
1
1131
77,9
12754
45,9
The table is based on an observation every hour.
The total Danish energy consumption in 2017 was 660 PJ. (Table 4)
Søren Kjærsgård, July , 2019
48 of 111
2018. Danish and European Energy 2018
KEF, Alm.del - 2018-19 (2. samling) - Bilag 88: Henvendelse af 20/9-19 fra Søren Kjærsgård, Grenaa, om synspunkter fra 'Danish and European Energy 2018'
2079937_0049.png
On and Off Shore Wind Denmark East and West 2018
vii
Summary
The main data are given in table 18 below. It is shown, that Denmark east of the
great belt produces about 25 % of the wind power. It is seen too that the off shore
wind power is 33% of the total. It may be surprising that the off shore wind power
is nearly just as unstable as the on shore power. They can both go down to zero,
and the standard deviation is high for both.
85% of the average for on shore wind and 68% for off shore wind. So wind power
is of little use unless
back up
is provided for. Until now we have been able to
count on the Scandinavian hydro power resources. But since both Norway and
Sweden are expanding their wind power considerably, and build transmission
lines to England, The Netherlands and Germany it seems very sanguine to take it
for granted that this will be the case in the future too. Not to speak of the
conditions when the Danish plans to expand the Offshore capacity by 12 GW,
resulting in a wind power varying between zero and 17-18 GW against the actual
figures varying between zero and 5 GW.
The variations per month are shown in the tables 18-21 hereunder and
illustrated in the figures 40-43.
Tabel 18
Wind Power, MW, Denmark 2018
East
West
Onshore Offshore
340
1247
1058
529
1082
3845
3759
1239
0
0
1
0
294
977
900
360
87
78
85
68
On shore
Off shore
Total
East
West
East
West
1586
186
872
160
365
4850
1
1231
78
Average
Max
Min
Stddev
Stddev% of average
Søren Kjærsgård, July , 2019
49 of 111
2018. Danish and European Energy 2018
KEF, Alm.del - 2018-19 (2. samling) - Bilag 88: Henvendelse af 20/9-19 fra Søren Kjærsgård, Grenaa, om synspunkter fra 'Danish and European Energy 2018'
2079937_0050.png
Tabel 19
Turbines number and capacity
444
Denmark
MW
East Off
Number
192
shore
MW/turbine
2,31
Demark
West off
shore
Denmark
total Off
shore
Denmark
East On
shore
Denmark
West On
shore
Denmark
total On
shore
Denmark
total
MW
Number
MW/turbine
MW
Number
MW/turbine
MW
Number
MW/turbine
MW
Number
MW/turbine
MW
Number
MW/turbine
MW
Number
MW/turbine
847
316
2,7
1291
508
2,5
2000
2300
0,87
3670
4672
0,79
5670
6972
0,81
6961
7480
0,93
Capacities Efficiency and production On and off Shore Turbines. Denmark 2018
Off Shore Turbines
Jan
Feb
Mar
Apr
May June
July
Aug
Sep
156
102
124
126
88
82
71
87
130
Production
GWh
210
152
166
175
119
114
95
117
181
Effect
MW
472
343
374
395
267
257
214
264
407
Efficiency
kW/MW
307
277
292
277
172
222
147
239
344
Production
GWh
412
412
392
385
232
309
198
321
478
Effect
MW
487
486
463
454
274
365
233
380
564
Efficiency
kW/MW
463
379
415
403
261
305
218
326
474
Production
GWh
622
564
558
560
351
423
293
439
658
Effect
MW
482
437
432
434
271
328
227
340
510
Efficiency
kW/MW
On Shore Turbines
Production
GWh
Effect
MW
Efficiency
kW/MW
Production
GWh
Effect
MW
Efficiency
kW/MW
Production
GWh
Effect
MW
Efficiency
kW/MW
Production
GWh
Effect
MW
Efficiency
kW/MW
Oct
150
202
455
343
461
545
494
663
514
186
250
330
823
1.106
301
1.009
1.356
305
1.503
2.020
353
5,4
Nov
118
163
368
258
359
424
376
522
405
133
185
244
619
860
234
752
1.045
236
1.128
1.567
274
4,1
Dec
163
219
493
318
428
505
481
647
501
183
246
324
777
1.044
285
960
1.290
291
1.441
1.937
339
5,2
2018
1.398
160
359
3.197
365
431
4.595
525
406
1.627
186
244
7.635
872
237
9.262
1.057
239
13.856
1.582
276
49,9
167
224
295
737
990
270
904
1.215
274
1.367
1.837
321
4,9
116
172
226
663
987
269
779
1.159
262
1.158
1.723
301
4,2
155
208
273
737
991
270
892
1.199
271
1.307
1.757
307
4,7
154
214
282
634
880
240
788
1.094
247
1.191
1.654
289
4,3
91
123
161
373
501
137
464
624
141
725
974
170
2,6
95
132
174
537
745
203
632
878
198
937
1.301
227
3,4
71
95
125
427
574
156
498
669
151
716
962
168
2,6
109
147
193
502
675
184
611
822
185
938
1.260
220
3,4
167
231
304
806
1.120
305
973
1.351
238
1.447
2.010
351
5,2
Denmark Total
Production
PJ
Søren Kjærsgård, July , 2019
50 of 111
2018. Danish and European Energy 2018
KEF, Alm.del - 2018-19 (2. samling) - Bilag 88: Henvendelse af 20/9-19 fra Søren Kjærsgård, Grenaa, om synspunkter fra 'Danish and European Energy 2018'
2079937_0051.png
Off shore wind parks
Summary
The age, number of turbines, capacities, production for each of the 6 off shore parks in East Denmark and the 8 parks in
West Denmark except the 406 MW large Hornsrev 3 which began production by the end of 2018 are shown in table 20 and
21. The author suspects that the efficiency is declining with time but has not been able prove it.
Tabel 20
MW
Number
MW per turbine
MW
Hvidovre
Number
23-11-2009
MW per turbine
MW
Slagelse
Number
28-10-2009
MW per turbine
MW
Lolland
Number
21-04-2010
MW per turbine
Guldborgsund
MW
Number
17-06-2003
MW per turbine
København
27-12-2000
Denmark East
Off shore
MW
Number
MW per turbine
40
20
2
11
3
3,6
21
7
3
207
90
2,3
166
72
2,3
444
192
2,31
Production
Effect
Efficiency
Production
Effect
Efficiency
Production
Effect
Efficiency
Production
Effect
Efficiency
Production
Effect
Efficiency
Production
Effect
Efficiency
GWh
MW
kW/MW
GWh
MW
kW/MW
GWh
MW
kW/MW
GWh
MW
kW/MW
GWh
MW
kW/MW
GWh
MW
kW/MW
Danmark East Offshore, 2018
Jan
Feb
Mar
Apr
May June
July
Aug
Sep
Oct
Nov
Dec 2018
5,9
3,9
6,7
7,4
4,0
3,6
2,1
4,5
6,8
8,4
7,2
8,0
68,7
7,9
5,8
9,0
10,3
5,4
5,0
2,9
6,1
9,5
11,3 10,1 10,8
7,8
199
144
226
258
135
125
71
152
237
282
251
270
196
3,2
2,7
3,0
3,5
1,8
1,8
1,1
2,5
3,3
3,7
3,1
3,8
33,5
4,4
4,0
4,0
4,9
2,4
2,6
1,4
3,4
4,5
4,9
4,3
5,1
3,8
404
374
373
450
219
237
134
313
419
455
395
474
354
4,5
3,8
4,0
4,6
2,5
3,5
2,7
3,8
5,8
6,9
5,4
6,9
54,2
6,0
5,7
5,4
6,3
3,3
4,9
3,7
5,1
8,0
9,2
7,4
9,2
6,2
286
272
257
301
158
231
174
241
381
440
354
439
294
82,9 53,1 63,0
64,5 46,6 44,2
38,3 47,3 68,2
78,6 61,5 87,3 735,5
111,4 79,0 84,6
89,6 62,6 61,4
51,5 63,6 94,8 105,6 85,4 117,4
84,0
538
382
409
433
302
297
249
307
458
510
412
567
406
59,7 38,8 46,9
46,2 33,6 29,2
26,4 29,2 46,0
52,8 40,6 56,9 506,4
80,2 57,7 63,1
64,2 45,2 40,5
35,5 39,2 63,9
71,0 56,3 76,5
57,8
484
349
381
388
273
245
215
237
386
429
340
462
349
156
210
472
102
152
343
124
166
374
126
175
395
88
119
267
82
114
257
71
95
214
87
117
264
130
181
407
150
202
455
118
163
368
163 1.398
219
160
493
359
Søren Kjærsgård, July , 2019
51 of 111
2018. Danish and European Energy 2018
KEF, Alm.del - 2018-19 (2. samling) - Bilag 88: Henvendelse af 20/9-19 fra Søren Kjærsgård, Grenaa, om synspunkter fra 'Danish and European Energy 2018'
2079937_0052.png
Tabel 21
Jan
Hornsrev 1
MW
160 Production
04-09-2002 Number
80 Effect
MW per turbine
2 Efficiency
Hornsrev 2
MW
209 Production
14-05-2009 Number
91 Effect
MW per turbine 2,3 Efficiency
Lemvig
MW
17,2 Production
09-01-2003 Number
8 Effect
MW per turbine 2,15 Efficiency
Lemvig II
MW
28 Production
17-02-2018 Number
4 Effect
MW per turbine
7 Efficiency
Norddjurs
MW
400 Production
21-09-2012 Number
111 Effect
MW per turbine 3,6 Efficiency
Odder
MW
5 Production
30-05-1995 Number
10 Effect
MW per turbine 0,5 Efficiency
Samsø
MW
20,7 Production
08-02-2003 Number
9 Effect
Per mølle MW per turbine 2,3 Efficiency
6,9 Production
Frederiks
MW
havn
Number
3 Effect
28-05-2003 MW per turbine 2,3 Efficiency
Demark
West off
shore
MW
Number
MW per turbine
MWh
MW
kW/MW
55888
75
469
Denmark West off shore, 2018
Feb
Mar
Apr
May
June
48756
73
453
49239
66
414
47156
65
409
30211
41
254
46332
62
298
3104
4
243
4495
6
216
39612
55
344
60845
85
404
4118
6
333
6369
9
316
July
25829
35
217
40102
54
258
3648
5
285
5345
7
257
Aug
37621
51
316
57545
77
370
4439
6
347
6109
8
293
Sep
53010
74
460
85452
119
567
6902
10
557
8430
12
418
Oct
33108
44
278
94852
127
609
6544
9
511
9291
12
446
Nov
0
0
0
86895
121
577
5313
7
429
7811
11
387
Dec
0
0
0
97429
131
626
6712
9
525
9343
13
448
2018
420429
48
300
872142
100
476
61622
7
409
72882
8
297
1671621
191
478
12182
1
278
66719
8
368
18978
2
314
3.197
365
431
MWh
81475 72056 80522 68636
MW
110
107
108
95
kW/MW
523
512
517
455
MWh
5784
4706
5497
4855
MW
8
7
7
7
kW/MW
452
407
430
392
MWh
0
1709
7551
6429
MW
0
3
10
9
kW/MW
0
91
362
319
MWh
154055 141226 139558 141035
MW
207
210
188
196
kW/MW
518
526
469
490
MWh
1438
1140
1136
924
MW
2
2
2
1
kW/MW
387
339
305
257
MWh
7235
5727
6181
6090
MW
10
9
8
8
kW/MW
470
412
401
409
MWh
997
1459
1905
1866
MW
1
2
3
3
kW/MW
194
315
371
376
307
412
487
277
412
486
292
392
463
277
385
454
83484 104459
112
145
281
462
1
124
3147
4
204
1110
1
216
172
232
274
363
657
1
182
4956
7
333
1274
2
256
222
309
365
67566 126848 180577 189199 150135 193478
91
170
251
254
209
260
227
414
1
111
3019
4
196
1110
1
216
147
198
233
427
713
1
192
4481
6
291
1312
2
256
239
321
380
628
1233
2
343
6271
9
421
1983
3
399
344
478
564
636
1350
2
363
6470
9
420
2372
3
462
343
461
545
522
1196
2
332
5657
8
380
1375
2
277
258
359
424
651
1518
2
408
7485
10
486
2214
3
431
318
428
505
847 Production
GWh
MW
316 Effect
2,7 Efficiency
kW/MW
Søren Kjærsgård, July , 2019
52 of 111
2018. Danish and European Energy 2018
KEF, Alm.del - 2018-19 (2. samling) - Bilag 88: Henvendelse af 20/9-19 fra Søren Kjærsgård, Grenaa, om synspunkter fra 'Danish and European Energy 2018'
2079937_0053.png
Figure 40
Off Shore Wind, Efficiency watt per installed kW,
Denmark East 2018
600
500
400
300
200
100
0
København
Lolland
Figure 41
Hvidovre
Guldborgsund
Slagelse
Denmark East Off shore
Off Shore Wind, Efficiency watt per installed kW,
700
600
500
400
300
200
100
0
Denmark West 2018
Lemvig II
Hornsrev 1
Odder
Frederikshavn
Hornsrev 2
Norddjurs
Samsø
Lemvig
Demark West off shore
Samsø
Søren Kjærsgård, July , 2019
53 of 111
2018. Danish and European Energy 2018
KEF, Alm.del - 2018-19 (2. samling) - Bilag 88: Henvendelse af 20/9-19 fra Søren Kjærsgård, Grenaa, om synspunkter fra 'Danish and European Energy 2018'
2079937_0054.png
The variations from month to month are shown on figure 40 to 43.
Figure 43
Figure 42
600
550
500
450
W/kW
400
350
300
250
200
Efficiency of Danish Off Shore Wind Power 2018
W/kW installed capacity
Denmark East Off shore
Denmark total Off shore
Demark West off shore
350
Efficiency of Danish On Shore Wind Power 2018
W/kW installed capacity
300
250
W/kW
200
150
100
Denmar West On shore
Denmark total On shore
Denmark East On shore
Figure 39 and 40 talk for themselves. Neither off shore nor on shore wind power
can give a reliable supply of electricity.
Søren Kjærsgård, July , 2019
54 of 111
2018. Danish and European Energy 2018
KEF, Alm.del - 2018-19 (2. samling) - Bilag 88: Henvendelse af 20/9-19 fra Søren Kjærsgård, Grenaa, om synspunkter fra 'Danish and European Energy 2018'
2079937_0055.png
Variation Wind Power 2018
viii
Summary
The graphs 44-47 below illustrate the wind power variation not from
month to month but from hour to hour. Figure 44 and 45 illustrate the variation in
total wind in the months January and July 2018.
Figure 44
Total Wind , MW, Jan-2018
5000
4000
3000
2000
1000
0
0
5
10
15
Day
20
Average
25
Stddev
30
1839
1412
1839
1412
Wind Total DK 2018
Figure 45
Total Wind , MW, July-2018
4000
3000
2000
1000
0
0
5
10
15
Day
20
25
965
841
965
841
30
Wind Total DK 2018
Average
Stddev
Figure 44 and 45 above illustrate the
uncontrollable- variation of wind power and
illustrate the fact that wind power without sufficient back up/storage is an
absurdity. Furthermore the graphs show that the wind power in January on
average 1839 MW was nearly the double of the 965 MW for July.
This should interest persons who wish to have their electric cars driven by Wind
Power.
Søren Kjærsgård, July , 2019
55 of 111
2018. Danish and European Energy 2018
KEF, Alm.del - 2018-19 (2. samling) - Bilag 88: Henvendelse af 20/9-19 fra Søren Kjærsgård, Grenaa, om synspunkter fra 'Danish and European Energy 2018'
2079937_0056.png
Figure 46
Vind off shore, MW, Danmark, Apr-Jun 2018
1200
1000
800
600
400
200
0
2161
447
447
344
2661
3161
3661
Hour from start of year
Vind off shore
Average
4161
Figure 47
Wind Onshore, MW, Danmark Apr-Jun 2018
4000
3500
3000
2500
2000
1500
1000
863
805
2661
3161
3661
Hour from start of year
Wind on shore
Average
4161
863
500
805
0
2161
Figure 46 and 47 show, that on shore and off shore wind follow exactly the same
pattern, although with a slightly lower standard deviation for off shore wind. 77%
of average against 93% for onshore wind power in the period April-June 2018.
A lot of new off shore capacity is planned. You must hope that an arrangement
with Norway has been made to secure the needed back up from the Norwegian
hydropower.
Søren Kjærsgård, July , 2019
56 of 111
2018. Danish and European Energy 2018
KEF, Alm.del - 2018-19 (2. samling) - Bilag 88: Henvendelse af 20/9-19 fra Søren Kjærsgård, Grenaa, om synspunkter fra 'Danish and European Energy 2018'
2079937_0057.png
Monthly Averages Wind Power 2012-18
Summary
It must be admitted, that there is an - although unclear - pattern in the variations
from month to month (Table 22 and figure 48). Anyway it seems that you can’t rely
on a car powered by wind power for your summer holiday tour to Italy.
The figures 49-51 illustrate how large a part of the time wind power is available.
For instance fig 49 illustrate that in 40% of the time the wind power is between 0%
and 50% of the average for on shore wind parks. Off shore wind parks are a little
more stable. Here the wind power is less than 50% of the average in 30% of the
time only. Fig 52 illustrates the availability of solar power. In 50% of the time it is
zero. Again: Have you said “green energy” you have also said “Back up.”
We will look at the combination on wind and solar power in Germany later.
Tabel 22
2012
2013
2014
2015
2016
2017
2018
Figure 48
Jan
1.542
1.279
2.727
2.107
1.943
1.557
1.838
Feb
1.358
908
2.098
1.780
1.816
2.179
1.725
Wind Power, Monthly Average, MW, Denmark 2012-2018
Mar
Apr
Maj
Jun
Jul
Aug
Sep
Okt Nov
1.442 1.006
988 1.056
799
696 1.295 1.176 1.201
1.552 1.227
915 1.205
731
987 1.018 1.627 1.451
1.612 1.426
876
884
777 1.367 1.033 1.505 1.688
1.529 1.485 1.692 1.377 1.443 1.085 1.354 1.259 1.703
1.097 1.444 1.111
930 1.087 1.371 1.032 1.730 1.870
1.689 1.916 1.363 1.747 1.201 1.256 1.155 1.833 1.608
1.761 1.657
977 1.304
965 1.264 2.014 2.025 1.572
Dec Average
1.429
1.165
2.237
1.265
1.932
1.491
2.520
1.611
1.933
1.469
2.276
1.640
1.942
1.585
Wind Power Monthly Average, MW, Denmark 2012-2018
3.000
2.500
2.000
1.500
1.000
500
0
2012
2013
2014
2015
2016
2017
2018
Søren Kjærsgård, July , 2019
57 of 111
2018. Danish and European Energy 2018
KEF, Alm.del - 2018-19 (2. samling) - Bilag 88: Henvendelse af 20/9-19 fra Søren Kjærsgård, Grenaa, om synspunkter fra 'Danish and European Energy 2018'
2079937_0058.png
Figure 49
Figure 50
Vind on shore % of averaqge,
Denmark 2018
400
350
300
250
200
150
100
50
0
0
20
40
60
80
100
% of time
0
0
100
50
200
150
250
Wind off shore % of average,
Denmark 2018
20
40
60
80
100
% of time
Figure 46 and 47 above show that less than 50 % of the average production is
produced in 40% of the time by onshore turbines and in less than 30% of the time
by off shore turbines.
Figure 51
Figure 52
Wind total % of average,
Denmark 2018
350
300
250
200
150
100
50
0
0 10 20 30 40 50 60 70 80 90 100
% of time
700
600
500
400
300
200
100
0
Solar % of average, Denmark
2018
0 10 20 30 40 50 60 70 80 90 100
% of time
It can be seen from figure 37 that the total wind power is less than 50% of the
average in 35% of the time and sun power yields nothing in 60% of the time.
Søren Kjærsgård, July , 2019
58 of 111
2018. Danish and European Energy 2018
KEF, Alm.del - 2018-19 (2. samling) - Bilag 88: Henvendelse af 20/9-19 fra Søren Kjærsgård, Grenaa, om synspunkter fra 'Danish and European Energy 2018'
2079937_0059.png
Wind Power variation from Week to Week in 2018
Summary
As illustrated by the figures 53-55 below the wind power varies considerably from
week to week. And the off shore wind power is not significantly more stable than
the on shore power.
Figure 53
3000
2500
2000
1500
1000
500
0
Wind Average per Week, MW , Denmark 2018
1 3 5 7 9 11 13 15 17 19 21 23 25 27 29 31 33 35 37 39 41 43 45 47 49 51
Week nr
Figure 54
Wind on shore Average per Week, MW , Denmark 2018
2000
1500
1000
500
0
1 3 5 7 9 11 13 15 17 19 21 23 25 27 29 31 33 35 37 39 41 43 45 47 49 51
Week nr
Figure 55
1000
800
600
400
200
0
Wind off shore Average per Week, MW , Denmark 2018
1 3 5 7 9 11 13 15 17 19 21 23 25 27 29 31 33 35 37 39 41 43 45 47 49 51
Week nr
Søren Kjærsgård, July , 2019
59 of 111
2018. Danish and European Energy 2018
KEF, Alm.del - 2018-19 (2. samling) - Bilag 88: Henvendelse af 20/9-19 fra Søren Kjærsgård, Grenaa, om synspunkter fra 'Danish and European Energy 2018'
2079937_0060.png
Wind and Solar Power Monthly Variation
Summary
It is up to the reader to study the many numbers, however, it should be remarked
that the monthly average for the solar power varies between 11MW in December
and 224 MW in May. And the wind power between 965 MW in July and 2025 MW
in October.
Tabel 23
Vind and sun power, average, max, min and standard deviation per Month, MW, Denmark 2018
Wind
on
shore
Average
Max
Min
Stddev
Average
Max
Min
Stddev
Average
Max
Min
Stddev
Average
Max
Min
Stddev
Average
Max
Min
Stddev
Average
Max
Min
Stddev
1215
3632
2
1059
1199
3506
4
1031
624
2536
1
476
670
2792
7
601
1352
3491
2
918
1046
3389
1
817
Vind off
shore
Wind
Total
January
Solar
Wind
+Solar
Wind
on
shore
1159
3473
15
991
1095
3545
4
961
878
3180
4
834
822
3491
4
691
1357
3759
8
941
1291
3616
63
887
Vind off
shore
Wind
Total
February
Solar
Wind
+Solar
624
1201
5
388
563
1206
4
379
353
1118
0
258
295
1162
1
273
663
1239
0
362
527
1090
1
336
1839
4806
15
1412
March
21
331
0
52
67
631
0
119
224
712
0
248
217
715
0
238
112
623
0
158
25
408
0
57
1860
4814
38
1412
1829
4830
42
1393
1201
3887
24
746
1182
4303
42
892
2127
4837
11
1251
1598
4479
1
1131
566
1193
3
384
563
1232
18
392
427
1234
0
337
442
1189
0
309
669
1217
1
335
657
1092
18
303
1725
4594
21
1347
April
50
479
0
92
145
666
0
192
212
708
0
232
147
655
0
182
77
522
0
128
11
227
0
30
1775
4596
21
1348
1803
5140
84
1343
1517
4657
27
1169
1411
5093
17
993
2102
5043
56
1239
1959
4764
137
1167
1762
4674
12
1381
May
1658
4730
29
1326
June
977
3370
6
706
July
1304
4348
5
1148
August
965
3895
9
841
September
1264
4660
6
965
October
2015
4730
4
1253
November
2025
4850
9
1237
December
1573
4479
1
1133
1948
4695
137
1164
Søren Kjærsgård, July , 2019
60 of 111
2018. Danish and European Energy 2018
KEF, Alm.del - 2018-19 (2. samling) - Bilag 88: Henvendelse af 20/9-19 fra Søren Kjærsgård, Grenaa, om synspunkter fra 'Danish and European Energy 2018'
2079937_0061.png
Figure 56
2500
2000
1500
1000
500
0
Wind and Solar Power, MW, Monthly Avcerage 2018
Jan
Feb Mar Apr Maj Jun Jul
Wind Total
Solar
Aug Sep Okt Nov Dec
Wind +Solar
Figure 57
6000
5000
4000
3000
2000
1000
0
Wind and Solar Power, Monthly Maximum , MW, 2018
Jan
Feb Mar Apr Maj Jun
Wind Total
Jul
Aug Sep Okt Nov Dec
Wind +Solar
Solar
It should be observed, that the averages do not tell very much. In a modern society
electricity must be at disposal when it is needed
.
Neither wind nor solar energy can comply with this condition.
This is illustrated more clearly in the following section.
Søren Kjærsgård, July , 2019
61 of 111
2018. Danish and European Energy 2018
KEF, Alm.del - 2018-19 (2. samling) - Bilag 88: Henvendelse af 20/9-19 fra Søren Kjærsgård, Grenaa, om synspunkter fra 'Danish and European Energy 2018'
2079937_0062.png
Wind Power and Load
Summary
When speaking of the proportion of Wind Power in the Danish system it is mostly
forgotten to mention, that the wind power sometime is higher than the load, and it
may also be forgotten to mention that by high winds some and not so small
amounts of electricity must be exported to get balance in the system. The relations
between wind power, load and im- and export are shown in table 17 hereunder.
It should be observed that we import up to 88 % of the load and export up to 83%
of the load. These high figures are caused by the large amount of wind power in
the Danish system, and are surely a special case. Other countries are not so lucky
that they can draw on the abundant water power from their neighbours.
The figures 45-48 showing the relation betrween wind power and load,
consumption, should convince
everybody that you can’t
say wind power without
saying back up, be it hydro power, thermal power stations or some other form
which until now exists only in somebody’s imagination
.
Tabel 24
Wind Power, Import and Export relative to load W/kW
Average
Max
Min
Stddev
Observations
Average
Max
Min
Stddev
Observations
Jan
Apri-
Jul-
Mar
Jun
Sep
Wind/Load W/kW 2018
408
405
363
400
1486
1283
1419 1486
0
2
1
1
306
310
293
316
8760
2160
2184 2208
2018
Import/Load W/kW
229
81
329
880
524
880
0
0
0
228
112
244
8760
2160
2184
353
789
0
239
2208
Oct-
Dec
462
1336
0
297
2208
143
584
0
148
2208
Average
Max
Min
Stddev
Observations
Export/Load W/kW
63
112
42
831
775
831
0
0
0
132
164
115
8760
2160
2184
29
677
0
90
2208
67
710
0
129
2208
The relation between Wind power and Load is illustrated by the figures 42-45
hereunder
Søren Kjærsgård, July , 2019
62 of 111
2018. Danish and European Energy 2018
KEF, Alm.del - 2018-19 (2. samling) - Bilag 88: Henvendelse af 20/9-19 fra Søren Kjærsgård, Grenaa, om synspunkter fra 'Danish and European Energy 2018'
2079937_0063.png
Figure 58
Wind /Load, W/kW, JAn-Mar 2018
1400
1200
1000
800
600
400
200
0
0
730
1460
Hrs from beginnning of year
Figure 59
Wind/Load, W/kW, Apr-Jun 2018
1400
1200
1000
800
600
400
200
0
2161
2891
3621
Hrs from beginnning of year
Figure 60
Wind /Load, W/kW, Jul-Sep 2018
1400
1200
1000
800
600
400
200
0
4345
5075
5805
Hrs from beginnning of year
6535
Søren Kjærsgård, July , 2019
63 of 111
2018. Danish and European Energy 2018
KEF, Alm.del - 2018-19 (2. samling) - Bilag 88: Henvendelse af 20/9-19 fra Søren Kjærsgård, Grenaa, om synspunkter fra 'Danish and European Energy 2018'
2079937_0064.png
Figure 61
Wind /Load, W/kW, Oct-Dec 2017
1400
1200
1000
800
600
400
200
0
6553
7283
8013
Hrs from beginnning of year
8743
Useful Wind Power
Summary
The wind power was on average 1586 MW in 2018 and the load 3900 MW, so a
rough calculation indicate that 40,8% of our electricity is supplied by wind power.
However the wind power is sometimes higher than the load, and sometimes we
export electricity simultaneously with the production of wind power. If we correct
for this we find that only 1337 MW of wind power was used in Denmark, which
reduces the wind power used in Denmark to 1337 MW, or 34% of the average load.
Figure 48-59 above illustrate that the wind power sometimes is larger than the
load. This is expressed in figures in table 23 below.
“Useful Wind”
is defined as
the wind power less the net export. (If the export is larger than the wind power, the
useful wind power is defined as zero not as a negative value).
Søren Kjærsgård, July , 2019
64 of 111
2018. Danish and European Energy 2018
KEF, Alm.del - 2018-19 (2. samling) - Bilag 88: Henvendelse af 20/9-19 fra Søren Kjærsgård, Grenaa, om synspunkter fra 'Danish and European Energy 2018'
2079937_0065.png
Tabel 25
2018
Average
Wind
Max
Min
Stddev
Average
Useful
Max
Min
Stddev
Average
Max
Min
Average
Max
Min
Figure 62
1586
4850
1
1231
Jan
1839
4806
15
1412
Feb
1725
4594
21
1347
Mar
1762
4674
11
1381
Apr
1658
4730
29
1326
Maj
977
3370
6
706
Jun
1304
4348
5
1147
Jul
965
3895
9
841
Aug
1264
4660
6
965
Sep
2015
4730
4
1253
Okt
2025
4850
9
1237
Nov
1573
4479
1
1133
Dec
1948
4696
137
1164
Average Wind MW
Useful Wind MW
1337
4088
0
929
408
1486
0
153
880
-831
1458
3703
15
955
420
1196
3
47
524
-643
1248
3536
21
849
389
1283
6
-48
309
-775
1145
3512
0
848
404
1166
2
-95
294
-717
1256
3545
29
864
447
1367
9
33
638
-831
969
3042
6
691
277
844
2
398
720
-252
1251
3859
5
1044
363
1419
1
435
880
-554
929
3427
9
751
282
1226
2
426
787
-355
1191
3502
6
819
359
1284
2
377
789
-459
1816
4088
4
1049
557
1486
1
171
768
-677
1793
4050
9
980
520
1336
2
93
520
-710
1429
3839
1
933
374
1084
0
167
584
-529
1565
3633
137
801
484
1303
30
-8
377
-698
Wind/Load W/kW
Exchange/Load W/kW
Fig 62 shows that
Wind Power and Useful Wind Power, MW, Denmark 2018
Denmark in the
2150
months January,
1950
February, March, and
1750
April and again in the
months September and
1550
October produces more
1350
wind power, than can
1150
be used by the Danish
950
system. The differen-
750
ces are 381 MW, 477
2018 Jan Feb Mar Apr Maj Jun Jul Aug Sep Okt Nov Dec
MW, 817 MW and 402
Average Wind
Average Useful
MW in January,
February, March and April and again 199 and 232 MW in September and October.
The figures may differ from year to year of course.
Table 15 gives the figure 3900 MW average electricity consumption in Denmark in
2018. Table 23 above gives the figure 1586 MW for the average wind power i.e.
40,7 % of the load. A more honest calculation would use the useful wind power
1337 MW, i.e. 34,3 %.
Søren Kjærsgård, July , 2019
65 of 111
2018. Danish and European Energy 2018
KEF, Alm.del - 2018-19 (2. samling) - Bilag 88: Henvendelse af 20/9-19 fra Søren Kjærsgård, Grenaa, om synspunkter fra 'Danish and European Energy 2018'
2079937_0066.png
You may wonder what will happen when the plans to build another 10 or more GW
off shore capacity are realised.
Figure 60 hereunder illustrates the decline of usefulness by increasing wind
power. Up to a wind power of about 2000 MW the most can be used in Denmark,
but by a wind power of 3000 MW on average of about 2300 MW can be used in
Denmark, and by a wind power of 4000 MW only about 2800 MW can be used.
Figure 63
Useful Wind and Wind, MW, Denmark 2018
4500
4000
3500
3000
Useful
2500
Wind
2000
MW
1500
1000
500
0
0
1000
2000
3000
Wind , MW
4000
5000
y = -9E-05x
2
+ 1,0882x - 105,47
R² = 0,8706
However, there may other reasons that the wind power can’t be used in
Denmark
than it is higher than the load. A large part of the district heating is coupled to
power stations, so when it is cold the power stations have to produce heat and at
the same time electricity.
You may then argue that it is this electricity that is exported and not the wind
power. Anyway the wind power is far too expensive and unreliable to be an
alternative to the thermal power stations.
It should be observed too that the Danish electricity import can be as high as 88 %
of the load and the export 83% of the load. (Table 23 bottom left, here these figures
are given as watt/kW i.e. as pro mille.)
Our high proportion of wind power in the system necessitates this high exchange.
There is not necessarily anything wrong with that. But not many countries will
have this possibility, and it is very questionable if we can go on with this high
proportion of foreign exchange, if the plans to build a lot of new wind power
capacity are fulfilled.
Søren Kjærsgård, July , 2019
66 of 111
2018. Danish and European Energy 2018
KEF, Alm.del - 2018-19 (2. samling) - Bilag 88: Henvendelse af 20/9-19 fra Søren Kjærsgård, Grenaa, om synspunkter fra 'Danish and European Energy 2018'
2079937_0067.png
Wind Power and Exchange.
Summary
There is a clear relation between wind power and export. Based on the regression
equation in figure 63 you can calculate the figures in table 26 hereunder showing
a fast decrease in the proportion of useful wind, when the wind power surpasses
2500 MW, which in 2018 was the case in a little more than 20% of the time.
Tabel 26
Vind
Exchange
x
y
500
1441
1000
1052
1500
663
2000
274
2500
-115
3000
-504
3500
-893
4000
-1282
4500
-1671
5000
-2060
5500
-2449
Useful vind
x+y
%
500
100
1000
100
1500
100
2000
100
2385
95
2496
83
2607
74
2718
68
2829
63
2940
59
3051
55
It is well known already that we have a large in- and export of electricity. It may be
less well known that this im- and export are determined by the amount of wind
power in the system.
Figure 64 below illustrates the relation between wind power and im/export of
electricity
Figure 64
4000
3000
2000
1000
Im- and
Export
0
MW
-1000
-2000
-3000
Danish wind Power, Electricity Consumption and
im-
and
Export, MW, 2018
3900
y = -0,7778x + 1830,3
R² = 0,6714
1586
0
Zero
1000
2000
3000
4000
5000
Wind Power MW
Load average
Lineær (Wind Average)
Søren Kjærsgård, July , 2019
67 of 111
2018. Danish and European Energy 2018
KEF, Alm.del - 2018-19 (2. samling) - Bilag 88: Henvendelse af 20/9-19 fra Søren Kjærsgård, Grenaa, om synspunkter fra 'Danish and European Energy 2018'
2079937_0068.png
Import is positive and export is negative.
A significant export is observed when the
wind power exceeds 3000 MW. The regression equation in the diagram indicates
that on average 504 MW is exported when the wind power reaches this level, and
1230 MW are exported by a wind power of 4000 MW. The correlation coefficient of
0,82 (the square root of 0,6714) is high enough to justify the calculations of the
export part of the wind power.
Very significant changes of the Danish energy system must be performed before it
makes any sense to expand the wind power as proposed by the majority of political
scientists in our parliament. Not to speak about the Youth Parliament in the
Streets.
The costs don’t seem to interest anybody. Not to speak of what is physically
possible.
Tabel 27
Danish Wind Power and Im- and Export of Electricity, MW
Wind DK
Exchange
Import
Export
Average
Max
Min
Stddev
Average
Max
Min
Stddev
Average
Max
Min
Stddev
Average
Max
Min
Stddev
Average
Max
Min
Stddev
January to December 2018
1586
596
846
4850
3391
3391
1
-2891
0
1231
1168
827
January to March
249
2891
0
509
492
2771
0
676
153
2891
0
433
102
1942
0
287
254
2206
0
475
1777
4806
12
1381
1309
4730
5
1123
1408
4729
3,6
1121
1852
4850
1,2
1195
-137
2586
-2771
1033
April to June
355
2586
0
510
1186
3391
0
861
1241
3211
0
875
593
2527
0
625
1034
3391
-2891
1136
1139
3211
-1942
1050
339
2527
-2206
958
Jul to September
October to December
Søren Kjærsgård, July , 2019
68 of 111
2018. Danish and European Energy 2018
KEF, Alm.del - 2018-19 (2. samling) - Bilag 88: Henvendelse af 20/9-19 fra Søren Kjærsgård, Grenaa, om synspunkter fra 'Danish and European Energy 2018'
Table 27 above illustrates the importance of im- and export of electricity. The
maximum import level was 3391 MW and the maximum export was 2891. This
should be compared with an average Wind power of 1586 MW and an average load
of 3900 MW.
It is the author’s hope that figure 64
and table 27 should impress people talking
about expanding our off-shore wind power capacity by 12-15 GW. Or at least that
the following figures 65-68 could be a wake-up call.
Søren Kjærsgård, July , 2019
69 of 111
2018. Danish and European Energy 2018
KEF, Alm.del - 2018-19 (2. samling) - Bilag 88: Henvendelse af 20/9-19 fra Søren Kjærsgård, Grenaa, om synspunkter fra 'Danish and European Energy 2018'
2079937_0070.png
Figure 65
Windpower and exchange over the borders, MW,
Denmark, Jan-Mar 2018
5000
4000
3000
2000
1000
0
-1000
-2000
-3000
0
168
336
504
672
840
1008 1176 1344 1512 1680 1848 2016
Hrs fromstart of year
Wind DK
Exchange
Figure 66
5000
4000
3000
Windpower and excahnge over the borders, MW,
Denmark, Apr-Jun 2018
2000
1000
0
-1000
-2000
-3000
2161 2329 2497 2665 2833 3001 3169 3337 3505 3673 3841 4009 4177
Hrs fromstart of year
Wind DK
Exchange
Søren Kjærsgård, July , 2019
70 of 111
2018. Danish and European Energy 2018
KEF, Alm.del - 2018-19 (2. samling) - Bilag 88: Henvendelse af 20/9-19 fra Søren Kjærsgård, Grenaa, om synspunkter fra 'Danish and European Energy 2018'
2079937_0071.png
Figure 67
Windpower and exchange over the borders, MW,
Denmark, July-Sep 2018
5000
4000
3000
2000
1000
0
-1000
-2000
-3000
4345 4513 4681 4849 5017 5185 5353 5521 5689 5857 6025 6193 6361 6529
Hrs fromstart of year
Wind DK
Exchange
Figure 68
5000
4000
3000
Windpower and excahnge over the borders, MW,
Denmark, Oct-Dec 2018
2000
1000
0
-1000
-2000
-3000
6553 6721 6889 7057 7225 7393 7561 7729 7897 8065 8233 8401 8569 8737
Hrs fromstart of year
Wind DK
Exchange
Søren Kjærsgård, July , 2019
71 of 111
2018. Danish and European Energy 2018
KEF, Alm.del - 2018-19 (2. samling) - Bilag 88: Henvendelse af 20/9-19 fra Søren Kjærsgård, Grenaa, om synspunkter fra 'Danish and European Energy 2018'
2079937_0072.png
Power Exchange with Norway, Sweden and Germany
Summary
There is a clear correlation between the wind power and the exchange with
Norway and Sweden and only a very weak correlation between the wind power
and the exchange with Germany. That is no wonder. Germany has plenty of
wind power and there is a high degree of simultaneousness between the wind in
in Denmark and in Germany.
Until 2010 when a DC cable with a capacity 600 MW was laid between Fünen
and Sealand there was no direct electric connection between East and West
Denmark.
An AC cable between Sealand and Sweden was established already in 1914
whereas Jutland was connected by DC cables to Sweden in 1965 and to Norway
in 1977. Both East and West Denmark are connected to the continental system,
So Denmark transfers electricity from Germany to Scandinavia too, which
makes it a little more difficult to calculate the direct exchange with Norway and
Sweden on the one and Germany on the other hand. But by the help of a little
Boolean Algebra it can be done.
Tabel 28
Import and Export of electricity 2018
Norway +
Germany
Sweden
Average
MW
383
213
Max
MW
3220
2121
Min
MW
-2771
-1895
Stddev
MW
992
540
Average import GWh
3358
1867
Average import PJ
12
7
Average Wind
MW
1586
Average Load
MW
3900
Danish Energy Consump-
MW
22373
tion 2017 (Table 7)
PJ
706
Total
596
3391
-2891
1168
5225
19
As can be seen from table 28 above we import about 3% of our total energy
consumption in form of electricity. That may be clever. But it is hardly clever
that we export up to 3391 MW electricity where the average load is 3900 MW.
According to table 27 above the maximal wind power was 4850 MW in Oct-Dec
2018. So far we can export a high effect, but the politicians and the Wind Power
Company Oersted talk about increasing the off shore wind power by about a
factor 7, adding about 6 GW to the domestic electricity production
1,5 times
the average present consumption and reaching a maximum of about 15 GW off
shore wind.
Søren Kjærsgård, July , 2019
72 of 111
2018. Danish and European Energy 2018
KEF, Alm.del - 2018-19 (2. samling) - Bilag 88: Henvendelse af 20/9-19 fra Søren Kjærsgård, Grenaa, om synspunkter fra 'Danish and European Energy 2018'
2079937_0073.png
We have heard very very little about how to use this amount of electricity. It will
be shown below, that the German and Swedish and Norwegian wind power to a
high degree are produced and not produced at the same time as the Danish.
The correlation between wind power and exchange with Norway +Sweden and
Germany are shown in the figures 63 and 64 below.
Figure 69
Wind effect and exchange with Norway and Sweden,2018
4000
3000
Exchange
Norway
1000
and
0
Sweden
MW
-1000
-2000
-3000
0
1000
2000
3000
Wind Power MW
4000
5000
2000
y = -0,5782x + 1300,5
R² = 0,5148
Figure 70
Wind effect and exchange with Germany. 2018
4000
3000
2000
Exchange
1000
Germany
0
MW
y = -0,1996x + 529,79
R² = 0,2071
-1000
-2000
-3000
0
1000
2000
3000
4000
5000
Wind Power MW
It is easy to see that there is only a very weak correlation between the Danish
wind power and the exchange with Germany. This is easy to understand when
observing the wind power profiles for Germany and Denmark.
Søren Kjærsgård, July , 2019
73 of 111
2018. Danish and European Energy 2018
KEF, Alm.del - 2018-19 (2. samling) - Bilag 88: Henvendelse af 20/9-19 fra Søren Kjærsgård, Grenaa, om synspunkter fra 'Danish and European Energy 2018'
2079937_0074.png
Wind AND Solar Power in Denmark, Germany, Norway and Sweden
Summary
ix
Table 29 below shows
that you can’t make a graph to compare the “green energy”
in systems of different size. You may use a logarithmic scale as in figure 71
below, but the author prefers to normalize the data. Thus each of the hourly data
are divided with the average yearly output for each country and thereafter
multiplied by 1000. You then obtain the dimensionless unit (W power/average
kW power), which enables you to make meaningful comparisons between systems
of different size.
Further you may add the normalized hourly values for each of the countries and
divide by the number of countries to get a normalized sum.
The result of this operation is shown in table 30 and in the figures 72-73 below.
should make it clear that wind power in different countries can only be of limited
help for their neighbours. The wind power simply differs too little from North
Cape in Norway to Bavaria in Germany. A distance of about 3000 km.
Figure 74 below illustrates the simultaneousness between the wind power in
Denmark, Norway and Sweden. It must be justified to claim that in a large part of
the time, the systems can’t
supply each other.
Figure 75 illustrates that the same is the case for the wind power in Denmark
and Germany. So when Denmark demands that Germany should expand her
transmission systems to be able to buy more of our superfluous wind power we
ridicule ourselves.
Tabel 29
Wind+Solar Power, Denmark, Germany, Norway and Sweden
MW, January 2018
Denmark Germany Norway Sweden
Sum
Average
1798
20392
464
2110
24780
Max
4538
44052
937
5612
52497
Min
51
903
30
247
2477
Stddev
1320
11742
175
1231
13216
Stddev % of average
73
58
38
58
53
Søren Kjærsgård, July , 2019
74 of 111
2018. Danish and European Energy 2018
KEF, Alm.del - 2018-19 (2. samling) - Bilag 88: Henvendelse af 20/9-19 fra Søren Kjærsgård, Grenaa, om synspunkter fra 'Danish and European Energy 2018'
2079937_0075.png
Figure 71
Wind and Solar Power in Denmark, Germany, Norway and Sweden ,
January 2018
100000
10000
MW
1000
100
10
0
7
14
Day
Wind+ Solar DK
Wind
+ Solar D
No_Wind
Wind_SE
W+S Sum
21
28
Normalized data
Tabel 30
Normalized Wind Power MW/GW,
Norway+Sweden+Denmark+Germany, 2018
Average
Max
Min
Stddev
Stddev % of average
Figure 72
Jan-Dec
1000
2774
82
536
54
Jan-Mar
1093
2774
214
536
49
Apr-Jun
818
2068
97
418
51
Jul-Sep
833
2509
82
527
63
Oct-Dec
1255
2665
279
524
42
Normalized Sum, Wind Power,
MW/GW. D, DK, S, N, Jan-June 2018
3000
2500
2000
1500
1000
500
0
1
337
673
1009 1345 1681 2017 2353 2689 3025 3361 3697 4033
Hours from start of year
N+S+DK+DE
Søren Kjærsgård, July , 2019
75 of 111
2018. Danish and European Energy 2018
KEF, Alm.del - 2018-19 (2. samling) - Bilag 88: Henvendelse af 20/9-19 fra Søren Kjærsgård, Grenaa, om synspunkter fra 'Danish and European Energy 2018'
2079937_0076.png
Figure 73
Normalized Sum, Wind Power,
W/kW. D, DK, S, N, July-December 2018
3000
2500
2000
1500
1000
500
0
4345 4681 5017 5353 5689 6025 6361 6697 7033 7369 7705 8041 8377 8713
Hours from start of year
N+S+DK+DE
From table 27 it can be seen, that the normalized average differs between 818
MW/GW in the period April to June and 1255 MW/GW in the period Oct-Dec
2018. We will in the following look at the demand for storing electricity if an
even supply should be secured.
Figure 74 below illustrates the simultaneousness of wind power in Denmark,
Norway and Sweden, and it seems evident that Norwegian and Swedish wind
power must be of much less interest for Denmark, than the Scandinavian
hydro-power. Alas the Scandinavian hydro power is of great interest for
Germany, The Netherlands and Germany too.
Figure 74
Normalized Wind, W/kW, N, S, DK, Jan 2018
3500
3000
2500
2000
1500
1000
500
0
0
7
Wind_DK
14
Wind_SE
21
No_Wind
28
Søren Kjærsgård, July , 2019
76 of 111
2018. Danish and European Energy 2018
KEF, Alm.del - 2018-19 (2. samling) - Bilag 88: Henvendelse af 20/9-19 fra Søren Kjærsgård, Grenaa, om synspunkter fra 'Danish and European Energy 2018'
2079937_0077.png
Fig 75 below illustrates the synchronism between Danish and German wind
Power in January 2018. The synchronism is not perfect but at least large
enough to ridicule the Danish demand for a larger transfer capacity to Germany.
Especially the Danish demands that Germany should be more interested in
cables to Denmark than in the North Stream 2 gas pipeline to Russia.
Figure 75
Normalized Wind, W/kW, DK,DE, Jan 2018
3500
3000
2500
2000
1500
1000
500
0
0
7
14
Wind_DK
21
Wind_D
28
Danish wind turbines produced on average 1,6 GW in 2018. North Stream 2 will
have a capacity of 50 billion m³ gas/year corresponding to 63 GW.
According to BP.s Statistic 2018 the German energy consumption in 2017 was
totally 335 Mio t oil equivalent corresponding to 445 GW. So North Stream 2
could deliver about 15% of the German energy. There may be a few hours per
year where the Danish wind turbines could deliver about 2 GW to Germany. The
electricity trade with Germany in 2018 can be expressed as:
Average import 213 MW
Maximum import 2121 MW
Maximum export 1895 MW
Standard deviation 540 MW.
So Danish politicians demanding better connections to Germany in replacement
for Russian gas simply ridicule themselves.
Søren Kjærsgård, July , 2019
77 of 111
2018. Danish and European Energy 2018
KEF, Alm.del - 2018-19 (2. samling) - Bilag 88: Henvendelse af 20/9-19 fra Søren Kjærsgård, Grenaa, om synspunkter fra 'Danish and European Energy 2018'
2079937_0078.png
Expanding and Storing off Shore Wind
VI
Summary
The political system talks about adding 12000 MW to the present abt. 1700 MW
of off shore capacity. Based on data from 2018 we have estimated the
consequences.
Table 31 below show the data from 2018 + the estimated future data. Figure 76
show the load and wind power in MW for every hour in the period Jan-Mar
2018, and figure 77 shows the same + the estimated future wind power. As can
be seen the estimated future wind power is much higher than the load the most
of the time.
We can estimate the cost for building of 12 GW off shore wind capacity, 270
billion DKK, about 50.000 DKK/inhabitant, but we have heard nothing about
the costs for the investments in systems which could use this uncontrollably
and violently varying wind power.
It is possible to calculate how large a storage you would need to get a constant
power supply from the wind turbines.
The result is shown in table 32 and 33 below. Under the chosen conditions we
find that the output would be 6361 MW, which should be compared to the
average load in 2018 of 3900 MW. The storage capacity should be 6790 GWh
corresponding to 1358 times the capacity of the largest European pumped
storage, Vianden in Luxembourg. And then we should still create systems able
to use about 3 GW of electricity.
The off shore capacity was 1291 MW by the end of 2018, however 406 MW were
added at the end of the year, but the production from this added capacity was
very close to zero in 2018.
Tabel 31
Estimate for future Danish Wind Power
Total
Load
2018
3900
6076
2294
782
20
Total
Future off
Wind
shore
2018
Wind
1586
5732
4850
13434
1
0
1231
3908
78
68
Future
total
Wind
6789
16925
6
4724
70
Average
Max
Min
Stddev
Stddev % of average
Søren Kjærsgård, July , 2019
78 of 111
2018. Danish and European Energy 2018
KEF, Alm.del - 2018-19 (2. samling) - Bilag 88: Henvendelse af 20/9-19 fra Søren Kjærsgård, Grenaa, om synspunkter fra 'Danish and European Energy 2018'
2079937_0079.png
Figure 76
Danish Wind Power and Load, MW, JAn-Mar 2018
6000
5000
4000
3000
2000
1000
0
0
365
730
Total Load
1095
1460
1825
Hour nr.
Total Wind 2018
Figure 76 above illustrates the load and the wind power in Denmark in the
period Jan-Mar 2018 and figure 73 hereunder the situation if the off shore wind
power capacity is expanded to 14000 MW. It should be observed, that the
calculations presume proportionality between capacity and production. However
new and probably more efficient wind turbines would probably give a higher
production than estimated.
Figure 77
Danish Wind Power and Load, MW, Base Jan-Mar 2018,
if off shore capacity was increased to 14000 MW
15000
10000
5000
0
0
365
Total Load
730
1095
1460
1825
Hour nr.
Total Wind 2018
Future total Wind
Figure 74 above illustrates the situation after adding 12000 MW of off shore
capacity.
In 2018 the load was on average 3900 MW. With the added wind capacity the
wind turbines would supply 6789 MW, varying between 6 MW and 16925 MW.
So it is evident that something must be done to store this wind energy.
Søren Kjærsgård, July , 2019
79 of 111
2018. Danish and European Energy 2018
KEF, Alm.del - 2018-19 (2. samling) - Bilag 88: Henvendelse af 20/9-19 fra Søren Kjærsgård, Grenaa, om synspunkter fra 'Danish and European Energy 2018'
2079937_0080.png
Storing of Wind Power
Assuming a constant output from the system we can calculate the demand for
storage capacity. A constant output is of course not what will be demanded, but
since nobody knows what a future electricity system will demand we have used
this assumption to get an idea of the storage demands. The result is shown in
table 28 hereunder.
Tabel 32
Future total Wind
MW
6789
16925
6
4724
To
Reservoir
MW
2254
10564
0
3040
To
reservoir
after
losses
MW
2029
9507
0
2736
From
Reservoir
MW
2029
7062
0
2444
Regene-
rated
Power
MW
1826
6355
0
2200
Resulting
Power
MW
6361
6361
6361
0
100
Reservoir
content
GWh
GWh
3817
6790
0
1835
Average
Max
Min
Stddev
Tabel 33
Loss by storing
Loss by reproduction
Loss totally
Storage Efficiency
Loss
Loss by a price of 700 DKK/MWh
Storage capacity
Wh/kWh
100
190
810
428
6,3
3752
2626
Vianden in
Luxembourg
5
1040
1290
0
0
0,9369
4523
100
68
MW
%
GWh/year
Mio DKK/year
Future reservoir
GWh
6790
hrs of average production
1000
Max input MW
10564
Max Output MW
6355
Condition 1: To reservoir - From reservoir =
Condition 2: Minimum storage content =
Calculated factor
Storage Start of Period
GWh
Storage 1 Tesla battery
kWh
Necessary number
Mio
Table 29 gives some details about the calculations. We calculate with a loss by
storing and regeneration of electric power of 100 Wh/kWh or 10 % by each of
the operations. This corresponds to the losses in Europe’s largest pumped
storage system, Vianden in Luxembourg.
Søren Kjærsgård, July , 2019
80 of 111
2018. Danish and European Energy 2018
KEF, Alm.del - 2018-19 (2. samling) - Bilag 88: Henvendelse af 20/9-19 fra Søren Kjærsgård, Grenaa, om synspunkter fra 'Danish and European Energy 2018'
2079937_0081.png
Vianden has a storing capacity of 5 GWh. According to the calculations
Denmark would need a storage capacity 6790 GWh corresponding to about 25
% of the total Swedish hydrostorage capacity. Or 68 million Tesla batteries.
An input capacity of up to 10-11 GW would be needed. The capacity of the
Danish connections to Germany + Sweden + Norway is 5,67 GW.
Figure 78
Calculated Reservoir content, Future wind Denmark, GWh
7000
6000
5000
4000
3000
2000
1000
0
0
730 1460 2190 2920 3650 4380 5110 5840 6570 7300 8030 8760
Hrs from start of year
Figure 75 above illustrate the variations of the stored energy during the year,
showing a minimum in the beginning of September and a maximum in April.
The author finds it very very strange that nobody seems to ask for what and how
the planned electricity should be used, not to speak of calculations about what
the experiment will cost.
The calculation method for obtaining a constant output.
It is assumed that the when the wind power surpasses the yearly average times
an unknown factor smaller than one, the difference between the actual wind
power and the calculated limit is stored. The losses by storing and retrieving are
arbitrary constants.
When the actual wind power is less than the calculated limit power is retrieved
form the storage.
When the year is gone the stored wind power must equal the retrieved wind
power plus the losses. The unknown factor is determined by iteration so that
this condition is fulfilled.
The storage may not be less than zero. This condition is fulfilled by a manual
calculation of the storage by the beginning of the year.
Søren Kjærsgård, July , 2019
81 of 111
2018. Danish and European Energy 2018
KEF, Alm.del - 2018-19 (2. samling) - Bilag 88: Henvendelse af 20/9-19 fra Søren Kjærsgård, Grenaa, om synspunkter fra 'Danish and European Energy 2018'
North Sea Cable. Viking Link
IX,X
Summary
Justification for the Viking Link.
The author has seen reports assuming that there in the future will be a price
difference for electricity between Denmark and the UK and that these assumed
differences in a distant future could make the Viking Link profitable.
The author has chosen another assumptions reasoning:
When the wind power in a country is higher than a constant times the average
wind power export might be interesting, and import might be interesting if the
wind power is less than the constant times the average wind power. So if the
wind power in both countries is higher than the constant times the average and
if the wind power in both countries is lower than the constant times the average
no exchange will take place.
The Viking Link will have a transfer capacity of 1400 MW. If we assume that
export might be interesting if the wind power is higher than 1,25 times the
average, and that import might be interesting if the wind power is lower than
1,25 times the average based on the data from 2018 we find that on average
Denmark might import 133 MW and export on average 122 MW to the UK.
Totally
255 MW would be transferred in a cable with a capacity of 1400 MW.
A calculation based on the
estimates for the future wind power
(table 35
below) results in a total transfer of on average 186+166 MW =
372 MW.
On October 30, 2017 the Danish Periodical
Energy Supply
described a plan for
a cable between England and Denmark with the following data:
Capacity:
Length:
Price:
corresponding to
Economy: Revenue over 40 years
The authors calculations:
Investment
Pay back time
Interest
Cost per Year
Assumed average load
Exchange per year
Capital cost per MWh
Capital cost per MWh exchange
At full capacity
1400
750
11
1,47
4,7
MW
km
Billion DKK
Billion €.
Billion DKK
11000
30
3%
561
250
2190
256
48
mio DK
years
per year
mio DKK
MW
GWh
DKK/Mwh
DKK/MWh
Søren Kjærsgård, July , 2019
82 of 111
2018. Danish and European Energy 2018
KEF, Alm.del - 2018-19 (2. samling) - Bilag 88: Henvendelse af 20/9-19 fra Søren Kjærsgård, Grenaa, om synspunkter fra 'Danish and European Energy 2018'
2079937_0083.png
Conclusion
The system price for electricity in the Nordic countries was on average
324 DKK/MWh in 2018. After sending electricity through the cable the
price would thus be at least 324+256 = 580 DKK/MWh.
The possible exchange, average per month and per year has been calculated by
a constant of 1,25 (as defined above) and a constant 1,5 for the years 2016,
2017 and 2018 and for the case that Denmark expands it offshore capacity to
14 GW wind Power.
Danish and British Wind Power
The graphs 79-82 hereunder illustrate the Danish and British Wind Power in
2018. It should be easy to see that a high degree of simultaneousness exists
between the two systems.
Figure 79
Wind Power, MW, Denmark and UK, Jan-Mar, 2018
12000
10000
8000
5493
5493
1737
0
700
1400
Hours from beginning of year
Wind DK 2018
Av. Vind DK
6000
4000
2000
0
1737
2100
Wind UK 2018
Av vind UK
Figure 80
Wind Power, MW, Denmark and UK, Apr-Jun, 2018
12000
10000
8000
6000
4000
2000
3196
1328
2861
3561
Hours from beginning of year
Wind DK 2018
Av. Vind DK
3196
1328
4261
Wind UK 2018
Av vind UK
0
2161
From the end of May and until mid-June there is a nearly 300 hours long Period
with very little wind in both Denmark and UK
Søren Kjærsgård, July , 2019
83 of 111
2018. Danish and European Energy 2018
KEF, Alm.del - 2018-19 (2. samling) - Bilag 88: Henvendelse af 20/9-19 fra Søren Kjærsgård, Grenaa, om synspunkter fra 'Danish and European Energy 2018'
2079937_0084.png
Figure 81
Wind Power, MW, Denmark and UK, Jul-Sep, 2018
12000
10000
8000
6000
4000
In July there is very
little wind in both
DK and UK.
3293
1433
2000
0
4369
Wind DK 2018
Figure 82
Hours from beginning of year
Wind UK 2018
Av. Vind DK
5069
5769
6469
Av vind UK
Wind Power, MW, Denmark and UK, Oct-Dec, 2018
14000
12000
10000
8000
6000
4000
6019
1869
7277
7977
Hours from beginning of year
Wind DK 2018
Av. Vind DK
2000
0
6577
8677
Wind UK 2018
Av vind UK
Figure 83
Normalized Wind Power, MW Denmark and UK, Jan-Mar,
2018
3000
2500
2000
1500
1000
500
0
T
he British wind
1
Hours from beginning of year
DK Wind 2016
UK Wind 2016
11
21
31
power is about 3
times larger than the
Danish so it is easier
to compare if you
normalize the figures
which is done by
dividing each figure
from each country
by the yearly average
and then multiply by
1000.
Søren Kjærsgård, July , 2019
84 of 111
2018. Danish and European Energy 2018
KEF, Alm.del - 2018-19 (2. samling) - Bilag 88: Henvendelse af 20/9-19 fra Søren Kjærsgård, Grenaa, om synspunkter fra 'Danish and European Energy 2018'
2079937_0085.png
Tabel 34
Possible exchange of Wind Power between UK and Denmark based on Wind Power in 2018
Const
Const
Wind 2018
Export
Import
Possible
Transfer
DK
UK
potential
potential
Exchange
limited
DK
UK
UK
UK
1,25
1,25
DK
UK
DK
UK
DK
UK
To
To
to
to
UK
DK
DK
DK
Average
MW
1592
4498
360
789
758
1914
136
140
122
133
Max
MW
4783 12002
2793
6379
1979
5575
2559
1979
1400
1400
Min
MW
11
48
0
0
0
0
0
0
0
0
Stddev
MW
1213
2911
656
1382
703
1882
398
374
337
346
76
65
182
175
93
98
293
266
277
260
Stddev
% of aver.
Hours
2898
3057
5862
5703
1424
1583
1424
1583
Table 30 above illustrates the calculations. The first to be observed are the
constants DK 1,25 and UK 1,25.
If the Danish wind power is less than 1,25*1592 (the average Danish Wind
Power in 2018) =1,25*1592= 1990 MW it is assumed that import might be
interesting, and export is interesting if the wind power is higher than that value.
The corresponding value for the British wind power is 1,25*4498= 5662 MW.
So when the Danish wind power is lower than 1990 MW and the British higher
than 5662 MW there should be a basis for Danish import of British Wind Power.
Import to Denmark might thus be interesting in 5862 hours and it might be
interesting to import on average 758 MW to Denmark. However British export
must be interesting for UK too, i.e. at the same time as Denmark might import,
the British wind power must be higher than 5662 MW.
Both conditions are fulfilled in 1583 hours and the possible export from UK to
Denmark is calculated to on average 140 MW.
And export from Denmark should be of interest in 1424 hours and with an
average export of 136 MW.
However, as can be seen the exchanges reach a maximum of 2559 and 1979
MW, where the Viking Link capacity is only 1400 MW.
Accounting for this limitation we find a slightly lower exchange from UK to
Denmark 133 MW and the opposite way 122 MW.
Søren Kjærsgård, July , 2019
85 of 111
2018. Danish and European Energy 2018
KEF, Alm.del - 2018-19 (2. samling) - Bilag 88: Henvendelse af 20/9-19 fra Søren Kjærsgård, Grenaa, om synspunkter fra 'Danish and European Energy 2018'
2079937_0086.png
Denmark plans to expand her off shore wind power capacity from the present
1697 MW to about 14000 MW. Based on the figures from 2018 this would result
in an average wind power production of 6789 MW where the present load is only
3900 MW. And the Danish wind power would be considerably higher than the
British, as shown in figure 80 Hereunder. So there will surely be a desire to
export wind power.
figure 84
Wind Power, MW, UK, Jan, Danish Load, Danish WInd and Danish
future Wind Estimate, Jan 2018
16000
14000
12000
10000
8000
6000
4000
2000
0
3900
3900
0
168
Future total Wind
Average Load DK 2018
336
UK Wind 2018
Wind DK 2018
504
Load
672
Hours from beginning of year
The Danish wind power could if existing plans are realized reach a maximum of
17000 MW with an average of 6800 MW, and the neighbouring countries will
hardly wish to by Danish electricity when it blows.
The average Danish load in 2018 was 3900 MW, and the capacity of the Viking
Link will be 1400 MW.
It will be interesting to see how the political system will bring the planned wind
power in concordance with the load.
Søren Kjærsgård, July , 2019
86 of 111
2018. Danish and European Energy 2018
KEF, Alm.del - 2018-19 (2. samling) - Bilag 88: Henvendelse af 20/9-19 fra Søren Kjærsgård, Grenaa, om synspunkter fra 'Danish and European Energy 2018'
2079937_0087.png
Tabel 35
Const
DK
Const
UK
1,25
1,25
Average
MW
Max
MW
Min
MW
Stddev
MW
Stddev % of av.
Hours
Possible Exchange UK Wind 2018, and Denmark future Estimate
Estima
ted
Wind
Export
Import
Transfer
future
2018
potential
potential
unlimited
Wind
DK
UK
DK
UK
DK
UK
DK
UK
from
from
to
to
UK
DK
UK
DK
6789
4498
1351
789
3049
1914
309
268
16925 12002
8438
6379
8481
5575
5443
5929
6
48
0
0
0
0
0
0
4724
2911
2218
1382
3026
1882
858
792
70
65
164
175
99
98
277
295
3211
3057
5549
5703
1585
1431
Transfer
limited
DK
To
UK
186
1400
0
443
238
1585
UK
to
DK
166
1400
0
423
2541
1431
It may be surprising to see that Denmark’s potential for electricity import
increases after a tremendous expansion of the wind power capacity. However it
is assumed that the electricity consumption will increase too, and even with an
off shore wind capacity of 14 GW the wind power may approach zero. And in
spite of the huge expansion of the wind power the calculated potential for the
wind power exchange rises from (122+133) to only (186+166) MW on average.
Søren Kjærsgård, July , 2019
87 of 111
2018. Danish and European Energy 2018
KEF, Alm.del - 2018-19 (2. samling) - Bilag 88: Henvendelse af 20/9-19 fra Søren Kjærsgård, Grenaa, om synspunkter fra 'Danish and European Energy 2018'
2079937_0088.png
Tabel 36
Exchange, MW average, per month 2016, 2017, 2018 and for future Danish Wind
DK to UK to DK to UK to DK to UK to DK to UK to DK to UK to DK to UK to DK to UK to DK to UK to
Constant
UK
DK
UK
DK
UK
DK
UK
DK
UK
DK
UK
DK
UK
DK
UK
DK
2016
2017
2018
Estimated Future Wind DK
Unlimited
Max transfer
Unlimited
Max transfer
Unlimited
Max transfer
Unlimited
Max transfer
1,25
Transfer
1,4 GW
Transfer
1,4 GW
Transfer
1,4 GW
Transfer
1,4 GW
Jan
48
187
48
184
54
96
54
93
48
266
45
260
59
386
56
280
Feb
101
100
101
99
222
154
207
139
56
135
56
127
126
222
107
154
Mar
65
73
65
73
151
121
142
117
167
150
139
134
376
246
204
153
Apr
159
83
137
83
323
63
292
61
245
198
205
183
507
365
300
214
May
75
104
75
103
157
42
136
40
30
58
30
56
155
83
107
72
Jun
59
8
59
8
218
73
204
73
190
23
166
23
374
46
209
38
Jul
68
19
64
19
109
54
105
54
104
20
96
18
326
26
140
19
Aug
117
72
115
72
83
48
83
48
127
71
117
71
329
116
197
96
Sep
13
147
13
145
40
111
40
111
244
92
234
92
501
208
330
166
Oct
167
80
154
80
93
176
92
172
136
59
132
58
264
82
213
71
Nov
157
86
139
86
95
357
95
323
24
337
24
309
87
815
58
394
Dec
52
72
51
72
65
171
64
163
265
284
220
278
615
645
317
348
Average
90
86
85
85
133
122
125
116
136
141
122
134
310
269
187
167
Sum DK +UK
Wind
MW
average
DK
1454
176
UK
2412
170
DK
1687
255
UK
3689
241
DK
1592
277
UK
4498
256
DK
6789
580
UK
4498
353
Table 33 above shows the resulting transfers given as average MW per month in the years 2016-2018 + for the estimated
increase of the Danish off shore Wind Power by a constant 1,25 for the cutting point relative to the average wind power. It is
observed, that there has been a remarkable increase in the British wind power production from 2016-2018. Nearly a
doubling, whereas the Danish wind power has gone up and down. The increase in transferred wind power is small
compared to the increase in the British wind Power, not to speak of the estimated Danish future wind power. An increase
Søren Kjærsgård, July , 2019
88 of 111
2018. Danish and European Energy 2018
KEF, Alm.del - 2018-19 (2. samling) - Bilag 88: Henvendelse af 20/9-19 fra Søren Kjærsgård, Grenaa, om synspunkter fra 'Danish and European Energy 2018'
2079937_0089.png
from 1454 MW in 2016 to 6789 MW in the future might according to the calculation model give an increase in the Danish
export to the UK from an average of 90 MW in 2016 to a future average of 187 MW.
Tabel 37
Exchange, MW average, per month 2016, 2017, 2018 and for future Danish Wind
Constant
1,50
DK to
UK
UK to DK to UK to DK to UK to DK to UK to DK to UK to DK to UK to DK to UK to DK to UK to
DK
UK
DK
UK
DK
UK
DK
UK
DK
UK
DK
UK
DK
UK
DK
2016
2017
2018
Future Wind DK
Unlimited
Max transf
Unlimited
Max transf
Unlimited
Max transf
Unlimited
Max transf
Transfer
1,4 GW
Transfer
1,4 GW
Transfer
1,4 GW
Transfer
1,4 GW
66
148
66
145
46
61
45
55
70
160
67
157
135
229
106
162
89
87
89
85
194
151
181
139
66
110
63
104
147
158
115
126
45
53
45
52
114
86
112
81
121
120
109
107
402
148
201
119
156
67
137
67
301
52
277
52
232
177
208
152
608
225
307
170
31
42
31
42
105
18
96
18
11
19
11
19
46
28
36
27
31
0
31
0
193
33
189
33
151
19
138
19
319
28
172
25
49
2
48
2
52
4
51
4
70
9
69
9
182
9
84
9
111
20
110
20
37
6
37
6
96
37
86
37
220
55
151
50
10
111
10
108
23
68
23
63
220
85
214
85
593
134
359
115
140
82
136
82
71
185
71
174
151
56
142
56
328
86
238
76
142
72
132
72
83
316
83
269
19
381
19
323
74
640
58
376
54
67
51
67
42
190
40
175
219
315
202
293
533
619
286
359
77
62
74
62
104
97
100
89
119
124
110
113
299
196
176
134
139
135
201
188
242
223
495
310
UK
2412
DK
1687
UK
3689
DK
1592
UK
4498
DK
6789
UK
4498
Jan
Feb
Mar
Apr
May
Jun
Jul
Aug
Sep
Oct
Nov
Dec
Average
Sum DK +UK
Wind
DK
average
MW
1454
According to the calculations for table 34 the cutting point for im- and export of wind power is 1,5 times the average against
1,25 times the average wind power for table 33. Taha does’nt make a great difference. By the estimated future
Danish Wind
power of 6789 MW the constant 1,25 would give a Danish an export of on average 187 MW against 176 MW by a constant
1,5.
Søren Kjærsgård, July , 2019
89 of 111
2018. Danish and European Energy 2018
KEF, Alm.del - 2018-19 (2. samling) - Bilag 88: Henvendelse af 20/9-19 fra Søren Kjærsgård, Grenaa, om synspunkter fra 'Danish and European Energy 2018'
2079937_0090.png
By varying the constant for Denmark and for England we can create a table
showing to total exchange between the 2 countries.
We have chosen the case with British wind Power 2018 and an estimated future
Danish Wind Power of on average 6789 MW.
Tabel 38
Calculated load, MW, of he Viking Link by different constants
358
Con-
stant
UK
0,6
0,8
1
1,2
1,4
1,6
1,8
0,6
312
342
381
438
498
555
618
0,8
345
351
365
397
438
480
529
Constant Denmark
1
1,2
1,4
385
429
482
365
390
423
358
363
377
370
356
353
393
361
337
418
366
320
450
381
315
1,6
537
462
400
354
312
274
252
1,8
599
511
430
362
299
240
199
It has surprised the author that even wide variations in the chosen constants
doesn’t
result in a good utilization of the Viking Link.
Figure 85
4500
4000
Calculated exchange, MW, between Denmark and UK 2018,
at a
constant
of 1,5
4498
4498
3500
3000
2500
2000
1500
1000
500
0
1592
1400
1592
1400
241
Hours from Beginning of Year
DK to UK
Cable Capacity
UK to DK
Average Wind Denmark
241
0
732 1464 2196 2928 3660 4392 5124 5856 6588 7320 8052 8784
Figure 82 above illustrate
that there isn’t much to loose
by limiting the capacity of the
Viking Link to 1400 MW.
Søren Kjærsgård, July , 2019
90 of 111
2018. Danish and European Energy 2018
KEF, Alm.del - 2018-19 (2. samling) - Bilag 88: Henvendelse af 20/9-19 fra Søren Kjærsgård, Grenaa, om synspunkter fra 'Danish and European Energy 2018'
Discussion
It may well be discussed if presumptions for the calculations
that import/export
becomes interesting if the wind power is larger or smaller than a figure defined by
the average wind power.
However the author is convinced that there must be a relationship between the
exchange and the actual wind power. It would be absurd if Denmark built wind
power to supply the British market and vice versa. So there must be a relationship
between the actual wind power effect and the exchange. And it has been shown,
that the criteria may vary considerable without making a great difference in the
magnitude of the exchange.
The relationship could be different price levels. However in a free market there will
always be a relationship between price and supply.
If on the other hand we are not in free market, no calculations of profitability can
be made at all.
Søren Kjærsgård, July , 2019
91 of 111
2018. Danish and European Energy 2018
KEF, Alm.del - 2018-19 (2. samling) - Bilag 88: Henvendelse af 20/9-19 fra Søren Kjærsgård, Grenaa, om synspunkter fra 'Danish and European Energy 2018'
2079937_0092.png
Die Energiewende
IX
Summary
Germany has during the last 10 years expanded her wind and solar power
dramatically, so that wind and solar power in 2018 accounted for 29,5 % of the
electric load. However that is only partly true. As illustrated by figure 86 there is a
strong correlation between export of electricity and production of wind and solar
power. So you can claim that a third of the wind and solar power produced in
Germany is exported. Often at very low prices, and mainly to Poland and Holland,
which should not surprise anybody since Holland and Poland have a wind power
share in their electricity supply of only 9,4% and 7,2% respectively. So the German
customers pay, and the neighbours can laugh. And the Russians dream of a
profitable gas export to Germany.
Tabel 39
Wind+Solar and Exchange, MW, Germany 2018
Load D
Average
Max
Min
Stddev
Stddev % of average
58062
78327
35434
9893
Wind_D Solar_D
12394
44628
273
9049
73
W+S
Germany
-5677
7437
-17647
4068
72
Exchange
Poland/ Netherlands
Germany /Germany
3528
1814
7907
8613
-848
-2767
2528
1875
72
103
4716 17110
28955 50217
0
667
7153 10091
152
59
On average Germany produced 17110 MW Wind+Solar power in 2018
corresponding to 29,5 % of the average electric load of 58062 MW. A third of this,
5677 MW, was exported. Mainly to Poland and The Netherlands.
Figure 86
Aussenhandel Contra Wind+Solar, MW,
Deutschland 2018
5000
0
Im- and
Export
-5000
-10000
-15000
-20000
0
10000
20000
30000
Wind+Solar MW
40000
50000
y = -0,2625x - 1185,3
R² = 0,4241
Søren Kjærsgård, July , 2019
92 of 111
2018. Danish and European Energy 2018
KEF, Alm.del - 2018-19 (2. samling) - Bilag 88: Henvendelse af 20/9-19 fra Søren Kjærsgård, Grenaa, om synspunkter fra 'Danish and European Energy 2018'
2079937_0093.png
Fig 86 illustrates that Germany can’t use more than about 2/3 of the generated
wind and solar power.
Danish wishes that Germany should build stronger transmission lines so that we
could export the wind power which can’t be sold in Denmark, when it blows, thus
are meaningless.
The maximal German wind + solar power in 2018 was 50217 MW. The regression
equation in figure 86 allows us to calculate a table showing the expected
import/export as a function of the wind + solar power.
Tabel 40
Wind + solar
MW
0
5000
10000
15000
20000
25000
30000
35000
40000
45000
50000
55000
17110
Exchange
MW
-1158
-2471
-3783
-5096
-6408
-7721
-9033
-10346
-11658
-12971
-14283
-15596
Average
-5677
% of W+S
49
38
34
32
31
30
30
29
29
29
28
33
It is no wonder that Poland and The Netherlands are the main importers of cheap
often very cheap- German green energy since the wind power share of the electricity
consumption was only 9,4 % in The Netherlands and 7,2% in Poland and since The
Netherlands have very little nuclear power (Average 2018 was 253 MW) and Poland
none.
Søren Kjærsgård, July , 2019
93 of 111
2018. Danish and European Energy 2018
KEF, Alm.del - 2018-19 (2. samling) - Bilag 88: Henvendelse af 20/9-19 fra Søren Kjærsgård, Grenaa, om synspunkter fra 'Danish and European Energy 2018'
2079937_0094.png
It always blows and the sun shines somewhere
IX,X
Summery
Alas, that is not true. The author has compared the wind power in
Belgium, Germany, Spain, France, UK and the Netherlands based on hourly
registrations of the wind power in each of the six mentioned countries. As shown in
table 41 hereunder the combined wind and solar power varied between 89360 MW
and 5671 MW with an average of 36635 MW. We will later look at the demands to a
storage system enabling an even supply of wind and solar energy.
Tabel 41
Wind and Solar Power, MW, in Belgium, Germany, France, Spain, UK and The Netherlands 2018
Belgium
Average
Max
Min
Stddev
Stddev % of average
1122
4119
7
791
70
Germany
17108
50217
667
10090
59
Spain
6894
19175
442
3435
50
France
4169
13418
525
2429
58
UK
5742
16171
75
3177
55
Nether-
lands
1598
5449
27
1029
64
Sum
36635
89360
5671
16526
45
Since the wind power capacity differs greatly from country to country it gives no
meaning to compare directly, however you can normalize each of the hourly figures
by dividing them with the average yearly output for each country, multiply by 1000
and thus obtain the dimensionless unit (W power/average kW power), and thus
enable you to make meaningful comparisons. Further you may add the normalized
hourly values for each of the six countries and divide by 6.
Tabel 42
Average
Max
Min
Stddev
Belgium
1000
3662
8
863
Normalized Wind Power W/kW, 2018
Germany
Spain
France
UK
1000
1000
1000
1000
3601
2876
3739
2668
22
44
138
11
730
592
730
647
NL
1000
3029
0
789
Sum
1000
2818
95
563
Table 42 shows the normalized wind power for the 6 mentioned countries, The
standard deviation becomes somewhat lower when the wind power is added for all
six countries but is still considerable. 563 W/kW or 56% of the average. And the
yield varied between 9,5 and 281 % of the average. So the demands for back-up will
be huge no matter how powerful grids are built.
The graphs hereunder illustrate the findings for 2018.
It is evident that it does not always blow somewhere.
Søren Kjærsgård, July , 2019
94 of 111
2018. Danish and European Energy 2018
KEF, Alm.del - 2018-19 (2. samling) - Bilag 88: Henvendelse af 20/9-19 fra Søren Kjærsgård, Grenaa, om synspunkter fra 'Danish and European Energy 2018'
2079937_0095.png
Figure 87
3000
2000
Normalized Sum, Wind+Solar Power,
MW/GW. B, D, ES, F, UK, NL, Jan-Mar 2018
1307
1000
0
0
Figure 88
1307
7
14
21
28 35 42 49 56 63
Days from start of year
70
77 84
Average
2000
Normalized Sum, Wind+Solar Power,
MW/GW. B, D, ES, F, UK, NL, Apr-Jun 2018
1000
763
763
0
91
Figure 89
98 105 112 119 126 133 140 147 154 161 168 175
Days from start of year
Average
3000
2000
1000
0
Normalized Sum, Wind+Solar Power,
MW/GW. B, D, ES, F, UK, NL, July-Sep 2018
684
684
182 189 196 203 210 217 224 231 238 245 252 259 266 273
Days from start of year
Average
Figure 90
3000
2000
1000
0
Normalized Sum, Wind+Solar Power,
MW/GW. B, D, ES, F, UK, NL, Oct-Dec 2018
1250
274 281 288 295 302 309 316 323 330 337 344 351 358 365
Days from start of year
Average
Søren Kjærsgård, July , 2019
95 of 111
2018. Danish and European Energy 2018
KEF, Alm.del - 2018-19 (2. samling) - Bilag 88: Henvendelse af 20/9-19 fra Søren Kjærsgård, Grenaa, om synspunkter fra 'Danish and European Energy 2018'
2079937_0096.png
Wind + Solar Power % of load in Belgium, Germany, France, Spain, UK and
the Netherlands
Summary
Table 43 below gives the data for the proportion of wind and solar power of the
load in the six countries. This proportion varies between 45% and 3% with an
average of 19%. If it is chosen to increase the proportion to for instance 50% i.e. a
factor 2,5 you would still have periods where wind and solar give only 7-8% of the
load and periods where the yield will be 112 % of the load.
The figures 91 to 94 below illustrate the variation of the supply relative to the load.
Tabel 43
Wind + Solar Power % of load in B,DE,F,ES,NL,UK 2018
Year
Jan-Mar Apr-Jun Jul-Sep Oct-Dec
Average
19
19
19
17
19
Max
45
43
45
43
44
Min
3
4
4
4
3
Stddev
8
8
8
8
8
Stddev %
42
40
43
47
39
Figure 91
Wind+ Sun as % of electric load, B,D,ES,F,GB,NL. Jan- Mar,
2018
50
40
30
20
10
0
0
168 336 504 672 840 1008 1176 1344 1512 1680 1848 2016
Hr nr
Søren Kjærsgård, July , 2019
96 of 111
2018. Danish and European Energy 2018
KEF, Alm.del - 2018-19 (2. samling) - Bilag 88: Henvendelse af 20/9-19 fra Søren Kjærsgård, Grenaa, om synspunkter fra 'Danish and European Energy 2018'
2079937_0097.png
Figure 92
Wind+ Sun as % of electric load, B,D,ES,F,GB,NL.
Apr- Jun, 2018
50
40
30
20
10
0
0
168 336 504 672 840 1008 1176 1344 1512 1680 1848 2016 2184
Hr nr
Figure 93
Wind+ Sun as % of electric load, B,D,ES,F,GB,NL.
July-Sep, 2018
50
40
30
20
10
0
0
168 336 504 672 840 1008 1176 1344 1512 1680 1848 2016 2184
Hr nr
Figure 94
Wind+ Sun as % of electric load, B,D,ES,F,GB,NL.
Oct-Dec, 2018
50
40
30
20
10
0
0
168 336 504 672 840 1008 1176 1344 1512 1680 1848 2016 2184
Hr nr
Søren Kjærsgård, July , 2019
97 of 111
2018. Danish and European Energy 2018
KEF, Alm.del - 2018-19 (2. samling) - Bilag 88: Henvendelse af 20/9-19 fra Søren Kjærsgård, Grenaa, om synspunkter fra 'Danish and European Energy 2018'
2079937_0098.png
Some Data from Belgium, Germany, Spain, France, United Kingdom and The
Netherlands
iX, X
, x
Summary
Table 44 hereunder gives data about energy consumption, the share of nuclear
power and (wind+solar), effect consumption and carbondioxide emission per capita
and per kWyear. (1 kWyear = 8760 kWh, since there is 8760 hours per normal
year))
It is remarkable that Germany in spite of
Die Energiewende
and in spite of the
highest proportion of wind and solar energy in the energy consumption has both
the highest carbon dioxide emission per produced unit of energy (kWyear) and per
capita. France has the highest share of nuclear power in her energy supply, 14,5 %
and by far the lowest carbon dioxide emission both per capita and per consumed
kWyear.
Angela Merkels “Energiewende seems to be a complete failure!
xi
Carbon Dioxide and population
Tabel 44
Wind+Solar Effect 2018 Compared with the Total Energy Consumption
B
Average
1.122
Max
4.119
MW
Wind + Solar
Min
7
Stddev
791
Stddev
% of aver.
70
Average
3.107
Max
4.982
MW
Nuclear
Min
234
Stddev
1.273
Stddev
% of aver.
41
Average electric load
MW
9.924
Total Effect Consumptio
GW
80,8
%
Electric Load/Total Effect
12,3
Carbn dioxide Emissions
mio t
100
Wind+Solar/Total Energy
1,39
%
3,85
Nuclear/Total Energy
%
Inhabitants
Thousands 11.299
Electric load/Capita
W
878
Total Effect/Inhabitant
kW
7,15
Carbon dioxid/capita
t
8,85
Carbon dioxide /kWyear t/kW year
1,24
DE
ES
F
UK
NL
Sum
DK
1.860
4.814
38
1.412
76
0
0
0
0
0
3.900
22
17,7
35
8,45
0,00
5.733
680
3,84
6,11
1,59
17.110 6.894 4.169 5.743 1.598 36.635
50.217 19.175 13.418 16.171 5.449 89.360
667
442
525
75
27
5.671
10.091 3.435 2.429 3.177 1.029 16.526
59
50
58
55
64
45
8.199 6.082 44.729 6.923
253 69.294
9.500 7.117 58.432 8.322
551 86.806
4.591 4.045 28.920 4.912
0 50.650
1.029
847 6.375
657
268
7.913
13
14
14
9
106
11
58.062 29.063 53.803 31.440 13.267 195.558
434,5 180,0 308,6 248,1 111,7
1364
13,4
16,1
17,4
12,7
11,9
14,3
799
281
356
385
164
2085
3,94
3,83
1,35
2,31
1,43
2,69
1,89
3,38 14,50
2,79
0,23
5,08
80.689 46.122 64.395 64.716 16.925 284.146
720
630
836
486
784
688
5,39
3,90
4,79
3,83
6,60
4,80
9,90
6,09
5,53
5,95
9,69
7,34
1,84
1,56
1,15
1,55
1,47
1,53
Søren Kjærsgård, July , 2019
98 of 111
2018. Danish and European Energy 2018
KEF, Alm.del - 2018-19 (2. samling) - Bilag 88: Henvendelse af 20/9-19 fra Søren Kjærsgård, Grenaa, om synspunkter fra 'Danish and European Energy 2018'
2079937_0099.png
Comments to table 44.
Average electric load
The electricity consumptions for each of the 7 countries are
shown as
average MW.
Total Effect Consumption.
The BP yearly statistics gives the energy consumption
for each of the countries in Mtoe per year.
The author has transferred the data
to GW.
So it is easy to calculate electricity, wind+solar power and nuclear power as per
cent of the total energy consumption.
Belgium’s effect consumption per capita is by far the highest 7,15 kW and
UK has the lowest 3,83 kW. This must reflect the types of industry found in
the different countries.
It is seen too that France with 14,5 % nuclear power in the total energy
supply has by far the lowest carbon dioxide emission per capita, 5,53
t/capita/year against Germany’s 1,89 % and 9,9 t/capita/year.
That is of course no wonder considering that Germany must export about a third
of her wind and solar power, and has to use brown coal to generate electricity,
when the sun doesn’t shine and the wind doesn’t blow.
The Danish figure is lower 1,59 t carbon dioxide per kWyear. At first we import a
lot of our electricity, and where Germany generates electricity with brown coal
Denmark uses imported wood, which is considered not to give any carbon dioxide
emission. It is not the authors intention
to discuss the “sustainability”
of this
arrangement, but anyway it can be mentioned, that it is hardly possible for
Germany to do the same. The supply of wood is limited, and it would be quite a
task to transport wood pellets from the sea ports in Holland and Belgium to
Duisburg, Frankfurt and Ludwigshafen.
figure 95
(Wind+Solar) and Nuclear Energy % of Total Energy
Consumption 2018
20
15
10
5
0
Belgium
Germany
Spain
France
UK
Netherlands
Wind+Solar % of Total Energy
Nuclear/Total Energy
Søren Kjærsgård, July , 2019
99 of 111
2018. Danish and European Energy 2018
KEF, Alm.del - 2018-19 (2. samling) - Bilag 88: Henvendelse af 20/9-19 fra Søren Kjærsgård, Grenaa, om synspunkter fra 'Danish and European Energy 2018'
2079937_0100.png
figure 96
Carbond dioxide t/kWyear, 2018
2,00
1,50
1,00
0,50
0,00
Belgium
Germany
Spain
France
UK
Netherlands
1,84
1,56
1,24
1,15
1,55
1,47
Carbon Dioxide t/kWyear
Figure 87 and 88 illustrate that Germany and Spain have the highest proportion of
of wind and solar energy in their energy supply. And the highest emission of
carbon dioxide per produced kWyear
(One kWyear equals 8760 kWh)
Storing of Green Energy
Summary
It is evident that the most severe limitation for usage of wind and solar power is
their instability and that this limits their usefulness until a storage method has
been found. A precondition for The Danish engagement in Wind energy has been the
access to the Scandinavian hydro power and the storage capacity of Swedish and
Norwegian magazines, about 120 TWh. For comparison the Danish electricity
consumption is about 35 TWh/year.
With the expansion of wind- and solar power throughout Europa follows the
question:
“Is the
storage capacity large enough?”
And not only for the storage
capacity but also for the capacity to receive an effect of many GW and to deliver
them again when needed.
The maximal output delivered by Swedish and Norwegian hydropower stations in
2018 was 39546 MW. A very considerable part of these 39 GW was used in Norway
and Sweden. The maximal export from Norway + Sweden in 2018 was 10277 MW
and the maximal import was 7053 MW. So the author supposes that about 15 GW
transfer to and from Scandinavia will be an absolute maximum.
So let us look at the storage demand for Germany+ Spain + France + Belgium +
United Kingdom in 2018, calculated under the presumption that Wind and Solar
power should deliver an even effect, realizing of course that the reality will differ
from that. Anyway the author thinks that this calculation at least will be a god
Søren Kjærsgård, July , 2019
100 of 111
2018. Danish and European Energy 2018
KEF, Alm.del - 2018-19 (2. samling) - Bilag 88: Henvendelse af 20/9-19 fra Søren Kjærsgård, Grenaa, om synspunkter fra 'Danish and European Energy 2018'
indication of the magnitude of the task to make wind and solar energy useful on a
large scale.
According to the calculations the 6 countries in question would need a storage
capacity of 18 TWh, or about 15% of the Scandinavian hydro power magazine.
This is may be not so frightening before you remember that this is more than
3600 times the capacity of
Europe’s largest pumping storage Vianden in
Luxembourg. And the maximum input to the reservoir would be 54 GW, 8
times the maximum power import for Norway + Sweden in 2018. And the
maximum delivery would be 30 GW, the double of the maximal power export
from Norway and Sweden.
You might modify the demands, but anyway they would be very much larger if
for instance wind + solar should deliver 10% of the energy supply instead of
the present 2,3%
Søren Kjærsgård, July , 2019
101 of 111
2018. Danish and European Energy 2018
KEF, Alm.del - 2018-19 (2. samling) - Bilag 88: Henvendelse af 20/9-19 fra Søren Kjærsgård, Grenaa, om synspunkter fra 'Danish and European Energy 2018'
2079937_0102.png
Tabel 45
Calculation of the necessary storage capacity for an even supply of wind+ solar power
Wind+Solar Germany, Spain,
France, Belgium, United
Kingdom, Netherlands 2018
Column
Average
Max
Min
Stddev
I
MW
36635
89360
5671
16526
To
Regene-
Reservoir
To
reservoir
From
Resulting
rated
content
Reservoir after Reservoir
Power
Power
GWh
losses
II
MW
7621
54173
0
10794
III
MW
6859
48756
0
9714
IV
MW
6859
32795
0
8784
V
MW
6173
29516
0
7905
VI
MW
35187
35187
35187
0
VII
GWh
9065
18241
0
5540
Column I in table 39 gives the data for the wind and solar power in the described
countries in 2018 based on an observation every hour. Column II indicates the
electricity transferred to the storage and column III the input to the storage after
losses. Column IV shows the amount taken from the storage, which equals the
amount put into the storage, and column V the regenerated power after losses.
Column VI shows the resulting power from wind, solar and storage, which is being
kept constant , and column VII the movements in the reservoir.
Tabel 46
Loss by storing
Loss by reproduction
Total loss by Storing
Storage Efficiency
Loss
Loss by a price of 700 DKK/MWh
Storage capacity
Wh/kWh
100
100
190
810
1448
4,0
12684
8879
Vianden in
Luxem-bourg
5
1040
1290
0
0
0,9605
6582
MW
%
GWh/year
Mio DKK/year
Future reservoir
18241
GWh
498
hrs of average production
54173
Max input MW
29516
Max Output MW
Condition 1: To reservoir - From reservoir =
Condition 2: Minimum storage content =
Calculated constant
GWh
Storage Start of Period
Table 46 above shows at first the loss per kWh by storing, calculated to be totally
19% as in Vianden.
Søren Kjærsgård, July , 2019
102 of 111
2018. Danish and European Energy 2018
KEF, Alm.del - 2018-19 (2. samling) - Bilag 88: Henvendelse af 20/9-19 fra Søren Kjærsgård, Grenaa, om synspunkter fra 'Danish and European Energy 2018'
2079937_0103.png
Thereafter follows the calculated loss according to the calculations, and the
magnitude of the demanded storage, 18,241 TWh corresponding to 182 million
Tesla Batteries a 100 kWh! And corresponding to 498 hours of average production.
The storage should be 3600 times larger than the storage in Vianden.
The maximum input to the storage is calculated to 54 GW corresponding to about
the average electricity production in Germany and the regeneration to 29 GW. You
might say that it does not pay to store the peaks, but it will more difficult to reduce
the necessary output.
If imaginative ideas like storing the wind power by heating stones and thereafter
raising steam to power a gas turbine the losses and the necessary storage would
be much higher.
Figure 97 shows the calculated reservoir content in GWh during the year.
figure 97
Calculated Reservoir content,B, D, ES, F, GB, NL, GWh, 2018
18000
16000
14000
12000
10000
8000
6000
4000
2000
0
0
730 1460 2190 2920 3650 4380 5110 5840 6570 7300 8030 8760
Søren Kjærsgård, July , 2019
103 of 111
2018. Danish and European Energy 2018
KEF, Alm.del - 2018-19 (2. samling) - Bilag 88: Henvendelse af 20/9-19 fra Søren Kjærsgård, Grenaa, om synspunkter fra 'Danish and European Energy 2018'
2079937_0104.png
Figure 98 shows the input to the reservoir in January. It might be reasonable to
cut the peaks and lose the corresponding amount of electricity.
Figure 98
Reservoir input,B, D, ES, F, GB, NL, Jan 2018; MW
50000
45000
40000
35000
30000
25000
20000
15000
10000
5000
0
0
7
14
21
28
Figure 99 shows the calculated delivery from the reservoir in January. Here too It
might be reasonable to cut the peaks and and get the electricy from other kinds of
back-up.
But then you don’t get a “fossil free society”.
Figure 99
Reservoir output,B, D, ES, F, GB, NL, Jan 2018; MW
25000
20000
15000
10000
5000
0
0
7
14
21
28
Søren Kjærsgård, July , 2019
104 of 111
2018. Danish and European Energy 2018
KEF, Alm.del - 2018-19 (2. samling) - Bilag 88: Henvendelse af 20/9-19 fra Søren Kjærsgård, Grenaa, om synspunkter fra 'Danish and European Energy 2018'
Wind and Nuclear Power
xii
Summarry.
Most politicians, journalists and a large majority among common
people seem to believe that nuclear power is prohibitively expensive.
We don’t know the exact cost for maintenance of off shore wind power but
this is
surely not lower than 0,7 cent/kWh and probably
much higher. We don’t know
either what it will cost to decommission the turbines after 20-30 years of service.
So we assume that the operation costs for off shore wind power impossibly can be
lower than the operation costs for nuclear power.
Vattenfall informs that the cost for the latest Danish off shore wind power park,
Horns Rev 3 commissioned by the end of 2018, was 9 billion DKK and that the
production is expected to be on average 194 MW. This results in an investment of
46 million DKK/MW.
Ingeniøren informed us on April 15, 2019 that the still not commissioned Finnish
Reactor Oulkiluoto 3 will cost 41 billion DKK and on average deliver 1484 MW. I.e.
27 mio DKK/MW.
Other informants say the cost will be not less than
37 mio
DKK/MW.
The author has tried to find information for the four 1400 MW reactor being built
by The United Arab Emirates and find a specific investment of
37 mio DKK/MW.
The four more than 30 years old Finnish nuclear reactors yielded on average 2499
MW in 2018, and the standard deviation was 15% of the average.
The Finnish wind turbines yielded on average 615 MW with a standard deviation of
74% of the average.
So nuclear power even from a new and still unpaid reactor is inevitably much
cheaper than off shore wind power, and it is reliable.
According to table 49 below the unpredictable variations in wind power are
very large and not at all comparable with the stability of nuclear power.
We see a lot of fanciful
and absolutely unrealistic
ideas about how to solve
the problems arising from the unpredictable variations for the wind power.
The author is an experienced chemical engineer and dares to conclude that
all these
ideas will cost a lot of money and they can’t be realised.
The figures shown with red script are given in the above mentioned home pages.
The rest of the figures are calculated by the author based on these figures. The
Swedish figures are given by to digits only, so you might wish a higher accuracy
but the resulting figures for the costs minus capital costs can´t be completely
wrong.
Søren Kjærsgård, July , 2019
105 of 111
2018. Danish and European Energy 2018
KEF, Alm.del - 2018-19 (2. samling) - Bilag 88: Henvendelse af 20/9-19 fra Søren Kjærsgård, Grenaa, om synspunkter fra 'Danish and European Energy 2018'
2079937_0106.png
Tabel 47
Exchange rates 13.05.2019
SEK/DKK
0,6893
DKK/US$
6,66
DKK/€
7,4668
Cost comparison, Wind and Nuclear
XII, XIII, XIV, XV
On April 15, 2019 the periodical “Ingeniøren” informed
that the cost for Olkiluoto
would cost 41 billion DKK. Others say that 55 billion DKK is closer to the truth
and we were informed too that the production would be on average 1484 MW.
Vattenfall informs us that the latest Danish off shore wind park has cost 9 billion
DKK and will yield on average 194 MW
Tabel 48
Comparing generation costs for Oulkiluoto 3 and Barakah Nuclear Power Plant with Hornsrev 3
Oulkiluoto
Horns Rev 3
UAE
Billion DKK
41
55
9
199,8
Investment
Billion US$
30
Depreciation Period
Year
30
30
30
30
Interest rate
% pa.
3,0%
3,0%
3,0%
3,0%
Capital Cost/year
Mio DKK
2.092
2.806
459
10.194
Specific investment
DKK/W
27,63
37,06
46,38
37,14
Nominal Capacity
MW
1600
1600
406,7
5600
Efficiency
0,928
0,928
0,477
0,961
Average yield
MW
1.484
1.484
194
5.380
Hours/year
Number
8.760
8.760
8.760
8.760
Production
GWh/year
13.000
13.000
1.700
47.129
Capital Cost
162
218
270
216
Operation Forsmark 2018
89
89
89
DKK/MWh
Maintenance Horns Rev 3 minimum
50
Sum
251
306
320
305
Operation Ringhals 2018
130
130
DKK/MWh
Sum
292
348
The only figures which can be considered to be really reliable are the operation
costs for Forsmak and Ringhas, 89 and 130 DKK/MWh. The maintenance cost 50
DKK/MWh for Horns Rev is probably much too low, but we have not been able to
find a better figure.
But the author is convinced in the conclusion:
“It is not true, that nuclear
power costs more than off shore wind Power”
Søren Kjærsgård, July , 2019
106 of 111
2018. Danish and European Energy 2018
KEF, Alm.del - 2018-19 (2. samling) - Bilag 88: Henvendelse af 20/9-19 fra Søren Kjærsgård, Grenaa, om synspunkter fra 'Danish and European Energy 2018'
2079937_0107.png
Danish Plans and Swedish nuclear power
IX
Summary
Figure 100 below illustrates Swedish nuclear power, Danish wind power, and
Danish future windpower if the plans to build 12 GW new off shore capacity are
realized. It should be no problem for the watchful reader to see that it will be a
tremendous task to get the black curve
the present Danish load
to fit together
with the future wind power
the blue curve.
The author finds it completely impossible to understand that the wind power lobby
has been able to sell the idea of building a huge off shore wind capacity without
having presented any sensible idea of how to use this wind power.
Figure 100
Swedish Nuclear, Danish Wind Power and Danish Load,
MW, Oct-Dec 2018 + future Danish Wind
15000
10000
5000
0
6553
Wind total 2018
Average Load, DK
Danish Load
7283
Nuclear 2018
Max Load DK
8013
8743
Future total Wind
Min Load DK
In figure 100 above the red curve illustrates the Swedish production of nuclear
power hour for hour in the period October-December 2018, and the green curve
shows the Danish wind power in this period.
The blue curve shows the hypothetical Danish wind power if the actual plans to
build another 12000 MW of shore wind power capacity are realized.
The dotted blue and brown lines show maximum and minimum Danish load in the
period. It will not be an easy task to fit the future wind in between these two lines.
Søren Kjærsgård, July , 2019
107 of 111
2018. Danish and European Energy 2018
KEF, Alm.del - 2018-19 (2. samling) - Bilag 88: Henvendelse af 20/9-19 fra Søren Kjærsgård, Grenaa, om synspunkter fra 'Danish and European Energy 2018'
2079937_0108.png
Tabel 49
Sweden
Nuclear
Wind off
Shore
Wind
total
Denmark
Future
off Shore
Future
total
Wind
7318
18164
6
5083
69
Load
Average
Max
Min
Stddev
Stddev% of Av
7510
8677
3394
1116
15
2018, MW
529
1586
1239
4850
0
1
360
1231
68
78
5732
13434
0
3908
68
3900
6076
2294
782
20
Table 44 above shows the nuclear power in Sweden in 2018, and the Danish of
shore, total wind and load in 2018 plus the estimated future wind power if the off
shore wind capacity is increased by 12 GW.
It is evident, that if the investment
should make sense a market for the wind power must be found. So far we
have heard nothing about those future customers. It should be observed too
that the nuclear power has a standard deviation of 16% of the average
whereas the wind has a standard deviation of 70-80% of the average.
Everybody who has ever been responsible for any kind of production will
without difficulty understand that the uncontrollable variation is a huge
problem.
Figure 101-104 below show the estimated future wind power in Denmark, the
nuclear power in Sweden, the Danish electricity load and the wind power in 2018
in the months January, April, July and October
Figure 101
Danish Wind and Load, Swedish Nuclear, Jan 2018 and Future
Danish Wind, MW
14000
12000
10000
8000
MW
6000
4000
2000
0
0
Nuclear_SE
7
14
Future Off shore
Day
21
28
Load
Total Wind DK 2018
Søren Kjærsgård, July , 2019
108 of 111
2018. Danish and European Energy 2018
KEF, Alm.del - 2018-19 (2. samling) - Bilag 88: Henvendelse af 20/9-19 fra Søren Kjærsgård, Grenaa, om synspunkter fra 'Danish and European Energy 2018'
2079937_0109.png
Figure 102
18000
16000
14000
12000
MW
10000
8000
6000
4000
2000
0
Danish Wind and Load, Swedish Nuclear, Apr 2018 and Future
Danish Wind, MW
0
Nuclear_SE
Figure 103
7
14
Total Wind DK 2018
Day
21
28
Load
Future total Wind
Danish Wind and Load, Swedish Nuclear, July 2018 and Future
Danish Wind, MW
20000
18000
16000
14000
12000
10000
MW
8000
6000
4000
2000
0
0
Nuclear_SE
7
14
Total Wind DK 2018
Day
21
Future total Wind
28
Load
Søren Kjærsgård, July , 2019
109 of 111
2018. Danish and European Energy 2018
KEF, Alm.del - 2018-19 (2. samling) - Bilag 88: Henvendelse af 20/9-19 fra Søren Kjærsgård, Grenaa, om synspunkter fra 'Danish and European Energy 2018'
2079937_0110.png
Figure 104
Danish Wind and Load, Swedish Nuclear, October 2018 and Future
Danish Wind, MW
18000
16000
14000
12000
MW
10000
8000
6000
4000
2000
0
0
Nuclear_SE
7
14
Total Wind DK 2018
21
Day
Future total Wind
28
Load
It will be a tremendous task to get the blue curves
future wind power
to fit
together with the brown curves
the electric load.
Until now we have not heard anything serious about how that could be done.
We have shown above that the difference in costs for producing wind power only
differs slightly from the cost for nuclear power.
But to fit the brown and the blue curves together will without any possible doubt
be absolutely ruining
apart from the fact that no realistic process for storing
huge amounts of electric energy are in sight.
So it is time to congratulate the wind power industry for it’s efficient
salesmanship.
Søren Kjærsgård
July 22, 2019
Søren Kjærsgård, July , 2019
110 of 111
2018. Danish and European Energy 2018
KEF, Alm.del - 2018-19 (2. samling) - Bilag 88: Henvendelse af 20/9-19 fra Søren Kjærsgård, Grenaa, om synspunkter fra 'Danish and European Energy 2018'
2079937_0111.png
i
https://population.un.org/wpp/Download/Standard/Population/
Total Population - Both Sexes (XLSX, 2.42 MB)
ii
https://www.bp.com/content/dam/bp/business-sites/en/global/corporate/pdfs/energy-
economics/statistical-review/bp-stats-review-2018-full-report.pdf
iii
https://ens.dk/service/statistik-data-noegletal-og-kort/maanedlig-og-aarlig-energistatistik
Energistatistik 2017
iv
Bioenergien Analyse af bioenergi i Danmark
ISBN: 978-87-93071-68-1
https://ens.dk/sites/ens.dk/files/Bioenergi/bioenergi_-_analyse_2014_web.pdf
(Page 40)
v
https://ens.dk/service/statistik-data-noegletal-og-kort/maanedlig-og-aarlig-energistatistik
månedsstatistik
vi
http://osp.energinet.dk/_layouts/Markedsdata/framework/integrations/markedsdatatemplate.asp
x
vii
https://ens.dk/service/statistik-data-noegletal-og-kort/data-oversigt-over-energisektoren
Data for eksisterende og afmeldte anlæg
viii
http://osp.energinet.dk/_layouts/Markedsdata/framework/integrations/markedsdatatemplate.asp
x
ix
x
https://transparency.entsoe.eu/
http://www.globalcarbonatlas.org/en/CO2-emissions
xi
https://corporate.vattenfall.se/om-oss/var-verksamhet/var-elproduktion/ringhals/produktion-
och-driftlage/ringhals-ekonomi/
XIII
https://ing.dk/artikel/finsk-kaempereaktor-star-nu-ved-malstregen-225385
XIV
https://corporate.vattenfall.dk/vores-vindmoller-i-
danmark/vindprojekter/horns-rev-3/om-horns-rev-3/
XV
https://spectrum.ieee.org/energy/nuclear/the-united-arab-emirates-nuclear-
power-gambit
Søren Kjærsgård, July , 2019
111 of 111
2018. Danish and European Energy 2018