FACTSHEET
Wintershall combines economic, environmental and social responsibility.
As one of the financial investors in the Nord Stream 2 Project, Wintershall
therefore initiated an eco-efficiency analysis that was conducted by BASF/TÜV.
Its major key results are presented in this spreadsheet.
Nord Stream 2:
Eco-Efficiency Analysis
Bovanenkovo
Eco-Efficiency Analysis (EEA)
created by BASF SE
+ TÜV Rheinland LGA Products GmbH (Link
p
on EEA)
EEA evaluates:
Nord Stream 2
(basic route) from Bovanenkovo.
Russia via Baltic Sea
Onshore Alternative 1
(virtual) from Bovanenkovo,
Russia via Belarus and Poland and
Onshore Alternative 2
(virtual) from Bovanenkovo,
Russia via Ukraine to Western Europe
EEA compares (selection):
Construction, operation and
maintenance of evaluated pipelines for the transport of one
normalized m³ of natural gas to western European hubs;
assuming
state-of-the art design
and equipment at a maximum
operating pressure of
100 bar
for all onshore pipeline sections
N
d
or
S
am
tre
2
Greifswald
te
Al
Baumgarten
ECO-EFFICIENCY PORTFOLIO
EEA6: highest efficiency
Environmental impact (person minutes/FU)
Alt
rn
iv
at
er n
e
1
a ti
ve
2
Aggregated environmental and economic result
at a glance:
3
Nord Stream 2 and Alternative 1 imply
similar Eco-Efficiency results.
3
Nord Stream 2 and Alternative 1 are
significantly more eco-efficient than Alternative 2.
3
Alternative 2 is most expensive and has
the highest environmental impact.
A
person minute
describes the environmental or economic
impact caused by one EU-28 inhabitant in one minute.
FU – Functional Unit
refers to the transport of one Nm³ of
natural gas via evaluated pipelines from Bovanenkovo,
Russia to Western Europe.
0
1
2
■
Nord Stream 2
3
■
Alternative 1
■
Alternative 2
4
5
5
4
3
2
1
0
Economic impact (person minutes/FU)
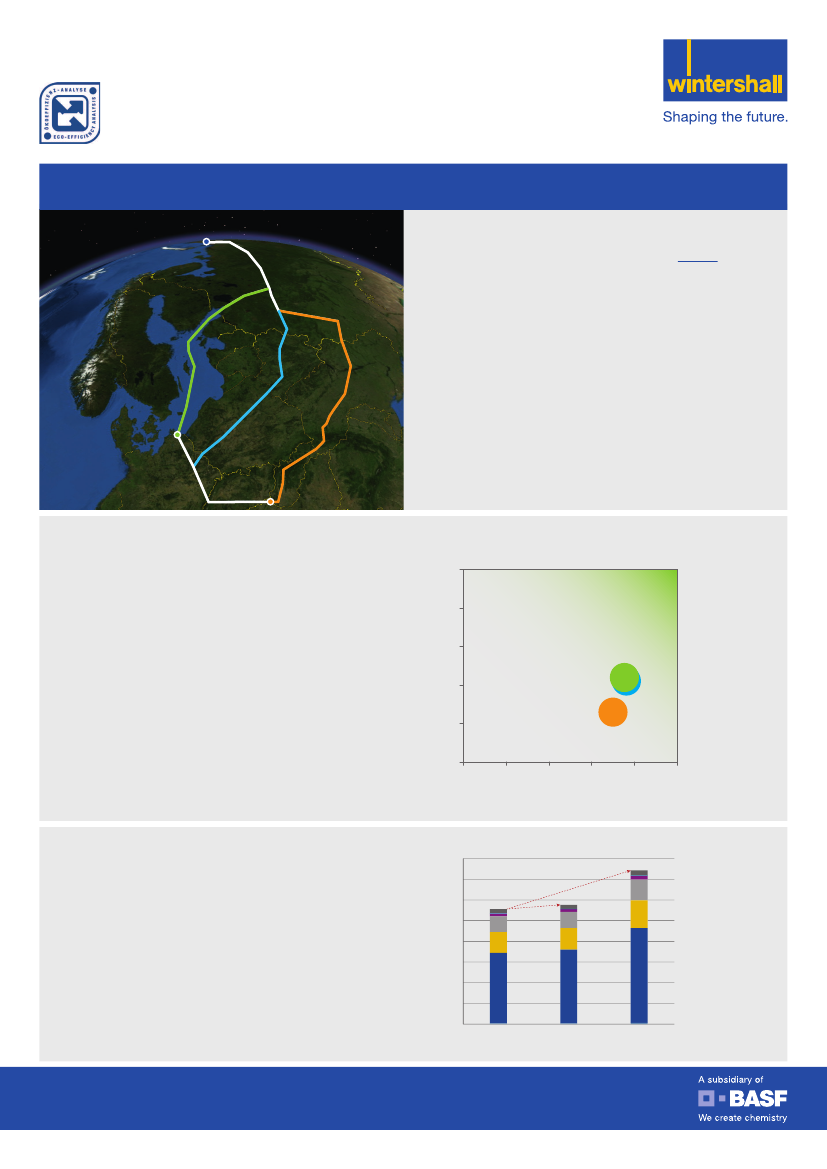
ENVIRONMENTAL IMPACTS
Aggregated environmental results
Global warming potential, photochemical ozone formation
and acidification contribute most to the environmental impact
results. Alternative 2 performs visibly worse in all categories.
■
Resource depletion (mineral, fossil)
■
Eutrophication (fresh water)
■
Eutrophication (marine)
■
Acidification
Environmental Impact (person minutes/FU)
4.0
3.5
3.0
2.5
2.0
1.5
1.0
0.5
0
Nord Stream 2
4%
34%
■
Photochemical ozone formation
■
Climate Change
(Global Warming Potential)
■
Human toxicity
Alternative 1
Alternative 2