Udvalget for Fødevarer, Landbrug og Fiskeri 2014-15 (1. samling)
FLF Alm.del Bilag 184
Offentligt
1507467_0001.png
PINNGORTITALERIFFIK
GRØNLANDS NATURINSTITUT
GREENLAND INSTITUTE OF NATURAL RESOURCES
Rejerådgivning for 2015
Nuuk 18. september 2014
Journal.: 20.00-11/2014
Orientering vedrørende den biologiske rådgivning om fiskeri på rejebestandene ved Vest- og Øst-
grønland for 2015
Rejebestanden i Vestgrønland er fortsat nedadgående, og NAFO/ICES anbefaler, at fangsterne i 2015
ikke overstiger 60.000 tons. I både 2013 og 2014 var rådgivningen om fiskeri efter rejer langs vestkysten
80.000 tons.
Rådgivningen om fiskeri på rejer i Østgrønland i 2015 er 2.000 tons og er uændret i forhold til 2014.
Fangstniveauet for
Vestgrønland
i 2015 er fastsat med udgangspunkt i:
fortsat faldende rejebiomasse – markant fald i udenskærsområderne
et lavt antal af små rejer, der er på vej ind i det kommende fiskeri
mindre udbredelse af bestanden i området
stigning i biomassen af torsk i rejeområderne (primært i den sydlige del af Vestgrønland) over
de sidste 3 år og et forventet højt indhug i bestanden af rejer forårsaget af torsk
160
140
120
'000 t
Catch
TAC
100
80
60
40
ved
20
60.00 tons
0
1970
2014 catches
are projected
1980
1990
2000
2010
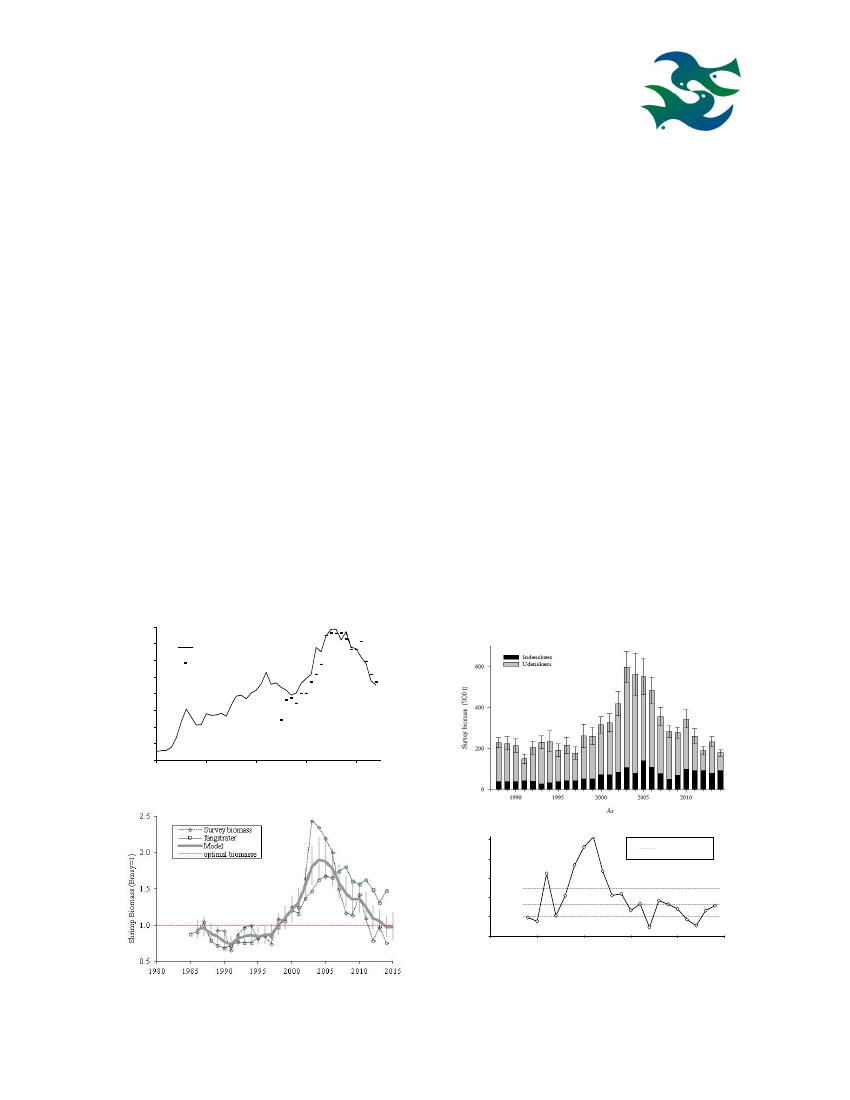
Figur 1. Vest. Totale fangster (’000 tons)
3.0
Figur 3. Vest. Biomasse fra survey
quartiles, 1994–2013
2.5
Number at age 2
(mean 1994--2013 = 1)
2.0
1.5
1.0
0.5
0.0
1990
1995
2000
2005
2010
2015
Figur 2. Vest. Biomasseudvikling fra model
Figur 4. Vest. Antal af 2-årige i bestanden fra de
biologiske undersøgelser 1994-2014.
PDF to HTML - Convert PDF files to HTML files
1507467_0002.png
RÅDGIVNINGEN om rejefiskeri i Vestgrønland
Beregninger forudsiger, at bestanden vil kunne blive på den optimale størrelse (B
msy
) og fortsat vokse,
hvis fangsten i 2015 ikke overstiger 60.000 tons. Det videnskabelige råd anbefaler derfor, at fangster i
2015 ikke overstiger 60.000 tons
1
.
Ud over rejefangsterne og torskens indhug i bestanden kan rejebestanden påvirkes af en række ukendte
faktorer såsom eventuelle ændringer i havets temperatur, rejens biologi og andre rovdyr end torsk, der
spiser rejer. Disse andre mulige faktorer arbejder biologerne på at blotlægge, således at der kan tages
højde for dem i fremtidige videnskabelige rådgivninger.
Herunder en kort gennemgang af baggrunden for rådgivningen (den engelske tekst af rådgivningen fin-
des i bilag 1):
De samlede
fangster
steg fra 80.000 tons i 1998 til 150.000 tons i 2008 og er siden faldet i takt med fal-
dende kvotefastsættelse. Fangster i 2014 forventes at ligge på 90.000 tons (Figur 1).
Mængden af rejer,
der i gennemsnit fanges pr. time af en trawler (CPUE), giver et fingerpeg om bestandens status, fordi det
giver et indirekte tal for tætheden af rejer. Dette tal (CPUE) er generelt faldet fra 2008, dog med en min-
dre fremgang i 2014 sammenlignet med 2013. Fiskeriet har i flere år koncentreret indsatsen til stadig
mindre områder, og fiskeriet foregår i dag i området nord for Store Hellefiskebanke og i Disko Bugt.
De biologiske undersøgelser i 2014 har registreret et fald i bestanden i forhold til tidligere år (Figur 3).
Faldet er særlig udtalt i de udenskærs områder, hvor
biomassen
(dvs. den samlede vægt af rejer) er på
det laveste niveau siden 1988. Samme nedgang er ikke set i de indenskærs områder, og biomassen i
Disko Bugt i 2014 er beregnet til at være over gennemsnittet. Det samlede antal af små rejer (rekrutte-
ring)
på vej ind i fiskeriet har været lavt gennem de senere år, og det forventes at påvirke den fiskbare
bestand negativt. Antallet af 2-årige rejer har været under middel i de senere år, og der er endvidere et
rekordlavt antal af 3-4 årige rejer. Rekrutteringen til bestanden forventes derfor at være på et lavt niveau
i nær fremtid. Den fiskbare bestand består hovedsageligt af hunner og et fåtal af hanner.
Den matematiske model, der benyttes i til at vurdere bestanden samt forudsige bestandens udvikling ved
forskellige fangstniveauer, anvender fangsterne (det samlede udtag af bestanden), fangstrater (CPUE fra
logbøger) og biologiske undersøgelser samt et mål for biomassen af torsk (fordi torsk spiser rejer).
Modellen viser, at bestanden i slutningen af 2014 vil være under den optimale størrelse (biomasse, B
msy
),
og at der bliver fjernet lidt mere fra bestanden, end bestanden kan bære (dvs. den totale dødelighed vil
være lidt over den bæredygtige dødelighed, Z
msy
).
Biomassen af torsk
i rejeområderne er steget i de senere år, og mængden af rejer, som spises af torsk, er
derfor steget. I 2014 er torskebiomassen lidt over niveauet i 2012 og 2013.
1
De 60.000 tons svarer til en beregnet risiko på under 35 % for at fjerne så meget af bestanden, at den ikke længere kan
holde sig på et niveau svarende til den optimale biomasse (B
msy
) eller højere. Tidligere arbejde har vist, at hvis man holder
sig under risikogrænsen på 35 % med den mængde af rejer, der dør (pga. af fiskeri og anden påvirkning, også kaldet
dødelighed), vil bestanden holdes på eller over den optimale biomasse (B
msy
).
PDF to HTML - Convert PDF files to HTML files
1507467_0003.png
RÅDGIVNINGEN om rejefiskeri i Østgrønland
(den engelske tekst af rådgivningen findes i bilag 2
nedenfor)
Rådgivningen om fiskeri efter rejer ved Østgrønland for 2015 er uændret på 2.000 tons. De biologiske
undersøgelser og data fra fiskeriet viser, at bestanden fortsat er relativt lille på trods af faldende fangst-
mængder i de senere år. Nedgangen i bestanden falder sammen med en stigning i forekomsten af torsk
(torsk spiser rejer).
18
16
14
Catch ('000 tons)
Catch
TAC
2.5
2.0
1.5
1.0
0.5
Overall
12
10
8
6
4
2
0
1978
1983
1988
1993
1998
Year
2003
2008
2013
Std. CPUE (1987 = 1)
0.0
1986
1990
1994
1998
2002
Year
2006
2010
2014
Figur 1. Fangster i Østgrønland
2.5
2.0
Std.effort (1987=1)
Figur 2. Fangstrater i Østgrønland
Overall
80
70
1.5
1.0
0.5
0.0
1986
Biomass Index
1990
1994
1998
2002
2006
2010
2014
60
50
40
30
20
10
0
2008
2009
2010
2011
2012
2013
2014
Figur 3. Fiskeridødelighed (indeks)
Figur 4. Biomasse fra survey
Om rådgivningen
Rådgivningen om rejer er formuleret på det seneste møde under NAFO/ICES, som er afholdt i Nuuk den
10.–17. september 2014. Grønlands Naturinstitut har skrevet og fremlagt 8 dokumenter, der tilsammen
danner baggrunden for rådgivningen. Status for andre rejebestande i Nordatlanten blev endvidere vurde-
ret på samme møde, og den samlede rapport indeholder status og rådgivning om rejer på Flemish Cap og
Grand Bank samt status for bestandene af rejer i Barentshavet og Skagerrak. På mødet deltog i alt 17
forskere fra Canada, EU, Norge, Rusland og fra Grønland. Fra Grønland deltog seniorforsker Michael
Kingsley, forsker Nanette Hammeken Arboe, forsker AnnDorte Burmeister og afdelingschef Helle Sieg-
stad. Den officielle rådgivning findes på NAFOs (www.NAFO.int) hjemmeside. Den engelske rapport
over rådgivningen fra NAFO består af mere end 100 sider, som Departement og Styrelsen for Fiskeri
modtager en kopi af.
Grønlands Naturinstitut vil snarest invitere forvalterne og rejefiskerne til en grundig gennemgang af
baggrunden for rådgivningen, herunder besvarelse af spørgsmål og udveksling af viden.
Med venlig hilsen
Helle Siegstad, Afdelingschef
PDF to HTML - Convert PDF files to HTML files
1507467_0004.png
Bilag 1: Northern Shrimp in Subarea 1 and Div. 0A
Advice September 2014 for 2015
Recommendation
Previous work has shown that a maintained mortality risk of 35% is low enough to keep stock levels safely at or
above
B
msy
. A catch of 60 000 t in 2015 would entail an estimated mortality risk below 35% and is projected to allow
stock growth. Scientific Council therefore advises that catches in 2015 should not exceed 60 000 t.
Management Objectives
Scientific Council is aware of the Greenland management plan for shrimp and of general management objectives specified
in the Greenland Fisheries Act; however the contents of these have not been conveyed to the Council. Canada requested
Scientific Council to provide advice on this stock within the context of the NAFO Precautionary Approach Framework
(SCS Doc. 13/04).
Advice is based on risk analysis coming from a quantitative model, and on qualitative evaluation of biomass and stock-
composition indices.
Objective
Apply Precautionary Approach
Status
Comment/consideration
Stock status is both estimated and forecast
relative to precautionary reference points
OK
Management unit
The stock, considered distinct from all others, is distributed throughout Subarea 1, extends into Div. 0A east of 6030’W,
and is assessed as a single stock.
Stock status
Biomass is estimated to have been declining since 2004, and at the end of 2014 is projected to be near
B
msy
with a risk of
being below
B
lim
of <2%. The risk that total mortality in 2014 will exceed
Z
msy
is estimated at 53%.
160
140
120
'000 t
Catch
1.5
Z/Zmsy
88
2014 with
quartile bars
TAC
100
80
60
40
20
0
1970
1980
1990
2000
2010
92
91 14
12
1.0 90
08
10 09
95
​ ​
85
99
06
02
1.7
04
1.9
0.5
0.7
Biomass (Bmsy=1)
2.5
0.9
1.1 1.3
B/Bmsy
1.5
3.0
2.5
2.0
1.5
1.0
0.5
Recruitment index
(mean 1994--2013 = 1)
2.0
1.5
1.0
0.0
1990
0.5
1985
1990
1995
2000
2005
2010
2015
1995
2000
2005
2010
2015
PDF to HTML - Convert PDF files to HTML files
1507467_0005.png
Reference points
B
lim
is 30% of
B
msy
and the limit reference point for mortality is
Z
msy
(FC Doc. 04/18).
Projections
Projections for 2015 were made with catch levels ranging from 50 to 90 Kt/yr and a cod stock biomass at 50
Kt.
50 000 t cod
Catch option ('000 tons)
Risk (%) of transgressing:
50
55
60
65
70
80
90
B
msy
, end 2015
50
51
51
52
52
53
54
2016
47
47
48
49
49
52
53
2017
45
46
47
48
49
52
54
B
lim
, end 2015
3
3
3
3
3
3
3
2016
3
4
4
4
4
4
4
2017
5
5
5
5
5
5
6
Z
msy
during 2015
27
30
32
36
39
47
53
2016
28
30
33
37
40
47
54
2017
28
31
34
37
41
47
55
Assessment
The analytical assessment was run with the same methods as in 2011–13, with the exception that cod-stock biomass
index series were combined within the model, and with updated data series.
The next assessment is scheduled for 2015.
Human impact
Mainly fishery related mortality has been documented. Other sources (e.g. pollution, shipping, oil-industry) are con-
sidered minor.
Biological and Environmental Interactions
Cod is an important predator on shrimps. This assessment incorporates this interaction
.
Fishery
Shrimps are caught in a directed trawl fishery. Bycatch of fish in the shrimp fishery is around 1% by weight. The fishery is re-
gulated by TAC
.
Recent catches and TACs (t) have been as follows:
2007
2008
2009
2010
2011
2012
2013
2014
NIPAG
STATLANT 21
Enacted TAC
2
1
144 190
144 123
152 417
152 749
148 550
145 717
135 458
133 990
132 987
133 990
129 179
132 987
123 985
123 195
142 597
115 975
115 080
118 596
95 380
91 802
102 767
90 000
1
94 140
provisional—projected to year end;
2
sum of TACs autonomously set by Canada and Greenland.
Effects of the fishery on the ecosystem
Measures to reduce effects of the fishery on the ecosystem include area closures and moving rules to protect sponges
and cold-water corals and to reduce bycatch, and gear modifications to reduce damage to benthic communities, and,
again, to reduce bycatch.
Special comments
The future trajectory of the stock is likely to depend on the evolution of the stock of cod, which has recently been increas-
ing and is difficult to predict.
The stock comprises a low proportion of males, and recruitment to both the fishable and the spawning stocks in the short
term are expected to remain low
.
Source of Information
SCR Docs 04/75, 04/76, 08/6, 11/053, 11/057, 11/058, 12/44, 13/54, 13/56, 13/57, 13/58, 13/59, SCS Doc. 04/12.
PDF to HTML - Convert PDF files to HTML files
1507467_0006.png
Bilag 2: Northern Shrimp in Denmark Strait and off East Greenland
Advice September 2014 for 2015
Recommendation
In 2013 Scientific Council advised that catches should not exceed the current catch level of 2 000 t, and there is no
basis to change this advice.
Management objectives
Scientific Council is aware of general management objectives specified in the Greenland Fisheries Act; how-
ever the contents of these have not been conveyed to the Council.
Advice is based on qualitative evaluation of biomass indices in relation to historic levels.
Management unit
The shrimp stock is distributed off East Greenland in ICES Div. XIVb and Va and is assessed as a single popu-
lation
Stock status
The stock size remained at a very low level in 2014 despite several years of very low exploitation rates.
18
16
14
Catch ('000 tons)
Catch
TAC
3.0
2.5
Std. CPUE (1987 = 1)
12
10
2.0
1.5
1.0
0.5
0.0
1978 1982 1986 1990 1994 1998 2002 2006 2010 2014
Year
8
6
4
2
0
1978 1982 1986 1990 1994 1998 2002 2006 2010 2014
Year
80
70
2.0
Survey Biomass Index
50
40
30
20
10
0
Std. effort (1987=1)
60
1.5
1.0
0.5
1978 1982 1986 1990 1994 1998 2002 2006 2010 2014
Year
0.0
1978 1982 1986 1990 1994 1998 2002 2006 2010 2014
Year
PDF to HTML - Convert PDF files to HTML files
1507467_0007.png
Reference points
No reference points have been established for this stock
Projections
Quantitative assessment of risk at various catch options is not possible for this stock at this time.
Assessment
No analytical assessment is available. Evaluation of stock status is based upon interpretation of commer-
cial fishery and research survey data.
Next full assessment is scheduled for 2015.
Human impact
Mainly fishery related mortality has been documented. Other sources (e.g. pollution, shipping, oil-
industry) are considered minor.
Biological and Environmental Interactions
Cod is an important predator on shrimp. The cod stock has been increasing in East Greenland waters in
recent years.
Fishery
Shrimp is caught in a directed trawl fishery. The fishery is regulated by TAC and bycatch reduction measures
include move on rules and Nordmøre grates.
Recent catches were as follows:
2007
4600
12400
12400
2008
2794
12400
12400
2009
4555
12400
12835
2010
3735
12400
11835
2011
1235
12400
12400
2012
2109
12400
12400
2013
1702
12400
12400
2014
1
609
2000
8300
1 To
July
NIPAG
SC Recommended
TAC
Enacted TAC
2014
Effects of the fishery on the ecosystem
Measures to reduce effects of the fishery on the ecosystem include move-on rules to protect sponges and
cold-water corals, and gear modifications to reduce damage to benthic communities.
Source of Information
SCR Doc. 14/057, 14/060
PDF to HTML - Convert PDF files to HTML files
Bilag 3:
c)
Harvest Control Rule (Item 7 of Annex II)
In connection with the certification of the West Greenland Cold Water Prawn Trawl Fishery, Denmark (on
behalf of Greenland) asks the NAFO Scientific Council to view the below suggested Harvest Control Rules to
be applied in the context of the present risk-based management of the fishery:
1. The management of the fishery must be based on long-term goals.
2. The total TAC should be set in such a way as to ensure that the estimated risk of the overall stock mor-
tality exceeding Fmsy does not exceed 35%.
3. The above 35% risk level must be maintained regardless of the estimated size of the stock relative to
Bmsy.
4. Efforts must be made to ensure that the TAC does not vary by more than a maximum of 12.5% from
year to year, either up or down.
Scientific Council is asked to assess whether the above proposed HCR, in relation to the management of the
West Greenland prawn fishery, are likely to maintain biomass in a safe zone above Bmsy, and to recommend
research studies that would improve its ability to make such an assessment.
The Council responded: Scientific Council is presently unable to determine whether the proposed HCR is sus-
tainable over the long term. In order to address this matter, SC
advises
that simulation studies can be under-
taken that can determine whether this and/or other candidate management plans will meet management goals,
but, before undertaking such studies, management goals need to be established and an acceptable risk of not
attaining them defined. These goals could include metrics of stock sustainability, fishery performance and
socio-economic factors
inter alia.
For example, if a long-term goal is to maintain biomass above the
B
msy
level, then the risk of the stock being
below
B
msy
after some predefined period must be agreed to and explicitly tested against the above rule or any
rules that could become part of the stock management plan.
Initial work was presented to Scientific Council in 2013 (SCR. Doc 13/055). Preliminary conclusions from
these experiments were:
Catch smoothing costs. Keeping the inter-annual change in catch small appears to reduce mean
catches and reduces mean biomass—i.e. is less safe. Even worse is unsymmetrical catch smoothing, a
policy under which catches can be increased when things look good but cannot be brought down
when they don’t. Such a policy tends to drive the stock into a hole from which it is eternally trying to
climb out.
Responsive HCRs aren’t so much the good idea that they appear to be at first sight. It looks as though
an unresponsive HCR which keeps to a fixed mortality risk regardless of the biomass risk is, under
most circumstances, at least as good if not better.
Conservative levels of mortality risk do give more safety and higher mean levels of biomass, but carry
a cost in lower mean catches. They appear to bring the CV of catch down a little bit. A conservative
level of mortality risk looks like something of a palliative to unsymmetrical catch smoothing, reducing
its worst effects. The effect of changing mortality risk is greater if assessments are imprecise, less if
assessments are precise. Might it therefore be useful to change the allowable mortality risk according
to the perceived level of uncertainty associated with the assessment?
A maintained mortality risk of 35% appeared to be low enough to keep stock levels safely at or above
B
msy
.
Scientific Council advises that work continues and that experience gained elsewhere in NAFO could be con-
sidered in this context.