Skatteudvalget 2013-14
SAU Alm.del Bilag 11
Offentligt
Danish versusDutch taxesWim SuykerProgrammeleader publicfinanceVisit of DanishParliamentarians23 September 2013CPB Netherlands Bureau for Economic Policy Analysis
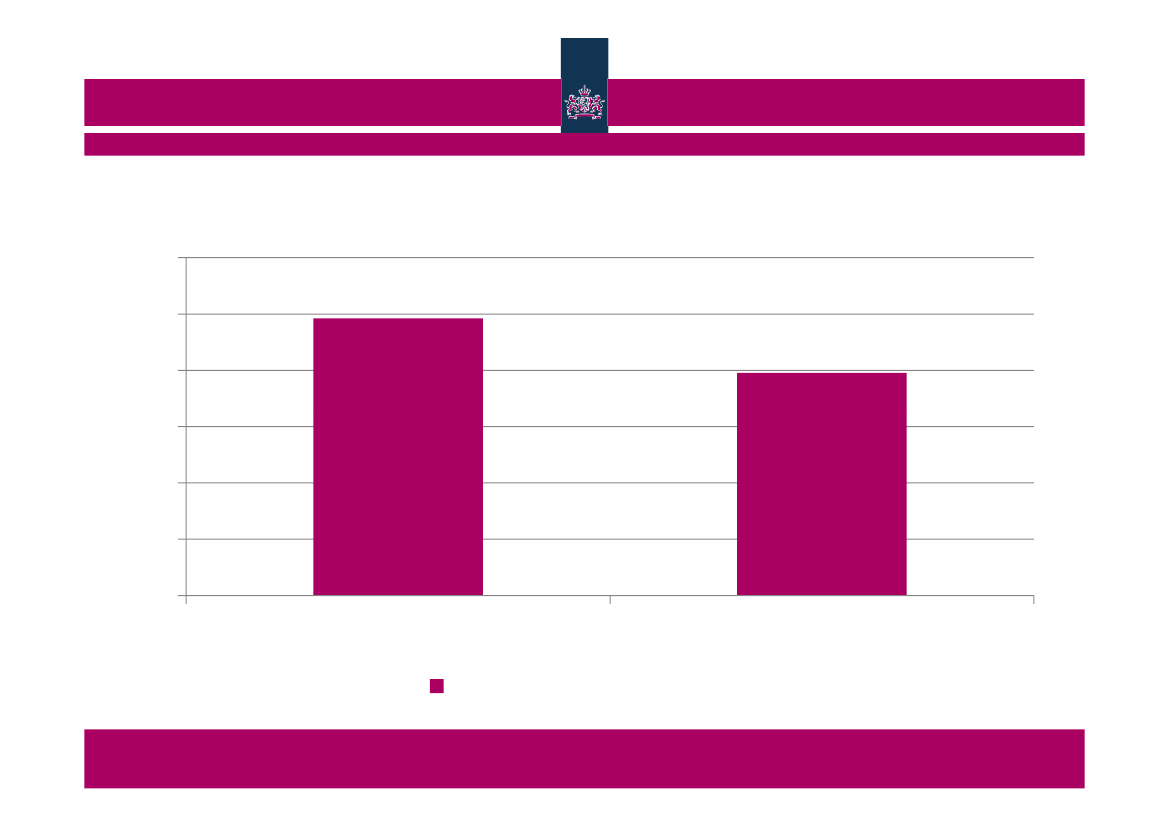
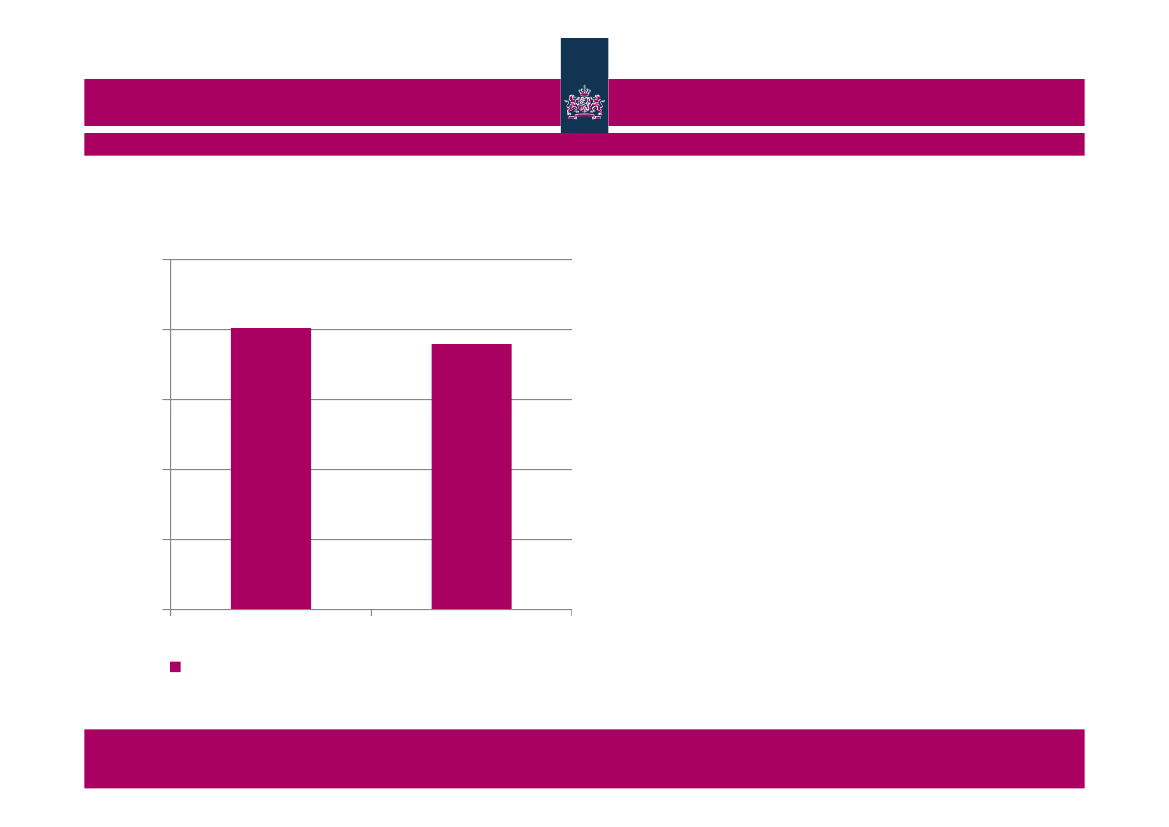
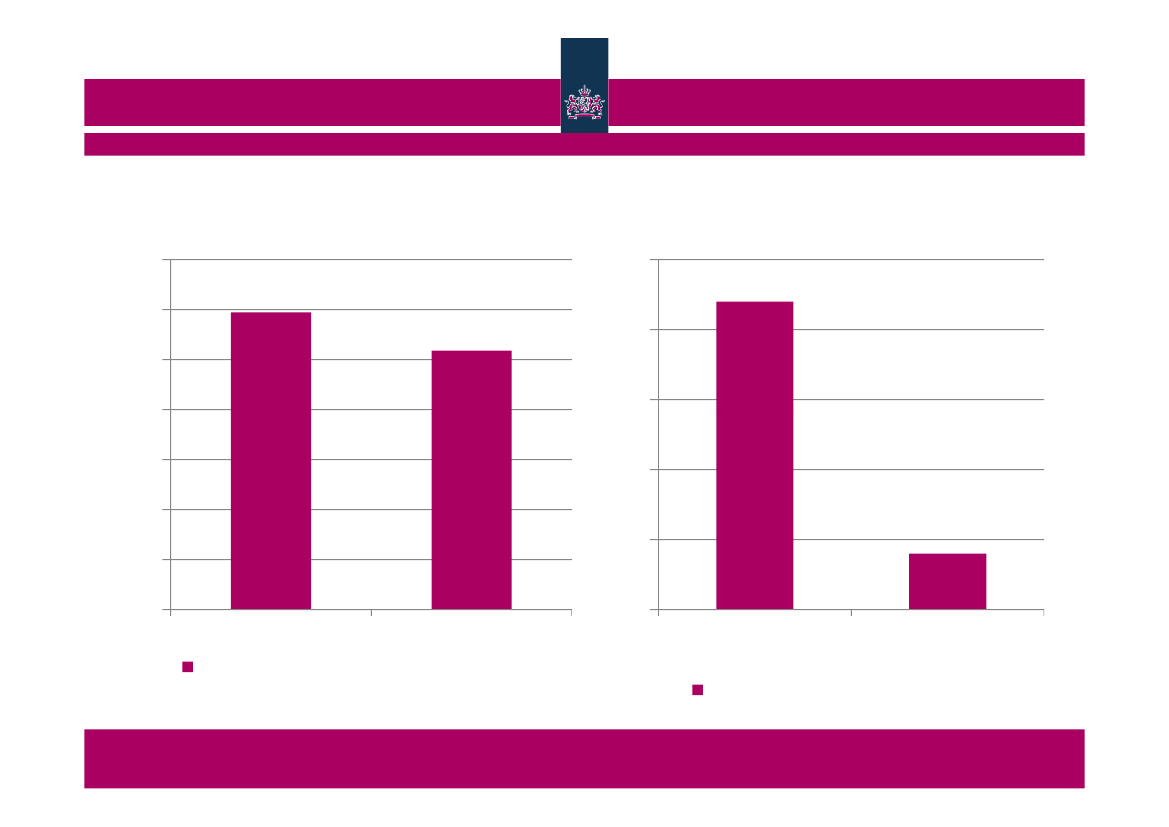
Danish tax burden 10% higher than in Netherlands6050403020100DenmarkNetherlandsTotal tax burden in 2012CPB Netherlands Bureau for Economic Policy Analysis
% GDP
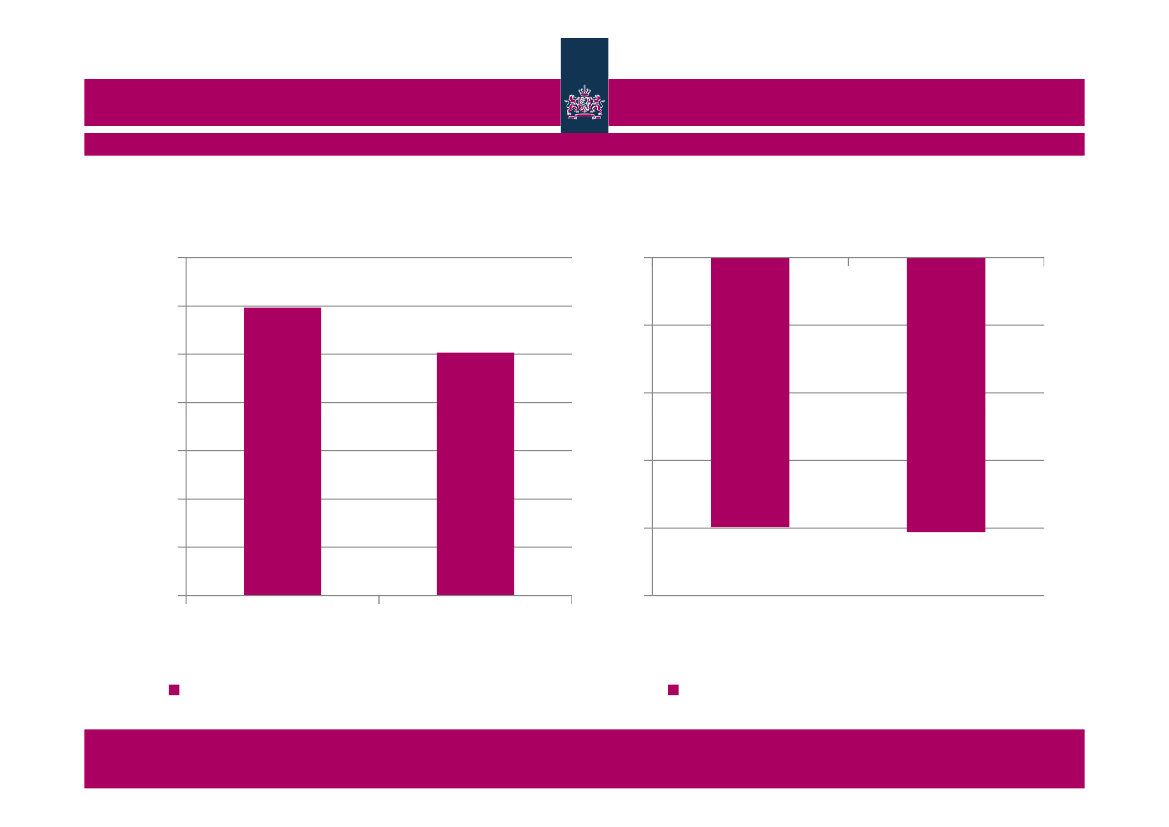
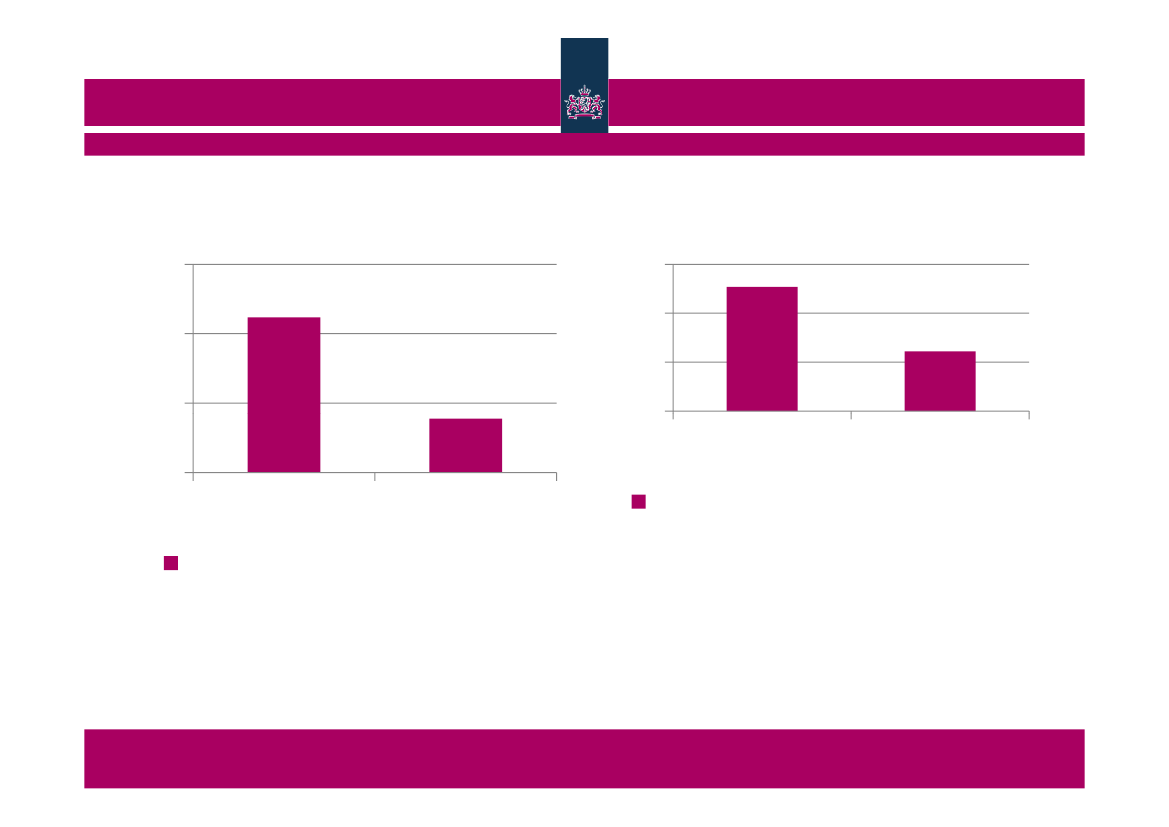
Higher burden related to higher outlays706050403020100DenmarkNetherlands-4% GDP% GDP
0-1-2-3
-5DenmarkNetherlands
Total government expenditure in 2012CPB Netherlands Bureau for Economic Policy Analysis
Net government lending in 2012
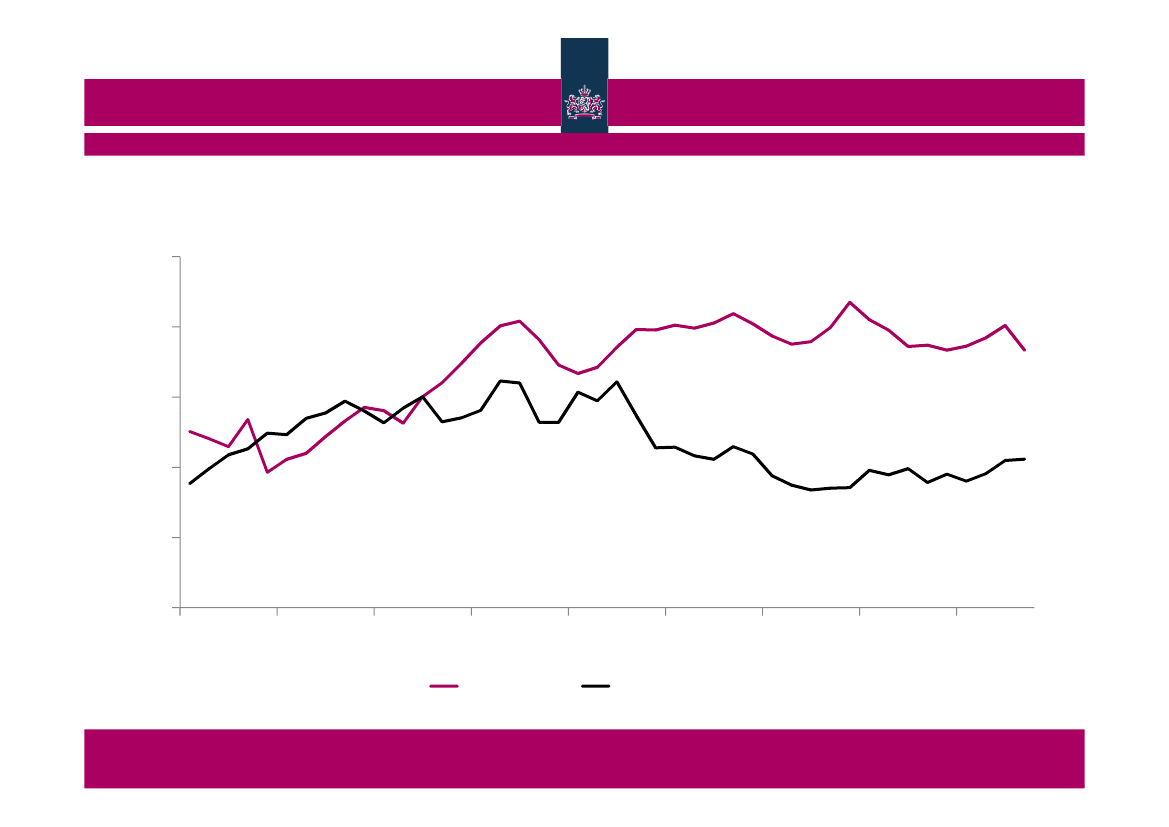
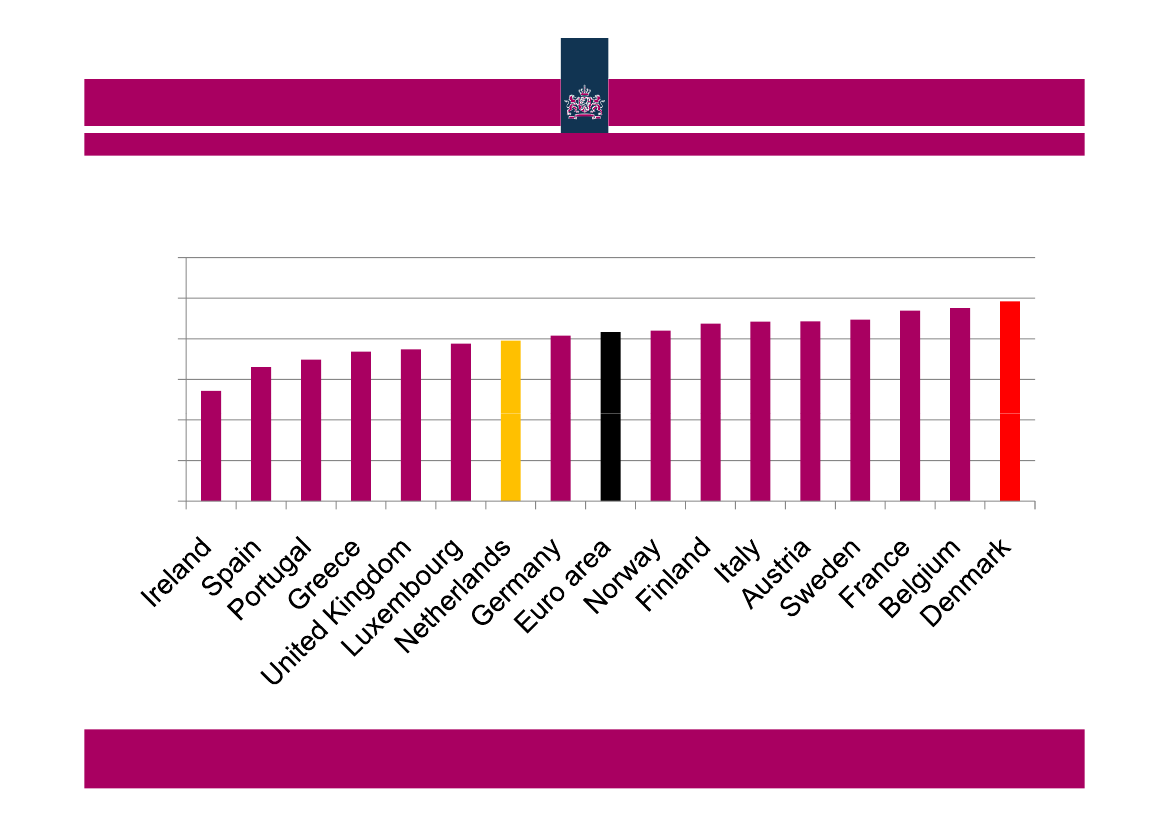
Danish tax burden exceeds since 1984555045403530197119761981198619911996Netherlands200120062011% GDP
Tax burden
Denmark
CPB Netherlands Bureau for Economic Policy Analysis
Denmark not only beats the Netherlands6050403020100% GDP
Total tax burden in 2012CPB Netherlands Bureau for Economic Policy Analysis
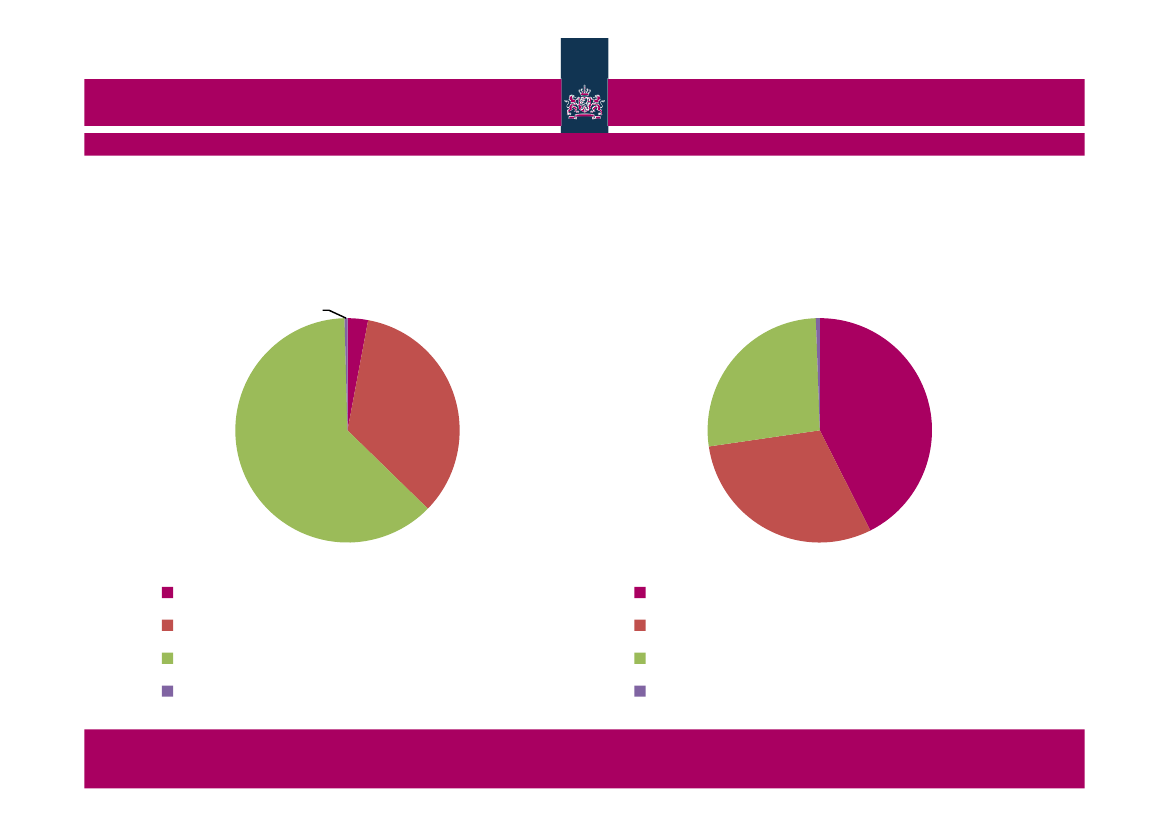
DK: bit more indirect; almost no soc. securityDenmark , shares in 20121%3%27%34%62%30%42%
Netherlands , shares in 20121%
Social security contributionsindirect taxesCurrent taxes on income and wealthCapital taxesCPB Netherlands Bureau for Economic Policy Analysis
Social security contributionsindirect taxesCurrent taxes on income and wealthCapital taxes
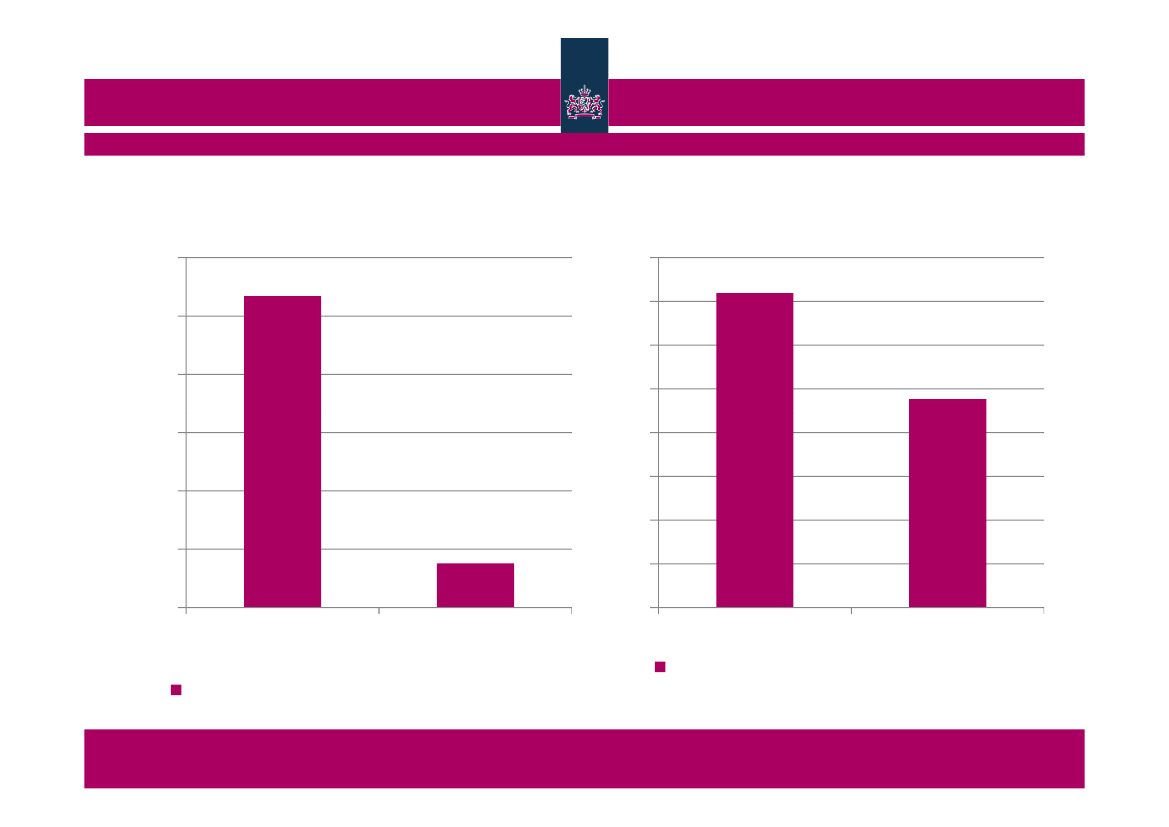
Huge difference in local taxes302520151050Denmark, 2010Netherlands, 2010Local share in total: Total tax revenueCPB Netherlands Bureau for Economic Policy Analysis
% total
80706050403020100
% total
Denmark, 2010Netherlands, 2010Local share in total: 4000 Taxes onproperty
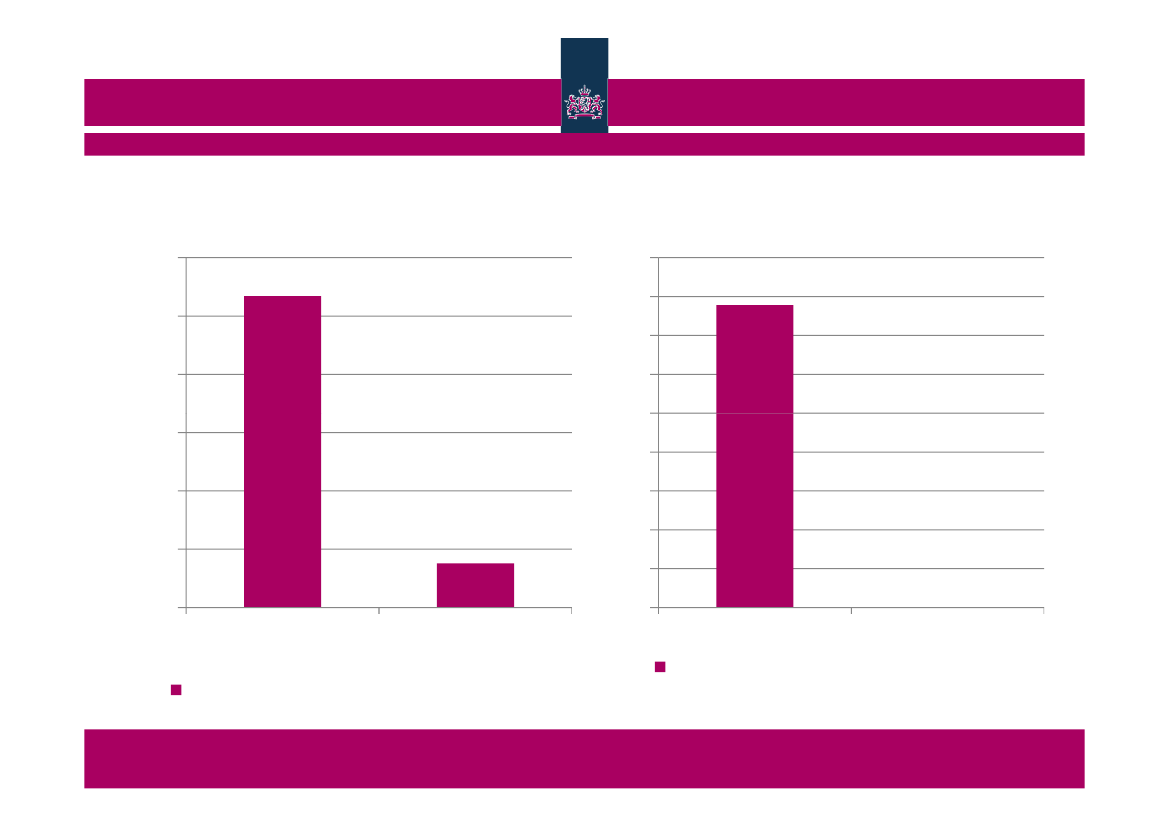
Huge difference in local taxes302520151050Denmark, 2010Netherlands, 2010Local share in total: Total tax revenueCPB Netherlands Bureau for Economic Policy Analysis
% total
454035302520151050
% total
Denmark, 2010Netherlands, 2010Local share in total: 1000 Taxes onincome, profits and capital gains
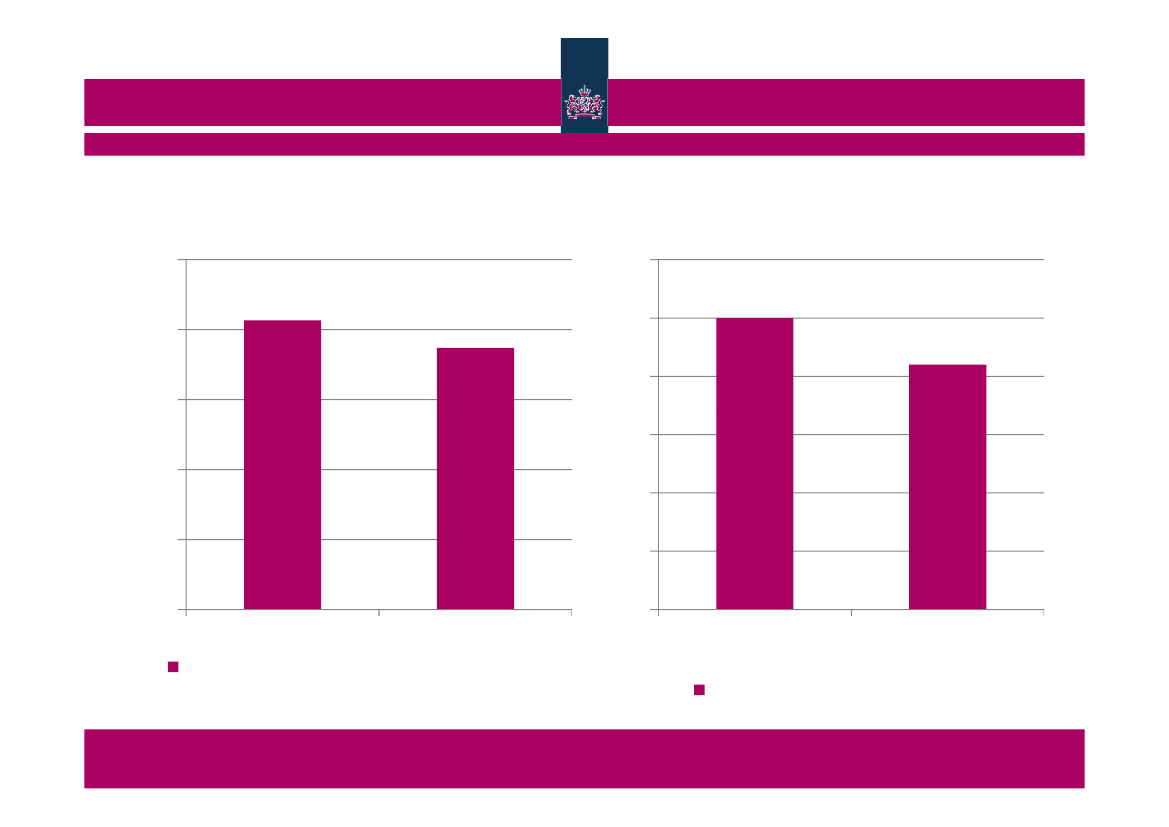
Direct taxes: DK higher average but lower marginal34323028DenmarkNetherlandsAverage tax wedge(%), 2012, Two-earnermarried couple, one at 100%of average earnings and theother at 33 %, 2 childrenCPB Netherlands Bureau for Economic Policy Analysis
0,90,80,70,6DenmarkNetherlandsIncrease in net income afteran increase of 1 currency unitin gross wages(%), 2012, Two-earnermarried couple, one at 100%of average earnings and theother at 33 %, 2 children
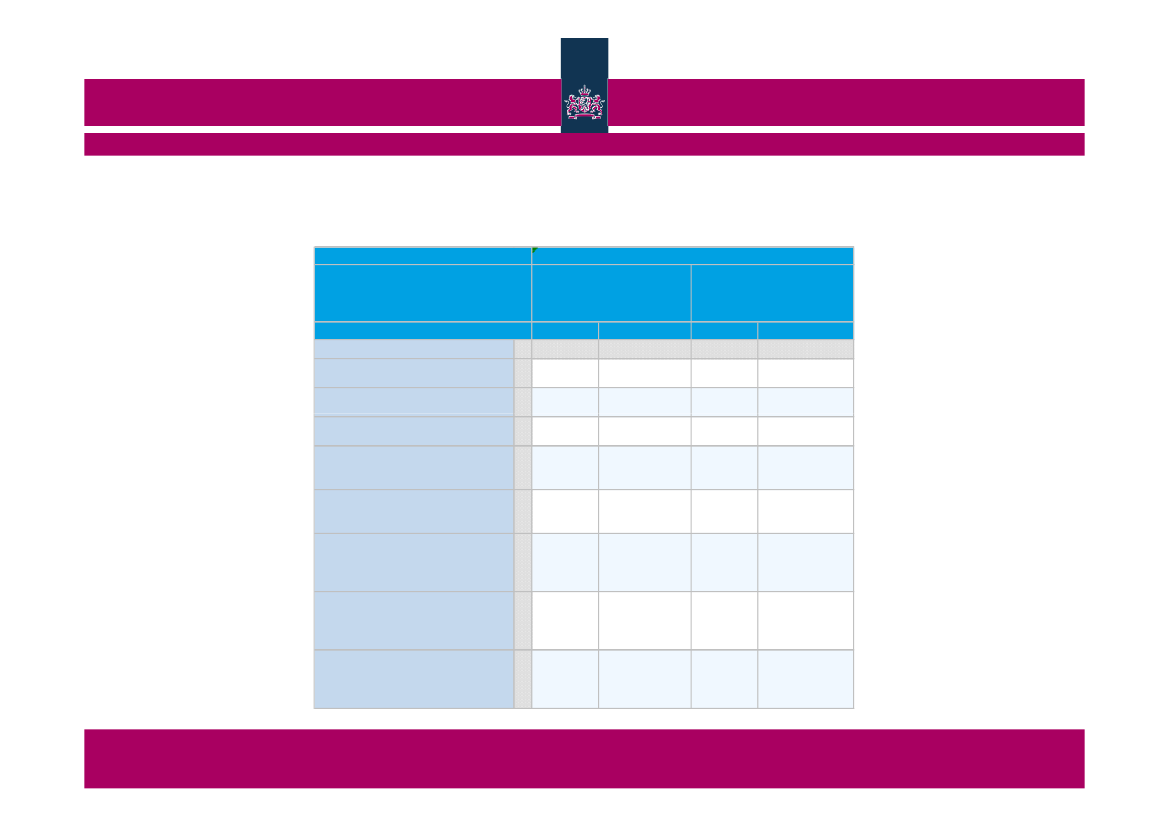
For all categoriesYearIndicatorCountryDenmarkFamily typeSingle person at 67% ofaverage earnings, no childSingle person at 100% ofaverage earnings, no childSingle person at 167% ofaverage earnings, no childSingle person at 67% ofaverage earnings, with twochildrenOne-earner married couple at100% of average earnings, 2childrenTwo-earner married couple, oneat 100% of average earningsand the other at 33 %, 2childrenTwo-earner married couple, oneat 100% of average earningsand the other at 67 %, 2childrenTwo-earner married couple, oneat 100% of average earningsand the other at 33 %, no child37.038.645.133.238.642.30.90.90.80.80.80.8Netherlands2012Average tax wedge (%)Increase in net incomeafter an increase of 1currency unit in grosswages (%)DenmarkNetherlands
11.7
11.2
0.7
0.5
27.8
32.0
0.8
0.6
32.5
29.6
0.9
0.7
34.2
31.8
0.9
0.7
37.2
34.5
0.9
0.8
CPB Netherlands Bureau for Economic Policy Analysis
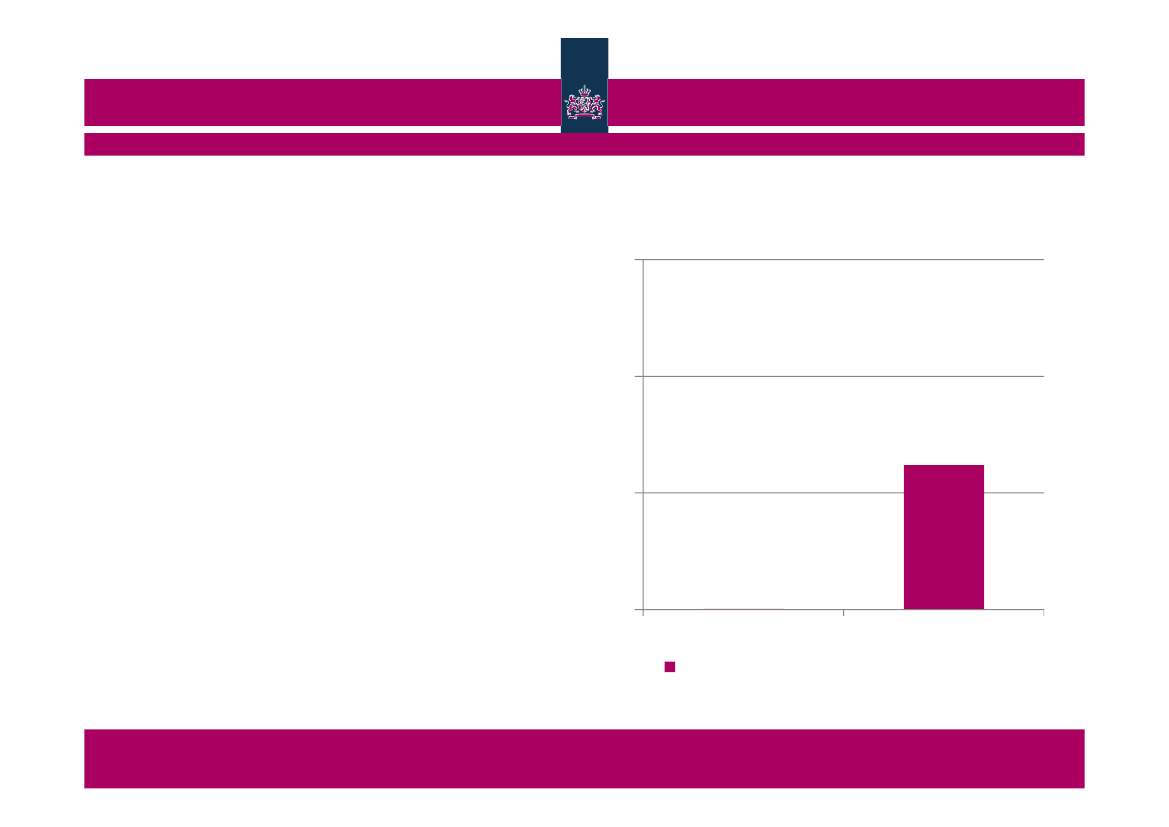
Property tax more or less comparable543210Denmark, 2010Netherlands, 20104000 Taxes on property, share in totaltaxesCPB Netherlands Bureau for Economic Policy Analysis
% total
Danish VAT a bit higher, no reduced rate!2520151050Denmark, 2010Netherlands, 20105111 Value added taxes, share in totaltaxesCPB Netherlands Bureau for Economic Policy Analysis
% total
302520151050Denmark (sinceNetherlands (since1992)2012)Standard VAT rate in 2013
Non-car excises somewhat more in Denmark76543210Denmark, 2010Netherlands, 20105121 Excises excluding car relatedexcises, share in total taxesCPB Netherlands Bureau for Economic Policy Analysis
% total
50403020100Denmark, 2010Netherlands, 2010Number of excises in 2010
No user charges in Denmark3% total
2
1
0Denmark, 2010Netherlands, 20105213 Other recurrent taxes (usercharges), share in totalCPB Netherlands Bureau for Economic Policy Analysis
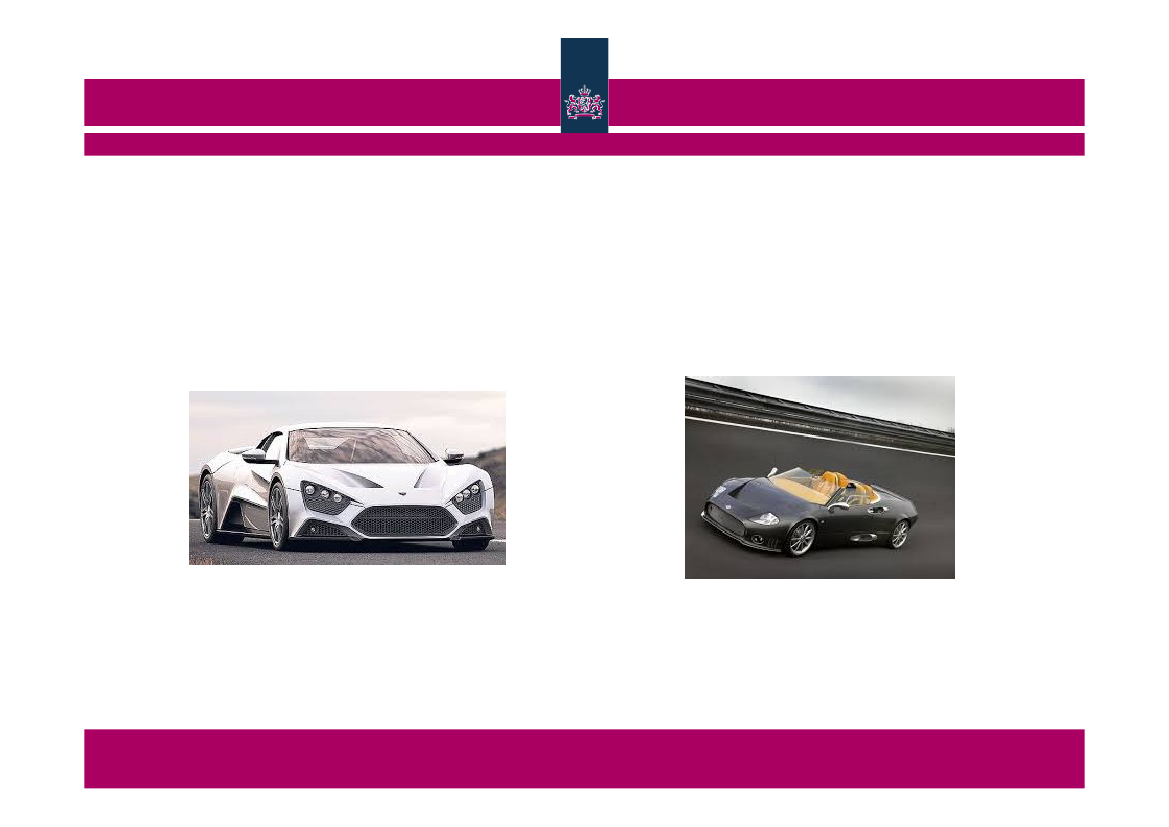
Finally: cars
Danish car: Zenvo
Dutch car: Spyker
CPB Netherlands Bureau for Economic Policy Analysis
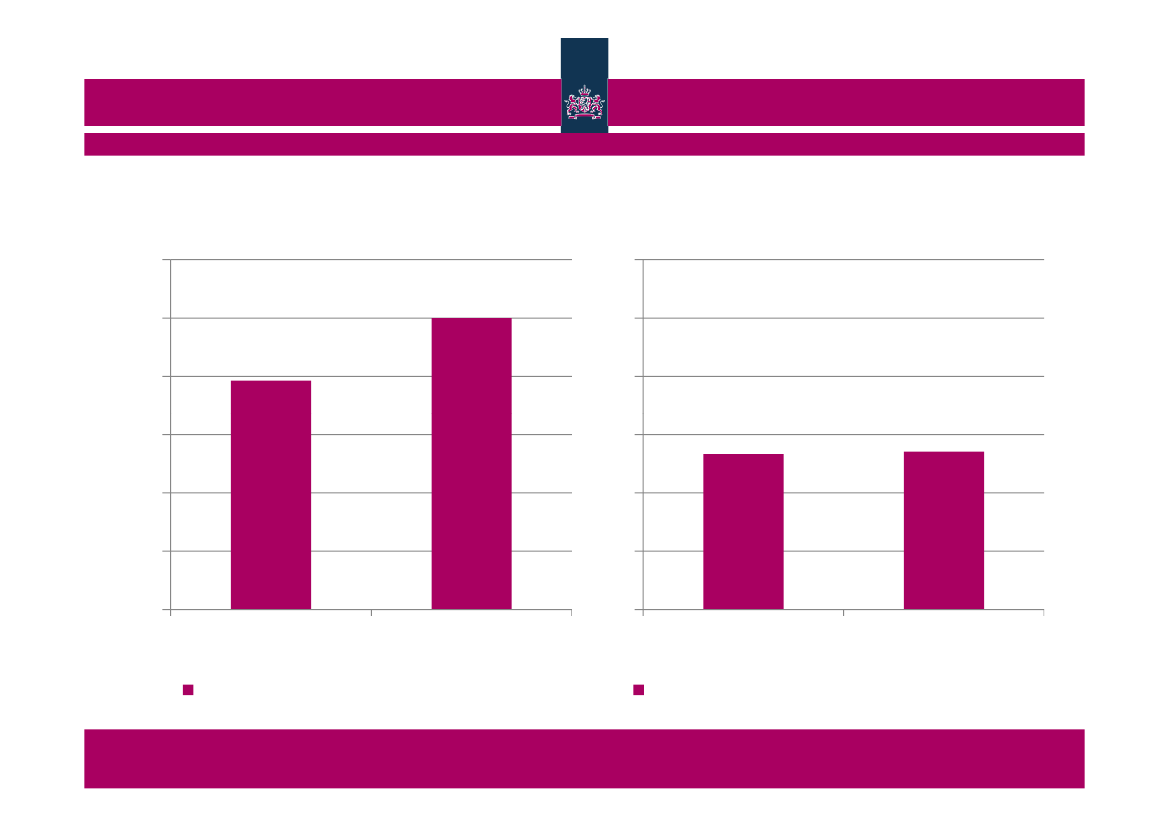
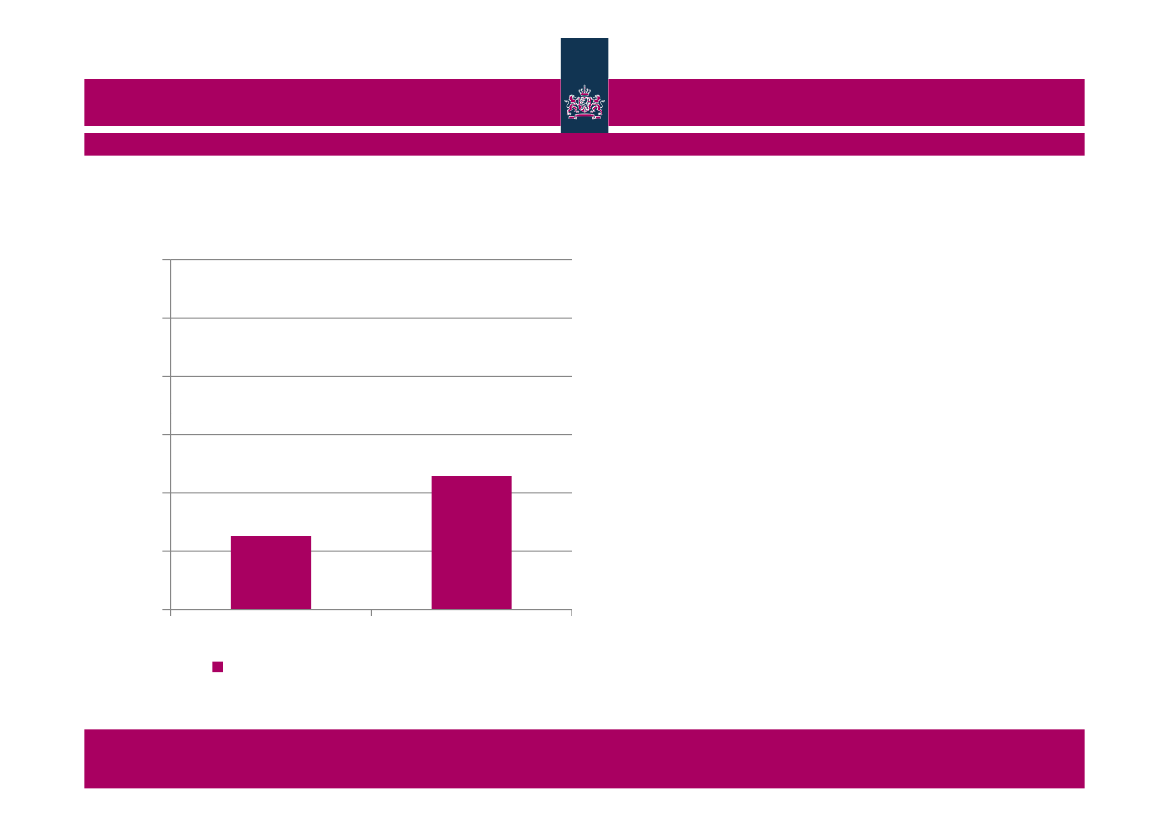
Denmark: smaller taxes on cars6543210Denmark, 2010Netherlands, 2010Total car taxes, share in total taxesCPB Netherlands Bureau for Economic Policy Analysis
% total
6543210
% total
Denmark, 2010
Netherlands, 2010
Car related excises, share in total taxes
Denmark: smaller taxes on cars6543210Denmark, 2010Netherlands, 20105211+5212 Taxes on motorvehicles, share in total taxesCPB Netherlands Bureau for Economic Policy Analysis
% total
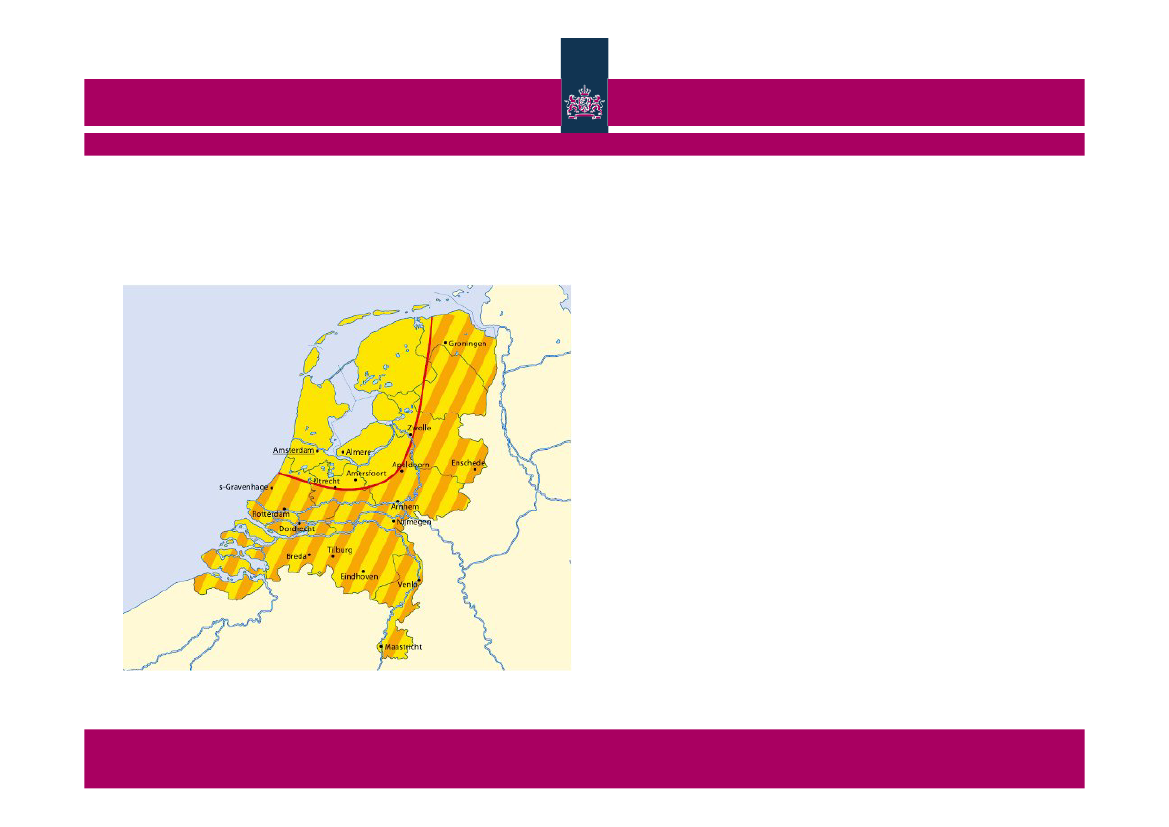
Dutch excises (petrol,tobacco, liquor) at maximum?
•Break-even line for buyingabroad:–1 carton cigarettes.–24 bottles beer–1 whole tank of petrol(Taking into travel costs, but notcosts travel time)
CPB Netherlands Bureau for Economic Policy Analysis
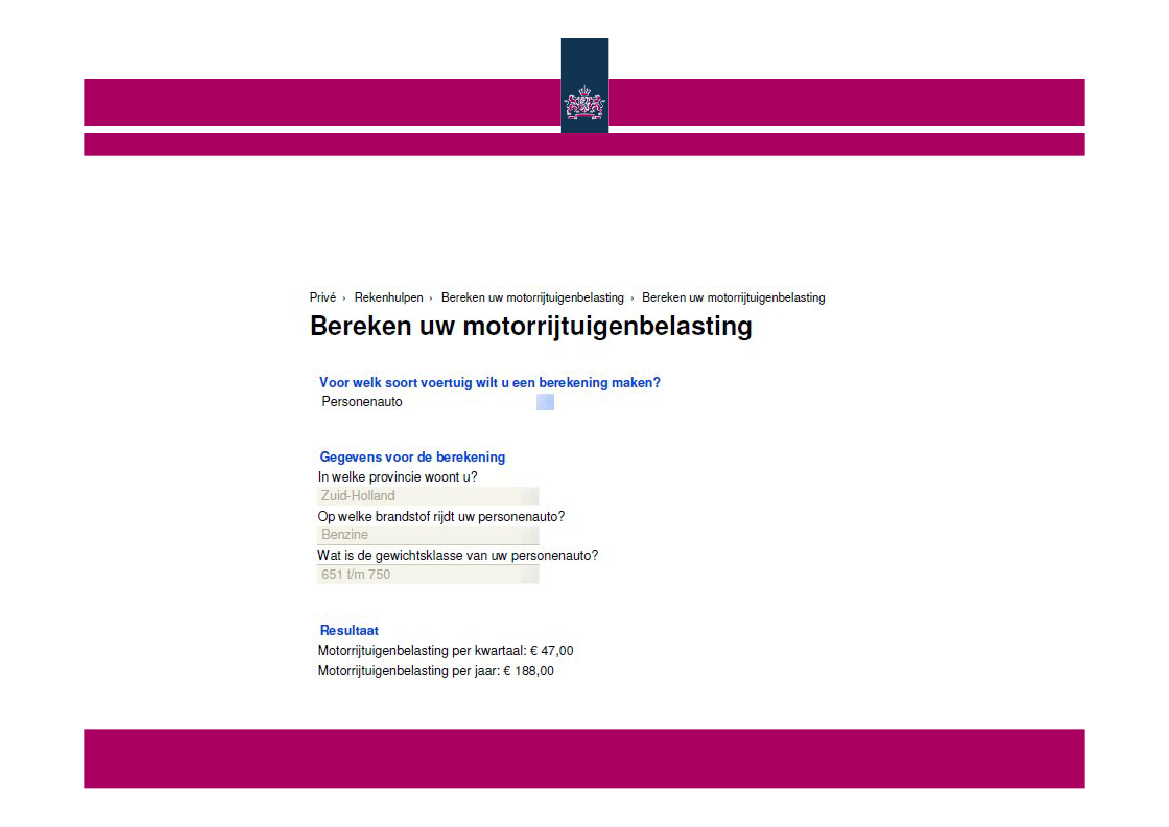
MRB (annual motor vehicle tax) depends onweight
•(Highly non-polluting cars aretax exempt up to January 2014)CPB Netherlands Bureau for Economic Policy Analysis
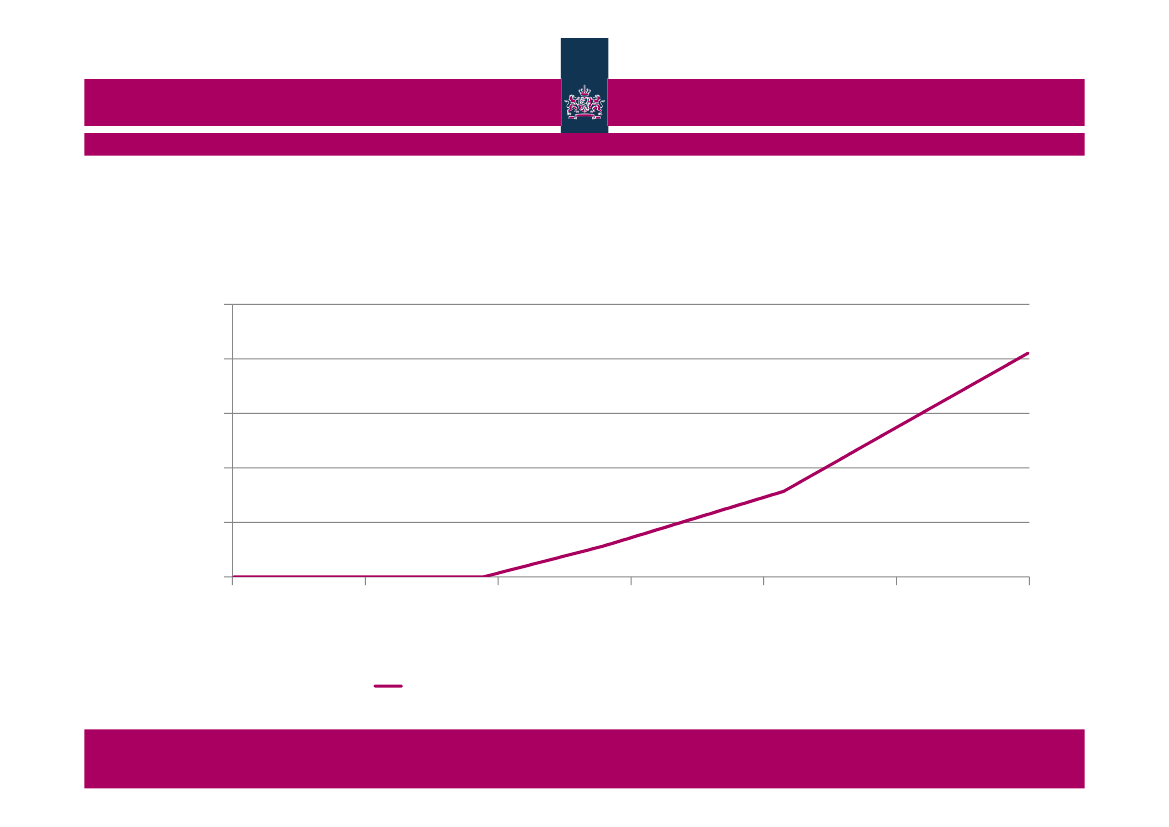
BPM (special motor vehicle tax for new cars)depends on CO2 emission (indexed)50000400003000020000100000151101151201251CO2 gr/kmBPM 2013 in euros gasoline carCPB Netherlands Bureau for Economic Policy Analysis
euros
Heavy policy debate on car taxes in recent years
CPB Netherlands Bureau for Economic Policy Analysis
Thank you and have a good mission here
CPB Netherlands Bureau for Economic Policy Analysis