Miljøudvalget 2013-14
MIU Alm.del Bilag 148
Offentligt
Danish Wind Industry AssociationDanish Wind Turbine Owners' Association
Low Frequency Noise from Wind Turbines: Do theDanish Regulations Have Any Impact?An analysis of noise measurements.January 2014
PublishedProjectPreparedChecked
::::
9 January 201435.6418.03Bo SøndergaardPeter Henningsen
AcousticaDusager 128200 Aarhus NDanmarkTlf.Direkte tlf.Mobiltlf.+45 8210 5100+45 8210 5149+45 2723 5149WebE-mailFile
Akustik ¶ Støj ¶ Vibrationer
www.grontmij.dkCVR-nr. 48233511[email protected]Report Low frequency noise from wind turbines.docx
Page 1FOREWORDAt the wind turbine noise conference in Denver 28-30 august 2013 Bo Søndergaard fromGrontmij’s acoustics department, Acoustica, presented results from an investigation of old andnew measurements of noise from wind turbines [1]. As this investigation was made withoutany funding with the purpose to present most recent findings at the conference no formalreporting was made at that time. Danish Wind Industry Association and Danish Wind TurbineOwners' Association have asked Grontmij if it was possible to publish a documentation of thefindings from the presentation in Denver.This report is a more detailed documentation of the presentation from Denver. The reporting ispaid for by the Danish Wind Industry Association and Danish Wind Turbine Owners'Association, but the results are from the independent investigation made by Grontmij at theirown expense.The acoustics department at Grontmij in Denmark, Acoustica, is an independent consultancywith a long history for working for industrial clients, environmental authorities, organisationsand private clients. As a guarantee for independency and quality Acoustica holds anaccreditation from the Danish Accreditation, DANAK for testing in the field of noise andacoustics.Grontmij A/S
Bo SøndergaardAcoustica
r:\projects\aar\35\35641803\06_output\report low frequency noise from wind turbines.docx
Page 2SUMMARYFor several years the concern that low frequency noise from wind turbines could cause seriousannoyance for neighbours to wind turbines has been a dominant factor in the public debate inDenmark. From the beginning of 2012 the Danish regulations were revised and a criteria forthe amount of in-door low frequency noise was introduced. Results from new and oldmeasurements of noise from mainly Danish produced wind turbines are analysed andcompared with the Danish regulations for noise and low frequency noise. In most cases lowfrequency noise is not the decisive parameter for Danish wind farms to comply with the Danishregulations. The new data in the analysis are from existing wind turbine projects and seriesproduced wind turbines excluding dedicated prototypes.The purpose of the analysis is to investigate whether the new Danish regulation on lowfrequency noise have had any impact on the emitted low frequency noise and the lowfrequency noise at the neighbours or not. The wind farm examples do not give a clear answerto that. However it indicates that the situation has not changed and that the amount of lowfrequency noise at the residents is the same as for wind farms with smaller and/or older windturbines.The analysis of the sound power levels and sound power spectra gives more information.Analysis of the sound power spectra shows that after 2010, where it was known that lowfrequency regulations were likely to be introduced, the relative amount of noise in thefrequency range from 100 to 400 Hz is reduced. This includes the important part of the lowfrequency range from 100 Hz to 160 Hz. Whether this is because of the Danish regulation isnot possible to say, but it is likely, that the regulation has increased the focus on this in thedesign phase. From the measurements it can be seen, that the low frequency tones, whichwere a significant part of low frequency noise in [2], [3], [4], [5] and [6] are reduced for seriesproduced wind turbines.In general the analysis shows that the development of low frequency noise with size do notfollow the conclusions from the analyses in [4], [5] and [6]. The analysis show that on averagethe amount of low frequency noise is the same for large and small wind turbines relative to thetotal noise level and that the amount of low frequency noise for new large wind turbines is lessthan for old large wind turbines relative to the total noise level.The analysis is based on a larger number of measurement reports than previous analyses andexperiences from post construction documentation. The results may change with inclusion ofnew data, but the conclusions are in line with the general conclusions in [2] and [3], where theresults were influenced by prototype wind turbines. There is a large variation in sound powerlevels and sound power spectra within each group of wind turbines used in the analysis and itis important to check the details for each wind farm project already in the planning phase.
r:\projects\aar\35\35641803\06_output\report low frequency noise from wind turbines.docx
Page 3SUMMARY IN DANISHI adskillige år har bekymringen om, at lavfrekvent støj fra vindmøller kunne give anledning tilvæsentlig gene i omgivelserne, været en dominerende del af den offentlige debat i Danmark.Ved starten af 2012 blev der indført nye regler for støj fra vindmøller og grænseværdier forlavfrekvent støj blev indført. Resultater fra nye og gamle målinger af støj fra primært danskproducerede vindmøller er blevet analyseret og sammenlignet med de danske regler for støjog lavfrekvent støj. I de fleste tilfælde er det ikke den lavfrekvente del af støjen, der erafgørende for om et projekt kan overholde de danske regler. Data der indgår isammenligningen er fra eksisterende vindmølleprojekter og serie producerede vindmøller.Dedikerede prototyper er udeladt fra analyserne, da de ikke vurderes at være repræsentativefor de opstillede vindmøller.Formålet med analysen er at undersøge, om de nye regler for lavfrekvent støj har haftindflydelse på den udsendte lavfrekvente støj fra vindmøllerne og den lavfrekvente støj vednaboerne. Analyserne, baseret på vindmølleparker, giver ikke noget entydigt svar, men det serud til at forholdene ikke er ændret væsentligt og at andelen af lavfrekvent støj er af sammestørrelsesorden som for vindmølleparker med mindre og/eller ældre vindmøller.Analysen af lydeffektniveauer og lydeffektspektre giver mere detaljeret information. Analysenaf lydeffektspektre viser, at efter 2010, hvor det var kendt at der ville komme grænser forlavfrekvent støj, er den relative andel af støj i frekvensområdet fra 100 Hz – 400 Hz reduceret.Dette omfatter den væsentlige del af det lavfrekvente frekvensområde fra 100 Hz til 160 Hz.Hvorvidt dette skyldes indførelse de nye grænseværdier, er det ikke muligt at sige, men det ersandsynligt, at reglerne har øget fokus på lavfrekvent støj i designfasen. Det er Grontmij’serfaring, at de lavfrekvente toner, som var en væsentlig del af den lavfrekvente støj i [2], [3],[4], [5] og [6], er reduceret for de seriefremstillede vindmøller.Overordnet viser analysen, at udviklingen af lavfrekvent støj med størrelsen af vindmøllerneikke følger forudsigelserne fra analyserne i [4], [5] og [6], men at små og store vindmøller igennemsnit har samme andel af lavfrekvent støj relativt til den samlede støj og at nye storevindmøller har en mindre andel af lavfrekvent støj end ældre store vindmøller relativt til densamlede støj.Analyserne er baseret på et større antal målerapporter end tidligere analyser, samt erfaringermed eftervisning af forholdene efter opstilling af vindmølleparker. Resultaterne kan ændre sigmed inkludering af yderligere data, men konklusionerne er i overensstemmelse med deoverordnede konklusioner in [2] and [3], hvor resultaterne var væsentligt påvirket af resultaterfra prototype vindmøller. Der er stor variation i lydeffektniveauerne og lydeffektspektrene i deenkelte grupper af vindmøller og det er derfor vigtigt at vurdere detaljerne for de enkeltevindmølleprojekter allerede i planlægningsfasen.
r:\projects\aar\35\35641803\06_output\report low frequency noise from wind turbines.docx
Page 4TABLE OF CONTENTSFOREWORDSUMMARYSUMMARY IN DANISH122.12.233.13.245INTRODUCTIONINVESTIGATIONSNoise from wind farms.Noise emission from wind turbines.OTHER CONSIDERATIONSType of regulationNoise as a function of distanceCONCLUSIONSREFERENCESPAGE12355671313161718
r:\projects\aar\35\35641803\06_output\report low frequency noise from wind turbines.docx
Page 5
1
INTRODUCTION
Around 2004 – 2005 low frequency noise from wind turbines became a major concern in thepublic in Denmark. There was a worry that larger wind turbines would emit substantially morelow frequency noise than the wind turbines people knew already. As this had consequencesfor the development of on-shore wind energy the Danish energy authorities initiated aninvestigation into the topic. The results were reported in [2] and [3] by DELTA and analternative interpretation were reported by the acoustics department at the University ofAalborg [4], [5] and [6]. In December 2011 the Danish regulations on wind turbine noise wererevised and noise criteria was introduced for the in-door low frequency noise. Details on theregulations and the background can be seen in [7]. Sørensen presented some of theconsequences for the planning process in [8].In short the Danish regulation introduces a set of noise criteria as well as a method forassessing the criteria through measurements and predictions. The noise limits are describedin the Statutory order 1284 of 15 December 2011 from the Danish ministry of the environment[7] as follows:The total noise impact from wind turbines may not exceed the following limit values:1) At the most noise-exposed point in outdoor living area no more than 15 metres from dwellings in opencountryside:(a) 44 dB(A) at a wind speed of 8 m/s.(b) 42 dB(A) at a wind speed of 6 m/s.2) At the most noise-exposed point in areas with noise-sensitive land use:(a) 39 dB(A) at a wind speed of 8 m/s.(b) 37 dB(A) at a wind speed of 6 m/s.The total low-frequency noise from wind turbines may not exceed 20 dB at a windspeed of 8 and 6 m/s indoors in dwellings in open countryside or indoors in areas with noise sensitive land userespectively.
2
INVESTIGATIONS
The question now is; do the new regulations have any impact on low frequency noise fromwind turbines and how can it be checked. As the neighbours are the main objective for thenew regulations, a set of wind farm projects, where Grontmij has been involved in the postconstruction documentation of noise were reviewed. Another parameter which has been usedas an indicator is the sound power level and specially the sound power spectra of the windturbines. An analysis based on Grontmij’s database on wind turbines has been made to see ifthere is a development.The database consists of the original data from [1] except for the specific prototype windturbines. Measurement reports from the archives of Acoustica ranging back to 1988 areincluded and supplemented with new measurements from 2010 to 2013.
r:\projects\aar\35\35641803\06_output\report low frequency noise from wind turbines.docx
Page 62.1Noise from wind farms.
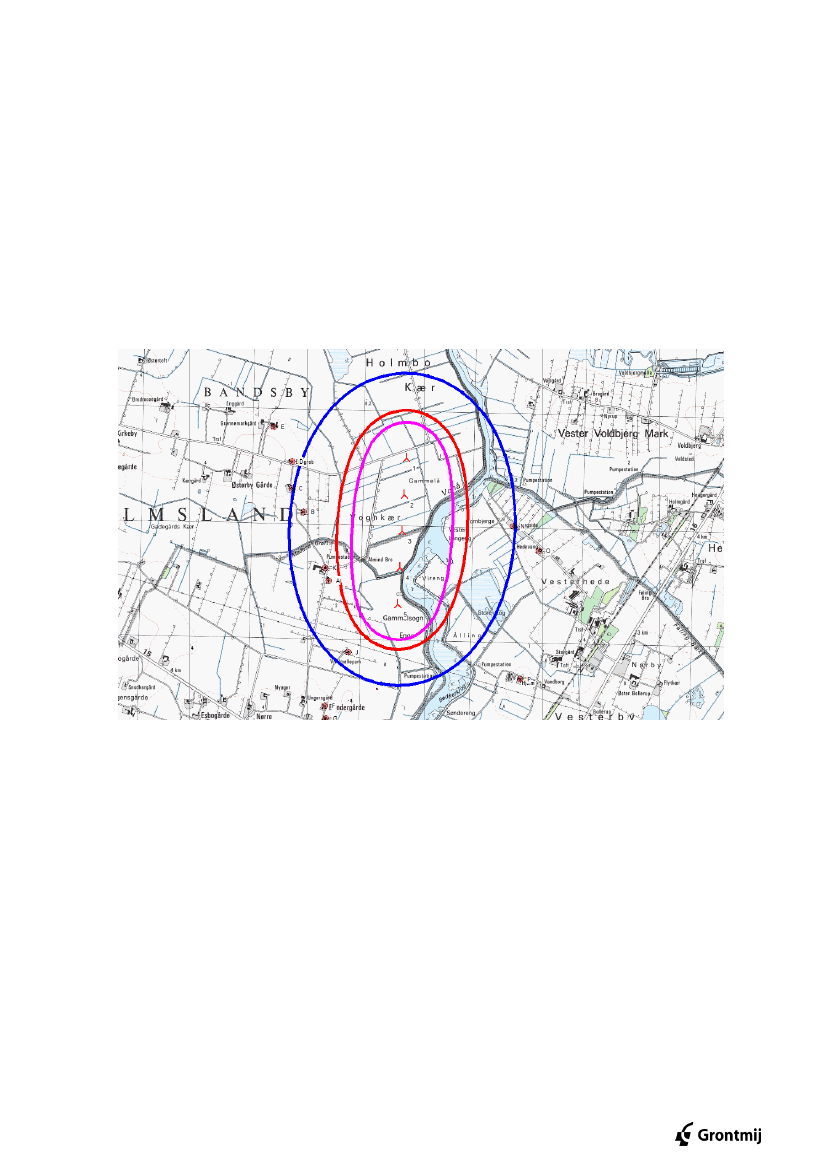
As an independent consultancy Grontmij is often involved in post construction documentationof noise from wind farms. In Denmark this includes determination of the sound power level ofindividual wind turbines and prediction of the noise in the surroundings. In Figure 1 the noisecontours, representing the noise limits, around a wind farm is shown. The blue line is 39dB(A), the red line is 44 dB(A) and the pink line is 20 dB(A) indoor low frequency noise, all at 8m/s. Typically for the projects Grontmij has seen, the pink curve for low frequency noise isenclosed by the other curves indicating that low frequency noise is not the decisive parameteron whether the noise requirements are met or not.
Figure 1. Typical noise contours for a Danish wind farm at 8 m/s. The blue line is 39 dB(A), thered line is 44 dB(A) and the pink line is 20 dB(A) indoor low frequency noise.
In Table 1 results from noise predictions for 6 wind farms according to the Danish regulationsare shown. The first 3 projects are planned and erected before the regulations on lowfrequency noise were introduced. The last 3 were planned with the new regulations as adesign criteria. Project no. 3 is actually a much older project with new measurements made in2013, allowing for a comparison with the new criteria. The numbers in the parenthesis showthe margin to the noise criteria. For the normal noise the margin is typically up to 2 dB, while itis in the range of 3 to 7 dB for low frequency noise. This again indicates that it is the “normal”noise which is the decisive parameter and not the low frequency noise.From these limited data it is difficult to conclude on the difference between older and newerprojects, but it looks like low frequency noise from new and old projects is of the same order atthe neighbours.
r:\projects\aar\35\35641803\06_output\report low frequency noise from wind turbines.docx
Page 7ProjectWind TurbinesDistance [m]1234566 V90-3MW6 SWT 2,3-933 600 kW WTG5 SWT 3.0-1013 V112-3MW3 SWT 3.0-101Noise criteria656700304587810574Neighbour with highest noise levelLpA(6 m/s)LpA,LF(6 m/s)LpA(8 m/s)[dB][dB][dB]39,9 (2,1)14,8 (5,2)42,6 (1,4)41,1 (0,9)14,4 (5,6)43,3 (0,7)41,2 (0,8)12,7 (7,3)42,7 (1,3)42,6 (-0,6)13,7 (6,3)43,5 (0,5)36,3 (0,7)11,0 (9,0)37,9 (1,1)41,4 (0,6)12,5 (7,5)42,1 (1,9)42/372044/39
LpA,LF(8 m/s)[dB]17,3 (2,7)16,8 (3,2)14,4 (5,6)16,1 (3,9)12,7 (7,3)14,9 (5,1)20
Table 1. Main results from typical wind farm projects in Denmark. The numbers in parenthesisshow the margin to the noise criteria. For project 4 at 6 m/s the noise is above the noise criteria.It is allowed for owners and part owners to exceed the noise criteria at their own residence. Notethat the neighbour with the highest noise level is not always the neighbour with the shortestdistance. For some of the projects the nearest neighbour are at a shorter distance with lowernoise levels.
2.2
Noise emission from wind turbines.
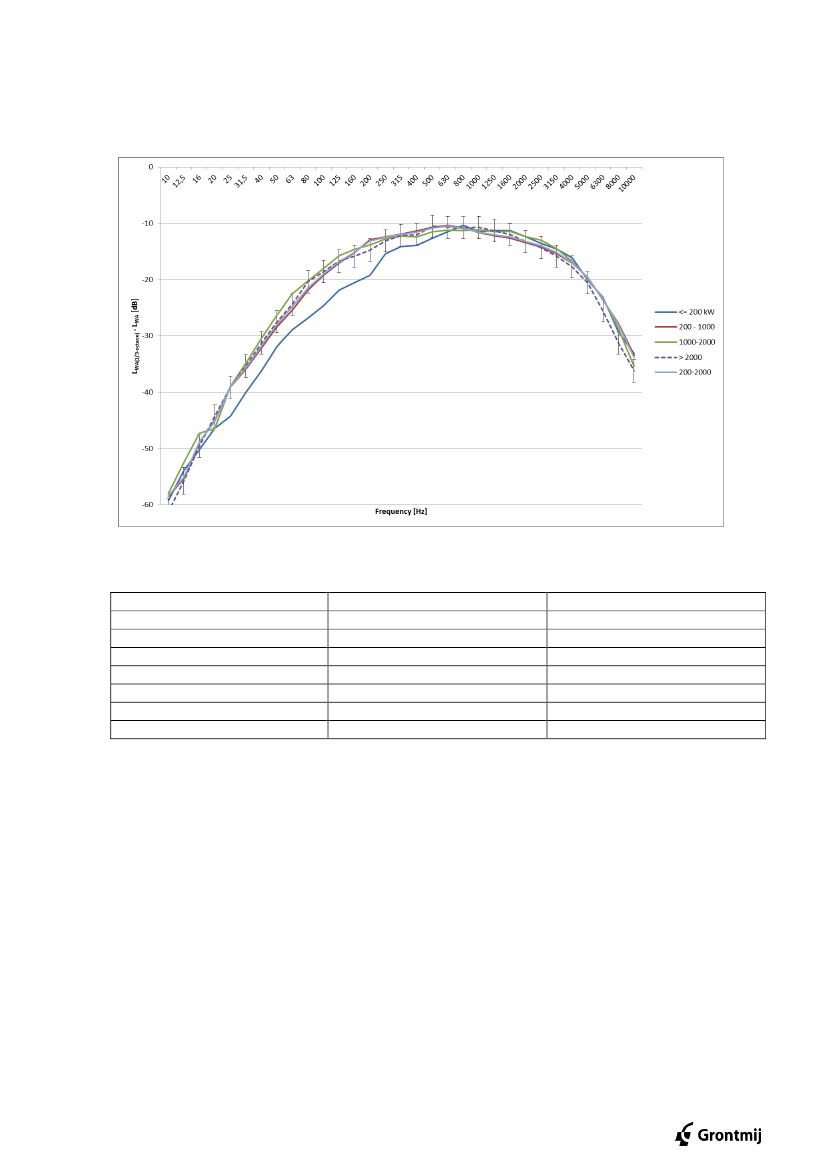
Much of the discussion so far has been based on sound power levels of the wind turbines andwhether the wind turbines generate more low frequency noise when the size increases. Forthis review an analysis based on 213 measurement reports is made. All the original data fromthe project in [1] are included, except for the 4 prototype wind turbines. Data are supplementedwith older measurement reports from the archives at Grontmij, where 1/3-octave band datawere available, and new measurement reports. The reports represent wind turbines rangingfrom a few kW to the newest version of MW turbines and give the sound power spectrum at 8m/s at 10 m height.The analysis is based on the same principles as in [2] to [6] but on a much better statisticalbasis with 213 measurement reports, with only 65 measurement reports in the previousanalyses e.g. [5]. As the new data also includes older types of stall regulated wind turbineswith a nominal power between 2000 kW and 3000 kW sorting of data is a little different. Thedata are sorted into 4 groups: ≤ 200 kW, ]200 kW – 1000 kW], ]1000 – 2000 kW], >2000 kW,>2000 kW old types and >2000 kW new types. This makes it possible to evaluate new largewind turbines compared to wind turbines designed and erected before the investigation in[2][1] and [3] was published. For comparison with previous investigations the group ]200 kW –2000 kW] is included The spectra are normalised to LWAof the individual wind turbine beforeaveraging. A comparison of the averaged spectra for each class can be seen in Figure 2 andthe number of spectra in each class can be seen in Table 2.
r:\projects\aar\35\35641803\06_output\report low frequency noise from wind turbines.docx
Page 8
Figure 2. Normalized apparent sound power levels in one- third-octave bands. Mean of groups ofwind turbines. Error bars show � 95 % confidence interval around the mean in every 1/3-octaveband for the group > 2000 kW.
Group≤ 200 kW]200 kW – 1000 kW]]1000 kW – 2000 kW]> 2000 kW]200 kW – 2000 kW]> 2000 kW new> 2000 kW old
Number of spectra1610827621353428
Number of spectra at 10 Hz551276234
Table 2 Number of spectra in each group. As not all measurements are covering the entirefrequency range the count of spectra including the 10 Hz 1/3-octave band is shown as well.
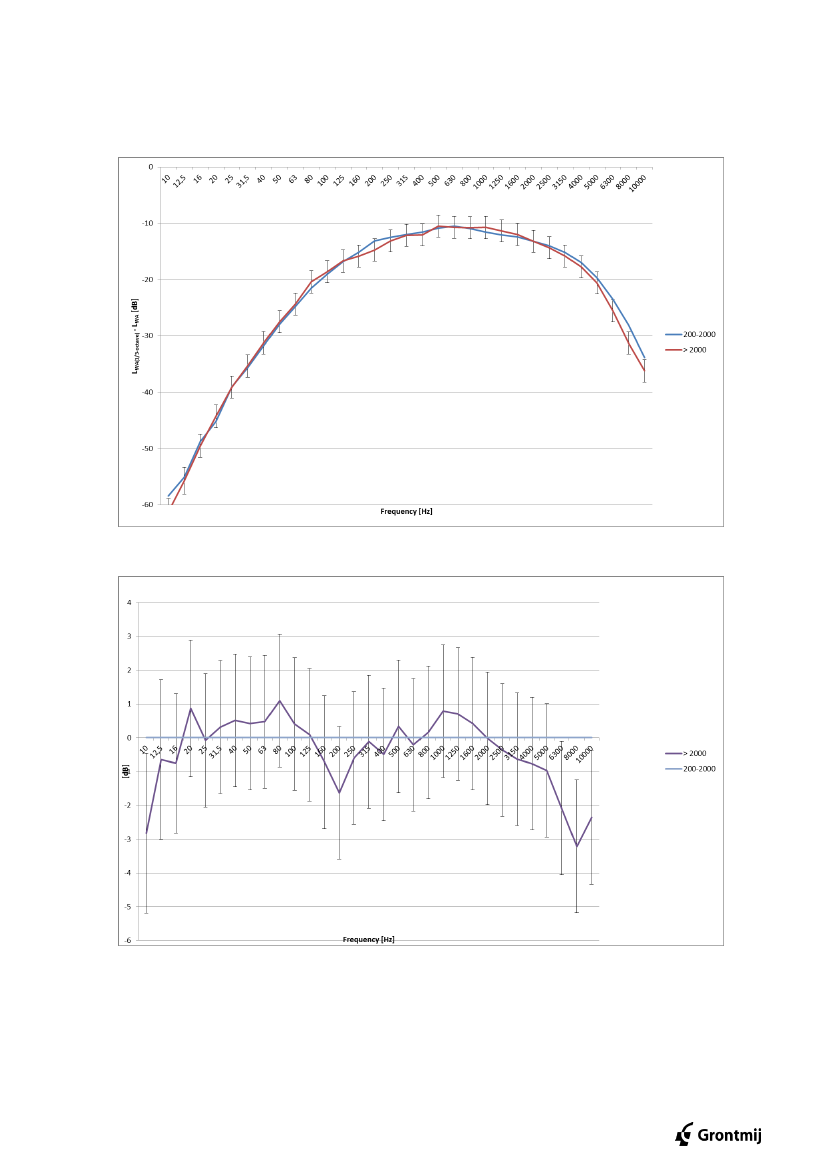
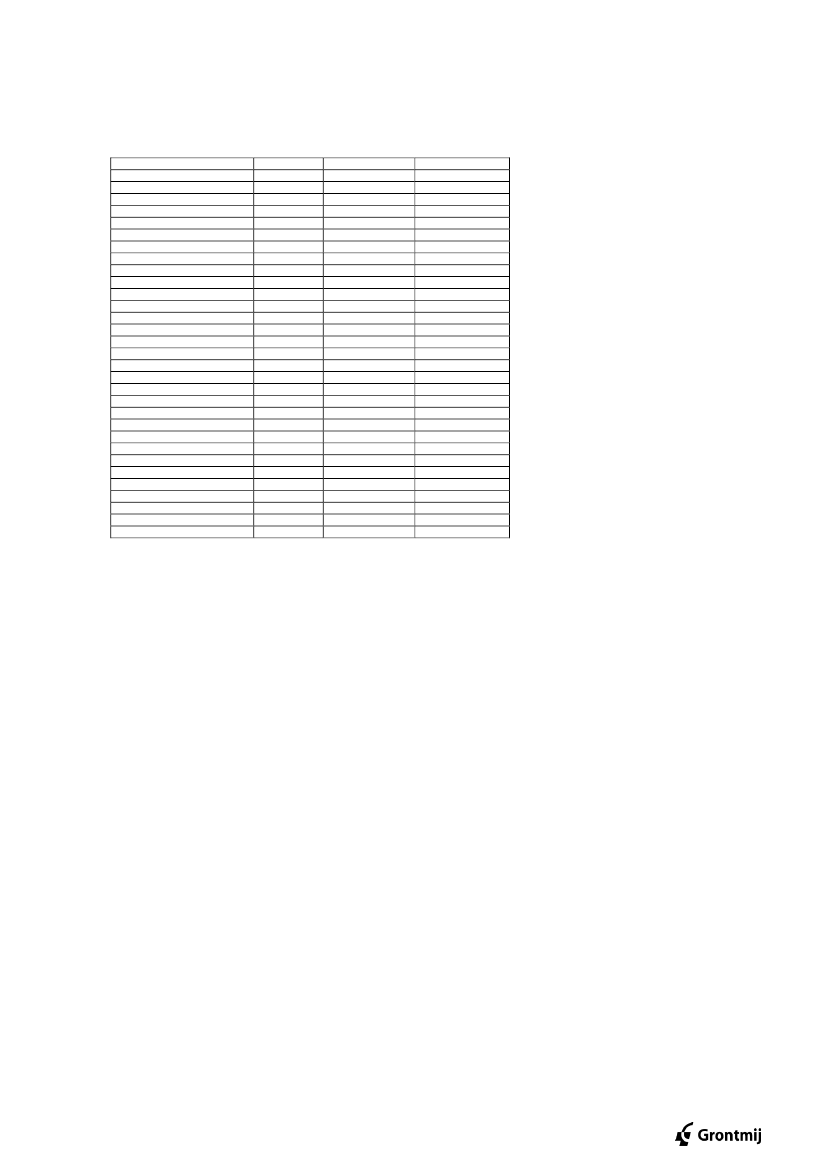
All spectra are measured down to at least 50 Hz and for the new large turbines down to atleast 16 Hz.The spectra representing the different groups do not deviate much in the low frequency regionfrom 10 Hz to 160 Hz, except for the group of wind turbines below 200 kW. These turbines arerelatively rare these days and due to the early design are dominated by machinery noise andtonal noise. Small wind turbines are represented by the group ]200 – 2000 kW] which isconsistent with the previous analyses in [2] to [6]. In Figure 3 a comparison of the group ]200 –2000 kW] and the group > 2000 kW wind turbines is shown. The differences in the lowfrequency range are small, which can be seen in more detail in Figure 4, where the spectrumfor the group > 2000 kW is subtracted from the spectrum of group ]200 – 2000 kW]. It is clearthat the group of turbines above 2000 kW deviates very little from the group ]200 – 2000 kW]wind turbine spectrum and positive deviations are less than 1 dB. In the low frequency rangethe difference is significant at 10 Hz, 80 Hz, 160 Hz, and 200 Hz. The statistics for all 1/3-octave bands are given in Table 3 from a Students t-test comparison of the 2 groups.
r:\projects\aar\35\35641803\06_output\report low frequency noise from wind turbines.docx
Page 9
Figure 3, Normalized apparent sound power levels in one- third-octave bands. Mean of twogroups of turbines: ]200 kW- 2000 kW] and > 2 000 kW
Figure 4 Normalized apparent sound power levels in one- third-octave bands. Spectrum of thegroup > 2000 kW wind turbines relative to the spectrum for the group ]200 – 2000 kW] windturbines. A positive value means that the level of group > 2000 kW at that frequency is higherthan the corresponding value for group ]200 – 2000 kW]. Error bars show 95% confidenceinterval around the mean in every 1/3-octaveband for the group > 2000 kW wind turbines.
r:\projects\aar\35\35641803\06_output\report low frequency noise from wind turbines.docx
Page 101/3-octave band [Hz]1012,516202531,540506380100125160200250315400500630800100012501600200025003150400050006300800010000t2,33010,49980,68550,83910,13370,55681,06960,71670,85582,32491,04130,20812,00444,54491,77400,42001,73151,19780,97630,71353,03582,86631,47000,07191,07601,54781,50341,50892,93993,98882,1608d.f.7,87,624,139,3298,1368,5566,3315,0391,1474,2895,2613,5894,1896,5925,81223,21304,81200,93667,03348,21887,31929,01180,41246,2919,3639,8407,5250,5254,2214,0105,5single sided p0,02630,31630,24980,20330,44680,28900,14260,23700,19630,01020,14900,41760,02270,00000,03820,33730,04180,11560,16450,23780,00120,00210,07090,47130,14110,06110,06680,06630,00180,00000,0165
Table 3. Parameters from Student’s t-test comparison of group ]200 kW – 2000 kW] and group>2000 kW.
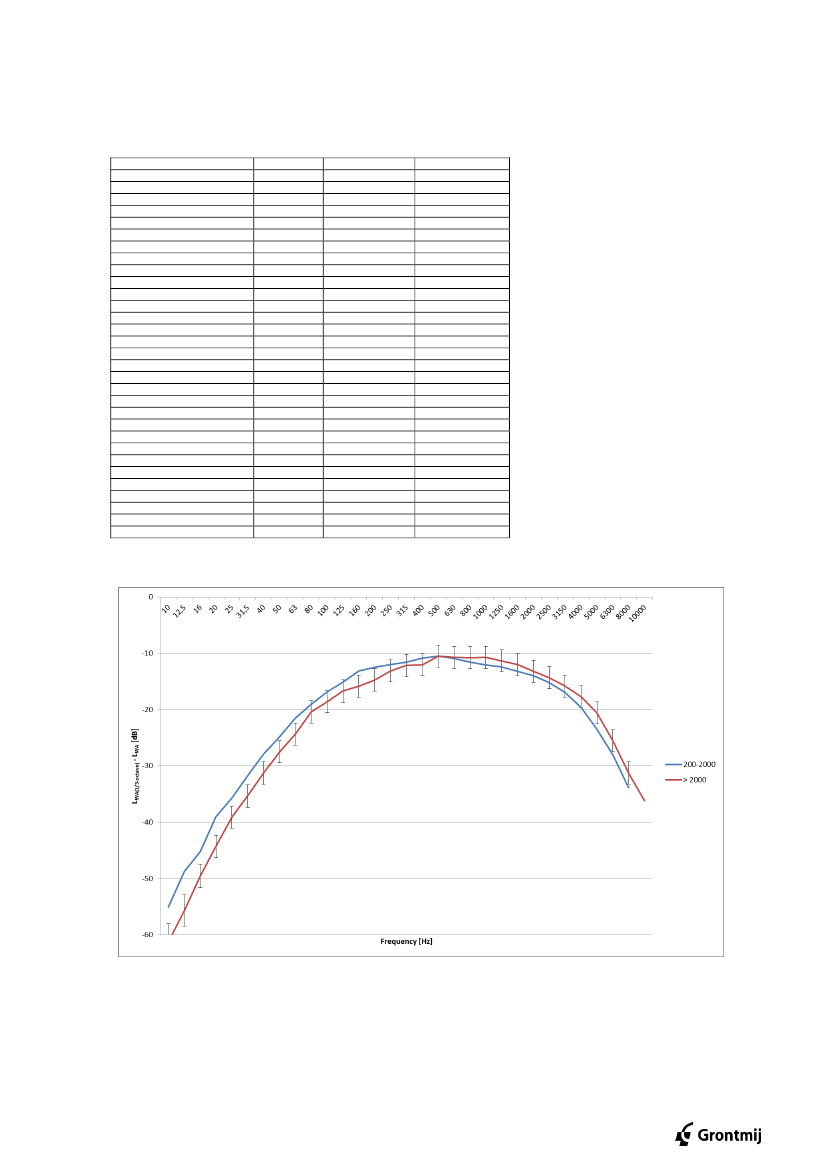
Figure 5 Normalized apparent sound power levels in one- third-octave bands. Mean of twogroups of turbines: ]200 kW- 2000 kW] and > 2000kW. The group of turbines ]200 kW- 2000 kW]are shifted one third of an octave down in frequency as suggested by Møller in [4] and [5]. Thecomparison shows that the development of low frequency noise with size is not as strong asassumed by Møller.
r:\projects\aar\35\35641803\06_output\report low frequency noise from wind turbines.docx
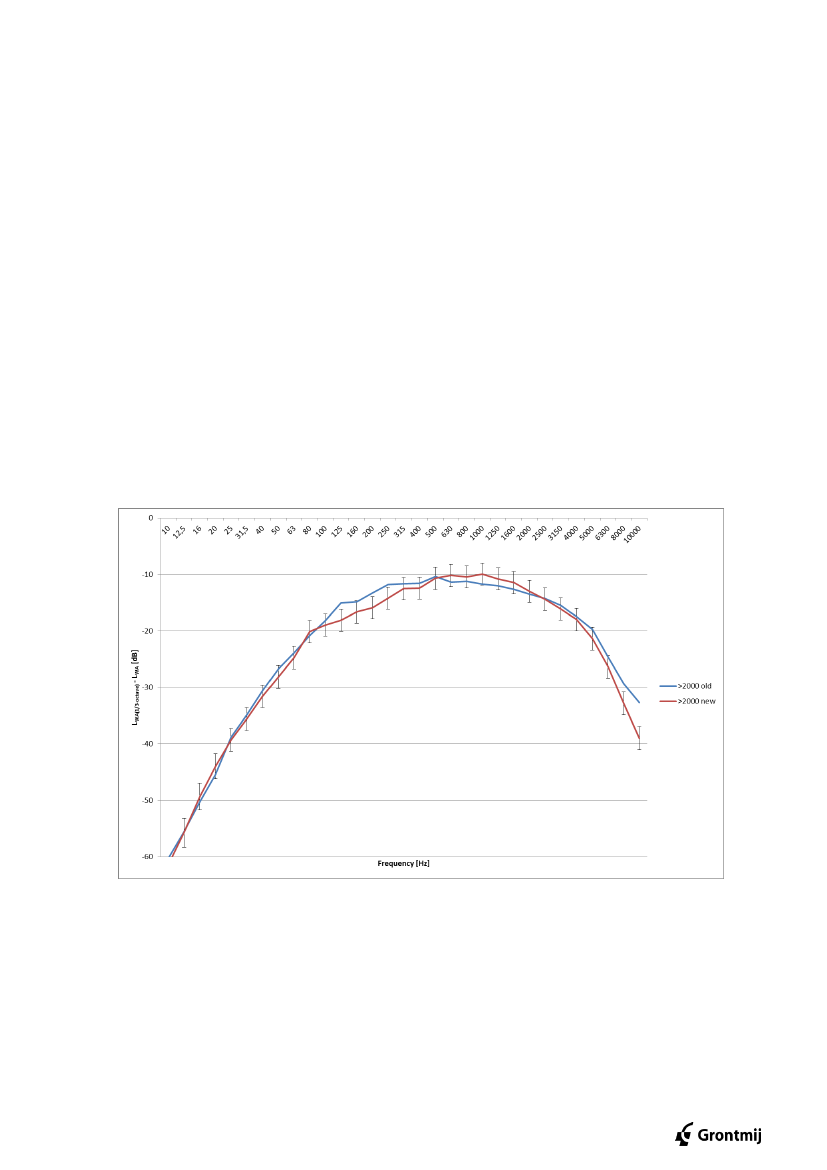
Page 11It has been suggested by Møller in [4] and [5] that the development in low frequency noise withsize corresponds to a shift by one 1/3-octave in the spectrum. In Figure 5 a comparison ismade where the spectrum for the group of wind turbines ]200 kW- 2000 kW] wind turbines isshifted one third of an octave down. It is obvious that the original presentation in Figure 3 givesa better match between the 2 groups and the assumption can be rejected as can theconsequences of this assumption when extrapolated to 5 MW and 10 MW wind turbines.In order to investigate the results from Figure 3 further a comparison between new (after theregulation) and old (before the regulation) wind turbines from group >2000 kW is made inFigure 6. The definition of new and old is a little diffuse, but measurement reports from before2010 are considered to be old and after 2010 as new. Around 2010 it was obvious to theindustry that regulations on low frequency noise would be introduced and possible measureswould be introduced. There is a clear difference in the frequency range from 100 Hz to 500 Hzwhere the relative amount of noise is lower for the new wind turbines than for the old windturbines in this group. The differences are significant as can be seen in Table 4.This suggeststhat there is a development towards less low frequency noise, possibly because tonality in thisfrequency range is an area of focus for the developers. Also aerodynamic and aero acousticoptimisation of the blades tends to shift the aero acoustically generated noise towards higherfrequencies.
Figure 6 Normalized apparent sound power levels in one- third-octave bands. Comparison ofnew and old wind turbines > 2000 kW. Error bars show 95% confidence interval around the meanin every 1/3-octaveband for new wind turbines above 2000 kW
r:\projects\aar\35\35641803\06_output\report low frequency noise from wind turbines.docx
Page 121/3-octave band [Hz]1012,516202531,540506380100125160200250315400500630800100012501600200025003150400050006300800010000t0,38620,12100,68301,18870,63090,85921,32961,39920,90400,83821,29284,85323,13805,35344,88441,76201,69590,67164,45492,46045,07603,21162,43170,94870,18410,94530,56181,48251,53742,91893,9954d.f.0,45,27,010,855,144,458,342,366,091,9159,1115,8158,9247,8249,8260,6268,4243,6816,6492,7461,3417,9254,8242,2168,1112,667,445,249,042,722,7single sided p-0,45420,25830,13100,26540,19740,09440,08460,18460,20210,09900,00000,0010<0,0001<0,00010,03960,04550,2512<0,00010,0071<0,00010,00070,00790,17190,42710,17330,28810,07260,06530,00280,0003
Table 4 Parameters from Student’s t-test comparison of old and new wind turbines in the group>2000 kW. The difference is significant at frequencies 125 Hz to 400 Hz and again at 630 Hz to1250 Hz and 8kHz and 10kHz. There are not enough measurements for old wind turbines at 10 Hzto give a result.
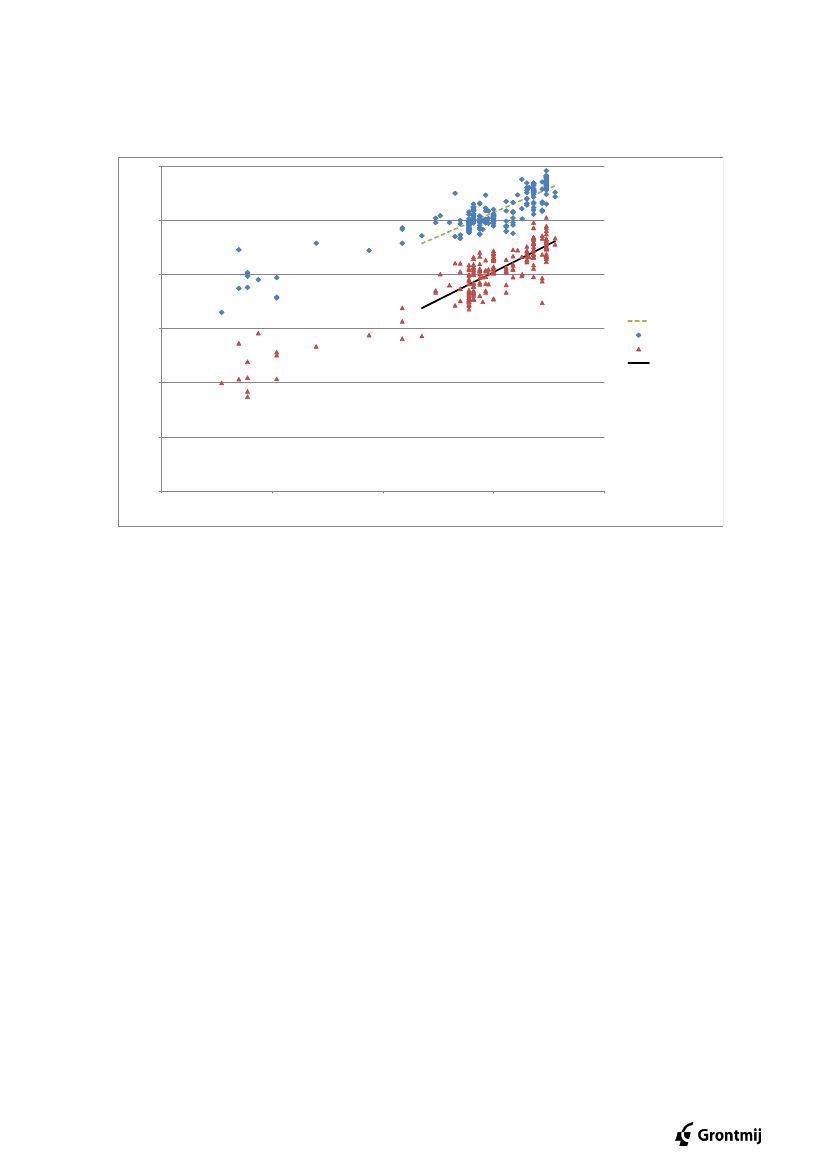
The apparent sound power level from the measurement reports is shown as a function ofnominal power in Figure 7 both as the total level, LWAand the low frequency part of the level,calculated as the sum of all 1/3-octave bands from 10 Hz to 160 Hz, LWA,LF. The figure showsthat the low frequency part of the level increases at a higher rate than the total level. From aregression analysis based on wind turbines with a nominal power above 200 kW the rate is0,43 dB for each doubling of the nominal power in MW. This is a modest developmentcompared to previous analyses of this and suggests that low frequency noise emission can bereduced. The slopes of the lines are not statistically significant different from each other [90 %confidence interval 7.2 to 10.5 for LWAand 8.6 to 11.3 for LWA,LF]. If the tendency seen insection 2.2 continues and more new wind turbines are included in the analysis, the differenceis likely to be reduced even more.
r:\projects\aar\35\35641803\06_output\report low frequency noise from wind turbines.docx
Page 13110
y = 8,854*log(x) + 74,920
100
Sound Power Level [dB re 1 pW]
90
80
y = 10,278*log(x) + 59,603
Regression LWALWALWA,LFRegression LWA,LF
70
60
50110100Nominal Power [kW]100010000
Figure 7 LWAand LWA,LFas a function of nominal power at 8 m/s.
33.1
OTHER CONSIDERATIONSType of regulation
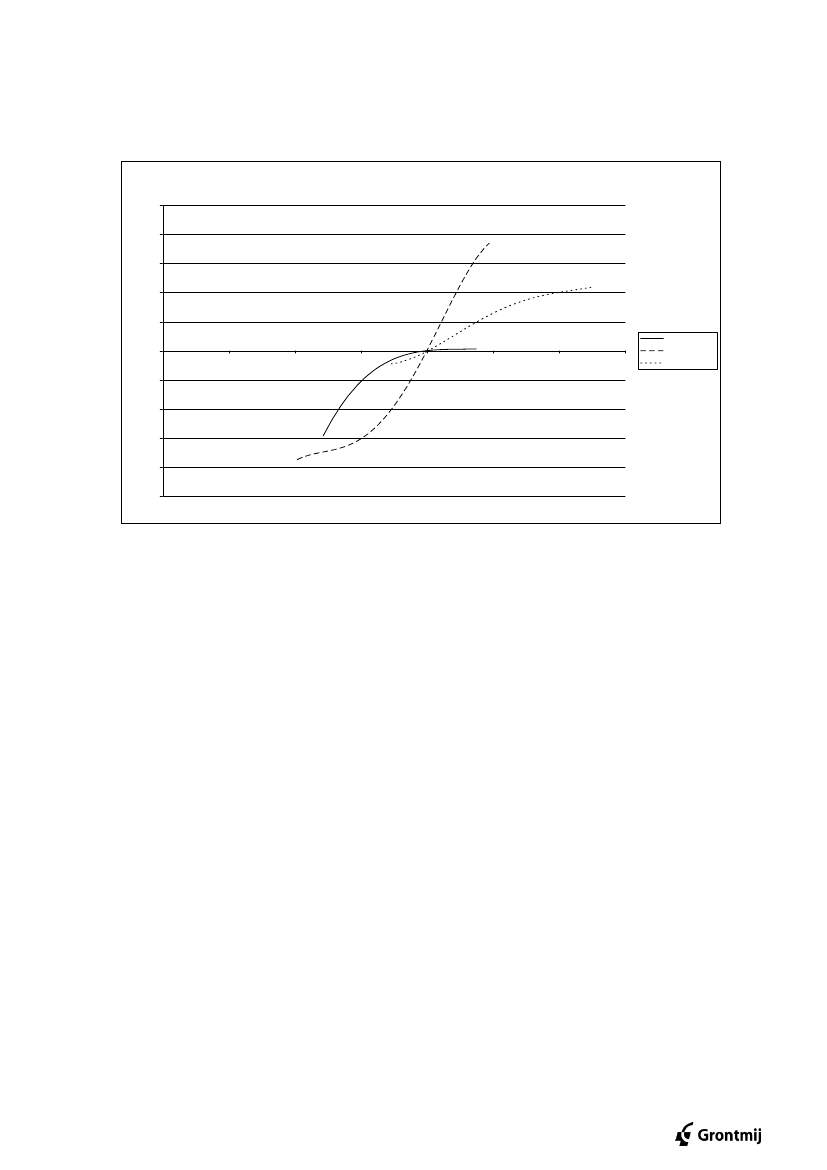
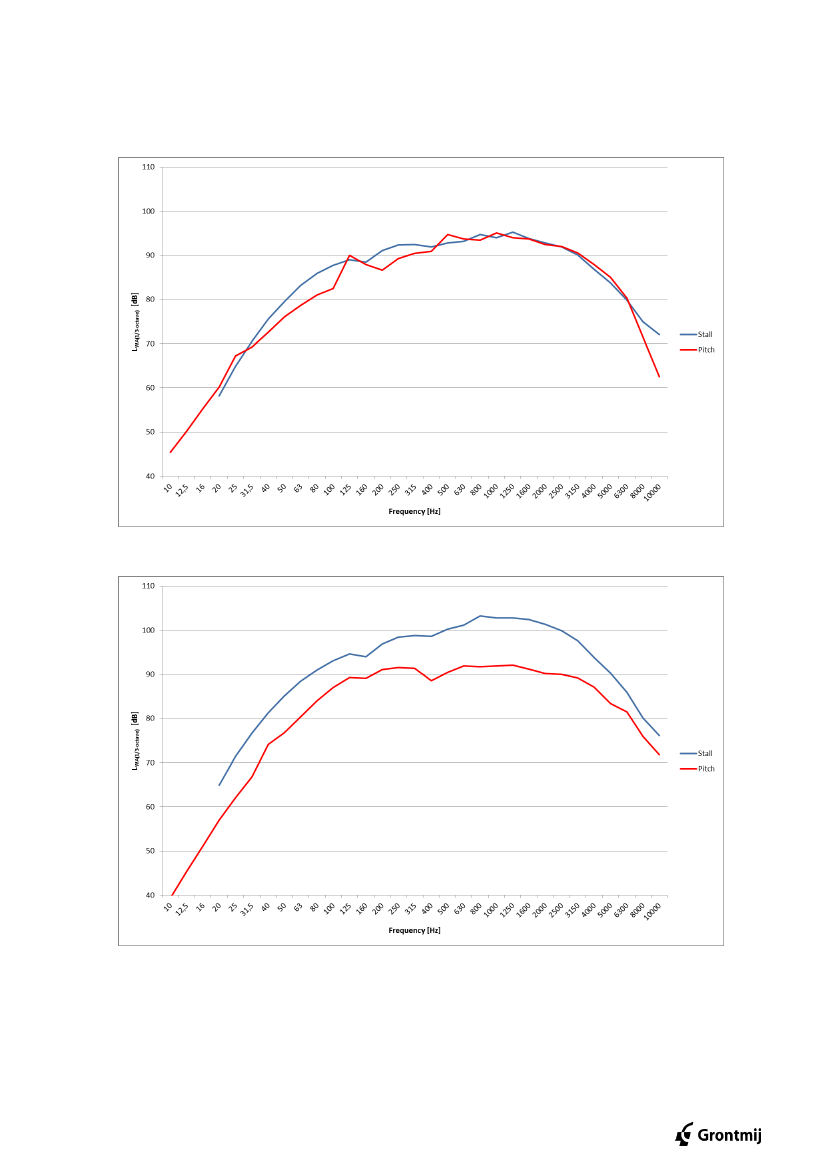
In this article as well as in other reviews and presentations the basis has been the soundpower level at 8 m/s. This wind speed has been the reference wind speed during the periodwhere noise from wind turbines has been measured. This is a good parameter for the newtype of turbines where pitch-RPM control has taken over from stall and active stall regulationof wind turbines. Measurements where a wider wind speed range has been covered show thatthe pitch-RPM regulated wind turbines from group > 2000 kW, have the maximal noiseemission around 8 m/s. Older wind turbines especially stall and active stall regulated windturbines have the maximum noise emission at higher wind speeds. Sometimes the maximummay be 5 dB or more higher than the value at 8 m/s. This can be seen in Figure 8, where thenoise as a function of wind speed is shown for the 3 types of regulation. For comparison thecurves are normalized to 0 dB at 8 m/s.Experience from measurements show that the low frequency noise increases at approximatelythe same rate as the “normal” noise and older wind turbines may actually produce more lowfrequency noise at wind speeds above 8 m/s than the modern large pitch controlled windturbines. It is possible that neighbours to wind farms have been exposed to more lowfrequency noise from the old turbines than they are from the present generation of turbines.
r:\projects\aar\35\35641803\06_output\report low frequency noise from wind turbines.docx
Page 14
Noise curves10
8
6
4
2Modern PitchActive stallStall
00-22468101214
-4
-6
-8
-10Wind speed [m/s]
Figure 8. Noise curves for 3 types of wind turbines. The curves are normalised to 0 dB at 8 m/sfor comparison, but are from actual measurements and are examples only.
In Figure 9 and Figure. 10 this is illustrated with a comparison of the spectra for a stallregulated wind turbine from group ]200 kW – 1000 kW] and a pitch-RPM regulated windturbine from group >2000 kW at 8 m/s and 10 m/s are shown. The wind turbines are selectedto have comparable spectra and levels at 8 m/s. It is obvious that the noise and the lowfrequency noise has increased significantly for the stall regulated wind turbine compared to thepitch-RPM regulated wind turbine at 10 m/s. This is a direct consequence of the noise curvesin Figure 8 and is a general trend.
r:\projects\aar\35\35641803\06_output\report low frequency noise from wind turbines.docx
Page 15
Figure 9. Spectra for a stall regulated wind turbine from group ]200 kW – 1000 kW] and a pitch-RPM regulated wind turbine from the group > 2000 kW at 8 m/s.
Figure. 10 Spectra for a stall regulated wind turbine from group ]200 kW – 1000 kW] and a pitch-RPM regulated wind turbine from the group > 2000 kW at 10 m/s
r:\projects\aar\35\35641803\06_output\report low frequency noise from wind turbines.docx
Page 163.2Noise as a function of distance
In Denmark the required distance from a wind turbine to nearest neighbour is at least 4 timesthe total height of the wind turbine. Low frequency noise is reduced less with the distancethan higher frequencies. In Table 5 predicted values of noise and low frequency noise arepresented for the groups ]200 kW to 2000 kW] and > 2000 kW wind turbines with different totalheights. Mean spectra from each group are used in the predictions. The results are scaled to anoise level at the neighbour of 44 dB(A) corresponding to the noise limit at 8 m/s. In thepredictions the total height for group ]200 kW to 2000 kW] is 75 m (50 m hub height and 50 mrotor diameter) and 150 m for the rest of the turbines. Differences in in-door low frequencynoise level are within 1.6 dB. New wind turbines > 2000 kW are 0.6 dB higher than small windturbines. For wind farms the predicted levels can change with different layouts, but most oftenthe noise is dominated by the nearest wind turbines and as the noise is reduced by 6 dB fromspherical spreading at all frequencies the contribution from wind turbines at larger distanceswill often be small. At least for typical Danish wind farms with 2 to 5 wind turbines. It ispossible to design wind farm layouts that give different results, but it is chosen to use a simpleexample for clarity. The results in Table 5 are in line with the results from existing wind farmsin Table 1.Wind TurbineDistance [m]LpA,LF[dB re 20 � Pa]200 kW – 2000 kW]30016.3>2000 kW60017.4>2000 kW New60016.9>2000 kW Old60017.9
Table 5. Predicted in-door low frequency noise LpA,LFat 8 m/s for different groups of windturbines assuming the noise level is 44 dB(A).
r:\projects\aar\35\35641803\06_output\report low frequency noise from wind turbines.docx
Page 174CONCLUSIONS
The purpose of this review is to investigate if the new Danish regulation on low frequencynoise has had any impact on the emitted low frequency noise and the low frequency noise atthe neighbours or not. The wind farm examples do not give a clear answer. It gives theimpression, that the situation has not changed and the amount of low frequency noise at theresidents is the same as for wind farms with smaller and/or older wind turbines.Looking at the sound power levels and sound power spectra gives more information. Analysisof the sound power spectra shows that after 2010 the relative amount of noise in the frequencyrange from 100 to 400 Hz is reduced significantly. This includes the important part of the lowfrequency range from 100 Hz to 160 Hz. Whether this is because of the Danish regulation isimpossible to say, but it is likely that the regulations have increased the focus on this in thedesign phase. It is the experience of Grontmij, that the low frequency tones, which were asignificant part of low frequency noise in [2], [3], [4], [5] and [6] are reduced for seriesproduced wind turbines.In general the analysis shows that the development of low frequency noise with size do notfollow the conclusions from the analyses in [4], [5] and [6]. The analysis show that on averagethe amount of low frequency noise is the same for large and small wind turbines, relative to thetotal noise level and that the amount of low frequency noise for new large wind turbines is lessthan for old large wind turbines, relative to the total noise level.The analysis is based on a larger number of measurement reports than previous analyses andexperiences from post construction documentation. The results can change if the dataset isincreased further, but the conclusions are in line with the conclusions in [2] and [3], where theresults were influenced by prototype wind turbines. There is a large variation in sound powerlevels and sound power spectra within each group of wind turbines used in the analysis and itis important to check the details for each wind farm project. It is also important to follow thedevelopment into the next generation of wind turbines where new technologies are likely to beintroduced.
r:\projects\aar\35\35641803\06_output\report low frequency noise from wind turbines.docx
Page 185REFERENCES
[1] Søndergaard B. “Low Frequency Noise from Wind Turbines: Do the DanishRegulations Have Any Impact?”, 5th International Conference on Wind TurbineNoise Denver 28 – 30 August 2013[2] Søndergaard B. “Low Frequency Noise from Large Wind Turbines – Summaryand Conclusions form Measurements and Methods”. AV 140/08. DELTA April2008[3] Madsen K. D. “Low Frequency Noise from Large Wind Turbines – Final report”.AV 1272/10. DELTA November 2010[4] Møller H. Low Frequency “Noise from Large Wind Turbines”, Acoustics Universityof Aalborg June 2010 (in Danish)[5] Møller H. “Low Frequency Noise from Large Wind Turbines – update 2011”,Acoustics University of Aalborg May 2011 (in Danish)[6] Møller H. “Low-frequency noise from large wind turbines” J. Acoust. Soc. Am.129 (6), June 2011[7] Statutory order 1284 of 15. December 2011 “Noise from wind turbines” from theDanish ministry of the environment (in Danish)[8] Jakobsen J. “Danish regulation of low frequency noise from wind turbines”. 15thInternational Meeting on Low Frequency Noise and Vibration and its ControlStratford upon Avon UK 22nd – 24th May 2012[9] Sørensen T. “Experiences with the New Danish Rules for the Calculation of LowFrequency Noise from Wind Turbines” 15th International Meeting on LowFrequency Noise and Vibration and its Control Stratford upon Avon UK 22nd –24th May 2012
r:\projects\aar\35\35641803\06_output\report low frequency noise from wind turbines.docx


