Beskæftigelsesudvalget 2012-13
BEU Alm.del
Offentligt
Working Paper 2010-1Do Time Limits in the Sickness Insurance SystemIncrease Return to Work?/Pathric Hägglund
2(23)
Working Paper 2010-1 .Pathric Hägglund .
3(23)
IndexAbstract ....................................................................................................... 41 Introduction ............................................................................................. 52 Sickness absence in Sweden ....................................................................... 73 The SI and the rehabilitation chain .............................................................. 94 Design and descriptives ............................................................................ 105 Analysis .................................................................................................. 135.1 Empirical strategy............................................................................ 135.2 Effects on return to work .................................................................. 135.3 Effects for different subgroups .......................................................... 155.4 The effect on future sick reporting ..................................................... 165.5 Model test ...................................................................................... 176 Conclusions ............................................................................................. 19References ................................................................................................... 20Appendix ..................................................................................................... 22
4(23)
AbstractThis paper analyses the effect of introducing a mandatory law for assessingworking capacity on the 91st and 181st days of the sick spell. Takingadvantage of the quasi-experimental feature of the intervention, increasedexit rates are found in the time periods before each of the assessments.This suggests that the positive effect mainly stems from the increasedmonitoring of the assessments. The results are more positive in big cityareas than in smaller municipalities, indicating that larger labour marketscreate better opportunities, and stronger incentives, to work.Keywords:Public sickness insurance, policy evaluation, natural experimentJEL classification:H55, I18, J22, J28
5(23)
1 IntroductionIn 2003, Sweden had the highest reported sick-leave rate in the EU-15 with4.4% of the working population being sick absent.1Together with highinflows to the disability insurance, a large share of the workforce becamedependent on income from the public social insurance systems. Despite apositive trend in recent years with fewer sick spells starting and shortersickness spells, public sickness insurance (SI) underwent a majorreformation in 2008. Several changes were introduced with the purpose ofreducing excess use of the SI and supporting individuals better in theirreturn to work. The most radical restructuring was the introduction of time-restricted assessments of working capacity for certain sick-spell durations:the so-calledrehabilitation chain.A relatively large amount of empirical literature has investigated thecorrespondence between the generosity of the SI and sickness absence. Forexample, Johansson & Palme (1996, 2002 and 2005) and Hesselius &Persson (2007) all find evidence of higher compensation levels increasingthe costs in the SI system. The negative incentive effects from a generousinsurance system could partly be offset by monitoring and sanctions. Theeffectiveness of these policy instruments is however much less analysed.On Swedish data, Hesselius, Johansson and Larsson (2005) make use of aunique large-scaled experiment in 1988. They find strong evidence of moreextensive sick spells as a result of prolonging the medical-certificate-freeperiod from 7 to 14 days. The result is expected from the theory of moralhazard predicting higher insurance costs when the insurance conditionsbecome more generous (see for instance Barr, 2004).In the relatively large empirical literature on the unemployment insurance(UI), monitoring through stricter enforcement and verification of work-search requirements have generally been shown to reduce benefit periods.Both the Washington Work-Search Experiment (Johnson & Klepinger, 1994)and the Maryland UI Work-Search Demonstration (Klepinger et al, 2002)evaluate the impact of various combinations and degrees of work-searchrequirements and monitoring. The analyses provide strong evidence thatsuch activities increase the UI exit rate. In Europe, Dolton & O’Neill (1996)find large positive effects of introducing recurrent counseling andmonitoring meetings (the British Restart program) for long-termunemployed.No earlier study has investigated the impact of introducing time limits inthe public SI system. The question to be answered in this paper is whetherthe introduction of repeated working capacity assessments on the 91st and181st days of the sickness period reduce the sickness absence length andincrease return to work. To separate the effect of the assessments from thedownward trend in sickness absence, the analysis exploits a quasi-experimental feature implementing the policy. Sick spells initiated only afew days apart (in the last week of June and the first week of July) weretreated under different regimes during the first six months. Including spellsstarted in the same weeks one year earlier, a difference-in-differencestrategy is used to estimate the reform’s impact. Job-search theory predictsthat the notification of future monitoring will have an immediate negativeeffect on the individual’s value of remaining absent from work. This isexpected to affect the return to work through increased efforts and a higher1
Swedish Social Insurance Agency (2009). The EU-15 refers to the members of theEU in 1995. The average sick-leave rate among these countries was 1.9% in 2003.
6(23)
acceptance level towards alternative income sources. Empirical findings onthe UI system confirm pre-intervention behavioral effects, both beforeprogram activities (see for instance Black et al, 2003 and Dolton & O’Neill,1996), and at benefit expiration (see for instance Carling et al, 1996 andMeyer, 1990).The paper unfolds as follows. The next section outlines the background ofthe reforms, describing sickness absence in Sweden over time. Thefollowing section outlines the Swedish SI system and the details of therehabilitation chain. Section 4 describes the data and section 5 specifies theempirical model and presents the results of the estimations. Section 6finally sums up the findings.
7(23)
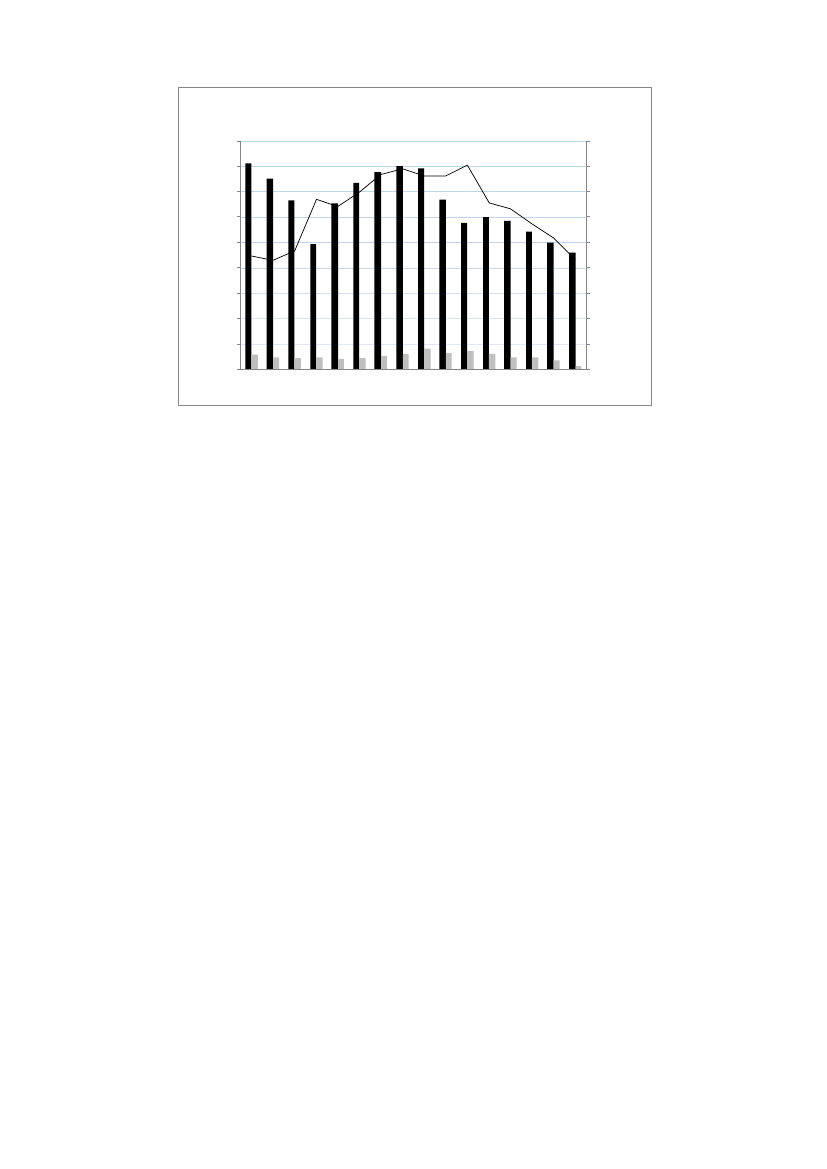
2 Sickness absence in SwedenThe 1990s’ economic crisis constituted a shift in the dependence of publicsocial insurance (including the unemployment insurance) in Sweden. Mostof the economic recovery late in the decade was offset by a rapidlyincreased inflow to sick leave and disability benefits. In 2003, Swedenreported the highest sick-leave rate in the EU-15, with almost 4.4% of theemployed absent due to sickness. Since then, both the inflow to the SI andthe sick-spell durations has dropped (see Figure 1). The high levels, thelarge variation over time and the strong pro-cyclical pattern have beenreceived as evidence of a dysfunctional SI, inappropriately used andafflicted by considerable levels of moral hazard. The measures taken toreduce sickness absence have correspondingly targeted institutionalchanges and the strengthening of the incentives among all actors torestrain the use of the SI. For instance, in 2004, the period for which theemployer is responsible for compensation was prolonged from 14 to 21days. This change was reversed in 2005, when besides the first 14 days,the employers also co-financed 15% of the compensation for the remainingdays of the sickness absence period. Probably the most important change,however, was the restructuring of the Swedish Social Insurance Agency in2005, centralizing the 21 semi-autonomous regional offices into oneadministration. This made possible more consistent and higher qualitydelivery of frontline services. Together with targeted efforts to changesocial attitudes and norms associated with reporting sick, this is generallyagreed to be the main reason for the fall in the sick-leave rate amongpolicy makers and analysts.The Alliance of Sweden Government came into office in 2006 with anoutspoken aim to restore the work-first principle and to prevent socialexclusion due to long-term benefit receipt. The resulting reformation,considered the largest ever in the SI history, was for the most part initiatedin 2008 and concerned changes in both the incentives to receivecompensation from SI and active measures to support return to work.Negative incentives were introduced with the reduction of the benefit levelafter one year on sick leave, and the limit for the maximum number ofentitlement days. Since an important explanation for the high Swedishsickness absence probably was the lack of a time limit, these changes wereexpected to stabilize sickness absence at lower levels. Also, people entitledto permanent disability benefits before July 2008 were henceforth allowedto earn up to €4,280 (≈SEK 42,800) per year before their benefit wasprogressively reduced. This positive incentive reform was motivated by thebelief that many in the 1990s and the early 2000s were transferred todisability benefits without a thorough assessment of their working capacity.Finally, to support the individuals’ possibilities to return to work, thegovernment introduced arehabilitation guarantee program,offeringcognitive therapy and multidiscipline treatment for people diagnosed withmental health conditions.The most radical change in the SI system, however, was the introduction oftherehabilitation-chain model,with eligibility checks at fixed sick-spelldurations. The model is described in the following section.
8(23)
Figure 1: Inflow to sick-leave (black bar) and disability benefits(grey bar), and sick-spell length900800700600180160140120100806040200-94 -95 -96 -97 -98 -99 -00 -01 -02 -03 -04 -05 -06 -07 -08 -09Days
Thousands
5004003002001000
9(23)
3 The SI and the rehabilitation chainThe public SI compensates all employed (and previously employed ifregistered at the Public Employment Services) unable to perform theirregular job due to temporary sickness. The employer is responsible forfinancing the first 14 days of the sickness period, with a 1-day waitingperiod. The replacement ratio is 80% up to a benefit cap, €2,563 permonth, during the first year. After that, the compensation is reduced to75% during the remaining period up 2.5 years, which is the maximumentitlement period.2Besides the public SI, most workers qualify foradditional benefits through agreements between the labour unions and theworkers’ confederations. The limit to the total compensation is usually 90%of the foregoing income, but varies with the specific agreement.The rehabilitation chain, despite what the name suggests, does not containrehabilitation measures. Instead it consists of time-restricted assessmentsof the individual’s work ability and right to benefits. The purpose of themodel is to create incentives among all actors to become more active earlyin their sick leave. During the first 90 days of the sick spell, the workingcapacity is assessed against the existing job, possibly with somemodifications. Between the 91st and 180th days, if the old job is not anoption, the worker is expected to try to find another job with the employer.Alternatively, the worker can take leave of absence for up to 6 months totry out another job with another employer. From the 181st day, workingcapacity and thus the right to benefits are evaluated against all the jobs onthe regular labour market. Exceptions from this assessment could be made,for instance if the individual is undergoing rehabilitation and is expected toresume work within 12 months. If the individual is assessed as havingremaining working capacity, he or she is expected to resume work with hisor her employer.An important point to make is that the different steps in the rehabilitationchain were already in use by the SI administration. What the rehabilitationchain added was the time limits specifying when at the latest in the sickspells the different assessments had to be executed. Note also that thetime limits are relevant only for employed. The working capacity among theunemployed should be evaluated against the regular labour market fromday 2 of the sick spell (the first day being uncompensated).
2
Some exceptions are stipulated granting the sick-reported 80% of their previousincome up to 2.5 years.
10(23)
4 Design and descriptivesThe analysis takes advantage of the temporary transition rules appliedwhen implementing the rehabilitation chain on 1 July 2008, when alreadyongoing sick spells were treated according to the old rules until 1 January2009. That means that sick spells initiated only a few days apart – in thelast week of June and the first week of July 2008 – were subject to differentrules/treatment during the first 6 months. Any individual-specificdifferences in factors potentially correlated with sick-spell length, forinstance age or income, will be accounted for in the analysis. By includingspells initiated in the same weeks of 2007, any non-observable differences,for instance related to the particular week or month starting the sick spell,will potentially also be captured in the analysis. The final sample consists of5 512/4 637 sick spells/individuals initiated by employed individuals inJune/July of 2008, and 4 795/4 267 spells started in the same months of2007.Sick spells are identified and collected from the sick-spell registeradministered by the Swedish Social Insurance Agency, which containsinformation on spells exceeding 14 days. The analyses are thus restrictedto sick spells at least 15 days long. Besides sick-spell-specific informationon medical diagnoses and the percentage on sick leave (100, 75, 50 or 25),the register also contains individual characteristics (gender, age,educational level, country of origin etc.), family situation, sick-spell historyand labour market attachment.Table 1 sums up the characteristics of each group. Both monthly and yearlycomparisons reveal small differences. A majority of the sample is womenand the average benefit recipient is about 45 years old. More than everyfourth person reporting sick is highly educated (university), and 21-25% ofthe sample receives maximum benefits. About 20% is living in theStockholm/Gothenburg/Malmö area, and the average sick-reporting historyis 9-10 months.
Table 1Sample descriptivesJuly (1stweek)2008WomenAgeBorn abroadUniversity% with maximum SI benefit0.56440.140.280.26June (last July (1stJune (lastweek)week)week)2008200720070.59450.140.270.240.213010.58450.150.270.210.212980.58440.140.270.220.20282
Big city areas0.22(Stockholm/Gothenburg/Malmö)Sick-leave history (days)275
Note: Number of observations, June 2007/2008: 5 512/4 795, and July 2007/2008:4 637/4 267.
11(23)
Table 2 reports sick-spell descriptives. A comparison suggests that thedifference in sick-spell length between the spells started in June and Julyeach year has become somewhat smaller, from -3.0 (56.7-59.7) to -1.2(56.1-57.3) days. Hence, sick spells initiated in June became shorterbetween 2007 and 2008 – in correspondence with the downward trend insick-spell length – but the July spells became even shorter on averageduring the same period.The sickness-spell register lacks information on the cause of ending asickness period. We would however assume that the vast majority of theindividuals ending a sick spell within 6 months returned to their currentemployer. By analysing the most common alternatives to returning to work– transitions to unemployment and disability benefits – we investigate howgood an approximation return to work is for all exits from sickness absence.From Table 2, we note that only 0.3-0.8% of the sample ended the sickperiod to become unemployed. Even fewer (0.0-0.1%) were granteddisability benefits. These small shares make state-specific analysisredundant. In the rest of the paper, I use sick-spell exits and return towork synonymously.
Table 2Sick-spell descriptivesJuly (1stweek)2008Share of spells at least (days):3090180Average (days)aShare of spells ending with:bDisability benefitsUnemploymentUnknown (return to work)Ongoing spells (28 weeks)0.00.592.17.40.00.392.57.20.00.890.19.10.10.691.67.759.917.98.757.357.517.48.156.161.119.110.259.760.016.88.656.7June (last July (1stweek)week)20082007June (lastweek)2007
Note:aSpells still in progress at 196 days have been given the spell length 197.bSome observations are lost combining different registers; this modified data setcontains 18 174 observations instead of 19 211. The transitions refer to full-time exitsfrom sickness payment, in contrast to part-time exits.
12(23)
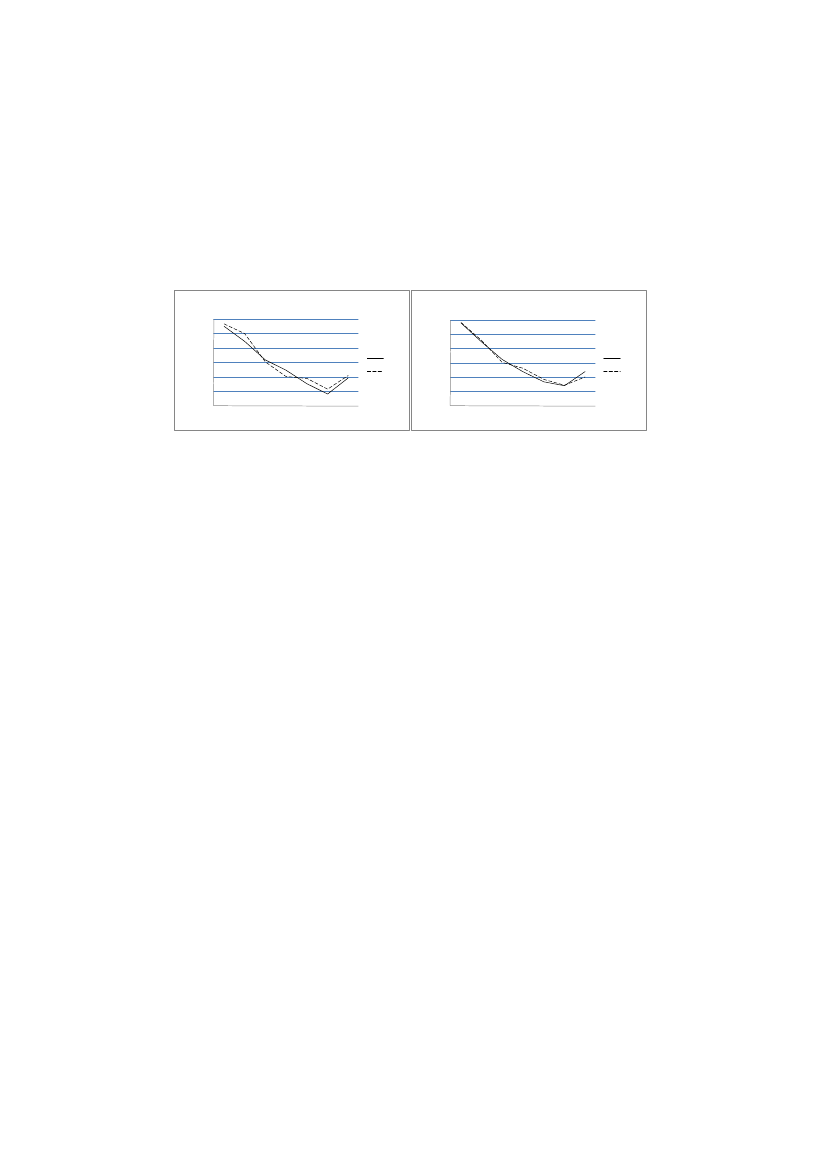
Figures 1a-b illustrate the Kaplan–Meier estimates for sick spells started ineach year. A positive effect of the rehabilitation chain would be shown in arelatively higher exit rate for the July spells in 2008 compared with 2007,especially close to days 91 (≈13 weeks) and 181 (≈26 weeks) in the sickspell. No such clear pattern is found. However, in correspondence with theresults from Table 2, the increase in the exit rate between 2007 and 2008is higher in the July group than in the June group. In the 26-28 weekinterval in 2008, the exit rate is even higher in the July group. Whether thisis an effect of the introduced time limits or not is investigated in thefollowing section.
0,60,5
Figure 1a: Sick-spell hazards, June andJuly 2007Hazard rate
0,60,50,40,30,20,1
Figure 1b: Sick-spell hazards, June and July2008
0,40,30,20,10
0
13(23)
5 Analysis5.1 Empirical strategyTo analyse the time-restricted eligibility checks within the rehabilitationchain, I use a Cox proportional hazard model. Such a model estimatesindividuali:sprobability of ending the sick spell at timet,given that it isstill in progress att-1,according to:
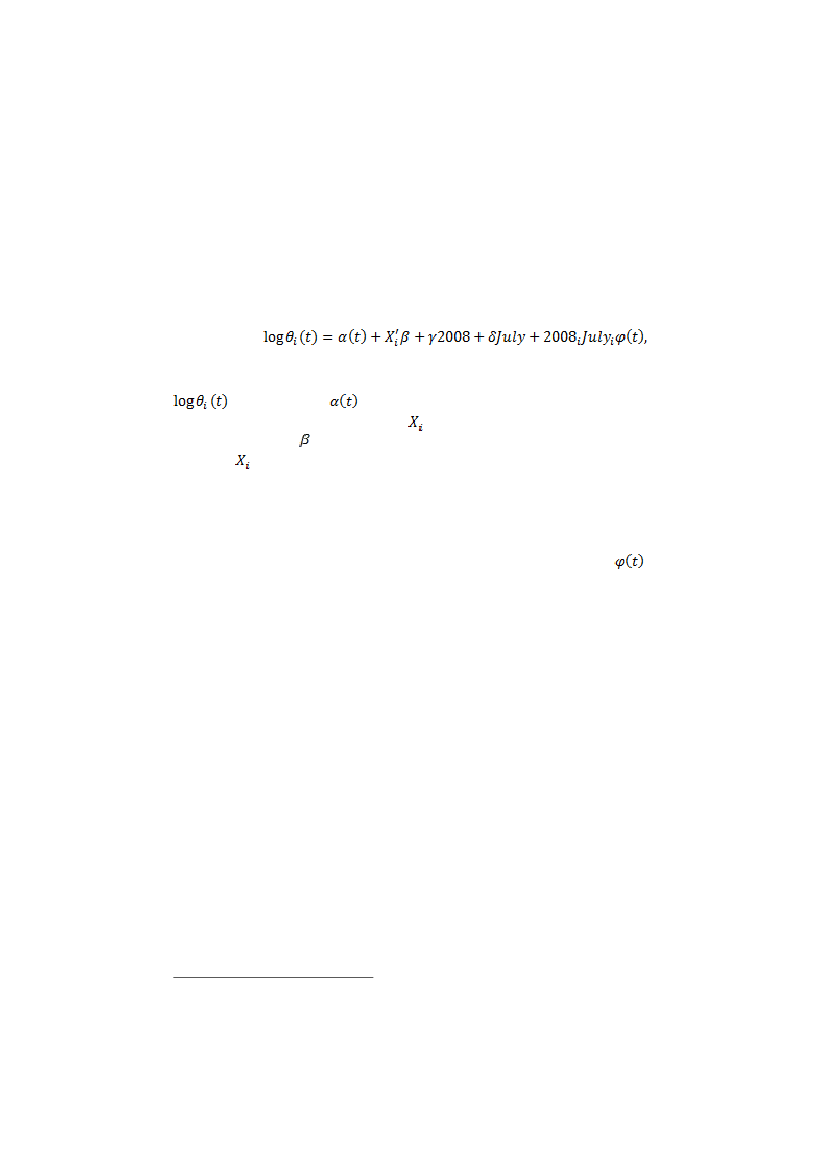
is a function of
, capturing the general exit from sickness
is a vector of individualabsence during the follow-up period.characteristics, and is the coefficient vector reproducing the correlationand the exit probability at different durations. ”2008” andbetween”July” are dummy variables of the sick-spell starting year (1=2008,0=2007) and month (1=July, 0=June). The impact of the rehabilitationchain is identified through the interaction of initiating the spell in July of2008. Since the effect is expected to vary with the sick-spell length, and beespecially visible at 91 and 181 days, the impact is studied in 4-weekintervals. The time-dependent impacts are captured in the coefficient.3The estimations apply Breslow’s approximation. The generated estimatesare approximately identical to those generated using more exact estimationmethods.
5.2 Effects on return to workTable 3 reports the effects of the rehabilitation chain on sick spells up to 28weeks. The sick-spell length is defined as the number of days between thebeginning and the end of the sick spell. No difference is made betweenpart-time and full-time sick spells. Transition to part-time sickness absenceis enough to terminate the spell.4A test allowing only full terminations ofthe sick spell reports results very similar to those presented in this paper.5Values over “1” indicate the percentage increase in the exit rate, andvalues below “1” indicate the opposite. The first column gives theestimation results of the simple model without covariates; the secondcolumn results adjust for differences in observables. Only small differencesappear when comparing the results, which strengthen the casualinterpretation of the estimations.A positive significant effect on the exit rate is found in the 5-8 weekinterval. The result is somewhat unexpected since it appears 1-2 monthsbefore the working ability assessment at 91 days. The effect coincides withthe handover between the national and the local administrational level34
5
Allison (1995).A person could be absent due to sickness for 100, 75, 50 or 25%. Transitions from100 to 50% sickness absence will terminate the sick spell, as well as a transitionfrom 50 to 25%.See Hägglund (2010).
14(23)
within the Swedish Social Insurance Agency. If not before, the individual isthen informed of the new SI rules, which could affect his or her incentivesto resume work. Another possibility is that the timing of the effect coincideswith a typical sick-period length stated in the medical verifications. If thesick reported did not expect to receive compensation beyond the 12thweek, they could have ignored the possibility to apply for further benefits.The positive effect at 5-8 weeks is followed by a corresponding drop in thehazard rate in the subsequent 4-week interval, i.e. the interval immediatelybefore the 91-day assessment. The result could be due to dynamicselection where a subgroup of sick reported with relatively good healthended their sick spell at 5-8 weeks, while a group with relatively poorhealth remained. Finally, a large (60.7%) positive effect is found at 25-28weeks, around the 181-day assessment. The positive effect is thus muchlarger than the significant effect before the 91-day assessment. This isexpected since the 181-day assessment is much sharper in the sense thatthe assessment concerns the entire regular labour market.
Table 3Effect on the off-SI hazard ratioNo covariatesInterval (week)3-45-89-12 (91-day assessment)13-1617-2021-2425-28 (181-day assessment)0.997(0.037)1.110***(0.039)0.892**(0.058)1.106(0.077)1.059(0.107)1.057(0.137)1.598***(0.132)1.019(0.021)0.946***(0.021)322 2360.981(0.037)1.104**(0.039)0.886**(0.058)1.104(0.078)1.052(0.107)1.049(0.138)1.607***(0.132)1.035*(0.021)0.967(0.021)320 089Full model
Year 2008Month July
-2 log likelihood
Note: 19,211 observations. Standard errors are within parentheses. */**/*** reportsignificance at the 10/5/1% levels. The full model controls for full-time/part-timesickness absence, first day as sick-reported, medical diagnosis, gender, age, educationallevel, born abroad, parent born abroad, marital status, number of children under 18,sick-reported history, labour market attachment, industry, home county and SI benefits.Effects are estimated as changes in the time patterns in June and July 2008 comparedwith the same months in 2007.
15(23)
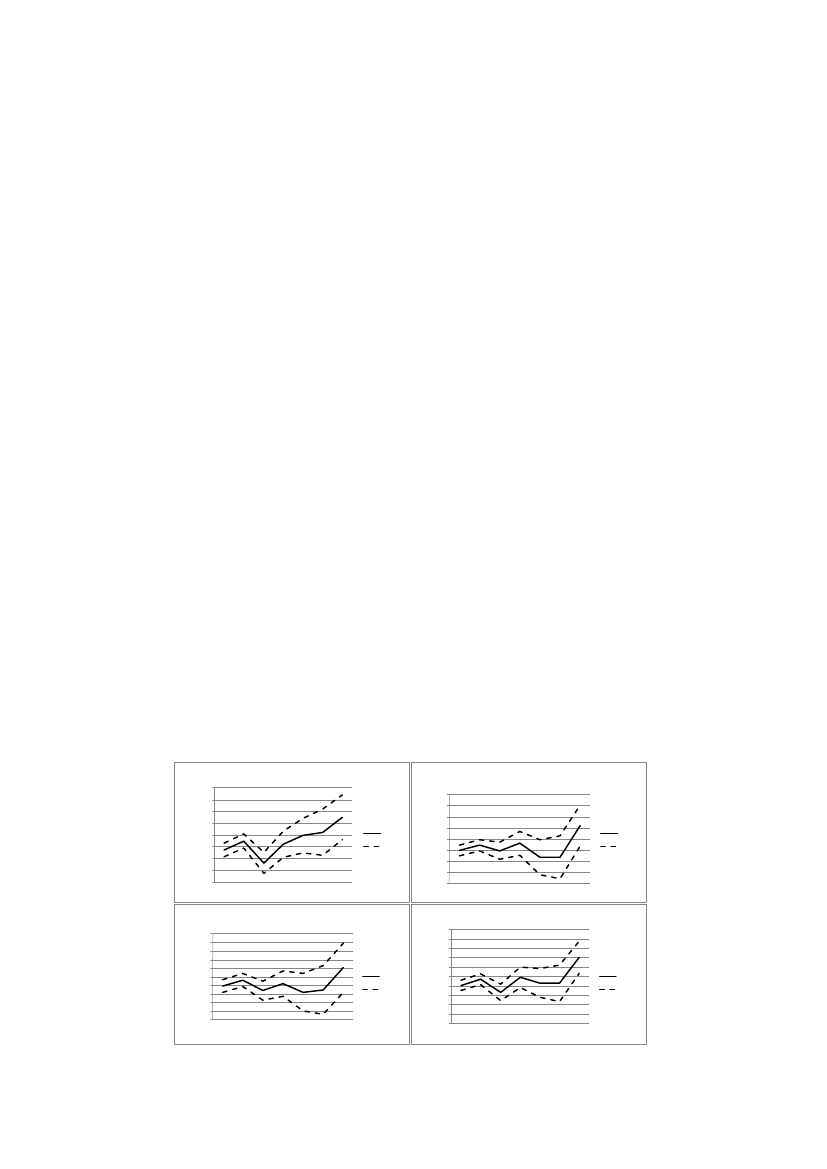
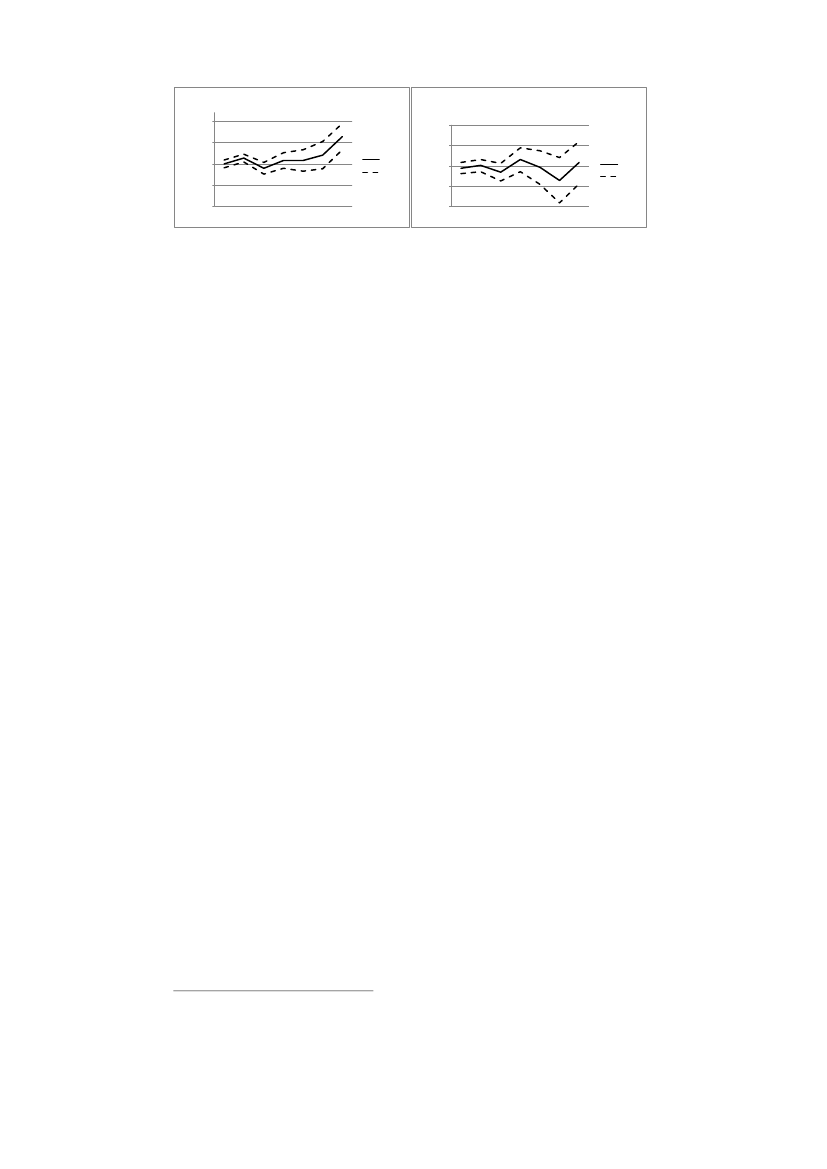
5.3 Effects for different subgroupsBoth the ability and the incentives to work are expected to vary among thesick-reported. We would therefore expect the impact of the time limits todiverge between groups in the sample.Figures 2a-4b illustrate the effect of the rehabilitation chain at differentdurations on some chosen subgroups. There are only small differencesbetween men and women (2a-b); both show sharp increases in the exitrate preceding the 181-day assessment. The reform seems to have had asomewhat more positive effect on older (45+) than on younger individuals.In contrast to the older sick reported (3a-b), the impact on younger sickreported is not significant around 6 months. The difference in the results isdue to both lower precision and a smaller impact estimate for the youngersick reported. A careful interpretation is that the on average more favorablelabour market situation for older involves better opportunities to return towork.Finally, Figures 4a-b illustrate the importance of the local labour market tothe reform impact. Figure 4a reports significant and positive effects beforeboth the 91st and the 181st day of the sick spell for an average of the big-city areas of Stockholm, Gothenburg and Malmö. Similar results are notfound in the more sparsely populated municipalities. To some extent, theresults are expected due to health differences in different parts of thecountry. However, a more favorable local labour market situation wouldalso correlate with stronger incentives to work. Comparing unemploymentrates, the unemployment rates were 7.3 and 8.1 in the large city areas andsmall municipalities, respectively.An alternative hypothesis is that the results derive from differences innorms and attitudes towards sickness absence. Hesselius, Johansson andNilsson (2009) find that when the sickness absence increases amongworking colleagues, it positively affects the individual’s sick-report rate.Comparing sick leave between different cities shows that the averagenumber of compensated sick days in big city areas was 34, and 42 insparsely populated areas. The large difference suggests that besides healthissues other explanations exist related to the local use of the sicknessinsurance system. These factors could also affect the potential for therehabilitation chain to be successful in shortening sick spells.
Figure 2a: Effect on hasard, men10,80,60,40,20-0,2-0,4-0,648121620242810,80,60,40,20-0,2-0,4-0,6
Figure 2b: Effect on hazard, women
Effect95% CI
Effect95% CI481216202428
Figure 3a: Effect on hazard, <35 years1,210,80,60,40,20-0,2-0,4-0,6-0,81,210,80,60,40,20-0,2-0,4-0,6-0,8
Figure 3b: Effect on hazard, 45- years
Effect481216202428
Effect481216202428
95% CI
95% CI
16(23)Figure 4a: Effect on hazard, big city areas1
Figure 4b: Effect on hazard rate, sparselypopulated areas10,504-0,5-181216202428
04-0,5-181216202428
Effect95% CI
0,5
Effect95% CI
5.4 The effect on future sick reportingTime limits and stricter enforcement of the SI rules are, besides shortersick spells, also expected to have an impact on the inflow to the SI system.This could potentially constitute a selection problem in this study comparingsick spells initiated before and after the reform. However, a brief look atthe data gives no such indication. Comparing June–July inflow quotes from2000 onward, the ratio is typically around 1.1 (1.09 on average). The 2008ratio is 1.03, which is lower than the 2007 ratio of 1.13. The July inflow in2008 was thus the opposite to what one would might have expected:relatively large compared with previous years.The stricter SI rules could especially be expected to affect the sick-leavebehavior among those recently reported sick. Setting a restriction on thelength of the period following the sick spell, I analyse whether the positiveeffects found in the main analysis are the effect of short-term or long-termworking spells.Figure 5 illustrates the effect of the rehabilitation chain at differentdurations when experimenting with alternative definitions of when a sickspell has ended. I analyse the effect using the restrictions 12 and 26 weeksrespectively on the subsequent working spells. That means that reportingsick again within 11 and 25 weeks of the last sick spell respectively, doesnot qualify as ending it.6Only small deviations are found compared with the main analysis, at leastup to 24 weeks. The positive impact at 5-8 weeks was thus the result ofneither shorter nor longer work spells. The effect at 6 months, on the otherhand, seems to have been generated by on average longer work spells. Thepositive impact increases from 60.7% (main analysis) to 89% using a 12-week restriction, i.e. with approximately 50%. Instead of using a 26-weekrestriction, the impact increases to about 94%. The effect thus correspondsto almost twice as many sick reported ending their sick spells at thisduration compared with the situation without the 181-day assessment. Theresults indicate that the rehabilitation chain did not only increase the exitrate from the SI system; it also created disincentives to report sick, henceprolonging the subsequent periods of work. This conclusion should howeverbe reserved for the probability that those who ended their sick spell aroundthe 181st day in the treatment group were healthier on average than theircomparisons in the non-treatment group. This would then be expected toaffect the future risk of sickness absence.
6
To exemplify: a person is reported sick for 8 weeks and then returns to work for 11weeks. The person then once again reports sick for another 8 weeks before goingback to work for 26 weeks. If the work-spell restriction is set to 12 weeks, the totalsick spell becomes 16 (8+8) weeks.
17(23)
21,81,61,41,210,80,60,4
Figure 5: Effect on hazard ratio, using work-spellrestrictionsEffect (mainanalysis)Effect (12-weekrestriction)Effect (26-weekrestriction)
Hazard ratio
4
8
12
16Weeks
20
24
28
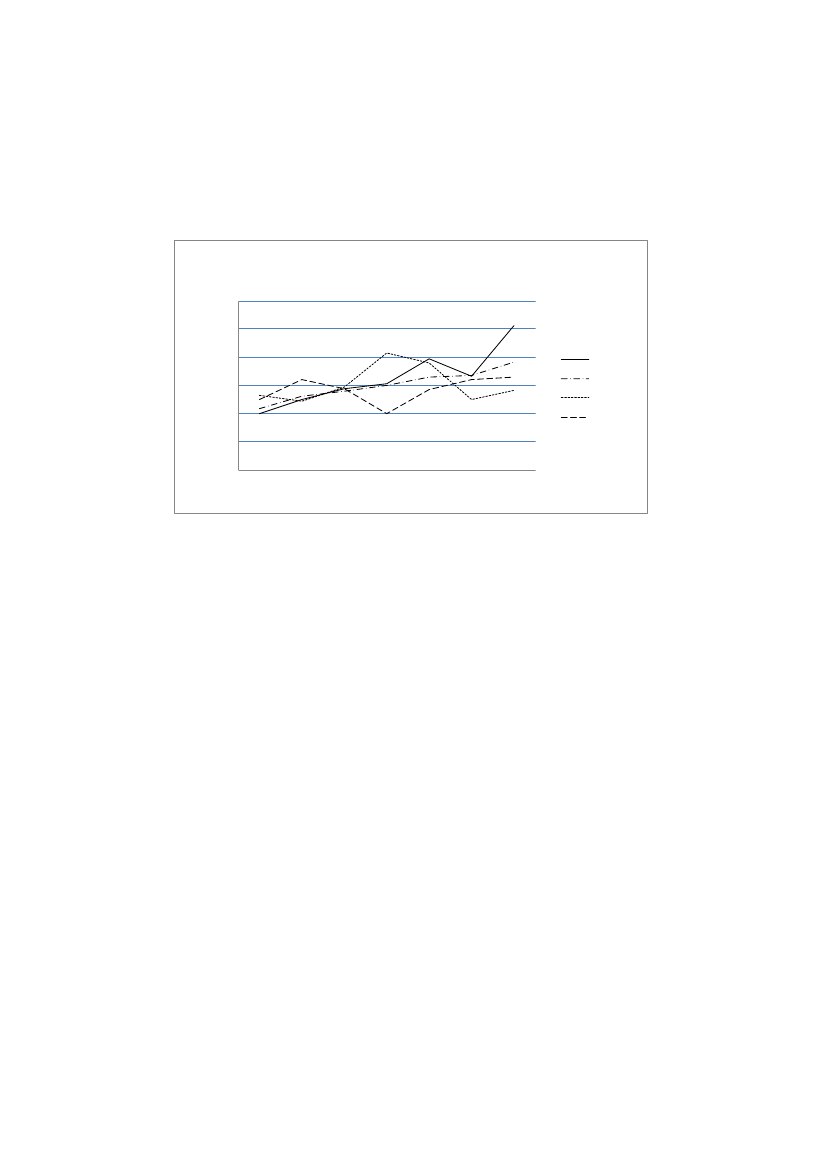
5.5 Model testIf the estimations suffer from unobserved heterogeneity, the results will bemisleading. Not finding the same effects analysing a fictitious reform,introduced at another date, would strengthen the reliability of theestimations. Table A1 (appendix) presents the hazard ratio impactestimates from a placebo reform introduced one year earlier (1 July 2007)than the actual reform. The analysis thus compares spell durations betweenperiods initiated in the last week of June 2007 and 2006 with those initiatedin the first week of July in the same years. As before, I control for richindividual information potentially correlated with health and the demand forSI benefits.The results give support to the above conclusion that the introduction ofthe rehabilitation chain has in fact increased return to work at the time ofthe work ability assessments. None of the week intervals reports significantimpact estimates. The estimate at 25-28 weeks is positive but considerablysmaller than the reform estimate.The implementation of the rehabilitation chain, where different rules wereapplied depending on the first day: reported sick, risks having negativelyaffected those in the pre-reform group in 2008. If the new sick-leaveprocess involved additional work for the administration, the June groupcould have received less attention than it otherwise would have received,affecting its outcome negatively. This would violate the condition requiringthat the comparison-group outcome should be unaffected by theexperiment group treatment.By comparing sick spells initiated in June 2007 and 2008 with sick spellsinitiated earlier in the same years, we test whether it is likely that the Junegroup was affected by the rules implemented in July 2008 or not.Figure 6 illustrates the impact of initiating a sick spell in a certain month(January, April and June) of 2008 compared with initiating it in the samemonth of 2007. The estimations are adjusted for the same backgroundinformation as in the previous analyses. The exit rate is on average 2-18%higher for the spells of 2008 at different durations. The impact is larger forlonger sick spells, which suggests that the more extensive sick spells havebecome relatively shorter than the not-so-long spells.
18(23)
There are no indications that the reform has negatively affected theoutcome of the comparison group in this study, i.e. those initiating a sickspell in June. The effect of initiating a sick spell in June is in fact largercompared with earlier months, at least up to 12 weeks. After that, theeffect is lower than average. There is no significant impact of havinginitiated the spell in June 2008, compared with having initiated it earlier inthe same year.
Figure 6: Effects on the hazard ratio of initiating a sick spellin 2008 compared to 2007, per month1,41,3
Hazard ratio
1,21,110,90,8481216202428
JanuaryAverageAprilJune
19(23)
6 ConclusionsThe main finding in this paper is that introducing time-restricted workingcapacity assessments in the public SI system have strengthened thedownward trend in sickness absence in Sweden. This seems to be the resultof people with relatively better health and better opportunities to workreturning to work at a higher rate. Analysing the effect of benefit eligibilitychecks on the 91st and 181st sickness days, large and significantly positiveeffect on the exit rate – which is approximately synonymous with return towork – are found around the assessment on the 181st day. Smaller, butsignificant, positive effect are also found before the working capacityassessment at 91 days. The fact that the exit rate increased before theactual assessments suggests that the positive effects primarily stem fromthe increased monitoring, rather than from the stricter enforcement of theSI rules themselves.Perhaps the effects would have been even more pronounced had the newrules been applied more consistently from the start. A survey performed onsick episodes initiated in the autumn of 2008 shows that the 91-dayassessment had been performed in fewer than 20% of the spells. We cantherefore assume that the assessments were not in fact performed in asignificant portion of the July group in this study.In total, the reform reduced the average number of compensated days inthe SI system by 0.27 days. This might appear to be a small impact forsuch a considerable change in policy. However, the vast majority of thosereporting sick are not directly affected by the time limits. Fewer than 20%of the sick spells reach 91 days and fewer than 10 % are still in progress at181 days. The large reform impact on return to work at 6 months thusconcerns too few to have an impact on the overall average of all sick spells.However, since long-term sickness often works as a first step towardspermanent disability benefits, the impact of the reform on the public budgetshould not be underestimated.The results demonstrate a regional pattern, with large positive effects in bigcity areas and no effects in small municipalities. The result is possibly dueto the larger labour markets offering more opportunities and strongerincentives to work. The result could also be due to region-specificdifferences in norms and attitudes towards reporting sick. For instance,sickness absence is considerably higher in the regions reporting a zeroeffect from the reform.
20(23)
ReferencesAllison, P. D. (1995)Survival Analysis using the SAS System – A PracticalGuide.Cay, NC, USA, SAS Institute Inc.Barr, N. (2004)Economics of the Welfare State.New York, OxfordUniversity Press.Black, D. A., Smith, J. A., Berger, M. C. & Noel, B. J. (2003) Is the threat ofreemployment services more effective than the services themselves?Evidence from random assignment in the UI system.American EconomicReview,93 (4), 1313-1327.Carling, K., Edin, P.-A., Harkman, A. & Holmlund, B. (1996) Unemploymentduration, unemployment benefits, and labor market programs inSweden.Journal of Public Economics,59, 313-334.Dolton, P. & O’Neill, D. (1996) Unemployment duration and the Restarteffect: Some experience evidence.The Economic Journal,106 (435),387-400.Hägglund, P. (2010)Rehabiliteringskedjans effekter på sjukskrivnings-tiderna.ISF. Report 2010: 1.Hesselius, P. & Persson, M. (2007)Incentive and spill-over effects ofsupplementary sickness compensation.Arbetsmarknadspolitiskutvärdering. Working paper 2007: 16.Hesselius, P., Johansson, P. & Larsson, L. (2005)Hur påverkar kravet påläkarintyg sjukfrånvaron? Erfarenheter från ett socialt experiment.IFAU.Report 2005: 7.Hesselius, P., Johansson, P. & Nilsson, P. (2009) Sick of your colleaguesabsence?Journal of the European Economic Association,7 (2-3), 583-594.Johansson, P. & Palme, M. (1996) Do economic incentives affect workabsence? Empirical evidence using Swedish micro data.Journal of PublicEconomics,59, 195-218.Johansson, P. & Palme, M. (2002) Assessing the effects of a compulsorysickness insurance on worker absenteeism.Journal of HumanResources,37, 381-409.Johansson, P. & Palme, M. (2005) Moral hazard and sickness insurance.Journal of Public Economics,89, 1879-1890.Johnson, T.R., Klepinger, D.H. 1994 Experimental evidence onunemployment insurance work-search policies.Journal of HumanResources,29 (3), 696-717.Klepinger, D.H., Johnson, T.R., Joesch, J.M. 2002 Effects of unemploymentinsurance work-search requirements: The Maryland experiment.Industrial and Labor Relations review,56 (1), 3-22.Meyer, B. (1990) Unemployment insurance and unemployment spells.Econometrica,58, 757-782.OECD (2009)Sickness, disability and work: Breaking the barriers –Sweden: Will the recent reforms make it?OECD. Report.Socialförsäkringsutredningen (2006)Mera försäkring och mera arbete.SOU. 2006: 86.
21(23)
Swedish Social Insurance Agency (2009)Sjukfrånvaron i Sverige – På vägmot europeiska nivåer.Social Insurance Report 2009: 10.
22(23)
AppendixTable A1Effect of a placebo reform on the off-SIhazard ratio: full model
Interval (week)3-45-89-12 (91-day assessment)13-1617-2021-2425-28 (181-day assessment)0.983(0.036)0.995(0.039)1.027(0.054)1.118(0.074)1.060(0.102)0.915(0.137)1.104(0.140)
Year 2007Month July
1.039*(0.020)0.969(0.021)338 450
-2 log likelihood
Note: 20,399 observations. Standard errors are withinparentheses. */**/*** report significance at the 10/5/1%levels. The full model controls for full-time/part-timesickness absence, first day as sick-reported, medicaldiagnosis, gender, age, educational level, born abroad,parent born abroad, marital status, number of childrenunder 18, sick-reported history, labour market attachment,industry, home county and SI benefits. Effects areestimated as changes in the time patterns in June and July2007 compared with the same months in 2006.
adressBox 202, 101 24 StockholmbesöksadressFleminggatan 7 Stockholmtelefon08 58 00 15 00fax08 58 00 15 90e-post[email protected]webbwww.inspsf.se