Udenrigsudvalget 2012-13
URU Alm.del Bilag 241
Offentligt
Levels & Trends in
ChildMortality
Report 2013Estimates Developed by theUN Inter-agency Group forChild Mortality Estimation
UnitedNations
This report was prepared at UNICEF Headquarters by Danzhen You, Phillip Bastian, Jingxian Wu and Tessa Wardlaw on behalfof the United Nations Inter-agency Group for Child Mortality Estimation.Organizations and individuals involved in generating country-specific estimates on child mortalityUnited Nations Children’s FundDanzhen You, Phillip Bastian, Jingxian Wu, Tessa WardlawWorld Health OrganizationColin Mathers, Ties Boerma, Jessica HoThe World BankEmi SuzukiUnited Nations, Department of Economic and Social Affairs, Population DivisionFrancois Pelletier, Kirill Andreev, Patrick Gerland, Danan Gu, Nan Li, Cheryl Sawyer, Thomas SpoorenbergUnited Nations Economic Commission for Latin America and the Caribbean Population DivisionGuiomar Bay, Tim Miller, Dirk Jaspers FaijerSpecial thanks to the Technical Advisory Group of the Inter-agency Group for Child Mortality Estimation for providingtechnical guidance on methods for child mortality estimationKenneth Hill (Chair), Harvard UniversityLeontineAlkema, National University of SingaporeSimon Cousens, London School of Hygiene and TropicalMedicineTrevor Croft, Measure DHS, ICF MacroGareth Jones, ConsultantMichel Guillot, University of PennsylvaniaJon Pedersen, FafoNeff Walker, Johns Hopkins University
Further thanks go to Jin Rou New and Fengqing Chao from the National University of Singapore for their assistance in pre-paring the UN IGME estimates. Thanks also go to David Anthony, Ivana Bjelic, Liliana Carvajal, Yadigar Coskun, ArchanaDwivedi, Attila Hancioglu, Priscilla Idele, Claes Johansson, Rolf Luyendijk, Colleen Murray, Holly Newby, Tyler Porth, Tur-gay Unalan, Daniel Vadnais and Upasana Young from UNICEF as well as Joy Lawn from the London School of Hygiene andTropical Medicine for their support. And special thanks to Khin Wityee Oo from UNICEF for proofreading. Special thanks toUNAIDS for sharing estimates on AIDS mortality.Communications Development Incorporated provided overall design direction, editing and layout.Copyright � 2013by the United Nations Children’s FundThe Inter-agency Group for Child Mortality Estimation (UN IGME) constitutes representatives of the United Nations Chil-dren’s Fund, the World Health Organization, the World Bank and the United Nations Population Division. The child mortalityestimates presented in this report have been reviewed by UN IGME members. As new information becomes available, estimateswill be updated by the UN IGME. Differences between the estimates presented in this report and those in forthcoming publica-tions by UN IGME members may arise because of differences in reporting periods or in the availability of data during the pro-duction process of each publication and other evidence.The designations employed and the presentation of the material in this publication do not imply the expression of any opinionwhatsoever on the part of UNICEF, the World Health Organization, the World Bank or the United Nations Population Divisionconcerning the legal status of any country, territory, city or area or of its authorities, or concerning the delimitation of its fron-tiers or boundaries. Dotted lines on maps represent approximate border lines for which there may not yet be full agreement.United Nations Children’s Fund3 UN Plaza, New York, New York, 10017 USAWorld Health OrganizationAvenue Appia 20, 1211 Geneva 27, SwitzerlandThe World Bank1818 H Street, NW, Washington, DC, 20433 USAUnited Nations Population Division2 UN Plaza, New York, New York, 10017 USA
PROGRESS TOWARDS MillEnniuM DEvElOPMEnT GOAl 4:KEY FACTS AnD FiGuRES•Overall, substantial progress has been madetowards achieving MDG4. The number ofunder-five deaths worldwide has declinedfrom 12.6 (12.4, 12.9)1million in 1990 to 6.6(6.3, 7.0) million in 2012. While that trans-lates into around 17,000 fewer children dyingevery day in 2012 than in 1990, it still impliesthe deaths of nearly 18,000 children underage five every day in 2012.Since 1990 the global under-five mortalityrate has dropped 47percent—from 90 (89,92) deaths per 1,000 live births in 1990 to 48(46, 51) in 2012. All regions, except for Sub-Saharan Africa and Oceania, have reducedtheir under-five mortality rate by 50percentor more.2The average annual rate of reduction inunder-five mortality has accelerated—from 1.2percent a year over 1990–1995 to3.9percent over 2005–2012—but remainsinsufficient to reach MDG4, particularly inOceania, Sub-Saharan Africa, Caucasus andCentral Asia, and Southern Asia.The highest rates of child mortality are stillin Sub-Saharan Africa, with an under-fivemortality rate of 98 deaths per 1,000 livebirths—more than 15 times the average fordeveloped regions.Under-five deaths are increasingly concen-trated in Sub-Saharan Africa and SouthernAsia, while the share in the rest of the worlddropped from 32percent in 1990 to 18per-cent in 2012.• Sub-Saharan Africa, however, has seen afaster decline in its under-five mortality rateover time, with the average annual rate ofreduction increasing from 0.8percent in1990–1995 to 4.1percent in 2005–2012.• About half of under-five deaths occur in onlyfive countries: India, Nigeria, DemocraticRepublic of the Congo, Pakistan and China.India (22percent) and Nigeria (13percent)together account for more than a third of allunder-five deaths.• The proportion of under-five deaths thatoccur within the first month of life (the neo-natal period) has increased 19percentsince 1990, from 37percent to 44percent,because declines in the neonatal mortalityrate are slower than those in the mortalityrate for older children.•Around two-thirds of neonatal deaths occurin just 10 countries, with India accounting formore than a quarter and Nigeria for a tenth.Sub-Saharan Africa, with the highest risk ofdeath in the first month of life, is among theregions showing the least progress in reduc-ing the neonatal mortality rate.
•
•
••
•
• The leading causes of death among childrenunder age five include pneumonia (17per-cent of all under-five deaths), preterm birthcomplications (15percent), intrapartum-related complications (complications duringbirth; 10percent), diarrhoea (9percent) andmalaria (7percent). Globally, about 45per-cent of under-five deaths are attributable toundernutrition.
1
IntroductionMillennium Development Goal 4 (MDG4) callsfor reducing the under-five mortality rate by two-thirds between 1990 and 2015. The world hasmade substantial progress, reducing the under-fivemortality rate 47percent, from 90 (89, 92) deathsper 1,000 live births in 1990 to 48 (46, 51) in 2012.However, this progress has not been enough, andthe target risks being missed at the global level. Toachieve MDG4 on time, the global annual rate ofreduction in under-five mortality rate would needto rise to 15.6percent for 2012–2015, much fasterthan the 3.9percent achieved over 2005–2012. Atthe country level, historical trends show that prog-ress for most countries has been too slow and thatonly 13 of the 61 countries with high under-fivemortality rates (at least 40 deaths per 1,000 livebirths in 2012) are currently on track to achieveMDG4—with an average annual rate of reductionof 4.4percent or more.Still, in 2012, 6.6 (6.3, 7.0) million children diedbefore reaching their fifth birthday, mostly frompreventable causes and treatable diseases, eventhough the knowledge and technologies forlife-saving interventions are available. In addi-tion, inequities in child mortality between high-income and low-income countries remain large.In 2012 the under-five mortality rate in low-income countries was 82 deaths per 1,000 livebirths—more than 13 times the average rate inhigh-income countries (6). Many countries stillhave very high under-five mortality rates—par-ticularly those in Sub-Saharan Africa, home toall 16 countries with an under-five mortality rateabove 100 deaths per 1,000 live births. Reduc-ing these inequities across countries and savingmore children’s lives by ending preventable childdeaths are important priorities.In 2012 the governments of Ethiopia, India andthe United States, in close collaboration withUNICEF, convened the Child Survival Call toAction Forum to mobilize political leadership toend preventable child deaths. Partners emergedfrom the Call to Action with a revitalized com-mitment to child survival under the banner of APromise Renewed. More than 170 governmentshave signed a pledge to redouble their efforts toend preventable child deaths so that more coun-tries achieve MDG4 and sustain momentumbeyond 2015.As global impetus and investment for accelerat-ing child survival grow, monitoring progress atthe global and country levels has become evenmore critical. The United Nations Inter-agencyGroup for Child Mortality Estimation (UNIGME) updates child mortality estimates annu-ally, and this report presents the UN IGME’s lat-est estimates of under-five, infant and neonatalmortality and assesses progress towards MDG4 atthe country, regional and global levels.
2
Estimating Child MortalityThe UN Inter-agency Group for ChildMortality EstimationThe UN IGME was formed in 2004 to share dataon child mortality, harmonize estimates withinthe UN system, improve methods for child mor-tality estimation, report on progress towards theMillennium Development Goals and enhancecountry capacity to produce timely and prop-erly assessed estimates of child mortality. TheUN IGME includes UNICEF, the World HealthOrganization (WHO), the World Bank andthe United Nations Population Division of theDepartment of Economic and Social Affairs asfull members.The UN IGME’s Technical Advisory Group, com-prising leading academic scholars and indepen-dent experts in demography and biostatistics,provides guidance on estimation methods, tech-nical issues and strategies for data analysis anddata quality assessment.The UN IGME seeks to compile all availablenational-level data on child mortality, includingdata from vital registration systems, populationcensuses, household surveys and sample regis-tration systems. To estimate the under-five mor-tality trend series for each country, a statisticalmodel is fitted to data points that meet qualitystandards established by the UN IGME and thenused to predict a trend line that is extrapolatedto a common reference year, set at 2012 for theestimates in this report. Infant mortality rates aregenerated by either applying a statistical modelor transforming under-five mortality rates basedon model life tables. Neonatal mortality rates areproduced using a statistical model that uses under-five mortality rates as an input. These methodsprovide a transparent and objective way of fittinga smoothed trend to a set of observations and ofextrapolating the trend from 1960 to the present.
Data sources and methodologyGenerating accurate estimates of child mortal-ity is a considerable challenge because of thelimited availability of high-quality data for manycountries. Vital registration systems are the pre-ferred source of data on child mortality becausethey collect information as events occur andthey cover the entire population. If registra-tion coverage is complete and the systems func-tion efficiently, the resulting child mortalityestimates will be accurate and timely. However,many countries lack fully functioning vital regis-tration systems that accurately record all birthsand deaths. Therefore, household surveys, suchas the UNICEF-supported Multiple IndicatorCluster Surveys and the US Agency for Interna-tional Development–supported Demographicand Health Surveys, have become the primarysources of data on child mortality in countrieswithout functioning vital registration systems.These surveys ask women about the survival oftheir children, and they provide the basis of childmortality estimates for most of these countries.4
Changes in the estimation processThe UN IGME continually seeks to improve itsmethods and may introduce changes from oneyear to the next. This year, a new estimationmethod is used for estimating and extrapolat-ing the under-five mortality rate, referred to asthe Bayesian B-splines bias-adjusted model orthe B3 model. Compared with the Loess estima-tion approach that the UN IGME used in previ-ous years, the B3 model better accounts for dataerrors, including biases and sampling and non-sampling errors in the data; it can better captureshort-term fluctuations in the under-five mortal-ity rate and its annual rate of reduction. Thus, itis better able to account for evidence of accelera-tion in the decline of under-five mortality fromnew surveys. Validation exercises show that theB3 model also performs better in projections. Amore complete technical description of the B3model is available elsewhere.3In 2012 the UN IGME produced estimates of theunder-five mortality rate for males and femalesseparately for the first time. In many countriesfewer sources have provided data by sex than
Why does the un iGME generate estimates on child mortality based on national data from censuses,surveys or vital registration systems but not directly use these national data as its official estimates?
•
Many developing countries lack a singlesource of high-quality data covering the lastseveral decades.Available data collected by countries areoften inconsistent across sources. It isimportant to analyse, reconcile and evalu-ate all data sources simultaneously for eachcountry. Each new survey or data pointmust be examined in the context of all othersources, including previous data.Data suffer from sampling or nonsamplingerrors (such as misreporting of age and sur-vivor selection bias; underreporting of childdeaths is also common). The UN IGMEassesses the quality of underlying datasources and adjusts data when necessary.In the absence of error-free data, there willalways be uncertainty around data and esti-mates. To allow for added comparability, theUN IGME generates such estimates withuncertainty bounds.The latest data produced by countries oftenare not current estimates but refer to anearlier reference period. This is particularlythe case for estimates from the most recentnational survey (such as a Multiple Indi-cator Cluster Survey or Demographic andHealth Survey), which typically refers to aperiod before the survey year that is severalyears before the target year of UN IGMEestimates. Thus, the UN IGME also extrap-olates estimates to a common referenceyear.A consistent and comparable trend line from1990 is needed for monitoring progresstowards MDG4 for each country.The UN IGME aims to minimize the errorsfor each estimate, harmonize trends over
time and produce up-to-date and properlyassessed estimates of child mortality.• Applying a consistent methodology alsoallows for comparisons between countries,despite the varied number and types of datasources. One objective of the UN IGME isto provide valid and comparable child mor-tality estimates for policymakers. To do so,the UN IGME applies a common methodol-ogy across countries and uses original empir-ical data from each country but does notreport figures produced by individual coun-tries using other methods, which would notbe comparable to other country estimates.•To increase the transparency of the estima-tion process, the UN IGME has developeda global database. All data, estimates anddetails on the UN IGME methods areavailable on the CME Info website atwww.childmortality.org.
•
•
Broad strategy of the un iGME•The UN IGME follows a broad strategy to gener-ate annual estimates of child mortality:• Compile all available nationally representativedata relevant to the estimation of child mor-tality, including data from vital registrationsystems, population censuses, householdsurveys and sample registration systems.•Assess data quality, recalculate data andmake adjustments if needed by applyingstandard methods.Fit a statistical model to the data observa-tions to generate a trend curve.
•
•
•
• Extrapolate the model to a target year, in thiscase 2012.
5
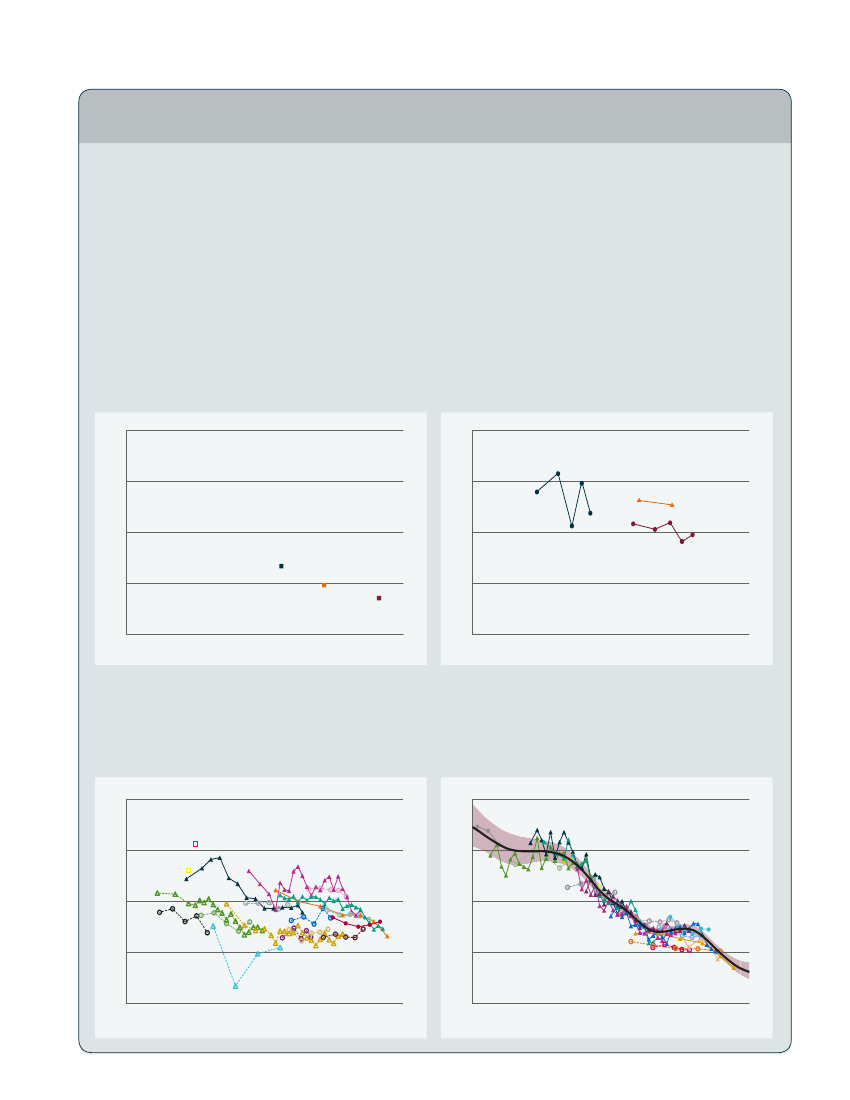
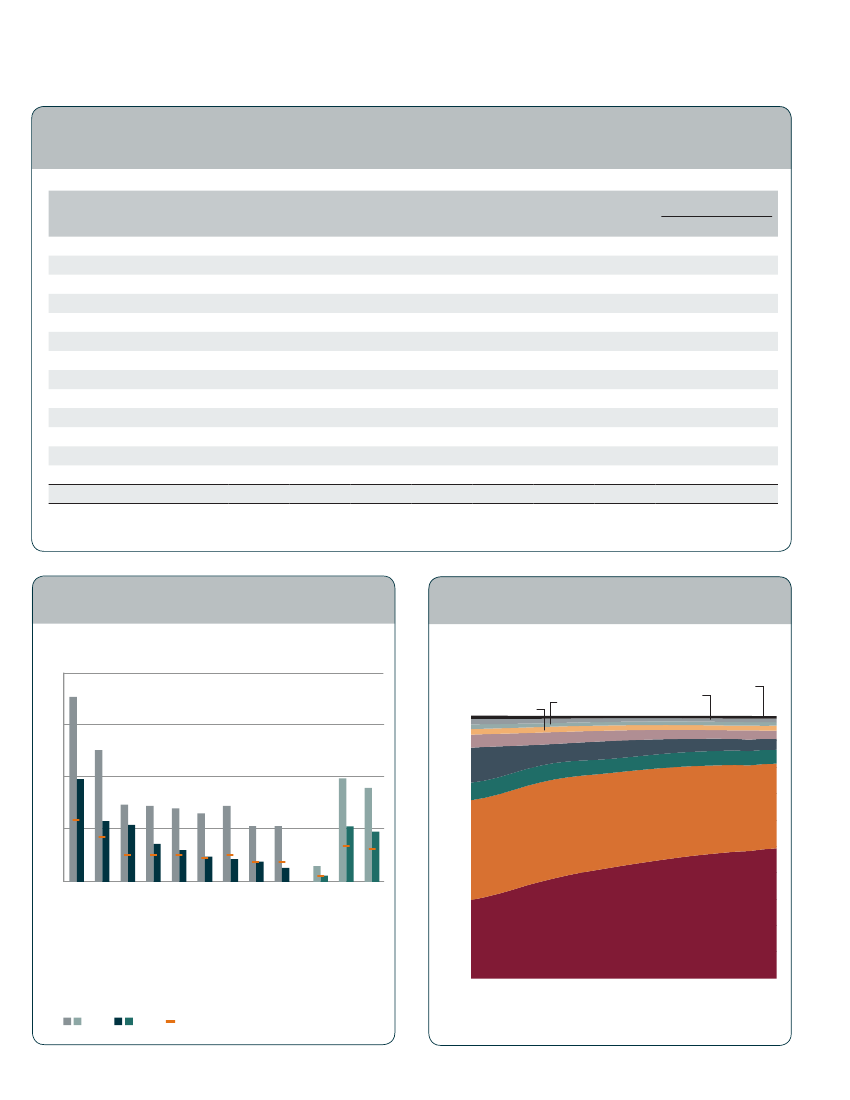
Examples of country dataUnder-five mortality estimation is challenging in the absenceof complete vital registration systems, as is the case in manydeveloping countries. Existing data sources often sufferfrom various data quality issues, including underreporting ofdeaths, misreporting of ages, selection bias and other sam-pling and nonsampling errors. Below are examples of thereal underlying mortality data used to derive the estimatesof the under-five mortality rate from countries with sparsedata (Democratic People’s Republic of Korea and Djibouti),acountry with abundant data but wide variations in the ratesand trends between data sources (Nigeria) and a countrywith abundant data and small variations between data points(Senegal). The Senegal example also shows the trend line ofthe under-five mortality rate that results from the B3 curve-fitting (black line) with the corresponding 90percent un-certainty range (red band). Detailed graphs showing all theunderlying data and the UN IGME trend estimates are avail-able for all countries at www.childmortality.org.
Examples of country data sourcesCountries with sparse dataDemocratic People’s Republic of KoreaUnder-five mortality rate (deaths per 1,000 live births)
DjiboutiUnder-five mortality rate (deaths per 1,000 live births)
200
200
150
150
100
100
50
50
01970
1980
1990
2000
2012
01970
1980
1990
2000
2012
Countries with abundant dataCountry with wide variations in mortality ratesfrom different data sourcesNigeriaUnder-five mortality rate (deaths per 1,000 live births)
Country with consistent trendsSenegalUnder-five mortality rate (deaths per 1,000 live births)
400
400
300
300
200
200
100
100
01950
1960
1970
1980
1990
2000
2012
01950
1960
1970
1980
1990
2000
2012
6
have provided data for both sexes combined. Forthis reason the UN IGME uses the available databy sex to estimate a time trend in the sex ratio(male : female) of child mortality, rather thanestimate child mortality trends by sex directlyfrom reported sex-specific mortality rates. Thisyear, new Bayesian methods have been developedby the UN IGME for estimating sex ratios of childmortality, with a focus on identifying countrieswith outlying levels or trends.4In addition to the changes in the methods, asubstantial amount of newly available data havebeen incorporated: data from about 50 surveysand censuses conducted since 2009 for almost 50countries, data from more than 30 surveys andcensuses conducted before 2009 for more than10 countries and new data from vital registrationsystems for about 90 countries.The increased data availability has substantiallychanged the estimates for some countries fromprevious editions partly because the fitted trendline is based on the entire time series of dataavailable for each country. In addition, changesfrom the Loess model to the B3 model may causechanges in the estimates, though results are moreor less similar for most of the countries. The esti-mates presented in this report may differ fromand are not necessarily comparable with previoussets of the UN IGME estimates or the most recentunderlying country data.
members, including UNICEF, the WHO and otherUN agencies, are actively involved in strengthen-ing national capacity in data collection, estimationtechniques and interpretation of results.Population-based survey data are critical fordeveloping reliable estimates for countries lack-ing functioning vital registration systems. TheUNICEF-supported Multiple Indicator ClusterSurveys programme has been working since 1995to build country-level capacity for survey imple-mentation, data analysis and dissemination. Thesurveys are government owned and implemented,with UNICEF providing support through work-shops, technical consultations and peer-to-peermentoring. More than 200 surveys have beenconducted in some 100 countries. In addition topopulation-based surveys, the WHO, the WorldBank and the UN Statistics Division work withcountries to strengthen vital registration systems.UNICEF supports this work by promoting andmonitoring progress in birth registration. TheUnited Nations Population Fund provides tech-nical assistance for population censuses, anotherimportant source of under-five mortality data.The UN IGME strengthens capacity by work-ing with countries to improve understanding ofunder-five mortality data and estimation. CMEInfo, a comprehensive data portal on child mor-tality funded and maintained by UNICEF, is apowerful platform for sharing underlying dataand collaborating with national partners onchild mortality estimates. Since 2008 a series ofregional workshops has been held, training morethan 250 participants from 94 countries in theuse of CME Info as well as the demographic tech-niques and modelling methods underlying theestimates. In the last few years UNICEF and theUN IGME have sent experts to some 15 countriesto conduct training on child mortality estima-tion. As part of the data review process, UNICEF’snetwork of field offices provides opportunities toassess the plausibility of estimates by engaging ina dialogue about the estimates and the underly-ing data. WHO and UNICEF also engage coun-tries in a country consultation process throughwhich governments provide feedback on the esti-mates and their underlying data.Guiding this capacity strengthening work is afundamental principle: child mortality estima-tion is not simply an academic exercise but a7
Country consultationA joint WHO–UNICEF country consultation wasundertaken in July 2013 to give each country’sMinistry of Health and National Statistics Officethe opportunity to review all data inputs and thedraft estimates for its country. The objective wasto identify relevant data not included in the UNIGME’s database—Child Mortality EstimationInformation (CME Info)—and allow countriesto review and provide feedback on estimates; itwas not, however, a country clearance process.In 2013, 99 of 195 countries showed interest andreceived the preliminary estimates; 47 of themprovided comments or data; and estimates wererevised for 28 countries using new data.Capacity strengthening at the countrylevelModelled estimates of child mortality can onlybe as good as the underlying data. UN IGME
fundamental part of effective policies and pro-gramming. UNICEF works with countries toensure that child mortality estimates are usedeffectively at the country level, in conjunctionwith other data on child health, to improve
child survival programmes and stimulate actionthrough advocacy. This work involves partneringwith other agencies, organizations, and initiativessuch as the Countdown to 2015.
8
Levels and Trends inChildMortality, 1990–2012Under-five mortalityThe latest estimates of under-five mortalityfrom the UN IGME show that under-five mor-tality declined 47percent, from 90 (89, 92)deaths per 1,000 live births in 1990 to 48 (46,51) in 2012 (table 1). As a result, the total num-ber of under-five deaths in the world has fallenfrom 12.6million in 1990 to 6.6million in 2012(table2)—thanks to more effective and afford-able treatments, innovative ways of deliveringcritical interventions to the poor and excluded,and sustained political commitment.The past two decades have witnessed an accel-eration of progress in lowering mortality amongchildren under age five, with the global annualrate of reduction increasing to 3.9percent over2005–2012 from 1.2percent in 1990–1995,2.3percent in 1995–2000 and 3.7percent in2000–2005.TABlE
Regional trends are also encouraging. All regionshave reduced the under-five mortality rate bymore than half since 1990 except for Sub-Saha-ran Africa and Oceania (figure 1). Eastern Asia,with a reduction of 74percent, and NorthernAfrica, 69percent, have already reduced theunder-five mortality rate by two-thirds since1990—the required reduction to achieve MDG4.Latin America and the Caribbean, with a reduc-tion of 65percent, and Western Asia, 62percent,are also on track to meet the MDG4 target.Many countries have made and are still mak-ing tremendous progress in lowering under-fivemortality. Of the 61 high-mortality countrieswith at least 40 deaths per 1,000 live births in2012, 25 have reduced their under-five mortalityrate by at least half between 1990 and 2012. Ofthem, Bangladesh (72percent), Malawi (71per-cent), Nepal (71percent), Liberia (70percent),
1
levels and trends in the under-five mortality rate, by Millennium Development Goal region,1990–2012 (deaths per 1,000 live births, unless otherwise indicated)
Region
1990
1995
2000
2005
2010
2012
MDGtarget2015
Decline(percent)1990–2012
Annual rate ofreduction(percent)1990–20121990–20002000–2012
Developed regionsDeveloping regionsNorthern AfricaSub-Saharan AfricaLatin America and the CaribbeanCaucasus and Central AsiaEastern AsiaExcluding ChinaSouthern AsiaExcluding IndiaSouth-eastern AsiaWestern AsiaOceaniaWorld
1599731775473532712612571657490
1193571704373463310910958547085
10834315532623731929348426775
8693113025492420767838346463
7572410623391617636633265852
653229819361415586130255548
53324591824189424224222530
5747694565507445545157622647
3.82.95.42.74.73.26.12.73.53.33.94.41.42.9
3.91.85.31.45.11.63.7–1.23.13.03.94.41.01.7
3.83.85.53.84.44.58.05.93.93.53.84.51.73.8
Note: All calculations are based on unrounded numbers.
9
TABlE
2
levels and trends in the number of deaths of children under agefive, by Millennium Development Goal region,1990–2012 (thousands, unless otherwise indicated)
Region
1990
1995
2000
2005
2010
2012
Decline(percent)1990–2012
Share of global under-five deaths(percent)19902012
Developed regionsDeveloping regionsNorthern AfricaSub-Saharan AfricaLatin America and the CaribbeanCaucasus and Central AsiaEastern AsiaExcluding ChinaSouthern AsiaExcluding IndiaSouth-eastern AsiaWestern AsiaOceaniaWorld
22612,3942683,7726271461,675284,7841,4598432651412,621
15310,7011883,998500122862424,0961,2416922291510,854
1319,5681374,08438386659303,4921,078521189169,699
1128,1231013,79128672426172,835850446150168,234
976,901913,39124969304152,277755380125156,998
906,463883,24520664272142,108694346120156,553
604867146756845156525955–348
1.898.22.129.95.01.213.30.237.911.66.72.10.1100.0
1.498.61.349.53.11.04.20.232.210.65.31.80.2100.0
Note: All calculations are based on unrounded numbers.
FiGuRE
1
under-five mortality declined in allregions between 1990 and 2012
FiGuRE
2
nearly half the world’s under-five deaths wereconcentrated in Sub-Saharan Africa in 2012
Under-five mortality rate, by Millenium Development Goal region, 1990 and2012 (deaths per 1,000 live births)200177
Share of global under-five deaths by Millennium DevelopmentGoal region, 1990–2012 (percent)Northern AfricaDeveloped regionsOceania
150126
1009099
Western Asia
Latin America and the CaribbeanEastern AsiaSouth-eastern Asia
90
100
98
8070
74
73
71
58
55
65
7354
53
36
50
30
48
6050Southern Asia
25
22
19
14
15
53
0Latin America andthe CaribbeanEastern AsiaCaucasus and Central AsiaSub-Saharan AfricaSouth-eastern AsiaDeveloped regionsWestern AsiaNorthern AfricaSouthern AsiaOceaniaDeveloping regionsWorld
403020Sub-Saharan Africa100199019921994199619982000200220042006200820102012
1990
2012
MDG target in 2015
10
6
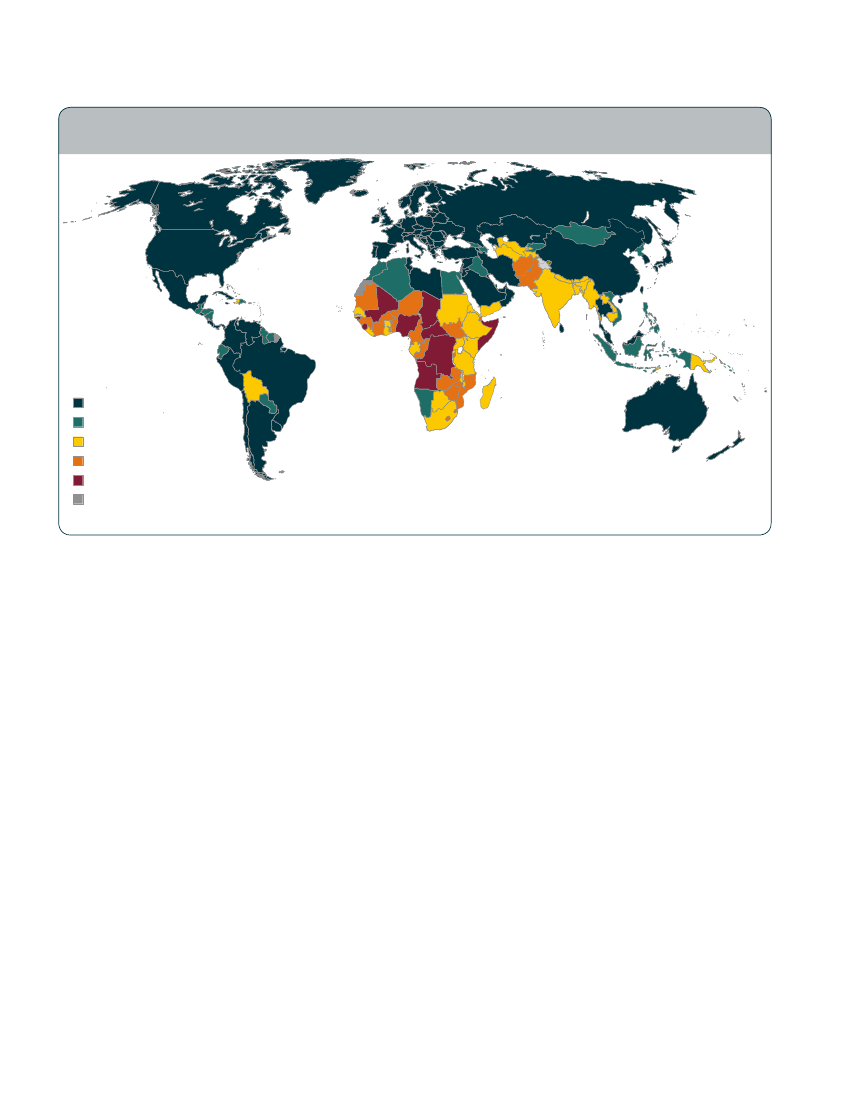
MAP
1
Children in Sub-Saharan Africa and Southern Asia face a higher risk of dying beforetheirfifthbirthday
Under-five mortality rate, 2012(deaths per 1,000 live births)Less than 2020–3940–7980–119120 or moreData not availableNote: This map is stylized and not to scale. It does not reflect a position by UN IGME agencies on the legal status of any country or territory or the delimitation of any frontiers.
Tanzania (68percent), Timor-Leste (67per-cent), and Ethiopia (67percent) have alreadyreduced the under-five mortality rate by two-thirds. In absolute terms 15 countries madereductions surpassing 100 deaths per 1,000 livebirths since 1990.However, improving child survival remains unfin-ished, and wide disparities exist among regionsand countries (map 1). Globally, the under-fivemortality rate has dropped 47percent since1990—far from the required two-thirds reduc-tion. The rate of decline in under-five mortalityhas accelerated but remains insufficient to reachMDG4, particularly in Sub-Saharan Africa, Oce-ania, Caucasus and Central Asia, and SouthernAsia. If current trends continue, only four MDGregions (Eastern Asia, Northern Africa, LatinAmerica and the Caribbean, and Western Asia)are expected to achieve MDG4 by 2015.Sub-Saharan Africa continues to confront sig-nificant challenges, as the region with the high-est mortality rates in the world—98 deaths per1,000 live births in 2012. All 16 countries with anunder-five mortality rate above 100 deaths per1,000 live births are in Sub-Sahara Africa. With
a reduction of only 45percent since 1990 in thisregion, progress has been slower than any otherregion except Oceania. As the rest of the worldreduces child mortality, under-five deaths arebecoming ever-more concentrated in Sub-Saha-ran Africa—3.2million deaths (nearly half theglobal under-five deaths) occurred in this regionin 2012 (figure 2). It is the only region in whichthe numbers of live births and child populationare expected to rise substantially over the nexttwo decades.By 2050 close to 40percent of all live births willtake place in Sub-Saharan Africa and 37percentof the world’s children under age five will live inthe region. Therefore, the number of under-fivedeaths may stagnate or even increase withoutmore progress in the region. Despite Sub-Saha-ran Africa’s relatively high rates of under-fivemortality, there are signs of progress in theregion. The rate of decline in under-five mortal-ity has accelerated over time—from 0.8percenta year over 1990–1995 to 4.1percent a year over2000–2012. Higher annual rates of reduction,particularly in eastern and southern Africa, showthat rapid decline in low-income countries ispossible.11
Southern Asia also continues to have both a highrate of under-five mortality (58 deaths per 1,000live births) and a large number of total deaths,at 2.1million. India has the highest number ofunder-five deaths in the world, with 1.4millionunder-five deaths in 2012.Globally, an estimated 6.6million children died(12 deaths every minute) in 2012, mostly frompreventable diseases. Pneumonia, diarrhoea andmalaria together killed roughly 2.2million chil-dren under age five in 2012, accounting for athird of all under-five deaths.Evidence shows that violence and political fragil-ity (weakened capacity to sustain core state func-tions) contribute to higher rates of under-fivemortality. Of the 20 countries with the world’shighest under-five mortality rates, 13 are eitheraffected markedly by conflict or violence, orare in fragile situations.5Of these 20, 9 are alsoamong the list of top 20 countries with the lowestannual rate of reduction since 1990 (excludingcountries with population less than half a mil-lion), indicating that there is little progress in thecountries where progress is most needed.Moreover, emerging evidence has shown alarm-ing disparities in under-five mortality at the sub-national level in many countries. Children areat greater risk of dying before age five if theyare born in rural areas, poor households, or to amother denied basic education.
In summary, much has already been achievedin child survival but much remains to be done.There is still time, however, to make a difference.Accelerating the reduction in under-five mortal-ity is possible by expanding effective preventiveand curative interventions that target the maincauses of post-neonatal deaths (pneumonia, diar-rhoea, malaria and undernutrition) and the mostvulnerable newborn babies and children. A revi-talized commitment to child survival towardsthe ultimate aim of ending preventable childdeaths is essential. A Promise Renewed—the callto action spearheaded by UNICEF and the USAgency for International Development to endall preventable child deaths by 2035—is such acommitment and more than 170 countries havesigned on to it. Countries, the United Nationsand its agencies, civil society and private sectororganizations must commit to redouble theirefforts to reduce child mortality and include thiscommitment in the post-2015 agenda.
Neonatal mortalityThe first 28 days of life—the neonatal period—represent the most vulnerable time for a child’ssurvival. In 2012 roughly 44percent of under-five deaths occur during this period. Reducingneonatal mortality is increasingly importantnot only because the proportions of under-fivedeaths that occur during the neonatal period isincreasing as under-five mortality declines, butalso because the health interventions neededto address the major causes of neonatal deaths
12
generally differ from those needed to addressother under-five deaths.The good news is that neonatal mortality is onthe decline globally. The world’s neonatal mor-tality rate fell from 33 deaths per 1,000 live birthsin 1990 to 21 in 2012. The global number of neo-natal deaths declined from 4.6million in 1990 to2.9million in 2012 (table 3).While under-five mortality reduction has beensignificant, progress in reducing neonatal mor-tality has been slower. For the world as a whole,the neonatal mortality rate declined 37percent—less than the 47percent decline in the under-fivemortality rate (figure 3). There is a consistentpattern of faster decline in the under-five mor-tality rate compared with the neonatal mortalityrate across all MDG regions.Because declines in the neonatal mortality rateare slower than those in the mortality rate forolder children, the share of neonatal deathsamong under-five deaths has increased fromabout 37percent in 1990 to 44percent in 2012.
FiGuRE
3
Decline in the neonatal mortality rateis slower than the decline in under-five mortality rate in all regions
Decline in under-five mortality rate and neonatal mortality rate, byMillennium Development Goal region, 1990–2012 (percent)74696580
6562
51
54
50
57544737Caucasus and Central AsiaSub-Saharan AfricaOceania172826Developed regionsNeonatal mortality rateRelative increase(percent)1990–2012
56
60
58
57
45
40
39
40
45
20
0Eastern AsiaNorthern AfricaLatin America andthe CaribbeanWestern AsiaSouth-eastern AsiaSouthern AsiaDeveloping regionsWorld
Under-five mortality rate
TABlE
3
neonatal mortality rate, number of neonatal deaths and neonatal deaths as a share ofunder-fivedeaths, by Millennium Development Goal region, 1990 and 2012
Neonatal mortality rate(deaths per 1,000 live births)Decline(percent)1990–2012
Number of neonataldeaths(thousands)
Neonatal deaths as a share ofunder-five deaths(percent)
Region
1990
2012
1990
2012
1990
2012
Developed regionsDeveloping regionsNorthern AfricaSub-Saharan AfricaLatin America and the CaribbeanCaucasus and Central AsiaEastern AsiaExcluding ChinaSouthern AsiaExcluding IndiaSouth-eastern AsiaWestern AsiaOceaniaWorld
836304522252411504927272633
4231332101587313115132221
5437582856406533393845511737
1174,50710996825550771111,92557131510954,625
502,802511,0901062716471,1273481686362,852
5236412641344639403937413537
5643583451416050535048533944
819423126223128332830291319
Note: All calculations are based on unrounded numbers.
37
47
13
This trend is expected to continue as under-fivemortality declines.In five developing regions more than half ofunder-five deaths took place in the neonatalperiod in 2012. Eastern Asia, for instance, hasmoved so quickly in cutting under-five mortalityrates overall, that neonatal deaths constituted a60percent share in 2012. The other four regionsare Northern Africa, Southern Asia, Western Asiaand Latin America and the Caribbean.Sub-Saharan Africa—where about a third ofunder-five deaths occurred during the neona-tal period—has the highest neonatal mortalityrate (32 deaths per 1,000 live births in 2012) andaccounts for 38percent of global neonatal deaths.Together with Oceania, the region has recordedthe least improvement over the last two decades.Among countries, the variation in neonatalmortality is substantial, ranging from less than1 death per 1,000 live births in Andorra andLuxembourg to 50 in Sierra Leone. Aroundtwo-thirds of neonatal deaths occur in just 10countries, with India accounting for more than aquarter and Nigeria for a tenth.Although neonatal deaths are often more diffi-cult to prevent, there are countries that have hadgreat success in reducing neonatal mortality. In1990 Estonia had a neonatal mortality rate above11 per 1,000 live births. By 2012 this had beenreduced to 1.6—a decline of 86percent. Luxem-bourg (82percent), Maldives (81percent), Lithua-nia (78percent), the Czech Republic (76percent)and Serbia (76percent) also reduced their neona-tal mortality rates substantially over this period.Children that die before 28 days of life often suf-fer from diseases and conditions that are readilypreventable or treatable with proven, cost-effec-tive interventions. Globally, almost a quarter ofneonatal deaths were caused by sepsis and men-ingitis (12percent), pneumonia (10percent) ordiarrhoea (2percent) in 2012. These diseasesare highly treatable, provided simple interven-tions and basic treatment knowledge are avail-able. Another 34percent of neonatal deaths, themajority of them preventable, were caused bycomplications from preterm birth.
With the share of under-five deaths during theneonatal period rising in every region and almostall countries, neonatal health will need to beaddressed more effectively if progress on overallchild mortality is to continue at a rapid rate. Sys-tematic action is required by governments andpartners to reach women and babies with effectivecare. Highly cost-effective interventions are fea-sible even at the community level, and most canbe linked with preventive and curative initiativesfor mothers and babies. For example, early postna-tal home visits are effective in promoting healthybehaviours such as breastfeeding and clean cordcare and in reaching new mothers. Case manage-ment of neonatal infections can be provided along-side treatment of childhood pneumonia, diarrhoeaand malaria. Care at birth brings a triple return oninvestment, saving mothers, newborns and unbornchildren. Scaling up low-cost solutions to addresspreterm birth could reduce these deaths by three-quarters, notably with antenatal steroid injectionsto women in preterm labour and with kangaroomother care, where the preterm baby is held skinto skin with their mother.6
Notes1. Values in parentheses indicate 90percent uncertainty intervals forthe estimates. The uncertainty intervals for the number of deaths arelikely to be too narrow because they are based only on the uncertainty inthe under-five mortality rate and do not account for uncertainty relatedto other inputs in the calculation of the number of deaths, such as thepopulation under age five.2. Regional classifications used in this report are MDG regions (see page30). The MDG regional classifications can also be found on the officialUnited Nations site for the MDG indicators (United Nations StatisticsDivision, ‘Millennium Development Indicators: World and regionalgroupings’, <http://mdgs.un.org/unsd/mdg/Host.aspx?Content=Data/RegionalGroupings.htm>, accessed 28 August 2013). Countries for whichdata are available are listed in the statistical annex.3. Alkema, Leontine, and Jin Rou New, ‘Global Estimation of Child Mortal-ity Using a Bayesian B-spline Regression Model’, Arxiv.org, 2013.4. Alkema, Leontine, Fengqing Chao, and Cheryl Sawyer, ‘Sex Differ-ences in U5MR: Estimation and Identification of Countries with Outly-ing Levels or Trends’, Paper presented at the XXVII IUSSP InternationalPopulation Conference, Busan, Republic of Korea, August 2013.5. The World Bank’s fragile and conflict-affected situations list (fiscal2014) is used to identify countries with conflict or violence or in frag-ile situations (World Bank, ‘Harmonized List of Fragile Situations’,Washington, DC, <http://siteresources.worldbank.org/EXTLICUS/Resources/511777-1269623894864/HarmonizedlistoffragilestatesFY14.pdf>, accessed 28 August 2013.6. March of Dimes, et al.,Born Too Soon: The Global Action Report on Pre-term Birth,edited by Christopher P. Howson, Mary V. Kinney and Joy E.Lawn, World Health Organization, Geneva, 2012.
14
15
StatiStical table
country, regional and global estimates ofunder-five, infant and neonatal mortalityUnder-five mortality rate (U5MR)(deaths per 1,000 live births)1990Country or territoryAfghanistanAlbaniaAlgeriaAndorraAngolaAntigua and BarbudaArgentinaArmeniaAustraliaAustriaAzerbaijanBahamasBahrainBangladeshBarbadosBelarusBelgiumBelizeBeninBhutanBosnia and HerzegovinaBotswanaBrazilBrunei DarussalamBulgariaBurkina FasoBurundiCambodiaCameroonCanadaCape VerdeCentral African RepublicChadChileChinaColombiaComorosCongoCook IslandsCosta RicaCôte d'IvoireCroatiaCubaU5MRLowerboundUpperboundU5MR
2000LowerboundUpperboundU5MR
2012Lowerbound
MillenniumDevelopmentGoaltargetforUpperbound201511625304236131521545021114323652212660547971691312415171151626184202111624138141141213556591417371891633318848663146044416162147675539453215770618124133865144
Annual rate of reduction (ARR)(percent)1990–2012ARRLowerboundUpperbound
1764350821324284991093232314418171043181131184862122220216411613586217120919543512410025171521313
16137478188182745998422221391716103916911611718425712221891471081258531561931950331118523171411313
19349539240312854910103252414819171049192148130195666132321418212614587018922620603813911728171641314
13429355203162030667217138818146251478078108533102118615011115063816418911372599118171314588
1232534517814202765641612851714623136727310663092117313210213863514517311352379105151313288
1463336522917213366811813911915627160918410105361022200170120165641186207113927117135201415999
99172031641014165435171041185418904541753148121021044095522129150914187896111010856
841013311171413542413839155415613332622137128466246151991109712134662888545
2.64.24.14.31.23.93.05.02.93.94.41.44.05.7–0.25.33.93.93.24.95.04.6–0.56.62.02.73.12.14.91.62.04.61.31.53.46.13.12.10.23.92.41.64.64.0
1.92.32.23.6–0.52.12.83.92.63.62.80.43.35.4–1.34.83.53.01.63.53.84.2–3.36.11.22.52.20.32.3–0.51.63.7–0.40.22.45.41.8–0.6–1.72.51.70.54.33.3
3.46.56.15.03.05.83.26.13.24.36.12.54.86.00.95.74.44.94.96.36.25.03.97.12.63.04.04.27.23.62.55.62.92.94.46.94.44.52.15.33.22.75.04.7
Bolivia (Plurinational State of) 123
16
StatiStical table(continued)
country, regional and global estimates ofunder-five, infant and neonatal mortality
Number of under-five deaths(thousands)1990Country or territoryAfghanistanAlbaniaAlgeriaAndorraAngolaAntigua and BarbudaArgentinaArmeniaAustraliaAustriaAzerbaijanBahamasBahrainBangladeshBarbadosBelarusBelgiumBelizeBeninBhutanBolivia (Plurinational State of)Bosnia and HerzegovinaBotswanaBrazilBrunei DarussalamBulgariaBurkina FasoBurundiCambodiaCameroonCanadaCape VerdeCentral African RepublicChadChileChinaColombiaComorosCongoCook IslandsCosta RicaCôte d'IvoireCroatiaCuba2012Under-Under-fiveLower UpperfiveLower Upperdeathsbound bounddeathsbound bound
Sex-specific under-fivemortalityrate(deaths per1,000 live births)1990MaleFemale
2012MaleFemale
Infantmortalityrate(deaths per1,000 livebirths)19902012
NeonatalNumber of mortality rate Number ofinfant(deaths perneonataldeaths1,000 livedeaths(thousands)births)(thousands)199020121990201219902012
964410106020421190053103103932912219037943406931205961,6473129017312
87338092020421170051303103722812201037338376431185462927016712
10744401220214212100550031042331132360384494474312264634210018013
103120014801012060012701103211103420166431474201982225816215017501
87013097010110400120000021080139015427847201359222512110015800
12313002240111208001340110461140546018164261222028114330122423019601
180465492232631541011100252414619191147187137130205268132520917312414296617821821563913110628191631415
1723945820321244488852122141161493917312511716445611191931541091277571641991752311179422151401111
102182241711116185438181044206520934945758169131081114410162513515710152083101121111656
9515183156913154432169381754168540386491371197983589520122142813167291999945
1203742712620244288742020100161483510992851638529181021008584747113114164229876521141041111
71151731009131543311483317431659363364113711666734615199189812155862997644
66334064018321150036502102422012180024027284331133251,3152616015112
73117090091105001020000211902370143291248201450222414110015400
501723252121624552910854975174142381125287124046373542147478252041331294887
368121456810321584241032928211942994728361828410414059113132674033
272190260122106002000110919119801161212182051337601713012301
3701204105010300760000100501270018157221062211571015002900
1,506 1,826
17
StatiStical table(continued)
country, regional and global estimates ofunder-five, infant and neonatal mortalityUnder-five mortality rate (U5MR)(deaths per 1,000 live births)1990Country or territoryCyprusCzech RepublicDemocratic People'sRepublic of KoreaDemocratic Republicof the CongoDenmarkDjiboutiDominicaDominican RepublicEcuadorEgyptEl SalvadorEquatorial GuineaEritreaEstoniaEthiopiaFijiFinlandFranceGabonGambiaGeorgiaGermanyGhanaGreeceGrenadaGuatemalaGuineaGuinea-BissauGuyanaHaitiHoly SeeHondurasHungaryIcelandIndiaIndonesiaIran (Islamic Republic of)IraqIrelandIsraelItalyJamaicaU5MRLowerboundUpperboundU5MR
2000LowerboundUpperboundU5MR
2012Lowerbound
MillenniumDevelopmentGoaltargetforUpperbound20154437193412816383522231807148626347910026492517441221715189—2773623621415542545155734062019292061507681023315712343472780692048—20624228191834310
Annual rate of reduction (ARR)(percent)1990–2012ARRLowerboundUpperbound
111544171911917605686591821502020431799217035912813228024120660144—591961268456539121030
111434155910016565082541531372019026798114929812112207522518054136—551961228052499111025
1215561929140196462906521516321220367910619542913513248625723567154—6320713088615810121036
77601716108164034453214389111462445861163451038165117117446105—381149252354577623
66471555891437304228120811113523457510128596815451591534198—351148850324177520
777719261281744404836171981215826461001354161108175618320052113—411259555384987628
34291464811327232116100524682234627320472514321011293576—23625631183444417
34221103491020162011583935219344852154564112381962566—19625127152944412
5.76.11.90.74.01.81.43.64.06.46.02.74.87.95.01.43.83.61.83.82.53.32.64.42.24.23.92.12.42.9—4.35.14.73.64.55.32.03.84.64.32.6
4.75.8—–0.43.6–0.40.32.12.16.14.3–0.13.47.23.90.43.43.40.52.41.03.11.53.91.22.73.10.90.72.2—3.54.63.43.23.94.51.13.34.23.90.8
6.66.5—1.94.54.02.55.15.76.77.65.36.28.56.32.44.23.93.15.34.13.63.84.83.35.75.03.54.13.6—5.15.56.04.15.26.22.84.45.04.64.3
18
StatiStical table(continued)
country, regional and global estimates ofunder-five, infant and neonatal mortality
Number of under-five deaths(thousands)1990Country or territoryCyprusCzech RepublicDemocratic People'sRepublic of KoreaDemocratic Republicof the CongoDenmarkDjiboutiDominicaDominican RepublicEcuadorEgyptEl SalvadorEquatorial GuineaEritreaEstoniaEthiopiaFijiFinlandFranceGabonGambiaGeorgiaGermanyGhanaGreeceGrenadaGuatemalaGuineaGuinea-BissauGuyanaHaitiHoly SeeHondurasHungaryIcelandIndiaIndonesiaIran (Islamic Republic of)IraqIrelandIsraelItalyJamaica2012Under-Under-fiveLower UpperfiveLower Upperdeathsbound bounddeathsbound bound
Sex-specific under-fivemortalityrate(deaths per1,000 live births)1990MaleFemale
2012MaleFemale
Infantmortalityrate(deaths per1,000 livebirths)19902012
NeonatalNumber of mortality rate Number ofinfant(deaths perneonataldeaths1,000 livedeaths(thousands)births)(thousands)199020121990201219902012
021626713013171551032104441063737701027649136—11303,325385107350152
02122401301215147931904091063637661025597134—103036798320151
0220302140131916311423148310648477510286910139—1230404116380162
00103910206840231102050033513561015418120—51015226350121
008291010453821801530032413431011336017—41013122290121
0013531030812423516025900347237210215110124—61017531420121
121747179101261964618664190161232173471099177391013514248524822067152—6421712190575710121134
101340163811216555085541741391819027688616230712111207523319153135—54176130775649811926
44321544861430262218106574742535677822577515351061394082—26735435193845419
332613737512242020149447362203457681746641229961193169—20625927173144415
10133311279314464463461239217121266760803078011186014212246100—4617588624442810825
33231003661223201814723734719234249183494112765812957—195226152833314
02121780301013114821302671052336441020385125—83027982280151
008271020563522801400032412380012275015—41012523290121
59214754012272033174735115413443346234409102954582837—231335130262656617
2216443319151012634182291022252815228371534461925—12413115111922211
0177501066593150120002122322101014219—4201,35413449170141
005118010332311408800212122200714307—2007797216190011
3,208 3,4391,4141,280 1,573
44 2,333 1,097
19
StatiStical table(continued)
country, regional and global estimates ofunder-five, infant and neonatal mortalityUnder-five mortality rate (U5MR)(deaths per 1,000 live births)1990Country or territoryJapanJordanKazakhstanKenyaKiribatiKuwaitKyrgyzstanLao People's DemocraticRepublicLatviaLebanonLesothoLiberiaLibyaLiechtensteinLithuaniaLuxembourgMadagascarMalawiMalaysiaMaldivesMaliMaltaMarshall IslandsMauritaniaMauritiusMexicoMicronesia (FederatedStates of)MonacoMongoliaMontenegroMoroccoMozambiqueMyanmarNamibiaNauruNepalNetherlandsNew ZealandNicaraguaNigerNigeriaNiueNorwayU5MRLowerboundUpperboundU5MR
2000LowerboundUpperboundU5MR
2012Lowerbound
MillenniumDevelopmentGoaltargetforUpperbound20153232010584123087101513410019—638292101217784812218177843873610668555352463614015146321218333152454711288314—635381631844164381518336627783524194734221097153
Annual rate of reduction (ARR)(percent)1990–2012ARRLowerboundUpperbound
637549894167116320338524843—1791592441794253114912823465581071780233106735814281166326213149
634499380166114820307722736—1681482301686238114111722424479716752159666361338116130619898
63960105110178118021379327050—17916925817103271125813924517091161885251118809315191271347227219
52844110711350120172011417628—12510917410452208411111925545631450166797342826740227188235
42641102621342108161710316127—1149916210412057361001824375571346154726736766736211175175
53049120821356134182312419330—12511918510502388481221927796711454179878150886844244201325
319197360112772991007515—5258719111287388415163942863190523937424624114124253
31618494310225986765613—5241568991630581316183195267739272533451791101132
3.43.04.81.42.11.84.43.73.95.7–0.75.44.7—5.16.24.65.63.010.03.12.31.21.91.94.81.63.36.24.84.34.33.22.92.05.63.23.14.54.82.5–2.75.2
3.12.14.3–0.30.41.43.72.83.23.6–2.24.13.5—4.75.03.04.42.59.31.71.5–0.20.21.24.3–1.42.54.74.03.53.61.91.2–0.94.63.02.62.73.81.5–6.14.6
3.63.85.33.13.72.15.44.74.57.90.56.85.8—5.77.46.26.73.610.74.63.22.63.62.65.24.83.97.85.65.15.04.74.55.16.63.43.56.35.83.40.95.8
20
StatiStical table(continued)
country, regional and global estimates ofunder-five, infant and neonatal mortality
Number of under-five deaths(thousands)1990Country or territoryJapanJordanKazakhstanKenyaKiribatiKuwaitKyrgyzstanLao People's DemocraticRepublicLatviaLebanonLesothoLiberiaLibyaLiechtensteinLithuaniaLuxembourgMadagascarMalawiMalaysiaMaldivesMaliMaltaMarshall IslandsMauritaniaMauritiusMexicoMicronesia (FederatedStates of)MonacoMongoliaMontenegroMoroccoMozambiqueMyanmarNamibiaNauruNepalNetherlandsNew ZealandNicaraguaNigerNigeriaNiueNorway2012Under-Under-fiveLower UpperfiveLower Upperdeathsbound bounddeathsbound bound
Sex-specific under-fivemortalityrate(deaths per1,000 live births)1990MaleFemale
2012MaleFemale
Infantmortalityrate(deaths per1,000 livebirths)19902012
NeonatalNumber of mortality rate Number ofinfant(deaths perneonataldeaths1,000 livedeaths(thousands)births)(thousands)199020121990201219902012
842196011029125235—10801038191001001120080561321174095211012984901
84199001826124204—10759681840090101007053121105308921911978500
8424102011132125256—108611091980011012200906014513040102211013991601
34610801414016112—00444340830011037002023844820241039182700
336730131100482—0031344059007036001019713620191027200
35715801417018152—00635750118001603800302710064303110511300
73861104100187717023349126047—1910166254181002621254137265060912218852411147863143913713302221510
635479388156415518317823539—15815123415882441044118204251791167522399685314171061322203128
3202278651230779101078017—6262769121347429217184243363494584341445627117129283
31816685510236689926914—525466891226337613153542262885473533394522110118223
530466468145811217276816537—1479714314681301039822037436761563155764945997950137126127
21617494610245488745613—424146798063165131431323627634128303435216378212
53186201820124154—1052607146007089006044878130661175450200
236720141000482—0031284053008032002020593820191035252800
319233329929441316455121—9440508345971943161621425113554412928535425485274
112102722614275545279—2122245642516349716210418302618212433122839122
32932004811252—1021214021003040002024304420361041920700
12340002500341—0017152028004016001013282410140022326700
663 1,025
21
StatiStical table(continued)
country, regional and global estimates ofunder-five, infant and neonatal mortalityUnder-five mortality rate (U5MR)(deaths per 1,000 live births)1990Country or territoryOmanPakistanPalauPanamaPapua New GuineaParaguayPeruPhilippinesPolandPortugalQatarRepublic of KoreaRepublic of MoldovaRomaniaRussian FederationRwandaSaint Kitts and NevisSaint LuciaSamoaSan MarinoSao Tome and PrincipeSaudi ArabiaSenegalSerbiaSeychellesSierra LeoneSingaporeSlovakiaSloveniaSolomon IslandsSomaliaSouth AfricaSouth SudanSpainSri LankaState of PalestineSudanSurinameSwazilandSwedenSwitzerlandSyrian Arab RepublicTajikistanU5MRLowerboundUpperboundU5MR
2000LowerboundUpperboundU5MR
2012Lowerbound
MillenniumDevelopmentGoaltargetforUpperbound2015131003227933122425494261411721424292368110807172363844924156148511298837111351911413461111301526206572111395010781043516479686363135920844714431724231335
Annual rate of reduction (ARR)(percent)1990–2012ARRLowerboundUpperbound
3913834328946795917152173238261512922301110447142281725781810391776125111214312851717838105
351332928804175551714197273726142272123279913913527152357171033146542081121391194261783493
451443935995084631815227393927161312427341411956149291828081811462196929811224713962827941118
171122826793340409712630272318218182222687221391314234412635171741817173010633121462491
15107252268293737971262426231711617211847420130121321241252913466154617279626110462277
201173330913843441081363727241952019242581012514913152574126412268321271833116431364626107
12862119632218305474181210559182318353960713182383311474510451023732180341558
11751313431615225364131110426131913236844610137273209436724918591257341229
5.52.22.22.41.63.36.73.15.76.44.72.82.75.14.24.65.21.10.22.45.43.07.73.96.61.11.64.43.95.51.00.81.44.04.13.62.92.64.0–0.53.92.94.12.7
4.91.50.10.6–0.21.75.71.55.46.03.92.60.84.53.93.33.2–0.3–0.71.22.41.06.62.66.1–0.10.43.73.64.8–1.3–1.00.12.13.73.11.81.71.5–2.13.62.53.0–0.4
6.32.94.44.13.34.97.74.56.16.75.43.14.55.74.65.87.22.51.23.88.64.98.75.37.02.22.85.24.26.03.12.62.65.94.44.24.13.56.51.04.33.45.15.7
Saint Vincent and the Grenadines 25
22
StatiStical table(continued)
country, regional and global estimates ofunder-five, infant and neonatal mortality
Number of under-five deaths(thousands)1990Country or territoryOmanPakistanPalauPanamaPapua New GuineaParaguayPeruPhilippinesPolandPortugalQatarRepublic of KoreaRepublic of MoldovaRomaniaRussian FederationRwandaSaint Kitts and NevisSaint LuciaSaint Vincent and the GrenadinesSamoaSan MarinoSao Tome and PrincipeSaudi ArabiaSenegalSerbiaSeychellesSierra LeoneSingaporeSlovakiaSloveniaSolomon IslandsSomaliaSouth AfricaSouth SudanSpainSri LankaState of PalestineSudanSurinameSwazilandSwedenSwitzerlandSyrian Arab RepublicTajikistan2012Under-Under-fiveLower UpperfiveLower Upperdeathsbound bounddeathsbound bound
Sex-specific under-fivemortalityrate(deaths per1,000 live births)1990MaleFemale
2012MaleFemale
Infantmortalityrate(deaths per1,000 livebirths)19902012
NeonatalNumber of mortality rate Number ofinfant(deaths perneonataldeaths1,000 livedeaths(thousands)births)(thousands)199020121990201219902012
361902126511199204316594900000026444044010050656657410103111723
25950211649111920421658460000002142404001004057534739302111520
364602147551289204317605300000031474049020163748157411013111826
1409011331169200213172400000053010390001655040243890300815
1353019294920021216180000004221029000040402723271020078
1477022051397200213183100000164010520001112635824410804001031
431413835954984642016227364230159322527331211050148301826982011421856726212234513656768941113
361363028834275531513197283422143262023281098431352615246716935169552411020401204566673496
139023216824203354842014125910192519458965714190383341544910951024792385351764
10821916582016265374161195181621163498556121733732814140984921671875341452
32106302665365641151218627312292231821251067377124141536169311074714991835804354673182
1069151648191424436315119397152115338745611117263269133674819491956241249
247902953785810321449300000002022402601003150404636402111418
133001103854200212151700000042310250000403726232600200713
18561513302228231171031418143818131511531214117105941261650215771321402329441833
7421092412914324298621710157120524485014214461536361329123023923
125301431847610218321300000012133010010015221534232010087
12020152632100102990000003120010000020171412235010056
23
StatiStical table(continued)
country, regional and global estimates ofunder-five, infant and neonatal mortalityUnder-five mortality rate (U5MR)(deaths per 1,000 live births)1990Country or territoryThailandThe former YugoslavRepublic of MacedoniaTimor-LesteTogoTongaTrinidad and TobagoTunisiaTurkeyTurkmenistanTuvaluUgandaUkraineUnited Arab EmiratesUnited KingdomUnited Republic of TanzaniaUnited StatesUruguayUzbekistanVanuatuVenezuela(BolivarianRepublic of)Viet NamYemenZambiaZimbabweU5MRLowerboundUpperboundU5MR
2000LowerboundUpperboundU5MR
2012Lowerbound
MillenniumDevelopmentGoaltargetforUpperbound2015199751252236192190448412105718106733172485140120131257488111725301959763554825121017426425
Annual rate of reduction (ARR)(percent)1990–2012ARRLowerboundUpperbound
38371711432333517490581782017916611237435305112519274
36351551331928456978491681814915711226429294611718068
4138188155283958791036818923201017711248442305513420580
2316106122182830377942147191171328166124213297169102
20159611013222533673813817116123816531921298915692
26171171352436354293471572112714191771332234105183113
1375796132116145330691185547740181523608990
96417371214102921571075416521101422426070
4.87.35.01.82.62.15.37.52.43.04.32.83.23.05.12.15.32.83.03.03.63.33.5–0.9
3.26.63.70.70.2–0.34.25.70.11.03.42.12.22.83.91.43.70.50.32.63.11.81.4–2.3
6.58.06.53.04.94.56.39.35.14.95.23.54.03.36.32.77.05.65.83.44.05.05.30.3
Estimates of under-five, infant and neonatal mortality by Millennium Development Goal regionaDeveloped regionsDeveloping regionsNorthern AfricaSub-Saharan AfricaLatin America & CaribbeanCaucasus & Central AsiaEastern AsiaExcluding ChinaSouthern AsiaExcluding IndiaSouth-eastern AsiaWestern AsiaOceaniaWorld15997317754735327126125716574901598711745269492412312369636889151017518256785932128128736881921083431553262373192934842677510824115231583525909146405974108444159336739389596494476776532298193614155861302555486512092182812135456282239467562510720501618626734297851533245918241894242242225303.82.95.42.74.73.26.12.73.53.33.94.41.42.93.62.64.82.34.41.75.32.43.22.83.33.6–0.32.64.13.15.93.05.04.36.83.03.93.74.35.12.93.0
24
StatiStical table(continued)
country, regional and global estimates ofunder-five, infant and neonatal mortality
Number of under-five deaths(thousands)1990Country or territoryThailandThe former YugoslavRepublic of MacedoniaTimor-LesteTogoTongaTrinidad and TobagoTunisiaTurkeyTurkmenistanTuvaluUgandaUkraineUnited Arab EmiratesUnited KingdomUnited Republic of TanzaniaUnited StatesUruguayUzbekistanVanuatuVenezuela(BolivarianRepublic of)Viet NamYemenZambiaZimbabwe2012Under-Under-fiveLower UpperfiveLower Upperdeathsbound bounddeathsbound bound
Sex-specific under-fivemortalityrate(deaths per1,000 live births)1990MaleFemale
2012MaleFemale
Infantmortalityrate(deaths per1,000 livebirths)19902012
NeonatalNumber of mortality rate Number ofinfant(deaths perneonataldeaths1,000 livedeaths(thousands)births)(thousands)199020121990201219902012
421522011110212014514171794415401799716328
39142001109510013612171684314701791665925
4515240113111140155161719144162017108776830
90222003186010361498290250933435039
6021700312308651475260130931303330
140330014271001286141303404301035628253
4339179152253654781016119022191117313268238335613020180
33351621352030487079541661715815910216531264511918368
15862102142317166033751295588845201726649496
117528911191513452762984506734161320568383
31331298920294055724510717148101920612925368811450
117486211181412452545974386634151318465656
341314019761008912161103714501472503818
8021500316506951369250220826343324
191747411122243031223991054361121151522424431
8624337151092213235532144149912272939
2111600541403260447221150844241411
60180021120353123917090517201717
Estimates of under-five, infant and neonatal mortality by Millennium Development Goal regiona(continued)Developed regionsDeveloping regionsNorthern AfricaSub-Saharan AfricaLatin America & CaribbeanCaucasus & Central AsiaEastern AsiaExcluding ChinaSouthern AsiaExcluding IndiaSouth-eastern AsiaWestern AsiaOceaniaWorld22626862714628224260606138242292786481553290882066427214694346120158680198502381163531410410959921990315177663891422116102751865881552912312877697992139770168496551251281236561698775524103214115175764342759506512092173213135858272350461269561074360422189925249556351916311218920549612021767617456235115512809811836304522252411504927272633423133210158731311513222111710925550771111,925571315109550511062716471,12734816863612,39412,192 12,6416,4636,234 6,8683,7723,689 3,8723,2453,048 3,57838 8,662 4,72564 2,285 2,1464,507 2,802968 1,090
1,6751,535 1,8554,7844,664 4,9041,4591,427 1,496843265148192551387127716
12 1,336
2,1081,959 2,277
45 3,400 1,64849 1,06725204260920011
12,62112,418 12,8686,5536,323 6,958
35 8,851 4,801
4,625 2,852
25
StatiStical table(continued)
country, regional and global estimates ofunder-five, infant and neonatal mortalityEstimates of under-five, infant and neonatal mortality by uniCEF regionaUnder-five mortality rate (U5MR)(deaths per 1,000 live births)1990RegionAfricaSub-Saharan AfricaWest and Central AfricaMiddle East and North AfricaAsiaSouth AsiaEast Asia and PacificLatin America and CaribbeanCentral and EasternEurope/Commonwealth ofIndependent StatesWorldU5MRLowerboundUpperboundU5MR
2000LowerboundUpperboundU5MR
2012Lowerbound
MillenniumDevelopmentGoaltargetforUpperbound201598107861333344642220545954652430431918
Annual rate of reduction (ARR)(percent)1990–2012ARRLowerboundUpperbound
16217719571901295854
15917415918969881265552
16618216820273931326256
1431551391745070944132
1401521361694869924031
1461591431815272974333
9098771183041602019
8592711082839551918
2.72.73.42.33.93.63.54.84.7
2.32.32.91.83.53.23.24.34.4
3.03.03.82.74.33.93.95.25.0
Eastern and Southern Africa 163
4790
4689
4992
3675
3574
3877
1948
1646
2351
1630
4.22.9
3.22.6
4.83.0
Estimates of under-five, infant and neonatal mortality by World Health Organization regionaUnder-five mortality rate (U5MR)(deaths per 1,000 live births)1990RegionAfricaAmericasEastern MediterraneanEuropeSouth-East AsiaWestern PacificWorldU5MRLowerboundUpperboundU5MR
2000LowerboundUpperboundU5MR
2012Lowerbound
MillenniumDevelopmentGoaltargetforUpperbound201510516631454185158143411391730
Annual rate of reduction (ARR)(percent)1990–2012ARRLowerboundUpperbound
17342103321185290
17041101311154989
17744106331215792
154268222843575
150258021813474
157278523863777
95155712501648
90155311461546
2.74.62.74.43.95.32.9
2.34.32.33.63.54.72.6
3.04.83.15.04.35.93.0
26
StatiStical table(continued)
country, regional and global estimates ofunder-five, infant and neonatal mortalityEstimates of under-five, infant and neonatal mortality by uniCEF regiona(continued)Number of under-five deaths(thousands)1990RegionAfricaSub-Saharan AfricaWest and Central AfricaMiddle East and North AfricaAsiaSouth AsiaEast Asia and PacificLatin America and CaribbeanCentral and EasternEurope/Commonwealth ofIndependent StatesWorld2012Under-Under-fiveLower UpperfiveLower Upperdeathsbound bounddeathsbound bound
Sex-specific under-fivemortalityrate(deaths per1,000 live births)1990MaleFemale
2012MaleFemale
InfantNeonatalmortality rate Number of mortality rate Number of(deaths perinfant(deaths perneonatal1,000 livedeaths1,000 livedeathsbirths)(thousands)births)(thousands)19902012199020121990201219902012
4,0403,7721,9826437,2094,6772,532627
3,9581,640626
4,1413,333
3,136 3,666
17018617220474901276158
15416815418668901325549
95103821243241592221
8492711122841601917
991071011155365924443
59 2,490 2,22264 2,285 2,14651 1,05076244787852421,169 1,300
434543482937512522
303228371522321110
1,0784444912601,8761,091255
1,1414246311551,111338106
3,689 3,8723,2453,048 3,5781,7411,1701,081 1,3236613062823371,911 2,0631,9851,795 2,2517,023 7,4352,7142,562 2,9004,557 4,7952,0821,933 2,2502,3926062,713648632206588198697219
968 1,090
Eastern and Southern Africa 1,686
32 5,273 2,15247 3,318 1,62617 1,95516496527174
2,967 1,449
357
346
370
112
97
140
5292
4287
2150
1746
3863
16
288
97
1933
921
146
53
12,62112,418 12,8686,5536,323 6,958
35 8,851 4,801
4,625 2,852
Estimates of under-five, infant and neonatal mortality by World Health Organization regiona(continued)Number of under-five deaths(thousands)1990RegionAfricaAmericasEastern MediterraneanEuropeSouth-East AsiaWestern PacificWorld2012Under-Under-fiveLower UpperfiveLower Upperdeathsbound bounddeathsbound bound
Sex-specific under-fivemortalityrate(deaths per1,000 live births)1990MaleFemale
2012MaleFemale
InfantNeonatalmortality rate Number of mortality rate Number of(deaths perinfant(deaths perneonatal1,000 livedeaths1,000 livedeathsbirths)(thousands)births)(thousands)19902012199020121990201219902012
3,593673417
3,512 3,6883,0712,871 3,3896534066954302,157237899136416229832120378251998163472
18246106351175592
16439100291194987
101176013491850
90145411501546
105347626834063
63131039
2,182 2,036535339201692117350
44184014472333
32826627921
924 1,0322795501791,80388812441567981231
1,4291,395 1,470
44 1,056
4,5254,406 4,6451,7921,658 1,9551,9791,83912,62112,418 12,8686,5536,323 6,958
3,182 1,403
14 1,554
35 8,851 4,801
4,625 2,852
27
StatiStical table(continued)
country, regional and global estimates ofunder-five, infant and neonatal mortalityEstimates of under-five, infant and neonatal mortality by World Bank regionaUnder-five mortality rate (U5MR)(deaths per 1,000 live births)1990RegionLow incomeMiddle incomeLower middle incomeUpper middle incomeLow and middle incomeHigh incomeWorldU5MRLowerboundUpperboundU5MR
2000LowerboundUpperboundU5MR
2012Lowerbound
MillenniumDevelopmentGoaltargetforUpperbound201590486623567515529391833530
Annual rate of reduction (ARR)(percent)1990–2012ARRLowerboundUpperbound
1668711854991590
1638511652981489
16989121581011592
134719338831075
132699137821074
137729539851077
8245612053648
7743581951646
3.23.03.04.52.93.92.9
2.82.72.63.92.63.52.6
3.53.23.35.03.04.13.0
Estimates of under-five, infant and neonatal mortality by united nations Population Division regionaUnder-five mortality rate (U5MR)(deaths per 1,000 live births)1990RegionMore developed regionsLess developed regionsLeast developed countriesExcluding least developedcountriesExcluding ChinaSub-Saharan AfricaAfricaAsiaEuropeLatin America & CaribbeanNorthern AmericaOceaniaWorldU5MRLowerboundUpperboundU5MR
2000LowerboundUpperboundU5MR
2012Lowerbound
MillenniumDevelopmentGoaltargetforUpperbound201575693466310898417208365153357283860542961841230
Annual rate of reduction (ARR)(percent)1990–2012ARRLowerboundUpperbound
159917285113179162871854113590
159816983112176159851752113289
1510117587115184166891856113792
1083138689115714367123283375
1082135679015414065123183074
1084141709216114668123383877
65385435999903971972648
65180415793853761861946
3.82.93.23.12.92.72.73.74.54.72.11.42.9
3.62.62.82.82.72.32.33.34.44.41.4–0.22.6
4.03.13.53.33.13.03.03.94.75.02.62.73.0
DefinitionsUnder-five mortality rate:Probability of dying between birth and exactly five years of age, expressed per 1,000 live births.Infant mortality rate:Probability of dying between birth and exactly one year of age, expressed per 1,000 live births.Neonatal mortality rate:Probability of dying in the first month of life, expressed per 1,000 live births.Note:Upper and lower bounds refer to the 90percent uncertainty intervals for the estimates. Estimates are generated by the United Nations Inter-agency Group for Child Mortality Estimation to ensure comparability;they are not necessarily the official statistics of UN Member States, which may use alternative rigorous methods.aThe sum of the number of deaths by region may differ from the world total because of rounding.
28
StatiStical table(continued)
country, regional and global estimates ofunder-five, infant and neonatal mortalityEstimates of under-five, infant and neonatal mortality by World Bank regiona(continued)Number of under-five deaths(thousands)1990RegionLow incomeMiddle incomeLower middle incomeUpper middle incomeLow and middle incomeHigh incomeWorld2012Under-Under-fiveLower UpperfiveLower Upperdeathsbound bounddeathsbound bound
Sex-specific under-fivemortalityrate(deaths per1,000 live births)1990MaleFemale
2012MaleFemale
InfantNeonatalmortality rate Number of mortality rate Number of(deaths perinfant(deaths perneonatal1,000 livedeaths1,000 livedeathsbirths)(thousands)births)(thousands)19902012199020121990201219902012
3,2529,1486,3862,763221
3,196 3,3222,1662,042 2,3828,951 9,3774,2944,082 4,6126,247 6,5243,5413,331 3,8312,619 2,941216226754936948985098
17389119571011692
1588511751971387
8746632255750
7744601951646
104628242691263
56 2,045 1,48634 6,625 3,23746 4,440 2,6311652,1851826067839 8,669 4,72335 8,851 4,801
4734442436733
3021281023421
920
788
3,592 2,0122,371 1,6311,221112381524,512 2,8004,625 2,852
12,40012,197 12,6476,4606,230 6,86512,62112,418 12,8686,5536,323 6,958
Estimates of under-five, infant and neonatal mortality by united nations Population Division regiona(continued)Number of under-five deaths(thousands)1990RegionMore developed regionsLess developed regionsLeast developed countriesExcluding least developedcountriesExcluding ChinaSub-Saharan AfricaAfricaAsiaEuropeLatin America & CaribbeanNorthern AmericaOceaniaWorld2012Under-Under-fiveLower UpperfiveLower Upperdeathsbound bounddeathsbound bound
Sex-specific under-fivemortalityrate(deaths per1,000 live births)1990MaleFemale
2012MaleFemale
InfantNeonatalmortality rate Number of mortality rate Number of(deaths perinfant(deaths perneonatal1,000 livedeaths1,000 livedeathsbirths)(thousands)births)(thousands)19902012199020121990201219902012
225
223
228
89
85
94
1610117987116188170872058123792
139716483110170154861549103287
754904462104953972182850
65179425792843861762346
126910761771089963154392663
5
188
75
83648344045433692261333
42330212533302141041121
116987
50858
12,39612,193 12,6426,4646,234 6,8693,5253,466 3,5972,3882,259 2,6228,8718,6749,1014,0753,866 4,376
38 8,663 4,72558 2,206 1,63433 6,457 3,09143 7,348 4,50164 2,221 2,08659 2,490 2,22231 5,672 2,3206166201414963913451742713
4,508 2,802
3,522 1,9443,748 2,644936 1,0551,078882552461,141291061873,173 1,551
10,74910,604 10,9116,2065,977 6,6043,6713,589 3,7703,1572,959 3,4874,0403,958168627471716660646164,1413,33317064848195220632173,136 3,6663,1065421936235119828127,7227,534 7,9502,9132,763
12,62112,418 12,8686,5536,323 6,958
35 8,851 4,801
4,625 2,852
29
RegionalClassificationsThe regional classifications that are referred to in the report and for which aggregate data are provided inthe statistical table are Millennium Development Goal regions (see below). Aggregates presented for memberorganizations of the Inter-agency Group for Child Mortality Estimation may differ. Regions with the same namesin different agencies may include different countries.
Developed regionsAlbania, Andorra, Australia, Austria, Belarus, Bel-gium, Bosnia and Herzegovina, Bulgaria, Canada,Croatia, Cyprus, Czech Republic, Denmark, Estonia,Finland, France, Germany, Greece, Hungary, Iceland,Ireland, Israel, Italy, Japan, Latvia, Liechtenstein,Lithuania, Luxembourg, Malta, Monaco, Montenegro,Netherlands, New Zealand, Norway, Poland, Portugal,Republic of Moldova, Romania, Russian Federation,San Marino, Serbia, Slovakia, Slovenia, Spain, Sweden,Switzerland, The former Yugoslav Republic of Mace-donia, Ukraine, United Kingdom, United States
Oceania
Cook Islands, Fiji, Kiribati, Marshall Islands,Micronesia (Federated States of), Nauru, Niue, Palau,Papua New Guinea, Samoa, Solomon Islands, Tonga,Tuvalu, VanuatuSouth-eastern Asia
Brunei Darussalam, Cambodia, Indonesia, LaoPeople’s Democratic Republic, Malaysia, Myanmar,Philippines, Singapore, Thailand, Timor-Leste,VietNamSouthern Asia
Developing regionsCaucasus and Central Asia
Afghanistan, Bangladesh, Bhutan, India, Iran (IslamicRepublic of), Maldives, Nepal, Pakistan, Sri LankaSub-Saharan Africa
Armenia, Azerbaijan, Georgia, Kazakhstan, Kyrgyz-stan, Tajikistan, Turkmenistan, UzbekistanEastern Asia
China, Democratic People’s Republic of Korea,Mongolia, Republic of Korealatin America and the Caribbean
Antigua and Barbuda, Argentina, Bahamas, Barba-dos, Belize, Bolivia (Plurinational State of), Brazil,Chile, Colombia, Costa Rica, Cuba, Dominica, Domin-ican Republic, Ecuador, El Salvador, Grenada, Gua-temala, Guyana, Haiti, Honduras, Jamaica, Mexico,Nicaragua, Panama, Paraguay, Peru, Saint Kitts andNevis, Saint Lucia, Saint Vincent and the Grenadines,Suriname, Trinidad and Tobago, Uruguay, Venezuela(Bolivarian Republic of)northern Africa
Angola, Benin, Botswana, Burkina Faso, Burundi,Cameroon, Cape Verde, Central African Republic,Chad, Comoros, Congo, Côte d’Ivoire, DemocraticRepublic of the Congo, Djibouti, Equatorial Guinea,Eritrea, Ethiopia, Gabon, Gambia, Ghana, Guinea,Guinea-Bissau, Kenya, Lesotho, Liberia, Madagascar,Malawi, Mali, Mauritania, Mauritius, Mozambique,Namibia, Niger, Nigeria, Rwanda, Sao Tome andPrincipe, Senegal, Seychelles, Sierra Leone, Soma-lia, South Africa, South Sudan, Sudan, Swaziland,Togo, Uganda, United Republic of Tanzania, Zambia,ZimbabweWestern Asia
Bahrain, Iraq, Jordan, Kuwait, Lebanon, Oman,Qatar, Saudi Arabia, State of Palestine, Syrian ArabRepublic, Turkey, United Arab Emirates, Yemen
Algeria, Egypt, Libya, Morocco, Tunisia
30
Cover photo:� UNICEF/BRDA2012-00032/PAWEL KRZYSIEKApril 2012, A child waiting for his meal at the UNICEF-supported Positive Deviance site in thecommune of Matongo, Kayanza province, north of Burundi. Positive Deviance is a community-led package of nutrition, health and hygiene interventions to improve children’s well-being.Photo on page 3: � UNICEF/UKLA2012-00707/OLIVIER ASSELINPhoto on page 8: � UNICEF/NYHQ2011-2460/BRIAN SOKOLPhoto on page 12: � UNICEF/NYHQ2012-2253/MARKISZPhoto on page 15: � UNICEF/UGDA201300090/PROSCOVIA NAKIBUUKA
UnitedNations
The UN Inter-agency Group for Child Mortality EstimationThe UN Inter-agency Group for Child Mortality Estimation (UN IGME) wasformed in 2004 to share data on child mortality, harmonize estimateswithin the UN system, improve methods for child mortality estimation,report on progress towards the Millennium Development Goals andenhance country capacity to produce timely and properly assessedestimates of child mortality. The UN IGME includes the United NationsChildren’s Fund, the World Health Organization, the World Bank and theUnited Nations Population Division of the Department of Economic andSocial Affairs as full members.The UN IGME’s independent Technical Advisory Group, comprisingeminent scholars and independent experts in demography, providestechnical guidance on estimation methods, technical issues and strategiesfor data analysis and data quality assessment.The UN IGME updates its child mortality estimates annually afterreviewing newly available data and assessing data quality. This reportcontains the latest UN IGME estimates of child mortality at the country,regional and global levels. Country-specific estimates and the data used toderive them are available at www.childmortality.org.