Udenrigsudvalget 2012-13
URU Alm.del Bilag 141
Offentligt
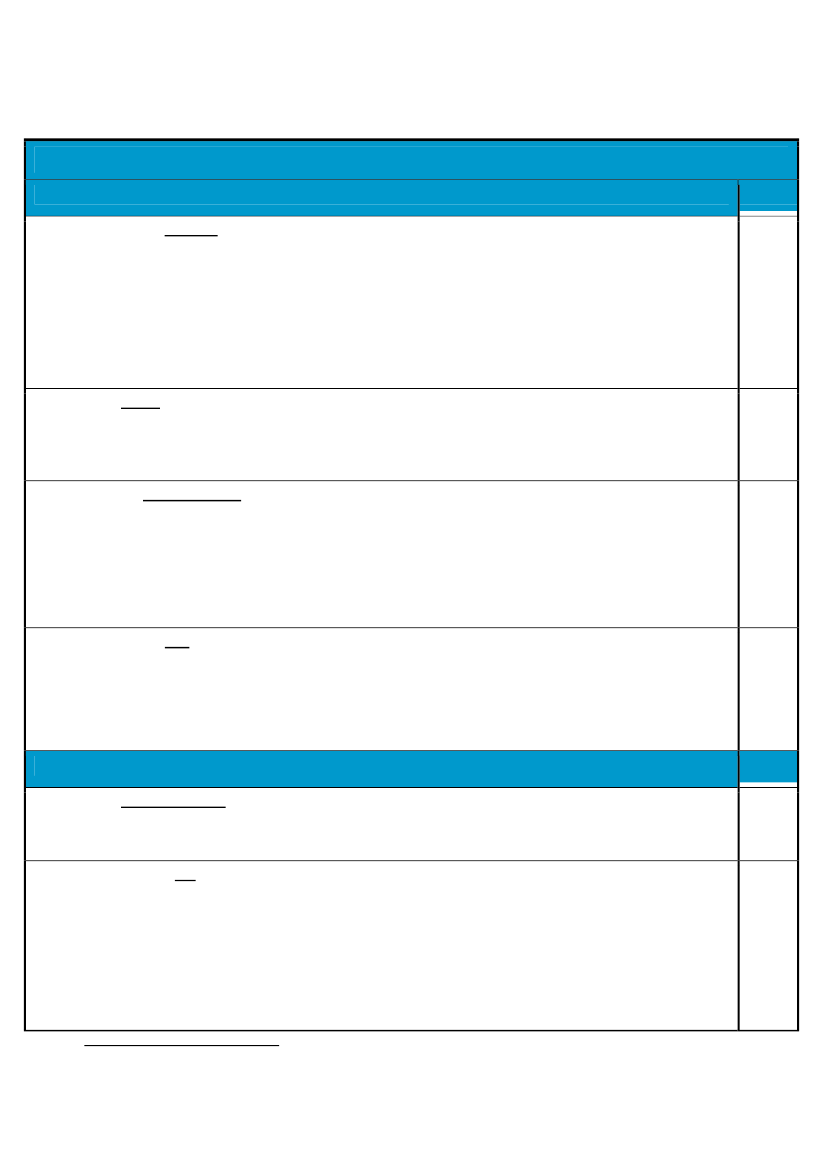


SUMMARY OF THE PAF 20121KEY POLICY ACTIONS(assessment criteria annexed)CLUSTER 1Implement intermodal transport measures to ease movement of goods to & from Dar es Salaam Port2012:Enhance cargo handling capacity through DSM Port demonstrated by fully operational Port Community System,increased container throughput (10%) of the port, advancement in TPA moving towards Land Lord Status and a prioritisedinvestment and business plan for TRL2013:Enhance TRL off-take capacity to and from DSM Port demonstrated by procurement for central line spot improvementsand rolling stock purchase finalized, options for improvement of rail operations within the port identified2014:Improve access by rail and road to DSM Port demonstrated by reliable rail transport service restored: TRL cargovolumes to/from DSM port increased by 15%, improving road access to DSM Port identified, bypass road to the centralcorridor from the DSM Port identified, exit and entrance gates to the port of DSM introducedFormulation of energy subsidy policy by August 20132012:Analytical study forming basis for drafting of an energy subsidy policy finalized by September 20122013:Energy subsidy policy proposal completed by MEM by September 20132014:New Energy subsidy policy in place by October 2014Implementation of natural resources decentralization to districts and communities2012:Increase the number of declared forest reserves on village forest land by 40, number of signed joint managementagreements by 16, authorised associations among wildlife management areas by 3, registered beach management units by 102013:Increase the number of declared village land forest reserves by 70 and signed Joint management agreements by 32,authorised associations among wildlife management areas by 3, and registered beach management units by 102014:Increase the number of declared forest reserves on village forest land by 80 and signed joint management agreementsby 40, authorised associations among wildlife management areas by 3, and registered beach management units by 40Put in place integrated land management information system in Northern and Eastern zones2012:Geodetic control network containing 700 control points of different levels (CORS 5; Zero Order Points 10; First OrderPoints 72 and Second Order Points 613) in place, homogenized across Tanzania, and fully operational2013:Consolidation of all relevant information from all 6 sectors’ registries2014:Integrated land management information system in Eastern and Northern Zones fully functioning with digitalizedrecords, and trained staff using the new system
LeadMoT
MEM
MNRT+MoFD
MoLHSD
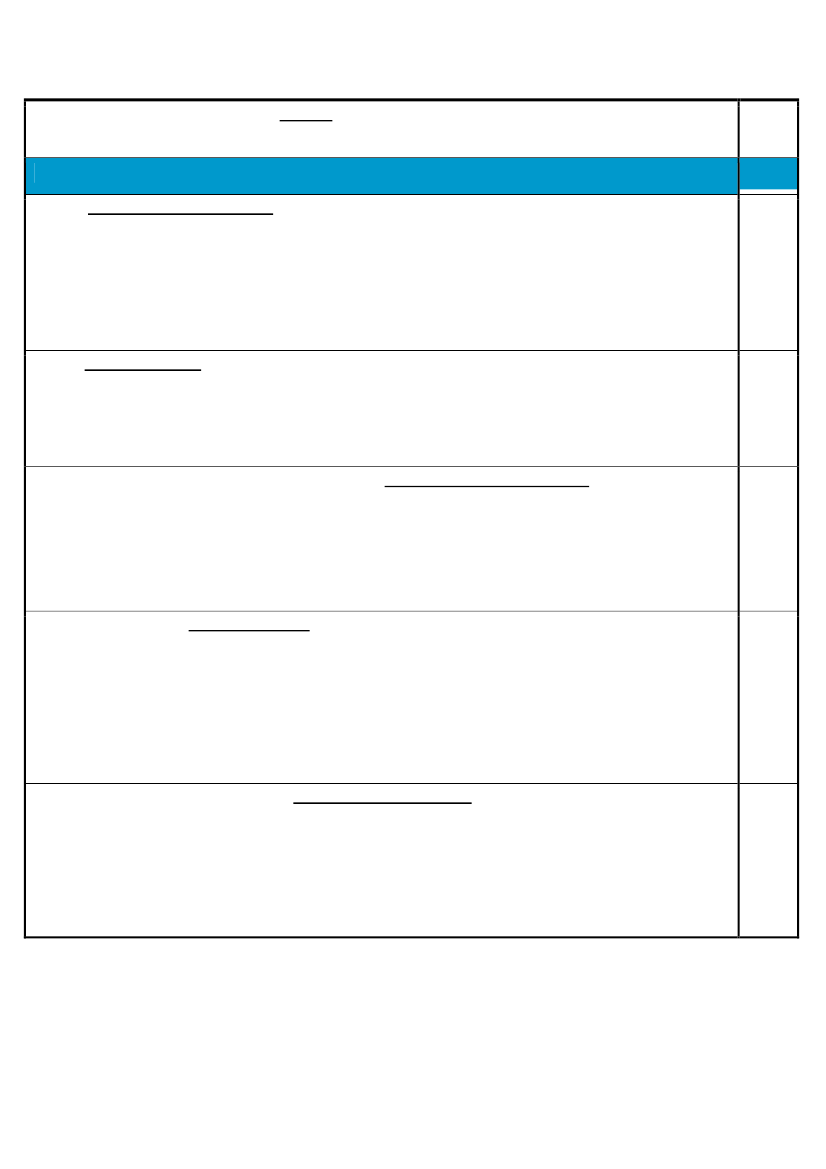
CLUSTER 3Implement the pay and incentives strategy2012:Administrative orders issued for facilitating staff in hard to serve areas by October 20122013:Pay and incentives scheme incorporated into budget 2013/14Tanzania validated as an EITI compliant country2012:Government will produce a report resolving the discrepancies between companies and GoT that were identified in theTEITI first reconciliation report; and, Tanzania EITI will submit a second report to the EITI Board addressing the 5 indicatorsidentified by EITI as being unmet in Tanzania EITI’s first validation report by June 20122013:1) Tanzania is validated as an EITI-compliant country; (2) Domestic legislation institutionalizing EITI and establishing anenabling framework for EITI’s operation is drafted and completes stakeholder consultation by October 2013.2014:(1) Bill of legislation institutionalizing EITI and establishing an enabling framework for EITI’s operation presented toParliament (2) Tanzania publishes annual Tanzania EITI report approved by the International EITI Secretariat by Oct 2014
POPSM
MEM
1
This summary was prepared for ease of reference, the detailed PAF remains as the key document for assessment as approvedby the Troika Plus.
Implement key recommendations from the case flow analysis and roll out of case/work flow reforms2012:Milestones to be defined.
MOCAJ
CLUSTER 4Interface central and local government ICT with technical control and new software acquisition, and all new softwaredeveloped becomes centrally coordinated2012:ICT mapping exercise showing location and owners of all and peri-financial software, software functions, outputs andthe actual potential data sharing, integration requirements / opportunities commenced with inception report published byOctober 2012, showing commitment to complete the mapping by December 2012.2013:Bring all GoT financial and peri-financial software under 1 common architecture with technical support structures.Costed action plan approved by GoT.2014:Milestones for 2014 to 2016 are taken from approved action plan and jointly agreed by GoT and DPsIncrease budget transparency and public access to key fiscal information2012:Guidelines for the preparation of the annual plan and Budget for 2012/13 published on Ministry of Finance website byMay 2012. The Executive Budget proposal as submitted to the Parliament published by end of June 2012. The ApprovedBudget is published on Ministry of Finance website by September 2012. Publish Citizens Budget by November 2012.2013:A Year-End Report (preliminary budget out turn) is published on Government of Tanzania websites by October 2013.Streamline and rationalize national systems and processes for intergovernmental transfers to LGAs2012:Review and mapping of the systems and processes for intergovernmental transfers initiated with inception reportfinalised by October 2012, showing commitment to complete the mapping by December 2012.2013:Comprehensive and sequenced two-year work plan, including a time-bound M/E framework with defined roles andresponsibilities, to address shortcomings of the systems and processes of intergovernmental transfers finalized by June 2013.Key actions starting to being implemented by October 2013.2014:Key actions from the work plan implemented as per M/E framework by October 2014The Government enhances domestic tax revenue (tax and non-tax) mobilization with better transparency and businessenvironment2012:Submission of a bill to Parliament to enact Tax Administration Act for the purpose of establishing a common taxprocedure among different taxes collected by Tanzania revenue authority (TRA) by November 20122013:Submission Finalization of the study on Non Tax Revenue (NTR) -“Integration and Harmonization of Revenue CollectionSystems” by November 2013. Review the current system of tax exemptions with the value-added Tax (VAT) regime andamend the VAT Act with a view to be in line with international best practices by November 20132014:Reform local government tax system to improve LGAs’ own source revenue mobilization by November 2014. Takepolicy action to improve revenue mobilization from natural resources sectorThe Government to strengthen institutions of public investment management and PPPs to ensure that public investmentsand PPP projects are selected based on proper economic and financial assessments2012:Set up the legal mandate of the President’s Office Planning Commission (POPC) with respect to those of the Ministry ofFinance, Prime Minister’s Office, and sector ministries in planning and managing public investments2013:Ensure that implementation of economic and financial analysis of public investment projects is mainstreamed amongthe MDAs and LGAs based on an operational manual prepared by POPC. The Cabinet approves PPP finance regulations ongovernment support and unsolicited bids. Establish operational PPP facilitation fund.
MoF /PMO-RALG
MoF
MoF /PMO-RALG
MoF
MoF /POPC
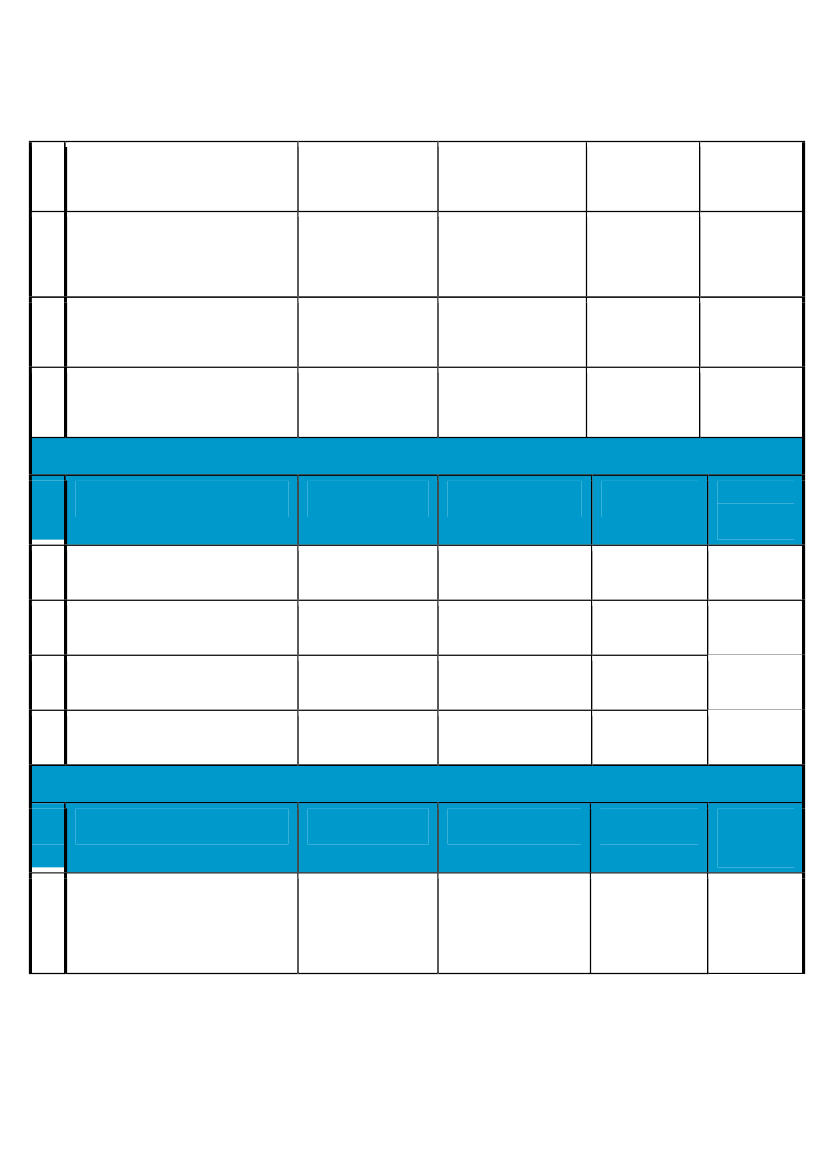
OUTCOME INDICATORS(Assessment Criteria annexed)CLUSTER IOutcome IndicatorBaseline 2011Target 2012Target 2013Target2014
1.
Head count ratio for basic needs poverty lineby rural/urban (Mkukuta II) (MOF-NBS)
33.6% (HBS 2007)
Improvement towards 2015MKUKUTA target includinganalysis of NPS.
Numeric target to beagreed during 2012informed by NPS trendanalysis.1,0781,166
2.
Growth of Value of Agricultural Exports (US $million)2
(MAFS)
905
991
3.
Flow of Private Funds into the AgriculturalSector (Tsh Billion) (MAFS)
691
741
847
957
4.
Proportion of villages with land use plans(MLHS)
8
15
22
31
5.
Time taken by Registrar of Titles to approve atransfer of certificate of right of occupancy(MLHS)
7
7
6
4
6.
Total electricity installed Capacity (MW)(MEM)
1,220 MW
1,400 MW
1,730 MW
2,300 MW
7.
* % population with access to electricity(MEM)
14.7%
16.5%
17%
17.5%
8.
Plant Availability (%) (MEM)
60%
70%
80%
85%
9.
% of Trunk and Regional Roads Network inGood and Fair Condition (MOW)
91%
91%
92%
93%
10.
% of rural roads that are passable (good andfair conditions) (MOW/PMORALG)
56%
58%
61%
63%
11.
Time Taken for Container from offloading untilclearing from port (MOT)
11 days
9 days
7 days
5 days
2
Revised forecast using actual figures instead of previous forecasted data
CLUSTER IIOutcome Indicator1.Standard VII exam pass rate
Baseline 2011
Target 2012
Target 2013
Target 2014
A. National average for the previous year,disaggregated by gender (MoEVT)
A: Baseline 2011:53.5%(M=59.0%; F=48.3%)
55%
60.2%
62.1%
B. Proportion of councils in which less than 40% of Standard VII pupils passed the PSLE in theprevious year (MoEVT)
B:12.1%
9%
12.5%
11.7%
2.
Form 4 examination pass rates (Division I-III)national average for the previous year,disaggregated by gender (MoEVT)
T=11.5%(M= 14.6%; F= 7.8%)
14%
12%
13%
3.
Total enrolment in Degree Programmes (%females) (MoEVT)
121,204(34.7% female)
124,500
127,000
130,500
4.
A. Proportion of births at Health facilities,national average
A: Baseline 201058.4%60%65%70%
B: Baseline 2010B. Proportion of districts in which at least 60%of births take place at health facilities(MoHSW)54%55%60%65%
5.
Persons with advanced HIV disease (CD4<200or <350) currently receiving ARV combinationtreatment (disaggregated under 15 and over15 and by sex) (MoHSW)
Baseline 2010384,816362,570404,788459,594
6.
Nurses and Nurse midwives per 10,000population by region (MoHSW)
Baseline 20103.964.04.45
7.
Total number of enrolment in health institutes(MoHSW)
Baseline 20116,713 (101%)
7,47575%
8,32583%
9,00090%
8
Proportion of households in rural settlementswith access to clean and safe water fromimproved/protected sources (MOWI)
Baseline 2010:57.8%
60.5%
62.1%
63.6%
9
Proportion of households in small towns withaccess to clean and safe water fromimproved/protected sources (MOWI)
Baseline 2009:53%
54.3%
55.7%
56.3%
10
Proportion of households in Regional urbancenters with access to clean and safe waterfrom improved/protected sources (MOWI)
Baseline 2010:86%
89.6%
91.4%
93.2%
11
Proportion of households in Dar es Salaamwith access to clean and safe water fromimproved/protected sources (MOWI)
Baseline 2010:55%
60%
67%
71%
CLUSTER IIIOutcome IndicatorBaseline 2011Target 2012Target 2013Target2014
1.
Percentage number of cases pending for twoor more years (MOCAJ)
14%
13%
12%
2.
Citizen Satisfaction with Service delivery inLGAs.(PMORALG)
LGAs 54%
3.
% of Under Five children receiving birthcertificates (MOCAJ)
Baseline from DHS 20106.2%
8%
11%
14%
4.
Joint commitment to develop anti-corruptionOI with agreed milestones in PAF 2013
CLUSTER IVOutcome IndicatorBaseline 2011Target 2012Target 2013Target2014BL+10% ofbaseline
1.
Average level of compliance of:i) All audited procuring entities and;ii) The top 20 procuring entities with the(revised) Procurement Act 2010. (MOF-PPRA)
(63%+75%)/2=68%
i) 75%ii) Baseline(BL) (New set ofindicators)
BL+5% of baseline
2.
Non-salary (OC-DEV) funds released to RAS andLGAs by end Q3, as percentage of theResources Available3
(OC+DEV) for the year.(MOF-BUDGET)Reduction in outstanding audit matters (MOF-NAO)
42.1%
60%
65%
70%
3.
Central: Tshs. 362026millions.Local: Tshs. 5515 million.
i) Improved performance andreduction in value of lastyear’s baseline at central andlocal levels in outstandingmatters.ii) Targets for 2013 and 2014TBD by June 2012.
4
Approved budget broadly in line with policyobjectives (MKUKUTA, 5YDP, sector policypriorities) (MOF-BUDGET)
75%
75%
75%
75%
5
Share of total actual expenditure on education,health, water, agriculture, road, and energysectors in total government spending excludinginterest. (MOF-BUDGET)Domestic tax revenue + non-tax revenue as ashare of GDP (MOF-BUDGET)
57.7%
58.7%
59.7%
60.7%
6
16.3%
17.6%
17.8%
18%
7
Value of tax exemptions as a share of GDP(MOF-PAD)
2.2%
1.9%
1.6%
1.2%
DONOR PAF 2012OUTCOME INDICATORBaseline 2011Target 2012Target 2013Target201465%
1.
% of Budget Support disbursed within the firstquarter of the GoT fiscal year.
17%
55%
60%
2.
% of budget support disbursed at the latestduring the quarter indicated in thedisbursement schedule agreed with GoT at thetime of confirmation of commitment.
98%
98%
98%
98%
“Resources available” is equivalent to final allocated budget at the end of the year which takes into account adjustments, such as necessaryexpenditure cuts and reallocations within the year.
3
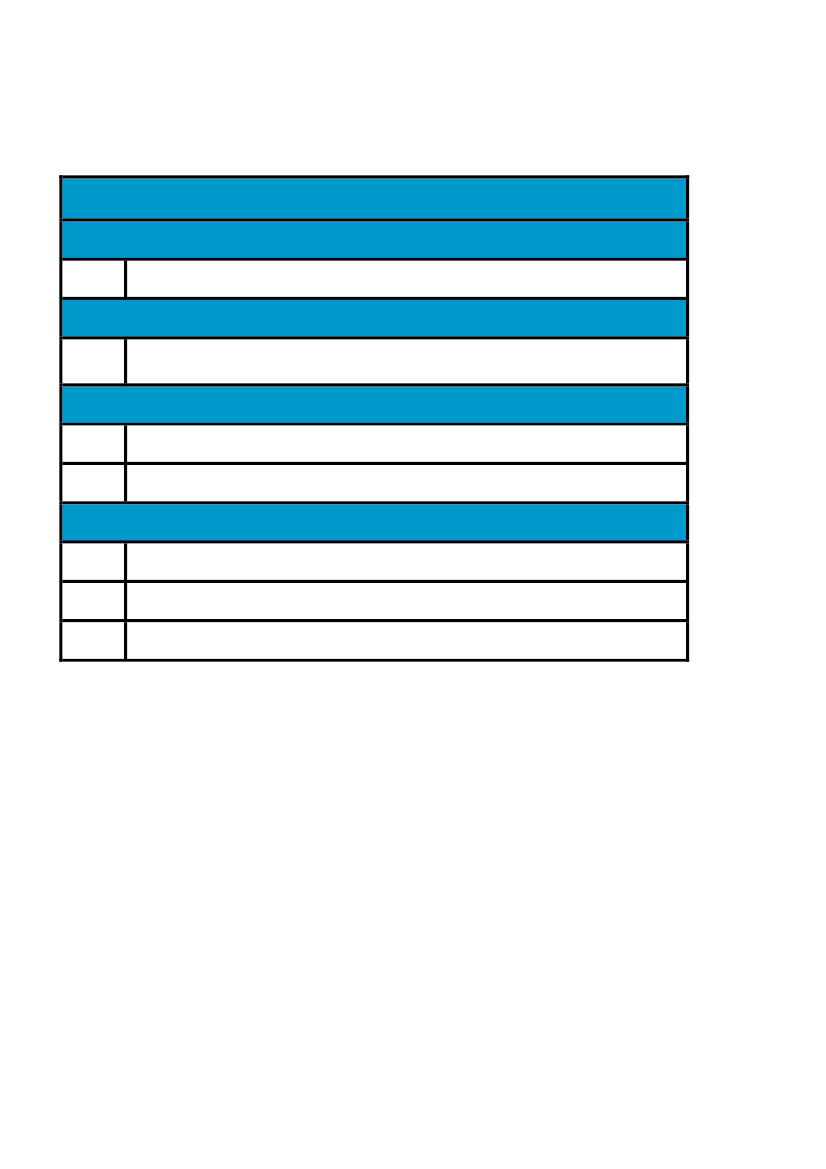
III.UNDERLYING PROCESSESCluster I1.Cluster II2.Cluster III3.4.Accountable GovernanceAnti-corruptionEducation Sector ReviewEnergy Sector Review
Cluster IV5.6.7.Macro-economic stabilityEffective PER dialoguePFM reform