Transportudvalget 2012-13
TRU Alm.del Bilag 133
Offentligt
Mir mache BÄRN MOBIL – We make Bern mobile
Population, working places and commuters
Bern CityPopulationWorkingplacesCommuters95‘000/day132’555152’600
Served area215‘000190‘000
Bern Region315’000224’000
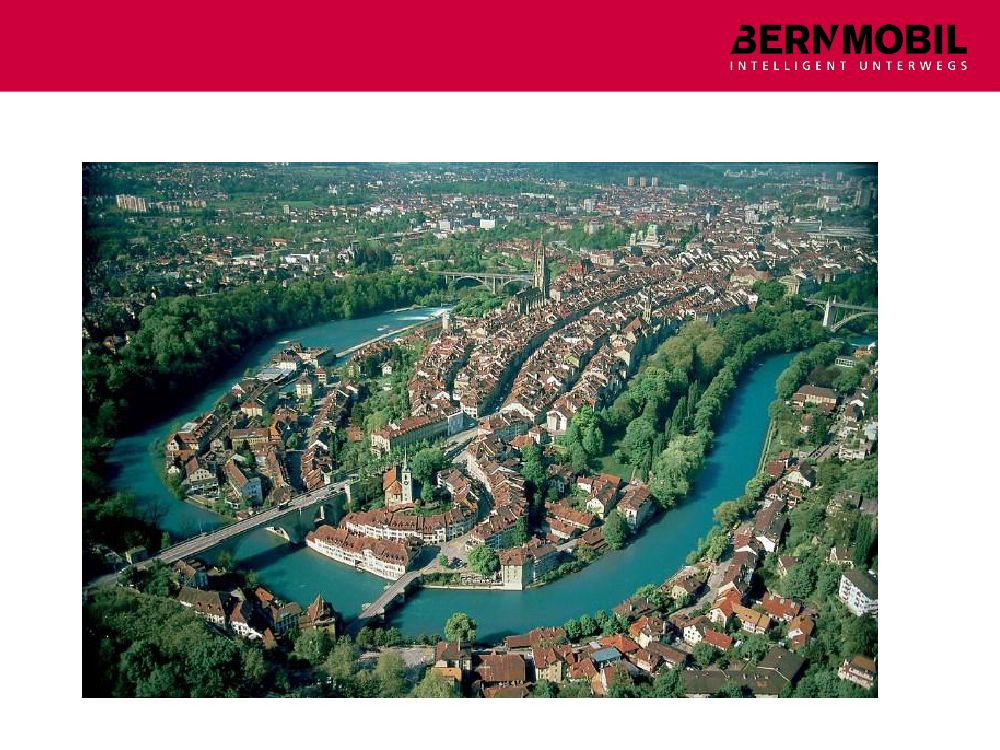
Old town is an UNESCO world heritage
Market shares City of Bern (distance km)
Traffic100%
pt46%
Cycling/walking11%
Cars/motorcycles43%
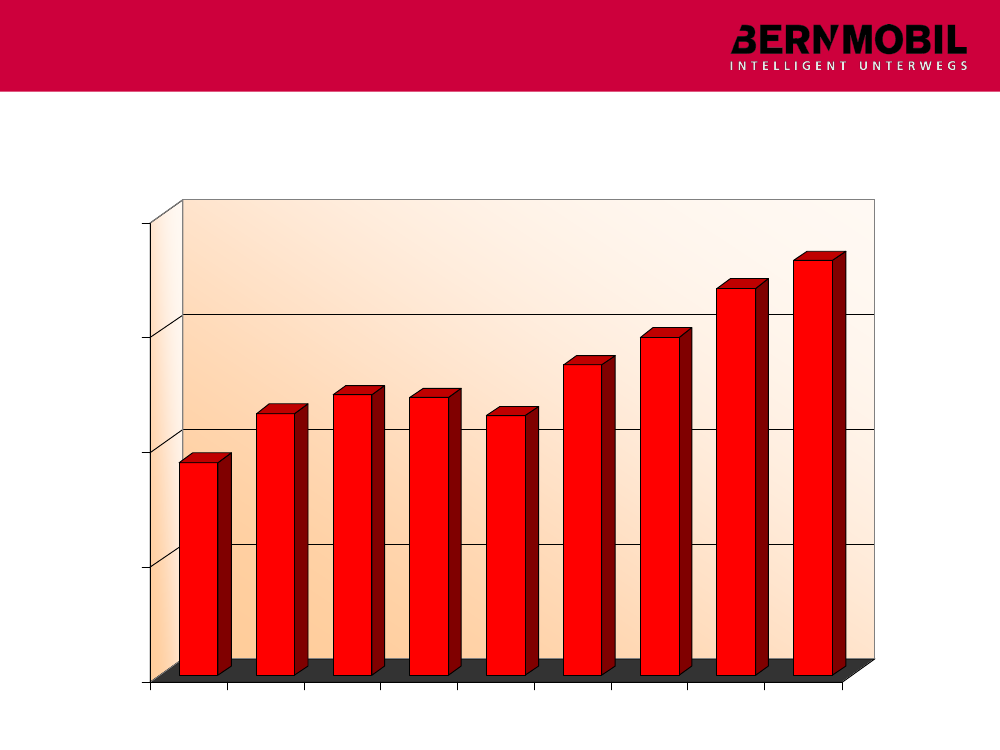
Continous growth of passengersFahrgäste in 1000100000
90000
80000
70000
60000200320042005200620072008200920102011
Jahr
Services
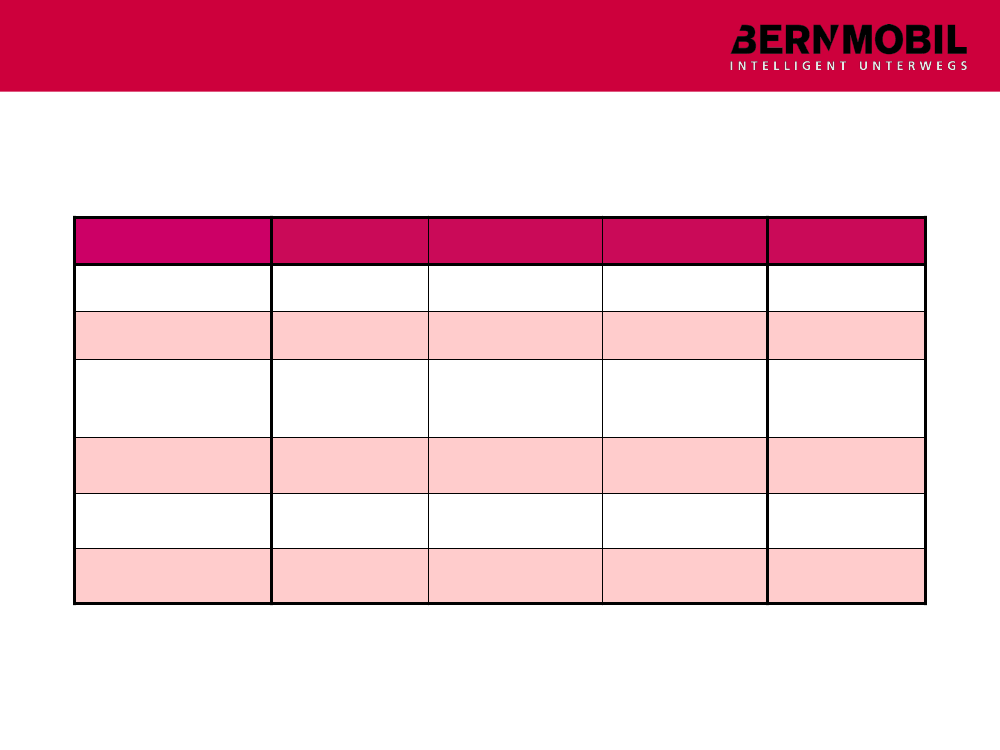
TramLinesLengthVehicles km*Passengers*539.6 km3.7 Mio.45.9 Mio.
Trolleybus311.7 km1.5 Mio.20.8 Mio.
Bus19116 km5.0 Mio.29.4 Mio.
Total27167.3 km10.2 Mio.96.1 Mio.
StopsSchedule* 2011
3106 min.2 - 8 min.3 -10 min.
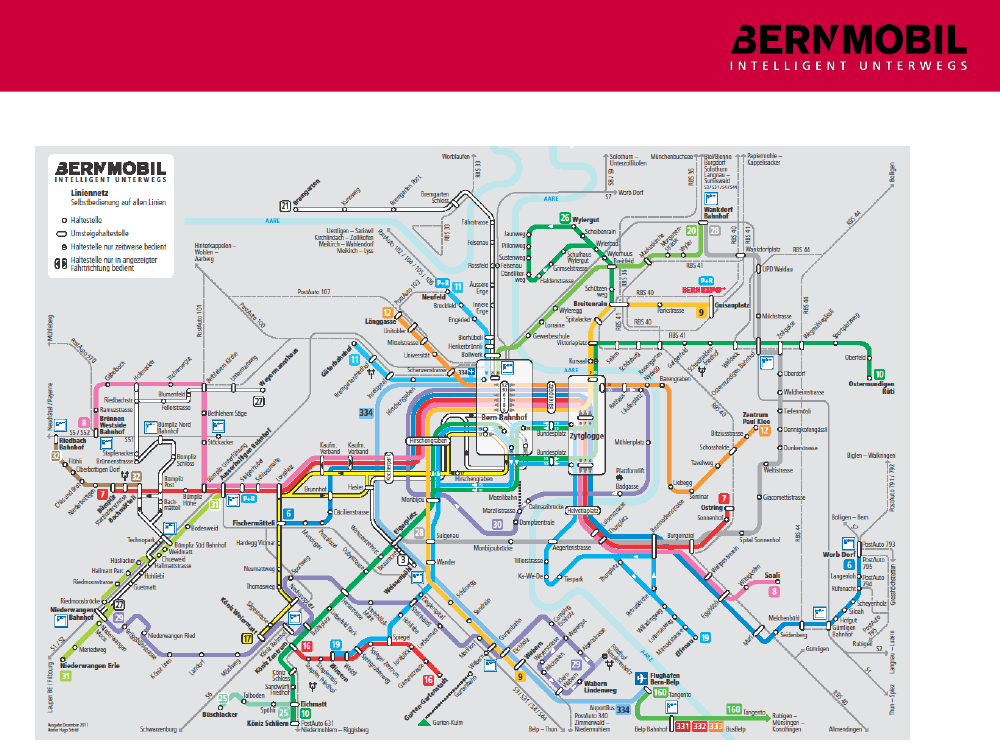
Pt net City of Bern
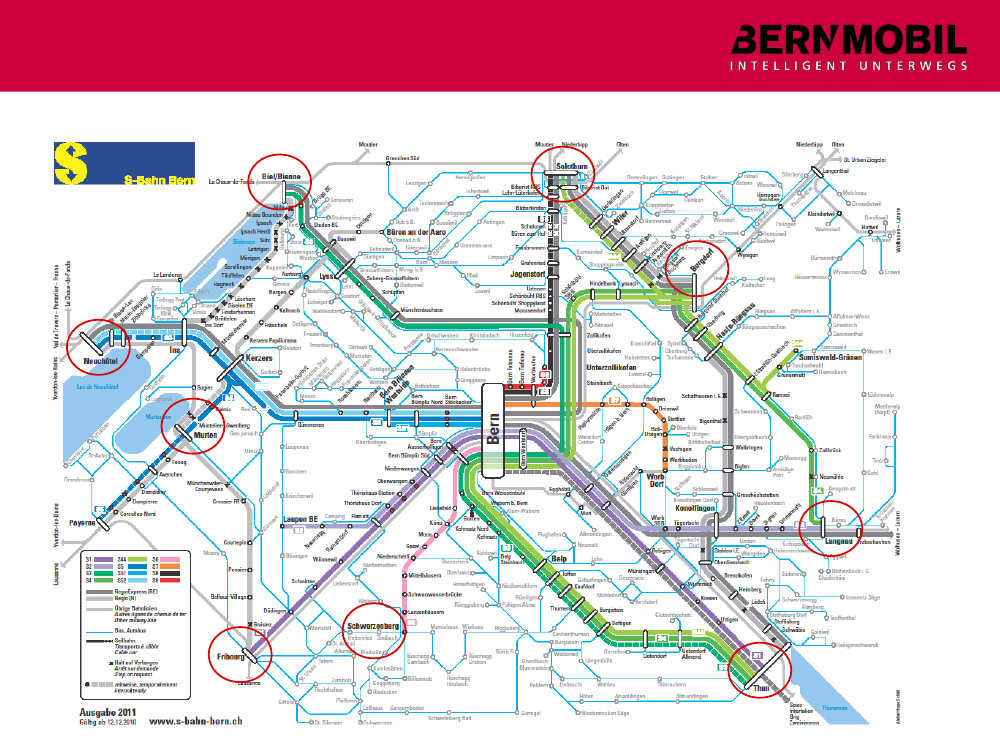
Pt net Bern Region
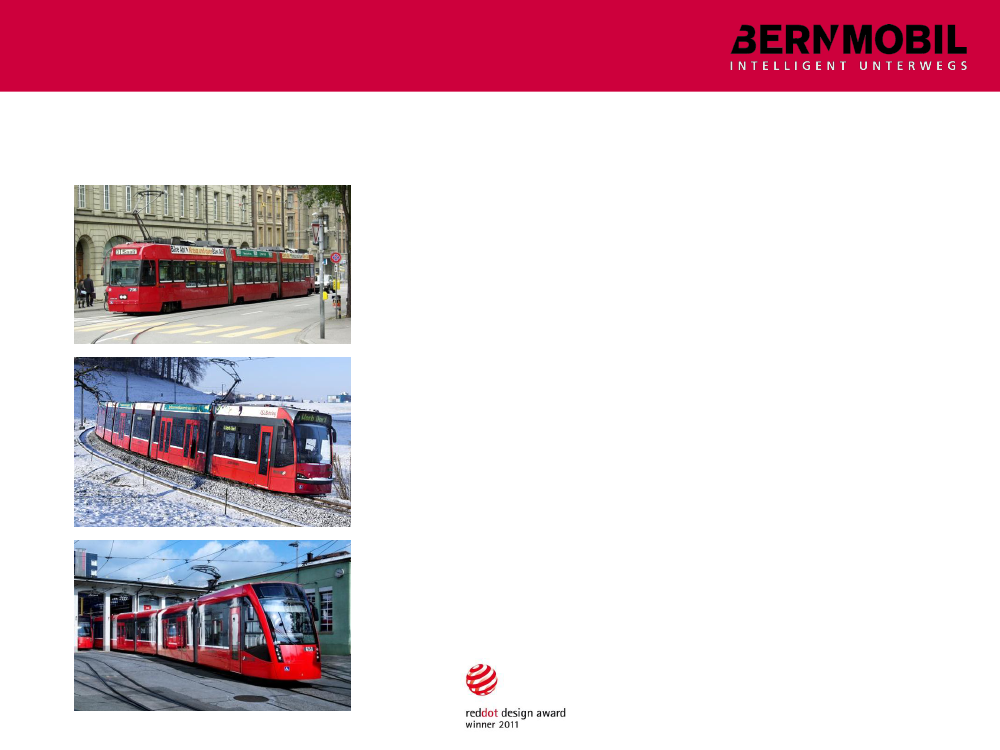
48 Trams
12 Vevey-ABB-Duewag Be 4/831 m lengthConstruction 1989/90
15 Siemens Combino Advanced- 7 at 31 m length (Be 4/6)- 8 at 41.5 m length (Be 6/8)Construction 2002-2004/2009
21 Siemens Combino Classic XL Be 6/841.5 m lengthConstruction 2009/2010
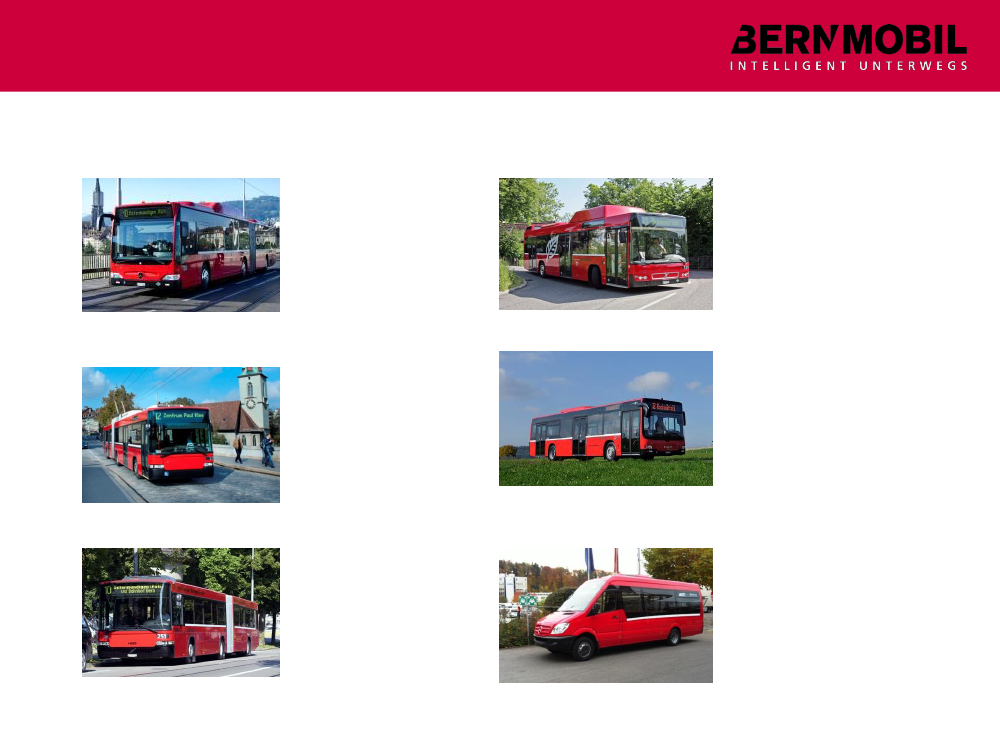
141 Busses24 Mercedes CitaroCNG GAB (Gas)2009/201032 Volvo 7700ACNG GAB (Gas)200620 Swisstrolley GABHess/NAW/Kiepe1998/200016 Volvo 7700A2CNG AB (Gas), 2007/20092 MAN Lion‘s CityDiesel, 2011
11 MAN Lion‘s MidiDiesel, 201112 MAN MidiDiesel, 2005
22 Hess VolvoGABDiesel2002/2003
2 Mercedes SprinterDiesel2011
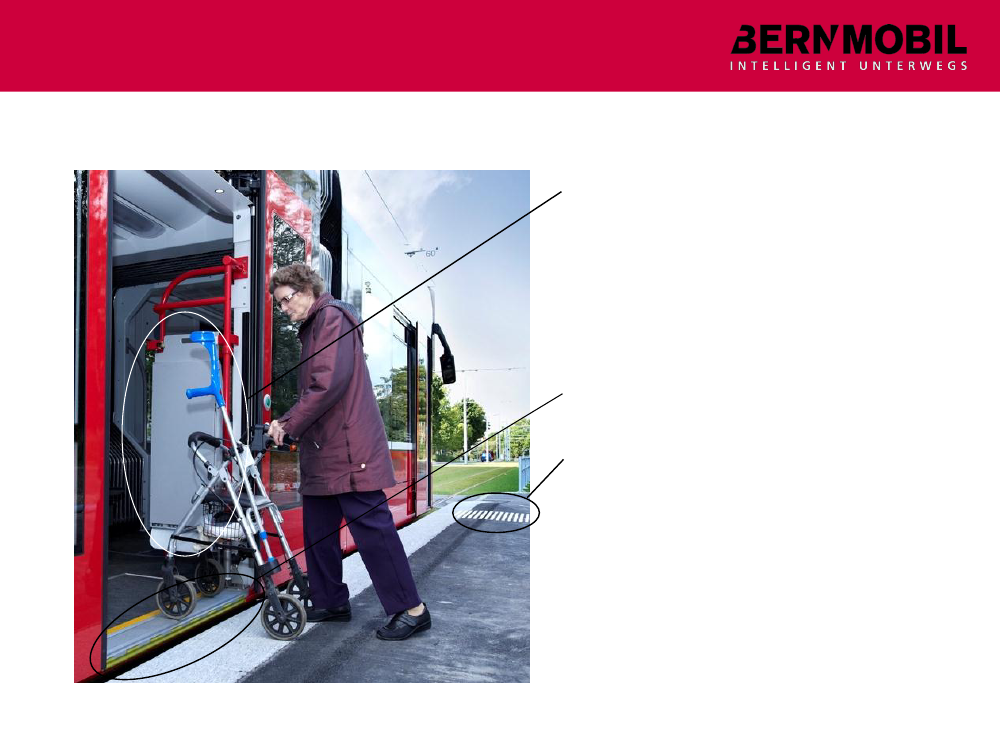
Accessibility for handicapped people•100% low floor vehicles withwheelchair ramps•optical and accoustic passengerinformation in the vehicles
•Optical passenger information at thevehicles and stops•Stepfree entrance at new stops andrebuilt stops•Squares for blind people at stops•Reserved seating places•Space for wheelchairs in the vehicles•Ticket machines and informations atstops adapted for handicappedpeople•Special trainings for collaborators
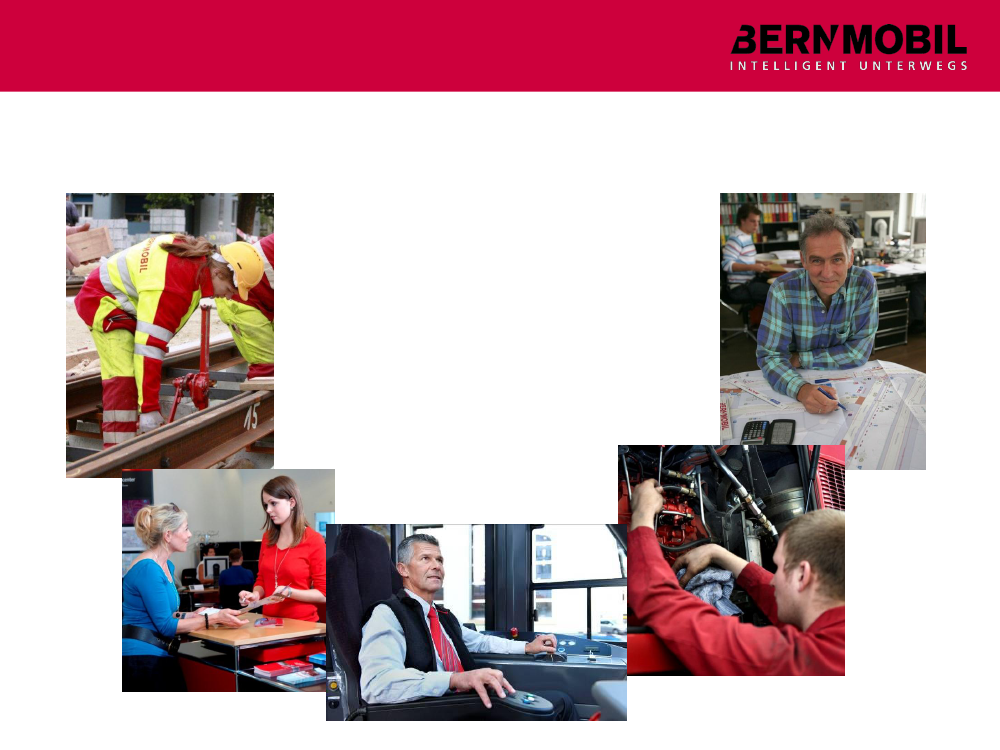
Staff814 employees(2011)(703 men/111 women)•564 operation•153 technique•85 administration
•12 trainees
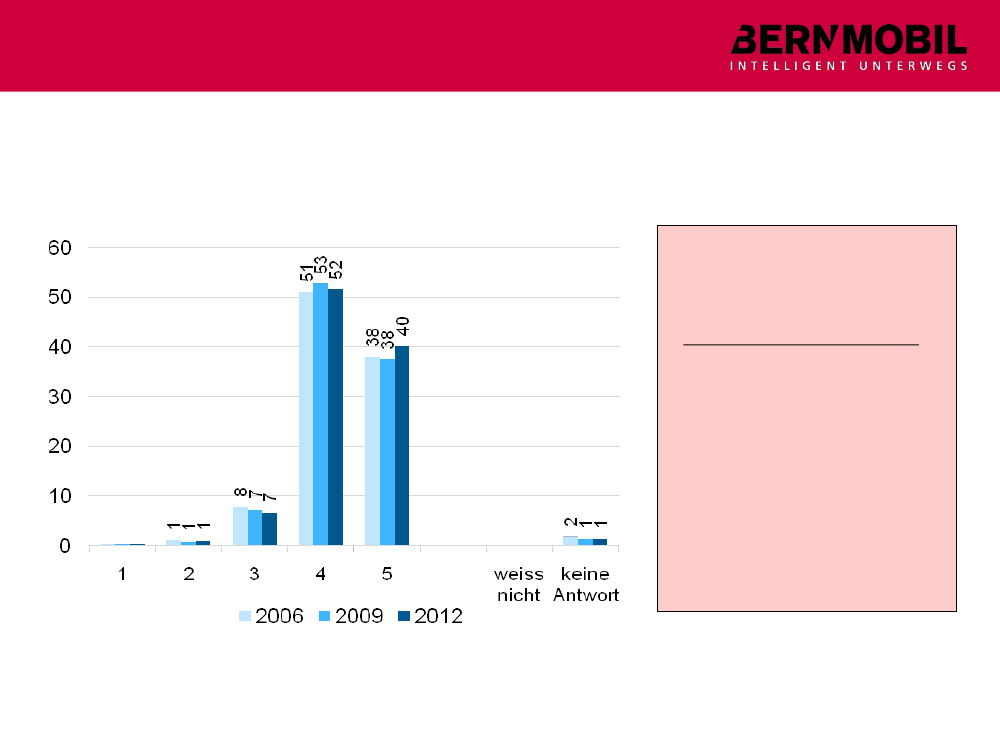
Customer satisfaction survey 2012
Overall staisfaction1998 - 2009Year2012MW4.31Trend
20092006200320011998
4.284.284.194.074.19
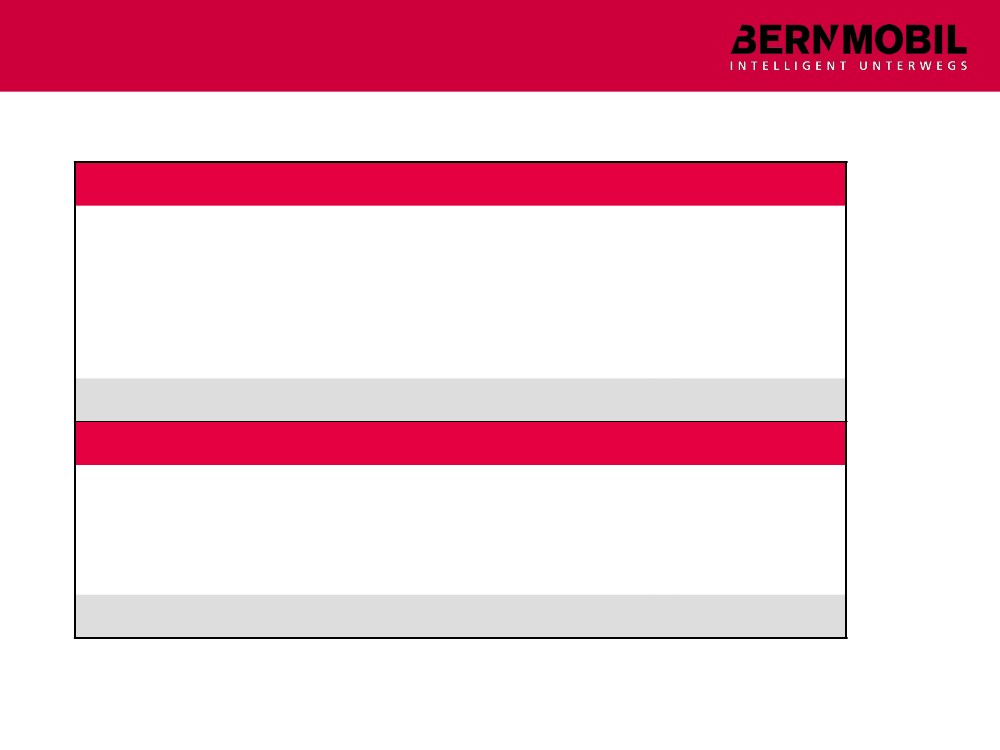
Finance(2011 in CHF 1‘000)RevenueTicket revenueOther revenue90‘76713‘881
Total ICompensationTotal IIExpendituresStaffMaterial costDepreciation, capital costTotalDegree of cost recovery
104‘64851‘419156‘067
75‘88052‘74225‘675154‘29767.8%
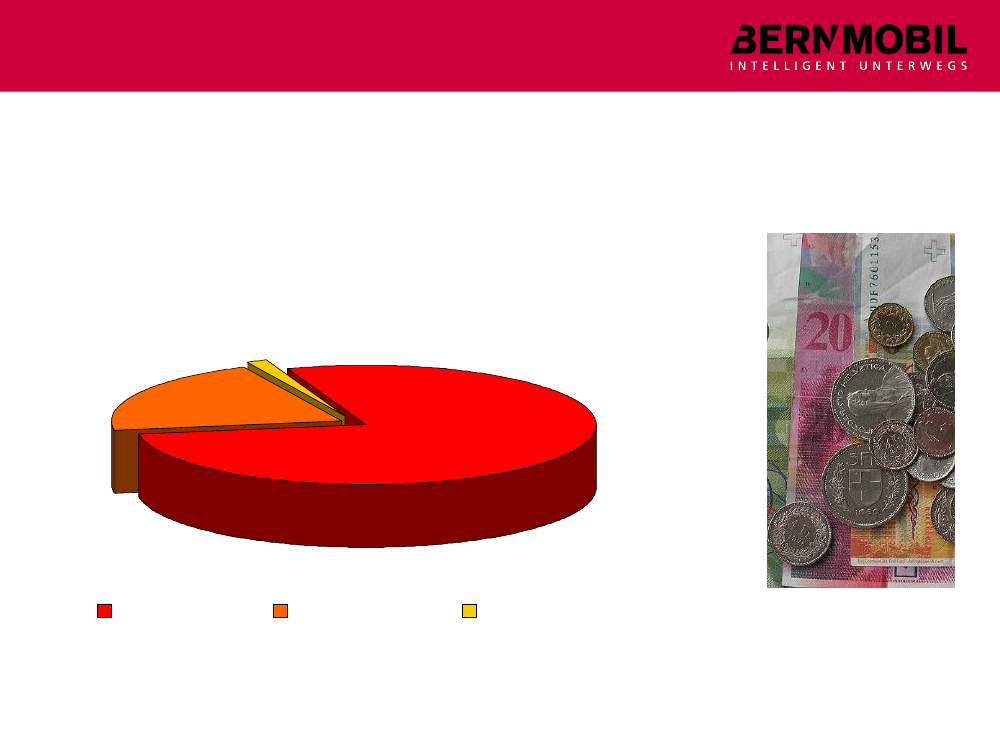
Ticket revenueCHF 90.77 Mio.(2011)
1%21%
78%
Libero
GA/HTA
Extrafahrten, Diverses
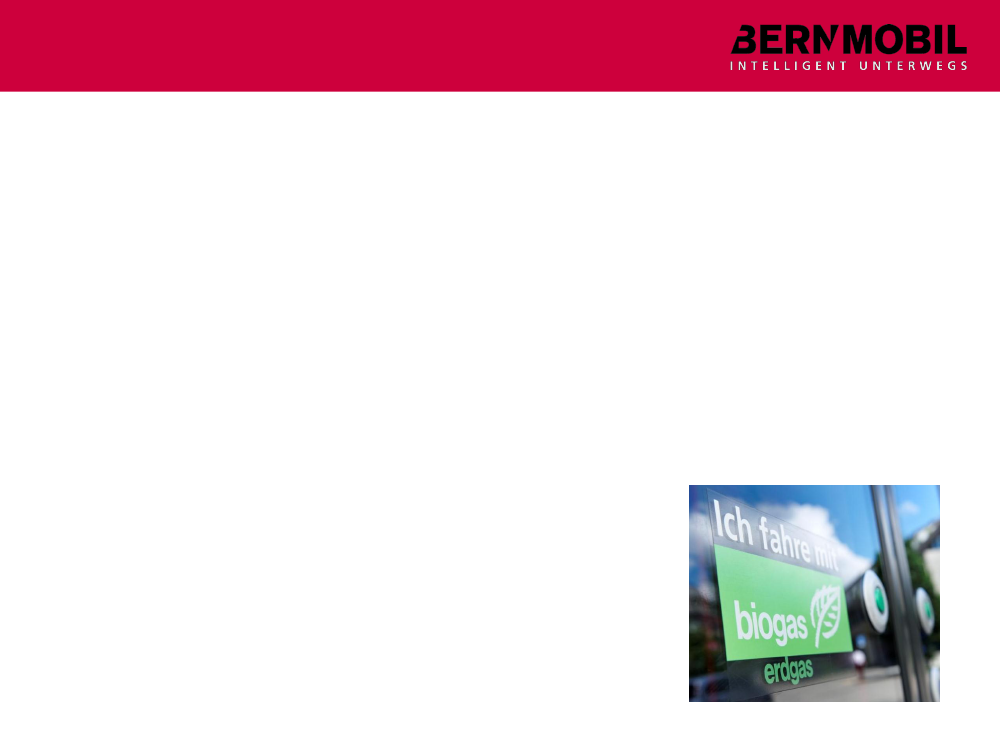
Environment•Reduce the consumption of not renewable energy, substitution byrenewable energy:Switch-over from diesel to CNG/biogasElectricity completely by hydrocraftUse of energy efficient technology:Solar power on the roof of the new tram depotTests for energy storages on our vehiclesStandards for sustainable procurementOptimization of traffic managementPromotion of electric tractionChange the behavior of our employeesEco Drive
•
•••
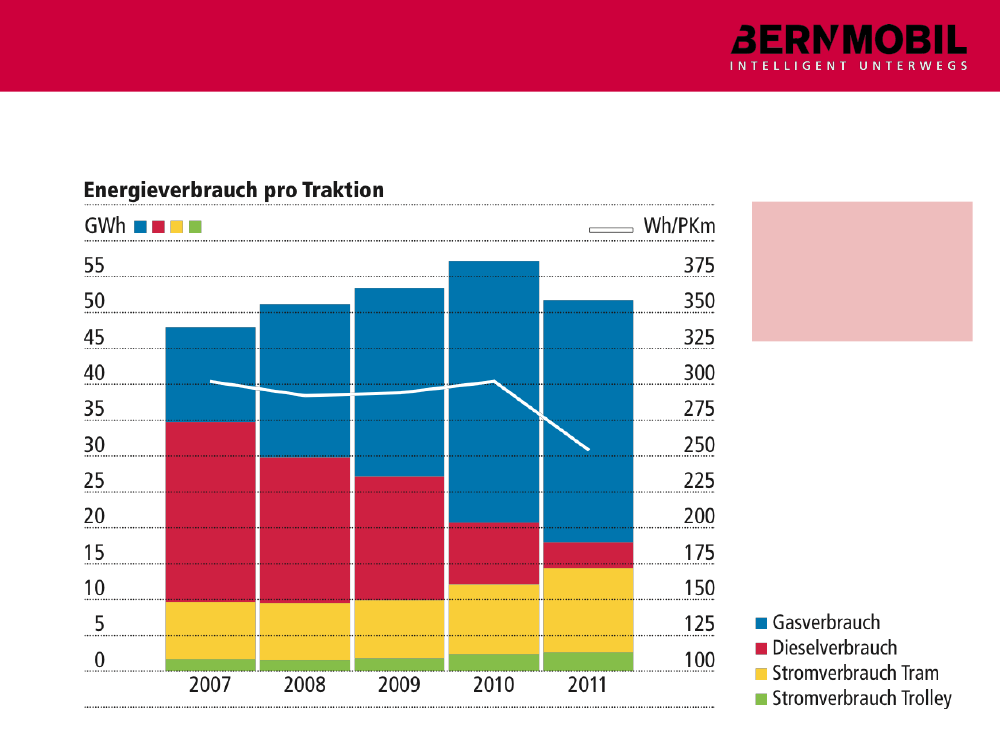
Development of energy consumptionEnergyconsumption2010/2011:-5.5 GWh due toTram Bern West
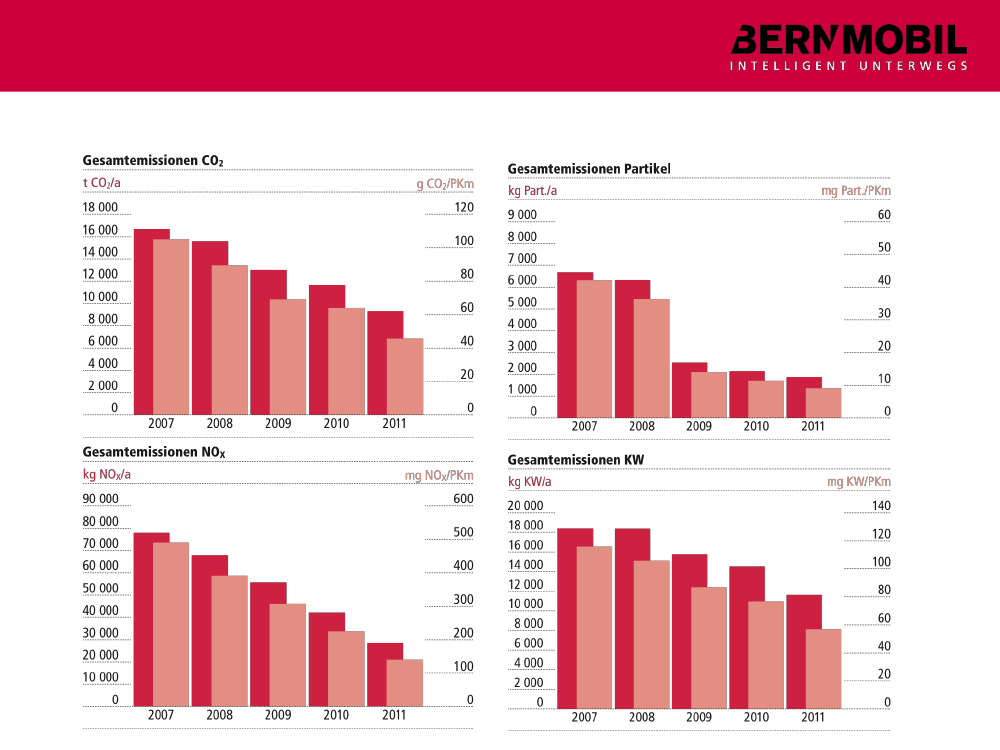
Development of pollutant emissions
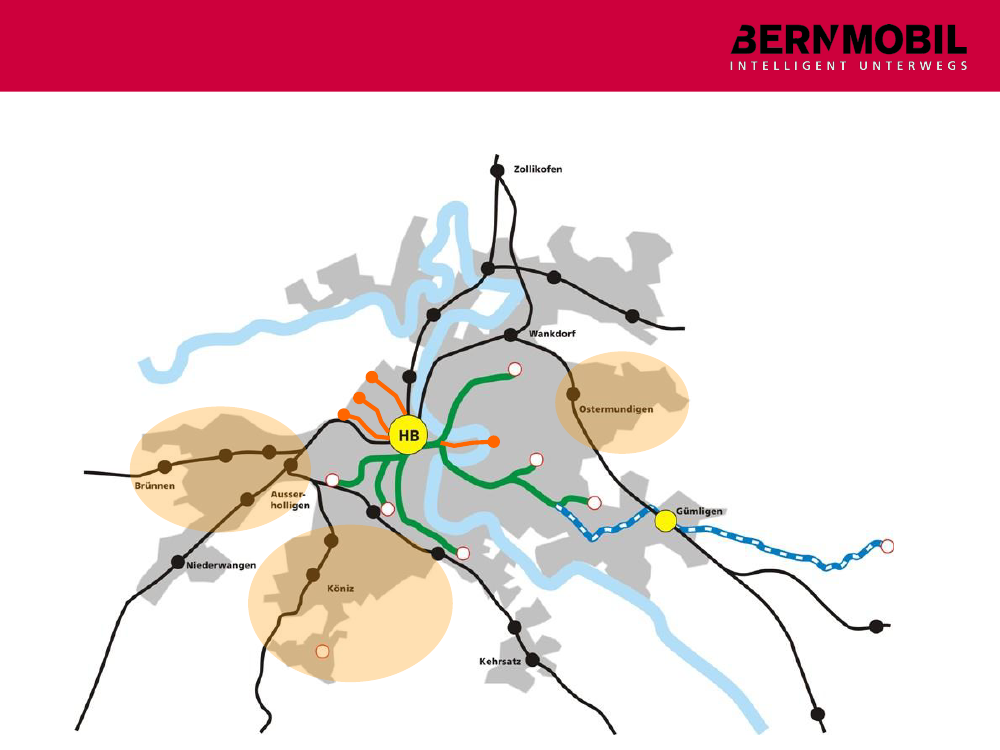
Development of the tramway net (1)
15’000 E32’000 E
40’000 E
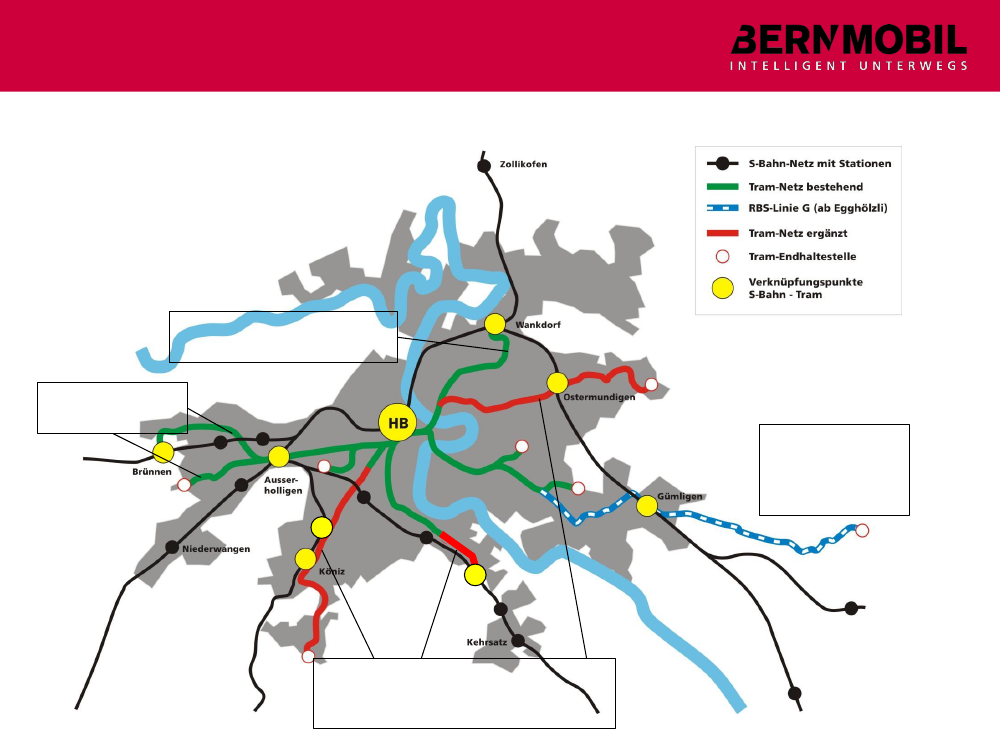
Development of the tramway net (2)
09.12.2012:Prolongation of line 912.12.2010:Tram Bern West
12.12.2010:Integration ofline G (RBS) intothe tramway net
Planning of Tram Ostermundigen –Köniz and prolongation oft the line9 from Wabern to Kleinwabern
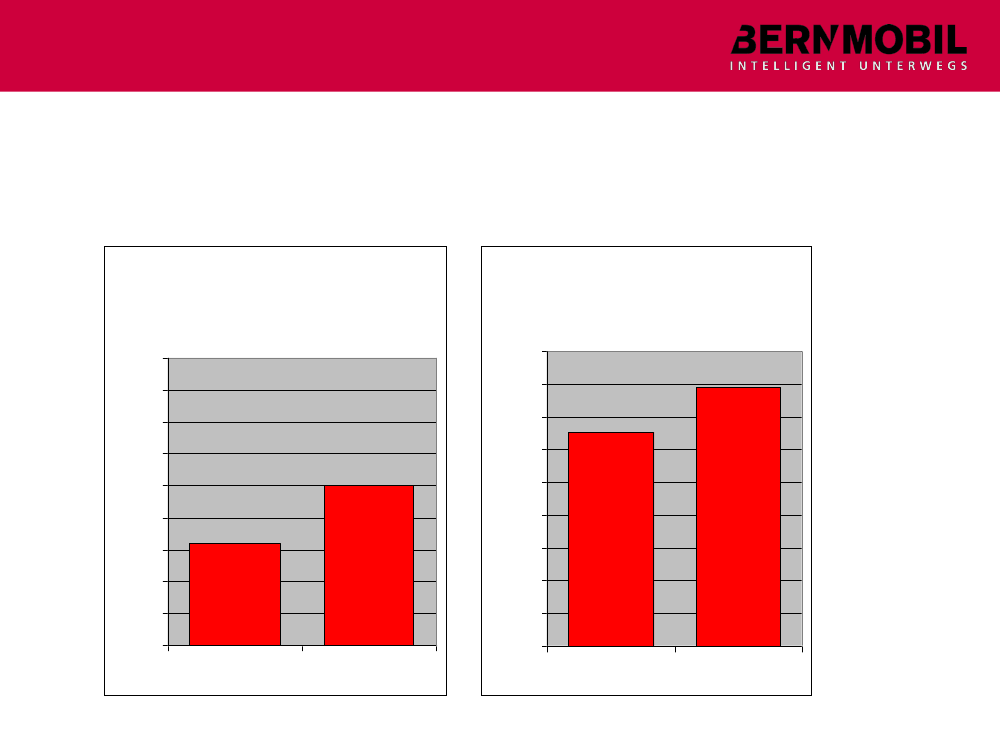
Forecast of traffic development in the Region Bern
Verkehrsleistung ÖV+ 56%987
Verkehrsleistung MIV+ 21%987
6543210
6543210
2007
2030
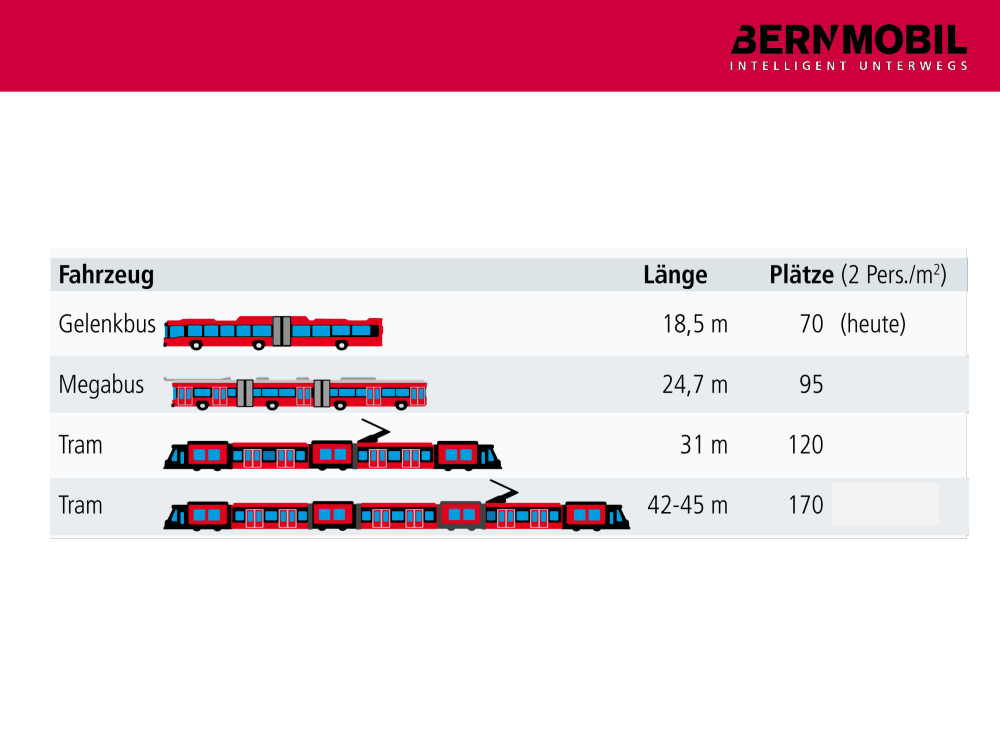
Comparison of transport capacities
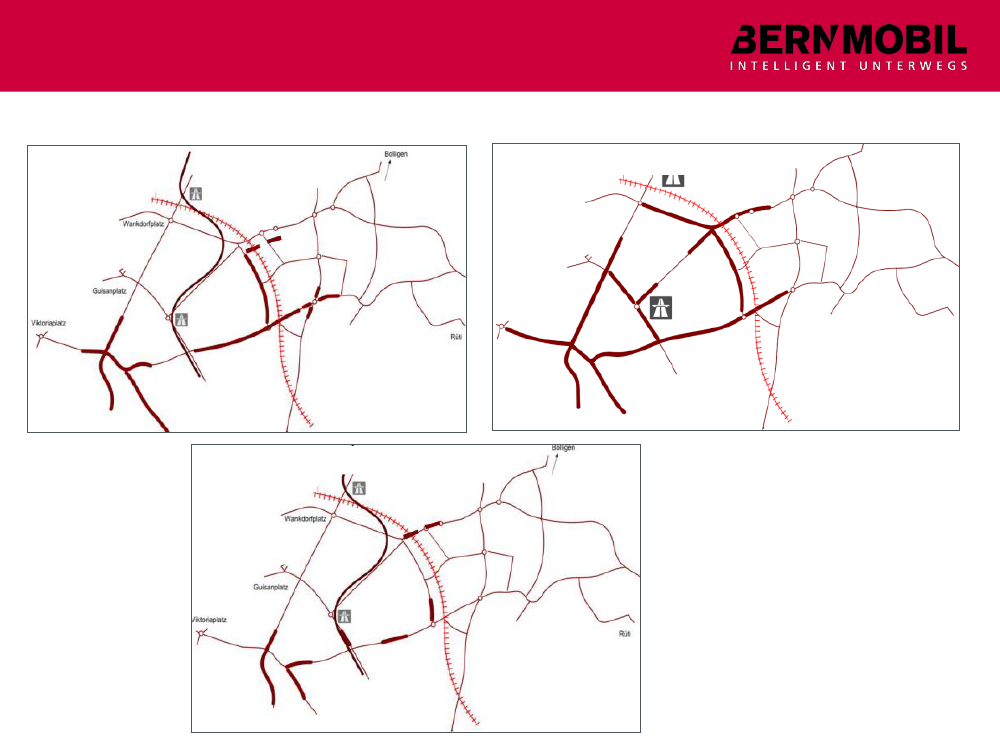
Sequences of traffic flow in Bern North Bus/TramSituation today Bus with 3’ scheduleSituation Bus with 2‘ schedule
Situation Tram with 6’ schedule
Verkehrsmanagement(Bericht Vorprojekt), RK&P, 2010
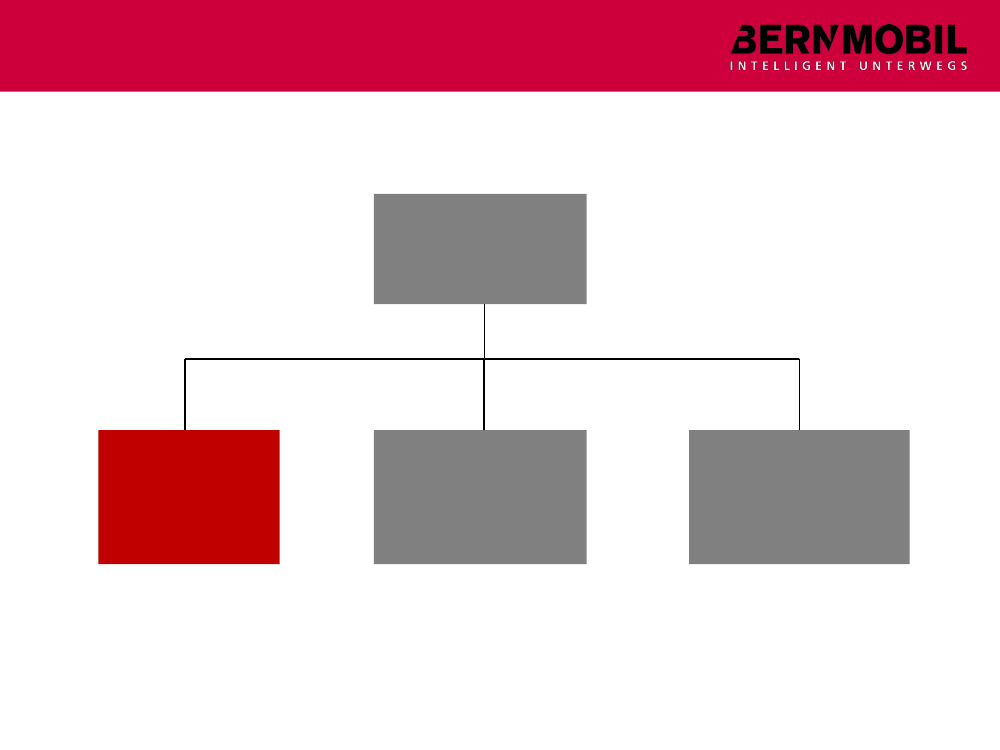
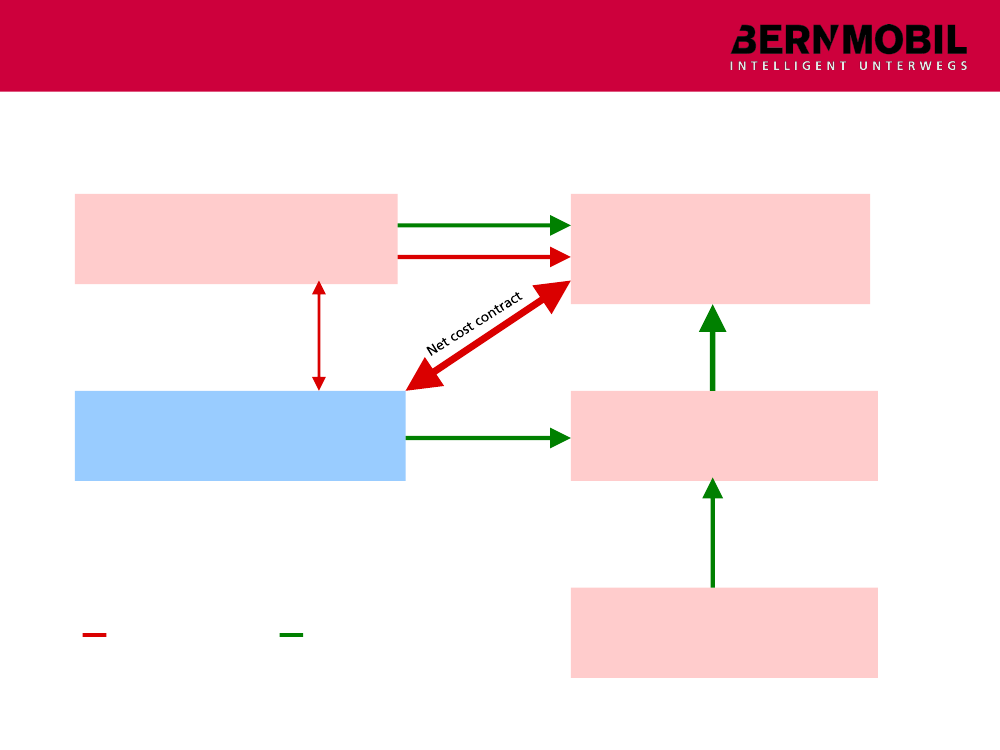
Organisation of public transport in the Kanton BernFederal Government- Co-Ordering and co-financing ofregional ptDefinition ofservice levels
Kanton- Co-ordering and financing ofregional pt- Ordering and financing of local ptServices
Rate for co-financing
Operator/companies- Production- Marketing/Revenues
Net costcontract
participation
Regional conferences- Planning of pt
Communitiesfinancept planning
- Praticipation in planning
Participation
Thank you for your attention
