Socialudvalget 2012-13
SOU Alm.del Bilag 333
Offentligt
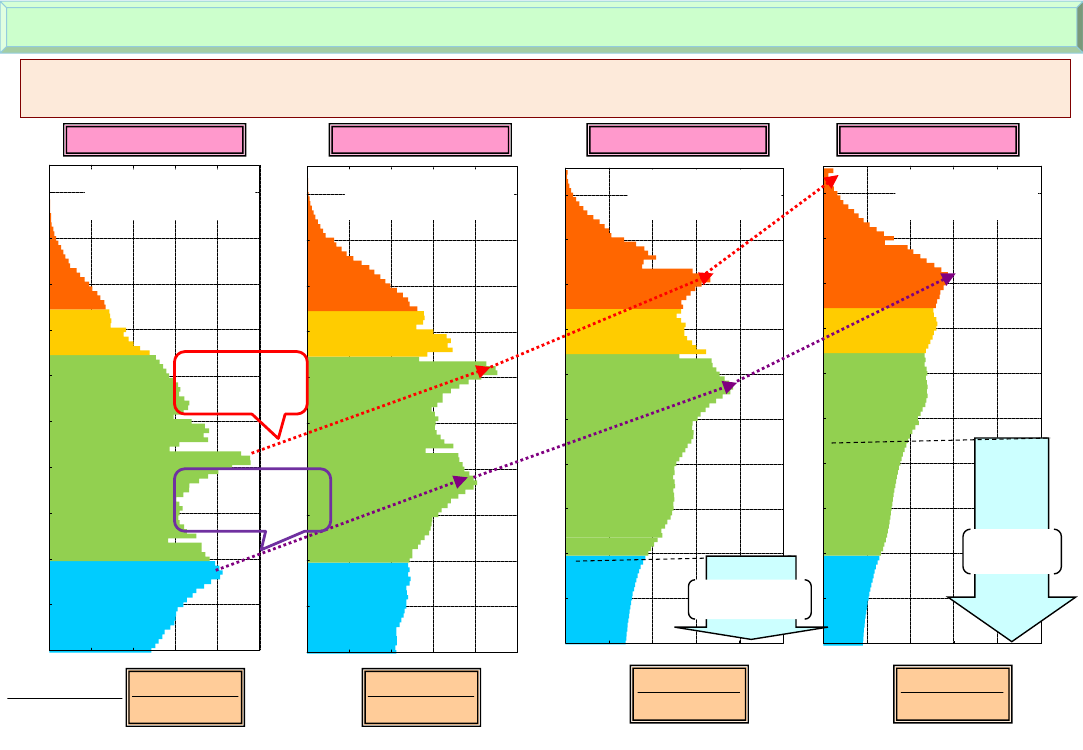
Change in the population pyramid (1990, 2010, 2030, 2055) - 2006 medium variant projection -Change in Japan’s population structure shows that one senior citizen is supported by 2.5 people in today’s society.In 2055, when the society will be much aged and have fewer children, Japan will have a social structure where one senior citizen will be supported by1.2 people.Age100
1990 (results)Total population123.61 millionAges 75+597 ( 5%)
Age100
2010 ( results)Total population128.06 millionAges 75+1,407 (11%)65-741,517 (12%)
Age100
2030Total population115.22 millionAges 75+2,266 (20%)
Age100
2055Total population89.93 millionAges 75+2,387 (27%)
90
90
90
90
80
80
80
80
70
65-74892 ( 7%)
70
70
65-741,401 (12%)
70
65-741,260 (14%)
60
Baby boomers60(born in 1947-49)20-647,590 (61%)50
60
60
50
50
50
20-644,290 (48%)
20-647,497 (59%)40
40
40
20-646,305 (55%)
40
30
Children of baby boomers(born in 1971-74)30
30
30
Born in2012~Subject to changedepending on futurebirth rate
20
20
20
10
19 and younger3,249 (26%)10
Born in 2012~19 and younger1,550 (13%)
20
19 and younger2,287 (18%)
10
Subject to changedepending on future birth10rate0
19 and younger1,057 (12%)
0050100150200250
00050100150200250050100150200250
0
50
100
150
200
250
Population aged 65 and overPopulation aged 20-64
15.1
10,000s ofpeople
12.5
10,000s ofpeople
11.7
10,000s ofpeople
11.2
10,000s ofpeople
Note: Data for 1990 and 2010 are population census results.

