Miljøudvalget 2012-13
MIU Alm.del Bilag 299
Offentligt
The Danish PesticideLeaching AssessmentProgrammeMonitoring results May 1999–June 2011
Walter Brüsch, Jeanne Kjær, Annette E. Rosenbom, René K. Juhler,Lasse Gudmundsson, Finn Plauborg, Carsten B. Nielsen and Preben Olsen
Geological Survey of Denmark and GreenlandDanish Ministry of Climate, Energy and BuildingDepartment of AgroecologyAarhus UniversityDepartment of BioscienceAarhus University
Editor:Walter BrüschCover photo:Vibeke ErnstsenCover:Henrik Klinge PedersenLayout and graphic production:Authors and Helle WintherPrinted:Maj 2013Price:DKK 200ISBN 978-87-7871-336-0Available from:Geological Survey of Denmark and GreenlandØster Voldgade 10, DK-1350 Copenhagen K, DenmarkPhone: +45 38 14 20 00. Fax: +45 38 14 20 50E-mail: [email protected]Homepage: www.geus.dkThe report is also available as a pdf file at www.pesticidvarsling.dk� De Nationale Geologiske Undersøgelser for Danmark og Grønland, 2013
Table of contentsPREFACESUMMARYDANSK SAMMENDRAG1INTRODUCTION .......................................................................................................................... 131.11.22OBJECTIVE............................................................................................................................... 13STRUCTURE OF THEPLAP ....................................................................................................... 14
PESTICIDE LEACHING AT TYLSTRUP.................................................................................. 172.1MATERIALS AND METHODS...................................................................................................... 172.1.1Site description and monitoring design .............................................................................. 172.1.2Agricultural management ................................................................................................... 182.1.3Model setup and calibration ............................................................................................... 182.2RESULTS AND DISCUSSION....................................................................................................... 192.2.1Soil water dynamics and water balances ............................................................................ 192.2.2Bromide leaching................................................................................................................ 212.2.3Pesticide leaching ............................................................................................................... 23
3
PESTICIDE LEACHING AT JYNDEVAD ................................................................................. 313.1MATERIALS AND METHODS...................................................................................................... 313.1.1Site description and monitoring design .............................................................................. 313.1.2Agricultural management ................................................................................................... 313.1.3Model setup and calibration ............................................................................................... 333.2RESULTS AND DISCUSSION....................................................................................................... 353.2.1Soil water dynamics and water balances ............................................................................ 353.2.2Bromide leaching................................................................................................................ 363.2.3Pesticide leaching ............................................................................................................... 38
4
PESTICIDE LEACHING AT SILSTRUP ................................................................................... 454.1MATERIALS AND METHODS...................................................................................................... 454.1.1Site description and monitoring design .............................................................................. 454.1.2Agricultural management ................................................................................................... 454.1.3Model setup and calibration ............................................................................................... 474.2RESULTS AND DISCUSSION....................................................................................................... 474.2.1Soil water dynamics and water balances ............................................................................ 474.2.2Bromide leaching................................................................................................................ 504.2.3Pesticide leaching ............................................................................................................... 51
5
PESTICIDE LEACHING AT ESTRUP ....................................................................................... 595.1MATERIALS AND METHODS...................................................................................................... 595.1.1Site description and monitoring design .............................................................................. 595.1.2Agricultural management ................................................................................................... 595.1.3Model setup and calibration ............................................................................................... 615.2RESULTS AND DISCUSSION....................................................................................................... 615.2.1Soil water dynamics and water balances ............................................................................ 615.2.2Bromide leaching................................................................................................................ 645.2.3Pesticide leaching ............................................................................................................... 65
6
PESTICIDE LEACHING AT FAARDRUP ................................................................................. 736.1MATERIALS AND METHODS...................................................................................................... 736.1.1Site description and monitoring design .............................................................................. 736.1.2Agricultural management ................................................................................................... 766.1.3Model setup and calibration ............................................................................................... 766.2RESULTS AND DISCUSSION....................................................................................................... 776.2.1Soil water dynamics and water balances ............................................................................ 776.2.2Bromide leaching................................................................................................................ 796.2.3Pesticide leaching ............................................................................................................... 801
7
PESTICIDE ANALYSIS QUALITY ASSURANCE ................................................................... 857.1MATERIALS AND METHODS...................................................................................................... 857.1.1Internal QA ......................................................................................................................... 857.1.2External QA ........................................................................................................................ 857.2RESULTS AND DISCUSSION....................................................................................................... 867.2.1Internal QA ......................................................................................................................... 867.2.2External QA ........................................................................................................................ 887.3SUMMARY AND CONCLUDING REMARKS.................................................................................. 90
89
SUMMARY OF MONITORING RESULTS ............................................................................... 93REFERENCES.............................................................................................................................. 105
APPENDIX1.CHEMICAL ABSTRACTS NOMENCLATURE FOR THE PESTICIDES ENCOMPASSED BY THEPLAP.APPENDIX2.PESTICIDE MONITORING PROGRAMME- SAMPLING PROCEDURE.APPENDIX3.AGRICULTURAL MANAGEMENT.APPENDIX4.PRECIPITATION DATA FOR THEPLAPSITES.APPENDIX5.PESTICIDE DETECTIONS IN SAMPLES FOR DRAINS,SUCTION CUPS AND GROUNDWATER MONITORING WELLS.APPENDIX6.LABORATORY INTERNAL CONTROL CARDS.APPENDIX7.RIDOMIL APPLICATION ATTYLSTRUP ANDJYNDEVAD.APPENDIX8.PESTICIDES ANALYSED AT5 PLAPSITES IN THE PERIOD UP TO2007.
2
PrefaceIn 1998, the Danish Parliament initiated the Danish Pesticide Leaching AssessmentProgramme (PLAP), an intensive monitoring programme aimed at evaluating theleaching risk of pesticides under field conditions. The Danish Government funded thefirst phase of the programme from 1998 to 2001. The programme has now beenprolonged twice, initially with funding from the Ministry of the Environment and theMinistry of Food, Agriculture and Fisheries for the period 2002 to 2009, and presentlywith funding from the Danish Environmental Protection Agency for the period 2010 to2015.The work was conducted by the Geological Survey of Denmark and Greenland (GEUS),the Department of Agroecology (AGRO) at Aarhus University and the Department ofBioscience (BIOS) also at Aarhus University, under the direction of a managementgroup comprising Jeanne Kjær (GEUS), Annette E. Rosenbom (GEUS), Walter Brüsch(GEUS), Lis Wollesen de Jonge (AGRO), Preben Olsen (AGRO), Ruth Grant (BIOS)and Steen Marcher (Danish Environmental Protection Agency).This report presents the results for the period May 1999–June 2011. Results coveringpart of the period May 1999–June 2010 have been reported previously (Kjæret al.,2002, Kjæret al.,2003, Kjæret al.,2004, Kjæret al.,2005c, Kjæret al.,2007, Kjæretal.,2008, Kjæret al.,2009, Rosenbomet al.,2010b and Kjær et al., 2011). The presentreport should therefore be seen as a continuation of previous reports with the main focuson the leaching risk of pesticides applied during 2010.The report was prepared jointly by Annette E. Rosenbom, Walter Brüsch, René K.Juhler, Jeanne Kjær and Lasse Gudmundsson (all GEUS), Preben Olsen and FinnPlauborg (AGRO), Ruth Grant and Carsten B. Nielsen (BIOS). While all authorscontributed to the whole report, authors were responsible for separate aspects asfollows:•Pesticide and bromide leaching: Preben Olsen, Jeanne Kjær and Walter Brüsch.•Soil water dynamics and water balances: Annette E. Rosenbom, Finn Plauborg andCarsten B. Nielsen.•Pesticide analysis quality assurance: René K. Juhler.
Walter Brüsch and Jeanne KjærMay 2013
3
4
SummaryIn 1998, the Danish Parliament initiated the Pesticide Leaching Assessment Programme(PLAP), an intensive monitoring programme aimed at evaluating the leaching risk ofpesticides under field conditions. The objective of the PLAP is to improve the scientificfoundation for decision-making in the Danish regulation of pesticides. The specific aimis to analyse whether pesticides applied in accordance with current regulations leach togroundwater in unacceptable concentrations. The programme currently evaluates theleaching risk of 43 pesticides and 47 degradation products at five agricultural sitesranging in size from 1.1 to 2.4 ha. The evaluation is based upon monitoring resultsrepresenting detections in 1 meters depth (water collected from drains and suction cups)and detections in groundwater monitoring screens (1.5-4.5 meter below ground surface,hereafter m b.g.s.). This report presents the results for the entire monitoring period May1999–June 2011. Results covering part of the period May 1999–June 2010 have beenreported previously.Highlights from themonitoring period 2010-2011where11pesticides were applied,show that:•Metalaxyl-M was found in low concentrations in the unsaturated zone. However,two degradation products (CGA 62826 and CGA 108906) were leached from theroot zone in average concentrations exceeding 0.1 �g/l. Leaching was mostpronounced in the suctions cups, where both compounds were found 1 m b.g.s. atthe end of the monitoring period, which indicate that leaching of especially CGA108906 had not yet ceased. CGA 108906 was found in 95% of the analysedgroundwater samples and in 27% of the analysed samples the concentrationexceeded 0.1�g/l. The metabolites were present in the groundwater beforeMetalaxyl-M was applied. The background concentration of CGA 108906 makes ittherefore difficult to determine whether the elevated concentrations observed inmonitoring wells are due to the Metalaxyl-M applied in 2010 or partly to previousapplications occurring at the “upstream” neighbouring fields. It should be noted thatmetalaxyl-M and CGA108906 concentrations in upstream screens increased afterapplication of Metalaxyl-M on upstream fields.•Fluazifop-P-buthyl was this year used in a new admissible dose 50% lower than inpast applications. The new reduced dose resulted in negligible leaching of the breakdown product TFMP. Before the imposed regulation, fluazifop-P-buthyl was used ata much higher dose, and TMFP was leaching above 0.1 �g/l to both drains andgroundwater monitoring wells.•Aclonifen, cyafamid, triacloprid and tree metabolites all of which were tested for thefirst time the in PLAP programme, did not leach during the monitoring period. Theleaching pattern of the remaining five pesticides (rimsulfuron bentazone,thriacloprid, tribenuronmethyl, iodosulfuronmethyl) all tested previously in PLAPprogramme was in line with the previous observations.
5
The results of theentire monitoring period 1999-2011covering43pesticides showthat:•Of the 43 pesticides applied, 11 pesticides and/or their degradation product(s)(clopyralid, chlormequat, desmedipham, fenpropimorph, florasulam, iodosulfuron-methyl-sodium, linuron, metsulfuron-methyl, thiamethoxam, tribenuron-methyl andtriasulfuron) did not leach during the entire monitoring period.•The monitoring data indicate pronounced leaching of 15 of the applied pesticidesand/or their degradation products. The following compounds leached through thesoil entering drains and suction cups (placed 1 m b.g.s.) in average concentrationsexceeding 0.1 �g/l:oooooooooooooooazoxystrobinand its degradation productCyPMbentazoneCL153815(degradation product of picolinafen)pirimicarb-desmethyl-formamido(degradation product of pirimicarb)propyzamidetebuconazoleglyphosateand its degradation productAMPACGA 108906 and CGA 62826(degradation products of metalaxyl-M)PPU(degradation products of rimsulfuron)bifenox-acid(degradation product of bifenox)ethofumesateTFMP(degradation product of fluazifop-P-butyl)metamitronand its degradation productdesamino-metamitrondesamino-diketo-metribuzinanddiketo-metribuzin(degradationproducts of metribuzin)terbuthylazineand its degradation products:desethyl-terbuthylazine,2-hydroxy-desethyl-terbuthylazineandhydroxy-terbuthylazine.
•For the pesticides and/or their degradation productsmarked in italics,pronouncedleaching is mainly confined to the depth of 1 meter, where pesticides werefrequently found in samples collected from drains and suction cups, while a limitednumber of detections (fewer than 5 samples per field) exceeding 0.1 �g/l were foundin groundwater monitoring wells. For the pesticides and/or their degradationproductsmarked in bold,pronounced leaching below the depth of 1 m wasobserved. Apart from PPU, these were all frequently detected in concentrationsexceeding 0.1 �g/l in groundwater monitoring wells, exceedance of 0.1 �g/l beingobserved more than six months after application. Although PPU was only detectedin a few samples in concentrations exceeding 0.1 �g/l, elevated concentrations justbelow 0.1 �g/l were found in groundwater monitoring wells during a two-yearperiod, thus confirming the pronounced leaching and high persistency of PPU in soiland groundwater. Repeated applications of rimsulfuron (PPU) may thus pose acontamination risk of the shallow groundwater.•Glyphosate has been frequently applied on one loamy soil, and detections ingroundwater monitoring wells have gradually increased over time. On two occasionsheavy rain events and snowmelt induced leaching to the groundwater monitoringwells in concentrations exceeding 0.1 �g/l more than two years after the application.6
•It was reported last year that Bifenox-acid (degradation product of Bifenox) leachedthrough the root zone on loamy soil and enter both the drainage water system andgroundwater monitoring wells in very high concentrations. In groundwater bifenox-acid was found frequently in concentration exceeding 0.1 �g/l. The degradationproduct nitrofen was found in drain water in concentrations being rather lowhowever. Today Bifenox is not used in Denmark.•The monitoring data also indicate leaching of an additional 17 pesticides, but in lowconcentrations. Although concentrations exceeded 0.1 �g/l in several samplescollected from suction cups and drains (1 m b.g.s.), average leaching concentrationson a yearly basis did not. None of the compounds were found in groundwatermonitoring wells in concentrations exceeding 0.1 �g/l.In order to describe water transport, a bromide tracer was applied to the fields. Bromideand pesticide concentrations are measured monthly in both the unsaturated and thesaturated zones, and weekly in the drainage water. This report covers the period May1999–June 2011 and presents the monitoring results from the five agricultural sitespresently monitored. The main focus is on evaluating the leaching risk of the pesticidesapplied during 2010.
7
8
Dansk sammendragI 1998 vedtog Folketinget at iværksætte projektet ”Varslingssystem for udvaskning afPesticider til grundvandet” (VAP). VAP er et omfattende moniteringsprogram, derundersøger udvaskning af pesticider anvendt i landbrug under reelle markforhold.Programmet har til formål at undersøge, om godkendte pesticider eller deresnedbrydningsprodukter – ved regelret brug og dosering – udvaskes til grundvandet ikoncentrationer over grænseværdien for herigennem at udvide det videnskabeligegrundlag for danske myndigheders (Miljøstyrelsen) procedurer for regulering afgodkendte sprøjtemidler. Udvaskningsrisikoen for 43 pesticider og 47 nedbrydnings-produkter er således op til i dag undersøgt på fem marker, der har en størrelse påmellem 1,1 og 2,4 ha. Undersøgelsen bygger på moniteringsresultater henholdsvisrepræsenterende fund i en meters dybde (indhentet via dræn og sugeceller) og fund igrundvandsmoniteringsfiltre (1.5-4.5 meter under terræn, herefter m u.t.).Denne rapport opsummerer resultaterne for den samlede moniteringsperiode fra maj1999 til juni 2011, mens resultater fra de foregående år, fra maj 1999 til juni 2010, erafrapporteret i de tidligere rapporter.”Highlights” fra den senestemoniteringsperiode 2010-2011,hvor11pesticider blevudbragt, viser følgende:•Metalaxyl-M blev det første år, ca. 9 måneder efter udbringningen på de to sandjorde,fundet i små koncentrationer i den umættede zone, mens to nedbrydningsprodukter(CGA 62826 og CGA 108906) blev udvasket fra rodzonen og fundet i sugeceller i højekoncentrationer, der gennemsnitlig i en meters dybde overskred 0,1 μg/l. Da beggestoffer blev fundet i sugeceller placeret 1 meter under terræn, kan dette betyde, atudvaskningen ikke har toppet endnu. CGA 108906 blev fundet i ca. 95% af deanalyserede grundvandsprøver. I 27% af prøverne var koncentrationerne større end 0,1μg/l. Det er væsentligt at bemærke, at nedbrydningsprodukterne og moderstoffet var tilstede i grundvandet opstrøms markerne før sprøjtningen med metalaxyl-M. Dette gørdet vanskeligt at skelne mellem indflydelsen fra sprøjtningen af VAP-markerne og detbidrag, der er kommet fra sidste og tidligere sprøjtninger på nabomarkerne. Det kanbemærkes, at koncentrationen af metalaxyl-M og CGA 108906 i opstrøms boringer iflere tilfælde stiger efter anvendelsen på VAP markerne, og efter stoffet har væretanvendt opstrøms.Fluazifop-P-buthyl er blevet testet med de anvendelsesbegrænsninger, der nu er indførtfor at beskytte grundvandet. Udvaskningen af nedbrydningsproduktet TMFP i dennemoniteringsperiode var ganske lille, hvilket er i modsætning til den tidligere anvendelse,hvor der blev observeret udvaskning, der overskred 0,1 μg/l ved anvendelse af en højeredosis, der ikke længere er godkendt.
•
•Aclonifen, cyazofamid, thiacloprid og 3 af disses metabolitter blev testet for første gangi Varslingssystemet, og ingen af disse stoffer blev udvasket i moniteringsperioden.Udvaskningen af 5 andre pesticider, der alle tidligere er testet i VAP (rimsulfuron,bentazone, thiacloprid, tribenuron-methyl, iodosulfuron-methyl), var på niveau medtidligere målinger, hvilket bekræfter at grænseværdien overholdes ved den godkendteanvendelse.9
Resultater forhele moniteringsperioden 1999-2011,som omfatter43pesticider viserfølgende:•Af de 43 pesticider, der er blevet udbragt, blev 11 pesticider eller nedbrydnings-produkter heraf (clopyralid, chlormequat, desmedipham, fenpropimorph, florasulam,iodosulfuron-methyl-natrium, linuron, metsulfuron-methyl, thiamethoxam, tribe-nuronmethyl og triasulfuron) ikke fundet udvasket i løbet af den samledemoniteringsperiode.•15 af de udbragte stoffer eller nedbrydningsprodukter heraf, gav anledning til enstørre udvaskning fra rodzonen. Følgende stoffer blev udvasket til dræn ogsugeceller, beliggende i ca. 1 meters dybde i gennemsnitskoncentrationer på års-niveau over 0,1 �g/l:ooooooooooooooazoxystrobinog dets nedbrydningsproduktCyPMbentazonCL153815(nedbrydningsprodukt af picolinafen)pirimicarb-desmethyl-formamido(nedbrydningsprodukt af pirimicarb)propyzamidtebuconazolglyphosatog dets nedbrydningsproduktAMPACGA 108906 og CGA 62826(nedbrydningsprodukt af metalaxyl-M)PPU(nedbrydningsprodukt af rimsulfuron)bifenox-syre(nedbrydningsprodukt af bifenox)ethofumesatTFMP(nedbrydningsprodukt af fluazifop-P-butyl),metamitronog dets nedbrydningsprodukt desamino-metamitrondesamino-diketo-metribuzinogdiketo-metribuzin(nedbrydningsprodukter af metribuzin)oterbuthylazinog dets nedbrydningsprodukterdesethyl-terbuthylazin,2-hydroxy-desethyl-terbuthylazin og 2-hydroxy-terbuthylazin.
For de pesticider eller nedbrydningsprodukter der erfremhævet med kursivvarudvaskningen primært begrænset til 1 m u.t., hvor de blev fundet hyppigt i dræn ogsugeceller. Selvom hovedparten af stofferne blev fundet i koncentrationer over 0,1�g/l i grundvandsfiltrene, var antallet af overskridelser få (mindre end 5 pr. mark).Pesticidermarkeret med fedblev dog udvasket til grundvandsfiltrene i en størregrad. På nær PPU blev samtlige stoffer relativt hyppigt fundet i koncentrationer over0,1 �g/l i grundvandsfiltrene, hvor koncentrationer over 0,1 �g/l blev fundet mereend seks måneder efter udbringning.Om end der kun var enkelte prøver som indeholdt mere end 0,1 μg/l PPU, blev derigennem en toårig periode fundet PPU i grundvandet i koncentrationer tæt på de 0,1 μg/lpå en af de to testede marker, hvilket bekræfter den høje persistens af PPU i jord oggrundvand. Gentagne udbringninger af rimsulfuron (PPU) kan potentielt forurene detallerøverste grundvand. Rimsulfuron er ikke længere tilladt at anvende i Danmark.
Glyphosat er blevet udbragt flere gange på en af de lerede forsøgslokaliteter. Pådenne mark er der igennem de seneste år konstateret et stigende antal fund afglyphosat i grundvandsfiltrene. To gange har markante nedbørshændelser samt10
snesmeltning forårsaget enkeltstående udvaskning af glyphosat til grundvandfiltrenei koncentrationer over 0,1 �g/l mere end to år efter udbringning.Sidste års rapport nævnte at bifenox-syre (nedbrydningsprodukt af bifenox) pålerjorde blev udvasket fra rodzonen til både dræn og grundvandsfiltre, hvor stoffetblev fundet hyppigt i koncentrationer større end 0,1 �g/l. I den sidste periode ernedbrydningsproduktet, nitrofen fundet i drænvand, men kun i relativt småkoncentrationer under 0,1�g/l. Bifenox må ikke længere anvendes i Danmark.•Andre 17 stoffer gav anledning til udvaskning. Selv om flere af disse stoffer i 1meters dybde ofte blev fundet i koncentrationer over 0,1 �g/l, var der ikke tale om,at udvaskningen som årsmiddel oversteg 0,1 �g/l i dræn i en meters dybde. Stofferneblev sjældent fundet i grundvandsfiltre og ikke i koncentration over 0,1 �g/l.Bromid er anvendt som sporstof for at beskrive vandtransporten. Bromid- ogpesticidkoncentrationer bliver analyseret månedligt i prøver udtaget i den umættede ogmættede zone, og ugentligt i prøver af drænvand. I denne rapport præsenteresmoniteringsresultaterne for de fem områder for perioden fra maj 1999 til juni 2011primært med fokus på pesticider udbragt i 2010.
11
12
1 IntroductionThere is growing public concern in Denmark about pesticide contamination of oursurface waters and groundwater. Pesticides and their degradation products haveincreasingly been detected in groundwater during the past decade and are now presentin much of the Danish groundwater. Under the Danish National GroundwaterMonitoring Programme (GRUMO) pesticides have so far been detected in 50% of allscreens monitored and in 60% of the screens placed in the upper groundwater (Thorling,L. (red), 2011).The detection of pesticides in groundwater over the past 10 years has given rise to thedesire to enhance the scientific foundation for the existing approval procedure forpesticides and to improve the present risk assessment tools. A main issue in this respectis that the EU assessment and hence also the Danish assessment of the risk of pesticideleaching to groundwater is largely based on data from modelling, laboratory orlysimeter studies. However, these types of data may not adequately describe theleaching that may occur under actual field conditions. Although models are widely usedwithin the registration process, their validation requires further work, not least becauseof the limited availability of field data (Boesten, 2000). Moreover, laboratory andlysimeter studies do not include the spatial variability of the soil parameters (hydraulic,chemical, physical and microbiological soil properties) affecting pesticide leaching.This is of particular importance for silty and loamy soils, where preferential transportmay have a major impact on pesticide leaching. In fact, various field studies suggest thatconsiderable preferential transport of several pesticides occurs to a depth of 1 m underconditions comparable to those pertaining in Denmark (Kördel, 1997).The inclusion of field studies, i.e. test plots exceeding 1 ha, in risk assessment ofpesticide leaching to groundwater is considered an important improvement to the riskassessment procedures. For example, the US Environmental Protection Agency (US-EPA) has included field-scale studies in its risk assessments since 1987. Pesticides thatmay potentially leach to the groundwater are required to be included in field studies aspart of the registration procedure. The US-EPA has therefore conducted field studies onmore than 50 pesticides (US Environmental Protection Agency, 1998). A similarconcept has also been adopted within the European Union (EU), where Directive91/414/EEC, Annexe VI (Council Directive 97/57/EC of 22 September 1997) enablesfield leaching study results to be included in the risk assessments.
1.1 ObjectiveIn 1998, the Danish Government initiated the Pesticide Leaching AssessmentProgramme (PLAP), an intensive monitoring programme with the purpose of evaluatingthe leaching risk of pesticides under field conditions. The PLAP is intended to serve asan early warning system providing decision-makers with advance warning if approvedpesticides leach in unacceptable concentrations. The programme focuses on pesticidesused in arable farming and PLAP monitors leaching at five agricultural test sitesrepresentative of Danish conditions.13
The objective of the PLAP is to improve the scientific foundation for decision-makingin the Danish registration and approval procedures for pesticides, enabling field studiesto be included in risk assessment of selected pesticides. The specific aim is to analysewhether pesticides applied in accordance with current regulations leach at levelsexceeding the maximum allowable concentration of 0.1 �g/l.
1.2 Structure of the PLAPThe pesticides included in the PLAP were selected by the Danish EnvironmentalProtection Agency on the basis of expert judgement. At present, 42 pesticides and 41degradation products are included in the PLAP. All the compounds analysed are listedin Appendix 1.
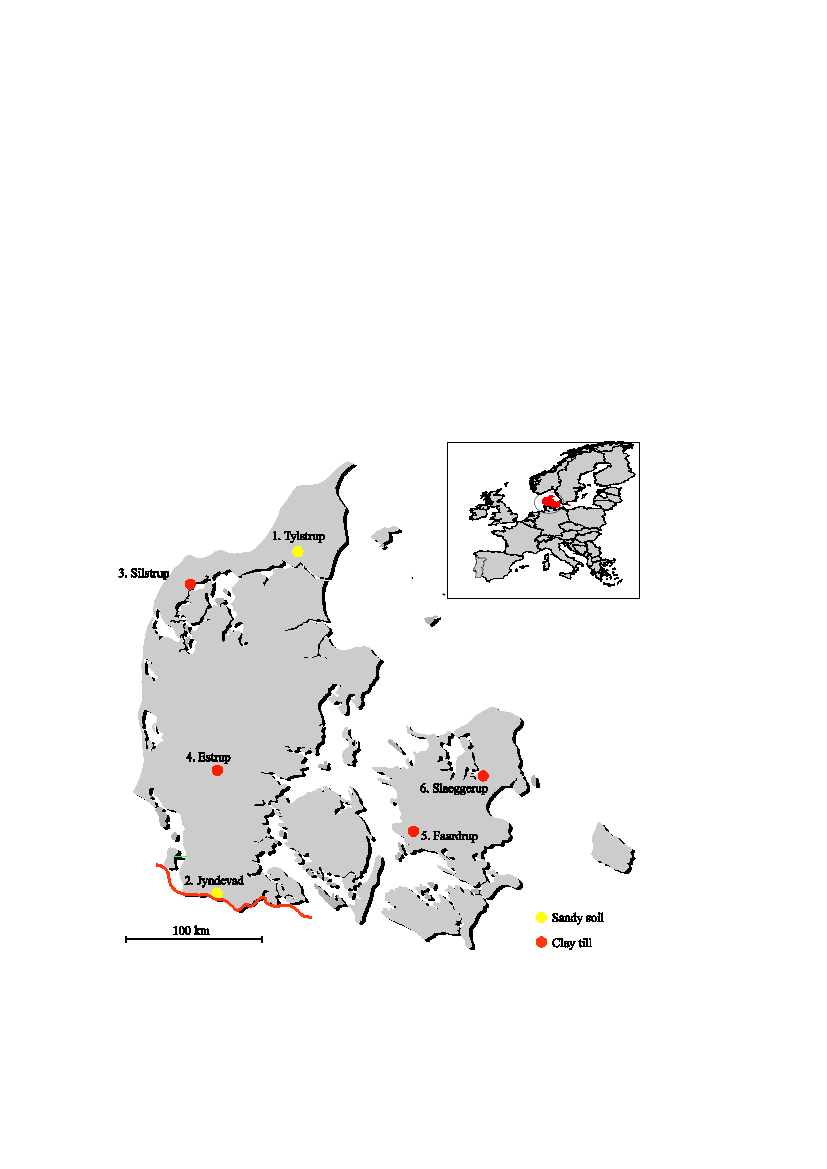
Figure 1.Location of the PLAP sitesTylstrup, Jyndevad, Silstrup, EstrupandFaardrup.Monitoring atSlaeggerup was terminated on 1 July 2003.
14
Soil type and climatic conditions are considered to be some of the most importantparameters controlling pesticide leaching. The PLAP initially encompassed six test sitesrepresentative of the dominant soil types and the climatic conditions in Denmark(Figure 1). Monitoring at the Slaeggerup site was terminated on 1 July 2003, and resultsfrom that site are not included in the present report. For the monitoring results from thissite see Kjæret al.(2003). The groundwater table at all the sites is shallow, therebyenabling pesticide leaching to groundwater to be rapidly detected (Table 1). Cultivationof the PLAP sites is in line with conventional agricultural practice in the vicinity. Thepesticides are applied at maximum permitted doses and in the manner specified in theregulations. Hence any pesticides or degradation products appearing in the groundwaterdownstream of the sites can be related to the current approval conditions pertaining tothe individual pesticides. The PLAP was initiated in autumn 1998. The five test sitesencompassed by the present report were selected and established during 1999.Monitoring was initiated at Tylstrup, Jyndevad and Faardrup in 1999 and at Silstrup andEstrup in 2000 (Table 1).Table 1.Characteristics of the five PLAP sites (modified from Lindhardtet al.,2001).TylstrupJyndevadSilstrupLocationPrecipitation1)(mm/y)Pot. evapotransp.1)(mm/y)W x L (m)Area (ha)Tile drainDepths to tile drain (m b.g.s.)Monitoring initiatedGeological characteristics– Deposited by– Sediment type– DGU symbol– Depth to the calcareous matrix(m b.g.s.)– Depth to the reduced matrix (m b.g.s.)– Max. fracture depth3)(m)– Fracture intensity 3–4 m depth(fractures/m)– Ks in C horizon (m/s)Topsoil characteristics– DK classification– Classification– Clay content (%)– Silt content (%)– Sand content (%)– pH– TOC (%)1)
EstrupAskov862543105 x 1201.3YesApr 2000Glacier/meltwaterClayey tillML1–42)>52)>6.5118.0¶10-8JB5/6Sandy loam10–2020–2750–656.5–7.81.7–7.31.1
FaardrupSlagelse558585150 x 1602.3YesSep 1999GlacierClayey tillML1.54.2847.2¶10-6JB5/6Sandy loam14–1525576.4–6.61.41.2
Brønderslev66855270 x 1661.1NoMay 1999SaltwaterYS6>12––2.0¶10-5JB2Loamy sand613784–4.52.0
Tinglev858555135 x 1842.4NoSep 1999MeltwaterTS5–910–12––1.3¶10-4JB1Sand54885.6–6.21.8
Thisted86656491 x 1851.7YesApr 2000GlacierClayey tillML1.354<13.4¶10-6JB7Sandy clay loam/sandy loam18–262786.7–72.21.1
Fine sand Coarse sand
Yearly normal based on a time series for the period 1961–90. The data refer to precipitation measured 1.5 m aboveground.2)Large variation within the field.3)Maximum fracture depth refers to the maximum fracture depth found in excavations and wells.
15
Site characterization and monitoring design are described in detail in Lindhardtet al.(2001). The present report presents the results of the monitoring period May 1999–June2011. The main focus of this report is on the leaching risk of pesticides applied during2010. For a detailed description of the earlier part of the monitoring period (May 1999–June 2009), see previous publications on http://pesticidvarsling.dk/publ_result-/index.html.Under the PLAP the leaching risk of pesticides is evaluated on the basis of at least twoyears of monitoring data. For some pesticides the present report must be consideredpreliminary because they have been monitored for an insufficient length of time.Hydrological modelling of the unsaturated zone at each PLAP site supports themonitoring data. The MACRO model (version 5.1), see Larsboet al.(2005), was usedto describe the soil water dynamics at each site during the entire monitoring period fromMay 1999–June 2011. The five site models have been calibrated for the monitoringperiod May 1999–June 2004 and validated for the monitoring period July 2004–June2011.Scientifically valid methods of analysis are essential to ensure the integrity of the PLAP.The field monitoring work has therefore been supported by intensive quality assuranceentailing continuous evaluation of the analyses employed. The quality assurancemethodology and results are presented in Section 7.
16
2 Pesticide leaching at Tylstrup2.1Materials and methods
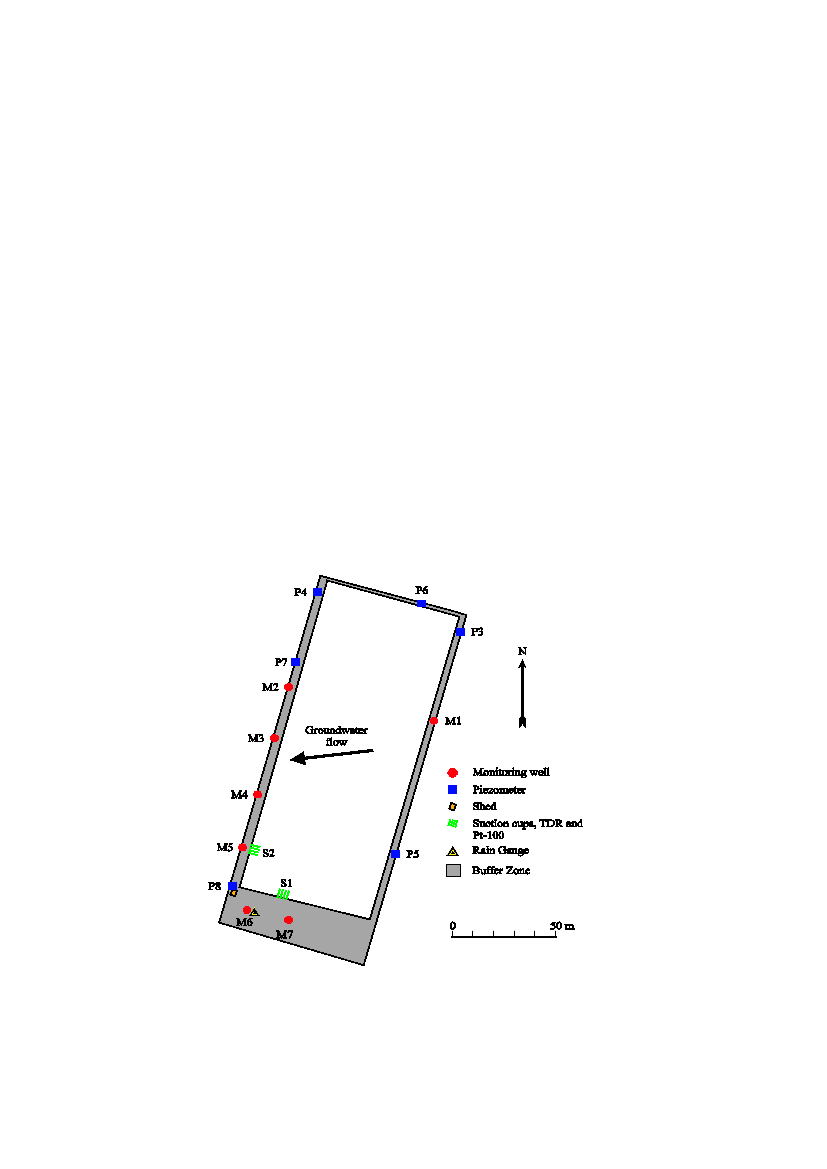
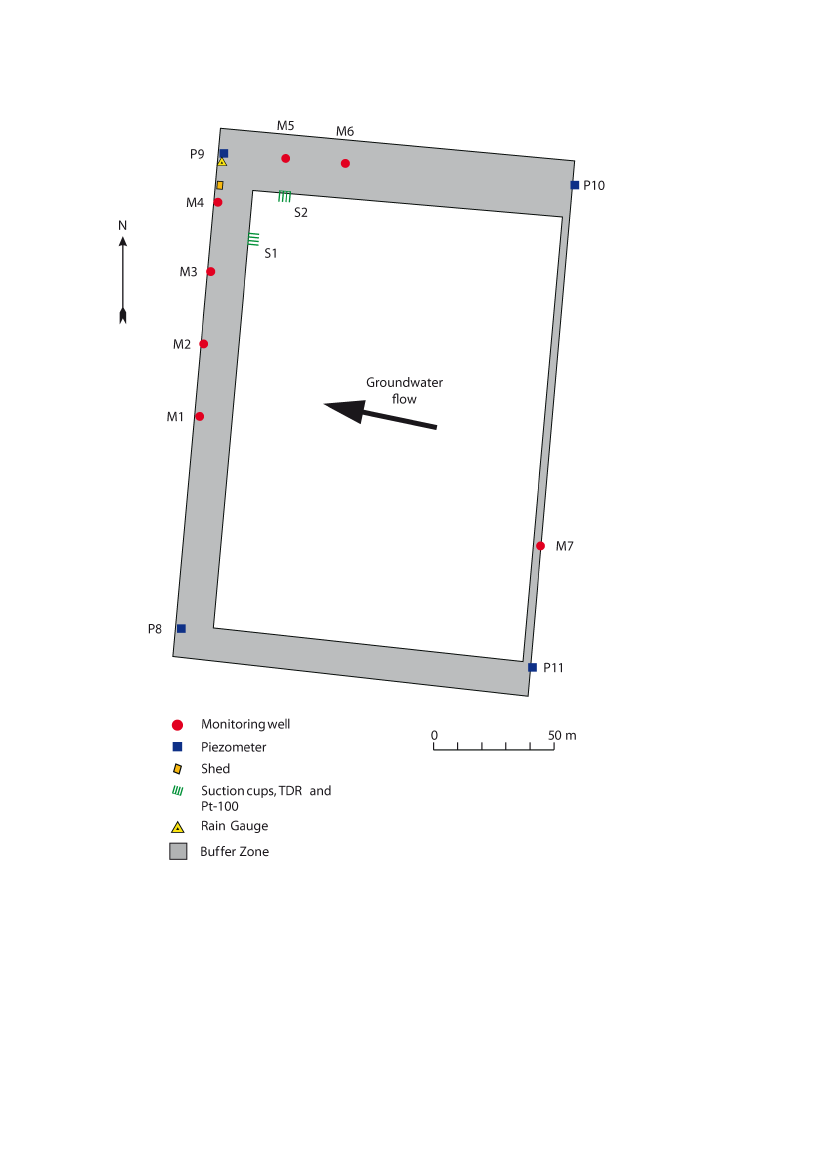
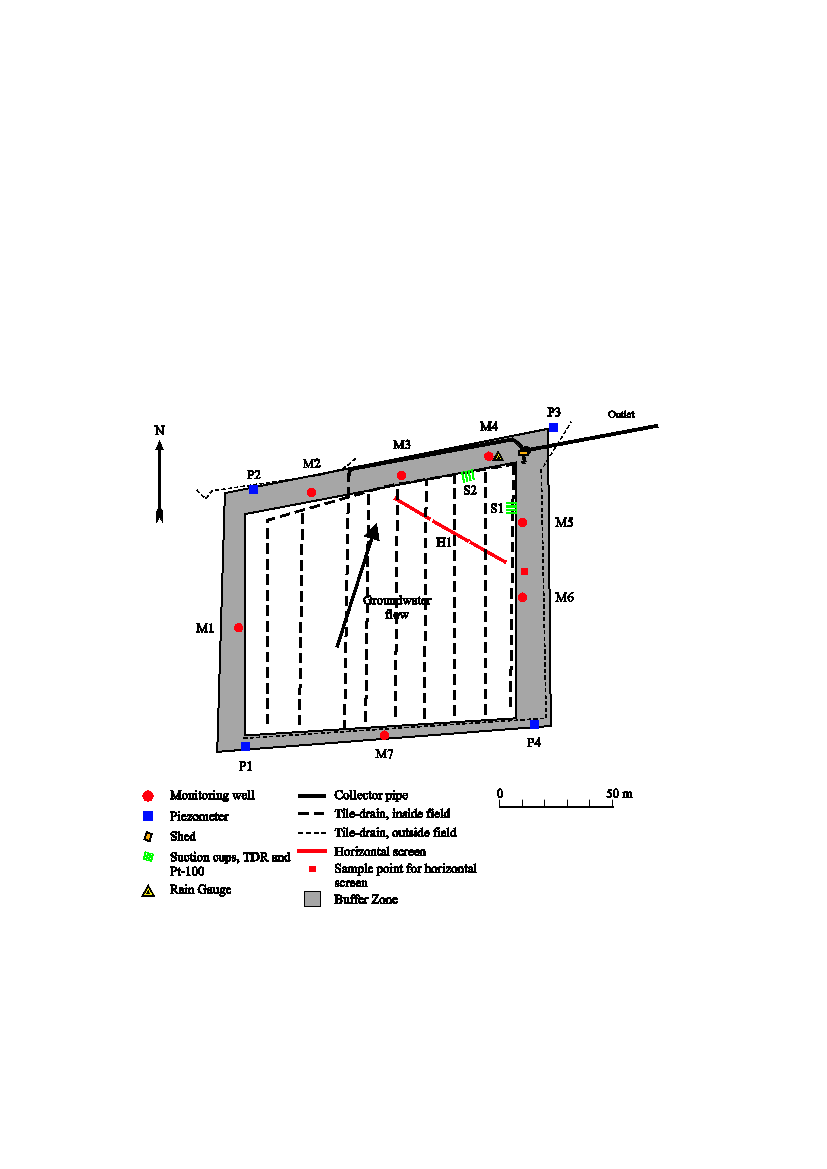
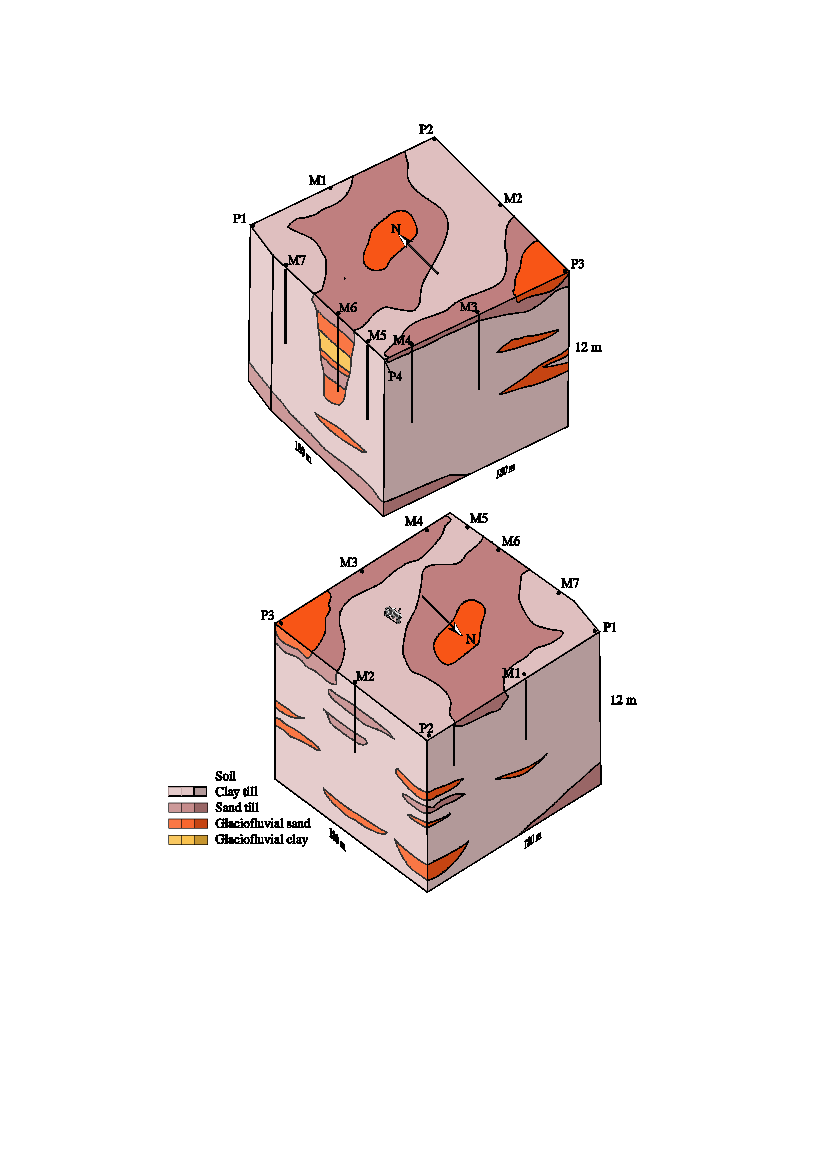
2.1.1 Site description and monitoring designTylstrup is located in northern Jutland (Figure 1). The test field covers a cultivated areaof 1.1 ha (70 x 166 m) and is practically flat, with windbreaks bordering the eastern andwestern sides. Based on two soil profiles dug in the buffer zone around the test field thesoil was classified as a Humic Psammentic Dystrudept (Soil Survey Staff, 1999). Thetopsoil is characterised as loamy sand with 6% clay and 2.0% total organic carbon(Table 1). The aquifer material consists of an approx. 20 m deep layer of marine sandsediment deposited in the Yoldia Sea. The southern part is rather homogeneous,consisting entirely of fine-grained sand, whereas the northern part is moreheterogeneous due to the intrusion of several silt and clay lenses (Lindhardtet al.,2001). The overall direction of groundwater flow is towards the west (Figure 2). Duringthe monitoring period the groundwater table was 2.6–4.5 m b.g.s. (Figure 3). A briefdescription of the sampling procedure is provided in Appendix 2. The monitoringdesign and test site are described in detail in Lindhardtet al.(2001), and the analysismethods in Kjæret al.(2002).
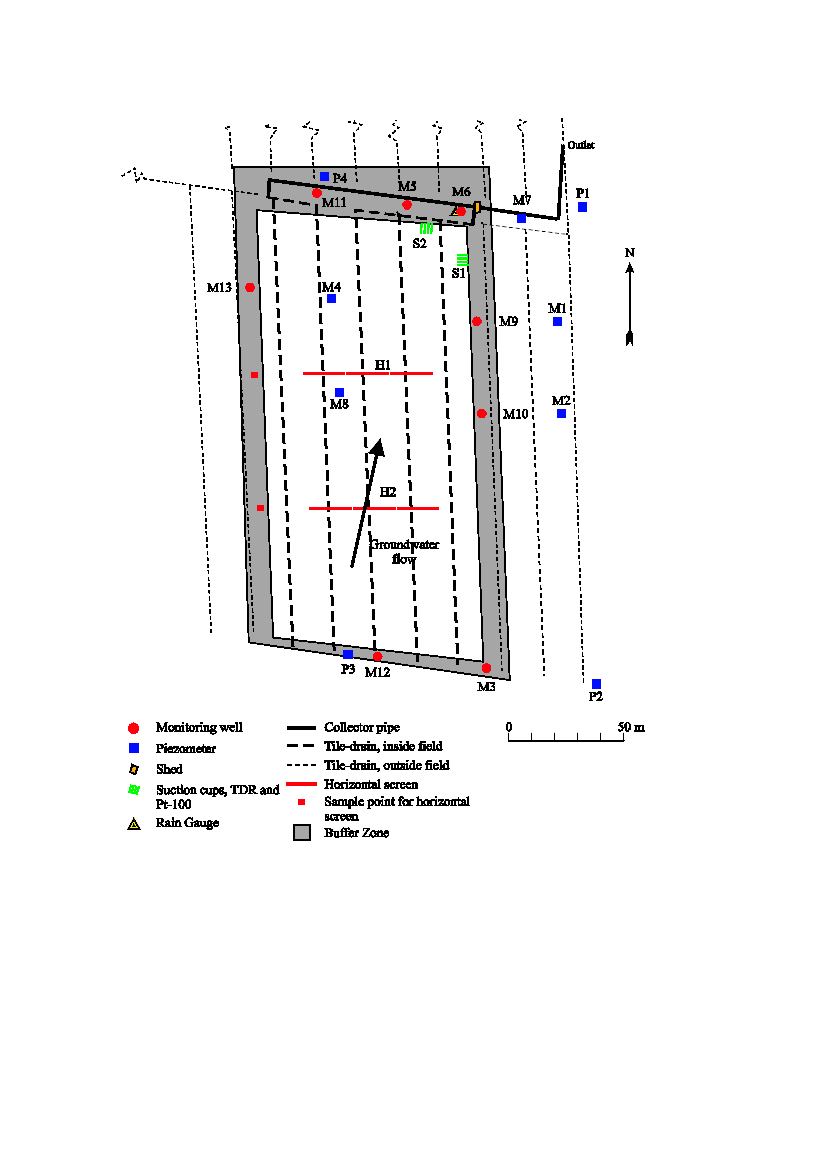
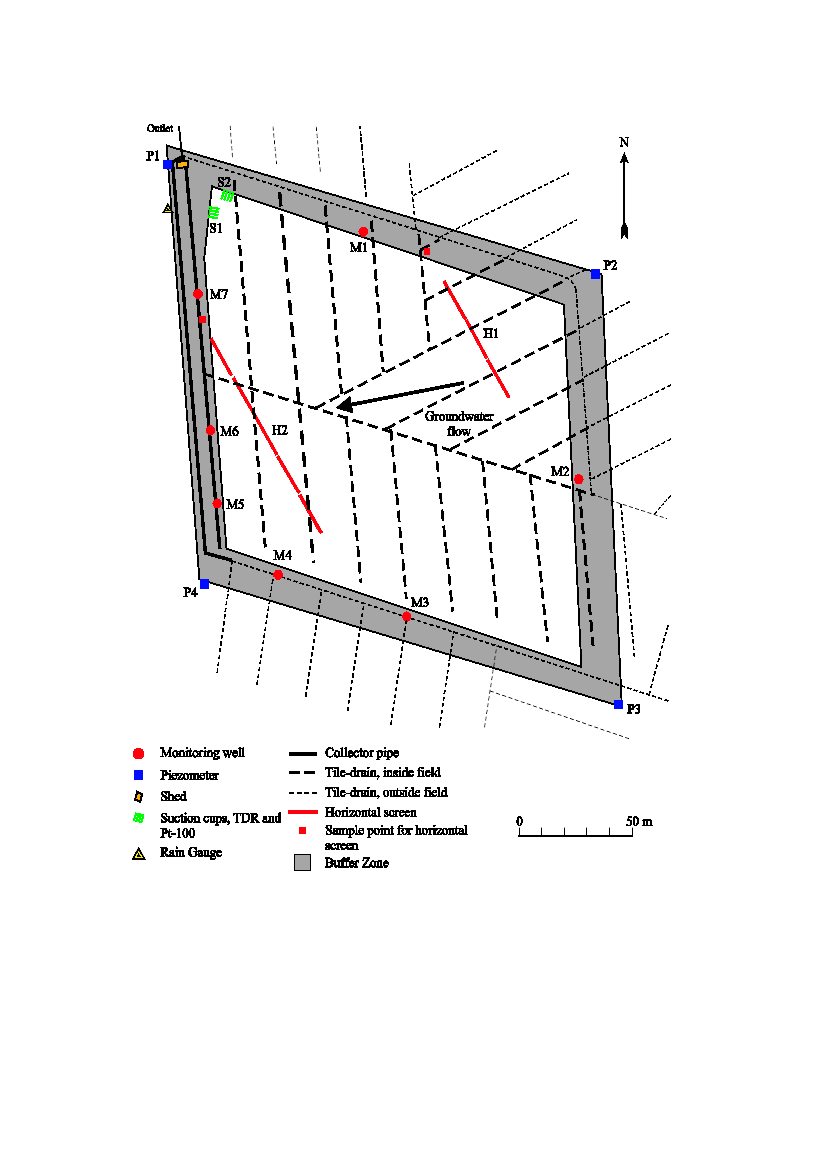
Figure 2.Overview of theTylstrupsite. The innermost white area indicates the cultivated land, while the grey areaindicates the surrounding buffer zone. The positions of the various installations are indicated, as is the direction ofgroundwater flow (by an arrow). Pesticide monitoring is conducted monthly and half-yearly from suction cups andselected monitoring wells as described in Table A2.1 in Appendix 2.
17
2.1.2 Agricultural managementManagement practice during the 2010-11 growing seasons is briefly summarized belowand detailed in Appendix 3 (Table A3.1). For information about management practiceduring the previous monitoring periods, see previous monitoring reports available onhttp://pesticidvarsling.dk/publ_result/index.html.On 4 April 2010 the field was ploughed and on 6 May planted with potatoes (cv.Kuras). On 26 May, before emergence, the field was sprayed with the herbicidesaclonifen and rimsulfuron. Rimsulfuron was applied again on 8 June, when the fifth leafof the main stem had unfolded. Cyazofamid was used against fungi six times between15 June and 2 August. On 9 July a fungicide containing mancozeb and metalaxyl wasused, of which only metalaxyl was monitored. Between 9 August and 23 August thefungicide mancozeb was again applied, but not monitored. The crop was irrigated twice,with 29 mm on 6 July and 28 mm on 27 July. The yield of potatoes, harvested on 20October, was 470.3 hkg/ha with 27.2% DM (128.0 hkg/ha at 100% DM), yields beingbelow the average for the year and soil type (Plantedirektoratet 2010).The field wasploughed on 17 April 2011. Spring barley (cv. TamTam), sown on the 19 April,emerged on 24 April.2.1.3 Model setup and calibrationThe numerical model MACRO (version 5.1) was applied to the Tylstrup site coveringthe soil profile to a depth of 5 m b.g.s., always including the groundwater table. Themodel was used to simulate water and bromide transport in the unsaturated zone duringthe full monitoring period May 1999–June 2011 and to establish an annual waterbalance.Compared to Kjæret al.(2011), a year of validation was added to the MACRO-setupfor the Tylstrup site. The setup was hereby calibrated for the monitoring period May1999-June 2004 and “validated” for the monitoring period July 2004-June 2011. Dailytime series of groundwater table measured in the piezometers located in the buffer zone,soil water content measured at three different depths (25, 60 and 110 cm b.g.s.) from thetwo profiles S1 and S2 (Figure 2) and the bromide concentration measured in thesuction cups located 1 and 2 m b.g.s. were used in the calibration and validationprocess. Data acquisition, model setup and results related to simulated bromidetransport are described in Barleboet al.(2007).
18
Table 2.Annual water balance forTylstrup(mm y-1). Precipitation is corrected to soil surface according to themethod of Allerup and Madsen (1979).NormalActualGroundwaterprecipitation2)PrecipitationIrrigationevapotranspirationrecharge3)1.5.99–30.6.991)12026901121561.7.99–30.6.007731073334986081.7.00–30.6.01773914754875021.7.01–30.6.02773906805704161.7.02–30.6.03773918235024391.7.03–30.6.0477375804722871.7.04–30.6.05773854574774341.7.05–30.6.06773725674883041.7.06–30.6.077731147595916151.7.07–30.6.087739131265724671.7.08–30.6.097731269266006951.7.09–30.6.10773867274244701.7.10–30.6.11773950574635441)2)
Accumulated for a two-month period.Normal values based on time series for 1961–1990.3)Groundwater recharge is calculated as precipitation + irrigation - actual evapotranspiration.
2.2
Results and discussion
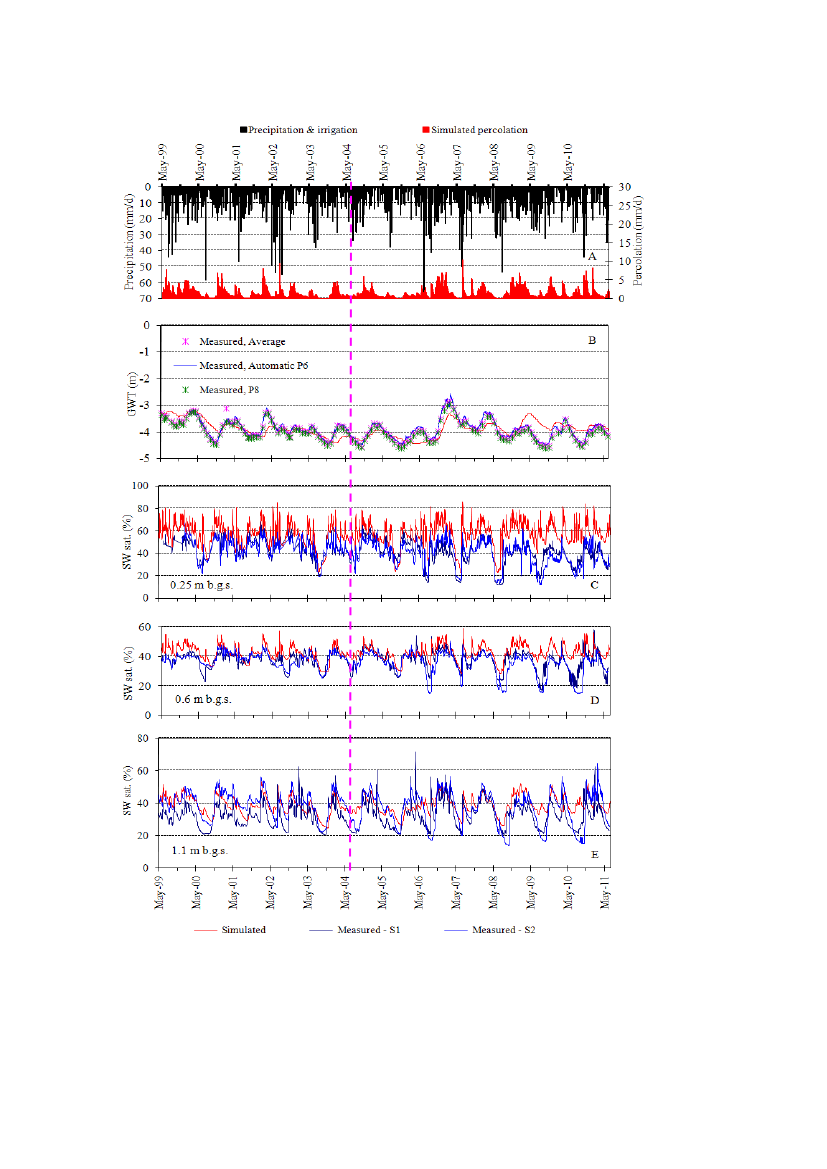
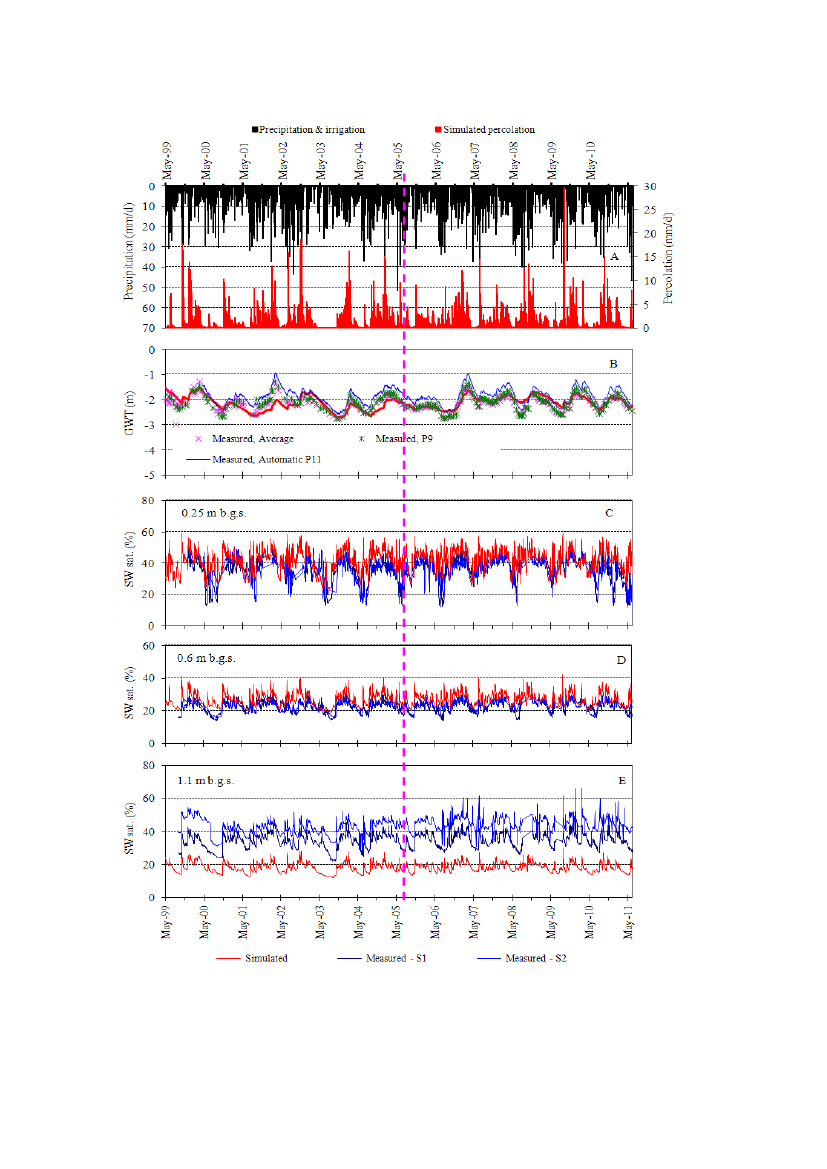
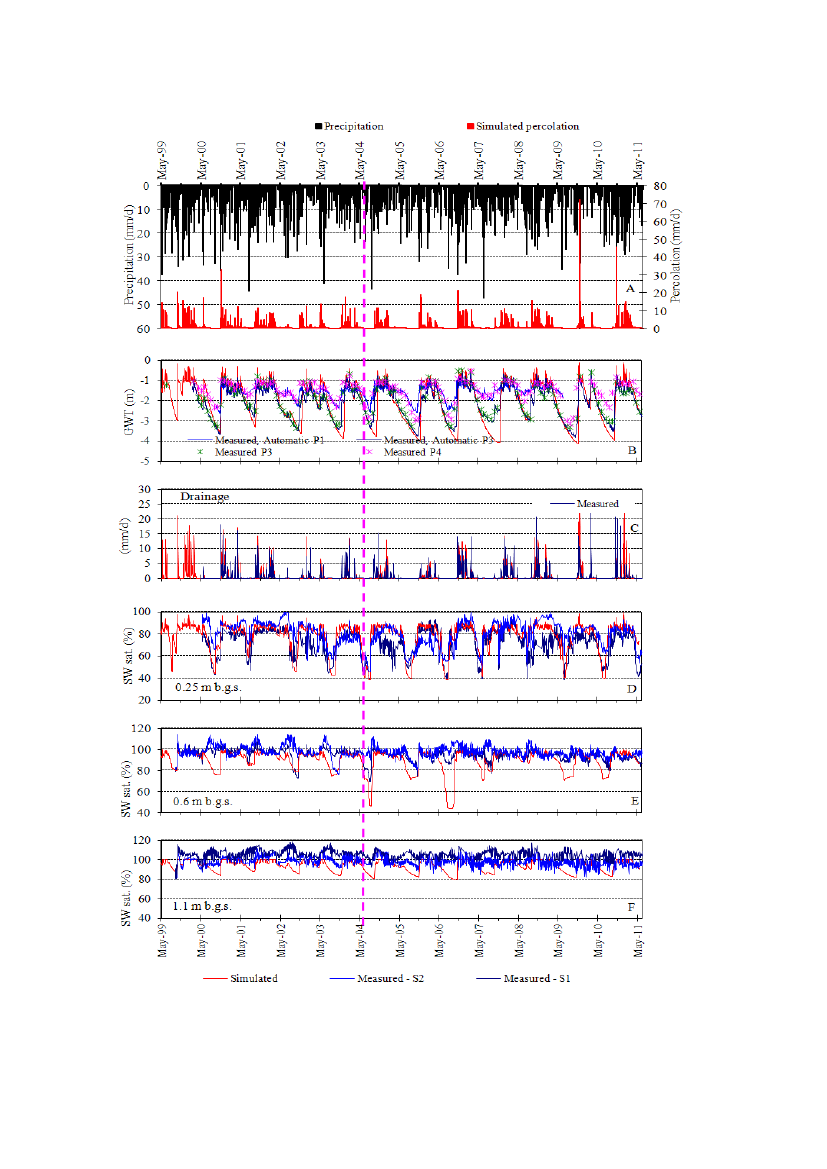
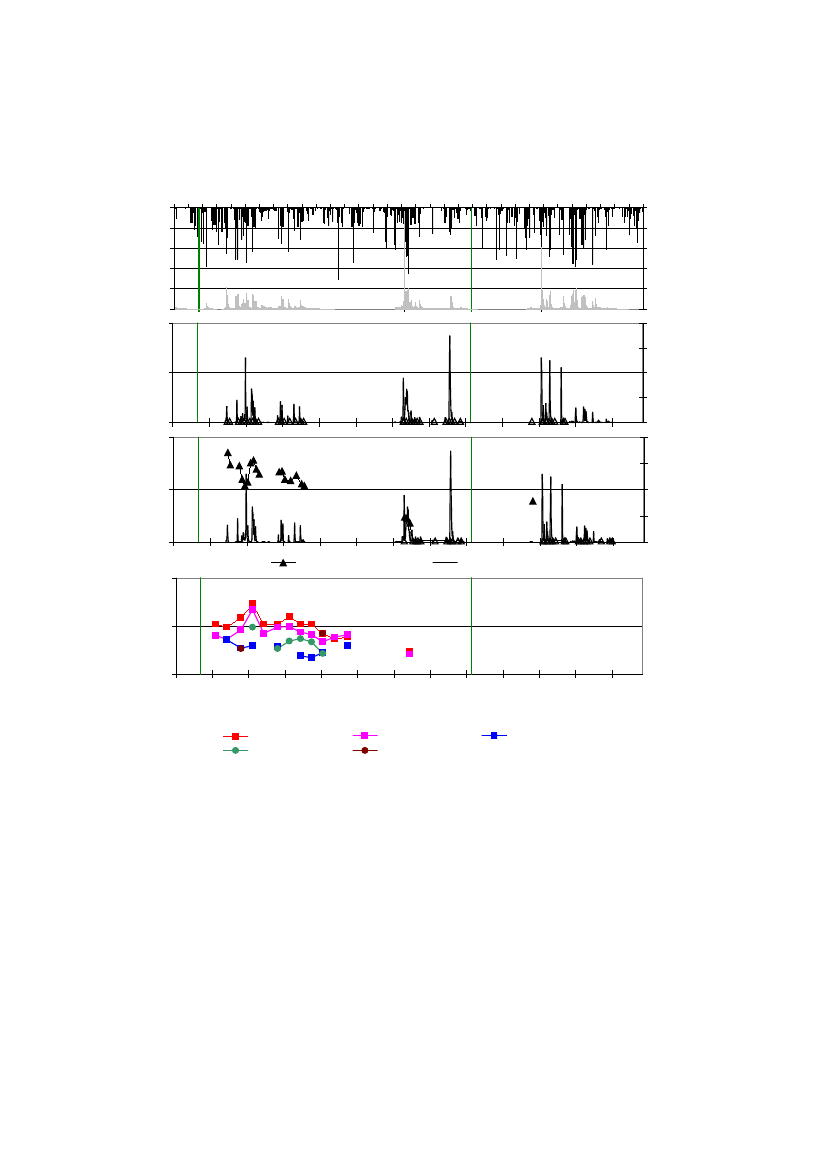
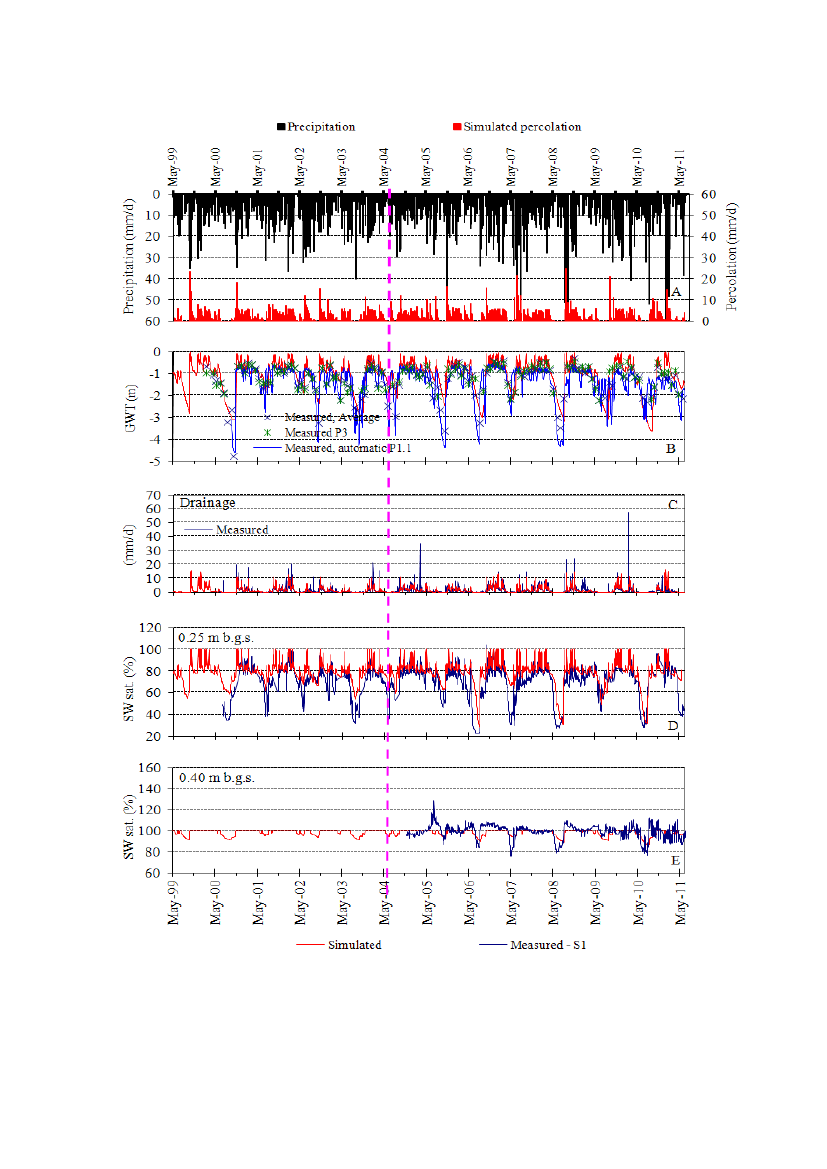
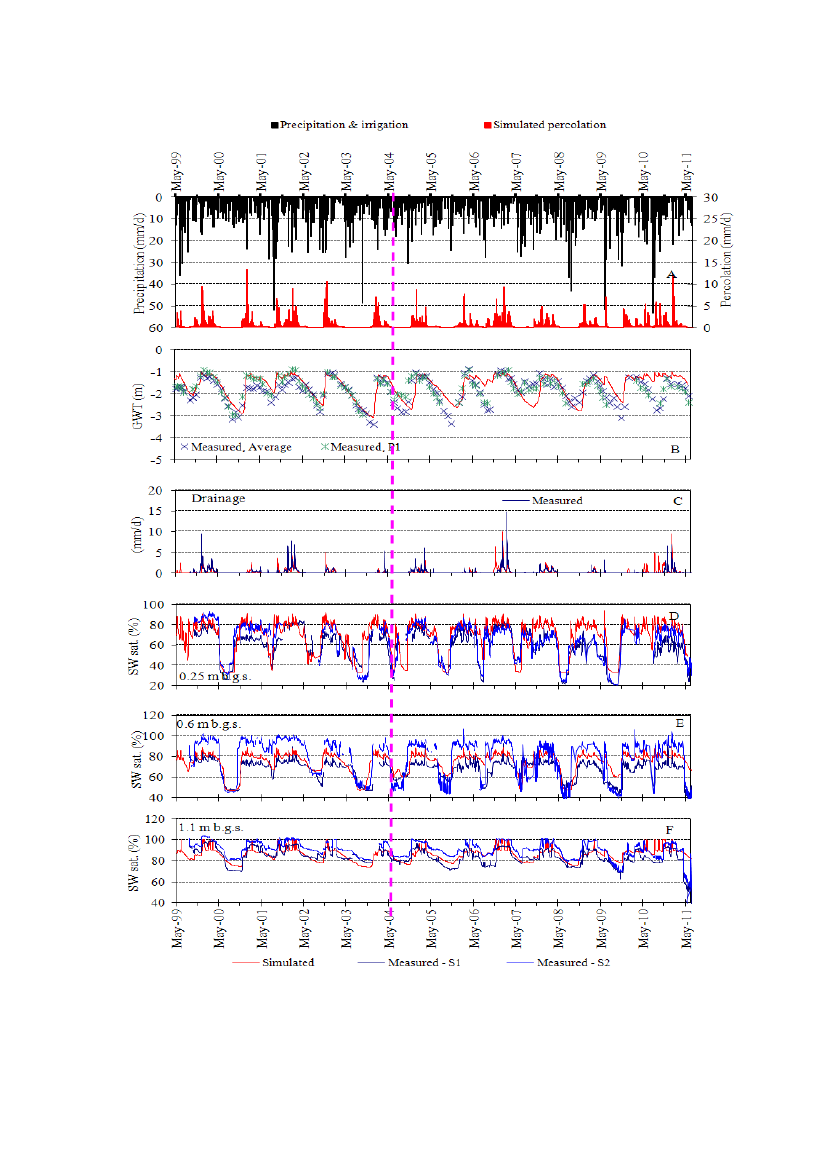
2.2.1 Soil water dynamics and water balancesThe model simulations were generally consistent with the observed data, thus indicatinga good model description of the overall soil water dynamics in the unsaturated zone(Figure 3). The overall trends in soil water saturation were modelled successfully, withthe model capturing soil water dynamics at all depths (Figure 3C-E). During the lastfour hydraulic years the level in water saturation at 25 cm b.g.s. was, however,overestimated. Moreover the initial decrease in water saturation observed during thefour summer periods at 25, 60 and 110 cm b.g.s. was less well captured.The dynamics of groundwater table were captured with some exceptions, but as withprevious simulations the amplitude of the fluctuations was less well described (Figure3B).The resulting annual water balance is shown for each hydraulic year of the monitoringperiod (July–June) in Table 2. Values for precipitation and actual evapotranspiration forthe most recent hydraulic year, July 2010–June 2011, were among the highest observedsince monitoring began at the site, and the monthly precipitation pattern for this yearwas medium to high compared with earlier years, except for the dryest April monitored(Appendix 4). Artificial irrigation was medium compared to the other monitoring years,which could be the result of the very dry April. The groundwater recharge/percolationwas medium to high compared to the other hydraulic years, and continuous (Figure 3B).
19
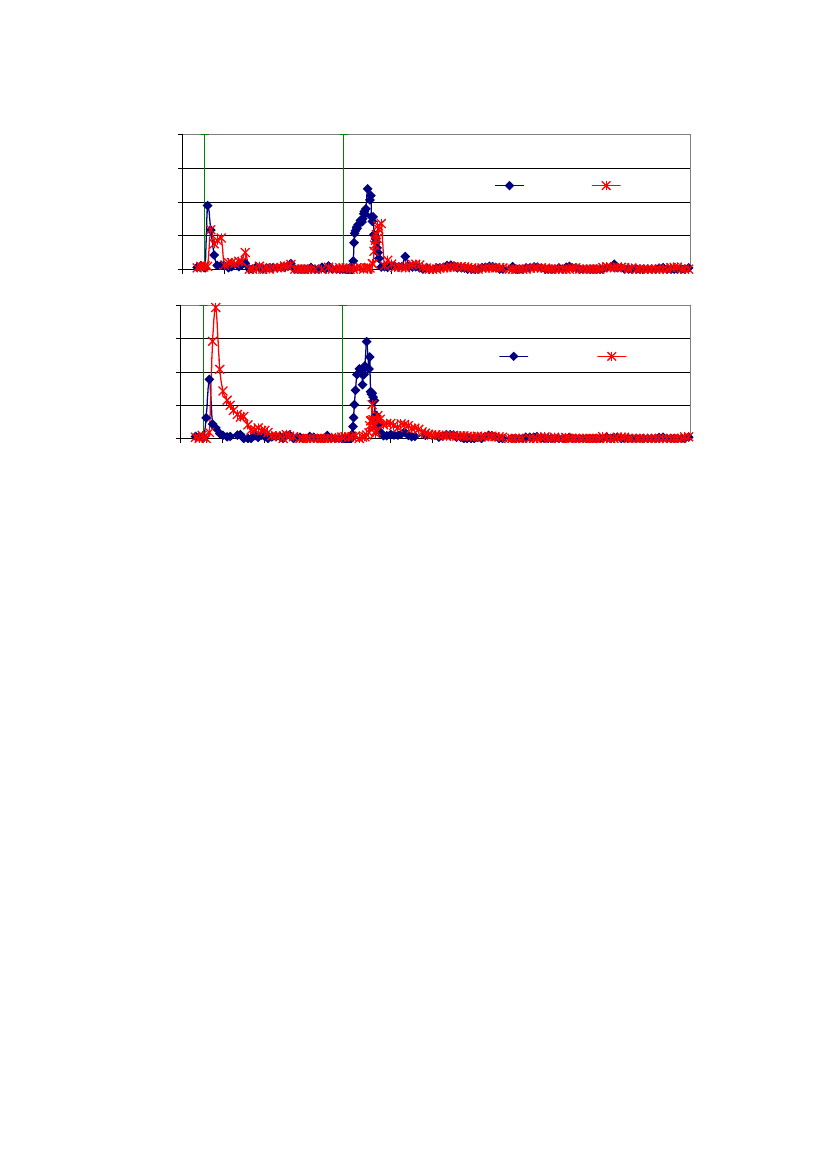
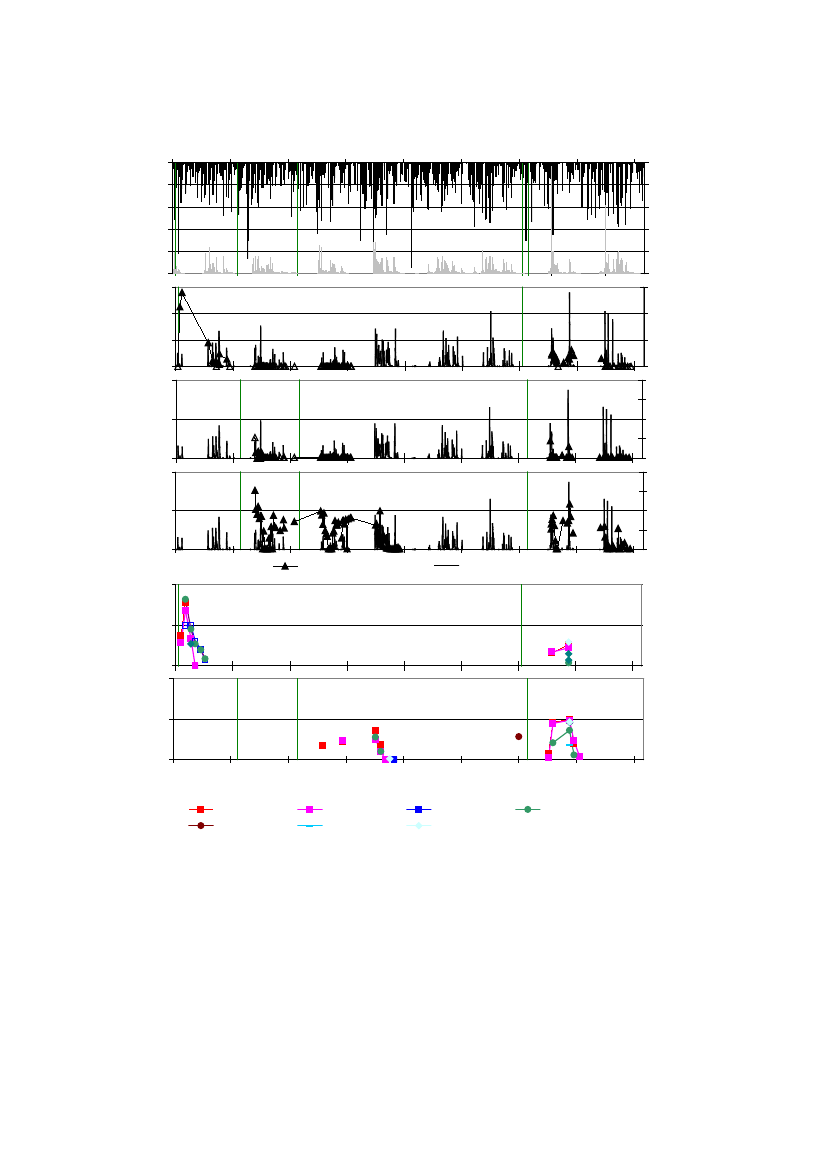
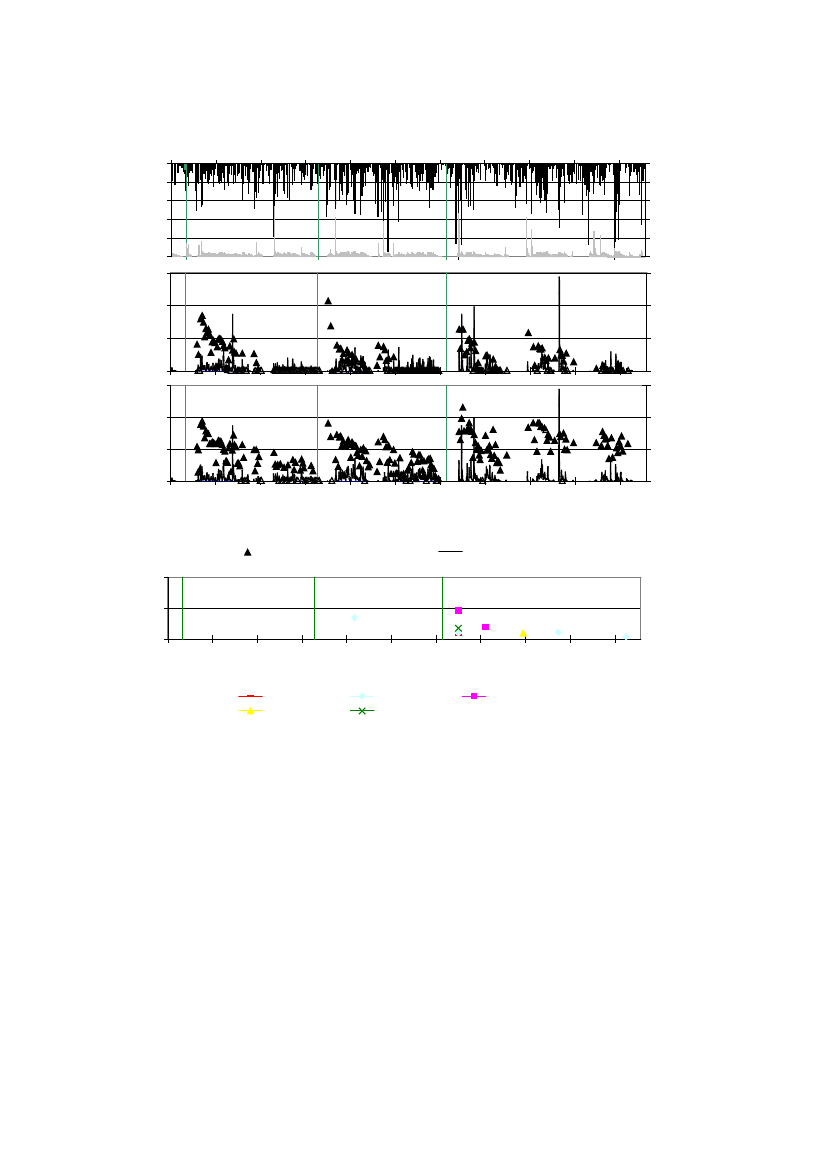
Figure 3.Soil water dynamics atTylstrup:Measured precipitation, irrigation and simulated percolation 1 m b.g.s.(A), simulated and measured groundwater level GWT (B), and simulated and measured soil water saturation (SWsat.) at three different soil depths (C, D and E). The measured data in B derive from piezometers located in the bufferzone. The measured data in C, D and E derive from TDR probes installed at S1 and S2 (Figure 2). The brokenvertical line indicates the beginning of the validation period (July 2004-June 2011).
20
12
Bromide (mg/l)
9630
A1 m b.g.s.
Suction cups - S12 m b.g.s.
May-99
May-00
May-01
May-02
May-03
May-04
May-05
May-06
May-07
May-08
May-09
May-10
12
Bromide (mg/l)
9630
B
Suction cups - S22 m b.g.s.
1 m b.g.s.
May-99
May-00
May-01
May-02
May-03
May-04
May-05
May-06
May-07
May-08
May-09
May-10
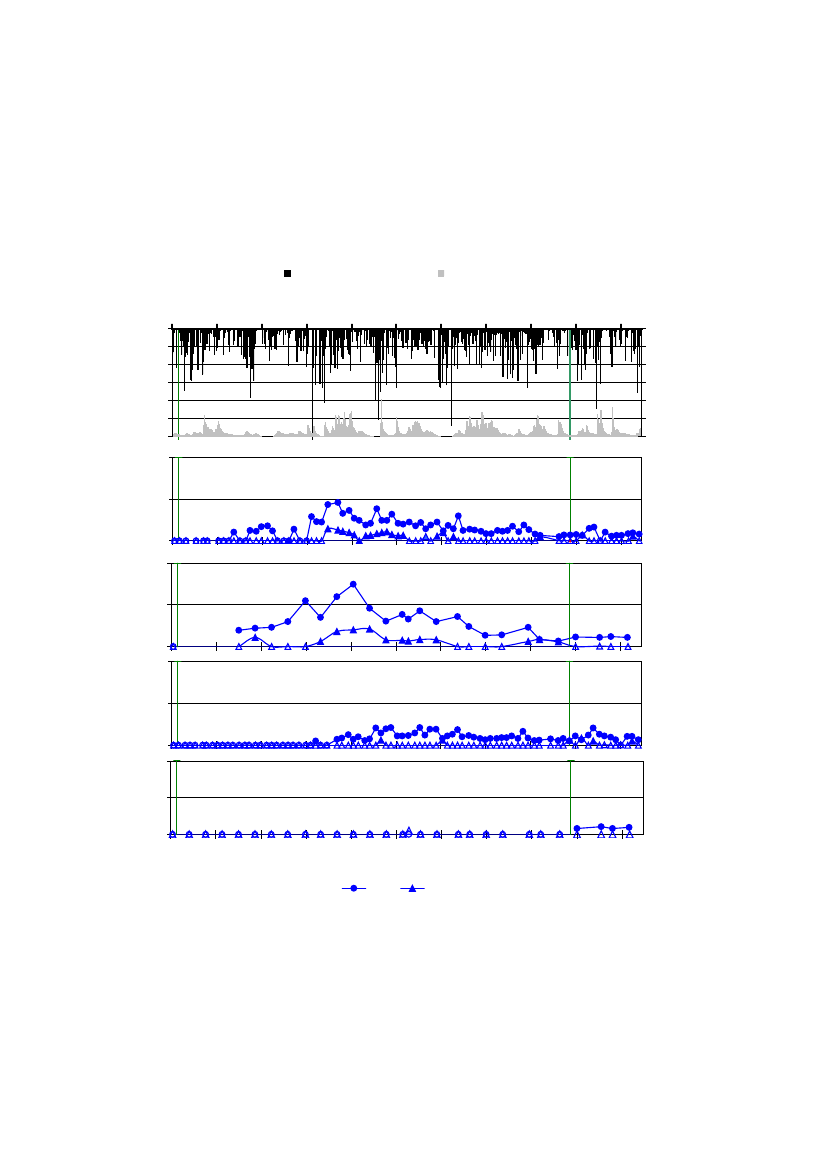
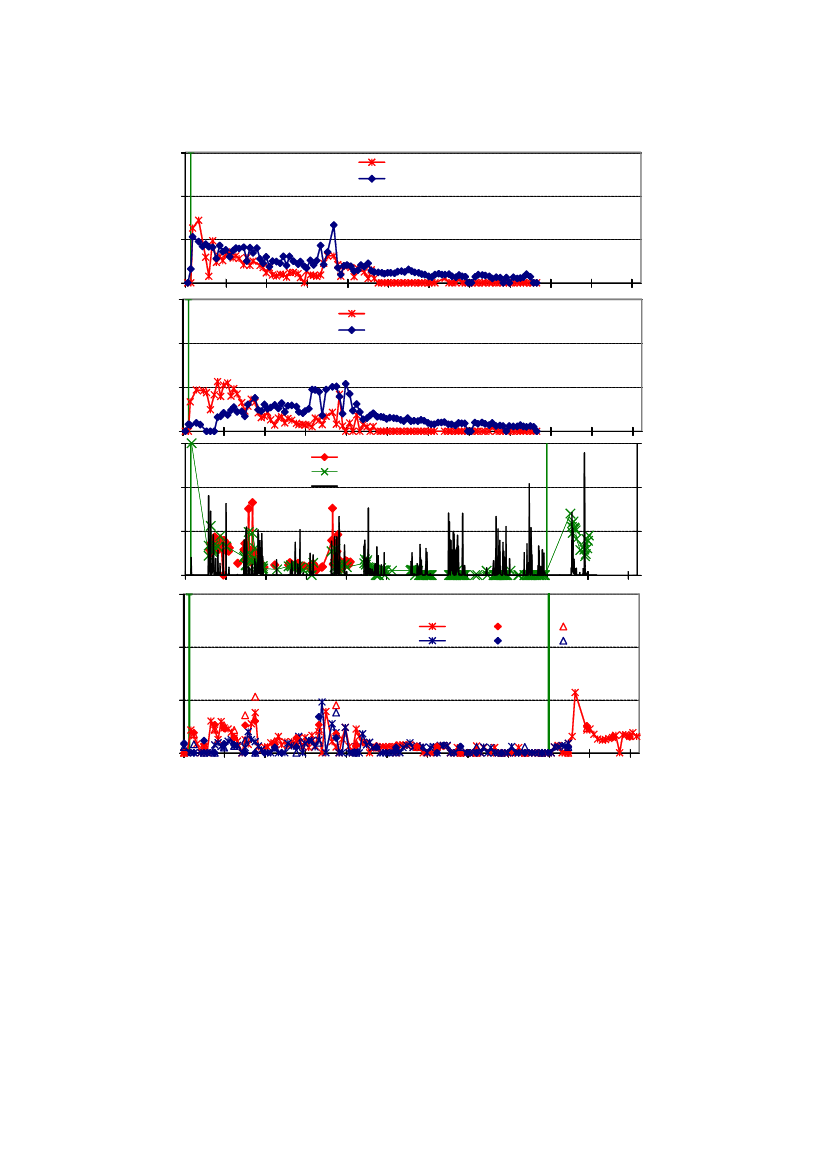
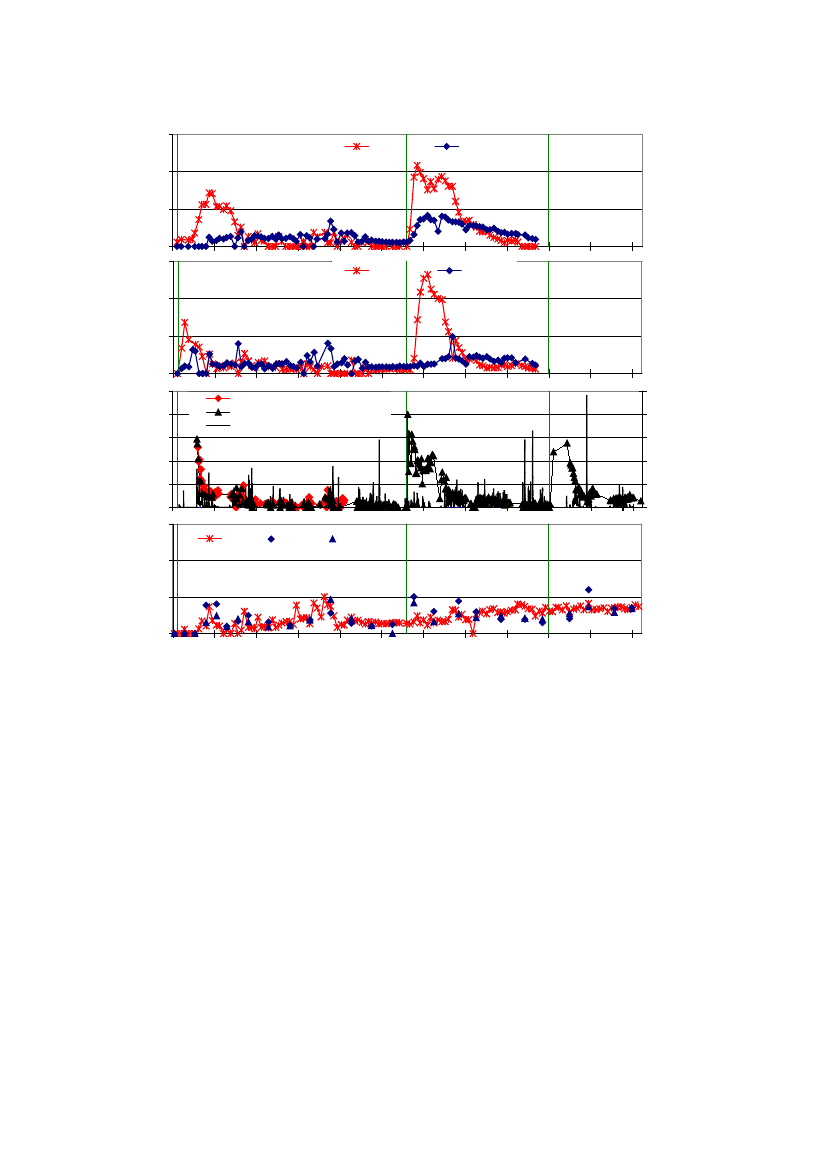
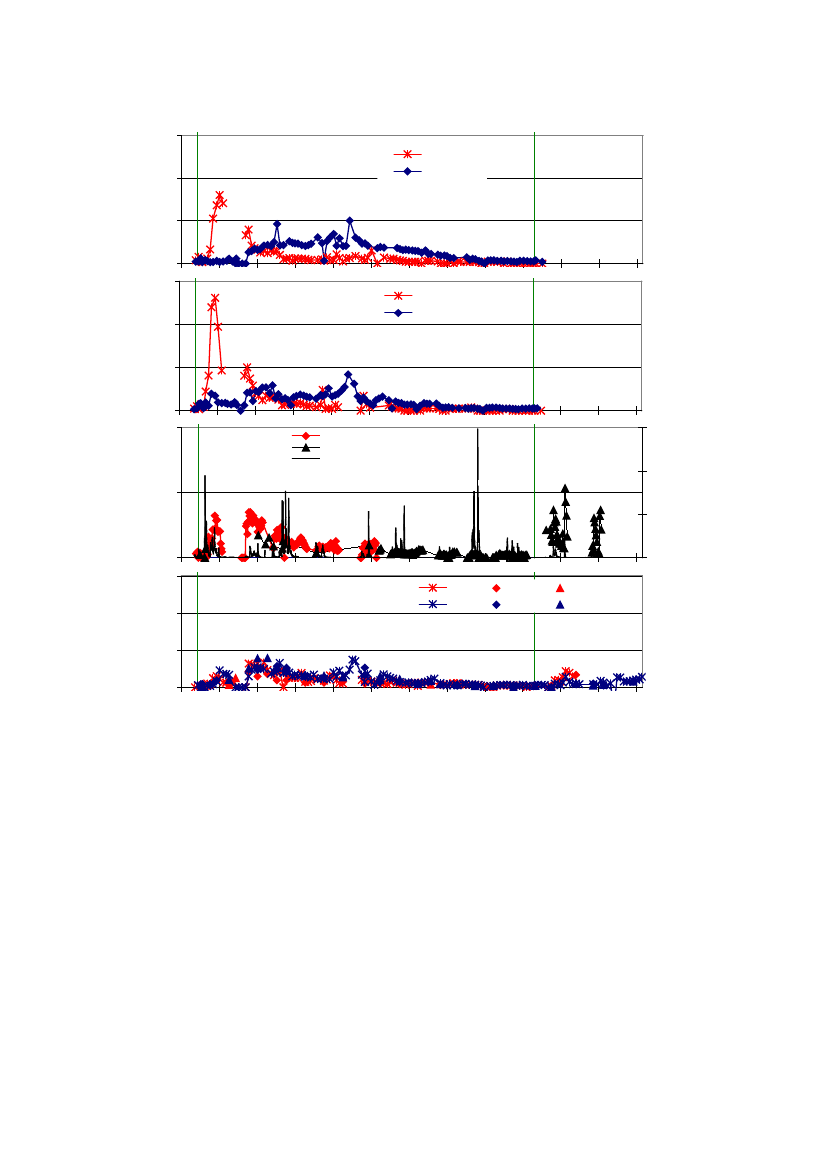
Figure 4.Measured bromide concentration in the unsaturated zone atTylstrup.The measured data derive fromsuction cups installed 1 m b.g.s. and 2 m b.g.s. at locations S1 (A) and S2 (B) indicated in Figure 2. The greenvertical lines indicate the dates of bromide applications.
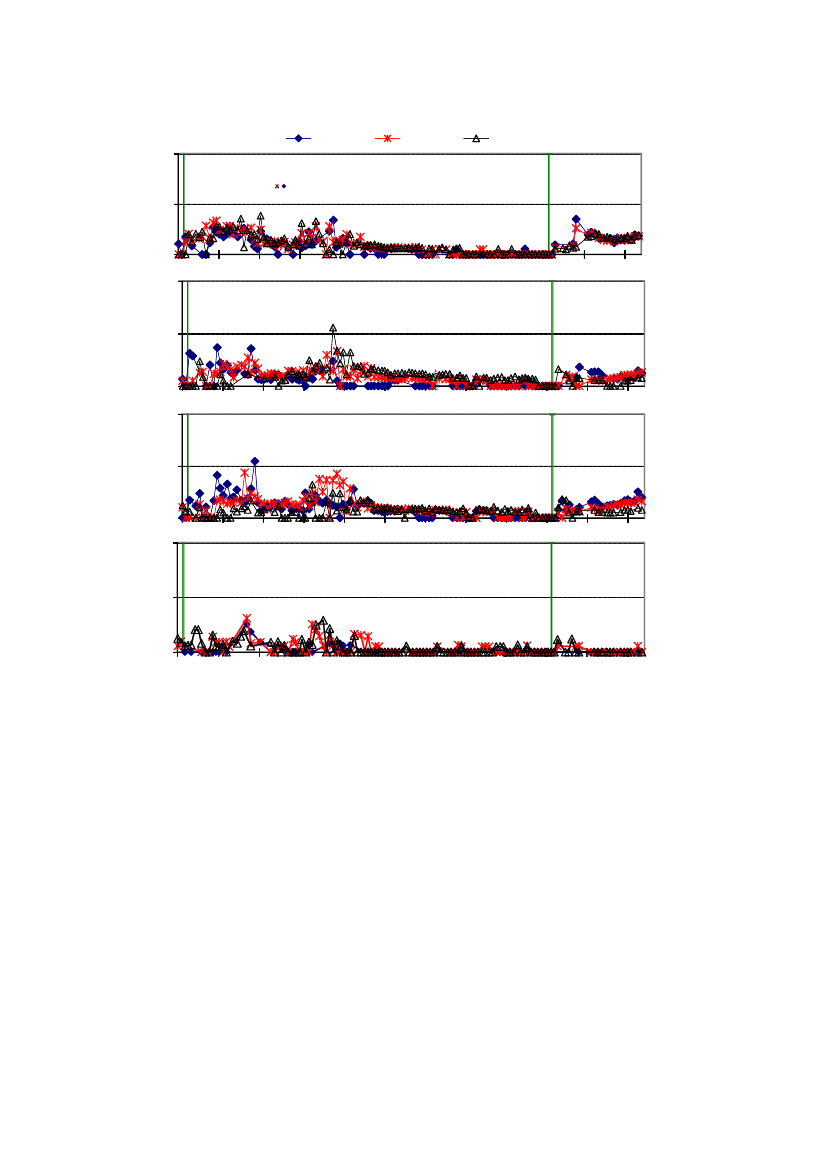
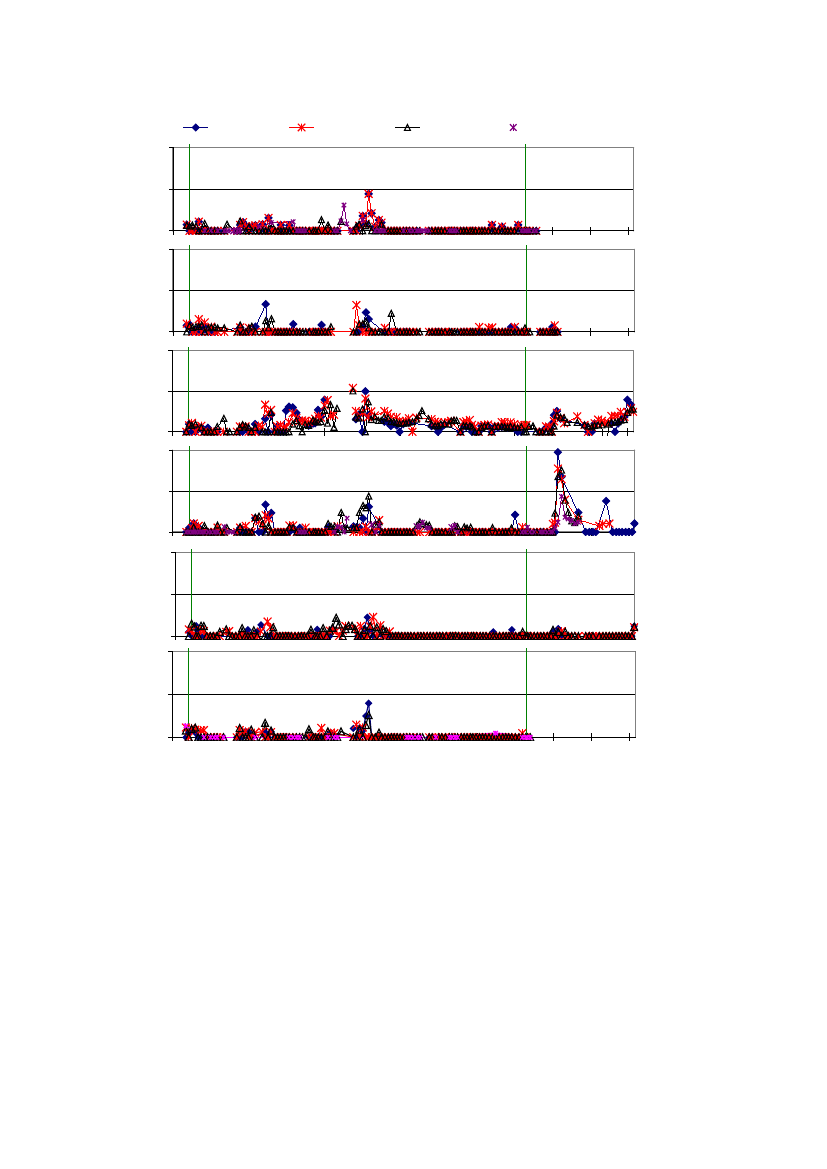
2.2.2 Bromide leachingBromide has now been applied twice at Tylstrup. The bromide concentrations measureduntil April 2003 (Figure 4 and Figure 5) relate to the bromide applied in May 1999, asdescribed further in Kjæret al.(2003). Unsaturated transport of the bromide applied inMarch 2003 is evaluated in Barleboet al.(2007).
21
May-11
May-11
Bromide (mg/l)Bromide (mg/l)0123
Bromide (mg/l)
Bromide (mg/l)Bromide (mg/l)0123May-99
Bromide (mg/l)
0
1
2
3
0012340123
1
2
3
May-99
May-99M4M5M3
May-99May-99May-00May-01May-02May-03May-04May-05May-06May-07May-08
M6
M1
3-4 m
May-00
May-00May-01May-02May-03May-04May-05May-06May-07May-08May-09May-10May-11
May-00May-01May-02May-03May-04May-05May-06May-07May-08May-09May-10May-11May-02May-03May-01
May-00
M2
May-01
4-5 m
May-02
May-03
5-6 m
May-04
May-04May-05May-06May-07May-08
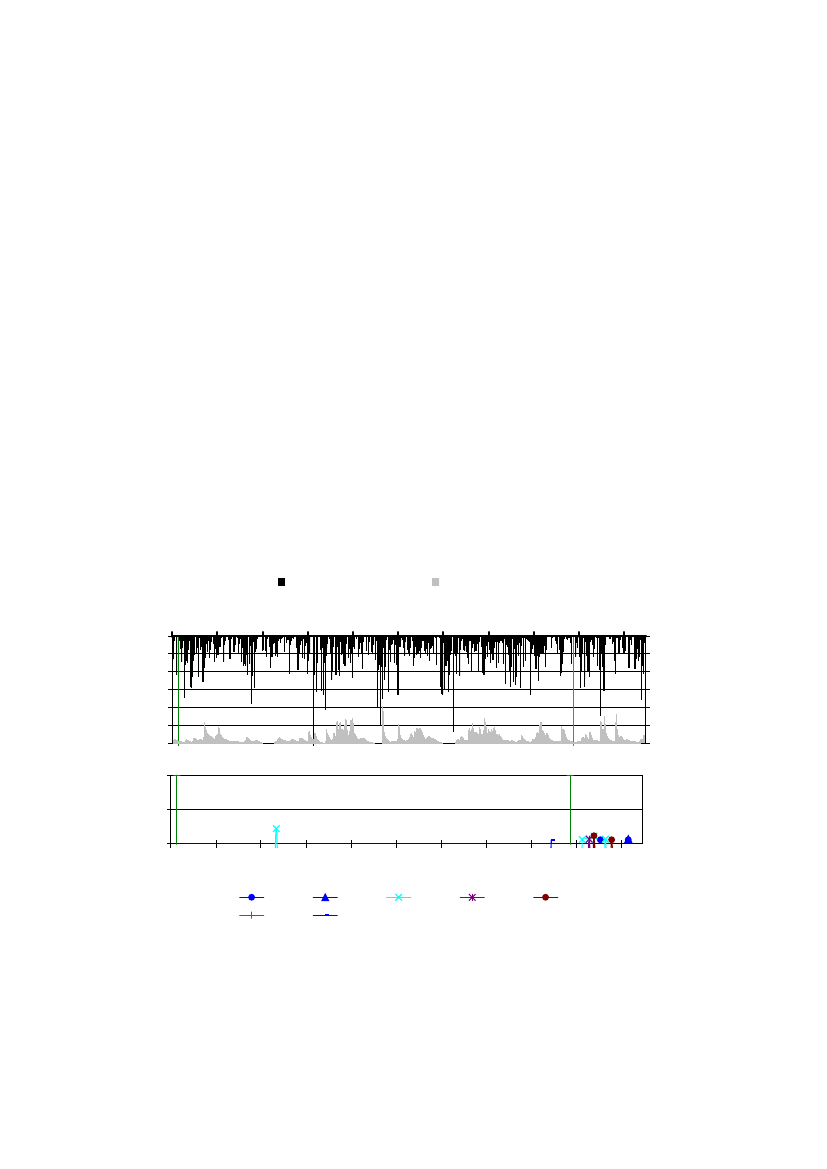
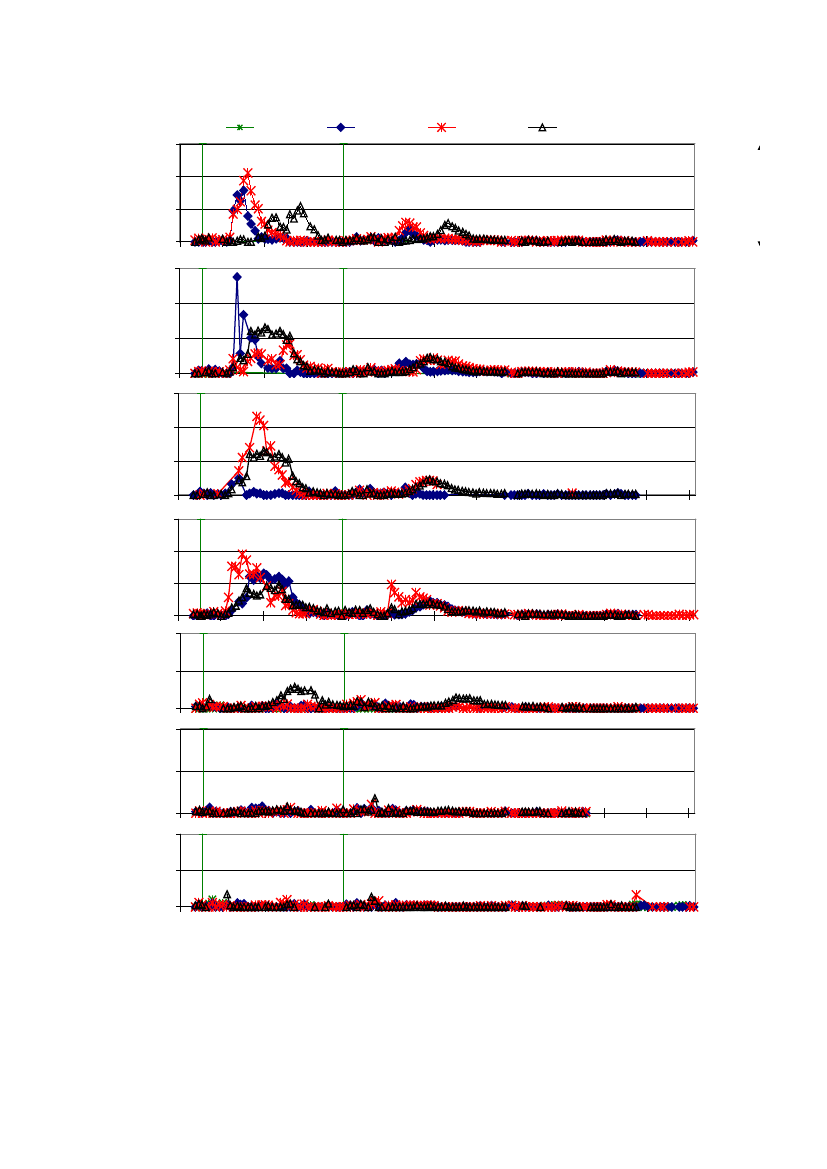
Figure 5.Bromide concentration in the groundwater atTylstrup.The data derive from monitoring wells M1–M6.Monitoring at well M6 was suspended September 2008 (Appendix 2). Screen depth is indicated in m b.g.s. The greenvertical lines indicate the dates of bromide applications.
22
May-05
May-06
6-7 m
May-07
May-08
7-8 m
May-09
May-09May-10May-11
May-09May-10May-118-9 m
May-10
May-11
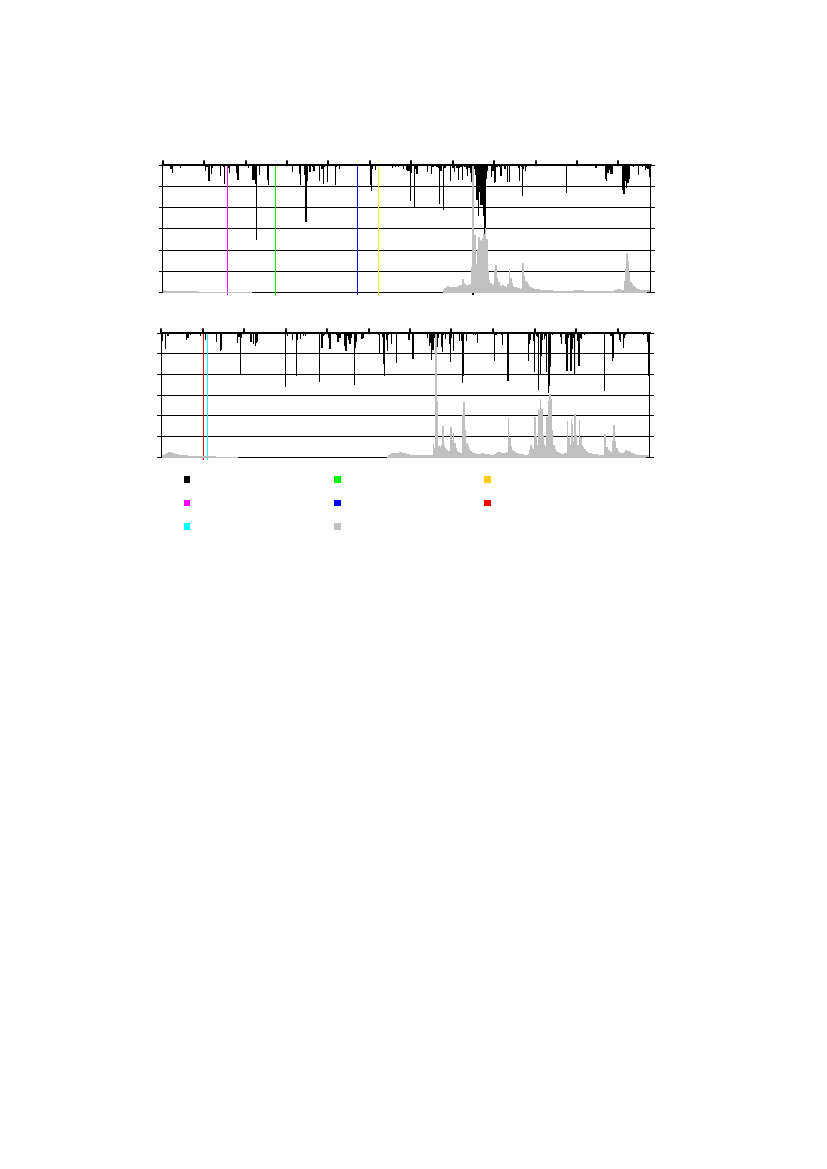
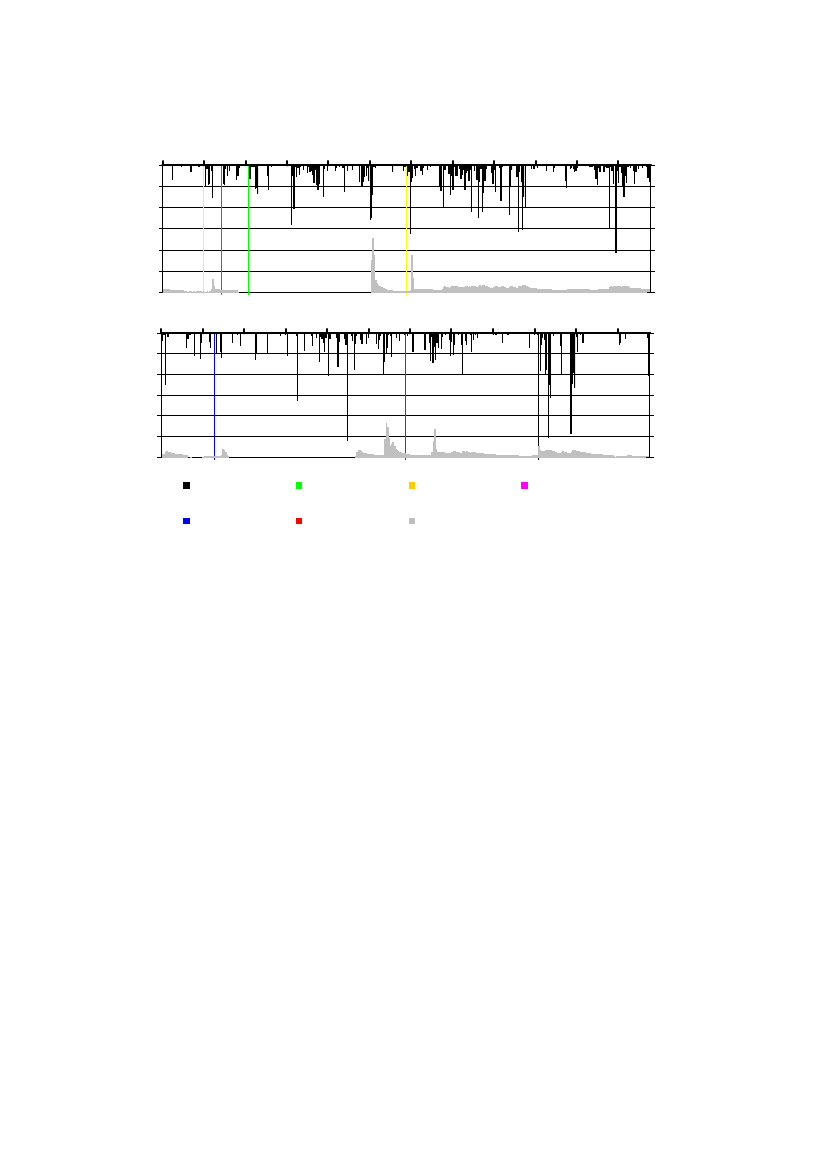
2.2.3 Pesticide leachingMonitoring at Tylstrup began in May 1999 and presently encompasses several pes-ticides and their degradation products, as shown in Appendix 8. Pesticide applicationsduring the latest growing seasons are listed in Table 3 and shown together withprecipitation and simulated precipitation in Figure 6.It should be noted that precipitation in Table 3 is corrected to soil surface according toAllerup and Madsen (1979), whereas percolation (1 m b.g.s.) refers to accumulatedpercolation as simulated with the MACRO model. It should also be noted thatrimsulfuron (applied here as Titus) degrade rapidly. The risk of leaching is thereforeassociated with the degradation products PPU and PPU-desamino. In Table 3 weightedaverage concentrations 1 m b.g.s (Cmean) is calculated from both from both S1 and S2.When these values are reported as a range it indicated that Cmean in S1 and S2 differsfrom each other.Pesticides applied later than April 2011 are not evaluated in this reportand hence are not included in Table 3 and Figure 6.The current report focuses on the pesticide applied from 2009 and onwards, whileleaching risk of pesticides applied before 2009 has been evaluated in previousmonitoring reports (see http://pesticidvarsling.dk/publ_result/index.html). The leachingof rimsulfuront is further detailed in Kjæret al.(2005b), Rosenbomet al.(2009) andRosenbomet al.(2010a).MayAugNovMarDecAprSepFebOctJunJan
0Precipitation (mm/d)
Jul
3020152009/201010503020152010/20111050PrecipitationRimsulfuron (2010)Azoxystrobin (2009)Cyazofamid (2010)Bentazone (2009)Metalaxyl-M (2010)Aclonifen (2010)Simulated percolation
20304050600
Precipitation (mm/d)
2030405060
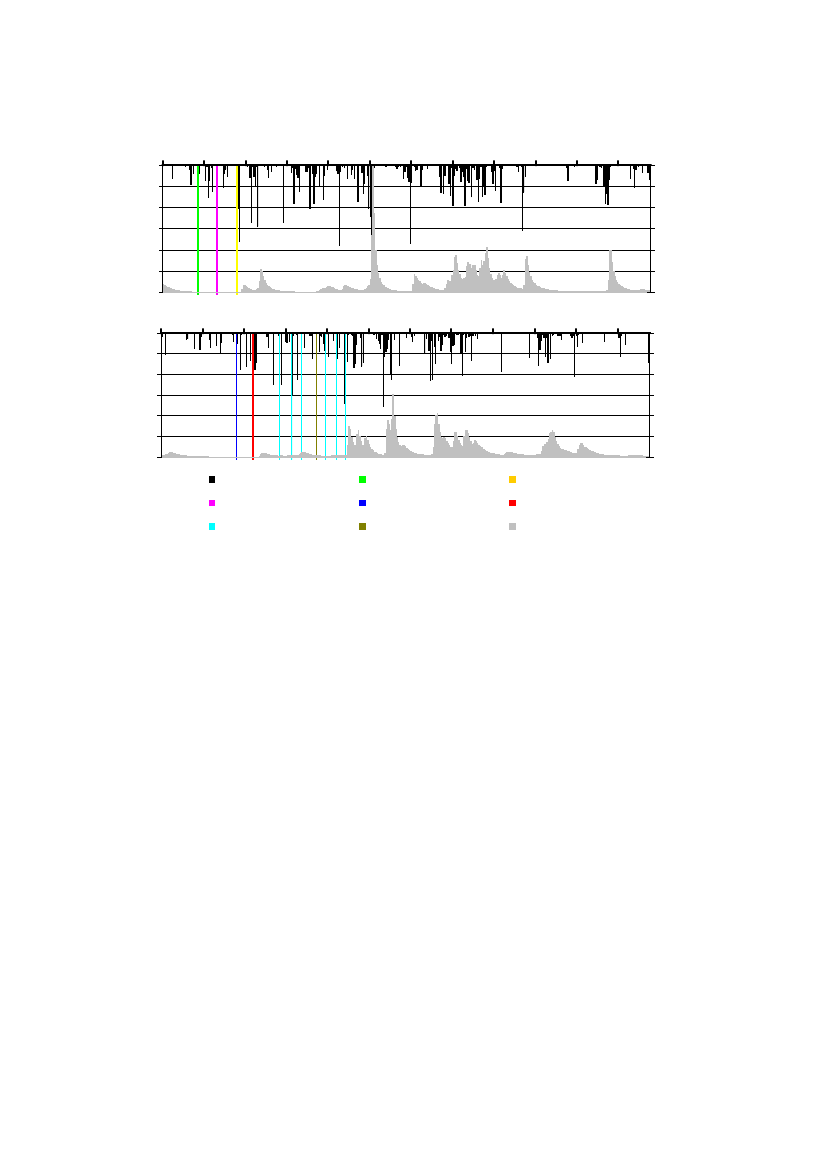
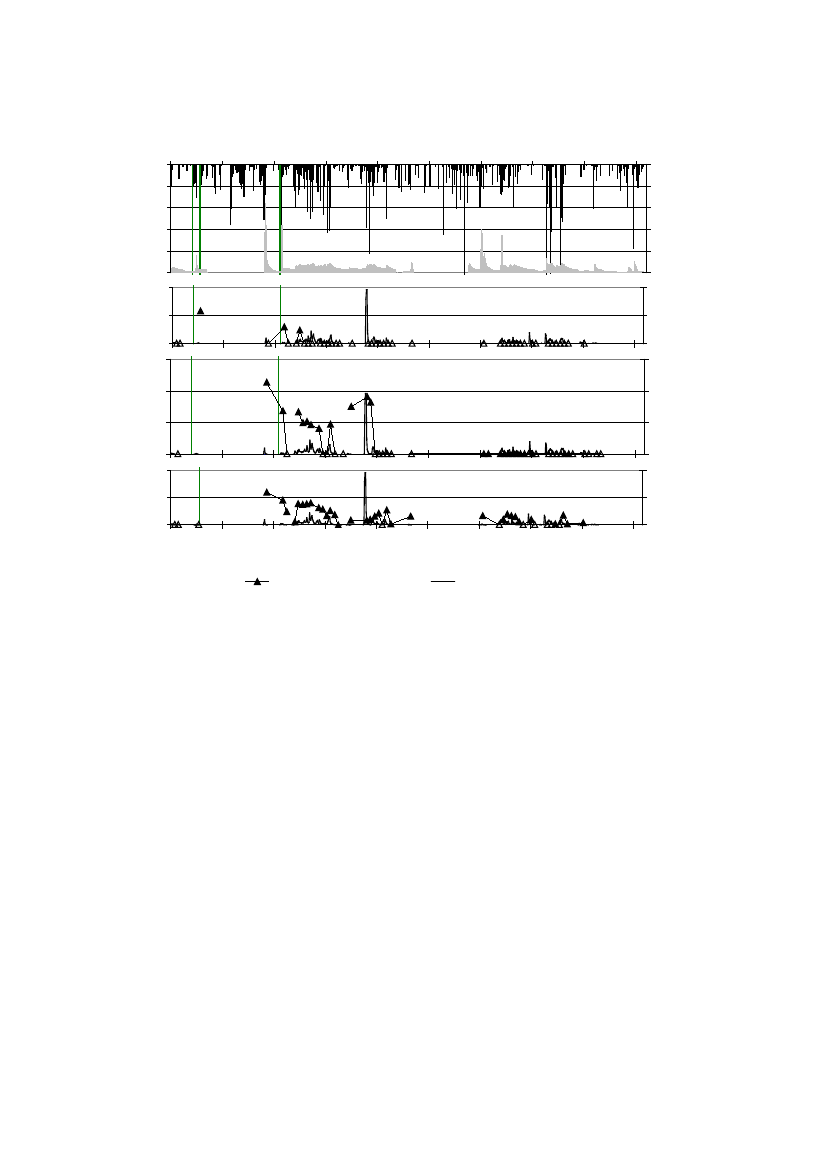
Figure 6.Application of pesticides included in the monitoring programme, precipitation and irrigation (primary axis)together with simulated percolation 1 m b.g.s. (secondary axis) atTylstrupin 2009/2010 (upper) and 2010/2011(lower).
23
Percolation (mm/d)
10
25
Percolation (mm/d)
10
25
Table 3.Pesticides analysed atTylstrup.Precipitation (precip.) and percolation (percol.) are accumulated within thefirst year (Precip 1styear, Percol 1styear) and first month (Precip 1stmonth, Percol 1styear) after the first applicationCmeanrefers to average leachate concentration at 1 m b.g.s. the first year after application. See Appendix 2 forcalculation method and Appendix 8 (Table A8.1) for previous applications of pesticides.CropAppliedAnalysedApplica- End of Y 1stY 1stM 1stM 1stCmeanproductpesticidetion date monit. precip. percol. precip. percol.8757 <0.01Winter Rape 2007CruiserRAPS Thiamethoxam(P) Aug 06 Apr 08 1250 700CGA 322704(M) Aug 06Kerb 500 SCPropyzamide(P)RH-24580(M)RH-24644(M)RH-24655(M)MatrigonWinter Wheat2008AmistarClopyralid(P)Azoxystrobin(P)CyPM(M)Folicur EC 250 Tebuconazole(P)StompSpring Barley2009AmistarAzoxystrobin(P)CyPM(M)Basagran M75 Bentazone(P)Potatoes 2010FenixRanmanRidomil GoldMZ PepiteAclonifen(P)Cyazofamid(P)Metalaxyl-M(P)Feb 07Feb 07Feb 07Feb 07Mar 07Jun 08Jun 08Nov 07Jun 09Jun 09May 09May 10Jun 10Jul 10Apr 09Jun 11Jun 11Mar 10Jun 10Jun 10Jun 11*Jun 11*Jun 11*Jun 11*
Apr 08Apr 09Apr 09
1250105210521052105210551316131611331032909909996958981934934934958958
700472472472472488662662461415475475488491499514514514491491
8748484848301411416936138138133621281271271276262
57404040402400432611112212174343431212
<0.02<0.01<0.01<0.01<0.01<0.02<0.01<0.01<0.01<0.01<0.01<0.01<0.01<0.01<0.01<0.010.03- 0.12<0.01- 0.020.01-0.02<0.01
Pendimethalin(P) Oct 07
CGA 108906(M) Jul 10CGA 62826(M)Jul 10May 10PPU(M)
Jun 11*Jun 11*Jun 11*Jun 11*
Titus WSB
PPU-desamino(M) May 10
Systematic chemical nomenclature for the analysed pesticides is given in Appendix 1.*Monitoring continue the following year.
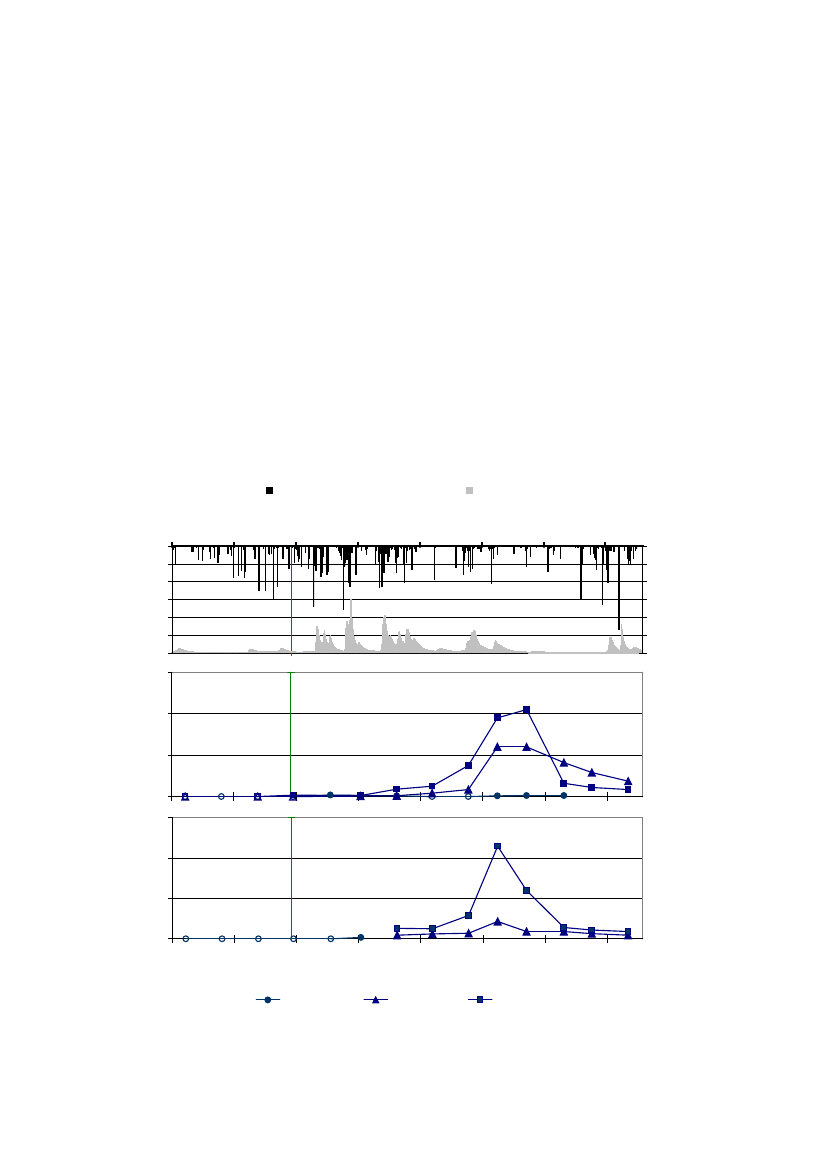
Neither the pesticides azoxystrobin and bentazone applied on spring barley in 2009 northe degradation product CyPM leached at the Tylstrup site. Although, bentazone hasbeen found in one sample (10 April 2006 at S1, 1 m b.g.s.) originating from theapplication in 2005, there were no leaching from the 2009 application (Table 3 andFigure 6). Azoxystrobin and CyPM were not detected in any of the analysed watersamples (Appendix 5.1).Neither aclonifen nor cyazofamid, both applied on potatoes in 2010, leached during thecurrent monitoring period (Appendix 5). The final evaluation awaits an additional yearof monitoring.Leaching of metalaxyl-M applied used in potatoes in 2010 was minor at Tylstrup, andthe compound was only detected in four samples collected from the unsaturated zone,concentration level ranging from 0.013 to 0.03 �g/l (Figure 7). However, twodegradation products of metalaxyl-M (CGA 62826 and CGA 108906) leached from theroot zone (1 m b.g.s.) the latter in average concentrations exceeding 0.1 �g/l (Table 3and Figure 7). Both compounds were found in suction cups 1 m b.g.s. at the end of themonitoring period, indication that leaching of especially CGA 108906 had not yetceased.24
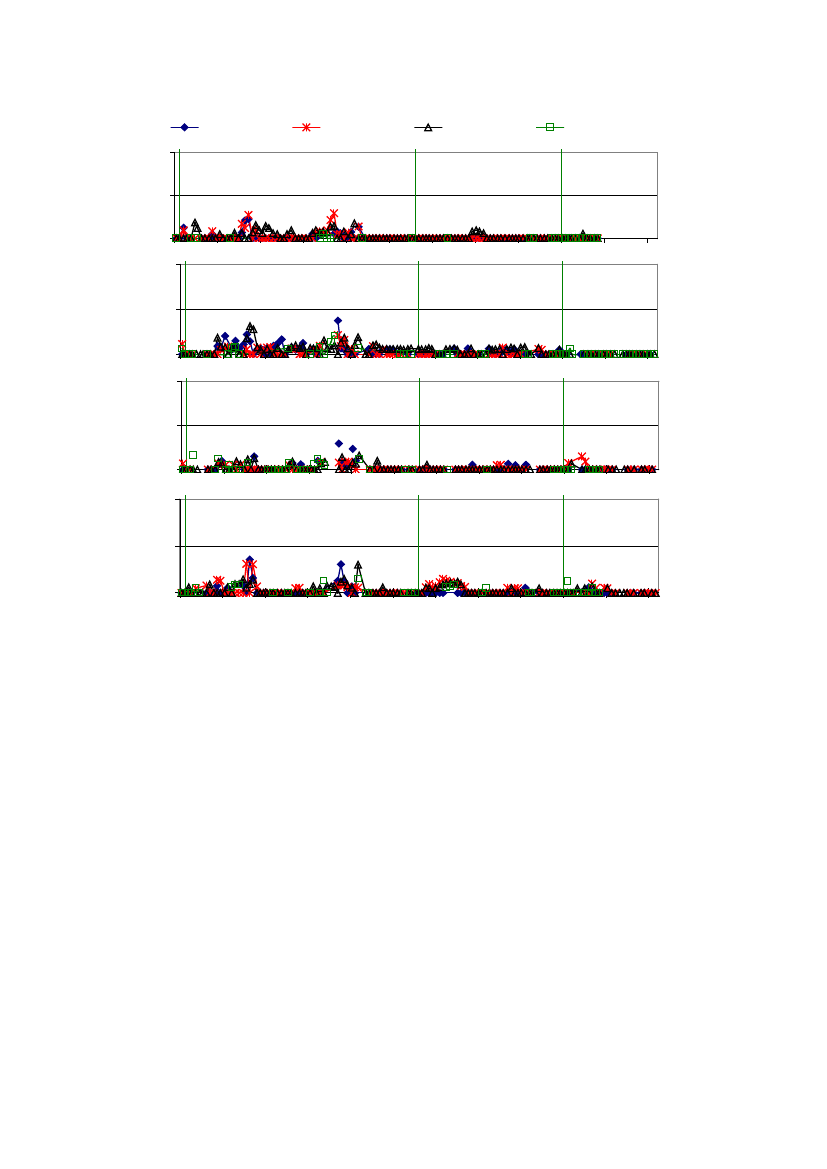
In the saturated zone neither metalaxyl-M nor CGA 62826 was found in any samplescollected from the wells situated downstream the field site, whereas both compoundswere found in samples collected from M1 situated upstream of the field site (Figure 8).While metalaxyl-M was detected in all seven samples (concentration 0.01–0.05 �g/l)collected from M1, CGA 62826 was only detected in two (0.02 �g/l). As the tracer testsuggested that water sampled in M1 had not infiltrated at the PLAP site, but originatedfrom the upstream neighbouring fields, detections in M1 suggest that these compoundhave leached from previous application occurring at these upstreams neighbouringfields, where metalaxyl have also been applied (Appendix 7).
Precipitation & irrigation
Simulated percolation
May-10
Precipitation (mm/d)
01020304050600.60.50.40.30.20.10.00.20.10.00.20.10.00.40.30.20.10.0A
May-11
Nov-10
Mar-11
Apr-10
Sep-10
Jan-11
Jul-10
302520151050Suction cups - S11 m b.g.sB
Pesticide (�g/l)
Pesticide (�g/l)
Suction cups - S12 m b.g.s
C
Suction cups - S21 m b.g.s
D
Pesticide (�g/l)
Suction cups - S22 m b.g.s
E
May-10
Nov-10
Metalaxyl-M
CGA 62829
CGA 108909
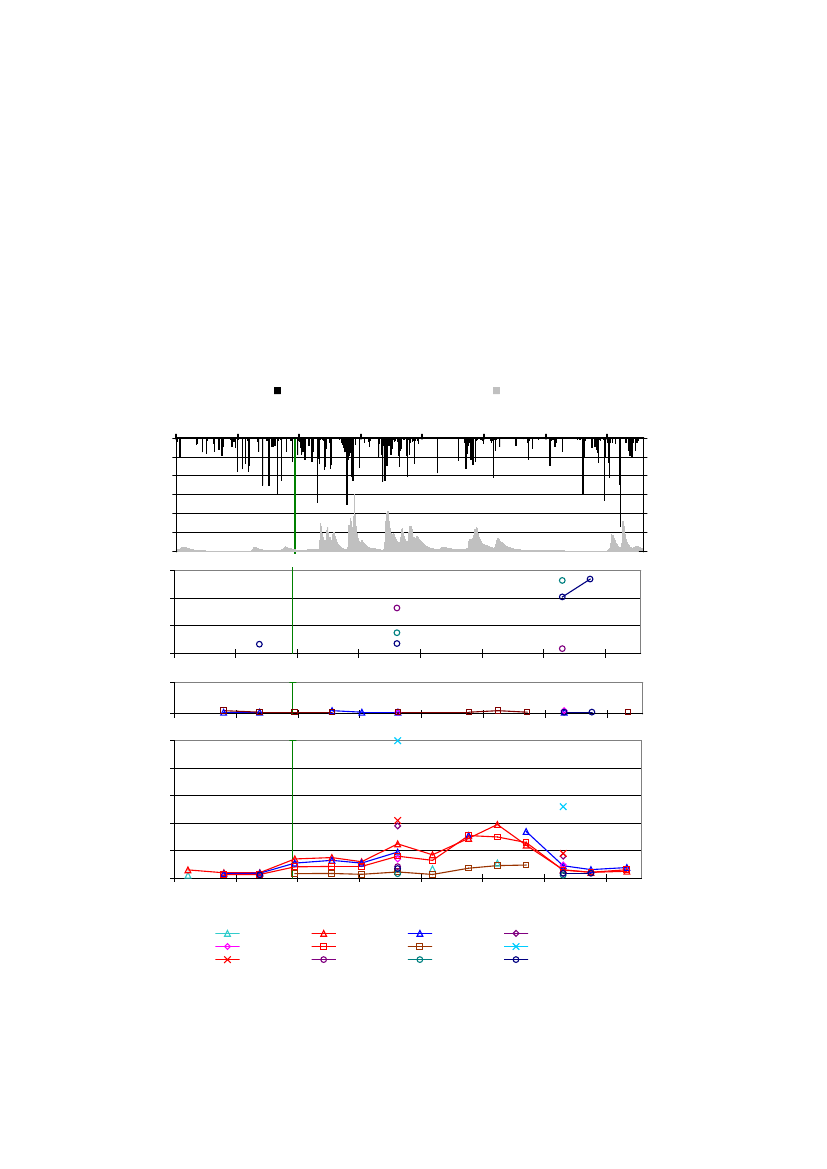
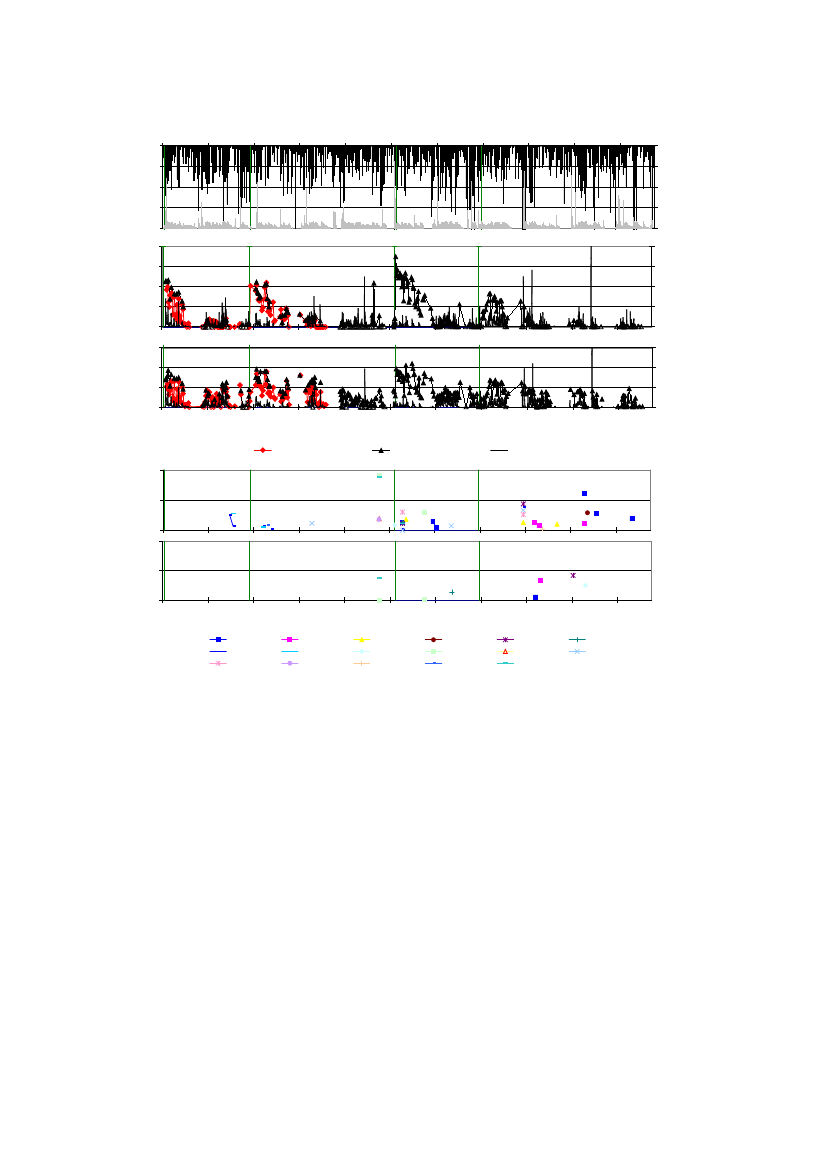
Figure 7.Precipitation, irrigation and simulated percolation 1 m b.g.s. (A) together with measured concentration ofMetalaxyl-M, CGA 62829andCGA 108909(�g/l) in suction cups installed at location S1 at 1 m b.g.s. (B) and 2 mb.g.s. (C) and location S2 at 1 m b.g.s. (D) and 2 m b.g.s. (E) atTylstrup.The green vertical line indicates the date ofpesticide application.
25
May-11
Apr-10
Sep-10
Mar-11
Jul-10
Jan-11
Percolation (mm/d)
CGA 108906 was found in 95% of analysed groundwater samples and 27% of theanalysed sample concentrations exceed 0.1 �g/l. Similar to the other compounds GCA108906 was also detected in samples from the upstream well of M1 and moreoverpresent in the groundwater before metalxyl-M was applied at the PLAP field in 2010.This background concentration of CGA 108906 found in all monitoring wells makes itdifficult to determine whether the elevated concentrations observed in downstreammonitoring wells are due to the metalaxyl-M applied on the PLAP test site in 2010 or toprevious applications on the “upstream” fields. However, the background concentrationsuggests that leaching of CGA 108906 occurs both from our field as well as fromneighbouring field situated upstream our field site. Moreover, with a background levelof CGA 108906 ranging between 0.02–0.1 �g/l, additional input via root zone leachingas that observed is likely to increase the frequency of exeedence of the 0.1 �g/l insamples collected from the groundwater monitoring wells.Precipitation & irrigationSimulated percolation
May-10
Precipitation (mm/d)
01020304050600.40.30.20.10.00.40.30.20.10.00.40.30.20.10.0Metalaxyl-M(only detections)A
May-11
Nov-10
Mar-11
Apr-10
Sep-10
Jan-11
Jul-10
302520151050
Pesticide (�g/l)
B
Pesticide (�g/l)
CGA 62826(only detections)
C
Pesticide (�g/l)
CGA 108906(only detections)
D
May-10
Nov-10
1.M1.31.M4.3
1.M1.41.M4.4
1.M3.31.M5.2
1.M3.41.M5.3
1.M4.21.M5.4
Figure 8.Precipitation, irrigation and simulated percolation 1 m b.g.s. (A) together with measured concentration ofMetalaxyl-M(B),CGA 62826(C) andCGA 108906(D) (�g/l) in monitoring wells atTylstrup.The green verticalline indicates the date of pesticide application.
26
May-11
Apr-10
Sep-10
Mar-11
Jul-10
Jan-11
Percolation (mm/d)
When evaluating these results it should be noted that the precipitation following theapplication of metalaxyl-M (applied in July) amounted to 140 mm in July 2010 (97%higher than normal) and 111 mm in June (50% higher than normal). See Appendix 4and Table 3.
Precipitation & irrigation
Simulated percolation
May-04
May-06
Precipitation (mm/d)
01020304050600.2Suction cups - S11 m b.g.sBA
Mar-11
Sep-05
Feb-09
Oct-07
Oct-09
Jun-08
Jun-10
Jan-05
Jan-07
302520151050Percolation (mm/d)
Pesticide (�g/l)Pesticide (�g/l)
0.10.00.20.10.00.20.10.00.20.10.0
Suction cups - S12 m b.g.s
C
Pesticide (�g/l)
Pesticide (�g/l)
Suction cups - S21 m b.g.s
D
Suction cups - S22 m b.g.s
E
May-04
May-06
Sep-05
Feb-09
Oct-07
Oct-09
PPU
PPU-desamido
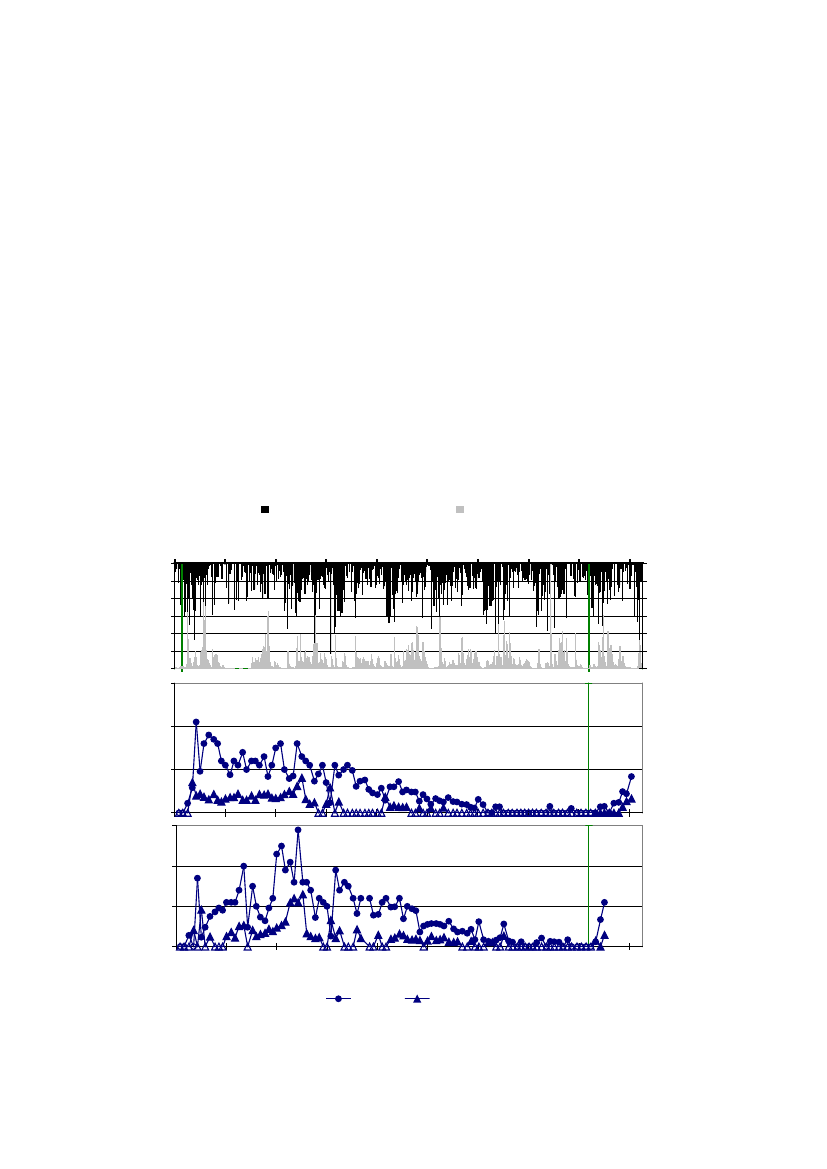
Figure 9.Precipitation, irrigation and simulated percolation 1 m b.g.s. (A) together with measured concentration ofPPUandPPU–desamino(�g/l) in suction cups installed at location S1 at 1 m b.g.s. (B) and 2 m b.g.s. (C) andlocation S2 at 1 m b.g.s. (D) and 2 m b.g.s. (E) atTylstrup.The green vertical line indicates the date of pesticideapplication. Open symbols indicate concentrations below the limit of detection (0.02 �g/l prior to July 2006 and 0.01�g/l thereafter). While PPU-desamino has not been detected in the groundwater, PPU was detected in twogroundwater samples (see text).
27
Mar-11
Jan-05
Jan-07
Jun-08
Jun-10
Metalaxyl was on the Danish market from 1980-1995, reported maximum alloweddosage from 1984-1995 being 375 gr. a.i./ha. It re-entered the Danish marked in 2007 asMetalaxyl-M with a maximum allowed dosage of 77.6 g/ha. Since 2006 metalaxyl-Mwas applied at upstream neighboring fields where reported dosage did not exceed themaximum allowed dosage of 77.6 g a.i./ha. Usage data are not available from 1980-1995 but information from local farmers suggest that metalxyl during this period wasapplied on some of the upstream neighboring field (Appendix 7). For placing the resultinto regulatory context it would thus be important to judge if measured groundwaterresidues origin from initial high usage of 375 g a.i/ha allowed in 1980–1995 or from thecurrent usage of 77.6 g a.i/ha allowed since 2007.Based on available data we believe that detected residues in the groundwater are mostlikely to derive from current usage of metalaxyl allowed since 2007 and not the initialusage allowed from 1980–1995. With an average travel time to all monitoring wellsbeing less than 4 years (Laier et al. in prep) it is unlikely that water sampled from thesescreen have infiltrated the unsaturated zone before 1995 (17 years ago). A possibilitycould however be that the residues originating from the initial usage of 375 g/ha(allowed in 1980-1995) were left in the soil and continued to leached during a longperiod of time. Should this be the case the persistency of these compounds would bevery high allowing them to leach more than a decade after application. An assumptionwhich dot not correspond the regulatory assessment where final endpoints for DT50were less than 18 days Danish EPA (2007).Precipitation & irrigationSimulated percolation
May-04
May-06
Precipitation (mm/d)
102030405060A
2520151050B
Pesticide (�g/l)
0.20.10.0Monitoring wellsPPU(only detections)
May-04
May-06
Sep-05
Oct-07
Feb-09
Oct-09
1.M3.31.M5.4
1.M3.41.M5.5
1.M4.3
1.M4.4
1.M5.3
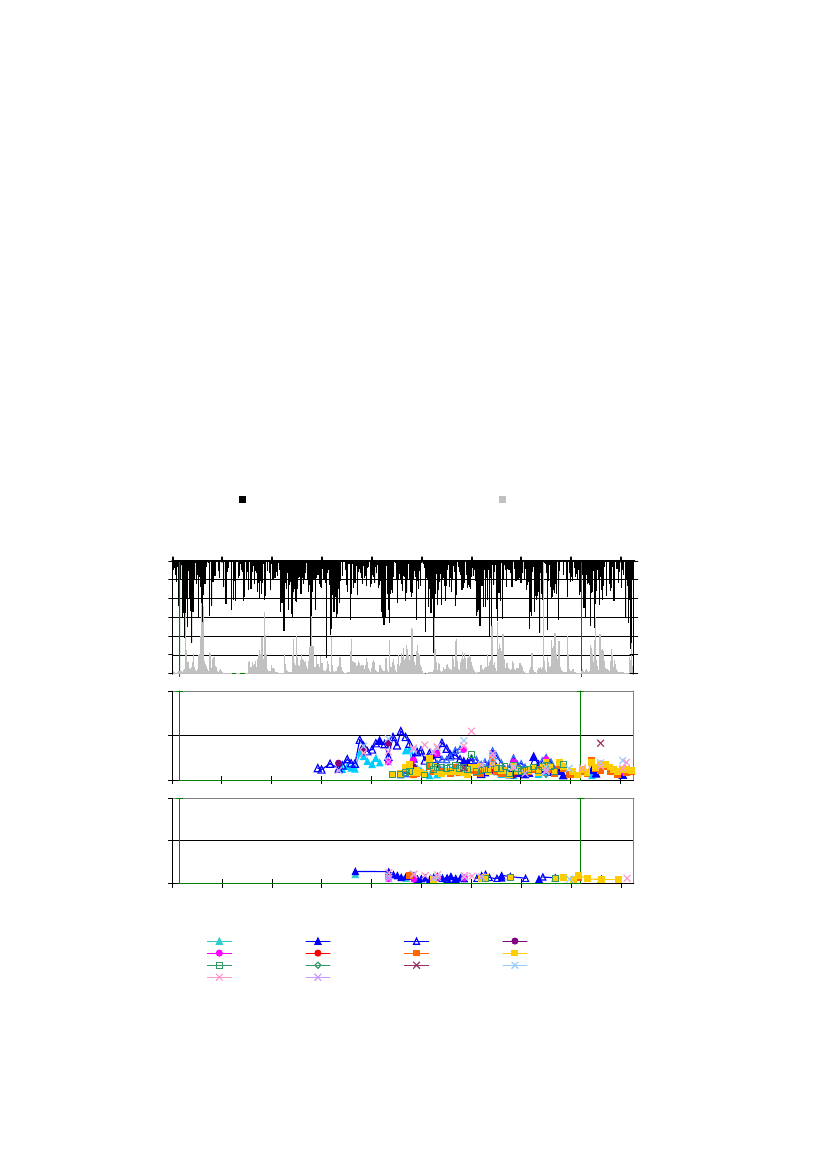
Figure 10.Precipitation, irrigation and simulated percolation 1 m b.g.s. (A) together with measured concentration ofPPU(�g/l) in monitoring wells (B) atTylstrup.The green vertical line indicates the date of pesticide application.
28
Mar-11
Jan-05
Jan-07
Jun-08
Jun-10
Percolation (mm/d)
0
Mar-11
Sep-05
Feb-09
Oct-07
Oct-09
Jun-08
Jun-10
Jan-05
Jan-07
30
Rimsulfuron was applied on potatoes in 2010 in the same dosage as that used onpotatoes in 2004. Rimsulfuron degrades rapidly in the soil, and the leaching risk istherefore associated with the degradation products PPU and PPU-desamino. At TylstrupPPU was characterised by continuous leaching over a long period of time. Residues(ranging between 0.01–0.05 �g/l) of the 2004 application were thus still detected in thesuction cups prior to the 2010 application. Evidence of additional leaching following the2010 application have not yet been observed, as leachate concentration 1 m b.g.s.following the 2010 application is similar to that observed in previous year of 2009/2010(Figure 9). During the last monitoring year (from July 2010 and onwards) frequency ofPPU (Rimsulfuron metabolite) detection in the groundwater has increased markedly andPPU is found in 35% of analysed samples, concentration level being low however(0.012-0.023 �g/l, Figure 10). Final evaluation of the 2010 application awaits anadditional year of monitoring; as travel time of these metabolites to the suction cups 1 mb.g.s. is know to be approximately 10 mounts (Kjær et al. 2010). The results of the 2004application are summarised Rosenbomet al.(2010a).
29
30
3 Pesticide leaching at Jyndevad3.1Materials and methods
3.1.1 Site description and monitoring designJyndevad is located in southern Jutland (Figure 1). The test site covers a cultivated areaof 2.4 ha (135 x 184 m) and is practically flat. A windbreak borders the eastern side ofthe test site. The area has a shallow groundwater table ranging from 1 to 3 m b.g.s.(Figure 12B) The overall direction of groundwater flow is towards the northwest(Figure 11). The soil can be classified as Arenic Eutrudept and Humic PsammenticDystrudept (Soil Survey Staff, 1999) with coarse sand as the dominant texture class andtopsoil containing 5% clay and 1.8% total organic carbon (Table 1). The geologicaldescription points to a rather homogeneous aquifer of meltwater sand, with localoccurrences of thin clay and silt beds. A brief description of the sampling procedure isprovided in Appendix 2. The monitoring design and test site are described in detail inLindhardtet al.(2001) and the analysis methods in Kjæret al.(2002).3.1.2 Agricultural managementManagement practice during the 2010-11 growing seasons is briefly summarized belowand detailed in Appendix 3 (Table A3.2). For information about management practiceduring the previous monitoring periods, see previous monitoring reports available onhttp://pesticidvarsling.dk/publ_result/index.html.
31
Figure 11.Overview of theJyndevadsite. The innermost white area indicates the cultivated land, while the greyarea indicates the surrounding buffer zone. The positions of the various installations are indicated, as is the directionof groundwater flow (by an arrow). Pesticide monitoring is conducted monthly and half-yearly from selectedmonitoring wells and suctions cups as described in Table A2.1 in Appendix 2.
32
Having been ploughed on 14 April 2010, the field was planted with potatoes (cv. Kuras)on 4 May. Before the potatoes emerged the field was sprayed with the herbicidesaclonifen and rimsulfuron on 27 May. Rimsulfuron was applied again on 8 June. Thefungicide cyazofamid was used five times between 28 June and 9 August, whereasazoxystrobin was applied on 6 July and a combination of mancozeb and metalaxyl on25 July. Aphids were sprayed once using lambda-cyhalothrin on 16 July. The field wasirrigated three times with 25, 25 and 30 mm on 24 June, 30 June and 8 July,respectively. Neither mancozeb, azoxystrobin nor lambda-cyhalothrin was included inthe monitoring. The potatoes were harvested on 19 October yielding 450 hkg/ha with26.8% DM (120.6 hkg/ha at 100% DM), yields being below the average for the soil typeand year (Plantedirektoratet, 2010). The field was ploughed on 22 March 2011 and thefollowing day sown with spring barley (cv. Quench).3.1.3 Model setup and calibrationThe numerical model MACRO (version 5.1, Larsboet al.,2005) was applied to theJyndevad site covering the soil profile to a depth of 5 m b.g.s., always including thegroundwater table. The model was used to simulate water flow and bromide transport inthe unsaturated zone during the full monitoring period July 1999–June 2011 and toestablish an annual water balance.Compared with the setup in Kjæret al.(2011), a year of validation was added to theMACRO-setup for the Jyndevad site. The setup was hereby calibrated for themonitoring period May 1999-June 2004 and validated for the monitoring period July2004-June 2011. For this purpose, the following time series have been used: thegroundwater table measured in the piezometers located in the buffer zone, soil watercontent measured at three different depths (25, 60, and 110 cm b.g.s.) from the twoprofiles S1 and S2 (location indicated at Figure 11), and the bromide concentrationmeasured in the suction cups located 1 and 2 m b.g.s (Figure 13). Data acquisition,model setup as well as results related to simulated bromide transport are described inBarleboet al.(2007).
33
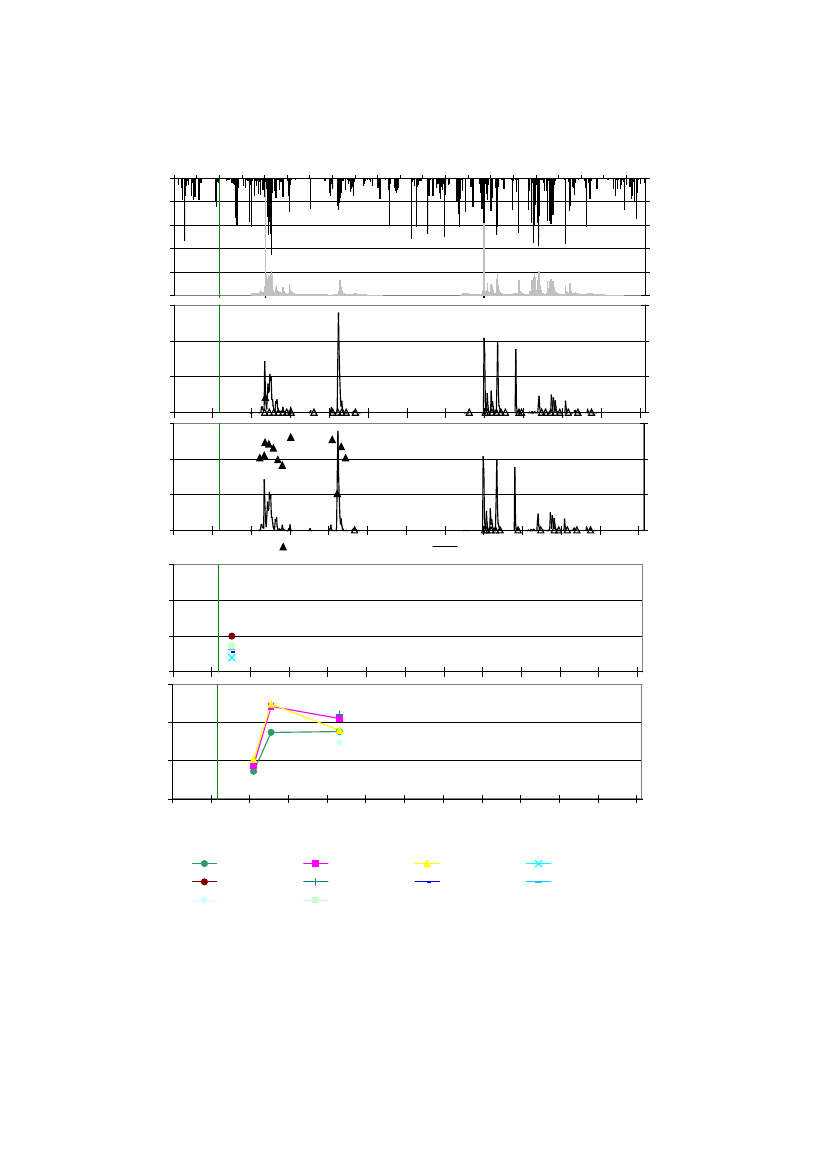
Figure 12.Soil water dynamics atJyndevad:Measured precipitation, irrigation and simulated percolation 1 m b.g.s.(A), simulated and measured groundwater level (B), and simulated and measured soil water saturation (SW sat.) atthree different soil depths (C, D and E). The measured data in B derive from piezometers located in the buffer zone.The measured data in C, D and E derive from TDR probes installed at S1 and S2 (Figure 8). The broken vertical lineindicates the beginning of the validation period (July 2004-June 2011).
34
3.2
Results and discussion
3.2.1 Soil water dynamics and water balancesThe model simulations were generally consistent with the observed data, thus indicatinga good model description of the overall soil water dynamics in the unsaturated zone(Figure 12). The dynamics of the simulated groundwater table were well described withMACRO 5.1 (Figure 12B). No measurements of the water saturation were obtainedduring the following two periods: 1 June-25 August 2009 (given a breakdown in theTDR measuring system) and 7 February-6 March 2010 (given a sensor error). As notedearlier in Kjæret al.(2011), the model still had some difficulty in capturing the degreeof soil water saturation 1.1 m b.g.s. (Figure 12E) and also the decrease in watersaturation observed during summer periods at 25 and 60 cm b.g.s. A similar decrease inwater saturation is observed from December 2010 to February 2011 at 25 cm b.g.s.,which is caused by precipitation falling as snow (air-temperature below zero degreesCelcius). The water flow through the soil profile will hereby be delayed – a delay,which can not be captured by the MACRO-setup.The resulting water balance for Jyndevad for the 11 monitoring periods is shown inTable 4. Compared with the previous eleven years, the latest hydraulic year July 2010-June 2011 was characterised by having medium precipitation, high simulated actualevapotranspiration and high irrigation values. Precipitation in the latest hydraulic yearwas characterised by August to October and May-June being very wet, and April beingthe driest monitored at this site (Appendix 4). Continuous percolation 1 m b.g.s. weresimulated for this hydraulic year.Table 4.Annual water balance forJyndevad(mm yr-1). Precipitation is corrected to the soil surface according to themethod of Allerup and Madsen (1979).NormalActualGroundwaterPrecipitation1)PrecipitationIrrigationEvapotranspirationRecharge2)1.7.99–30.6.009951073295006021.7.00–30.6.0199581004613491.7.01–30.6.029951204815457401.7.02–30.6.03995991514156271.7.03–30.6.04995937274325311.7.04–30.6.059951218875787271.7.05–30.6.069958571174904841.7.06–30.6.0799513041145718471.7.07–30.6.0899510231966136051.7.08–30.6.099951078845516101.7.09–30.6.109951059805306101.7.10–30.6.119951070925546071)2)
Normal values based on time series for 1961-1990.Groundwater recharge is calculated as precipitation + irrigation - actual evapotranspiration.
35
12
Bromide (mg/l)
96301 m b.g.s.
Suction cups - S12 m b.g.s.
May-99
May-00
May-01
May-02
May-03
May-04
May-05
May-06
May-07
May-08
May-09
May-10
12
Suction cups - S22 m b.g.s.
Bromide (mg/l)
96301 m b.g.s.
May-99
May-00
May-01
May-02
May-03
May-04
May-05
May-06
May-07
May-08
May-09
May-10
Figure 13.Bromide concentration in the unsaturated zone atJyndevad.The measured data derive from suction cupsinstalled 1 m b.g.s. (upper) and 2 m b.g.s. (lower) at locations S1 and S2 (Figure 8). The green vertical lines indicatethe dates of bromide applications.
3.2.2 Bromide leachingBromide has now been applied twice at Jyndevad. The bromide concentrationsmeasured until April 2003 (Figure 13 and Figure 14) relate to the bromide applied inautumn 1999, as described further in Kjæret al.(2003). Leaching of the bromideapplied in March 2003 is evaluated in Barleboet al.(2007).
36
May-11
May-11
Bromide (mg/l)Bromide (mg/l)Bromide (mg/l)
Bromide (mg/l)Bromide (mg/l)
Bromide (mg/l)
Bromide (mg/l)
0
3
6
9
30369
6
9
0
3
6
9
May-99May-00May-00May-01May-02May-03May-04May-05May-06May-07May-08May-01May-02May-03May-04May-05May-06May-07May-08May-09May-10
May-99
May-99May-99
06
003603
3May-99May-00May-01May-02May-03May-04May-05May-06May-07May-08May-09May-10
6
May-99
May-00
May-00
May-00May-01May-02May-03May-04May-053-4 m b.g.s.1-2 m b.g.s.
May-01
May-01
May-02
May-02
May-03
May-03
2-3 m b.g.s.
May-04
May-04
Figure 14.Bromide concentration in the groundwater atJyndevad.The data derive from monitoring wells M1–M7.Monitoring at well M6 was suspended September 2008 (Appendix 2). Screen depth is indicated in m b.g.s. The greenvertical lines indicate the dates of bromide applications.
37M6M4M5May-11
May-05
May-05
May-06
May-06
May-06May-07May-08May-09May-10
May-07
May-07
May-08
May-08
4-5 m b.g.s.
May-09
May-09
May-09May-10M3M2May-11May-11
May-10
May-10
M1
M7
May-11
May-11
May-11
May
Aug
Nov
0Precipitation (mm/d)
Mar
Dec
Apr
Sep
Feb
Oct
Jun
Jan
Jul
30201510503020152010/20111050PrecipitationBentazone (2009)Cyazofamid (2010)Bifenox (2009)Aclonifen (2010)Metalaxyl-M (2010)Epoxiconazole (2009)Rimsulfuron (2010)Simulated percolation
20304050600
2009/2010
Precipitation (mm/d)
2030405060
Figure 15.Application of pesticides included in the monitoring programme, precipitation and irrigation (primaryaxis) together with simulated percolation 1 m b.g.s. (secondary axis) atJyndevadin 2009/2010 (upper) and2010/2011 (lower).
3.2.3 Pesticide leachingMonitoring at Jyndevad began in September 1999 and presently encompasses severalpesticides and their degradation products, as indicated in Appendix 8. Pesticideapplication during the most recent growing seasons is listed in Table 5 and showntogether with precipitation and simulated precipitation in Figure 15. It should be notedthat precipitation is corrected to the soil surface according to Allerup and Madsen(1979), whereas percolation (1 m b.g.s.) refers to accumulated percolation as simulatedwith the MACRO model. It should also be noted that as rimsulfuron (applied here asTitus) degrade rapidly. The leaching risk is therefore associated with the degradationproducts: PPU and PPU-desamino, rather than the parent compounds. For the samereasons the degradation products and not the parent compounds are monitored in PLAP(Table 6). Pesticides applied later than April 2011 are not evaluated in this report andhence not included in Table 5 and Figure 16.
38
Percolation (mm/d)
10
25
Percolation (mm/d)
10
25
Table 5.Pesticides analysed atJyndevad.Precipitation (precip.) and percolation (percol.) are accumulated within thefirst year (Precip 1styear, Percol 1styear) and first month (Precip 1stmonth, Percol 1styear) after the first applicationCmeanrefers to average leachate concentration at 1 m b.g.s. the first year after application. See Appendix 2 forcalculation method and Appendix 8 (Table A8.2) for previous applications of pesticides.CropAppliedAnalysedApplica- End of Y 1stY 1stM 1stM 1stCmeanproductpesticidetion date monit. precip. percol. precip. percol.Atlantis WGMesosulfuron-methyl(P) Oct 06 Dec 09 1346 8099573 <0.01Triticale 2007Mesosulfuron(M)Cycocel 750OpusPico 750 WGPico 750 WGSpring Barley 2009Basagran M75BellFox 480 SCFox 480 SCFox 480 SCPotatoes 2010FenixRanmanRidomil GolMZ PepiteChlormequat(P)Epoxiconazole(P)Picolinafen(P)CL153815(M)Bentazone(P)Epoxiconazole(P)Bifenox(P)Bifenox acid(M)Nitrofen(M)Aclonifen(P)Cyazofamid(P)Metalaxyl-M(P)CGA 108906(M)CGA 62826(M)Titus WSBPPU(M)PPU-desamino(M)Oct 06Apr 07Dec 07Oct 07Oct 07Jun 08Mar 10Mar 10Mar 10May 07 Dec 0913461223119313961418141811781181120612061206114911881073107310731160116080963864482777777763063063063063056762761361361359259295791236077771441641061061061231251611611611371377316975555134233310164141411313<0.02<0.01<0.01<0.01<0.01<0.01<0.01-0.04<0.01<0.02<0.05<0.01<0.01<0.010.021)0.37-0.662)0.162)-0.190.021)<0.011)
Winter Wheat 2008Folicur EC 250 Tebuconazole(P)
May 09 Jun 11May 09 Dec 09Apr 09Apr 09Apr 09Jun 10Jul 10Jul 10Jul 10Jun 10Jun 10Jun 11*Jun 11*Jun 11**
May 10 Jun 11
Jun 11*Jun 11*Jun 11*Jun 11*Jun 11*Jun 11*
Systematic chemical nomenclature for the analysed pesticides is given in Appendix 1.1)Cmeanis only calculated from suction cups S1(see text).2)Degradation product of metalaxyl-M.*Monitoring continue the following year.
The current report focuses on the pesticides applied from 2009 and onwards, whileleaching risk of pesticides applied before 2008 has been evaluated in previousmonitoring reports (see http://pesticidvarsling.dk/publ_result/index.html).In Table 6 weighted average concentrations 1 m b.g.s (Cmean) is calculated from bothfrom both S1 and S2. When these values are reported as a range it indicated that CmeaninS1 and S2 differs from each other. During the monitoring period 2010/2011 it wasunfortunately not possible to extract sufficient water from S2 to perform all pesticideanalysis. For some of the compounds (metalaxyl-M, PPU, PPU-desamino) there was notsufficient data to calculate weighted leachate concentration (Figure 16 and 18), whyreported 2010 values in Table 6 refers to suction cups S1 only (see note 1 in Table 5).For the same reason concentration of CGA62826 and CGGA 108906 in S2 was notmeasured in S2 during the first mounts after applications. In Table 6 calculationconcentration of CGA62826 and CGA 108906 in S2 being 0.16 and 0.66 respectivelyrefers to average leaching concentration from date of first analysis on 4 November 2010until 1 July 2011 (see note 2 in Table 6).The herbicides bifenox and bentazone and the fungicide epoxiconazole were used in thespring barley sown in 2009. Bifenox was found twice in suctions cups, in concentrationsof 0.034 and 0.036 �g/l, four to six months after the application as well as in twomonitoring wells five months after application, in concentrations of 0.05 and 0.033 �g/l39
(Table A5.2). The metabolite bifenox acid was found once, 0.1 �g/l, in a monitoringwell four months after application, while nitrofen was not detected in any analysedwater sample. Bentazone was absent in all the samples from the monitoring wells (Table20). It was, however, found frequently in samples from suction cups, reaching amaximum of 0.71 �g/l (see Figure 15 in Kjær et al 2011). None of the substances wereleached in yearly average concentrations exceeding 0.1 �g/l (Table 6). Epoxiconazoledid not leaching at Jyndevad, as it was never detected in any of the analysed watersamples.Aclonifen and Cyazofamid both applied on potatoes in 2010 did not leaching during thecurrent monitoring period, as none of the compounds was found in any of the analysedwater samples (Appendix 5.2). The final evaluation awaits an additional year ofmonitoring.May-10May-11
Precipitation & irrigationNov-10Sep-10Jul-10
metalaxJan-11
Simulated percolationMar-11
Apr-10
Precipitation (mm/d)
01020304050600.60.40.20.00.20.01.00.80.60.40.20.0
302520151050Percolation (mm/d)
A
Pesticide (�g/l)
Metalaxyl-M
monitoring wells (detections only)
B
Pesticide (�g/l)
CGA 62826
monitoring wells (detections only)
C
CGA 108906
monitoring wells (detections only)
D
Pesticide (�g/l)
May-10
M1 (0.6-1.6)M2 (2.9-3.9)M5 (3.7-4.7)
M1 (1.6-2.6)M4 (2.4-3.4)M7 (1.6-2.6)
M1 (2.6-3.6)M4 (3.3-4.3)M7 (2.6-3.6)
M2 (1.9-2.9)M5 (2.7-3.7)M7 (3.6-4.6)
Figure 16.Precipitation, irrigation and simulated percolation 1 m b.g.s. (A) together with measured concentrations(�g/l) in downstream (M1, M2 and M4) and upstream monitoring wells (M7) ofmetalaxyl-M(B), CGA 62826 (C)and CGA 108906 (D) at Jyndevad. The numbers in parantheses indicate the depths of the analysed screens. The greenvertical line indicates the date of pesticide application.
40
May-11
Nov-10
Apr-10
Mar-11
Sep-10
Jan-11
Jul-10
Both metalaxyl-M applied on potatoes in 2010 as well as its two degradation product forCGA 62829 and CGA 108909 leached from the root zone (1 m b.g.s.) the two latter inaverage concentrations exceeding 0.1 �g/l (Table 3, Figure 16 and 17). Bothdegradation products were found is suction cups 1 m b.g.s. in the end of the monitoringperiod indication that leaching had not yet ceased.Results from the saturated zone suggested that previous application occurring at upstreams neighbouring fields also have induced leaching to the groundwater ofMetalaxyl-M, CGA 62829 and CGA108909. All three compound were present ingroundwater before metalaxyl-M was applied to the field, they were also detected insamples collected from M7 situated upstream of the field site (Figure 16) and CGA108909 was also found in M5 located north of the field. As the tracer test suggested thatwater sampled in M7 and M5 (uppermost three filters) had not infiltrated at the PLAPsite (Figure 14), but originated from the upstream neighbouring fields where metalaxylhave also been applied (Appendix 7). Moreover, CGA108909 was found in allgroundwater samples collected 27 July. As this sampling was done only 2 days afterapplication and precipitation during this period amounted to only 0.5 mm thesedetections are likely to occur from previous applications as well.Precipitation & irrigationmetalaxSimulated percolation
May-10
Precipitation (mm/d)
1020304050603.0Suction cups - S11 m b.g.s.
252015A1050B
Pesticide (�g/l)
2.01.00.03.0Suction cups - S21 m b.g.s.
C
Pesticide (�g/l)
2.01.00.0
May-10
Metalaxyl-M
CGA 62826
CGA 108906
Figure 17.Precipitation, irrigation and simulated percolation 1 m b.g.s. (A) together with measured concentrations ofMetalaxyl-M,CGA 62826 and CGA 108906. The green vertical line indicates the date of pesticide application.
41
May-11
Nov-10
Apr-10
Sep-10
Jan-11
Jul-10
Mar-11
Percolation (mm/d)
0
May-11
Nov-10
Mar-11
Apr-10
Sep-10
Jan-11
Jul-10
30
The background concentration of CGA 108909 found in all monitoring wells makes itdifficult to determine whether the elevated concentrations observed in downstreammonitoring wells during winter 2010/2011 are due to the metalaxyl-M applied on thePLAP test site in 2010 or to previous application on the “upstream” fields (Figure 7).However, with a background level of CGA 108909 ranging between 0.014–0.14 �g/ladditional input via root zone leaching is likely to increase groundwater concentrationand by this the frequency of exeedance of the 0.1 �g/l in collected groundwatersamples.In total CGA 108909 was found in 90% of analysed groundwater samples and 38% ofanalysed samples had concentration exceeding 0.1 �g/l. CGA 108909 was found in 30%of analysed groundwater samples, concentration being less than 0.1 �g/l however.Metalaxyl was only detected in the upstream well M7, but in high concentrationreaching 0.54 �g/l.When evaluating these results it should be noted that the precipitation following theapplication of metalaxyl-M (applied on 25 July 2010) amounted to 180 mm in August2010 (99% higher than normal) and 149 mm in September 2010 (47% higher thannormal). See Appendix 4 and Table 4.Precipitation & irrigationMar-04Mar-05Mar-06Apr-02Apr-03
RimSMar-07
Simulated percolationMar-08Mar-09Mar-10Mar-11
Precipitation (mm/d)
1020304050600.30.20.10.00.3A
2520151050Suction cups - S11 m b.g.s.
B
Pesticide (�g/l)
Pesticide (�g/l)
Suction cups - S21 m b.g.s.
C
0.20.10.0Apr-02Apr-03Mar-04Mar-05Mar-06Mar-07Mar-08Mar-09Mar-10Mar-11
PPU
PPU-desamido
Figure 18.Precipitation, irrigation and simulated percolation 1 m b.g.s. (A) together with measured concentrations ofPPUandPPU-desamino (�g/l)in suction cups installed 1 m b.g.s. at location S1 (B) and S2 (C) atJyndevad.Thegreen vertical line indicates the date of pesticide application. Open symbols indicate concentrations below the limit ofdetection (0.02 �g/l prior to July 2006 and 0.01 �g/l thereafter).
42
Percolation (mm/d)
0
30
Metalaxyl was on the Danish market from 1980-1995, reported maximum alloweddosage from 1984-1995 being 375 gr. a.i./ha. It re-entered the Danish marked in 2007 asMetalaxyl-M with a maximum allowed dosage of 77.6 g/ha. Since 2006 metalaxyl-Mwas applied at upstream neighboring fields where reported dosage did not exceed themaximum allowed dosage of 77.6 g a.i./ha but evidence of higher dosage used in theperiod 1988 1993 was also reported (Appendix 7). For placing the result into regulatorycontext it would thus be important to judge if measured groundwater residues originfrom initial high usage of 375 g a.i/ha allowed in 1980-1995 or from the current usageof 77.6 g a.i/ha allowed since 2007.Based on available data we believe that detected residues in the groundwater are mostlikely to derive from current usage of metalaxyl allowed since 2007 and not the initialusage allowed from 1980–1995. With an average travel time to all monitoring wellsbeing less than 3 years (Laier et al. in prep) it is unlikely that water sampled from thesescreen have infiltrated the unsaturated zone before 1995 (17 years ago). A possibilitycould however be that the residues originating from the initial usage of 375 g/ha(allowed in 1980-1995) were left in the soil and continued to leached during a longperiod of time.Precipitation & irrigationRimsulfuron app.Simulated percolation
Mar-04
Mar-05
Mar-06
Mar-07
Mar-08
Mar-09
Mar-10
Precipitation (mm/d)
1020304050600.20.10.00.20.10.0Apr-02Apr-03Mar-04Mar-05Mar-06Mar-07Mar-08Mar-09Mar-10Mar-11
2520A151050PPU monitoring wells(detections only)B
Pesticide (�g/l)
Pesticide (�g/l)
PPU-desamino monitoring wells(detections only)
C
M1 (1.6-2.6)M2 (2.9-3.9)M4 (4.4-5.4)M7 (3.6-4.6)
M1 (2.6-3.6)M2 (4.0-5.0)M5 (4.7-5.7)M7 (4.6-5.6)
M1 (3.6-4.6)M4 (2.4-3.4)M7 (1.6-2.6)
M2 (1.9-2.9)M4 (3.3-4.3)M7 (2.6-3.6)
Figure 19.Precipitation, irrigation and simulated percolation 1 m b.g.s. (A) together with measured concentrations(�g/l) in downstream (M1, M2 and M4) and upstream monitoring wells (M7) ofPPU(B) andPPU-desamino(C) atJyndevad.The numbers in parentheses indicate the depths of the analysed screens. The green vertical lines indicatesthe date of pesticide application.
43
Percolation (mm/d)
0
Mar-11
Apr-02
Apr-03
30
Should this be the case the persistency of these compounds would be very high allowingthem to leach more than a decade after application. An assumption which dot notcorrespond the regulatory assessment where final endpoints for DT50were less than 18days Danish EPA (2007).Rimsulfuron was applied on potatoes in 2010 in the same dosage as that used onpotatoes in 2002. Rimsulfuron degrades rapidly in the soil, and the leaching risk istherefore associated with the degradation products PPU and PPU-desamino. Followingthe 2002 application both compounds were characterised by continuous leaching over along period of time. Average yearly concentrations of especially PPU reaching 0.1 �g/lwere seen as long as three years after 2002 application (Rosenbom et al 2010a).Although the concentration decreased during the 2009/2010, PPU could occasional stillbe found in low concentrations. Additional leaching was observed after the 2010application, concentration of PPU reaching 0.084 �g/l and 0.11 �g/l were seen insuction cups S1 and S2 respectively (Figure 18). Final evaluation of the 2010application awaits an additional year of monitoring, as the leaching period of thesemetabolites extent the current monitoring period (Figure 18). During the last monitoringyear PPU were however still frequently found in the groundwater (frequency ofdetection being 59% and concentration level being less that 0.1�g/l), whereas detectionfrequency of PPU-desmino was decreased down to 10% (Figure 19).The results of the 2002 application are summarized in Rosenbomet al.(2010a).
44
4 Pesticide leaching at Silstrup4.1Materials and methods
4.1.1 Site description and monitoring designThe test field at Silstrup is located south of Thisted in north-western Jutland (Figure 1).The cultivated area is 1.69 ha (91 x 185 m) and slopes gently 1–2� to the north (Figure20). Based on two profiles excavated in the buffer zone bordering the field the soil wasclassified as Alfic Argiudoll and Typic Hapludoll (Soil Survey Staff, 1999). The topsoilcontent of clay in the two profiles was 18% and 26%, and the organic carbon contentwas 3.4% and 2.8%, respectively (Table 1). The geological description showed ratherhomogeneous clay till rich in chalk and chert, containing 20–35% clay, 20–40% silt and20–40% sand. In some intervals the till was sandier, containing only 12–14% clay.Moreover, thin lenses of silt and sand were found in some of the wells. The gravelcontent was approx. 5%, but could be as high as 20%. A brief description of thesampling procedure is provided in Appendix 2. The monitoring design and test site aredescribed in detail in Lindhardtet al.(2001) and the analysis methods in Kjæret al.(2002).4.1.2 Agricultural managementManagement practice during the 2010-2011 growing seasons is briefly summarizedbelow and detailed in Appendix 3 (Table A3.3). For information about managementpractice during the previous monitoring periods, see previous reports available onhttp://pesticidvarsling.dk/publ_result/index.html.Having been harrowed twice on 30 March 2009, pig slurry was injected and potassiumbromide applied as a tracer on 2 April. Sowing of spring barley (cv. Keops), undersownwith red fescue (cv. Jasperina), took place on 11 April 2009. The herbicide bentazonewas sprayed on 19 May, when the barley had four detectable tillers. The fungicideazoxystrobin was applied on 24 June, but not included in the monitoring. On 16 July thespring barley was harvested as whole crop, yielding 94.6 hkg/ha (100% DM). The redfescue was later sprayed with the herbicides iodosulfuron on 24 August, four tillersdetectable, and with bifenox on 9 September, five tillers detectable. On 2 May 2010weeds were sprayed with fluazifop-p-butyl and on 5 May with iodosulfuron and MCPA,the latter two were, however, not included in the monitoring. Harvest of grass seedstook place on 20 July, yielding 16.5 hkg/ha of seeds (87% DM). An amount of 69.3hkg/ha of straw (100% DM) was burned in the field on 21 July 2010.
45
Figure 20.Overview of theSilstrupsite. The innermost white area indicates the cultivated land, while the grey areaindicates the surrounding buffer zone. The positions of the various installations are indicated, as is the direction ofgroundwater flow (by an arrow). Pesticide monitoring is conducted weekly from the drainage system (during periodof continuous drainage runoff) and monthly and half-yearly from selected groundwater monitoring wells as describedin Table A2.1 in Appendix 2.
46
4.1.3 Model setup and calibrationCompared with the setup in Kjæret al.(2011), a year of validation was added to theMACRO setup for the Silstrup site. The setup was hereby calibrated for the monitoringperiod May 1999-June 2004 and validated for the monitoring period July 2004-June2011. For this purpose, the following time series have been used: the observedgroundwater table measured in the piezometers located in the buffer zone, soil watercontent measured at three depths (25, 60 and 110 cm b.g.s.) from the two profiles S1and S2 (Figure 20), and the measured drainage flow. Data acquisition, model setup andresults related to simulated bromide transport are described in Barleboet al.(2007).Given impounding of water in the drainage water monitoring well, estimates for themeasured drainage on 11 December 2006, 13-14 December 2006, 28 February 2007, 23October 2011, 13 November 2011 and 11 December 2011 were based on expertjudgement. Additionally, TDR-measurements at 25 cm b.g.s. in the period 15 December2009–20 March 2010 were discarded given freezing soils (soil temperatures at or belowzero degrees Celsius). The soil water content is measured with TDR based on Toppcalibration (Toppet al.,1980), which will underestimate the total soil water content atthe soil water freezing point as the permittivity of frozen water is much less than that ofliquid water (Flerchingeret al.,2006).
4.2
Results and discussion
4.2.1 Soil water dynamics and water balancesThe model simulations were largely consistent with the observed data, thus indicating areasonable model description of the overall soil water dynamics in the unsaturated zone(Figure 21). As in Kjæret al.(2011), the simulated groundwater table of this hydraulicyear was validated against the much more fluctuating groundwater table measured inpiezometer P3, which yielded the best description of measured drainage (Figure 21Band 21C). The first drainage flow period of the past year was well captured by themodel, whereas the magnitude of the second drainage flow period was not captured(Figure 21C). The last period can be characterised by frozen soil and precipitation in theform of snow – a situation, which MACRO has difficulties in describing. Additionally,drainage flow (q) is calculated by means of continuous measurements of the waterheight (h) at a V-notch in the drainage well and a q/h relationship. At events withextreme water flow it may happen that the discharge pipe has inadequate capacity todischarge the water, so that water will rise above the V-notch plate in the drainage well.This was the case during the snowmelt occurring on 11 December 2011, why adequatewater sampling was not possible. At these events the q/h relationship is not valid, andthe drainage flow is estimated at a water height (h) corresponding to themaximum height (h) of the V-notch plate, which could have resulted in anoverestimation of the measured drainage flow. As in the previous monitoring periods,the overall trends in soil water content were described reasonably well (Figure 21D, 21Eand 21F), although the model describe the topsoil as being more wet during the summerperiod than measured by the upper TDR probes (Figure 21D).
47
Figure 21.Soil water dynamics atSilstrup:Measured precipitation and simulated percolation 1 m b.g.s. (A),simulated and measured groundwater level GWT (B), simulated and measured drainage flow (C), and simulated andmeasured soil water saturation (SW sat.) at three different soil depths (D, E and F). The measured data in B derivefrom piezometers located in the buffer zone. The measured data in D, E and F derive from TDR probes installed at S1and S2 (Figure 16). The broken vertical line indicates the beginning of the validation period (July 2004-June 2011).
48
Table 6.Annual water balance forSilstrup(mm/year). Precipitation is corrected to the soil surface according to themethod of Allerup and Madsen (1979).NormalActualMeasuredSimulated Groundwaterprecipitation2)Precipitation evapotranspirationdrainagedrainagerecharge3)1.7.99–30.6.001)9761175457–4432754)1.7.00–30.6.019769094132172322791.7.01–30.6.0297610344702272793381.7.02–30.6.0397687953781742611.7.03–30.6.0497676051714897941.7.04–30.6.059769134911551582671.7.05–30.6.06976808506101952011.7.06–30.6.0797611505393613072491.7.07–30.6.089768774342001842421.7.08–30.6.099769855271612602961.7.09–30.6.109768354022032252301.7.10–30.6.1197610633991725694921)2)
The monitoring started in April 2000.Normal values based on time series for 1961–1990 corrected to soil surface.3)Groundwater recharge calculated as precipitation - actual evapotranspiration - measured drainage.4)Where drainage flow measurements were lacking, simulated drainage flow was used to calculate groundwater recharge.
The resulting water balance for Silstrup for the entire monitoring period is shown inTable 6. Compared with the previous 12 years, the recent hydraulic year July 2010-June2011 was characterised by having the third highest precipitation, the lowest simulatedactual evapotranspiration, and the medium measured drainage. Precipitation of this yearwas characterised by the wettest January monitored at Silstrup in January with morethan 150 mm, and April being very dry (Appendix 4). Due to this precipitation pattern,the simulated percolation pattern of the year July 2010-June 2011 continuouspercolation was simulated from medio September until June (Figure 21A). The climaticsetting of this year gave rise to two long periods with the groundwater table justfluctuating at the drainage level, however, only causing medium measured drainagecompared to the other hydrological years included in PLAP (Figure 21B and 21C).
49
3
Bromide (mg/l)
Suction cups - S1
1 m b.g.s.2 m b.g.s.
A
2103
Suction cups - S2Bromide (mg/l)2103
1 m b.g.s.2 m b.g.s.
B
2103
20100
Horizontal monitoring wells - 3.5 m b.g.s.H1.2H2.2H1.1H2.1H1.3H2.3
Bromide (mg/l)
2
D
1
apr-00
apr-01
apr-02
apr-03
apr-04
apr-05
apr-06
apr-07
apr-08
apr-09
apr-10
Figure 22.Bromide concentration atSilstrup.A and B refer to suction cups located at S1 and S2 (see Figure 16).The bromide concentration is also shown for drainage runoff (C) and the horizontal monitoring wells H1 and H2 (D).In March 2009, bromide measurements in the suction cups were suspended (Appendix 2). The green vertical linesindicate the dates of bromide applications.
4.2.2 Bromide leachingThe bromide concentrations shown in Figure 22 and Figure 23 relate to the bromideapplied in May 2000, as described in previous reports (Kjæret al.2003 and Kjæret al.2004) and further evaluated in Barleboet al.(2007). In Marts 2009, bromidemeasurements in the suction cups and monitoring wells M6 and M11 were suspended.In April 2009, 31.5 kg/ha potassium bromide was applied for the second time.
50
apr-11
0
Drainage runoff (mm/d)
Bromide (mg/l)
Drains
Bromide, time-proportional samplingBromide, flow-proportional samplingDrainage runoff
C
30
2
1.5-2.5 m
3.5-4.5 m
4.5-5.5 m
Bromide (mg/l)
M51
02M91
Bromide (mg/l)
mar-01
mar-02
mar-03
mar-04
mar-05
mar-06
apr-00
feb-07
feb-08
feb-09
feb-10feb-10feb-10
2
Bromide (mg/l)
M10
1
mar-01
mar-02
mar-03
mar-04
mar-05
mar-06
apr-00
feb-07
feb-08
feb-09
2
Bromide (mg/l)
M12
1
apr-00
feb-07
feb-08
feb-09
mar-02
mar-03
mar-01
mar-04
mar-05
Figure 23.Bromide concentration atSilstrup.The data derive from the vertical monitoring wells (M5–M12). InSeptember 2008, monitoring wells M6 and M11 were suspended (Appendix 2). Screen depth is indicated in m b.g.s.The green vertical lines indicate the date of bromide applications.
4.2.3 Pesticide leachingMonitoring at Silstrup began in May 2000 and presently encompasses several pesticidesand their degradation products, Appendix 8. Pesticide application during the most recentgrowing seasons, 2009/2010 and 2010/2011, is listed in Table 7 and shown togetherwith precipitation and simulated percolation in Figure 24. It should be noted thatprecipitation in Table 7 is corrected to soil surface according to Allerup and Madsen(1979), whereas percolation (1 m b.g.s.) refers to accumulated percolation as simulatedwith the MACRO model. Moreover, pesticides applied later than April 2011 are notevaluated in this report and hence not included in Table 7.
51
mar-06
feb-11
0
feb-11
0
feb-11
0
May
Aug
Nov
0Precipitation (mm/d)
Mar
Dec
Apr
Sep
Feb
Oct
Jun
Jan
Jul
30202009/20101510503020152010/20111050PrecipitationBentazone (2009)Iodosulfuron-methyl-sodium (2010)Azoxystrobin (2009)Iodosulfuron-methyl-sodium (2009)Simulated percolationBifenox (2009)Fluazifop-P-butyl (2010)
20304050600
Precipitation (mm/d)
2030405060
Figure 24.Application of pesticides included in the monitoring programme, precipitation and irrigation (primaryaxis) and simulated percolation 1 m b.g.s. (secondary axis) atSilstrupin 2009/2010 (upper) and 2010/2011 (lower).
It should also be noted that as fluazifop-P-butyl (Fusilade Max) degrade rapidly, theleaching risk is associated with their respective degradation products fluazifop-P, andTFMP rather than the parent products. For the same reasons the degradation productsand not the parent compounds are monitored in the PLAP (Table 9).The current report focuses on the pesticides applied from 2009 and onwards, while theleaching risk of pesticides applied in 2008 and before has been evaluated in previousmonitoring reports (see http://pesticidvarsling.dk/publ_result/index.html).Fluazifop-P-butyl, a herbicide used against monocotyledons, in this case couch grass(Agropyrum repens, L.), has been included in the PLAP several times over the past 10years. As fluazifop-P-butyl rapidly degrades, focus has so far been on its degradationproduct fluazifop-P (free acid). Similar to the 2000/2001 growing season at Silstrup(Kjæret al.,2003), this compound, was found in neither drainage water (Figure 25B)nor groundwater (Figure 25D). When applying fluazifop-P-butyl in July 2008 andincluding its degradation product TFMP in the monitoring programme, a differentpicture emerged (Figure 25C and Figure 25D). At the onset of the drainage flow on 11September 2008, a concentration of 0.52 �g/l TFMP was found. Concentrationsremained above 0.1 �g/l throughout the period of drainage runoff. Further, TFMP wasfound in the screens of the vertical monitoring wells M5.1 (1.5 to 2.5 m b.g.s) and M5.2(2.5 to 3.5 m b.g.s.) more than one month prior to the detection in the drainage water, inconcentrations of 0.11 and 0.064 �g/l, respectively (Figure 25C).52
Percolation (mm/d)
10
25
Percolation (mm/d)
10
25
Table 7.Pesticides analysed at Silstrup. Precipitation (precip.) and percolation (percol.) are accumulated within thefirst year (Precip 1styear, Percol 1styear) and first month (Precip 1stmonth, Percol 1styear) after the first application.Cmeanrefers to average leachate concentration at 1 m b.g.s. the first year after application. See Appendix 2 forcalculation method and Appendix 8, Table A8.3 for previous applications of pesticides.CropAppliedAnalysedApplica- End ofY 1stY 1stM 1stM 1stCmeanproductpesticidetion date monit. precip. percol. precip. percol.Chlormequat(P)Apr 07 Jun 08966 382303<0.01Winter Wheat 2007Cycocel 750Hussar ODOpusFodder Beet 2008Fusilade MaxGoliathIodosulfuron-methyl(P) Apr 07Metsulfuron-methyl(P) Apr 07Epoxiconazole(P)Fluazifop-P(M)TFMP(M)Metamitron(P)Desamino-metamitron(M)Triflusulfuron-methyl(P)IN-D8526(M)IN-E7710(M)IN-M7222(M)Tramat 500 SC Ethofumesate(P)Spring Barley 2009AmistarFighter 480Red Fescue 2010Fox 480 SCAzoxystrobin(P)CyPM(M)Bentazone(P)Bifenox(P)Bifenox acid(M)Nitrofen(M)Fusilade MaxHussar ODFluazifop-P(M)TFMP(M)Jun 07Sep 06Jul 08Jul 08Stomp Pentagon Pendimethalin(P)Oct 10Oct 10Apr 09Apr 08Jun 11*Jun 11**
96696694711669859859699699699699699699798358358768888888881027102789889889810241024
382382407508494494498498498498498498497390390391390390390520520390390390520520
30301731111051054343434343436861618556565653532727274949
3300212144444430010002200011
<0.01<0.01<0.010,04<0.010,240,010,02<0.01<0.01<0.01<0.02<0.010,010,060,03<0.022,26<0.01<0.01<0.02<0.01<0.01<0.01<0.01<0.01
May 08 Jun 11
May 08 Jun 11*Maj 08Jun 10
Safari
May 08 Jun 10May 08 Jun 10May 08 Jun 10May 08 Dec 10Jun 09Jun 09Sep 09Sep 09Sep 09Jun 11*Jun 11*Jun 11*
May 09 Jun 11Jun 11*Jun 11*
May 10 Jun 11*May 10 Jun 11*
Iodosulfuron-methyl(P) Aug 09 Dec 10Metsulfuron-methyl(M) Aug 09 Dec 10Triazinamin (M)Aug 09 Dec 10
Hussar OD
Iodosulfuron-methyl(P) May 10 Dec 10Metsulfuron-methyl(P) May 10 Dec 10
Systematic chemical nomenclature for the analysed pesticides is given in Appendix 1.*Monitoring continue the following year.
With the groundwater table minimum 1.6 m b.g.s., the root zone being relatively dry,and with percolation 1 m b.g.s. in July-August 2008 (Figure 21 and Figure 25A), thisindicates pronounced macro pore transport bypassing the tile drainage system.During the summer of 2009 there was no drainage flow. However, at the onset of flowin the autumn of 2009, TFMP was still present (Figure 25C), the last detection being0.023 �g/l on 2 December 2009. Since 18 March 2009 there has been no exceedance ofthe 0.1 �g/l in the drainage water, and since 1 April 2009 in the groundwater. The mostrecent detection of TFMP was 0.03 �g/l on 1 December 2009. The average leachingconcentration in drainage water within the first year of application of fluazifop-p-butyl,amounted to 0.24 �g/l of TFMP (Table 7). Maximum concentration of TFMP in thegroundwater at Silstrup was 0.29 �g/l (Table 18).53
May-08
Apr-09
Apr-10
Apr-11
Oct-08
Oct-09
Oct-10
Jan-09
Jan-10
Jan-11
Jul-08
Jul-09
Jul-10
Precipitation (mm/d)
010203040501
7545Percolation (mm/d)DR(mm/d)DR (mm/d)
6030150322416B
A
Pesticide (�g/l)
Fluazifop-P (free acid)Drains
0.1
80322416
0.01
1Pesticide (�g/l)
TFMPDrains
0.1C
80
0.01Pesticide concentrationDrainage runoff (DR)
1
Pesticide (�g/l)
TFMPMonitoring wells (detections only)
0.1D
0.01
May-08
Apr-09
Apr-10
M5 (1.5-2.5 m)H1 (3.5 m b.g.s.)
M5 (2.5-3.5 m)H2 (3.5 m b.g.s.)
M5 (3.5-4.5 m)
Figure 25.Precipitation and simulated percolation 1 m b.g.s. (A) together with the concentration of fluazifop-P (freeacid) (B) and TFMP (C) in the drainage runoff, and the concentration of TFMP (D) in the groundwater monitoringscreens atSilstrup.The green vertical lines indicate the dates of fluazifop-P-butyl applications. Values below thedetection limit of 0.01 �g/l are shown as 0.01�g/l (all graphs) and further represented by open symbols in A, B and C.
An application of fluazifop-P-butyl on 2 May 2010 did not cause any detections of itsmetabolite fluazifop-P (free acid) in drainage water, in line with observations followingthe 2008 application (Figure 25B). Another metabolite, TFMP, was found just once 30September, in a diminutive amount of drainage water (Figure 25C), concentration being0.061�g/l. TFMP was this year not found at all in the groundwater (Figure 25D) therebydeviating from results following the application of fluazifop-P-butyl in 2008. Anexplanation may lye in the differences in applied dosage as well as the precipitation andpercolation patterns before as well as after the two applications. Autumn 2008 theDanish EPA enforced considerable restriction on the application of fluazifop-P-buthylby reducing maximum allowed dosage by 50%. Dosage used in 2010 was thus 50%lower than that in 2008, thereby minimising the risk of leaching.54
Apr-11
Oct-08
Oct-09
Oct-10
Jul-08
Jan-09
Jul-09
Jan-10
Jul-10
Jan-11
Aug-09
Aug-10
Dec-09
Dec-10
Apr-10
Apr-11
Feb-10
Feb-11
Oct-09
Oct-10
Jun-10
Jun-11
Jul-09
Precipitation (mm/d)
0102030405010
7560453015
A
Pesticide (�g/l)
0.1
1003020100Pesticide concentrationDrainage runoff (DR)
0.0110
Pesticide (�g/l)
0.1
0.0110BifenoxMonitoring wells(detections only)
Pesticide (�g/l)
10.10.0110
D
Pesticide (�g/l)
E
10.1
Bifenox-acidMonitoring wells(detections only)
0.01
Aug-09
Aug-10
Apr-10
Jun-10
Apr-11
Oct-09
Dec-09
Oct-10
Dec-10
Feb-10
H1 (3.5 m b.g.s.)M5 (4.5-5.5 m)M10 (1.5-2.5 m)
M5 (1.5-2.5 m)M9 (1.5-2.5 m)M10 (2.5-3.5 m)
M5 (2.5-3.5 m)M9 (3.5-4.5 m)
Figure 26.Precipitation and simulated percolation 1 m b.g.s. (A) together with the concentration of bifenox (B) andbifenox-acid (C) in the drainage runoff, and the concentration of bifenox (D) and bifenox-acid (E) in the groundwatermonitoring screens atSilstrup.The green vertical line indicates the date of bifenox application. Values below thedetection limit of 0.01 �g/l are shown as 0.01 �g/l (all graphs) and further represented as open symbols in B and C.
55
Feb-11
M5 (3.5-4.5 m)M9 (4.5-5.5 m)
Jun-11
Jul-09
DR (mm/d)
1
C
Bifenox-acidDrains
DR (mm/d)
1
B
BifenoxDrains
03020
Percolation (mm/d)
In 2008 preferential flow transferred the pesticide from the surface firstly togroundwater and secondly to the tile drains. Although both the accumulated amount ofprecipitation within the first month following the spraying was as well as the totalprecipitation was higher in 2010 than 2008 (Table 7), the amount of percolation in thefirst month following the 2008 spraying was double that of n 2010 spraying. As is seenfrom Figure 25A, there was virtually neither percolation nor drainage flow for a periodof approximately 4.5 months following the 2010 spraying.Since the application of the herbicide bifenox in the spring barley on 9 September 2009,there has been a single detection in drainage water sampled on 19 November 2009(Figure 26B) and in samples from 5 groundwater screens in three different wells on 30September (Figure 26D), whereof one reached 0.1 �g/l. The degradation productbifenox acid was found in groundwater in the screens of both horizontal and verticalwells (Figure 26E). Four of the five detections from the horizontal wells exceeded 0.1�g/l, maximum, concentrations being 0.86 �g/l. Concentrations found in the verticalwells were even higher, amounting to 3.1 �g/l. The bifenox acid appeared in thegroundwater before it was found in drainage water, in this case seven days earlier. Sincethe aforementioned detections neither bifenox nor bifenox acid has been found in any ofthe water samples.Bentazone applied on 19 May 2009 had also been applied in May 2003. Although theamount of active ingredient was the same in both years, the 2003 application wasfollowed by concentrations that were above 0.1 �g/l in both drainage and groundwater(Kjær et all, 2005), as opposed to the 2009 application where 0.1 �g/l was neverexceeded (Figure 27B, 27E and Table 9). These results may reflect the importance ofdifferent climatic conditions following a spraying.Azoxystrobin, applied on 24 June 2009, as well as it metabolite CyPM were found indrainage water (Figure 27C and 27D). The concentrations of the metabolite weregenerally higher than those of the parent compound. All concentrations but one ofCyPM were below 0.1 �g/l. Average yearly concentrations in drainage water amountedto 0.01 and 0.06 for azoxystrobin and CyPM, respectively (Table 7), which is about thesame as for the two previous applications in 2004 and 2005 (Table 7). Whereas therewere no detections of azoxystrobin in the groundwater, CyPM could be found in bothhorizontal and vertical wells, concentrations ranging between 0.013 and 0.086 �g/l and0.011 and 0.1 �g/l, respectively. Leaching pattern of Azoxystrobin and CYPM is givenin Flindt Jørgensen et al 2011.When evaluating the leaching occurring during the 2009/2010 drainage season (Figure25–27) it should be noted that the large drainage event that took place during thesnowmelt on 12 March 2010 (28 mm/d) could not be sampled due to technical problemscaused by the extreme intensity of the drainage runoff. Likewise the drainage runoffcould not be measured, and the estimated value for this day is likely to be overestimated(see section 4.2.1 for details).
56
May-03
Apr-04
Apr-05
Apr-06
Apr-07
Apr-08
Apr-09
Apr-10
Precipitation (mm/d)
10203040501010.10.011
604530153020100321680321680Pesticide concentrationDrainage runoff (DR)
0
Pesticide (�g/l)
Pesticide (�g/l)
0.10.011
Pesticide (�g/l)
0.10.01
Pesticide (�g/l)
1E0.10.01
BentazoneMonitoring wells(detections only)
Pesticide (�g/l)
1
F
0.1
CyPMMonitoring wells - detections only
May-03
Apr-04
Apr-05
Apr-06
Apr-07
Apr-08
Apr-09
Apr-10
M5 (1.5-2.5 m)H2 (3.5 m b.g.s.)
M5 (2.5-3.5 m)M10 (1.5-2.5 m)
M5 (3.5-4.5 m)M9 (1.5-2.5 m)
H1 (3.5 m b.g.s.)
Figure 27.Precipitation and simulated percolation 1 m b.g.s. (A) together with the concentration of bentazone (B),azoxystrobin (C) and CyPM (D) in the drainage runoff, and the concentration of bentazone (E) and CyPM (F) in thegroundwater monitoring screens atSilstrup.The green vertical lines indicate the dates of bentazone and azoxystrobinapplications. Values below the detection limit of 0.01 �g/l are shown as 0.01�g/l (all graphs) and further representedas open symbols in B.
57
Apr-11
0.01
DR(mm/d)
D
CyPMDrains
24
DR (mm/d)
C
AzoxystrobinDrains
24
DR (mm/d)
B
BentazoneDrains
Percolation (mm/d)
0
Apr-11
A
75
58
5 Pesticide leaching at Estrup5.1Materials and methods
5.1.1 Site description and monitoring designEstrup is located in central Jutland (Figure 1) west of the Main Stationary Line on a hill-island, i.e. a glacial till preserved from the Weichselian Glaciation. Estrup has thus beenexposed to weathering, erosion, leaching and other geomorphological processes for amuch longer period than the other sites. The test field covers a cultivated area of 1.26 ha(105 x 120 m) and is virtually flat (Figure 28). The site is highly heterogeneous withconsiderable variation in both topsoil and aquifer characteristics (Lindhardtet al.,2001). Such heterogeneity is quite common for this geological formation, however.Based on three profiles excavated in the buffer zone bordering the field the soil wasclassified as Abrupt Argiudoll, Aqua Argiudoll and Fragiaquic Glossudalf (Soil SurveyStaff, 1999). The topsoil is characterised as sandy loam with a clay content of 10–20%,and an organic carbon content of 1.7–7.3%. A C-horizon of low permeability alsocharacterises the site. The saturated hydraulic conductivity in the C-horizon is 10-8m/s,which is about two orders of magnitude lower than at the other loamy sites (Table 1).The geological structure is complex comprising a clay till core with deposits of differentage and composition (Lindhardtet al.,2001). A brief description of the samplingprocedure is provided in Appendix 2. The monitoring design and test site are describedin detail in Lindhardtet al.(2001) and the analysis methods in Kjæret al.(2002). Pleasenote that the geological conditions only allowed one of the planned horizontal wells tobe installed.5.1.2 Agricultural managementManagement practice during the 2010-11 growing seasons is briefly summarized belowand detailed in Appendix 3 (Table A3.4). For information about management practiceduring the previous monitoring periods, see previous monitoring reports available onhttp://pesticidvarsling.dk/publ_result/index.html.On the 24 August 2009 the field was ploughed and rotor-harrowed and sown withwinter rape (cv. Cabernet). The following day the herbicide clomazone was applied butnot included in the monitoring. The herbicide bifenox was used on 30 September whenfour leaves had unfolded. Pesticide treatment was applied on 9 October usingcypermethrin, but the substance was not monitored. Due to poor overwintering of thewinter rape, the field was partially resown on 20 April 2010 using the spring rapevariety Pluto.An area of 2.265 m2was resown after a rotor-harrowing, whereas an area of 2.412 m2was resown without soil cultivation – direct seeding. The resown area amounted to 37%of the total field area. Thiacloprid was used against pests on 10 May and included in themonitoring programme. Harvest of the rape was a two-step procedure. On 23 Augustthe area grown with winter rape was harvested, yielding 38.3 hkg/ha (91% DM) and41.8 hkg being shredded at harvest (100% DM). On 23 August the section of the field59
grown with spring rape was shredded, and the resulting biomass of 11.64 hkg/ha spreadon the surface. The field was ploughed on 14 September 2010.On the same day the seedbed was prepared and the field was sown with winter wheat(cv. Frument). On the 25 September the crop emerged, whereas on the 30 September,when first leaf was through the coleoptiles, the herbicide tribenuron-methyl wassprayed.
Figure 28.Overview of theEstrupsite. The innermost white area indicates the cultivated land, while the grey areaindicates the surrounding buffer zone. The positions of the various installations are indicated, as is the direction ofgroundwater flow (by an arrow). Pesticide monitoring is conducted weekly from the drainage system (during periodof continuous drainage runoff) and monthly and half-yearly from selected groundwater monitoring wells as describedin Table A2.1 in Appendix 2.
60
5.1.3 Model setup and calibrationThe numerical model MACRO (version 5.1, Larsboet al.,2005) was applied to theEstrup site covering the soil profile to a depth of 5 m b.g.s., always including thegroundwater table. The model is used to simulate the water flow in the unsaturated zoneduring the monitoring period from July 2000-June 2011 and to establish an annual waterbalance.Compared to the setup in Kjæret al.(2011), a year of validation was added to theMACRO setup for the Estrup site. The setup was subsequently calibrated for themonitoring period May 1999-June 2004 and validated for the monitoring period July2004-June 2011. For this purpose, the following time series have been used: theobserved groundwater table measured in the piezometers located in the buffer zone,measured drainage flow, and soil water content measured at two depths (25 and 40 cmb.g.s.) from the soil profile S1 (Figure 28). The TDR probes installed at the other depthsyielded unreliable data with saturations far exceeding 100% and unreliable soil waterdynamics with increasing soil water content during the drier summer periods (data notshown). No explanation can presently be given for the unreliable data, and they havebeen excluded from the analysis. The data from the soil profile S2 have also beenexcluded due to a problem with water ponding above the TDR probes installed at S2, asmentioned in Kjæret al.(2003). Finally, TDR-measurements at 25 cm b.g.s. inFebruary 2010 were discarded given freezing soils (soil temperatures at or below zerodegrees Celsius). The soil water content is measured with TDR based on Toppcalibration (Toppet al.,1980), which will underestimate the total soil water content atthe soil water freezing point as the permittivity of frozen water is much less than that ofliquid water (Flerchingeret al.,2006).Because of the erratic TDR data, calibration data are limited at this site. Dataacquisition, model setup as well as results related to simulated bromide transport aredescribed in Barleboet al.(2007).
5.2
Results and discussion
5.2.1 Soil water dynamics and water balancesThe model simulations were generally consistent with the observed data (which werelimited compared to other PLAP sites, as noted above), indicating a good modeldescription of the overall soil water dynamics in the unsaturated zone (Figure 29). Themodel provided an acceptable simulation of the overall level of the groundwater table.As in the previous hydrological year, a drop in the measured groundwater table wasseen after short periods of low precipitation (Figure 29B). Also here the simulatedgroundwater table did not seem as sensitive to these short periods of low precipitationand tended not to drop as much as the measured values. Since the subsoil TDR data arelimited, a more detailed study of soil water dynamics in these layers is difficult.However, the overall soil water saturation at 25 and 40 cm b.g.s. was captured (Figure29D and 29E), except for the drop in water saturation at 25 cm b.g.s. in April-June2011. Nothing special is noted for the groundwater table in the latest monitoring period(July 2010-June 2011). As in previous years (Kjæret al.,2011), the simulatedgroundwater table often fluctuates slightly above the drain depth during periods ofdrainage flow.61
Figure 29.Soil water dynamics atEstrup:Measured precipitation and simulated percolation 0.6 m b.g.s. (A),simulated and measured groundwater level (B), simulated and measured drainage flow (C), and simulated andmeasured soil saturation (SW sat.) at two different soil depths (D and E). The measured data in B derive frompiezometers located in the buffer zone. The measured data in D and E derive from TDR probes installed at S1 (Figure23). The broken vertical line indicates the beginning of the validation period (July 2004-June 2011).
62
Table 8.Annual water balance forEstrup(mm/year). Precipitation is corrected to the soil surface according to themethod of Allerup and Madsen (1979).NormalActualMeasuredSimulated Groundwaterprecipitation2)Precipitation evapotranspirationdrainagedrainagerecharge3)1.7.99–30.6.001)9681173466–5531544)1.7.00–30.6.019688874203563401111.7.01–30.6.0296812905165055552701.7.02–30.6.039689394663293461441.7.03–30.6.049689284992983121311.7.04–30.6.059681087476525468861.7.05–30.6.069688974412583411991.7.06–30.6.0796813655155476183031.7.07–30.6.089681045478521556461.7.08–30.6.099681065480523362621.7.09–30.6.1096811905334995231581.7.10–30.6.1196811584862103414621)2)
Monitoring started in April 2000.Normal values based on time series for 1961–1990 corrected to the soil surface.3)Groundwater recharge is calculated as precipitation minus actual evapotranspiration minus measured drainage.4)Where drainage flow measurements are lacking, simulated drainage flow was used to calculate groundwater recharge.
The simulated drainage (Figure 29C) matched the measured drainage flow quite wellduring fall 2010. Drainage flow measured in connection with snowmelt was either notcaptured by MACRO as on the 11 December 2010 or overestimated in magnitudeduring spring 2011. In the latter case the initiation of fluctuations in the drainage flowwas captured. The periods preceding these drainage periods can be characterised byfrozen soil and precipitation in the form of snow – a situation which MACRO hasdifficulties in describing. Drainage runoff over the whole monitoring period was highcompared to that of the other two till sites investigated in the PLAP. This was due to asignificantly lower permeability of the C-horizon than of the overlying A and Bhorizons (see Kjæret al.(2005c) for details).The resulting water balance for Estrup for the entire monitoring period is shown inTable 10. Compared with the previous eleven years, the latest hydraulic year July 2010-June 2011 was characterised by having the fourth-highest precipitation, the mediumsimulated actual evapotranspiration and lowest measured drainage. With MACRO notbeing able to capture drainage flow in connection with snowmelt resulted that thesimulated drainage flow was largely overestimated. Precipitation in this year wascharacterised by January-February being very wet and Marts-April being very dry(Appendix 4). Due to this precipitation pattern, the simulated percolation pattern of theyear July 2010-June 2011 resulted in continuously percolation from the end of August2010 until the end of June 2011 (Figure 29A).
63
3
Suction cups - S1
1 m b.g.s.
2 m b.g.s.
Bromide (mg/l)
A
210
3Bromide (mg/l)
210432101/04/2000
Suction cups - S2
1 m b.g.s.
2 m b.g.s.
B
Bromide (mg/l)
C
483624120
02/04/2001
03/04/2002
04/04/2003
04/04/2004
05/04/2005
06/04/2006
07/04/2007
07/04/2008
08/04/2009
09/04/2010
Bromide (mg/l)
H1.2
H1.1
H1.3
210
Horizontal wells3.5 m b.g.s.
D
Apr-00
Apr-01
Apr-02
Apr-03
Apr-04
Apr-05
Apr-06
Apr-07
Apr-08
Apr-09
Apr-10
Figure 30.Bromide concentration atEstrup.A and B refer to suction cups located at S1 and S2, respectively. Thebromide concentration is also shown for drainage runoff (C) and the horizontal monitoring well H1 (D). In September2008, bromide measurements in the suction cups were suspended (Appendix 2). The green vertical lines indicate thedates of bromide applications.
5.2.2 Bromide leachingBromide has now been applied three times at Estrup. The bromide concentrationsmeasured up to October 2005 (Figure 30 and Figure 31) relate to the bromide applied inspring 2000, as described further in Kjæret al.(2003) and Barleboet al.(2007). InMarch 2009, bromide measurements in the suction cups and monitoring wells M3 andM7 were suspended.
64
Apr-11
10/04/2011
03
Drainage runoff (mm/d)
5
Bromide, time-proportional samplingBromide, flow-proportional samplingDrainagerunoff
Drains
60
1.5-2.5 m b.g.s
2.5-3.5 m b.g.s
3.5-4.5 m b.g.s
4.5-5.5 m b.g.s
Bromide (mg/l)
2102
M2
Bromide (mg/l)
M410210M5
Bromide (mg/l)
Bromide (mg/l)
2M610
Apr-00
Apr-01
Apr-02
Apr-03
Apr-04
Apr-05
Apr-06
Apr-07
Apr-08
Apr-09
Apr-10
Figure 31.Bromide concentration atEstrup.The data derive from the vertical monitoring wells (M2–M6). Screendepth is indicated in m b.g.s. In September 2008, monitoring wells M3 and M7 were suspended (Appendix 2). Thegreen vertical lines indicate the dates of bromide applications.
5.2.3 Pesticide leachingMonitoring at Estrup began in May 2000. Pesticides and degradation productsmonitored so far can be seen from Table 9 (2007-2011) and Appendix 8, Table A8.4(2000-2007). Pesticide application during the most recent growing seasons (2007/2010and 2010/2011) is shown together with precipitation and simulated precipitation inFigure 32. It should be noted that precipitation is corrected to the soil surface accordingto Allerup and Madsen (1979), whereas percolation (0.6 m b.g.s.) refers to accumulatedpercolation as simulated with the MACRO model (Section 5.2.1). Moreover, pesticidesapplied later than April 2011 are not evaluated in this report and hence not included inTable 9.
65
Apr-11
Table 9.Pesticides analysed at Estrup. Precipitation (precip.) and percolation (percol.) are accumulated within thefirst year (Precip 1styear, Percol 1styear) and first mount (Precip 1stmonth, Percol 1styear) after the first applicationCmeanrefers to average leachate concentration at 1 m b.g.s. the first year after application. See Appendix 2 forcalculation method and Appendix 8, (Table A8.4) for previous applications of pesticides.CropAppliedAnalysedApplica- End ofY 1stY 1stM 1stM 1stCmeanproductpesticidetion date monit.precip percol precip percolMesosulfuron-methyl(P)Oct 06Jul 08142030590290.01Winter Wheat 2007Atlantis WGMesosulfuron(M)Cycocel 750OpusWinter Wheat 2008AmistarChlormequat(P)Epoxiconazole(P)Azoxystrobin(P)CyPM(M)Folicur EC 250 Tebuconazole(P)Pico 750 WGRoundup MaxSpring Barley 2009AmistarBasagran M75Fox 480 SCPicolinafen(P)CL153815(M)Glyphosate(P)AMPA(M)Azoxystrobin(P)CyPM(M)Bentazone(P)Bifenox(P)Bifenox acid(M)Nitrofen(M)Winter Rape 2010Biscaya OD 240 Thiacloprid(P)M34(M)Thiacloprid-amide(M)Winter Wheat 2011Express STTriazinamin-methyl(M)1)Oct 06Apr 07May 07Jun 08Jun 08Nov 07Oct 07Oct 07Sep 07Sep 07Jun 09Jun 09May 09May 09May 09May 09May 10May 10May 10Sep 10Jul 08Jul 08Jun 11*Jun 11*Mar 10Mar 10Mar 10Jun 11*Jun 11*Jun 11*Jun 11Jun 11Jun 11*Jun 11*Jun 11*Jun 11**
14201261115410931093132512531253120012001215121512221243124312431083108310831083823
305287299232232275267267261261235235238246246246196196196196176
9031154888810376761131136060838787874343434397
29029003124242929004161616000031
<0.02<0.010.020.060.480.440.030.240.190.130.040.410.05<0.020.16<0.01<0.01<0.02<0.1<0.010.01
Jun 11*Jun 11*Jun 11*Jun 11*
Thiacloprid sulfonic acid(M) May 10
Systematic chemical nomenclature for the analysed pesticides is given in Appendix 1.1)Degradation product of tribenuron-methyl. The parent degradte to rapidly to be detected by monitoring.*Monitoring continue the following year.
The current report focuses on pesticides applied from 2009 and onwards, while leachingrisk of pesticides applied in 2008 and before has been evaluated in previous monitoringreports (see http://pesticidvarsling.dk/publ_result/index.html).Azoxystrobin has now been applied four times at Estrup: 22 June 2004, 29 June 2006,13 June 2008 and 4 June 2009 (Figure 33). The last application before then was in June1998 (Lindhardtet al.,2001). Following all four applications azoxystrobin and themetabolite CyPM leached to the depth of the drainage system at the onset of drainagedue to infiltration of excess rain. Concentrations in drainage water of both parent andmetabolite are shown in Figure 33. The maximum measured concentration ofazoxystrobin was 1.4 �g/l on 24 August 2006 and 2.1 �g/l of CyPM on 11 September2008.
66
May
Aug
Nov
0Precipitation (mm/d)
Mar
Dec
Apr
Sep
Feb
Oct
Jun
Jan
Jul
3020152009/201010503020152010/20111050PrecipitationThiacloprid (2010)Azoxystrobin (2009)Tribenuron-methyl (2010)Bifenox (2009)Simulated percolationBentazone (2009)
20304050600
Precipitation (mm/d)
2030405060
Figure 32.Application of pesticides included in the monitoring programme and precipitation (primary axis) togetherwith simulated percolation 0.6 m b.g.s. (secondary axis) atEstrupin 2009/2010 (upper) and 2010/2011 (lower).
Within the year of application as well as the following year, the average concentrationsof CyPM in drainage water were higher than of azoxystrobin (Figure 33B and 33C),indicating its higher persistence. Differences in persistence for the two substances isfurther underlined by the fact that only one of 467 groundwater samples containedazoxystrobin (0.011 �g/l–data not shown) whereas 11 contained CyPM, maximumconcentration being 0.09 �g/l, Figure 33D and Table A5.4. The leaching pattern ofAzoxystrobin and CyPm is further described in Jørgensen et al 2012.The herbicide bifenox was used on 1 May and on 30 September 2009. Less than twoweeks later 0.15 �g/l of bifenox was detected in the drainage water (Figure 34B).Following the second application, bifenox was found twice, this time in concentrationsless than 0.1 �g/l. The metabolite bifenox acid was found in connection with a smalldrain flow event on 9 September 2009 at a concentration of 1.9 �g/l (Figure 34C),whereas bifenox was below the detection limit of 0.01 �g/l. Following the application inSeptember there were only two detections of bifenox, both less than 0.1 �g/l (Figure34B), whereas eight out of ten bifenox acid detections were above 0.1 �g/l (Figure34C). Bifenox acid leached from the root zone to the drainage system in an averageconcentration of 0.16 �g/l in the drainage water, whereas the figure for bifenox was<0.02 �g/l (Table 9). Neither bifenox nor bifenox acid was found in the groundwatermonitoring screens.
67
Percolation (mm/d)
10
25
Percolation (mm/d)
10
25
May-08
May-10
Aug-05
Dec-04
Dec-06
Apr-04
Apr-06
Sep-07
Sep-09
Precipitation (mm/d)
Feb-11
Jan-09
122436486010A
2418126060AzoxystrobinDrainsB402006040200
Pesticide (�g/l)
0.10.011010.10.01CyPMDrainsC
Pesticide (�g/l)
Aug-05
May-08
May-10
Dec-04
Dec-06
Sep-07
Sep-09
Apr-04
Apr-06
10
Pesticide concentration
Drainage runoff (DR)
Pesticide (�g/l)
10.1
1
0.1
CyPMMonitoring wells(detections only)Sep-04Aug-05
D
May-08Mar-06
May-10Mar-07
Apr-06Mar-05
Apr-04Apr-04
Jun-05Dec-06
Sep-05Sep-07
Jun-06Jan-09
Sep-06Sep-09
Dec-04
Dec-05
M5 (1.5-2.5 m)M4 (1.5-2.5 m)
H1 (3.5 m b.g.s.)M6 (1.5-2.5 m)
M5 (2.5-3.5 m)
Figure 33.Precipitation and simulated percolation 0.6 m b.g.s. (A) together with concentration of azoxystrobin (B)and CyPM (C) in the drainage runoff (DR on the secondary axis) atEstrup.Detections of CyPM in groundwatermonitoring screen are indicated in D. Azoxystrobin was only detected once in groundwater monitoring screens (seetext). The green vertical lines indicate the dates of applications. Open symbols in B and C indicate values below thedetection limit of 0.01 �g/l.
The highest concentration in drainage water of bentazone following the 14 May 2009application was 0.16 �g/l in connection with a small drain flow event in September2009 (Figure 34D). None of the subsequent concentrations were above 0.1 �g/l and theaverage yearly concentrations amounted to 0.05 �g/l (Table 9). The second yearfollowing the application bentazone was still leaching to the drainage water (Figure 34),11 of 17 samples containing bentazone in the range 0.011 to 0.025 �g/l. t Within thefirst year after application bentazone was found four times in groundwater monitoringscreens; concentrations did, however, not exceed 0.1 �g/l (Table A5.4, Appendix 5).
68
Dec-06
Jun-07Feb-11
Dec-04Jul-04
0.010.01
Feb-11
Jan-09
3020100
DR (mm/d)
DR (mm/d)
1
Percolation (mm/d)
0
30
Mar-09
Mar-10
Mar-11
Dec-09
Dec-10
Sep-09
Sep-10
Jun-09
Jun-10
Precipitation (mm/d)
Jun-11
010203040
20161284060300
A
Pesticide (�g/l)
Bifenox
B
0.10.01
Pesticide (�g/l)
1010.1
Bifenox-acid
C
906030060300
Pesticide (�g/l)
Bentazone
D
0.10.01
Jun-09
Jun-10
Dec-10
Mar-09
Pesticide concentration
Mar-10
Drainage runoff (DR)
Figure 34.Precipitation and simulated percolation (A) together with concentration of bifenox (B), bifenox-acid (C)and bentazone (E) in the drainage runoff (DR on the secondary axis) atEstrupin 2004/2010. The green vertical linesindicates the dates of applications. Open symbols indicate values below the detection limit of 0.01 �g/l. Whilebifenox and bifenox-acid were not detected in any samples from groundwater monitoring, bentazone was detected infour samples (see text).
The herbicide glyphosate has now been applied at Estrup in 2000, 2002, 2005 and 2007(Figure 35). Following all applications, both glyphosate and AMPA could be found inthe drainage water. Out of 418 drainage water samples analysed for glyphosate andAMPA in the period 31 October 2000-7 February 2011, the concentrations ofglyphosate and AMPA exceeded 0.1 �g/l in 89 and 98 samples, respectively (Figure35B and 35C). During that period AMPA never exceeded 0.1 �g/l (Figure 35E andTable A5.4 in Appendix 5), whereas glyphosate did so in three samples, of which twowere taken on 7 July 2005 from two different wells, concentrations being 0.67 and 0.59�g/l, and one on 13 January 2010 from a third well with a concentration of 0.17 �g/l(Figure 35D and Table A5.4 in Appendix 5). In relation to the data shown in Figure 35it should be noted that the quality program of the program has indicated possibleanalytical problems with the quantification of glyphosate in a number of ground watersamples. The results from the external quality assurance reveal that in the period June2007 to July 2010 the concentration of glyphosate may have been underestimated by afactor of up to ~2 as compared to previous periods A modification of the analyticalprocedure has been implemented in the analysis to address this problem (for furtherdetails see section 7.2.2.).
69
Mar-11
Dec-09
Sep-09
Sep-10
Jun-11
DR (mm/d)
0.011
DR (mm/d)
DR (mm/d)
501
Percolation (mm/d)
Sep-04
Sep-05
Sep-06
Sep-07
Sep-08
Sep-09
0Precipitation (mm/d)
Sep-10
Oct-00
Oct-01
Oct-02
Oct-03
201510A50B56DR (mm/d)
10203040100
Glyphosate (�g/l)
1010.10.0110
Glyphosate
4228140
AMPA (�g/l)
10.10.01
36180
Oct-00
Oct-01
Oct-02
Oct-03
Sep-04
Sep-05
Sep-06
Sep-07
Sep-08
Sep-09
Time-proportional sampling
Flow-proportional sampling
Drainage runoff (DR)
1Pesticide (�g/l)
Sep-10
Glyphosate0.10.011AMPA
D
Pesticide (�g/l)
E
0.1
0.01Oct-00Oct-01Oct-02Oct-03Sep-09Sep-10Sep-04Sep-05Sep-06Sep-07Sep-08
M4 (1.5-2.5 m)M5 (3.5-4.5 m)M3 (2.5-3.5 m)
M4 (2.5-3.5 m)M5 (4.5-5.5 m)M3 (3.5-4.5 m)
M4 (3.5-4.5 m)H1 (3.5 m b.g.s.)M6 (1.5-2.5 m)
M4 (4.5-5.5 m)M1 (4.5-5.5 m)M6 (2.5-3.5 m)
M5 (1.5-2.5 m)M1 (3.5-4.5 m)M6 (3.5-4.5 m)
M5 (2.5-3.5 m)M3 (1.5-2.5 m)
Figure 35.Precipitation and simulated percolation 0.6 m b.g.s. (A) together with the concentration of glyphosate (B)and AMPA (C) in the drainage runoff (DR on the secondary axis) atEstrup.Data represent a nine-year periodincluding four applications of glyphosate as indicated by the green vertical lines. Open symbols indicate values belowthe detection limit of 0.01 �g/l. Detection of glyphosate and AMPA in groundwater monitoring wells is shown in Dand E. In the period June 2007 until July 2010, marked with the red outlined box, analytical problems caused theconcentration of glyphosate to be underestimated (see text for details).
When comparing the three-year periods following the application of glyphosate inSeptember 2002 and the four year period following the September 2007 application, apattern of longevity/persistence seems to emerge, in particular regarding AMPA (Figure35B and Figure 35C). This long-term leaching of AMPA may indicate that AMPA isretained within the soil and gradually released over a very long time, as described inKjæret al.(2005a), or that glyphosate is retained within the soil and then graduallydegraded into AMPA. With an increased detection of glyphosate in the groundwatersamples at Estrup following high precipitation events in September 2005 (nearly threeyears after latest application), September 2008 and January 2010 (one and two and ahalf years after the latest application, respectively), evidence of the latter pattern seemsalso to be recognizable.It is remarkable that detections of particularly glyphosate in groundwater monitoringwells seem to increase over the years (Figure 35D). Within the first four years,70
DR (mm/d)
AMPA
C
54
Percolation (mm/d)
detections of glyphosate were scarce, and AMPA is not found at all (Figure 35E).Following these four years there is an increase in the first 3 years, particularly indetections and concentrations of glyphosate. A similar tendency was observed forAMPA, although detections are less frequent and the concentrations comparativelylower. In this respectitshould be noted that there had been no application of glyphosatefor at least seven years prior to the 2000 application (Lindhardtet al.,2001). A singledetection in the most recent year, where there had not been sprayed, was of glyphosate,Figure 35E.Thiacloprid, a pesticide, was applied on 10 May 2010. Neither samples of drainage norgroundwater have contained the substance or any of its three metabolites thiacloprid-amide (M2), thiacloprid sulfonic acid (M30) or thiacloprid sulfonic acidamide (M34).Instead of the herbicide tribenuron-methyl, applied 30 September 2010 which degradesrapidly its metabolite, triazinamin-methyl (INL5296) has been analyzed for. Themetabolite was not found in any of the 46 groundwater samples taken. However, it wasdetected in 2 out of 19 drainage water samples, concentrations being 0.042 �g/l on 28October 2010 and 0.025 �g/l on 4 November 2010 (data not shown).Pesticide leaching at Estrup is mostly confined to the depth of the drainage system.Apart from AMPA, CyPM, bentazone, desethyl-terbuthylazine, deisopropylatrazine,and glyphosate having been detected in 8, 11, 16, 7, 27 and 42 groundwater samples,respectively, pesticides have only sporadically been detected in groundwater monitoringscreens below the depth of the drainage system (Appendix 5, Table A5.4). Due todecreased hydraulic conductivity and a lower degree of preferential flow, transport ofwater and solutes at Estrup is much slower beneath the drainage system than above it.Slow transport may allow for dispersion, dilution, sorption and degradation, therebyfurther reducing the deep transport. Compared to the other loamy soils investigated, theretention characteristics at Estrup suggest that the C-horizon (situated beneath thedrainage depth) is less permeable with a lower degree of preferential flow occurringthrough macro pores (see Kjæret al.,2005c, for details). An indication thereof are thelong periods with groundwater table beyond drainage depth in which an increasinglateral transport to the drainage system and decreased leaching to the deepergroundwater will occur.
71
72
6 Pesticide leaching at Faardrup6.1Materials and methods
6.1.1 Site description and monitoring designFaardrup is located in southern Zealand (Figure 36). The test field covers a cultivatedarea of 2.3 ha (150 x 160 m). The terrain slopes gently to the west by 1–3� (Figure 37).Based on three profiles in the buffer zone bordering the field, the soil was classified asHaplic Vermudoll, Oxyaquic Hapludoll and Oxyaquic Argiudoll (Soil Survey Staff,1999). The topsoil is characterised as sandy loam with 14–15% clay and 1.4% organiccarbon. Within the upper 1.5 m numerous desiccation cracks coated with clay arepresent. The test field contains glacial deposits dominated by sandy till to a depth ofabout 1.5 m overlying a clayey till. The geological description shows that smallchannels or basins filled with melt water clay and sand occur both interbedded in the tilland as a large structure crossing the test field (Lindhardtet al.,2001). The calcareousmatrix and the reduced matrix begin at 1.5 m and 4.2 m b.g.s., respectively.The dominant direction of groundwater flow is towards the west in the upper part of theaquifer (Figure 36). During the monitoring period the groundwater table was located 1–2 and 2–3 m b.g.s. in the lower and upper parts of the area, respectively. Duringfieldwork within the 5 m deep test pit it was observed that most of the water enteringthe pit came from an intensely horizontally-fractured zone in the till at a depth of 1.8–2.5 m. The intensely fractured zone could very well be hydraulically connected to thesand fill in the deep channel, which might facilitate parts of the percolation. Thebromide tracer study showed, however, that virtually none of the applied bromidereached the vertical monitoring well (M6) located in the sand-filled basin (Figure 37and Figure 40), thus indicating that hydraulic contact with the surface in the “basin”does not differ from that in other parts of the test field, and that the basin is a small pondfilled with sediments from local sources.A brief description of the sampling procedure is provided in Appendix 2. Themonitoring design and test site are described in detail in Lindhardtet al.(2001) and theanalysis methods in Kjæret al.(2002).
73
Figure 36.Overview of theFaardrupsite. The innermost white area indicates the cultivated land, while the greyarea indicates the surrounding buffer zone. The positions of the various installations are indicated, as is the directionof groundwater flow (by an arrow). Pesticide monitoring is conducted weekly from the drainage system (duringperiod of continuous drainage runoff) and monthly and half-yearly from selected groundwater monitoring wells asdescribed in Table A2.1 in Appendix 2.
74
Figure 37.Geological description ofFaardrup(Lindhardtet al.,2001).
75
6.1.2 Agricultural managementManagement practice during the 2010-11 growing seasons is briefly summarized belowand detailed in Appendix 3 (Table A3.5). For information about management practiceduring the previous monitoring periods, see previous monitoring reports available onhttp://pesticidvarsling.dk/publ_result/index.html.On 22 April 2010 the field was sown with a mixture of spring barley varieties. Thebarley was undersown with red fescue (cv. Maximum). When four to six tillers weredetectable on the barley it was sprayed with the herbicide bentazone. The fungicideazoxystrobin was applied on 2 July, but not included in the monitoring. The barley washarvested on 21 August yielding 58.5 hkg/ha of grain (85% DM) and approximately 27hkg/ha of straw (100% DM).The red fescue was sprayed with bifenox, a herbicide, on 25 October 2010, where thegrass plants were having between 4 and 8 detectable tillers whereas others where at theend of tillering.6.1.3 Model setup and calibrationThe numerical model MACRO (version 5.1) was applied to the Faardrup site coveringthe soil profile to a depth of 5 m b.g.s., always including the groundwater table. Themodel was used to simulate the water flow in the unsaturated zone during the fullmonitoring period September 1999-June 2011 and to establish an annual water balance.Compared to the setup in Kjæret al.(2011), a year of validation was added to theMACRO setup for the Faardrup site. The setup was accordingly calibrated for themonitoring period May 1999-June 2004 and validated for the monitoring period July2004-June 2011. For this purpose, the following time series were used: observedgroundwater table measured in the piezometers located in the buffer zone, water contentmeasured at three depths (25, 60 and 110 cm b.g.s.) from the two profiles S1 and S2(Figure 36) and measured drainage flow. Data acquisition and model setup aredescribed in Barleboet al.(2007).
76
Table 10.Annual water balance forFaardrup(mm/year). Precipitation is corrected to the soil surface according tothe method of Allerup and Madsen (1979).NormalActualMeasuredSimulated Groundwaterprecipitation1)Precipitation2)evapotranspirationdrainagedrainagerecharge3)1.7.99–30.6.00626715572192152-501.7.00–30.6.0162663938350352061.7.01–30.6.02626810514197201991.7.02–30.6.0362663648049721071.7.03–30.6.0462668550536191441.7.04–30.6.0562667146913155721.7.05–30.6.0662655737228161581.7.06–30.6.07626796518202212771.7.07–30.6.0862664552211165121.7.08–30.6.0962671346346202041.7.09–30.6.1062662441554431551.7.10–30.6.11626694471133184901)2)
Normal values based on time series for 1961–1990.For July 1999-June 2002, July 2003-June 2004, in January and February of both 2005 and 2006, and July 2006-June2007, measured at the DIAS Flakkebjerg meteorological station located 3 km from the test site (see detailed text above).3)Groundwater recharge is calculated as precipitation minus actual evapotranspiration minus measured drainage.
Due to electronic problems, precipitation measured at Flakkebjerg located 3 km east ofFaardrup was used for the monitoring periods: July 1999-June 2002, July 2003-June2004, January and February of both 2005 and 2006, and July 2006-June 2007.Precipitation measured locally at Faardrup was used for the rest of the monitoringperiod.
6.2
Results and discussion
6.2.1 Soil water dynamics and water balancesThe level and dynamics of the soil water saturation in all three horizons in the hydraulicyear July 2010-June 2011 were generally well described by the model (Figure 38D, 38Eand 38F). However, for the summer period 2011 the model largely underestimated thedrop in measured water saturation at 60 and 110 cm b.g.s. (Figure 38E and 38F).Especially, the measured drop at 110 cm depth looks unrealistic and will be checked.Drainage flow generated by snowmelt on the 11 December 2010 and 8 January 2011was not captured by the MACRO-model.The resulting water balance for Faardrup for the 12 monitoring periods is shown inTable 10. Compared with the previous eleven years, the latest hydraulic year July 2010-June 2011 was characterised by having the medium precipitation, the medium simulatedactual evapotranspiration, and the fourth-highest measured and simulated drainage.Precipitation in this year was characterised by July-November 2010 being very wet andDecember-February being very dry (Appendix 4). Due to this precipitation pattern, theduration of the simulated percolation period of the year July 2010-June 2011 wasrepresented by continuous percolation throughout the period August-May (Figure 38A).Compared to the other years, the climate this year gave rise to long periods, where thegroundwater table was a bit higher than the drainage level, causing long-termcontributions to the drains (Figure 38B and 38C).
77
Figure 38.Soil water dynamics atFaardrup:Measured precipitation and simulated percolation 1 m b.g.s. (A),simulated and measured groundwater level GWT (B), simulated and measured drainage flow (C) and simulated andmeasured soil water saturation (SW sat.) at three different soil depths (D, E and F). The measured data in B derivefrom piezometers located in the buffer zone. The measured data in D, E and F derive from TDR probes installed at S1and S2 (Figure 32). The broken vertical line indicates the beginning of the validation period (July 2004-June 2011).
78
9
Bromide (mg/l)
Suction cups - S1
6309
1 m b.g.s.2 m b.g.s.
A
Bromide (mg/l)
Suction cups - S2
630
1 m b.g.s.2 m b.g.s.
B
105
3
0
0
Bromide (mg/l)
9630Horizontal wells - 3.5 m b.g.s.
H1.3H2.3
H1.1H2.1
H1.2H2.5
D
May-99
May-00
May-01
May-02
May-03
May-04
May-05
May-06
May-07
May-08
May-09
May-10
Figure 39.Bromide concentrations atFaardrup.A and B refer to suction cups located at S1 and S2. The bromideconcentration is also shown for drainage runoff (C) and the horizontal monitoring wells (D). In September 2008,bromide measurements in the suction cups were suspended. The green vertical lines indicate the dates of bromideapplications.
6.2.2 Bromide leachingThe bromide concentration shown in Figure 39 and Figure 40 relates primarily to thebromide applied in May 2000, as described further in Kjæret al.(2003), and furtherevaluated in Barleboet al.(2007). In August 2008, 30 kg/ha potassium bromide wasapplied for the second time. In September 2008, bromide measurements in the suctioncups and monitoring wells M2 and M7 were suspended. A drastic increase in bromideconcentration in M4 and M5 was detected in May-June 2009 (Figure 40).
79
May-11
Drainage runoff (mm/d)
6
Drains
Bromide (mg/l)
Bromide, time-proportional samplingBromide, flow-proportional samplingDrainage runoff
C
15
1.5-2.5 m b.g.s.
2.5-3.5 m b.g.s.
3.5-4.5 m b.g.s.
4.5-5.5 m b.g.s.
Bromide (mg/l)
2M210
May-99
May-00
May-01
May-02
May-03
May-04
May-05
May-06
May-07
May-08
May-09
May-10May-10
Bromide (mg/l)
210
M3
May-99
May-00
May-01
May-02
May-03
May-04
May-05
May-06
May-07
May-08
May-09
May-10
Bromide (mg/l)
210
M4
May-99
May-00
May-01
May-02
May-03
May-04
May-05
May-06
May-07
May-08
May-09
Bromide (mg/l)
210
M5
May-99
May-00
May-01
May-02
May-03
May-04
May-05
May-06
May-07
May-08
May-09
May-10M7May-10
2Bromide (mg/l)
M6
102
Bromide (mg/l)
10May-99May-00May-01May-02May-03May-04May-05May-06May-07May-08May-09May-11
Figure 40.Bromide concentrations atFaardrup.The data derive from the vertical monitoring wells (M2–M7).Screen depth is indicated in m b.g.s. In September 2008, monitoring wells M2 and M7 were suspended (Appendix 2).The green vertical line indicate the dates of bromide applications.
6.2.3 Pesticide leachingMonitoring at Faardrup began in September 1999 and presently encompasses severalpesticides and their degradation products, as indicated in Table 11 and in Appendix 8,Table A8.5.
80
May-11
May-11
May-11
May-11
May
Aug
Nov
0Precipitation (mm/d)
Mar
Dec
Apr
Sep
Feb
Oct
Jun
Jan
Jul
3020152009/201010503020152010/20111050PrecipitationEthofumesate & Metamitron & Triflusulfuron-methyl (2009)Bentazone (2010)Simulated percolationMetamitron (2009)Azoxystrobin (2010)Bifenox (2010)
20304050600
Precipitation (mm/d)
2030405060
Figure 41.Application of pesticides included in the monitoring programme and precipitation (primary axis) togetherwith simulated percolation (secondary axis) atFaardrupin 2009/2010 (upper), in 2010/2011 (lower).
The application time of the pesticides included in the monitoring during the two mostrecent growing seasons is shown together with precipitation and simulated precipitationin Figure 41. It should be noted that precipitation is corrected to the soil surfaceaccording to Allerup and Madsen (1979), whereas percolation (1 m b.g.s.) refers toaccumulated values as simulated with the MACRO model. It should also be noted thatas e.g. tribenuron-methyl (applied as Express) degrades rapidly, the leaching risk ismore associated with its degradation product, triazinamin-methyl.For the same reason it is the degradation product and not the parent compounds that ismonitored in the PLAP (Appendix 8, Table A8.5).
81
Percolation (mm/d)
10
25
Percolation (mm/d)
10
25
Table 11.Pesticides analysed at Faardrup. Precipitation (precip.) and percolation (percol.) are accumulated within thefirst year (Precip 1styear, Percol 1styear) and first mount (Precip 1stmonth, Percol 1styear) after the first applicationCmeanrefers to average leachate concentration at 1 m b.g.s. the first year after application. See Appendix 2 forcalculation method and Appendix 8 (Table A8.5) for previous applications of pesticides.CropAppliedAnalysedApplica- End ofY 1stY 1stM 1stM 1stCmeanproductpesticidetion date monit. precip. percol. precip. percol.Epoxiconazole(P)Jun 06 Jun 08790306173 <0.01Spring Barley 2006OpusStarane 180 S Fluroxypyr(P)Winter Rape 2007CruiserRAPS Thiamethoxam(P)CGA 322704(M)Kerb 500 SC Propyzamide(P)RH-24580(M)RH-24644(M)RH-24655(M)Winter Wheat 2008Folicur 250Stomp SCSugar Beet 2009EthosanGoliathSafariTebuconazole(P)Pendimethalin(P)Ethofumesate(P)Metamitron(P)May 06 Jun 08Aug 06 Jul 08Aug 06 Jul 08Feb 07 Mar 09Feb 07 Mar 09Feb 07Feb 07 Mar 09Nov 07 Dec 09Oct 07 Dec 09Apr 09 Jun 11Apr 09 Jun 11708806806735735735735693673609609609609609609609*
333294294199199199199158180146146146146146146146327190190190
3757576464646464515042425050505049757575
172323464646465624222222229727272
<0.02<0.01<0.020.01<0.01<0.01<0.01<0.01<0.010.010.020.06<0.01<0.01<0.01<0.02<0.010.022.540.01
Desamino-metamitron(M) Apr 09 Jun 11Triflusulfuron-methyl(P) Apr 09 Jun 11IN-D8526(M)IN-E7710(M)IN-M7222(M)Spring Barley andFighter 480 Bentazone(P)Red Fescue 2010Fox 480 SC Bifenox(P)Bifenox acid(M)Nitrofen(M)Apr 09 Jun 11Apr 09 Jun 11Apr 09 Jun 11Jun 10Jun 11
693351351351
Oct 10 Jun 11*Oct 10 Jun 11*Oct 10 Jun 11*
Systematic chemical nomenclature for the analysed pesticides is given in Appendix 1.*Monitoring continue the following year.
The current report focuses on the pesticides applied from 2008 and onwards, while theleaching risk of pesticides applied before 2008 has been evaluated in previousmonitoring reports (see http://pesticidvarsling.dk/publ_result/index.html).Tebuconazole and pendimethalin were applied in 2007 and these pesticides have untilnow been detected in five and two samples (data not shown, see Rosenbomet al.,2010b), respectively. Measured concentrations, however, never exceeded 0.1 �g/l.Triasulfuron-methyl was applied in April 2009, but neither the parent compound nor itsdegradations products have so far been detected.Metamitron, ethofumesate and triflusulfuron were applied April 2009 (Figure 41) and sofar neither of the pesticides nor their metabolites have been detected in water samplesfrom Faardrup.Bentazone, bifenox and fluazifop-Pbutyl were applied in 2010 and in 2011 (Table 13).Bentazone was found in one water sample (0.013 �g/l) from a drain in January 2011,but bentazone was also found in small concentrations in 5 water samples in 2010. 2 ofthese water samples originated from the drain system and 3 from the horizontal well.82
Bifenox was applied in October 2010 and found in 6 water samples collected fromdrains from November 2010 to December 2010. Al concentrations were below 0.1 �g/l.The metabolite bifenox-acid was found in 7 samples in 2010 from the same drain, but inhigh concentrations from 0.23-6.9, and in one ground water sample from the horizontalwell H2 in a concentration of 0.19 �g/l (Figure 42). In January to April 2011 themetabolite was found in high, but decreasing concentrations in 9 water samples thedrain (8.3 to 0.11 �g/l). The 2010 average concentration in the drain for bifenox-acidand bifenox was 2.54 �g/l and 0.02 �g/l respectively.
Aug-10
Dec-10
Apr-11
Feb-11
Oct-10
Precipitation (mm/d)
Jun-11
Jul-10
102030405010
A
604530150Bifenox (black)Nitrofen (red)Drains30
Pesticide (�g/l)
0.10.0110C
100Bifenox-acidDrains3020100Pesticide concentrationDrainage runoff (DR)
Pesticide (�g/l)
0.10.0110D
Pesticide (�g/l)
10.1
Bifenox-acidMonitoring wells(detections only)H2 (3.5 m b.g.s.)
0.01
Aug-10
Dec-10
Figure 42.Precipitation and simulated percolation 0.6 m b.g.s. (A) together with concentration of bifenox andnitrofen (B) and bifenox-acid (C) in the drainage runoff, and the detections of bifenox-acid (E) in the groundwatermonitoring screens atFaardrup.The green vertical line indicate the date of bifenox application. Open symbols in Band C represent values below the detection limit of 0.01 �g/l (bifenox and nitrofen) and 0.05 �g/l (bifenox-acid).
83
Apr-11
Oct-10
Feb-11
Jun-11
Jul-10
DR (mm/d)
1
DR (mm/d)
1
B
20
Percolation (mm/d)
0
75
Another metabolite from bifenox - nitrofen - was found in the same drain in 5 watersamples in concentrations from 0.014 to 0.16 in 2010 and in one water sample from2011. 24 water samples were analyzed in 2010 and 60 samples in 2011. The samplesoriginated both from ground water and drain water.From Figure 42 it can be seen that the precipitation in July before the application inOctober was large, which could indicate that the soil was more or les saturated belowthe root zone (Figure 38), during application.
84
7 Pesticide analysis quality assuranceReliable results and scientifically valid methods of analysis are essential for the integrityof the present monitoring programme. Consequently, the field monitoring work hasbeen supported by intensive quality assurance entailing continuous evaluation of theanalyses employed. Two types of sample are used in the quality control – samples withknown pesticide composition and concentration are used forinternal monitoringof thelaboratory method, whileexternally spiked samplesare used to incorporate additionalprocedures such as sample handling, transport and storage. Pesticide analysis qualityassurance (QA) data for the period July 2010 to June 2011 are presented below, whilethose for the preceding monitoring periods are given in previous monitoring reports(available on http://pesticidvarsling.dk/publ_result/index.html).
7.1 Materials and methodsAll pesticide analyses were carried out at commercial laboratories selected on the basisof a competitive tender. In order to assure the quality of the analyses, the call for tendersincluded requirements as to the laboratory’s quality assurance (QA) system comprisingboth an internal and an external control procedure. In addition to specific quality controlunder the PLAP, the laboratory takes part in the proficiency test scheme employed bythe Danish Environmental Protection Agency when approving laboratories for theNationwide Monitoring and Assessment Programme for the Aquatic and TerrestrialEnvironments (NOVANA).7.1.1 Internal QAWith each batch of samples the laboratory analysed one or two control samplesprepared at each laboratory as part of their standard method of analysis. The pesticideconcentration in the internal QA samples ranged between 0.03–0.11 �g/l. Using thesedata it was possible to calculate and separate the analytical standard deviation intowithin-day (Sw), between-day (Sb) and total standard deviation (St). Total standarddeviation was calculated using the following formula (Wilson 1970, Danish EPA 1997):st=22sw+sb
7.1.2 External QAEvery four months, two external control samples were analysed at the laboratories alongwith the various water samples from the five test sites. Two stock solutions of differentconcentrations were prepared from two standard mixtures in ampoules prepared by Dr.Ehrenstorfer, Germany (Table 14). Fresh ampoules were used for each set of standardsolutions. The standard solutions were prepared two days before a sampling day andstored in darkness and cold until use. For the preparation of stock solutions 150 �l (lowlevel) or 350 �l (high level) of the pesticide mixture was pipetted into a preparationglass containing 10 ml of ultrapure water. The glass was closed and shaken thoroughlyand shipped to the staff collecting the samples. The staff finished the preparation of85
control samples in the field by quantitatively transferring the standard solution to a 3.0 lmeasuring flask. The standard solution was diluted and adjusted to the mark withgroundwater from a groundwater well. After a thorough mixing, the control sample wastransferred to a sample bottle and transported to the laboratories together with theregular samples. In the present report period the final concentrations in the solutionsshipped for analysed in the laboratories were in the range 45 to 50 �g/l for low levelspikes and 105 to 117 �g/l for high spike levels. As water sample supply wasoccasionally limiting at Faardrup, all volumes were reduced by a factor of three for thislocation, keeping the concentrations in the final control samples identical to the otherlocations.The pesticide concentration in the solution is indicated in Table 14. Blank samplesconsisting of HPLC water were also included in the external QA procedure everymonth. All samples included in the control sample were labelled with coded referencenumbers, so that the laboratory was unaware of which samples were controls or blanks.Table 12.Pesticide concentrations in both the original ampoules and in the resulting high-level and low-levelexternal control samples used in in the period 1.7.2010-30.6.2011.CompoundAmpouleAmpouleHigh-level controlLow-level controlConcentration (�g/l)(�g/l)(�g/l)AMPA100020.1170.050Aclonifen90010.1050.045Bentazone90010.1050.045Bifenox acid90010.1050.045CGA 6282690010.1050.045CyPM90010.1050.045Cyazofamid90010.1050.045Ethofumesate90010.1050.045Glyphosate100020.1170.050IN-E771090010.1050.045Metamitron90010.1050.045Metsulfuron-methyl90010.1050.045PPU90010.1050.045TFMP90010.1050.045Thiacloprid-amide90010.1050.045
7.2
Results and discussion
7.2.1 Internal QAIdeally, the analytical procedure provides precise and accurate results. However, in thereal world results from analysis are subject to a certain standard deviation. Suchstandard deviation may be the combined result of several contributing factors. Overall,the accuracy of an analytical result reflects two types of error: Random errors related toprecision and systematic errors relating to bias. In a programme like PLAP it is relevantto consider possible changes in analytical “reliability over time”. As random andsystematic errors may change over time it is relevant to distinguish between standarddeviations resulting fromwithin-dayvariation as opposed to those associated withbetween-dayvariation in the analytical result. To this end, control samples are includedin the analytical process as described above. Thus, by means of statistical analysis of theinternal QA data it is possible to separate and estimate the different causes of theanalytical variation in two categories: day-to-day variation and within-day variation(Milleret al.,2000; Funket al.,1995). This kind of analysis can provide an indicationof the reliability of the analytical results used in the PLAP. The statistical tool used is an86
analysis of variance (ANOVA) and encompasses all duplicate pesticide analyses, singleanalyses being excluded. The analysis can be divided into three stages:1.Normality:An initial test for normality is made as this is an underlyingassumption for the one-way ANOVA.2.Between-day contribution:Explained simply, this test will reveal any day-to-day contribution to the variance in the measurements. If there is none, the totalstandard deviation can be considered to be attributable to the within-day error ofthe analysis. For this purpose an ANOVA-based test is used to determine if thebetween-day standard deviation (Sb) differs significantly from 0 (this test ismade as an F-test with the H0:between-day mean square = within-day meansquare).3.Calculating standard deviations:If the F-test described above reveals acontribution from the between-day standard deviation (Sb), it is relevant tocalculate three values: The within-day standard deviation Sw, the between-daystandard deviation Sb, and the total standard deviation St.As the error associated with the analytical result is likely to be highly dependent on thecompound analysed, the QA applied is pesticide-specific. The results of the internal QAstatistical analysis for each pesticide are presented in Table 15. For reference, estimatedSbvalues are listed for all pesticides, including those for which the between-dayvariance is not significantly greater than the within-day variance. ANOVA details andvariance estimates are also included, even for pesticides where the requirement fornormality is not fulfilled. Such data should obviously be interpreted with caution.As a rule of thumb, the between-day standard deviation should be no more than doublethe within-day standard deviation. From Table 15 it can be seen that Sb/Swratios greaterthan two were observed for several compounds. For these compounds, the resultsindicate that day-to-day variation makes a significant contribution. Among thecompounds meeting the normality requirement, 12 out of 21 compounds had ratiosabove 2, and the highest Sb/Swratio in this group was observed for desamino-metamitron (4.2) and diflufenican (3.9). When all compounds are considered, aparticularly high Sb/Swratio is apparent for CGA 108906, PPU-desamino and PPU.Such relatively high ratios can be caused by very low within-day standard deviations,i.e. within each laboratory day, the variation on the analysis is small compared to theother compounds, whereas the variation between days is comparable to the othercompounds analysed. This is not the case for the three high ratio compounds CGA108906, PPU-desamino and PPU. For these compounds it is apparent that the highSb/Sw ratio is caused by relatively high between-day deviation(Sb).The total standard deviations (St) of the various analyses of pesticides and degradationproducts lie within the range 0.001-0.111 �g/l, the highest value being observed forCGA 108906 (max St for compounds other than CGA 108906 was 0.061 �g/l). Ingeneral, the data suggest that the analytical procedure used for the quantification of thecompounds with high Sb/Sw ratio and/or high St, and in particular the compound CGA108906, may benefit from a critical review and possible optimisation of within dayvariation. Excluding the CGA 108906 data, the overall mean St was 0.012 �g/l and inthe same range as observed in previous report periods.87
Table 13.Internal QA of pesticide analyses carried out in the period 1.7.2010-30.6.2011. Results of the test fornormality, one-way analysis of variance (ANOVA), the estimated values of standard deviations (w: within-day, b:between-day, t: total – see text for details), pesticide concentration in internal QA sample (Conc.) and number ofduplicate samples (n) are given for each pesticide. For test the P valueα=0.05was used.CompoundNormalSignificant SbSwSbStRatioN Conc.distribution Between day(�g/l)(�g/l) (�g/l) Sb/Sw(�g/l)contributionα=0.05ANOVAα=0.05AE-05422291*yes-0.0010.003 0.003 sb/sw4 0.05AE-05422291*yes-0.0010.003 0.003 sb/sw4 0.05AE-B107137*yesyes0.0050.006 0.008 sb/sw4 0.10AMPA*yes0.0090.002 0.010 sb/sw 26 0.03Aclonifenyes-0.0030.005 0.006 sb/sw 17 0.05Azoxystrobinyes0.0600.013 0.061 sb/sw 43 0.05Bentazone-0.0050.004 0.006 sb/sw 60 0.05Bifenoxyes-0.0030.008 0.008 sb/sw 53 0.05Bifenoxacid-0.0120.028 0.030 sb/sw 45 0.10Boscalidyes0.0010.000 0.001 sb/sw3 0.05CGA108906*-0.0070.110 0.111 sb/sw 15 0.10CGA62826*-0.0060.016 0.017 sb/sw 15 0.10CyPM*-0.0030.010 0.010 sb/sw 21 0.05Desamino-metamitron*yes-0.0030.012 0.012 sb/sw 24 0.05Diflufenicanyes-0.0010.002 0.002 sb/sw4 0.05Diketo-metribuzin*yes-0.0030.007 0.008 sb/sw9 0.05Ethofumesate-0.0020.004 0.004 sb/sw 24 0.05Fluazifop-P*yes0.0150.013 0.020 sb/sw4 0.05Fluazifop-P(free-acid)*-0.0020.003 0.004 sb/sw7 0.05Glyphosateyes0.0050.003 0.006 sb/sw 25 0.03IND8526*yes-0.0010.002 0.002 sb/sw8 0.05INE7710*yes-0.0020.005 0.005 sb/sw8 0.05IN-D8526*yes-0.0030.006 0.007 sb/sw 16 0.05IN-E7710*yes-0.0020.006 0.006 sb/sw 16 0.05IN-M7222*yes-0.0040.007 0.007 sb/sw 24 0.05Iodosulfuron-methylyes-0.0020.006 0.006 sb/sw 11 0.05M34*-0.0250.042 0.048 sb/sw 22 0.10Metalaxyl-M-0.0010.004 0.004 sb/sw 17 0.05Metamitron-0.0060.010 0.012 sb/sw 41 0.05Metrafenoneyesyes0.0010.002 0.003 sb/sw4 0.05Metsulfuron-methylyes-0.0040.006 0.007 sb/sw 11 0.05Nitrofen-0.0020.007 0.007 sb/sw 53 0.05PPU*-0.0050.034 0.034 sb/sw 18 0.05PPU-desamino*-0.0020.019 0.019 sb/sw 18 0.05TFMP*yes-0.0040.008 0.009 sb/sw 11 0.05Thiacloprid-0.0020.005 0.005 sb/sw 28 0.05Thiaclopridsulfonicacidyes-0.0180.022 0.028 sb/sw 22 0.10Thiacloprid-amide*yes-0.0040.007 0.008 sb/sw 28 0.05Triazinaminyes-0.0060.009 0.011 sb/sw 10 0.11Triazinamin-methyl*yes-0.0030.004 0.005 sb/sw 24 0.05*Degradation product.
7.2.2 External QAAs part of the quality control a set of blanks made from HPLC water are analysed toevaluate the possibility of false positive findings in the programme. From these results itcan be concluded that contamination of samples during collection, storage and analysisis not likely to occur. In a total of 28 blank samples consisting of HPLC water no88
detection of the compounds analysed were made. As a consequence, samples analysedin the monitoring program and found to contain pesticides or their degradation productsare thus regarded as true positive findings.Table 16 provides an overview of the recovery of all externally spiked samples. As theresults for each field site in Table 16 are based on only a few observations for eachconcentration level (high/low), the data should not be interpreted too rigorously.Table 14.Externally spiked samples. Average recovery (%) of the nominal concentration at low/high concentrationlevel indicated for each site. For each compound nlowand nhighrefer to the total number of samples being spiked atlow and high concentrations, respectively. Bold font is used for recoveries outside the range 70% to 120%.TylstrupJyndevadSilstrupEstrupFaardrupAverage nlow/nEthofumesateGlyphosateMetamitronAMPA*BentazonePPU*CyPM*IN-E7710*TFMP*Bifenox acid*CGA 62826*CyazofamidAclonifenThiacloprid-amide*EthofumesateLowHigh LowHighLow104%104%85% 90% 92%63%77%149%120% 107%90%113%89%97%132%
High114%104%90%89%111%75%
Low59%74%103%112%
High58%70%97%114%
Low108%96%100%
High107%100%97%109591007294101107120117108848578116109
high
88%86%75%
133%79% 88%78% 89%71% 85%
98%79%86%80%
111%
81%
117%103%170%
123%114%111%
*Degradation produkt.
104%
114%
117%
114%
108%
107%
4/83/64/83/615/306/129/183/65/1011/166/126/126/123/64/8
A total of 36 samples were spiked in this reporting period, Whereas the recovery of themost spiked compounds in the samples is generally good (i.e. in the range 70% to120%), the broad range of average recoveries indicates that for some compounds theremay be reason for concern. For some samples a small background content may bepresent in the water used for spiking, and in particular for low levels QC samples suchcontent can cause a elevated recovery percentage. For this reason, the QC data must beconsidered as a whole, and used to keep track on possible changes in the quality of theprogram from period to period. In the present reporting period, no alarming QC datawas registered, but the data points to the need for keeping track on particularcompounds, e.g. bifenox and PPU.In previous reports a somewhat low levels was observed for recovery of bifenox acid atJyndevad and Estrup. In the present reporting period, such low recoveries were notobserved, indicating that a more robust analytical method has been implemented in theprogram, even if a high recovery was observed for a low level spike at Faardrup (170%)and for PPU a similar high recovery is observed for low spiking levels at Jyndevad (seebelow for possible background in the water used for spiking).In previous reporting periods, low recoveries were observed. In the current periodthe PPU levels observed at Tylstrup are still to the lower end yet acceptable, whereasthe levels at Jyndevad must be considered as high. In general, the most extremerecoveries (low and high) are found for the low level spikings (0.05 ppb), indicating that89
the analytical procedure is more suitable for the high level spiking range close to theresidue limit of 0.1 ppb.This finding and the low overall recoveries for glyphosate indicate that there may stillbe some aspects of the procedures used for monitoring of glyphosate that can beoptimised. Based on previous findings of low recovery of glyphosate, the analyticalprocedures used in the current monitoring period were optimised. As reportedpreviously, there was a shift from GC/MS to LC/MS analytical procedure was made inJune 2007. Concern for the QC aspects caused an evaluation of the analyticalprocedures used in the programme and as a consequence some analytical details wereadjusted. As reflected by the current results of the internal QC the analytical procedureperforms well on in-house spiked samples (Table 15). However, it seems there are stillsome elements of the sampling handling and analytical procedure that needs evaluation,as the external QC program demonstrates low overall recoveries at 59% when QCsamples from the field site are analysed (Table 16). It is known that the LC basedmethod is sensitive to a number of matrix components, possible due to the derivatizationstep in the method used, but even if these procedures have been optimised, there is stilla nee for further investigations into the possible cause for the low overall recoveries ofglyphosate.All the compounds included in the spiking procedure (Table 14) were detected in thelaboratory. Additionally, a number of compounds were measured at the threshold ofdetection of the analytical procedure (i.e. close to 0.01 �g/l). The occurrence of anumber of false positives is expected when analysing environmental matrices and thesefindings do not cause a general concern in relation to the reliability of the analyticalprocedures used in the programme.At the sites Tylstrup and Jyndevad the compound PPU was frequently found at levelsclose to the detection limit, an observation that needs to be taken into considerationwhen evaluating the recovery data (Table 14). In the programme, the water matrixs usedfor spiking were analysed. The high recovery of bifenox acid at Faardrup (170%) couldnot be explained by background content. In contrast, a background content wasobserved at one occasion for the compound PPU (level 0.03 �g/l) and this can explainthe rather high recovery observed for low level spiking of PPU at Jyndevad. However,in general, the analysis of the water used for spiking showed no or were low levels ofbackground content (i.e. in the range of the detection limit) and these findings do notcause concern for the overall quality of the programme.During the 2010/2011 monitoring period a total of five pesticides and nine degradationproducts were detected in samples from the experimental fields. The external andinternal QA data relating to these particular pesticides/degradation products are ofspecial interest. These data (when available) are illustrated in Appendix 6.
7.3 Summary and concluding remarksThe QA system showed that:•The internal QA indicates that the reproducibility of the pesticide analyses was goodwith total standard deviation (St) in the range 0.001-0.061 �g/l except for thecompound CGA 108906 having a relatively large Stof 0.111.90
•As demonstrated by the external QA, recovery was generally good in externallyspiked samples. Low recovery of glyphosate was, however, observed in somesamples, causing low overall recovery. These results will be used in the ongoingoptimization of the procedures used in the programme.•Based on the results from analysis of blank ‘HPLC water samples’ shipped togetherwith the true monitoring samples it is concluded that contamination of samplesduring collection, storage and analysis is not likely to occur.
91
92
8 Summary of monitoring resultsThis section summarizes the monitoring data from the entire monitoring period, i.e. bothdata from the two most recent monitoring years (detailed in this report) and data fromthe previous monitoring years (detailed in previous reports available onhttp://pesticidvarsling.dk/publ_result/index.html). Pesticide detections in samples fromthe drainage systems, suction cups and monitoring wells are detailed in Appendix 5.The monitoring data in 1 m b.g.s. (collected in drains and suction cups) reveal that theapplied pesticides exhibit three different leaching patterns – no leaching, slight leachingand pronounced leaching (Table 15). Pronounced leaching in 1 m b.g.s. is defined asroot zone leaching (1 m b.g.s.) exceeding an average concentration of 0.1 �g/l withinthe first season after application.On sandy and loamy soils, leaching is determined as the weighted average concentrationin soil water and drainage water, respectively (Appendix 2).The monitoring data from the groundwater monitoring screens is divided into threecategories: no detection of the pesticide (or its degradation products), detections of thepesticide (or its degradation products) not exceeding 0.1 �g/l, and detections of thepesticide (or its degradation products) exceeding 0.1 �g/l (Table 17). It should be noted,though, that the present evaluation of the leaching risk of some of these pesticides is stillpreliminary as their potential leaching period extends beyond the current monitoringperiod. Up to 2011 16 of the applied pesticides (or their degradation products) exhibitedpronounced root zone leaching and 12 of these were also detected in the groundwatermonitoring screens in concentrations exceeding 0.1 �g/l.•Azoxystrobin, and in particular its degradation product CyPM, leached from the rootzone (1 m b.g.s.) in high average concentrations at the loamy sites Silstrup andEstrup. CyPM leached into the drainage water in average concentrations exceeding0.1 �g/l at both the Silstrup and Estrup sites, while azoxystrobin only leached inconcentrations exceeding 0.1 �g/l at Estrup (Table 15 and 16). At both sites,leaching of azoxystrobin and CyPM has hitherto mostly been confined to the depthof the drainage system, and they have rarely been detected in monitoring screenssituated below drainage depth (Table 17 and 18). However, detection of CyPM ingroundwater monitoring wells has gradually increased over time with highestnumbers of detection found after the latest applications (2009 at Silstrup, Figure 27and 2008 at Estrup, Figure 33). Apart from one sample, however, concentrationsdetected were all below 0.1 �g/l. In 2010 and 2011 CyPM continued to enter thedrain water especially in Silstrup in high concentrations. At the loamy Faardrup siteazoxystrobin and CyPM were detected in only four samples from the drainage water,and in no samples from the sandy Jyndevad site (Appendix 5).
93
Table 15.Leaching1 m b.g.s.of pesticides or their degradation products at the five PLAP sites. The colours indicatethe degree of leaching. Pesticides applied in spring 2011 are not included in the table.TylstrupJyndevadSilstrupEstrupFaardrupAzoxystrobinBentazoneBifenoxEthofumesate2)2)Fluazifop-P-butylGlyphosateMetalaxyl-MMetamitron1)MetribuzinPicolinafenPirimicarbPropyzamideRimsulfuronTebuconazoleTerbuthylazine2)AmidosulfuronBromoxynilClomazoneDimethoateEpoxiconazoleFlamprop-M-isopropylFluroxypyrIoxynilMCPAMancozebMesosulfuron-methylPendimethalinPhenmediphamPropiconazoleProsulfocarbPyridateTriflusulfuron-methylChlormequatClopyralidDesmediphamFenpropimorphFlorasulamIodosulfuron-methylLinuronMetsulfuron-methylThiamethoxamTriasulfuronTribenuron-methyl1)Derived from application before May 1999 (see Kjæret al.,2002).2)Degradation products are not monitored (see text).
2)
2)
Pesticide (or its degradation products) leached 1 m b.g.s. in average concentrations exceeding 0.1 �g/l withinthe first season after application.Pesticide (or its degradation products) was detected in either several (more than three) consecutive samples orin a single sample in concentrations exceeding 0.1 �g/l; average concentration (1 m b.g.s.) below 0.1 �g/lwithin the first season after application.Pesticide either not detected or only detected in very few samples in concentrations below 0.1 �g/l.
94
Table 16.Number of samples from1 m b.g.s.in which the various pesticides and their degradation products weredetected at each site with maximum concentration (�g/l) in parentheses. The table encompassespesticides/degradation products detected in either several (more than three) consecutive samples or in a single samplein concentrations exceeding 0.1�g/l.The pesticide and metabolites are mentioned if analyzed under compound.Pesticides applied in spring 2011 are not included.ParentCompoundTylstrup Jyndevad SilstrupEstrupFaardrupAzoxystrobinAzoxystrobin0010(0.03) 106(1.4)0CyPM0073(0.34) 203(2.1)4(0.06)Bentazone2-amino-N-isopropylbenzamide02(0.03)01(0.06)1(0.06)Bentazone1(0.01)39(1.6)45(6.4)161(20)20(43)BifenoxBifenox2(0.04)1(0.03)3(0.15)6(0.09)Bifenox acid1(0.1)12(4.2)12(1.9)17(8.6)Nitrofen01(0.02)06(0.16)EthofumesateEthofumesate20(0.23) 35(3.36)14(12)Fluazifop-P-butylFluazifop-P0009(3.8)TFMP0021(0.52)0GlyphosateAMPA1(0.01) 122(0.35) 367(1.6) 15(0.11)Glyphosate067(4.7)254(31)5(0.09)Metalaxyl-MCGA 10890613(0.52)18(2.3)CGA 628267(0.04)17(1.2)Metalaxyl-M4(0.03)7(0.04)MetamitronDesamino-metamitron58(0.67) 49(5.55)16(2.5)Metamitron46(1)42(26.37) 12(1.7)MetribuzinDesamino-diketo-metribuzin67(2.1)Diketo-metribuzin185(0.62) 3(0.09)PicolinafenCL153815031(0.5)Picolinafen1(0.02)17(0.07)PirimicarbPirimicarb0014(0.05) 40(0.08)7(0.06)Pirimicarb-desmethyl01(0.01)1(0.05)06(0.05)Pirimicarb-desmethyl-formamido00026(0.38)3(0.04)PropyzamidePropyzamide023(1.6)4(0.51)RH-2458002(0.02)0RH-24644015(0.05)4(0.02)RH-24655001(0.02)RimsulfuronPPU119(0.09) 168(0.29)PPU-desamino27(0.03) 98(0.13)TebuconazoleTebuconazole0041(2)4(0.05)Terbuthylazine2-hydroxy-desethyl-terbuthylazine 5(0.02)028(0.11)87(6.3)8(1)Desethyl-terbuthylazine2(0.01)20(0.06) 108(1.08) 146(8.2)89(8.3)Desisopropylatrazine17(0.04)043(0.04) 71(0.44) 25(0.36)Hydroxy-terbuthylazine1(0.04)026(0.04) 88(0.99) 21(0.58)Terbuthylazine0060(1.55) 112(11)41(10)AmidosulfuronAmidosulfuron3(0.11)0BromoxynilBromoxynil003(0.6)0ClomazoneClomazone01(0.28)FMC 6531701(0.3)DimethoateDimethoate001(1.42)00EpoxiconazoleEpoxiconazole00014(0.39)0Flamprop-M-isopropyl Flamprop07(0.1)13(0.03)1(0.09)Flamprop-M-isopropyl012(0.11) 20(0.07)1(0.04)FluroxypyrFluroxypyr0003(1.4)1(0.19)IoxynilIoxynil0020(0.25)1(0.01)MCPA2-methyl-4-chlorophenol001(0.05)1(0.24)MCPA0012(3.89)2(0.28)MancozebETU6(0.04)Mesosulfuron-methyl Mesosulfuron-methyl013(0.06)PendimethalinPendimethalin0014(0.06)4(0.04)2(0.04)PhenmediphamMHPC02(0.19)PropiconazolePropiconazole006(0.03)26(0.86)0ProsulfocarbProsulfocarb5(0.18)0PyridatePHCP04(2.69)Triflusulfuron-methyl IN-E77105(0.01)0
95
Table 17.Detections of pesticides and their degradation products in water samples fromthe groundwatermonitoring screensat the five PLAP sites (see Table 20 for details Pesticides applied in spring 2011 are not includedin the table.TylstrupJyndevadSilstrupEstrupFaardrupAzoxystrobinBentazoneBifenoxEthofumesate2)2)2)Fluazifop-P-butylGlyphosateMetalaxyl-MMetamitron1)MetribuzinPicolinafenPirimicarbPropyzamidePyridateRimsulfuronTebuconazoleTerbuthylazine2)2)AmidosulfuronBromoxynilClomazoneDimethoateEpoxiconazoleFlamprop-M-isopropylFluroxypyrIoxynilMCPAMancozebMesosulfuron-methylPendimethalinPhenmediphamPropiconazoleProsulfocarbTriflusulfuron-methylChlormequatClopyralidDesmediphamFenpropimorphFlorasulamIodosulfuron-methylLinuronMetsulfuron-methylThiamethoxamTriasulfuronTribenuron-methyl1)Derived from application before May 1999 (see Kjæret al.,2002).2)Degradation products are not monitored (see text).Pesticide (or its degradation products) detected in water samples from groundwater monitoring screens inconcentrations exceeding 0.1 �g/l.Pesticide (or its degradation products) detected in water samples from groundwater monitoring screens inconcentrations not exceeding 0.1 �g/l.Pesticide (or its degradation products) not detected in water samples from the groundwater monitoring screens.
96
Table 18.Number of samples from thegroundwater monitoring screensin which the various pesticides and/ortheir degradation products were detected at each site with the maximum concentration (�g/l) in parentheses (seeAppendix 5 for further details). The parent pesticide and metabolites are mentioned if analyzed under compound.Only pesticides with more than 3 detections at one site are included. Pesticides applied in spring 2011 are notincluded.ParentCompoundTylstrup JyndevadSilstrupEstrupFaardrupAzoxystrobinAzoxystrobin001(0.01)0CyPM0028(0.1)11(0.09)0Bentazone2-amino-N-isopropylbenzamide0001(0.03)0Bentazone0029(0.44)16(0.02)13(0.6)BifenoxBifenox2(0.05)5(0.1)00Bifenox acid013(3.1)01(0.19)EthofumesateEthofumesate5(0.04)031(1.4)Fluazifop-P-butyl Fluazifop-P001(0.07)6(0.17)TFMP0048(0.29)0FluroxypyrFluroxypyr0001(0.06)1(0.07)GlyphosateAMPA2(0.02)15(0.08)8(0.07)2(0.03)Glyphosate04(0.03)42(0.67)3(0.02)Metalaxyl-MCGA 10890663(0.26)65(1)CGA 628262(0.02)21(0.02)Metalaxyl-M6(0.08)8(0.54)MetamitronDesamino-metamitron30(0.19)048(1.3)Metamitron29(0.17)024(0.63)MetribuzinDesamino-diketo-metribuzin239(0.2)20(1.83)Diketo-metribuzin456(0.55) 26(1.37)Metribuzin1(0.01)0PirimicarbPirimicarb003(0.01)1(0.02)2(0.04)Pirimicarb-desmethyl00003(0.04)Pirimicarb-desmethyl-formamido00002(0.08)PropyzamidePropyzamide09(0.14)1(0.03)RH-2464402(0.03)0PyridatPHCP014(0.309)RimsulfuronPPU19(0.05) 319(0.11)PPU-desamino076(0.03)TebuconazoleTebuconazole1(0.01)1(0.01)5(0.12)1(0.01)Terbuthylazine 2-hydroxy-desethyl-terbuthylazine1(0.03)01(0.02)07(0.09)Desethyl-terbuthylazine027(0.02) 161(0.14)7(0.05)66(0.94)Desisopropylatrazine1(0.01)04(0.05)27(0.03)60(0.04)Hydroxy-terbuthylazine000034(0.07)Terbuthylazine0036(0.12)1(0.02)51(1.9)
•Bentazone leached through the root zone (1 m b.g.s.) in average concentrationsexceeding 0.1 �g/l in the drainage system at the loamy sites of Silstrup, Estrup, andFaardrup. Moreover, bentazone was frequently detected in the monitoring screenssituated beneath the drainage system at Silstrup and Faardrup (Table 17 and 18).Apart from eight samples, however, concentrations detected were all below 0.1 �g/l.At Estrup leaching was mostly confined to the depth of the drainage system andrarely detected in deeper monitoring screens (Appendix 5). On the sandy soils,bentazone leached at Jyndevad, but was only detected once 1 m b.g.s. at Tylstrup. AtJyndevad high concentrations (exceeding 0.1 �g/l) were detected in the soil watersamples from suction cups 1 m b.g.s. four months after application. Thereafter,leaching diminished and bentazone was not subsequently detected in the monitoringwells. Although leached in high average concentrations (>0.1 �g/l) at four sites,bentazone was generally leached within a short period of time. Initial concentrationsof bentazone were usually very high, but then decreased rapidly. In general,concentrations exceeding 0.1�g/l were only found within a period of one to fourmonths following the application. The degradation product 2-amino-N-isopropyl-benzamide was detected twice in the vadose zone at Jyndevad, once in drainagewater at Estrup and Faardrup (Table 16), and once in water from a horizontal well atEstrup (Table 20).97
•Bifenox acid (degradation product of bifenox) leached through the root zone andentered the drainage water system in average concentrations exceeding 0.1 �g/l atthe loamy sites of both Silstrup, Estrup and Faardrup. While leaching at Estrupseems to be confined to the depth of the drainage system, leaching to groundwatermonitoring wells situated beneath the drainage system was observed at Silstrup,where concentrations exceeding 0.1 �g/l were observed up to six months afterapplication. As in Silstrup and Estrup the metabolite bifenox acid was found in veryhigh concentrations in drain water from Faardrup. in a yearly average concentrations2,54 �g/l (Table 11). Another unwanted metabolite from bifenox, nitrofen, wasfound in drain water form Faardrup, but in rater low concentrations. Similarevidence of pronounced leaching wasnotobserved on the coarse sandy soil as therewas only a single detection of bifenox acid in soil water, whereas bifenox wasdetected very sporadically in soil and groundwater, concentrations always less than0.1 �g/l.•In the loamy soil of Estrup, ethofumesate, metamitron, and its degradation productDesamino-metamitron leached through the root zone (1 m b.g.s.) into the drainagewater in average concentrations exceeding 0.1 �g/l (Table 15). The compounds havenot been detected in deeper monitoring screens. These compounds also leached 1 mb.g.s. at the Silstrup and Faardrup sites, reaching both the drainage system (Table 15and 16) and groundwater monitoring screens (Table 17 and 18). Averageconcentrations in drainage water were not as high as at Estrup, althoughconcentrations exceeding 0.1 �g/l were observed in both drainage water andgroundwater monitoring screens during a 1–6-month period at both Silstrup andFaardrup (see Kjæret al.,2002 and Kjæret al.,2004 for details). The aboveleaching was observed following an application of 345 g/ha of ethofumesate and2,100 g/ha of metamitron in 2000 and 2003. Since then, ethofumesate has beenregulated and the leaching risk related to the new admissible dose of 70 g/ha wasevaluated with the two recent applications (2008 at Silstrup and 2009 at Faardrup).Although metamitron has not been regulated, a reduced dose of 1400 g/ha wasapplied at one of the two recent applications, namely that at Silstrup in 2008. Theleaching following these recent applications (2008 at Silstrup and 2009 at Faardrup)was minor. Apart from a few samples from the drainage system and groundwatermonitoring wells containing less than 0.1 �g/l, neither ethofumesate nor metamitronwas found in any of the analysed water samples (see section 4.2.3 and 6.2.3).•Fluazifop-P-butyl has several times been included in the monitoring programme atJyndevad, Tylstrup, Silstrup, and Faardrup. As fluazifop-P-butyl rapidly degrades,until July 2008 monitoring has focused only on its degradation product fluazifop-P(free acid). Except for one detection below 0.1 �g/l in groundwater at Silstrup and17 detections with eight exceeding 0.1 �g/l (four drains, three vadose zone, onegroundwater, Table 16 and 18) at Faardrup, leaching was not evident. TFMP, thedegradation product of fluazifop-P-butyl, was included in the monitoringprogramme at Silstrup in July 2008 following an application of fluazifop-P-butyl.After approximately one month, TFMP was detected in the groundwater monitoringwells, where concentrations at or above 0.1 �g/l were detected within a ten-monthperiod following application (Figure 25, Table 17 and 18). At the onset of drainageflow in September, TFMP was detected in all the drainage water samples atconcentrations exceeding 0.1 �g/l (Figure 25). The average TFMP concentration indrain water was 0,24 �g/l in 2008/09. The leaching pattern of TFMP indicates98
pronounced preferential flow also in periods with a relatively dry vadose zone. Afteruse in low doses at Silstrup no leaching was observed.•Glyphosate and AMPA was found to leach through the root zone at high averageconcentrations on loamy soils. At the loamy sites Silstrup and Estrup, glyphosate hasbeen applied two (in 2001 and 2003) and four (in 2000, 2002, 2005 and 2007) timeswithin the monitoring period, respectively. All six autumn applications have resultedin detectable leaching of glyphosate and AMPA from the upper meter into thedrainage water, often at concentrations exceeding 0.1 �g/l several months afterapplication. Higher leaching levels of glyphosate and AMPA have mainly beenconfined to the depth of the drainage system and have rarely been detected inmonitoring screens located below the depth of the drainage systems, although itshould be noted that detections of particularly glyphosate in groundwater monitoringwells at Estrup seem to increase over the years (Figure 35D).This increase may beunderestimated for the period June 2007 to July 2010 as external quality assuranceof analytical methods in this period indicates that the true concentration ofglyphosate may be underestimated (see section 7.2.2). On two occasions heavy rainevents and snowmelt triggered leaching to the groundwater monitoring wells inconcentrations exceeding 0.1 �g/l more than two year after the application (Figure35D). Numbers of detections exceeding 0.1 �g/l in groundwater monitoring wellsare, however, very limited (only few samples). Glyphosate and AMPA were alsodetected in drainage water at the loamy site of Faardrup (as well as at the nowdiscontinued Slaeggerup site), but in low concentrations (Kjæret al.,2004).Evidence of glyphosate leaching was only seen on loamy soils, whereas the leachingrisk was negligible on the coarse sandy soil of Jyndevad. Here, infiltrating waterpassed through a matrix rich in aluminium and iron, thereby providing goodconditions for sorption and degradation (see Kjæret al.,2005a for details).•Two degradation products of metribuzin – Diketo-metribuzin and Desamino-diketo-metribuzin – leached 1 m b.g.s. at average concentrations exceeding 0.1 �g/l in thesandy soil at Tylstrup. Both degradation products appear to be relatively stable andleached for a long period of time. Average concentrations reaching 0.1 �g/l wereseen as late as three years after application (Table 17). Evidence was also found thattheir degradation products might be present in the groundwater several years afterapplication, meaning that metribuzin and its degradation products have long-termsorption and dissipation characteristics (Rosenbomet al.,2009). At both sandy sites(Tylstrup and Jyndevad), previous applications of metribuzin has caused markedgroundwater contamination with its degradation products (Kjæret al.,2005b).•Metalaxyl-M was applied found in low concentrations in few samples from theunsaturated zone at Tylstrup. Two degradation products (CGA 62829 and CGA108906) however, were leached from the root zone (1 m b.g.s.), and CGA 108906 inaverage concentrations exceeding 0.1 �g/l (Table 3, Figure 7, Table 15-18. CGA108906 was found in 95% of the analysed groundwater samples and in 27% of theanalysed samples the concentration exceeded 0.1 �g/l. Similar to the othercompounds GCA 108906 was detected in samples from the upstream well of M1and present in the groundwater before metalaxyl-M was applied. The backgroundconcentration makes it difficult to determine whether the elevated concentrationsobserved in downstream monitoring wells are due to the metalaxyl-M applied in2010 or to previous applications “upstream”. Evaluating these results it should be99
noted that the precipitation following the application amounted to 140 mm in July2004 (97% higher than normal) and 111 mm in June 2004 (50% higher than normal)(see Appendix 4 and Table 3). Both metabolites were found at Jyndevad inconcentrations exceeding 0,1�g/l and in increasing concentrations.•At Estrup, CL153815 (degradation product of picolinafen) leached through the rootzone upper meter into the drainage water in average concentrations exceeding 0.1�g/l (Appendix 5). CL153815 has not been detected in deeper monitoring screens(Table 17). Leaching of CL153815 has not been observed on the sandy soil atJyndevad after application in October 2007, (Table 15, Table 17 and Appendix 5).•Pirimicarb together with its two degradation products pirimicarb-desmethyl andpirimicarb-desmethyl-formamido has been included in the monitoring programmefor all five sites. All of the three compounds have been detected, but onlypirimicarb-desmethyl-formamido leached through the root zone (1 m b.g.s.) enteringthe drainage system in average concentrations exceeding 0.1 �g/l (Table 15) atEstrup. Comparable high levels of leaching of pirimicarb-desmethyl-formamidohave not been observed with any of the previous applications of pirimicarb at theother PLAP sites (Table 15 and Kjæret al.,2004). Both degradation products(pirimicarb-desmethyl and pirimicarb-desmethyl-formamido) have been detected indeeper monitoring screens at Faardrup (Table 17 and 18).•Propyzamide leached through the root zone (1 m b.g.s.) at the loamy Silstrup andFaardrup sites, entering the drainage system at average concentrations exceeding 0.1�g/l (Table 15 and 16). Propyzamide was also detected in the monitoring screenssituated beneath the drainage system. Apart from a few samples at Silstrup, theconcentrations in the groundwater from the screens were always less than 0.1 �g/l(Appendix 5, Table 17 and 18).•One degradation product of rimsulfuron – PPU – leached from the root zone (1 mb.g.s.) in average concentrations reaching 0.10–0.13 �g/l at the sandy soil site atJyndevad. Minor leaching of PPU was also seen at the sandy site Tylstrup, wherelow concentrations (0.021-0.11 �g/l) were detected in the soil water sampled 1 and 2m b.g.s (Table 15 and 16). In groundwater PPU was occasionally detected and twiceexceeded 0.1 �g/l at Jyndevad, whereas it was only detected once (and at a lowconcentration) at Tylstrup (Table 17 and 18). At both sites, PPU was relativelystable and persisted in the soil water for several years, with relatively little furtherdegradation into PPU-desamino. E.g. average leaching concentrations reaching 0.1�g/l were seen as much as three years after application at Jyndevad. With an overalltransport time of about four years, PPU reached the downstream monitoring screens.Thus, the concentration of PPU-desamino was much lower and apart from foursamples at Jyndevad, never exceeded 0.1 �g/l. It should be noted that theconcentration of PPU is likely to be underestimated by up to 22-47%. Results fromthe field-spiked samples thus indicate that PPU is unstable and may have furtherdegraded to PPU-desamino during analysis (Rosenbomet al.,2010a).•Terbuthylazine as well as its degradation products leached through the root zone (1m b.g.s.) at high average concentrations on loamy soils. At the three loamy soil sitesSilstrup, Estrup, and Faardrup, desethyl-terbuthylazine leached from the upper meterentering the drainage water in average concentrations exceeding 0.1 �g/l (Table 15100
and 16). Four years after application in 2005 at Estrup, both terbuthylazine anddesethyl-terbuthylazine were detected in drainage water, but not exceeding 0.1 �g/l.At Silstrup (Kjæret al.,2007) and Faardrup (Kjæret al.,2009), desethyl-terbuthylazine was frequently detected in the monitoring screens situated beneaththe drainage system (Table 17 and 18) at concentrations exceeding 0.1 �g/l during a2- and 24-month period, respectively. Leaching at Estrup (Kjæret al.,2007) wasconfined to the drainage depth, however. Minor leaching of desethyl-terbuthylazinewas also seen at the two sandy sites Jyndevad and Tylstrup, where desethyl-terbuthylazine was detected in low concentrations (<0.1 �g/l) in the soil watersampled 1 m b.g.s. While desethyl-terbuthylazine was not detected in thegroundwater monitoring screens at Tylstrup, it was frequently detected in lowconcentration (< 0.1 �g/l) at Jyndevad (Table 18, Kjæret al.,2004). Markedleaching of terbuthylazine was also seen at two of the three loamy sites (Estrup andFaardrup), the leaching pattern being similar to that of desethyl-terbuthylazine. 2-hydroxy-desethyl-terbuthylazine and Hydroxy-terbuthylazine leached at bothFaardrup and Estrup and at the latter site the average drainage concentrationexceeded 0.1 �g/l. Leaching of these two degradation products was at both sitesconfined to the drainage system. None of the two degradation products weredetected in groundwater monitoring screen at Estrup, whereas at Faardrup both werefound, but at low frequencies of detection and concentrations.
Frequency of detection (%)0%Diketo-metribuzinPPUCGA 108906Desamino-diketo-metribuzinDesisopropylatrazineCGA 62826ETUPPU-desaminoMetalaxyl-M2-hydroxy-desethyl-terbuthylazineDesethyl-terbuthylazineHydroxy-terbuthylazineBentazoneBromoxynilClopyralidCGA 108906CGA 62826PPUDiketo-metribuzinPPU-desaminoMetalaxyl-MBentazoneDesethyl-terbuthylazineAmidosulfuronBifenox2-amino-N-isopropylbenzamideBifenox acidPicolinafenAMPAPirimicarb-desmethyl
Frequency of detection (%)80%100%0%
20%
40%
60%
20%
40%
60%
80%B
100%
A
TylstrupSuction cups
TylstrupGroundwater monitoring screens
C
D
JyndevadSuction cups>=0.1 �g/l< 0.1 �g/l
JyndevadGroundwater monitoring screens>=0.1 �g/l< 0.1 �g/l
Figure 43.Frequency of detection in samples from the suction cups (left) and groundwater monitoring screenslocated deeper than the suction cups (right) at the sandy soil sites:Tylstrup(A, B) andJyndevad(C, D). Frequencyis estimated for the entire monitoring period and the length of time that the different pesticides have been included inthe programme and the number of analysed samples thus varies considerably among the different pesticides. Thefigure only includes the fifteen most frequently detected pesticides. Pesticides monitored for less than one year arenot included.
101
•Tebuconazole has been applied in autumn 2007 at Tylstrup, Jyndevad, Estrup andFaardrup. Only on the loamy soil of Estrup did it leach through the root zone (1 mb.g.s.) and into the drainage water in average concentrations exceeding 0.1 �g/l in anaverage yearly concentration of 0,44 �g/l (Table 15 and 16). Leaching was mainlyconfined to the depth of the drainage system, although the snow melt occurring inMarch 2011 (more than two years after application) induced leaching oftebuconazole to the groundwater monitoring well in concentrations exceeding 0.1�g/l (Table 17 and 18). None of the applications at the three other PLAP sites causedtebuconazole to be detected in similarly high concentrations in the vadose zone,though concentrations below 0.1 �g/l have been detected in a few samples from thegroundwater monitoring screens (Table 17 and 18).Frequency of detection (%)0%Desethyl-terbuthylazineAMPACyPMTerbuthylazineHydroxy-terbuthylazine2-hydroxy-desethyl-terbuthylazineGlyphosateTebuconazoleBentazoneAzoxystrobinDesisopropylatrazineDesamino-metamitronCL153815MetamitronEpoxiconazole
Frequency of detection (%)80%100% 0%20%40%60%80%100%
20%
40%
60%
A
B
EstrupDrainage system
EstrupGroundwater monitoring screens
Desethyl-terbuthylazineAMPACyPMTerbuthylazineDesisopropylatrazineBifenox acidGlyphosateTFMP2-hydroxy-desethyl-terbuthylazineBentazoneHydroxy-terbuthylazinePropyzamideDesamino-metamitronRH-24644MetamitronDesethyl-terbuthylazineBifenox acidTerbuthylazineDesisopropylatrazineHydroxy-terbuthylazineBifenoxNitrofenBentazone2-hydroxy-desethyl-terbuthylazineDesamino-metamitronEthofumesateTebuconazoleMetamitronFluazifop-PAMPA
CD
SilstrupDrainage system
SilstrupGroundwater monitoring screens
E
F
FaardrupDrainage system
FaardrupGroundwater monitoring screens
>=0.1 �g/l
< 0.1 �g/l
>=0.1 �g/l
< 0.1 �g/l
Figure 44.Frequency of detection in samples from the drainage system (left) and groundwater monitoring screenslocated deeper than the drainage system (right) at the loamy soil sites:Estrup(A, B),Silstrup(C, D) andFaardrup(E, F). Frequency is estimated for the entire monitoring period and the time that the different pesticides have beenincluded in the programme and the number of analysed samples thus varies considerably among the differentpesticides. The figure only includes the fifteen most frequently detected pesticides. Pesticides monitored for less thanone year are not included.
102
The monitoring data also indicate leaching 1 m b.g.s. of a further 17 pesticides (or theirdegradation products), but often in low concentrations. Although the concentrationsdetected 1 m b.g.s. exceeded 0.1 �g/l in several samples, the average leachingconcentration (1 m b.g.s.) did not. This is summarized in Table 15.Table 16 show the number of samples in which the various pesticides were detected oneach site as well as the maximum concentration. Apart from slight leaching of ETU(Kjæret al.,2002) and amidosulfuron, within this group of 17 pesticides (or theirdegradation products) leaching from 1 meter was only observed at the loamy soil sites,where it was associated with pronounced macropore transport, resulting in very rapidmovement of pesticides through the vadose zone. It should be noted that the findingsregarding amidosulfuron are of very limited use since the degradation products – withwhich the leaching risk is probably mainly associated – are not included, as methods fortheir analysis are not yet available.11 of the 43 pesticides applied – about 26% – did not leach at all from 1 m b.g.s. duringthe monitoring period (Table 15). 3 of the 11 were, however, detected in thegroundwater monitoring screens (Table 17). The group of 11 includes the three differentsulfonylureas – metsulfuron-methyl, triasulfuron, iodosulfuron-methyl-sodium andtribenuron-methyl applied at several sites. For example, tribenuron-methyl was appliedat four different sites under different hydrological conditions, with percolation (1 mb.g.s.) during the first month after application ranging from 0 to 114 mm. Themonitoring results give no indication of leaching for any of the compounds or theirdegradation products.It should, however, be noted, that the leaching risk associated with an autumnapplication of tribenuron-methyl, where preferential transport is likely to occur, has notyet been evaluated for the loamy soils.The leaching patterns of the sandy and loamy sites are further illustrated in Figure 43and 44, showing the frequency of detection in samples collected 1 m b.g.s. (suction cupson sandy soils and drainage systems on loamy soils) and the deeper located groundwatermonitoring screens.On the sandy soils the number of leached pesticides as well as the frequency ofdetection was much lower than on loamy soils (Figure 43 and 44), the exceptions beingthe mobile and persistent degradation products of rimsulfuron and metribuzin,frequently found in both suction cups and groundwater monitoring wells. Thisdifference was mainly due to the different flow patterns characterising the two differentsoil types. On the sandy soils infiltrating water mainly passed through the matrix, whichprovide good conditions for sorption and degradation. Pesticides being leached in thesandy soils were thus restricted to mobile as well as persistent pesticides.On the loamy soils pronounced macro pore transport resulted in the pesticides movingvery rapidly through the unsaturated zone. Compared to the sandy soils residence timewas much lower on the structured, loamy soils. As a result of this, various types ofpesticides, even those being strongly sorbed, were prone to leaching on the loamy typesof soil.
103
At the loamy sites pronounced leaching was generally confined to the drainage system(Figure 44). Several pesticides were often detected in the drainage system, whereas thefrequency of detection in the monitoring screens situated beneath the drainage systemwas lower and varied considerably between the three sites (Figure 44). Thesedifferences should be seen in relation to the different sampling procedures applied.Frequent, integrated water samples can be provided from a drainage system thatcontinuously captures water infiltrating throughout the drainage runoff season.However, although the monitoring screens situated beneath the drainage systems weresampled less frequently (on a monthly basis from a limited number of the monitoringscreens (Appendix 2), pesticides were frequently found in selected screens at Faardrupand Silstrup. Hitherto, at the Estrup site, leaching of pesticides has mainly beenconfined to the depth of the drainage system. Apart from 49, 91 and 64 samplescontaining glyphosate, desisopropyl-atrazine, and bentazone respectively, pesticideshave only occasionally been detected in the screens beneath the drainage system(Appendix 5).The differences are, however, largely attributable to the hydrological conditions.Compared to the Silstrup and Faardrup sites, the C horizon (situated beneath thedrainage depth) at the Estrup site is less permeable with less preferential flow throughmacro pores (see Kjæret al.2005c for details). The movement of water and solute maytherefore be slower at Estrup, allowing for dispersion, dilution, sorption and degradationand thereby reducing the risk of transport to deeper soil layers. An indication thereof arethe long periods with groundwater table beyond drainage depth in which an increasinglateral transport to the drainage system and decreased leaching to the deepergroundwater will occur.Comparing the loamy sites, the number of drainage water samples containingpesticides/degradation products was higher at Silstrup and Estrup than at Faardrup,which is largely attributable to the differences in the hydrological conditions.The occurrence of precipitation and subsequent percolation within the first month afterapplication were, generally, higher at Silstrup and Estrup than at Faardrup (Table 7,Table 9 and Table 11).
104
9 ReferencesAllerup, P., and Madsen, H. (1979): Accuracy of point precipitation measurements.Danish Meteorological Institute,Climatological Papers No. 5,Copenhagen, 84 pp.Barlebo, H.C., Rosenbom, A., and Kjær, J. (2007): Evaluation of Pesticide Scenarios forthe Registration Procedure; no. 1178; Danish Environmental Protection Agency.Available on http://www2.mst.dk/common/Udgivramme/Frame.asp?http://www2.mst.dk/Udgiv/publications/2007/978-87-7052-540-/html/default_eng.htm.Boesten, J.J.T.I. (2000): From laboratory to field: uses and limitations of pesticidebehaviour models for the soil/plant system.Weed Res.,40, 123–138.Danish EPA (1997): Bekendtgørelse nr. 637 af 30. juni 1997, Miljø- og Energi-ministeriet 1997.Danish EPA (2007):. Miljømæssig vurdering, Bilag 2 a, Ridomil Gold MZ Pepite(Metalaxyl-M/ Mancozeb).EEC (1971): Directive 71/250/EEC of 15 June 1971 establishing Community methodsof analysis for the official control of feeding-stuffs,Official Journal L 155, 12/07/1971pp. 0013–0037.Information is also available on:http://www.seas.upenn.edu/courses/belab/LabProjects/1997/BE210S97R4R01.htmFunk, W., Dammann, V., and Donnevert, G. (1995): Quality assurance in analyticalchemistry, VCH Verlagsgesellschaft GmbH, Weinheim.Flerchinger, G.N., Seyfried, M.S. and Hardegree, S.P. (2006): Using soil freezingcharacteristics to model multi-season soil water dynamics. Vadose Zone Journal, 5,1143-1153.Juhler, R.K., Henriksen, T., Rosenbom, A.E., and Kjaer, J. (2010): Fate and transport ofchlormequat in subsurface environments.Environ. Sci. Pollut. Res.,17(6), 1245-1256.Jørgensen, L.F., Kjær J., Olsen, P., Rosenbom, A.E., 2012. Corrigendum to "Leachingof azoxystrobin and its degradation product R234886 from Danish agricultural fieldsites" in Chemosphere 88, 554-562.Kjær, J., Ullum, M., Olsen, P., Sjelborg, P., Helweg, A., Mogensen, B., Plauborg, F.,Jørgensen, J.O., Iversen, B.O., Fomsgaard, I., and Lindhardt, B. (2002): The DanishPesticide Leaching Assessment Programme: Monitoring results, May 1999–June 2001,Geological Survey of Denmark and Greenland, 2002.Kjær, J., Ullum, M., Olsen, P., Sjelborg, P., Helweg, A., Mogensen, B., Plauborg, F.,Grant, R., Fomsgaard, I., and Brüsch, W. (2003): The Danish Pesticide LeachingAssessment Programme: Monitoring results, May 1999–June 2002, Geological Surveyof Denmark and Greenland, 2003.105
Kjær, J., Olsen, P., Barlebo, H.C., Juhler, R.K., Plauborg, F., Grant, R., Gudmundsson,L., and Brüsch, W. (2004): The Danish Pesticide Leaching Assessment Programme:Monitoring results, May 1999–June 2003, Geological Survey of Denmark andGreenland, 2004.Kjær, J., Olsen, P., Ullum, M., and Grant, R. (2005a): Leaching of glyphosate andamino-methylphosphonic acid from Danish agricultural field sites,J. Environ. Qual.,34, 608–630.Kjær, J., Olsen, P., Henriksen, T. and Ullum, M. (2005b): Leaching of metribuzinmetabolites and the associated contamination of a sandy Danish aquifer,Environ. Sci.Technol.39, 8374-8381.Kjær, J., Olsen, P., Barlebo, H.C., Juhler, R.K., Henriksen, T., Plauborg, F., Grant, R.,Nyegaard P., and Gudmundsson L. (2005c): The Danish Pesticide Leaching AssessmentProgramme: Monitoring results, May 1999–June 2004, Geological Survey of Denmarkand Greenland, 2005.Kjær, J., Olsen, P., Barlebo, H.C., Henriksen T., Plauborg, F., Grant, R., Nyegaard P.Gudmundsson, L., and Rosenbom, A. (2007): The Danish Pesticide LeachingAssessment Programme: Monitoring results, May 1999–June 2006, Geological Surveyof Denmark and Greenland, 2007.Kjær, J., Rosenbom, A., Olsen, P., Juhler, R.K., Plauborg, F., Grant, R., Nyegaard, P.,Gudmundsson, L., and Brüsch, W. (2008): The Danish pesticide Leaching AssessmentProgramme: Monitoring results May 1999 - June 2007. Geological Survey of Denmarkand Greenland.Copenhagen, 92 pp. + 6 Appendices.Kjær, J., Rosenbom, A., Olsen, P., Ernstsen, V., Plauborg, F., Grant, R., Nyegaard, P,Gudmundsson, L., and Brüsch, W. (2009): The Danish pesticide Leaching AssessmentProgramme: Monitoring results May 1999 - June 2008. Geological Survey of Denmarkand Greenland. Copenhagen, 85 pp. + 6 Appendices.Kjær, J., Rosenbom, A., Olsen, P., Ernstsen, V., Plauborg, F., Grant, R., Gudmundsson,L., and Brüsch, W. (2011): The Danish pesticide Leaching Assessment Programme:Monitoring results May 1999-June 2010. Geological Survey of Denmark andGreenland. Copenhagen, 110 pp. + 6 Appendices.Kördel, von W. (1997): Feldversuche zum Austrag von Pflanzenschutzmitteln überDrainage – Abschätzung der Belastung aquatischer Ökosysteme,Gesunde Pflanzen, 49(5): 163–170 (in German).Jørgensen, L.F.,Kjær, J.,Olsen, P., Rosenbom, A.E. 2012, Leaching of Azoxystrobinand the metabolite R234886 from Danish Agricultural Field Sites, Chemosphere.88:554-562.Laier, T., Hinsby, K., Ernstsen, V. Hansen, B., Larsen F. Thorling, L., Busenberg, E.Plummer, N., Solomon, K., Sültenfuß, J., Aeschbach-Hertig, W., (in prep.): Dating ofyoung groundwater in Denmark using the SF6 and 3H/3He methods, GEUS,Copenhagen 2012.106
Larsbo, M., Roulier, S., Stenemo, F., Kasteel, R., and Jarvis, N. (2005): An improveddual-permeability model of water flow and solute transport in the vadose zone.VadoseZone Journal4(2), 398-406.Lindhardt, B., Abildtrup, C., Vosgerau, H., Olsen, P., Torp, S., Iversen, B. V.,Jørgensen J. O., Plauborg, F., Rasmussen, P., and Gravesen, P. (2001): The DanishPesticide Leaching Assessment Programme: Site characterization and monitoringdesign, Geological Survey of Denmark and Greenland, 2001.Miller, J.N., and Miller, J.C. (2000): Statistics and chemometrics for analyticalchemistry, Pearson, Essex.Plantedirektoratet (2009): Vejledning om gødsknings- og harmoniregler. Planperioden1. august 2008 til 31. juli 2009. Ministeriet for Fødevarer, Landbrug og Fiskeri.Revideretoktober2008.105pp.ISBN978-87-7083-238-0.(Web)http://www.netpublikationer.dk/FVM/9114/pdf/Vejledning_GR_HR_2008-09_rev_udg.pdf.Plantedirektoratet (2010): Vejledning om gødsknings- og harmoniregler. Planperioden1. august 2009 til 31. juli 2010. Ministeriet for Fødevarer, Landbrug og Fiskeri.Revideret udgave 14. September 2009. http://www.netpublikationer.dk/FVM/978-87-7083-418-6/index.htm.Topp, G.C., Davis, J.L. and Annan, A.P. (1980).Electromagnetic determination of soilwater content: Measurements in coaxial transmission lines. Water Resources Research,16, 574-582.Rosenbom, A.E., Kjær, J., Henriksen, T., Ullum, M., and Olsen, P. (2009): Ability ofthe MACRO Model to Predict Long-Term Leaching of Metribuzin andDiketometribuzin,Environ. Sci. Technol.,43(9), 3221-3226.Rosenbom, A.E., Kjær, J., and Olsen, P. (2010a): Long-term leaching of rimsulfurondegradation product through sandy agricultural soils,Chemosphere,79, 830-838.Rosenbom A., Brüsch, W. Juhler, R.K., Ernstsen, V., Gudmundsson, L., Plauborg, F.,Grant, R. and Olsen, P., (2010b): The Danish Pesticide Leaching AssessmentProgramme: Monitoring results May 1999 - June 2009. Geological Survey of Denmarkand Greenland. Copenhagen (available on www.pesticidvarsling.dk).Thorling, L. (ed.) (2011): Grundvand. Status og udvikling 1989-2010. GEUS 2011.ISBN 978-87-7871-324-7.www.geus.dk/publications/grundvandsovervaagning/index.htm.U.S. Environmental Protection Agency (1998): Guidance for prospective groundwatermonitoring studies. Environmental Fate and Effects Division, Office of PesticidePrograms, U.S. Environmental Protection Agency, September 16, 1998.Wilson, A.L. (1970): The performance characteristics of analytical methods II,Talanta17(1), 31–44.107
108
Appendix 1. Chemical abstracts nomenclature for the pesticides encompassed by the PLAP
Table A1.1.Systematic chemical nomenclature for the pesticides and degradation products encompassed by thePLAP.ParameterSystematic chemical nomenclatureAclonifen2-chloro-6-nitro-3-phenoxyanilineAmidosulfuronN-[[[[(4,6-dimethoxy-2-pyrimidinyl)amino]carbonyl]-amino]sulfonyl]-N-methylmethanesulfonamideAzoxystrobinMethyl (E)-2-{2-[(6-(2-cyanophenoxy)-4-pyrimidin-4-yloxy]phenyl}-3-methoxyacrylate-CyPME-2-(2-[6-cyanophenoxy)-pyrimidin-4-yloxy]-phenyl) – 3-methoxyacrylic acidBentazone3-(1-methylethyl)-1H-2,1,3-benzothiadiazin-4(3H)-one 2,2 dioxide- 2-amino-N-isopropyl-benzamide2-amino-N-isopropyl-benzamideBromoxynil3,5-dibromo-4-hydroxybenzonitrileBifenoxmethyl 5-(2,4-dichlorophenoxy)-2-nitrobenzoate-Bifenox acid5-(2,4-dichlorophenoxy)-2-nitrobenzoic acid- Nitrofen2,4-dichlorophenyl 4'-nitrophenyl etherChlormequat2-chloroethyltrimethylammonium chlorideClomazone2-[(2-chlorphenyl)methyl]-4,4-dimethyl-3-isoxazolidione- FMC65317(N-[2- chlorophenol)methyl] -3-hydroxy-2,2- dimethylpropanamide(Propanamide-clomazone)Clopyralid3,6-Dichloropyridine-2-carboxylic acidCyafamid4-chloro-2-cyano-N,N-dimethyl-5-p-tolylimidazole-1-sulfonamideDesmediphamEthyl 3-(phenylcarbamoyloxy)phenylcarbamate- EHPCCarbamic acid, (3-hydroxyphenyl)-ethyl esterDimethoateO,O-dimethyl S-methylcarbamoylmethyl-phosphorodithioateEthofumesate(�)-2-ethoxy-2,3-dihydro-3,3-dimethylbenzofuran-5-yl-methanesulfonate2)- Fluazifop-P(R)-2-(4-((5-(trifluoromethyl)-2-pyridinyl)oxy)phenoxy-propanoic acid- TFMP2)5-trifluoromethyl-pyridin-2-olEpoxiconazole(2RS, 3SR)-1-(2-(2-chlorophenyl)-2,3-epoxy-2-(4-fluorophenyl)propyl)-1H-1,2,4-triazol- ETU1)EthylenethioureaFenpropimorphCis-4-[3-[4-(1,1-dimethylethyl)-phenyl]-2-methylpropyl]-2,6-imethylmorpholine- Fenpropimorph acidCis-4-[3-[4-(2-carboxypropyl)-phenyl]-2-methylpropyl]-2,6-dimethylmorpholineFlamprop-M-isopropylIsopropyl N-benzoyl-N-(3-chloro-4-flourophenyl)-D-alaninate- FlampropN-benzoyl-N-(3-chloro-4-flourophenyl)-D-alanineFlorasulam2’,6’,8-Trifluoro-5-methoxy-s-triazolo [1,5-c]pyrimidine-2-sulfonanilide- Florasulam-desmethylN-(2,6-difluorophenyl)-8-fluro-5-hydroxy[1,2,4]triazolo[1,5-c]pyrimidine-2-sulfonamideFluroxypyr(4-amino-3,5-dichloro-6-fluro-2-pyridinyl)oxy]acetic acidGlyphosateN-(phosphonomethyl)glycine- AMPAAmino-methylphosphonic acidIodosulfuron-methyl-sodiumsodium salt of methyl 4-iodo-2-[[[[(4-methoxy-6-methyl-1,3,5-triazin-2-yl)amino]carbonyl]amino]sulfonyl]benzoate- Triazinamin2-amino-4-methoxy-6-methyl-1,3,5-triazine- Metsulfuron-methylMethyl2-[[[[(4-methoxy-6-methyl-1,3,5-triazine-2-yl)amino]=carbonyl]amino]-sulfonyl]benzoic acidIoxynil4-hydroxy-3,5-diiodobenzonitrileLinuron3-(3,4-dichlorophenyl)-1-methoxy-1-methylureaMCPA(4-chloro-2-methylphenoxy)acetic acid- 2-methyl-4-chlorophenol2-methyl-4-chlorophenolMesosulfuron-methylMethyl 2-[3-(4,6-dimethoxypyrimidin-2-yl)ureidosulfonyl]-4-methanesulfonamidomethylbenzoateMetamitron4-amino-4,5-dihydro-3-methyl-6-phenyl-1,2,4-triazin-5-one- Desamino-metamitron4,5-dihydro-3-methyl-6-phenyl-1,2,4-triazine-5-oneMetribuzin4-amino-6-tert-butyl-4,5-dihydro-3-methylthio-1,2,4-triazine-5-one- Desamino-metribuzin6-(1,1-dimethylethyl)-3-(methylthio)- 1,2,4-triazin-5-(4H)-one- Desamino-diketo-metribuzin6-tert-butyl-4,5-dihydro-3-methylthio-1,2,4-triazine-3,5-dione- Diketo-metribuzin4-amino-6-tert-butyl-4,5-dihydro-1,2,4-triazine-3,5-dioneMetalaxyl-Mmethyl N-(methoxyacetyl)-N-(2,6-xylyl)-D-alaninate-CGA 628262-[(2,6-dimethylphenyl)(methoxyacetyl)amino]propanoic acid- CGA 1089062-[(1-carboxyethyl)(methoxyacetyl)amino]-3-methylbenzoic acidMetsulfuron-methylMethyl2-[[[[(4-methoxy-6-methyl-1,3,5-triazine-2-yl)amino]=carbonyl]amino]-sulfonyl]benzoic acid- Mesosulfuron2-[[[[(4,6-dimethoxy-2-pyrimidinyl)amino]carbonyl]amino]sulfonyl]-4-[[(methylsulfonyl)amino]methyl]benzoic acid
A1-1
Appendix 1. Chemical abstracts nomenclature for the pesticides encompassed by the PLAP
Table A1.1 (continued).encompassed by the PLAP.ParameterPendimethalinPhenmedipham- MHPC-3-aminophenol- PHCP3)Picolinafen- CL153815Pirimicarb- Pirimicarb-desmethyl- Pirimicarb-desmethyl-formamidoPropiconazolePropyzamide- RH-24644- RH-24580- RH-24655ProsulfocarbRimsulfuron- PPU- PPU-desaminoTerbuthylazine- Desethyl-terbuthylazine- Desisopropyl-atrazine- 2-hydroxy-desethyl-terbuthylazine- Hydroxy-terbuthylazineTebuconazoleThiamethoxam- CGA 322704- Triazinamin-methyl4)Thiacloprid-Thiacloprid sulfonic acid
Systematic chemical nomenclature for the pesticides and degradation productsSystematic chemical nomenclatureN-(1-ethyl)-2,6-dinitro-3,4-xynile3-[(methoxycarbonyl)amino]phenyl (3-methylphenyl)carbamateMethyl-N-(3-hydoxyphenyl)-carbamate1-amino-3-hydroxybenzene3-phenyl-4-hydroxy-6-chloropyridazine4'-fluoro-6-(α,α,α-trifluoro-m-tolyloxy)pyridine-2-carboxanilide6-(3-trifluoromethylphenoxy)-2-pyridine carboxylic acid2-(dimethylamino)-5,6-dimethyl-4-pyrimidinyldimethylcarbamate2-(dimethylamino)-5,6-dimethyl-4-pyrimidinylmethylcarbamate2-methylformamido-5,6-dimethylpyrimidine-4-yl dimethylcarbamate1-[[2-(2,4-dichlorophenyl)-4-propyl-1,3-dioxolan-2-yl]methyl]-1H-1,2,4-triazole3,5-dichloro-N-(1,1-dimethylprop-2-ynyl)benzamide2-(3,5-dichlorophenyl)-4,4-dimethyl-5-methylene-oxalzolineN-(1,1-dimethylacetonyl)-3,5-dichlorobenzamide3,5-dichloro-N-(1,1-dimethylpropenyl)benzamideN-[[3-(4-methoxy-6-methyl-1,3,5-triazin-2-yl)-3-[2-(3,3,3,-trifluro=propyl)phenylsulfonyl]ureaN-[[(4,6-dimethoxy-2-pyrimidinyl)amino]carbonyl]-3-(ethylsulfonyl)-2-pyridinesulfonamideN-(4,6-dimethoxy-2-pyrimidinyl-N-((3-ethylsulfonyl)-2-pyridinyl)urea (IN70941)N-((3-(ethylsulfonyl)-2-pyridyl)-4,6 dimethoxy-2 pyrimidinamine (IN70942)6-chloro-N-(1,1-dimethylethyl)-N-ethyl-1,3,5,triazine-2,4-diamine6-chloro-N-(1,1-dimethylethyl)-1,3,5,triazine-2,4-diamine6-chloro-N-ethyl-1,3,5,triazine-2,4-diamine6-hydroxy-N-(1,1-dimethylethyl)-1,3,5,triazine-2,4-diamine
6-hydroxy-N-(1,1-dimethylethyl)-N´-ethyl-1,3,5,triazine-2,4-diaminea-[2-(4-chlorophenyl)ethyl]-a-(1,1-dimethylethyl)-1H-1,2,4-triazole-1-ethanol3-(2-cholro-thiazol-5-ylmethyl)-5-methyl[1,3,5]oxadiazinan-4ylidene-N-nitroamine[C(E)]-N-[(2-chloro-5-thiazolyl)methyl]-N'-methyl-N'-nitroguanidine4-methoxy-6-methyl-1,3,5-triazin-methylamine(Z)-3-(6-chloro-3-pyridylmethyl)-1,3-thiazolidin-2-ylidenecyanamidesodium 2-[[[(aminocarbonyl)amino]-carbonyl][(6-chloro-3-pyridinyl)-methyl]amino]ethanesulfonate-Thiacloprid-amide(3-[(6-chloro-3-pyridinyl)methyl]-2-thiazolidinylidene) urea-M342-{carbamoyl[(6-chloropyridin-3-yl)methyl]amino}etanesulfonic acidTriflusulfuron-methylmethyl 2-[4-dimethylamino-6-(2,2,2-trifluoroethoxy)-1,3,5-triazin-2-ylcarbamoylsulfamoyl]-m-toluate- IN-E7710N-methyl-6-(2,2,2-trifluoroethoxy)-1,3,5-triazine-2,4-diamine- IN-D8526N,N-dimethyl-6-(2,2,2-trifluoroethoxy)-1,3,5-triazine-2,4-diamine- IN-M72226-(2,2,2-trifluoroethoxy)-1,3,5-triazine-2,4-diamineTriasulfuron1-[2-(2-chloroethoxy)phenylsulfonyl]-2-(4-methoxy-6-methyl-1,3,5-triazine-2-yl)-urea1)Degradation product of mancozeb.2)Degradation product of fluazifop-P-butyl.3)Degradation product of pyridate.4)Degradation product of tribenuron-methyl.
A1-2
Appendix 2. Pesticide monitoring programme – Sampling procedure
From each of the PLAP sites, samples were collected of groundwater, drainage water and soilwater in the unsaturated zone. A full description of the monitoring design and samplingprocedure is provided in Lindhardtet al.(2001) and Kjæret al.(2003), respectively.Until March 2002, pesticide analysis was performed monthly on water samples from thesuction cups located both 1 m b.g.s. and 2 m b.g.s., from two screens of the horizontalmonitoring wells and from two of the downstream vertical monitoring wells. In addition,more intensive monitoring encompassing all four groups of suction cups, six screens of thehorizontal monitoring wells and five monitoring wells was performed every four months(Kjæret al.,2002). At the loamy sites, the pesticide analysis was also performed on drainagewater samples.The monitoring programme was revised in March 2002 and the number of pesticide analyseswas reduced. At the loamy sites, pesticide analysis of water sampled from the suction cupswas ceased, and the monthly monitoring was restricted to just one monitoring well. AtJyndevad, pesticide analysis of the suction cups located 2 m b.g.s. was ceased and the intervalfor the intensive monitoring encompassing the larger number of monitoring screens wasextended to six months, except for the suction cups 2 m b.g.s. at Tylstrup, where the four-month interval was retained (Kjæret al.,2003).On the sandy soils, the analysis of a number of pesticides in water from the monitoring wellshad to be further reduced, due to economical constraints imposed by the high prices onpesticide analysis. This reduction was based on results from the suction cups implying thatleaching risk of certain pesticides was negligible, why analysis of a limited number ofgroundwater samples would be reasonable (see Table A5.1 and Table A5.2 in Appendix 5).In March 2008, a new revision of the monitoring programme was completed resulting in anoptimization of the programme including an additional reduction in the sampling programme(Table A2.1). On the loamy sites, sampling from the suction cups for inorganic analysis, fromone-two monitoring wells per site, and one horizontal well at Silstrup (H2) and Faardrup (H1)was suspended. On the sandy sites, only sampling from the monitoring well M6 at Tylstruphas been suspended (see Rosenbomet al.,2010b for details).Table A2.1.Pesticide monitoring programme in suction cups (S), horizontal monitoring wells (H) and vertical monitoringwells (M) as of March 2009. Water sampling places (S, H, and M) from where sampling stopped in 2008 and 2009 are givenin bold. Well M10 at Silstrup was included in the programme on 5 February 2009.SiteMonthly monitoringHalf-yearly monitoringNot monitored(Intensive)(Extensive)TylstrupJyndevadSilstrupEstrupFaardrupM4, M5, S1a, S2aM1, M4, S1a, S2aM5, H1.2M4, H1.2M4, M5, H2.3M1, M3, M4, M5, S1a, S2a, S1b*, S2b*M1, M2, M4, M5, M7, S1a, S2aM5, M9, M10, M12, H1.1, H1.2, H1.3M1, M4, M5, M6, H1.1, H1.2, H1.3M4, M5, M6, H2.1, H2.3, H2.5M2,M6,M7M3,M6,S1b, S2bM1, M2, M4,M6, M8, M7,M11,M13,H2.1, H2.2, H2.3M2,M3, M7,M1,M2, M3, M7, H1.1,H1.2,H1.3
S1a and S1b refer to suction cups installed 1 and 2 m b.g.s., respectively, at location S1, whereas S2a and S2b refer to suction cupsinstalled 1 and 2 m b.g.s., respectively, at location S2.*At Tylstrup suctions cups installed 2 m b.g.s are monitored four times a year (see text).
Until July 2004, pesticide analyses were performed weekly on water sampled time-proportionally from the drainage system. Moreover, during storm events additional samples(sampled flow-proportionally over 1–2 days) were also analysed for pesticides. In June 2004the drainage monitoring programme was revised. From July 2004 and onwards pesticideA2-1
Appendix 2. Pesticide monitoring programme – Sampling procedure
analyses were done weekly on water sampled flow- proportionally from the drainage watersystem. See Kjæret al.2003 for further details on the methods of flow-proportional sampling.The weighted average concentration of pesticides in the drainage water was calculatedaccording to the following equation:
C=
∑Mi=1n
n
i
∑Vi=1
i
Mi=Ci¶iV
where:n = Number of weeks within the period of continuous drainage runoff.Vi= Weekly accumulated drainage runoff (mm/week).Ci= Pesticide concentration collected by means of the flow-proportional sampler (�g/l).Until July 2004 where both time and flow-proportional sampling was applied the numberswere:Mi=Cti¶ViIf no flow event occurs within the i'th weekMi=Cfi¶iIf a flow event occurs within the i'th week and if Cfi¶Vfi> Cti¶ViVfwhere:n = Number of weeks within the period of continuous drainage runoff.Vi= Weekly accumulated drainage runoff (mm/week).Vfi= Drainage runoff accumulated during a “flow event” (mm/storm event).Cfi= Pesticide concentration in the “event samples” collected by means of the flow-proportional sampler (�g/l).Cti= Pesticide concentration in the weekly samples collected by means of the time-proportional sampler (�g/l).Table 3, 5, 7, 9 and 11 report the weighted average leachate concentration in the drainagewater within the first drainage season after application. In these tables this calculation periodis defined as the period from application until 1 July the following year, as pesticides areusually present in the first drainage runoff occurring after application of pesticide.On the sandy soils the weighted average concentration of pesticides leached to the suctioncups situated 1 m b.g.s. was estimated using the measured pesticide concentration andestimated percolation on a monthly basis. Pesticide concentrations measured in suction cupsS1 and S2 were assumed to be representative for each sample period. Moreover, accumulatedpercolation rates deriving from the MACRO model were assumed to be representative forboth suction cups S1 and S2. For each of the measured concentrations, the correspondingpercolation (Perc.) was estimated according to the equation:Pi=
∑
t2t1
Pt
wheret = sampling date; t1= 0.5(ti-1+ti) ; t2=0.5(ti+ti+1)Pt= daily percolation at 1 m b.g.s. as estimated by the MACRO model (mm)A2-2
Appendix 2. Pesticide monitoring programme – Sampling procedure
The average concentration was estimated according to the equation:C=
whereCi= measured pesticide concentration in the suction cups located 1 m b.g.s.Table 3 and 6 report the weighted average leachate concentration. In these tables thiscalculation period is defined as the period from the date of first detection until 1 July thefollowing year. On sandy soils the transport of pesticides down to the suction cups situated at1 m depth may take some time. In most cases the first detection of pesticides occurs around 1July, why the reported concentration represents the yearly average concentration. In a fewcases the first detection of pesticides occurs later, but this later occurrence does not affect theweighted average calculation. E.g. the reported average concentration using a calculationperiod from the first detection until 1 July the following year is equal to that using acalculation period of a year (1 July –30 June) the following year). Unless noted theconcentrations listed in Table 3 and 6 can therefore be considered as yearly averageconcentrations. In the few cases where reported concentrations are either not representativefor an annual average concentration or not representative for the given leaching pattern(leaching increases the second or third year after application) a note is inserted in the table.
∑C¶P∑Pii
i
A2-3
Appendix 2. Pesticide monitoring programme – Sampling procedure
A2-4
Appendix 3. Agricultural management
Table A3.1.Management practice atTylstrupduring the 2008 to 2010 growing seasons. The active ingredients of thevarious pesticides are indicated in parentheses.DateManagement pratice14.10.08Stubbleharrowed - depth 7.0 cm10.04.09Ploughed - depth 24 cm.10.04.09Rolled with concrete roller14.04.09Spring barley sown, cv. Keops, seeding rate 170 kg/ha, sowing depth 2.5 cm, row distance 13 cm. Usingcombine driller with a tubular packer roller, Finalplant number 392 /m215.05.09Basagran M75 (bentazone+MCPA) - weeds - 1.5 l/ha23.06.09Amistar (azoxystrobin) - fungi - 1.0 l/ha08.07.09Insecticide - 0.1 l/ha Mavrik (tau-fluvalinat) (not analyzed)08.07.09Irrigation - 27mm20.08.09Harvest of spring barley. Grain yield 53.4 hkg/ha, 85% DM28.08.09Straw remowed, yield 17.4 hkg/ha 100% DM04.04.10Ploughed - 24 cm depth26.04.10Rolled with concrete roller04.05.10Seed bed preparation - 10 cm depth06.05.10Planting of potatoes - cv. Kuras17.05.10Ridging26.05.10Herbicides - 1.0 l/ha Fenix (aclonifen) + 10 g/ha Titus WSB (rimsulfuron)08.06.10Herbicide - 20 g/ha Titus WSB (rimsulfuron)15.06.10Fungicide - 0.2 l/ha Ranman (cyazofamid)24.06.10Fungicide - 0.2 l/ha Ranman (cyazofamid)01.07.10Fungicide - 0.2 l/ha Ranman (cyazofamid)06.07.10Irrigation - 29 mm09.07.10Fungicide - 2.0 kg/ha Ridomil Gold MZ Pepite (mancozeb - metalaxyl) (mancozeb not analyzed)16.07.10Fungicide - 0.2 l/ha Ranman (cyazofamid)23.07.10Fungicide - 0.2 l/ha Ranman (cyazofamid)27.07.10Irrigation - 28 mm02.08.10Fungicide - 0.2 l/ha Ranman (cyazofamid)09.08.10Fungicide - 2.0 kg/ha Dithane NT (mancozeb) (not analyzed)17.08.10Fungicide - 2.0 kg/ha Dithane NT (mancozeb) (not analyzed)23.08.10Fungicide - 2.0 kg/ha Dithane NT (mancozeb) (not analyzed)20.10.10Harvest of potatoes. Tuber yield 128.0 hkg/ha, 100% DM17.04.11Ploughed - 24 cm depth18.04.11Rolled with concrete roller19.04.11Seed bed preparation - 8 cm depth19.04.11Spring barley sown, cv.TamTam10.05.11Herbicides - 0.4 l/ha Oxitril CM (ioxynil + bromoxynil) (not analyzed)20.06.11Fungicide - 1.5 L/ha Bell (boscalid + epoxiconazol) (epoxiconazol not analyzed)
A3-1
Appendix 3. Agricultural management
Table A3.2.Management practice atJyndevadduring the 2008 to 2011 growing seasons. The active ingredients of thevarious pesticides are indicated in parentheses.DateManagement practice07.05.08Irrigation - 42 mm14.05.08Irrigation - 27 mm21.05.08Irrigation - 27 mm30.05.08Irrigation - 30 mm05.06.08Irrigation - 35 mm11.06.08Fungicide - 1.0 l/ha Amistar (azoxystrobin)25.06.08Irrigation - 35 mm08.07.08Irrigation - 30 mm30.08.08Winter wheat harvested (seed yield 68.1 hkg/ha 85% DM, straw yield 28.1 hkg/ha 100% DM)17.03.09Ploughed - 22 cm depth18.03.09Rolled with a concrete roller18.03.09Spring barley sown cv. Simba27.04.09Herbicide - 1.2 l/ha Fox 480 SC (bifenox)11.05.09Herbicide - 1.5 l/ha Basagran M75 (bentazone+ MCPA)26.05.09Fungicide - 1.5 l/ha Bell (boscalide + epoxiconazole)27.05.09Irrigation - 30 mm05.06.09Irrigation - 27 mm29.06.09Irrigation - 27 mm07.08.09Harvest of spring barley. Grain yield 64.0 hkg/ha 85% DM, straw yield 19.5 hkg/ha 100% DM14.04.10Ploughed. Depth 24 cm15.04.10Rolled with concrete roller22.04.10Seedbed preparation - 9 cm depth04.05.10Planting of potatoes - cv. Kuras04.05.10Ridging27.05.10Herbicides - 1.0 l/ha Fenix (aclonifen) + 10 g/ha Titus WSB (rimsulfuron)08.06.10Herbicide - 20 g/ha Titus WSB (rimsulfuron)24.06.10Irrigation - 25 mm28.06.10Fungicide - 0.2 l/ha Ranman (cyazofamid)30.06.10Irrigation - 25 mm06.07.10Fungicide - 0.5 l/ha Amistar (azoxystrobin) (not analyzed)07.07.10Fungicide - 0.2 l/ha Ranman (cyazofamid)08.07.10Irrigation - 30 mm14.07.10Fungicide - 0.2 l/ha Ranman (cyazofamid)16.07.10Pesticide - 0.3 kg/ha Karate 2,5 WG (Lambda-cyhalothrin) (not analyzed)25.07.10Fungicide - 2.0 kg/ha Ridomil Gold MZ Pepite (metalaxyl + mancozeb) (mancozeb not analyzed)01.08.10Fungicide - 0.2 l/ha Ranman (cyazofamid)09.08.10Fungicide - 0.2 l/ha Ranman (cyazofamid)16.08.10Fungicide - 0.2 l/ha Ranman (cyazofamid)23.08.10Fungicide - 2.0 l/ha Tyfon (propamocarb + fenamidon) (not analyzed)31.08.10Fungicide - 2.0 kg/ha Dithane NT (mancozeb) (not analyzed)10.09.10Fungicide - 2.0 kg/ha Dithane NT (mancozeb) (not analyzed)23.09.10Fungicide - 0.4 l /ha Shirlan (fluazinam) (not analyzed)19.10.10Harvest of potatoes Tuber yield 120.6 hkg/ha, 100% DM22.03.11Ploughed - 24 cm depth23.03.11Spring barley sown - cv. Quench24.03.11Rolled with concrete roller26.04.11Herbicides - 0.5 l/ha Oxitril CM (bromoxynil + ioxynil) (not analyzed) + 0.25 l/ha DFF (diflufenican)02.05.11Irrigation - 30 mm23.05.11Irrigation - 32 mm
A3-2
Appendix 3. Agricultural management
Table A3.3.Management practice atSilstrupduring the 2008 to 2011 growing seasons. The active ingredients of the variouspesticides are indicated in parentheses.DateManagement practice07.05.08Fodder beet sown - cv. Kyros22.05.08Herbicide - 30 g/ha Safari (triflusulfuron) + 0.5 l/ha Goliath (metamitron) + 1.5 l/ha Betanal (phenmedipham)30.05.08Herbicide - 30 g/ha Safari (Triflusulfuron-methyl) + 0.5 l/ha Goliath (metamitron) + 1.5 l/ha Betanal(phenmedipham) + 0.07 l/ha Tramat 500 SC (ethofumesate)17.06.08Herbicide - 30 g/ha Safari (Triflusulfuron-methyl) + 0.5 l/ha Goliath (metamitron) + 1.5 l/ha Betanal(phenmedipham) + 0.07 l/ha Tramat 500 SC (ethofumesate)26.06.08Insecticide - 0.30kg/ha Pirimor G (pirimicarb)01.07.08Herbicide - 3.0 l/ha Fusilade Max (fluazifop-P-butyl)04.07.08Herbicide - 30 g/ha Safari (Triflusulfuron-methyl) + 0.5 l/ha Goliath (metamitron) + 1.5 l/ha Betanal(phenmedipham)09.07.08Insecticide - 0.300 kg/ha Pirimor G (pirimicarb)27.10.08Fodder beet harvested. Yield of root 17.3 t/ha 100% DM, yield of top 5.15 t/ha 100% DM15.12.08Ploughed - 23 cm depth02.04.09Tracer - 31.5 kg/ha potassium bromide11.04.09Rolled with Cambridge roller11.04.09Spring barley sown - cv. Keops; undersown red fescue cv. Jasperina19.05.09Herbicide -1.25 l/ha Fighter 480 (bentazone)24.06.09Fungicide - 1.0 l/ha Amistar (azoxystrobin)16.07.09Wholecrop harvest of spring barley - 94.6 hkg/ha 100% DM24.08.09Herbicide - 0.020 l/ha Hussar OD (iodosulfuron)09.09.09Herbicide - 1.5 l/ha Fox 480 SC (bifenox)02.05.10Herbicide - 1.5 l/ha Fusilade Max (fluazifop-P-butyl)05.05.10Herbicides - 0.1 l/ha Hussar OD (iodosulfuron) + 0.7 l/ha SweDane MCPA 750 (not analyzed)20.07.10Harvest of grass. Seed yield 16.5 hkg/ha, 87% DM21.07.10Straw burned, 69.3 hkg/ha, 100% DM15.04.11Herbicide - 0.05 l/ha Hussat OD (iodosulfuron) (not analyzed)26.04.11Herbicide - 1.5 l/ha Fusilade Max (fluazifop-P-butyl)
A3-3
Appendix 3. Agricultural management
Table A3.4.Management practice atEstrupduring the 2008 to 2011 growing seasons. The active ingredients of the variouspesticides are indicated in parentheses.DateManagement practice13.06.08Fungicide - 1.0 Amistar (azoxystrobin)16.08.08Winter wheat harvested (seed yield 83.8 hkg/ha 85% DM)16.08.08Straw shredded - 40.7 hkg/ha 100% DM12.03.09Ploughed - depth 18 cm - packed with a ring roller06.04.09Tracer - 30 kg/ha potassium bromide08.04.09Spring barley sown - cv. Keops08.04.09Rolled with a cambridge roller01.05.09Herbicide - 1.2 l/ha Fox 480 SC (bifenox)14.05.09Herbicide - 1.5 l/ha Basagran M75 (bentazone/MCPA)04.06.09Fungicide - 1.0 l/ha Amistar (azoxystrobin)07.08.09Spring barley harvested. Grain yield 71.4 hkg/ha, 85% DM,07.08.09Straw shredded. 39.9 hkg/ha, 100% DM24.08.09Ploughed - 20 cm depth - packed with a ring roller24.08.09Rotor harrowed - 4 cm depth24.08.09Winter rape sown - cv.Cabernet25.08.09Herbicide - 0.33 l/ha Command CS (clomazone)30.09.09Herbicide - 0.75 l/ha Fox 480 SC (bifenox)09.10.09Insecticide - 0.15 l/ha Cyperb (cypermethrin) (not analyzed)20.04.10Field partially resown with spring rape - cv. Pluto10.05.10Insecticide - 0.3 l/ha Biscay OD 240 (thiacloprid)20.08.10Winter rape harvested. Seed yield 38.3 hkg/ha, 91% DM06.09.10Rotor harrowed - 5 cm depth14.09.10Ploughed - 20 cm depth - packed with a ring roller14.09.10Seedbed preparation - 5 cm depth14.09.10Winter wheat sown cv. Frument30.09.10Herbicide - 1 tablet/ha Express ST (tribenuron-methyl)26.04.11Herbicide - 1.2 l/ha Fox 480 SC (bifenox)09.05.11Fungicide - 0.5 l/ha Flexity (metrafenon)07.06.11Fungicide - 0.5 l/ha Flexity (metrafenon)
A3-4
Appendix 3. Agricultural management
Table A3.5.Management practice atFaardrupduring the 2008 to 2011 growing seasons. The active ingredients of thevarious pesticides are indicated in parentheses.DateManagement practice10.08.07Stubble cultivation - 15 cm depth22.08.07Stubble cultivation - 15 cm depth18.09.07Ploughed and packed - 25 cm depth18.09.07Winter wheat sown – cv. Ambition09.10.07Herbicide - 5.0 l/ha Stomp (pendimethalin)20.11.07Fungicide - 1.0 l/ha Folicur 250 (tebuconazole)20.08.08Winter wheat harvested (seed yield 89.6 hkg 85% DM, straw yield 65.2 hkg/ha 100% DM)26.08.08Tracer - 30 kg/ha potassium bromide01.12.08Ploughing - 23 cm depth05.04.09Sugar beet sown - cv. Palace24.04.09Herbicide - 1.5 l/ha Betanal (phenmedipham) + 1.0 l/ha Goliath (metamitron)30.04.09Herbicide - 10 g/ha Safari (Triflusulfuron-methyl) + 1.5 l/ha Betanal (phenmedipham) + 1.0 l/ha Goliath(metamitron) + 0.07 l/ha Ethosan (ethofumesate)11.05.09Herbicide - 10 g/ha Safari (Triflusulfuron-methyl) + 1.5 l/ha Betanal (phenmedipham) + 1.0 l/ha Goliath(metamitron) + 0.07 l/ha Ethosan (ethofumesate)14.05.09Herbicide - 1.0 l/ha Focus Ultra (cycloxydim)17.06.09Herbicide - 1.0 l/ha Focus Ultra (cycloxydim)06.10.09Sugar beet harvested. Root yield 147.9 hkg/ha 100% DM, top yield 40.1 hkg/ha, 100% DM01.11.09Ploughing - 20 cm depth07.04.10Seed bed preparation - 6 cm depth22.04.10Spring barley sown - mixture of varieties. Undersown red fescue - cv Maximum01.06.10Herbicide - 1.25 l/ha Fighter 480 (bentazon)02.07.10Fungicide - 1.0 l/ha Amistar (azoxystrobin) (not analyzed)21.08.10Spring barley harvested. Grain yield 58.5 hkg/ha, 85% DM21.08.10Straw removed. Straw yield 27.5 hkg/ha25.10.10Herbicide - 1.5 l/ha Fox 480 SC (bifenox)21.05.11Herbicide - 1.5 l/ha Fusilade Max (fluazifop-P-butyl)
A3-5
Appendix 3. Agricultural management
A3-6
Appendix 4. Pricipitation data for the PLAP sites
Figure A4.1.Monthly precipitation at all localities for the monitoring period July 2000–June 2010. Normal values (1961–1990) are included for comparison.
A4-1
Appendix 4. Pricipitation data for the PLAP sites
A4-2
Appendix 5. Pesticide detections in samples for drains, suction cups and groundwater monitoring wells
Table A5.1.Number of samples where pesticides were either not detected (nd), detected in concentrations below 0.1 �g/l(<0.1 �g/l) or detected in concentrations above 0.1 �g/l (>=0.1�g/l) atTylstrup.Numbers are accumulated for the entiremonitoring period, and pesticides monitored for less than one year are not included.Vertical<0.1>=�g/l0.1�g/l..........................................2.45182.6.2345..1413151...................19.....1.1...1.............Suction cups<0.1>=�g/ 0.1�g/l........1............................7127435.1942.........14540..52171.........6..51.61..........3............
ParentAclonifenAzoxystrobinBentazoneBromoxynilClomazoneClopyralidCyazofamidDimethoateEpoxiconazoleFenpropimorphFlamprop-M-isopropylFluazifop-P-butylFluroxypyrIoxynilLinuronMancozebMetalaxyl-MMetribuzin
PendimethalinPirimicarbPropiconazolePropyzamide
RimsulfuronTebuconazoleTerbuthylazine
ThiamethoxamTriasulfuronTribenuron-methyl
CompoundAclonifenAzoxystrobinCyPM2-amino-N-isopropylbenzamideBentazoneBromoxynilClomazoneFMC 65317ClopyralidCyazofamidDimethoateEpoxiconazoleFenpropimorphFenpropimorph acidFlampropFlamprop-M-isopropylFluazifop-PTFMPFluroxypyrIoxynilLinuronETUCGA 108906CGA 62826Metalaxyl-MDesamino-diketo-metribuzinDesamino-metribuzinDiketo-metribuzinMetribuzinPendimethalinPirimicarbPirimicarb-desmethylPirimicarb-desmethyl-formamidoPropiconazolePropyzamideRH-24580RH-24644RH-24655PPUPPU-desaminoRimsulfuronTebuconazole2-hydroxy-desethyl-terbuthylazineDesethyl-terbuthylazineDesisopropylatrazineHydroxy-terbuthylazineTerbuthylazineCGA 322704ThiamethoxamTriasulfuronTriazinamin-methyl
nd66216216191330192224208776617619930727617617617831941982701983646028936559386430295295167307221221221157543562178195190191190191179175175295440
nd369595721367282767836637489736363636972673716273216785658914482815289828282587218065776770557172646482137
A5-1
Appendix 5. Pesticide detections in samples for drains, suction cups and groundwater monitoring wells
Table A5.2.Number of samples where pesticides were either not detected (nd), detected in concentrations below 0.1 �g/l(<0.1 �g/l) or detected in concentrations above 0.1 �g/l (>=0.1�g/l) atJyndevad.Numbers are accumulated for the entiremonitoring period, and pesticides monitored for less than one year are not included.VerticalSuction cups>=>=ParentCompoundnd <0.1 �g/l0.1�g/lnd <0.1 �g/l0.1�g/lAclonifen72..18..AclonifenAmidosulfuron88..2021AmidosulfuronDesmethyl-amidosulfuron88..23..Azoxystrobin233..65..AzoxystrobinCyPM233..65..2-amino-N-isopropylbenzamide178..452.BentazoneBentazone436..80345Bifenox1572.402.BifenoxBifenox acid*107..281.Nitrofen159..42..Bromoxynil218..61..BromoxynilChlormequat14..28..ChlormequatCyazofamid72..18..CyazofamidDimethoate190..52..DimethoateEpoxiconazole3231.90..EpoxiconazoleFenpropimorph2531.781.FenpropimorphFenpropimorph acid260..79..Florasulam191..54..FlorasulamFlorasulam-desmethyl28..Fluazifop-P190..51..Fluazifop-P-butylTFMP3..Fluroxypyr193..55..FluroxypyrAMPA2212.681.GlyphosateGlyphosate223..69..Ioxynil218..61..Ioxynil2-methyl-4-chlorophenol210..56..MCPAMCPA210..56..Mesosulfuron12..45..Mesosulfuron-methylMesosulfuron-methyl285..78..CGA 108906738272216Metalaxyl-MCGA 628265121.3512Metalaxyl-M6435117.Desamino-diketo-metribuzin67136..MetribuzinDesamino-metribuzin26..4..Diketo-metribuzin.71933.Metribuzin26..6..Pendimethalin257..71..PendimethalinCL15381535..36..PicolinafenPicolinafen35..351.Pirimicarb251..69..PirimicarbPirimicarb-desmethyl251..681.Pirimicarb-desmethyl-formamido251..69..Propiconazole293..89..PropiconazolePHCP184..59..PyridatePyridate116..39..PPU44831723911454RimsulfuronPPU-desamino69176. 109944Rimsulfuron189..52..Tebuconazole2131.58..TebuconazoleDesethyl-terbuthylazine49027. 13020.TerbuthylazineTerbuthylazine260..79..Triazinamin-methyl248..77..Tribenuron-methyl*Number of analysed samples collected from the monitoring wells was reduced (see Appendix 2 for explanation).
A5-2
Appendix 5. Pesticide detections in samples for drains, suction cups and groundwater monitoring wells
Table A5.3.Number of samples where pesticides were either not detected (nd), detected in concentrations below 0.1 �g/l(<0.1 �g/l) or detected in concentrations above 0.1 �g/l (>=0.1�g/l) atSilstrup.Numbers are accumulated for the entiremonitoring period, and pesticides monitored for less than one year are not included.Drainage<0,1>=nd �g/l 0.1�g/l11713165753013301204410168813612782817370115275025806060151519711191531001011601731417643645166696211.1069.401.1.1.....14.1711.4.10852.....422814...141.617215.4...Horizontal<0,1>=nd �g/l 0.1�g/lVerticalSuction cups<0,1>=<0,1>=nd �g/l 0.1�g/l nd �g/l 0.1�g/l
ParentCompoundAmidosulfuronAmidosulfuronDesmethyl-amidosulfuronAzoxystrobinAzoxystrobinCyPM2-amino-N-BentazoneisopropylbenzamideBentazoneBifenoxBifenoxBifenox acidNitrofenBromoxynilBromoxynilChlormequatChlormequatClopyralidClopyralidDesmediphamDesmediphamEHPCDimethoateDimethoateEpoxiconazoleEpoxiconazoleEthofumesateEthofumesateFenpropimorphFenpropimorphFenpropimorph acidFlamprop-M-FlampropFlamprop-M-isopropylisopropylFluazifop-PFluazifop-P-TFMPbutylFluroxypyrFluroxypyrAMPAGlyphosateGlyphosateIodosulfuron-Iodosulfuron-methyl-sodiummethyl-sodiumMetsulfuron-methylIoxynilIoxynil2-methyl-4-MCPAchlorophenolMCPADesamino-MetamitronmetamitronMetamitronPendimethalinPendimethalinPhenmedipham3-aminophenolMHPCPhenmediphamPirimicarbPirimicarbPirimicarb-desmethylPirimicarb-desmethyl-formamidoPropiconazolePropiconazolePropyzamidePropyzamideRH-24580RH-24644RH-24655ProsulfocarbProsulfocarbPHCPPyridatePPURimsulfuronPPU-desamino
.. 1064 135. 745 133. 3112 26. 31.. 36. 67. 107. 621 73. 621 169. 74. 74. 741 73. 14017 57. 7414 12315 128.....33.....8585676716516112270106108210
.8.8.1...1.1.2...1110.5.....310........2.1.12
. 202. 257. 1311 244. 614 57. 66................6612424011814811735514814714814829991142226232
.20.1851.......3.....29.104....2317....3...5.1..8
...2.7...........
58202754272726
...3.......
...2.......
. 27. 569.. 8. 8....12.....404036555959
. 165. 165. 124. 1233......334339223170234240433
1510.......
49.......
. 210. 160. 746 75. 78. 77. 781 784 66..
. 436..1.....308148143149148149147109
. 59. 20. 271....4
A5-3
Appendix 5. Pesticide detections in samples for drains, suction cups and groundwater monitoring wells
Table A5.3 (continued).Number of samples where pesticides were either not detected (nd), detected in concentrationsbelow 0.1 �g/l (<0.1 �g/l) or detected in concentrations above 0.1 �g/l (>=0.1�g/l) atSilstrup.Numbers are accumulated forthe entire monitoring period, and pesticides monitored for less than one year are not included.Drainage<0,1>=nd �g/l 0.1�g/l43828453182322732322764432651..5..1Horizontal<0,1>=nd �g/l 0.1�g/l84.32..5...1.VerticalSuction cups<0,1>=<0,1>=nd �g/l 0.1�g/l nd �g/l 0.1�g/l11274.30......2..1. 27......
ParentCompoundTerbuthylazine2-hydroxy-desethyl-terbuthylazineDesethyl-terbuthylazineDesisopropylatrazineHydroxy-terbuthylazineTerbuthylazineTriazinamin-methylTribenuron-methylTriflusulfuron-IN-D8526methylIN-E7710IN-M7222Triflusulfuron-methyl
. 151. 113. 148. 152. 173. 148. 102. 102. 102. 102
44 101. 84. 849 107.....7456565556
A5-4
Appendix 5. Pesticide detections in samples for drains, suction cups and groundwater monitoring wells
Table A5.4.Number of samples where pesticides were either not detected (nd), detected in concentrations below 0.1 �g/l(<0.1 �g/l) or detected in concentrations above 0.1 �g/l (>=0.1�g/l) atEstrup.Numbers are accumulated for the entiremonitoring period, and pesticides monitored for less than one year are not included.DrainageParentCompoundAmidosulfuronAmidosulfuronAzoxystrobinCyPM2-amino-N-BentazoneisopropylbenzamideBentazoneBifenoxBifenoxBifenox acidNitrofenBromoxynilBromoxynilChlormequatChlormequatClopyralidClopyralidDimethoateDimethoateEpoxiconazoleEpoxiconazoleEthofumesateEthofumesateFenpropimorphFenpropimorphFenpropimorph acidFlamprop-M-FlampropFlamprop-M-isopropylisopropylFlorasulamFlorasulamFlorasulam-desmethylFluroxypyrFluroxypyrAMPAGlyphosateGlyphosateIodosulfuron-Metsulfuron-methylmethyl-sodiumIoxynilIoxynil2-methyl-4-MCPAchlorophenolMCPAMesosulfuron-MesosulfuronMesosulfuron-methylmethylDesamino-MetamitronmetamitronMetamitronPendimethalinPendimethalinCL153815PicolinafenPicolinafenPirimicarbPirimicarbPirimicarb-desmethylPirimicarb-desmethyl-formamidoPropiconazolePropiconazoleTebuconazoleTebuconazoleTerbuthylazine2-hydroxy-desethyl-terbuthylazineDesethyl-terbuthylazineDesisopropylatrazineHydroxy-terbuthylazineTerbuthylazineAzoxystrobin<0,1>=nd �g/l 0.1�g/l991313423717741354413645188359182821191129281875416713111910291746276811195064159199206192404418904349.92109114524.11..12271.1320..1272168.15110.1338274201740.13232463111707278Horizontal<0,1>=nd �g/l 0.1�g/l..6115...............13.................71..Vertical<0,1>=nd �g/l 0.1�g/l10.9... 3541.. 3505.. 271. 439. 81. 81. 81. 125. 56......15969158151124209.1..............1736...1.......1..23..26.1..................3...............2.....Suction cups<0,1>=nd �g/l 0.1�g/l
.14 11194 105. 7912 1221 348 33. 342 41. 18.. 422 198 46. 39. 34. 55..5535
53
.2
.2
32323172323
......
......
. 209. 125....100120577543
. 302 3495 17386 170.5.2..1115.11...13317243511634554134342427464641404067677886395059625063
2323223
..1.
....
. 209. 125. 112. 111. 83.......99158158147118118225
766523
.....
.....
. 226. 266. 310. 118. 180. 232. 197. 180. 222
A5-5
Appendix 5. Pesticide detections in samples for drains, suction cups and groundwater monitoring wells
Table A5.4 (continued).Number of samples where pesticides were either not detected (nd), detected in concentrationsbelow 0.1 �g/l (<0.1 �g/l) or detected in concentrations above 0.1 �g/l (>=0.1�g/l) atEstrup.Numbers are accumulated forthe entire monitoring period, and pesticides monitored for less than one year are not included.DrainageParentThiaclopridCompoundM34ThiaclopridThiacloprid sulfonicacidThiacloprid-amideTriazinamin-methyl<0,1>=nd �g/l 0.1�g/l24..18..231816..2...Horizontal<0,1>=nd �g/l 0.1�g/l18..18..181814......Vertical<0,1>=nd �g/l 0.1�g/l36..37..363731......Suction cups<0,1>=nd �g/l 0.1�g/l
Tribenuron-methyl
A5-6
Appendix 5. Pesticide detections in samples for drains, suction cups and groundwater monitoring wells
Table A5.5.Number of samples where pesticides were either not detected (nd), detected in concentrations below 0.1 �g/l(<0.1 �g/l) or detected in concentrations above 0.1 �g/l (>=0.1�g/l) atFaardrup.Numbers are accumulated for the entiremonitoring period, and pesticides monitored for less than one year are not included.Drainage<0,1>=nd �g/l 0.1�g/l106..1024.671.932792710184849983778115010110176701029918213113799142141147151559799148949717870747073785060218589696868146.5.......7..115..941.1121021.763.2.41.4782242030..HorizontalVertical<0,1>=<0,1>=nd �g/l 0.1�g/l nd �g/l 0.1�g/l92.. 194..92.. 194..61.. 132..5...........1......1.1............1.....1213245..1.1.....................174353435225166166165123148143226225225148142173165163682822822242544..........25....5...221..3620.122321.....1615283025..3..........6....1........124..............30..20..Suction cups<0,1>=nd �g/l 0.1�g/l
ParentAzoxystrobinBentazoneBifenoxBromoxynilClomazoneDesmediphamDimethoateEpoxiconazoleEthofumesateFenpropimorphFlamprop-M-isopropylFluazifop-P-butylFluroxypyrGlyphosateIoxynilMCPAMetamitronPendimethalinPhenmediphamPirimicarb
PropiconazolePropyzamide
ProsulfocarbTebuconazoleTerbuthylazine
Thiamethoxam
CompoundAzoxystrobinCyPM2-amino-N-isopropylbenzamideBentazoneBifenoxBifenox acidNitrofenBromoxynilClomazoneFMC 65317DesmediphamEHPCDimethoateEpoxiconazoleEthofumesateFenpropimorphFenpropimorph acidFlampropFlamprop-M-isopropylFluazifop-PFluazifop-P-butylTFMPFluroxypyrAMPAGlyphosateIoxynil2-methyl-4-chlorophenolMCPADesamino-metamitronMetamitronPendimethalinMHPCPhenmediphamPirimicarbPirimicarb-desmethylPirimicarb-desmethyl-formamidoPropiconazolePropyzamideRH-24580RH-24644RH-24655ProsulfocarbTebuconazole2-hydroxy-desethyl-terbuthylazineDesethyl-terbuthylazineDesisopropylatrazineHydroxy-terbuthylazineTerbuthylazineCGA 322704Thiamethoxam
6 74. 1317 121 13. 811 691 69. 66. 52. 58. 666 104. 80. 81. 58. 563.11..17266714611010981109
732916277373
...2..
......
262973576173
3..51.
......
1 1094 1042 104. 551 66. 66. 116. 66.66
. 255. 209......233125164163318162
2929292973292973
........
........
. 163........372155155155155126120126
. 1382 68. 69. 69. 69. 61. 531 6071111..685785835858
. 149. 166. 1641 149. 126. 126
A5-7
Appendix 5. Pesticide detections in samples for drains, suction cups and groundwater monitoring wells
Table A5.5 (continued).Number of samples where pesticides were either not detected (nd), detected in concentrationsbelow 0.1 �g/l (<0.1 �g/l) or detected in concentrations above 0.1 �g/l (>=0.1�g/l) atFaardrup.Numbers are accumulatedfor the entire monitoring period, and pesticides monitored for less than one year are not included.Drainage<0,1>=nd �g/l 0.1�g/l77..63636363........HorizontalVertical<0,1>=<0,1>=nd �g/l 0.1�g/l nd �g/l 0.1�g/l57.. 147..38383838........92929292........Suction cups<0,1>=nd �g/l 0.1�g/l
ParentTribenuron-methylTriflusulfuron-methyl
CompoundTriazinamin-methylIN-D8526IN-E7710IN-M7222Triflusulfuron-methyl
A5-8
Appendix 6. Laboratory internal control cards
AMPA0.15
Conc(�g/l)
0.100.050.002010/072010/082010/092010/102010/112010/12date2011/012011/022011/032011/042011/052011/06
Azoxystrobin0.15
Conc(�g/l)
0.100.050.002010/072010/082010/092010/102010/112010/12date2011/012011/022011/032011/042011/052011/06
Bentazone0.15
Conc(�g/l)
0.100.050.002010/072010/082010/092010/102010/112010/12date2011/012011/022011/032011/042011/052011/06
Bifenox0.15
Conc(�g/l)
0.100.050.002010/072010/082010/092010/102010/112010/12date2011/012011/022011/032011/042011/052011/06
Bifenoxacid0.15
Conc(�g/l)
0.100.050.002010/072010/082010/092010/102010/112010/12date2011/012011/022011/032011/042011/052011/06
Triazinamin-methyl0.15
Conc(�g/l)
0.100.050.002010/072010/082010/092010/102010/112010/12date2011/012011/022011/032011/042011/052011/06
Figure A6.1.Quality control data for pesticide analysis by laboratory 1. Internal laboratory control samples are indicated by squaresymbols and the nominal level is indicated by the solid grey line ( IQ measured,―IQ nominal concentration). External controlsamples are indicated by circles. Open circles indicate the nominal level (EQ nominal low,EQ nominal high), and closed circlesthe observed concentration ( EQ measured low,EQ measured high).
A6-1
Appendix 6. Laboratory internal control cards
CGA628260.15
Conc(�g/l)
0.100.050.002010/072010/082010/092010/102010/112010/12date2011/012011/022011/032011/042011/052011/06
CGA1089060.15
Conc(�g/l)
0.100.050.002010/072010/082010/092010/102010/112010/12date2011/012011/022011/032011/042011/052011/06
CyPM0.15
Conc(�g/l)
0.100.050.002010/072010/082010/092010/102010/112010/12date2011/012011/022011/032011/042011/052011/06
Desamino-metamitron0.15
Conc(�g/l)
0.100.050.002010/072010/082010/092010/102010/112010/12date2011/012011/022011/032011/042011/052011/06
Ethofumesate0.15
Conc(�g/l)
0.100.050.002010/072010/082010/092010/102010/112010/12date2011/012011/022011/032011/042011/052011/06
Fluazifop-P0.15
Conc(�g/l)
0.100.050.002010/072010/082010/092010/102010/112010/12date2011/012011/022011/032011/042011/052011/06
Figure A6.1 continued.Quality control data for pesticide analysis by laboratory 1. Internal laboratory control samples are indicatedby square symbols and the nominal level is indicated by the solid grey line (IQ measured,―IQ nominal concentration). Externalcontrol samples are indicated by circles. Open circles indicate the nominal level ( EQ nominal low,EQ nominal high), andclosed circles the observed concentration ( EQ measured low,EQ measured high).
A6-2
Appendix 6. Laboratory internal control cards
Glyphosate0.15
Conc(�g/l)
0.100.050.002010/072010/082010/092010/102010/112010/12date2011/012011/022011/032011/042011/052011/06
IN-E77100.15
Conc(�g/l)
0.100.050.002010/072010/082010/092010/102010/112010/12date2011/012011/022011/032011/042011/052011/06
IN-M72220.15
Conc(�g/l)
0.100.050.002010/072010/082010/092010/102010/112010/12date2011/012011/022011/032011/042011/052011/06
Metalaxyl-M0.15
Conc(�g/l)
0.100.050.002010/072010/082010/092010/102010/112010/12date2011/012011/022011/032011/042011/052011/06
Metamitron0.15
Conc(�g/l)
0.100.050.002010/072010/082010/092010/102010/112010/12date2011/012011/022011/032011/042011/052011/06
Metsulfuron-methyl0.15
Conc(�g/l)
0.100.050.002010/072010/082010/092010/102010/112010/12date2011/012011/022011/032011/042011/052011/06
Figure A6.1 continued.Quality control data for pesticide analysis by laboratory 1. Internal laboratory control samples are indicatedby square symbols and the nominal level is indicated by the solid grey line (IQ measured,―IQ nominal concentration). Externalcontrol samples are indicated by circles. Open circles indicate the nominal level ( EQ nominal low,EQ nominal high), andclosed circles the observed concentration ( EQ measured low,EQ measured high).
A6-3
Appendix 6. Laboratory internal control cards
Nitrofen0.15
Conc(�g/l)
0.100.050.002010/072010/082010/092010/102010/112010/12date2011/012011/022011/032011/042011/052011/06
PPU0.15
Conc(�g/l)
0.100.050.002010/072010/082010/092010/102010/112010/12date2011/012011/022011/032011/042011/052011/06
PPU-desamino0.15
Conc(�g/l)
0.100.050.002010/072010/082010/092010/102010/112010/12date2011/012011/022011/032011/042011/052011/06
TFMP0.15
Conc(�g/l)
0.100.050.002010/072010/082010/092010/102010/112010/12date2011/012011/022011/032011/042011/052011/06
Triazinamin0.15
Conc(�g/l)
0.100.050.002010/072010/082010/092010/102010/112010/12date2011/012011/022011/032011/042011/052011/06
Figure A6.1 continued.Quality control data for pesticide analysis by laboratory 1. Internal laboratory control samples are indicatedby square symbols and the nominal level is indicated by the solid grey line (IQ measured,―IQ nominal concentration). Externalcontrol samples are indicated by circles. Open circles indicate the nominal level ( EQ nominal low,EQ nominal high), andclosed circles the observed concentration ( EQ measured low,EQ measured high).
A6-4
Appendix 7. Ridomil application at Tylstrup and Jyndevad
Metalaxyl was on the Danish market from 1980-1995, reported maximum allowed dosage from1984-1995 being 375 gr. a.i./ha. It re-entered the Danish marked in 2007 as Metalaxyl-M with amaximum allowed dosage of 77.6 g/ha. Available usage data is gathered in Table A7.2 andAppendix 8.At Tylstrup exacts information on usage available from 2006 (upstream neighboring field) and 1989(Tylstrup and field 1) and are listed in Table A7.1 At the upstream neighboring fields data coveringthe initial period of metalaxyl usage 1980-19995 were not available, but the following informationhave been obtained from local farmers in the area: From 1980-1995 field 3, 4 and 5 receivedmetalaxyl once every four years when potatoes were grown. Potatoes were never grown on field 2and 6 and metalaxyl have thus not been applied on these fields. Usage data from the Tylstrup fieldsite and site 1 were available from 1989 respectively. From 1980-1989 potatoes were grownapproximately every four year at these two fields but information on the applied fungicide is notavailable.Table A7.1.Ridomil application at theTylstrupPLAP test site (marked in red) and neighboring upstream fields, since metalxylreentered the Danish marked in 2007. The positions of the various fields are indicated in the figure below, those upstream fieldreceiving metalaxyl-M being marked with yellow filling. The direction of groundwater flow is indicated by a blue arrow.
Field-ID51Tylstrup PLAP site3Tylstrup PLAP site (left half of the field)1 (right half of the field)1)
The active ingredient was metalaxyl from 1980-1995 and metalaxyl-M from 2006–2011.
Year ofapplication201120102010200919901989
Dosage(g a.i./ha)1)77.677.677.677.6187.5187.5
A7-1
Appendix 7. Ridomil application at Tylstrup and Jyndevad
Table A7.2.Ridomil application at theJyndevadPLAP test site (marked in red) and neighboring upstream fields. The positions ofthe various fields are indicated in the figure below, those upstream field receiving metalaxyl-M being marked with yellow fillling.The direction of groundwater flow is indicated by a blue arrow. Usage data from the Jyndevad field site and the upstreamneighboring field were available from 1999 and 1988 respectively.
Field-ID
KF-2Jyndevad PLAP-test siteF5M4N-østS1D-3(less than 0,2 ha.)S-4D2N-vestS3KD-3S-2F-1M-41)2)
The active ingredient was metalaxylfrom 1980-1995 and metalaxyl-M from 2006-2010.The field is subdivided into parcel and three of these received 187.5 g/ha metalaxyl each.
Year ofapplication20102010201020092009200920092009200820082008200720071993199019891988
Applied product(kg/ha)2 kg/ha - Ridomil Gold MZ Pepite2 kg/ha - Ridomil Gold MZ Pepite2 kg/ha - Ridomil Gold MZ Pepite2 kg/ha - Ridomil Gold MZ Pepite2 kg/ha - Ridomil Gold MZ Pepite2 kg/ha - Ridomil Gold MZ Pepite2 kg/ha - Ridomil Gold MZ Pepite2 kg/ha - Ridomil Gold MZ Pepite2 kg/ha - Ridomil Gold MZ Pepite2 kg/ha - Ridomil Gold MZ Pepite2 kg/ha - Ridomil Gold MZ Pepite2 kg/ha - Ridomil Gold MZ Pepite2 kg/ha - Ridomil Gold MZ Pepite3*2,5 kg/ha - Ridomil MZ1*2,5 kg/ha - Ridomil MZ2*2,5 kg/ha - Ridomil MZ1,0+2+2.5 kg/ha - Ridomil MZ
Applied pesticide1)(g a.i /ha)77.677.677.677.677.677.677.677.677.677.677.677.677.63¶187.52)187.5375412.5
A7-2
Appendix 8. Pesticides analysed at 5 PLAP sites in the period up to 2007
Table A8.1.Pesticides analysed atTylstrupwith the products used shown in parentheses. Degradation products are in italics.Precipitation (prec.) and percolation (perc.) are accumulated from the date of first application until the end of monitoring. 1stmonthperc. refers to accumulated percolation within the first month after the application. Cmeanrefers to average leachate concentration at 1m b.g.s. the first year after application (See Appendix 2 for calculation method).Crop and analysed pesticidesApplication End ofPrec.Perc.1stmonthCmeandatemonitoring(mm)(mm)perc. (mm)(�g/L)Potatoes 1999Linuron (Afalon)- ETU1)(Dithane DG)Metribuzine (Sencor WG)- metribuzine-diketo- metribuzine-desamino- metribuzine-desamino-diketoSpring barley 2000Triasulfuron (Logran 20 WG)- triazinaminPropiconazole (Tilt Top)Fenpropimorph (Tilt Top)- fenpropimorphic acidPirimicarb (Pirimor G)- pirimicarb-desmethyl- pirimicarb-desmethyl-formamidoWinter rye 2001Pendimethalin (Stomp SC)Triazinamin-methyl2)(Express)Propiconazole (Tilt Top)Fenpropimorph (Tilt Top)- fenpropimorphic acidWinter rape 2002Clomazone (Command CS)- FMC65317 (propanamide-clomazone)Winter wheat 2003Bromoxynil (Oxitril CM)Ioxynil (Oxitril CM)Fluroxypyr (Starane 180)Flamprop-M-isopropyl (Barnon Plus 3)- Flamprop-M (free acid)Dimethoate (Perfekthion 500 S)May 99Jun 99Jun 99Jul 01Oct 01Jul 03Jul 10†Jul 03Apr 08Apr 03Jul 03Jul 03Apr 0325502381422311142422386892740294829482622125311692097538720974192128313411341126387738585858513111117<0.01<0.01<0.010.05–0.36<0.020.14–0.97<0.02<0.02<0.01<0.01<0.02<0.01<0.02<0.02<0.01<0.02<0.01<0.01<0.01<0.01<0.02<0.01<0.01<0.02<0.01<0.01<0.01<0.015)<0.015)<0.01<0.01<0.01<0.016)<0.01<0.01<0.01<0.02<0.01
May 00Jun 00Jun 00Jun 00
Nov 00Nov 00May 01May 01
Apr 03Apr 03Jul 03Jul 03
2271227129482948
1219121913411341
1091091111
Sep 01
Jul 04
2534
1194
9
Oct 02Oct 02May 03May 03Jul 03
Apr 05Apr 05Jul 05Jul 05Jul 05Jul 06Jul 10†Jul 10†Jul 07
208220821867263516291754621162112145
995995787103172270430083008933
535350421416131316
Potatoes 2004-Fluazifop-P (free acid)3)(Fusilade X-tra) May 04- PPU4)(Titus)Jun 04- PPU-desamino4)(Titus)Jun 04Maize 2005Terbuthylazine (Inter-Terbutylazine)-desethyl-terbuthylazine-2-hydroxy-terbuthylazine-desisopropyl-atrazine-2-hydroxy-desethyl-terbuthylazineBentazone (Laddok TE)-AIBASpring barley 2006-triazinamin-methyl7)(Express ST)Epoxiconazole (Opus)May 05
Jun 05
Jul 07
2061
927
33
Systematic chemical nomenclature for the analysed pesticides is given in Appendix 1.1)Degradation product of mancozeb. The parent compound degrades too rapidly to be detected by monitoring.2)Degradation product of tribenuron-methyl. The parent compound degrades too rapidly to be detected by monitoring.3)Degradation product of fluazifop-P-butyl. The parent compound degrades too rapidly to be detected by monitoring.4)Degradation product of rimsulfuron. The parent compound degrades too rapidly to be detected by monitoring.5)Leaching increased the second and third year after application6)Leaching increased during the second year after application but measured concentrations did not exceed 0.042 �g/l (see Kjær et al., 2008).7)Degradation product of tribenuron-methyl. The parent compound degrades too rapidly to be detected by monitoring.† Monitoring will continue during the following year. The values for prec. and perc. are accumulated up to July 2009.
Jun 06Jul 06
Jul 08Jul 08
23492233
11841148
4324
A8-2
Appendix 8. Pesticides analysed at 5 PLAP sites in the period up to 2007
Table A8.2.Pesticides analysed atJyndevadwith the product used shown in parentheses. Degradation products are in italics.Precipitation (prec.) and percolation (perc.) are accumulated from date of first application until end of monitoring. 1stmonth perc.refers to accumulated percolation within the first month after application. Cmeanrefers to average leachate concentration 1 m b.g.s thefirst year after application (See Appendix 2 for calculation method).Crop and analysed pesticidesApplicationEnd ofPrec.Perc.1stmonthCmeandatemonitoring(mm)(mm)(�g/l)perc. (mm)Winter rye 2000Glyphosate (Roundup 2000)-AMPATriazinamin-methyl1)(Express)Propiconazole (Tilt Top)Fenpropimorph (Tilt Top)-fenpropimorphic acidMaize 2001Terbuthylazine (Lido 410 SC)-desethyl-terbuthylazinePHCP2)(Lido 410 SC)Potatoes 2002-PPU(Titus)3)- PPU-desamino(Titus)3)Spring barley 2003MCPA (Metaxon)- 4-chlor,2-methylphenolDimethoate (Perfekthion 500 S)Pea 2004Bentazone (Basagran 480)- AIBAPendimethalin (Stomp SC)Pirimicarb (Pirimor G)-Pirimicarb-desmethyl-Pirimicarb-desmethyl-formamido- fluazifop-P(free acid)5)(Fusilade X-tra)Winter wheat 2005Ioxynil (Oxitril CM)Bromoxynil (Oxitril CM)Amidosulfuron (Gratil 75 WG)Fluroxypyr (Starane 180 S)Azoxystrobin (Amistar)- CyPMSpring barley 2006Florasulam (Primus)- florasulam-desmethylEpoxiconazole (Opus)1)
Sep 99Nov 99Apr 00Apr 00May 01May 01May 01May 02Jun 03Jun 03May 04May 04Jun 04Jun 04Oct 04Oct 04Apr 05May 05May 05May 06Jun 06
Apr 02Apr 02Jul 02Apr 02Apr 04Apr 07Jul 03Jul 10†Jul 10†Jul 05Jul 05Jul 07Apr 07Apr 07Jul 06Apr 07Apr 07Jul 07Jul 07Apr 07Jul 08Dec 09
2759253423012015311867422413938993892340227838883557349323952955295510702683227427794698
160714511061102918093826136651265126123312322044199619931233179117915151360128314872592
139863344411110144272781813337493431
<0.01<0.01<0.02<0.01<0.01<0.01<0.01<0.01-0.02<0.020.064)-0.130.01-0.03<0.01<0.01<0.010.02-0.13<0.01<0.01<0.01<0.01<0.02<0.01<0.01<0.01<0.01<0.02<0.01<0.02<0.01<0.03<0.01
Systematic chemical nomenclature for the analysed pesticides is given in Appendix 1.Degradation product of tribenuron-methyl. The parent compound degrades too rapidly to be detected by monitoring.2)Degradation product of pyridate. The parent compound degrades too rapidly to be detected by monitoring.3)Degradation product of rimsulfuron. The parent compound degrades too rapidly to be detected by monitoring.4)Leaching increased the second year after application.5)Degradation product of fluazifop-P-butyl. The parent compound degrades too rapidly to be detected by monitoring.† Monitoring will continue during the following year. The values for prec. and perc. are accumulated up to July 2009.
A8-3
Appendix 8. Pesticides analysed at 5 PLAP sites in the period up to 2007
Table A8.3.Pesticides analysed atSilstrupwith the product used shown in parentheses. Degradation products are in italics.Precipitation (prec.) and percolation (perc.) are accumulated from date of first application until end of monitoring. 1stmonth perc.refers to accumulated percolation within the first month after application. Cmeanrefers to average leachate concentration in thedrainage water within the first drainage season after application (See Appendix 2 for calculation methods).Crop and analysed pesticidesApplication End ofPrec.Perc.1stmonthCmeandatemonitoring(mm)(mm)perc. (mm)(�g/l)Fodder beet 2000Metamitron (Goltix WG)-metamitron-desaminoEthofumesate (Betanal Optima)Desmedipham (Betanal Optima)-EHPCPhenmedipham (Betanal Optima)-MHPC- 3-aminophenolFluazifop-P-butyl (Fusilade X-tra)- fluazifop (free acid)Pirimicarb (Pirimor G)- pirimicarb-desmethyl- pirimicarb-desmethyl-formamidoSpring barley 2001Triazinamin-methyl1)(Express)Flamprop-M-isopropyl (Barnon Plus 3)- flamprop (free acid)Propiconazole (Tilt Top)Fenpropimorph (Tilt Top)- fenpropimorphic acidDimethoate (Perfekthion 500 S)Maize 2002Glyphosate (Roundup Bio)- AMPAPHCP2)(Lido 410 SC)Terbuthylazine (Lido 410 SC)- desethyl-terbuthylazine- 2- hydroxy-terbuthylazine- 2-hydroxy-desethyl-terbuthylazine- desisopropyl-atrazinePeas 2003Bentazone (Basagran 480)-AIBAPendimethalin (Storm SC)Glyphosate (Roundup Bio)-AMBAWinter wheat 2004Prosulfocarb (Boxer EC)MCPA (Metaxon)- 4-chlor,2-methylphenolAzoxystrobin (Amistar)- CyPMPirimicarb (Pirimor G)- Pirimicarb-desmethyl- Pirimicarb-desmethyl-formamidoSpring barley 2005Fluroxypyr (Starane 180 S)Azoxystrobin (Amistar)- CyPMPirimicarb (Pirimor G)- Pirimicarb-desmethyl- Pirimicarb-desmethyl-formamidoMay 00May 00May 00May 00Jun 00Jul 00Apr 03Apr 03Apr 03Apr 03Jul 02Jul 0726342634263426341953645213281328132813281019282553535353510.050.060.03<0.01<0.02<0.01<0.02<0.02<0.01<0.02<0.01<0.01<0.02<0.02<0.01<0.01<0.01<0.01<0.010.020.130.060.060.070.153)3)3)
May 01Jun 01Jun 01Jun 01Jul 01Oct 01May 02May 02
Jul 03Jul 03Jul 03Jul 03Jul 03Apr 06Jul 04Apr 06Apr 05Apr 05Apr 05Apr 05Jul 06Apr 06Apr 06
19411928192819281882380217643320
95194494494493716947381327
1033334466
May 03May 03Sep 03
263426342207
10551055971
44440
0.26<0.01<0.01<0.010.020.01<0.01<0.010.010.09<0.01<0.01<0.02<0.020.010.02<0.01<0.01<0.01
Oct 03May 04Jun 04Jul 04
Apr 06Jul 06Jul 06Jul 07Jul 07
21251797178129312818
97471070612021205
374000
May 05Jun 05Jun 05Jul 05
Jul 07Jul 06Jul 07Jul 07
201286220121933
830332828818
1110100
A8-4
Appendix 8. Pesticides analysed at 5 PLAP sites in the period up to 2007
Table A8.3 (continued).Pesticides analysed atSilstrupwith the product used shown in parentheses. Degradation products are initalics. Precipitation (prec.) and percolation (perc.) are accumulated from date of first application until end of monitoring. 1stmonthperc. refers to accumulated percolation within the first month after application. Cmeanrefers to average leachate concentration in thedrainage water within the first drainage season after application (See Appendix 2 for calculation methods).Crop and analysed pesticidesApplication End ofPrec.Perc.1stmonthCmeandatemonitoring(mm)(mm)perc. (mm)(�g/l)Winter rape 2006Propyzamide (Kerb 500 SC)- RH-24644- RH-24580- RH-24655Clopyralid (Matrigon)1)2)
Nov 05
Apr 08
2345
1115
75
Degradation product of tribenuron-methyl. The parent compound degrades too rapidly to be detected by monitoring.Degradation product of pyridate. The parent compound degrades too rapidly to be detected by monitoring.3)Average leachate concentration within the first drainage season after application could not be calculated, as monitoring started January2003 (7 months after application). See Kjær et al.(2007) for further information.4)Drainage runoff commenced two weeks prior to the application of propyzamide, and the weighted concentrations refer to the period fromthe date of application until 1 July 2007.
Apr 06
Apr 08
2009
859
8
0.224)0.014)<0.014)<0.014)<0.01
A8-5
Appendix 8. Pesticides analysed at 5 PLAP sites in the period up to 2007
Table A8.4.Pesticides analysed atEstrupwith the product used shown in parentheses. Degradation products are in italics.Precipitation (prec.) and percolation (perc.) are accumulated from the date of first application until the end of monitoring. 1st monthperc. refers to accumulated percolation within the first month after application. Cmeanrefers to average leachate concentration in thedrainage water within the first drainage season after application (See Appendix 2 for calculation methods).Crop and analysed pesticidesApplication End ofPrec. Perc.1stmonthCmeandatemonitoring(mm) (mm)perc. (mm)(�g/l)Spring barley 2000Metsulfuron-methyl (Ally)May 00Apr 032990 145629<0.01- triazinamin<0.02Flamprop-M-isopropyl (Barnon Plus 3)May 00Apr 032914 143420.02- flamprop (free acid)0.01Propiconazole (Tilt Top)Jun 00Apr 054938 229400.01Fenpropimorph (Tilt Top)Jun 00Jul 022211 10480<0.01- fenpropimorphic acid<0.02Dimethoate (Perfekthion 500 S)Jun 00Jul 022211 10480<0.01Pea 2001Glyphosate (Roundup Bio)Oct 00Jul 10†10484 49771230.54- AMPA0.17Bentazone (Basagran 480)May 01Jul 087629 362190.03- AIBA<0.01Pendimethalin (Stomp SC)May 01Jul 032208 10969<0.01Pirimicarb (Pirimor G)Jun 01Jul 054251 1995100.01- pirimicarb-desmethyl<0.02- pirimicarb-desmethyl-formamido<0.02Winter wheat 2002Ioxynil (Oxitril CM)Nov 01Jul 031580860520.041)Bromoxynil (Oxitril CM)Nov 01Jul 031580860520.011)Amidosulfuron (Gratil 75 WG)Apr 02Jul 0421489288<0.01MCPA (Metaxon)May 02Jul 0420919280<0.01- 4-chlor,2-methylphenol<0.01Propiconazole (Tilt 250 EC)May 02Apr 052920 1336390.02Pirimicarb (Pirimor G)Jun 02Jul 052982 1403580.01- pirimicarb-desmethyl<0.02- pirimicarb-desmethyl-formamidoApr 06<0.02Fodder beet 2003Glyphosate (Roundup Bio)Sep 02Jul 10†8289 390000.43- AMPA0.19Ethofumesate (Betanal Optima)May 03Apr 062901 1371500.11Metamitron (Goltix WG)May 03Apr 062901 1371501.1- metamitron-desamino0.21Pirimicarb (Pirimor G)Jul 03Jul 0520719390<0.01- pirimicarb-desmethylJul 05<0.01- pirimicarb-desmethyl-formamidoApr 060.12Spring barley 2004Fluroxypyr (Starane 180)May 04Jul 062073 10300<0.02Azoxystrobin (Amistar)Jun 04Jul 084452 2209380.12- CyPM0.23Maize 2005Terbuthylazine (Inter-Terbuthylazin)May 05Apr 094247 2042320.48- desethyl-terbuthylazineJul 094406 2051320.31- 2-hydroxy-terbuthylazineJul 083338 1628320.11- desisopropyl-atrazineApr 094247 2042320.02- 2-hydroxy-desethyl-terbuthylazineJul 083338 1628320.24Bentazone (Laddok TE)Jun 05Jul 083338 1628100.18- AIBA<0.01Glyphosate (Roundup Bio)Nov 05Jul 10†5191 2460684.041)- AMPA0.421)Spring barley 2006Florasulam (Primus)Jun 06Jul 082442 11630<0.01- florasulam-desmethyl<0.03Azoxystrobin (Amistar)Jun 06Jul 082414 117000.03- CyPM0.13
Systematic chemical nomenclature for the analysed pesticides is given in Appendix 1.† Monitoring will continue during the following year. The values for prec. and perc. are accumulated up to July 2006.1)Drainage runoff commenced about two and a half months prior to the application of ioxynil and bromoxynil, and the weightedconcentrations refer to the period from the date of application until 1 July 2002.
A8-6
Appendix 8. Pesticides analysed at 5 PLAP sites in the period up to 2007
Table A8.5.Pesticides analysed atFaardrupwith the product used shown in parentheses. Degradation products are in italics.Precipitation (prec.) and percolation (perc.) are accumulated from the date of first application (app. date) until the end of monitoring.1stmonth perc. refers to accumulated percolation within the first month after application. Cmeanrefers to average leachateconcentration in the drainage water the first drainage season after application (See Appendix 2 for calculation methods).Crop and analysed pesticidesApplicationEnd ofPrec.Perc.1stmonthCmeandatemonitoring(mm)(mm)perc. (mm)(�g/l)Winter wheat 1999Glyphosate (Roundup 2000)- AMPABromoxynil (Briotril)Ioxynil (Briotril)Fluroxypyr (Starane 180)Propiconazole (Tilt Top)Fenpropimorph (Tilt Top)- fenpropimorphic acidPirimicarb (Pirimor G)- pirimicarb-desmethyl- pirimicarb-desmethyl-formamidoSugar beet 2001Glyphosate (Roundup 2000)- AMPAMetamitron (Goltix WG)- metamitron-desaminoEthofumesate (Betanal Optima)Desmedipham (Betanal Optima)- EHPCPhenmedipham (Betanal Optima)- MHPCFluazifop-P-butyl (Fusilade X-tra)- fluazifop-P (free acid)Pirimicarb (Pirimor G)- pirimicarb-desmethyl- pirimicarb-desmethyl-formamidoSpring barley 2002Flamprop-M-isopropyl (Barnon Plus 3)- flamprop-M (free acid)MCPA (Metaxon)- 4-chlor-2-methylphenol- triazinamin-methyl1)(Express)Dimethoate (Perfekthion 500 S)Propiconazole (Tilt 250 EC)Winter rape 2003Clomazone (Command CS)- FMC65317 (propanamide-clomazon)Winter wheat 2004Prosulfocarb (Boxer EC)MCPA (Metaxon)- 4-chlor,2-methylphenolAzoxystrobin (Amistar)- CyPMMaize 2005Terbuthylazine (Inter-Terbutylazin)- desethyl-terbuthylazine- 2-hydroxy-terbuthylazine- desisopropyl-atrazine- 2- hydroxy-desethyl-terbuthylazineBentazone (Laddok TE)- AIBASpring barley 2006Fluroxypyr (Starane 180 S)Epoxiconazole (Opus)Aug 99Oct 99Oct 99Apr 00May 00May 00Jun 00Apr 03Apr 02Apr 02Apr 02Jul 03Jul 02Jul 032526173817381408215115182066947751751494669491684035357000<0.01<0.01<0.01<0.01<0.01<0.01<0.01<0.01<0.01<0.01<0.02<0.010.010.010.010.06<0.01<0.02<0.01<0.02<0.010.02<0.01<0.01<0.02<0.01<0.01<0.01<0.02<0.02<0.01<0.01<0.02<0.02<0.01<0.01<0.01<0.01<0.010.670.590.040.030.072.82<0.01<0.02<0.01
Oct 00May 01May 01May 01May 01Jun 01Jul 01
Jul 03Jul 03Jul 03Jul 03Jul 03Jul 03Jul 03
1747151215121512151214601460
709507507507507503503
0444401
May 02May 02May 02Jun 02Jun 02Aug 02
Jul 04Jul 04Jul 04Jul 04Jul 04Apr 05
133713581358132813281761
333337337333333509
044004
Oct 03Jun 04Jun 04
Apr 06Jul 06Jul 07
154213072098
454331636
000
May 05May 05May 05May 05May 05May 05
Jul 08Jul 08Jul 08Jul 08Jul 07Jul 07
207820782078207814281408
666666666666465464
4
46
Systematic chemical nomenclature for the analysed pesticides is given in Appendix 1.1)Degradation product of tribenuron-methyl. The parent compound degrades too rapidly to be detected by monitoring.† Monitoring will continue during the following year. The values for prec. and perc. are accumulated up to July 2009.
May 06Jun 06
Jul 08Jul 08
14961441
524507
173
A8-7


