Ligestillingsudvalget 2012-13
LIU Alm.del Bilag 73
Offentligt
Gender Equality Index
ReportReport
The Gender Equality Index is the result of three years ofwork by various contributors.The principal authors of the main Report and CountryProfiles are: Laura de Bonfils, Dr Anne Laure Humbert,Dr Viginta Ivaškaitė-Tamošiūnė, Dr Anna Rita Manca,Ligia Nobrega, Dr Jolanta Reingardė and Dr Irene RiobóoLestón. A particular thank you goes to colleagues at theEuropean Institute for Gender Equality for their intel-lectual contributions, administrative support and encou-ragement.This work builds upon the initial study for the develop-ment of the basic structure of a European Union GenderEquality Index, developed for EIGE by Prof Dr JannekePlantenga, Prof Colette Fagan, Prof Dr Friederike Maierand Dr Chantal Remery. Important contributions to theGender Equality Index were also made by Prof EileenDrew, Dr Maris Goldmanis, Eva Heckl and Dr Irene Pim-minger. A special gratitude goes to Dr Michaela Saisanafrom the European Commission’s Joint Research Centreand Linda Laura Sabbadini from ISTAT.
The construction of the Gender Equality Index has alsogreatly benefited from expert advice received from:EIGE’s Working Group on the Gender Equality Index, itschair and external experts; EIGE’s Management Board andExperts’ Forum. The acknowledgements are also extend-ed to the European Commission, in particular the Gen-der Equality Unit at the Directorate-General for Justice,Freedom and Security, Eurostat and Joint Research Cen-tre; the European Union Agency for Fundamental Rights(FRA); the European Foundation for the Improvement ofLiving and Working Conditions (Eurofound); National Sta-tistics offices, European Women’s Lobby, Social Partners(European Trade Union Confederation, BusinessEurope)and international organisations (ILO, UNECE, OECD, WorldEconomic Forum, Social Watch).The European Institute for Gender Equality is very grate-ful to many other individuals and institutions which pro-vided valuable contributions and support to the buildingof the Gender Equality Index.
Europe Direct is a service to help you find answers to yourquestions about the European Union.Freephone number (*):00 800 6 7 8 9 10 11(*) Certain mobile telephone operators do not allow access to 00 800 numbersor these calls may be billed.
More information on the European Union is available on the Internet (http://europa.eu).Cataloguing data can be found at the end of this publication.Gender Equality Index ReportISBN: 978-92-9218-224-3doi:10.2839/69597Gender Equality Index – Country ProfilesISBN 978-92-9218-265-6doi:10.2839/87720� European Institute for Gender Equality, 2013Reproduction is authorised provided the source is acknowledged.Printed in Germany
Halfway towards equalityEquality between women and men is a fundamental valueof the European Union and is vital to its economic and so-cial growth. To reach the objectives set by the EU in theEurope 2020 growth strategy; face current economic andsocial challenges; secure social justice; and achieve smartand sustainable development, gender equality has to beincluded at the very centre of political debate in Europe.Despite 50 years of policies and actions at European level,Member States have not yet managed to overcome gen-der gaps, thus there is a need for further efforts.Policy improvement cannot bear fruit without systematicand consistent measurement of gender gaps at EU andMember States level. The process began when the Europe-an Commission proposed to introduce an assessment toolon gender equality in the Roadmap for Equality betweenWomen and Men 2006–2010, and subsequently includedit in the Action Plan of its Strategy for Equality betweenWomen and Men 2010–2015. The creation of the assess-ment tool was undertaken by the European Institute forGender Equality (EIGE) since the start of its operations, inJune 2010.This report is a result of the Institute’s work of the pastthree years, which presents a synthetic measure of genderequality – the Gender Equality Index. I am proud to saythat it is the only index that gives a comprehensive map ofgender gaps in the EU and across Member States based onthe EU policy framework.The Gender Equality Index relies on a trustworthy statisti-cal methodology. In spite of the scarcity of data, stringentcriteria are applied to the gender indicators, requiring thatvariables are available and comparable across all Mem-ber States. The computation of the Gender Equality Indexavoided subjective decisions in the way a weighting andaggregation method for the Index was selected. The proc-ess relied on a computation of more than 3,000 alterna-tives in order to choose the best and most robust Index.In the report, scores for each Member State and an EUaverage are presented to enable a detailed assessment ofhow close the EU and Member States have come towardsachieving gender equality in each of the critical domainsand within the EU policy agenda. It is also evident thatgender equality is correlated more with social indicatorssuch as public expenditure on education and research,rather than with traditional economic indicators such asGDP. With an average score of 54.0, (where 1 stands forabsolute gender inequality and 100 for full genderequality), the European Union is only halfway towards agender equal society.The results obtained show that the domain of power high-lights the biggest gender gaps, with an average score ofonly 38.0 at EU level. The wide differences in the propor-tion of women and men in decision-making across theEU-27 is a strong call for the improvement of policy anddecisive action, such as the introduction of quota systems,initiated by the European Commission in 2012. The domainof time is marked by wide differences between womenand men when it comes to time spent on unpaid caringand domestic activities. This is the second domain wherethe widest gender gaps can be observed, with an averagescore of 38.8 at the EU level.The Institute foresees regular updates of this first GenderEquality Index, which is specifically tailored towards the EU’sneeds in a present policy context and hopes to offer EUpolicy makers a reliable tool in assessing the progress andeffectiveness of policies and initiatives aimed at improv-ing gender equality in general and specific policy areas.On behalf of the Institute and its team, I would like tothank all institutions and experts who contributed to thecreation of the Gender Equality Index, and especially tothe European Commission: Directorate-General for Justice;Joint Research Centre; Eurofound; International LabourOrganisation; European Women’s Lobby; EIGE’s Manage-ment Board; Experts’ Forum; Working Group on the Gen-der Equality Index; and my colleagues at EIGE. We firmlybelieve that the Index will give impetus for broader debateon the challenges of gender equality, and will contributeto making equality between women and men in Europea reality for all.
Virginija Langbakk,DirectorThe European Institute for Gender Equality (EIGE)
Gender Equality Index – Report
3
The European Institute for Gender Equality (EIGE) is anautonomous body of the European Union, established tocontribute to and strengthen the promotion of genderequality, including gender mainstreaming in all EU policiesand the resulting national policies, and the fight againstdiscrimination based on sex, as well as to raise EU citizens’awareness of gender equality. Further information can befound on the EIGE website (eige.europa.eu).
European Institute for Gender EqualityGedimino pr. 16LT-01103 VilniusLITHUANIATel. +370 52157444E-mail: [email protected]http://eige.europa.euhttp://www.twitter.com/eurogenderhttp://www.facebook.com/eige.europa.euhttp://www.youtube.com/eurogender
4
Gender Equality Index – Report
ContentsAcknowledgements1. Introduction2. Conceptual framework3. Methodology4. Indicators5. Index results6. Conclusion7. Annexes8. References26143456108136145165
Gender Equality Index – Report
5
1. IntroductionEquality between women and men is a fundamental valueof the European Union, enshrined in its Treaties, includingthe Charter of Fundamental Rights of the European Un-ion. The capacity of EU institutions to help shape genderrelations in its Member States has been present since itsearliest days (Verloo and Lombardo, 2007). Although theTreaty of Rome was signed at a time when the genderequality landscape looked substantially different from thecontemporary one, it nevertheless contained a clause onequal pay between women and men, a precursor to thelegislation and policy approaches that emerged through-out Europe in later years. Gender equality is recognised asvital to economic growth, prosperity and competitiveness,as exemplified by the Council’s commitment to fulfil EUambitions on gender equality through the adoption of theEuropean Pact for Gender Equality (2011–2020) (7349/11adoption of the European Pact) and the European Com-mission’s Strategy for Equality between Women and Men(2010–2015) (COM(2010) 491 final). The EU, as a multi-levelgovernance framework, plays a crucial role in enabling aconcern for gender equality in Member States’ policies,gender norms and cultures to filter down from the interna-tional and EU level to national, regional and local levels.The acknowledged importance of gender equality in theEU manifests itself in the development of distinct gender-aware policies. The evaluation of the effectiveness of thesepolicies is, however, a complex and challenging endeavourgiven that the EU is a multi-level polity, comprising ofsubnational, national and supranational institutions, withactors and discourses interacting in complex ways to en-act gender legislation and policy. The development anddissemination of EU-wide, comparable and reliable gen-der statistics and indicators have contributed to bet-ter monitoring and assessment of progress, for example,through the process of Gender Mainstreaming in the EU. Itis therefore important to develop further monitoring andevaluation indicators. To assist with the measurement ofgender equality at EU level, and in order to demonstratethe success of promoting gender equality in each Mem-ber State, the creation of a composite indicator on genderequality, a Gender Equality Index, as a common assess-ment tool was initially introduced by the European Commis-sion in The Roadmap for Equality between Women andMen (2006–2010) (COM(2006) 92 final) and proposed in theAction Plan of the Strategy for Equality between Womenand Men (2010–2015) (SEC(2010) 1079/2) that followed.The elaboration of the Gender Equality Index became oneof the major assignments decided by the European Insti-tute for Gender Equality (EIGE) in its first Mid-term WorkProgramme (2010–2012), following its establishment. TheGender Equality Index is a composite indicator that pro-vides a measure, across Member States and eventually overtime, of the concept of gender equality as a multi-dimen-sional concept. It is a sophisticated tool that synthesisesthis complexity into a user-friendly and easily interpretablemeasure. It is formed by combining gender indicators ac-cording to a conceptual framework, into a single summarymeasure.
1.1. Structure of the reportThe first section positions the Gender Equality Index as ameasure of gender equality for the EU. It shortly reviewsthe definitions and approaches to gender equality, as wellas main existing gender equality indices along with theirmain shortcomings. The rationale behind producing aGender Equality Index is also set out.The second part of the report outlines the conceptualframework used for the Gender Equality Index. It describesthe major areas of concern in the field of gender equalitythat are of particular interest to European policy.Subsequently, the methodology employed is described.It gives information on how the conceptual structure(underpinned by policy and theory) was translated into ameasurable structure (underpinned by data and statisticalconsiderations), as well as the steps followed to computethe Index.The fourth section presents an overview of the gender in-dicators, by domain, used to construct the Gender EqualityIndex. For each indicator, a detailed analysis of both levelsof achievement and gender gaps is provided, at EU level,across Member States and where possible over time.The report then provides with a detailed breakdown ofthe Gender Equality Index score for each country. It alsodiscusses the contribution of each indicator to the Gen-der Equality Index. Lastly, this section analyses the resultsin conjunction with other contextual variables in MemberStates such as GDP and spending on key policy areas.
6
Gender Equality Index – Report
Finally, the report concludes with the main findings of theGender Equality Index.Accompanying this report is a set of 27 Country Profileswhich provide an overview of the score of the GenderEquality Index for each Member State, along with listedmain policy initiatives for the promotion of gender equalityand key data at national level. The profiles aim to supportdecision-makers and researchers alike in drawing conclu-sions to feed into national and EU level debates on closingthe gender equality gap even further.
national level. In those Member States that see womenas primary carers, the bulk of policy aims at supportingwomen in those roles. In other Member States, the focusis on challenging gender roles with a policy frameworkthat tends to focus on changing the behaviours of bothwomen and men (Rubery, 2002).To counter the difficulties of agreeing on a definition ofgender equality, and in light of the imperative need tooperate from an agreed definition, the Gender Equality In-dex bases itself on a simplified overarching definition ofgender equality:equal share of assets and equal dignity andintegrity between women and men.
1.2. Definitions of genderequality in the EUGender equality is a complex and multi-dimensional con-cept, as well as a normatively and politically controversialsubject, with a diversity of meanings across Europe (Verlooand Lombardo, 2007). Gender equality is not consistentlydefined in EU policy texts. Furthermore, although defini-tions attempt to be gender neutral, there is a general ten-dency to conflate this approach with one that focuses onwomen specifically.At EU level, treaties and policy documents (for example,Art. 2 and 3(3) TEU and Art. 8 TFEU) discuss gender equalityin different ways, including conceptualisations that en-compass a mixture of equal access to resources and assetsand equal access to dignity and integrity. The EuropeanCommission defines gender equality as ‘the result of theabsence of discrimination on the basis of a person’s sex inopportunities and the allocation of resources or benefitsor in access to services’ (European Commission, 2010). Anexpanded definition is provided in the European Commis-sion’s Women’s Charter (2010) (COM(2010) 78 final) whichfocuses on the following elements:life choices and economic independence;the full realisation of women’s potential and the fulluse of their skills;a better gender distribution in the labour market, morequality jobs for women;the promotion of genuine opportunities for bothwomen and men to enjoy a work-life balance;human dignity, the right to life and the right to theintegrity of the person.At national level, there are also various meanings of genderequality across individual Member States. Differences mostlyreside in the ideology of gender roles most represented at
1.3. Gender equality approachesThe task of developing the Gender Equality Index calls fora clear direction of what is the purpose of gender equal-ity. However, this is greatly hampered by the insufficientagreement of what constitutes gender equality and whatit should achieve. There are contrasting ways in which toaddress the purpose of gender equality, with three broadapproaches: equality through sameness (equal opportu-nities or equal treatment); equal valuation of difference(special programmes) and the transformation of genderedpractices and standards of evaluation (Walby, 2005). Thissection presents these three approaches before outlininghow they are incorporated into the Gender Equality Index.
1.3.1. The sameness approachThe sameness approach highlights the necessity to includewomen into a world from which they have typically been ex-cluded. Equality policies should seek gender-neutrality andextend the dominant practices and values to all individuals(Verloo, 2005). Differences between women and men are of-ten attributed to a gender identity which is inscribed in theprocess of a lifetime of learning experiences (Epstein, 1988)and which as a consequence often characterises women ina disadvantageous position as opposed to men.In this approach, the emphasis is on women becomingequal to men. This entails women entering previously maledomains, and has the unintended consequence that themale norm remains the standard (Walby, 2005). Equalitystrategies based on the male as norm may in fact disad-vantage women (Plantenga et al., 2009). This is problematicin that it may place women in a position of defensiveness,to be explained and justified, as well as falsely constructsmen as belonging to one homogenous category (Bacchi,1996). In addition, encouraging women to become more
Gender Equality Index – Report
7
like men does not tackle the need to re-examine and re-evaluate social roles and values including ‘caring roles’ andcare itself (Maddock, 1999).
1.3.2. The difference approachThe second approach reflects a move towards the equalvaluation of the existing and different contributions ofwomen and men in a gender segregated society (Wal-by, 2005). This approach suggests that women’s physi-cal difference from men results in different life patterns,psychology and moral values. This approach often seesa call for parity rather than sameness (Cockburn, 1991).Men and male cultures and practices are often prob-lematised and the need to construct new spaces thataccommodate non-hegemonic gender identities andcultures are called for (Verloo, 2005).A number of difficulties exist with this approach. It is difficult torecognise differences, while avoiding the trap of essentialismand relying on essentialist notions of femininity and mascu-linity. It can reinforce existing stereotypes and the currentorganisation of labour and care (Fraser, 1997). The debate onthe sameness/difference approach was criticised becauseit provides limited possibilities for change (Cockburn, 1991),may divert attention to other problems such as the prob-lem of caring for children and the elderly (Bacchi, 1996) andmaintains a political frame of arguments that reifies maledefinitions in order to be heard (Maddock, 1999). It is alsounclear as to whether there can be an effective route togender justice in which existing separate gender norms/standards are retained, in that it is not possible to be ‘differ-ent but equal’ because differences are too entwined withpower and resources (Fraser, 1997).
sal caregiver model’, gender equality implies a change inthe lives of both women and men through the promotionof greater equality in the distribution of paid and unpaidwork, while also indicating that an equal distribution ofpaid and unpaid work is not enough.
1.3.4. Drawing on all three approachesIndeed, these three approaches are intertwined with, andbuild on, one another (Daly, 2005). In practice, the threeapproaches are not mutually exclusive but can be (andare) combined: the sameness approach can be seen asan integrationist approach which may lead to culturalchanges, while the approach of difference could be trans-formative in questioning both femininity and masculinity(Verloo, 2005).These steps remain necessary in order to achieve deepcultural changes, create new structures and transform thegendered nature of society (Martin, 2003). It is important tointegrate these different approaches under the same goal:that of achieving greater gender equality.These three approaches can be observed in the EuropeanCommission’s approach to gender equality over the lastthree decades (Rees, 1992):Tinkering – equal treatment (legal redress to treatwomen and men the same);Tailoring – positive action (recognising that thereare differences between men and women and thatspecific measures are required to address disadvantagesexperienced by women as a consequence of thosedifferences);Transforming – gender mainstreaming (how existingsystems and structures cause indirect discriminationand altering or redesigning them as appropriate).This perspective of gender equality as a particular com-bination of sameness, difference and transformation, isclearly reflected in key EU policy documents. The Women’sCharter (2010) (COM(2010) 78 final) presents the commit-ment of the European Commission to five priorities basedon agreed principles of equality between women and menthat draw on these several perspectives. These five priori-ties are translated into concrete measures in the Commis-sion Strategy for Equality between Women and Men (2010–2015) (COM(2010) 491 final).
1.3.3. The transformative approachThe third approach is one where, rather than having tochoose between the sameness and difference approach, anew standard for both men and women is created, that is,the transformation of gender relations (Walby, 2005; Walby,2009). It aspires to move ‘beyond gender’ and attempts toproblematise not only the exclusion of women, or men asa norm, but the gendered world in itself (Verloo, 2005).For example, Fraser (1997) provides a vision of what thismay entail and calls for men to change their lifestyles sothat they resemble more that of women’s. In the ‘univer-
8
Gender Equality Index – Report
The measures range from getting more women into com-pany boardrooms and tackling gender-based violence toraising the transparency of pay structures. The Strategyunderlines that gender equality is not only equated withequal positions of women and men within paid employ-ment (equality-as-sameness strategy), but embedded intoa more broadly defined ‘gender equal regime’, as a resultof which relevant policies might also refer to, for example,equal sharing of power between women and men, reducingthe school drop-out rate for boys, improving fathers accessto parental leave and combating domestic violence.The perspective of gender equality adopted in the GenderEquality Index attempts to combine these different ap-proaches, by reflecting this plurality of drawing on same-ness and difference of outcomes, but also on engagingwith a broader reflection on how to transform gender rela-tions to achieve greater gender equality for both womenand men in Europe.To combine these positions, the Gender Equality Index con-siders gender gaps, in an attempt to distance itself from thesameness-difference debate inherent in measuring levels ofachievement. Gender gaps, indeed, provide an opportunityto reflect on gender equality from a transformative perspec-tive, as they provide a single equality point to be achieved.By focusing on measuring gender gaps, the Gender EqualityIndex places the equality point between women and menas a benchmark, meaning that women and men shouldhave equality in outcomes. In some instances, it is alsonecessary to consider the approach of difference, by rec-ognising the specificities of women or other groups, forexample, in terms of violence or social exclusion where thefocus is on protecting the integrity and dignity of indi-viduals, and where certain groups are more at risk becauseof power relations in society. Finally, the transformative ap-proach can be introduced through opening up a debateon the division of time between women and men.It is, however, not possible to focus solely on genders gapsand ignore levels of achievement altogether. In light ofthe crisis for example, gender gaps have greatly reducedacross the EU in some areas. Unfortunately, this is not asign of greater gender equality, but shows the hard rea-lity of how much the life of women and men have beenaffected over the past few years (European Commission,2013). In order to ensure that gender gaps cannot be
regarded positively where they point to an adverse situa-tion for women and men, the Gender Equality Index alsotakes levels of achievement into consideration by adjust-ing gender gaps to reflect these. This is the case, for exam-ple, where gender gaps are low in employment rates, butwhere that is associated with low, and possibly worsening,participation rates.
1.4. Measuring gender equalitythrough indicesThe Gender Equality Index does not represent the firstattempt to measure gender equality through a compositeindicator. Several indices that measure gender equality atinternational level already exist (a summary is provided inTable 1.1.). They represent an extremely valuable startingpoint to assist in the measurement of the effectivenessof gender equality policies at EU level. However, there arealso a number of drawbacks, which are discussed in thissection.The evolution of indices can be traced back to the GrossNational Product (GNP) and the Gross Domestic Product(GDP) as internationally applicable measures of a nation’seconomic development. Subsequently, the United NationsDevelopment Programme’s (UNDP) ‘Human DevelopmentReport’ sought to extend this measure to capture some as-pects of human as distinct from purely economic develop-ment. This led to the Human Development Index in 1990.By 1995, along with the elaboration of the Beijing Platformfor Action, a strong case emerged for a more comprehen-sive investigation of gender inequality in economic and so-cial arrangements throughout the world that would requireanalyses and empirical research. Two initial gender indiceswere thus developed. The Human Development Index wasadjusted to build the Gender-related Development Index(Bardhan and Klasen, 1999) by adding disaggregation ofthe indicators by sex. The Gender Empowerment Measuredeparted from these initial indices by focusing on indica-tors related specifically to women’s empowerment issues(Bardhan and Klasen, 1999). It does not attempt to measurewomen’s progress in well-being, but, rather, their roles asagents in society. Other gender indices have since beendeveloped, expanding on the theoretical positions andconceptual frameworks of these initial gender indices.
Gender Equality Index – Report
9
1.4.1. Theoretical positionsThe theoretical positions of gender indices are differ-ent and have developed from several theoretical per-spectives including human development, women’sempowerment or, increasingly, gender equality. TheGender Development Index supported the premise ofseeing gender inequality as a human development is-sue (not primarily an issue of women’s empowerment)that would facilitate policy discussions on gender in-equality and further the collection of sex-disaggregateddata for analysis and policy (Bardhan and Klasen, 1999).Other indices were built with an explicit focus on adopt-ing women’s empowerment position. Examples of suchindices include: the Relative Status of Women Index, basedon the same indicators as the Gender Development Indexand Human Development Index, but instead using relativemeasures that assess the position of women compared tothat of men (Dijkstra and Hanmer, 2000); the Gender In-equality Index which is designed to capture women’s dis-advantage in the dimensions of empowerment, economicactivity and reproductive health.
The European Union Gender Equality Index (Plantenga etal., 2009) departs from a perspective of women’s empow-erment and embraces a gender approach. It does so byencompassing the universal caregiver model outlined byFraser (1997), in which gender equality, as ‘equal sharingof paid work, money, knowledge, decision-making powerand time’, is seen as central (Plantenga et al., 2009).
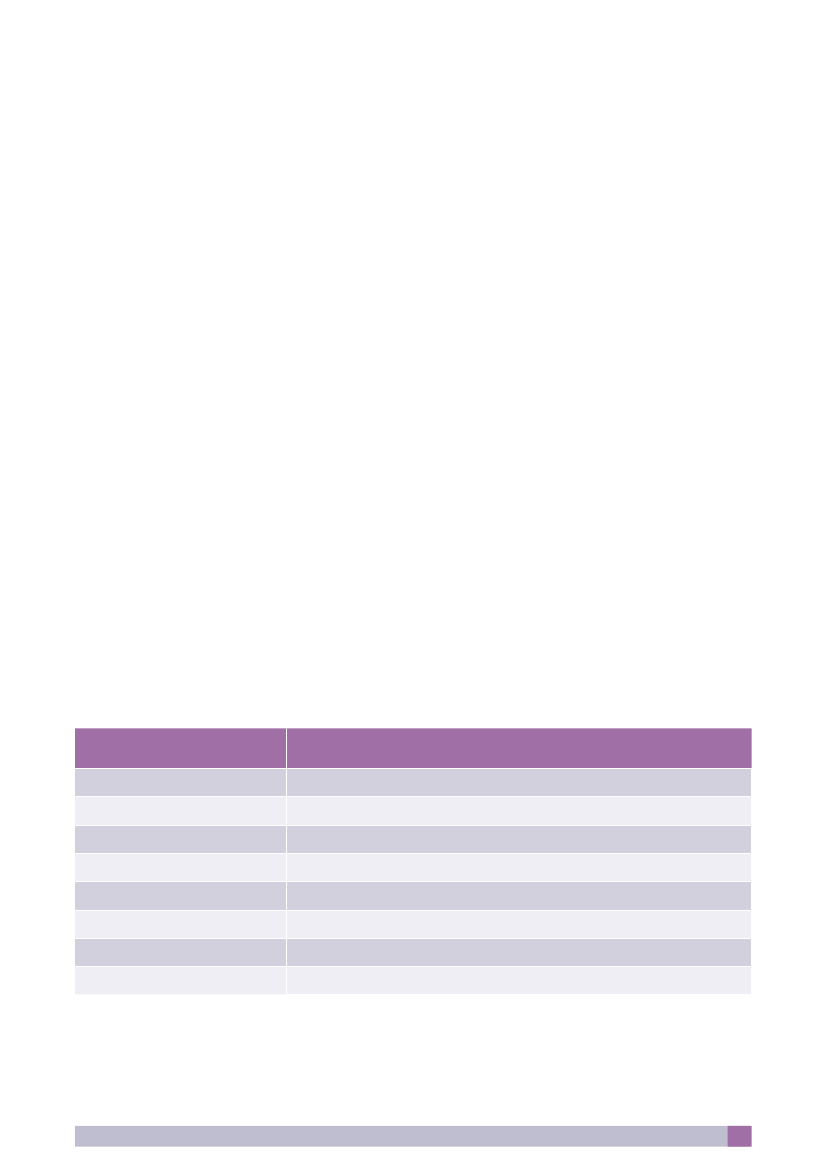
1.4.2. Enlarging the frameworksNumerous studies attempted to expand on the concep-tual frameworks of the initial gender indices, with someattempting to construct alternative indices. Examples ofalternative indices along with their main conceptual frame-works are provided below in Table 1.1.
10
Gender Equality Index – Report
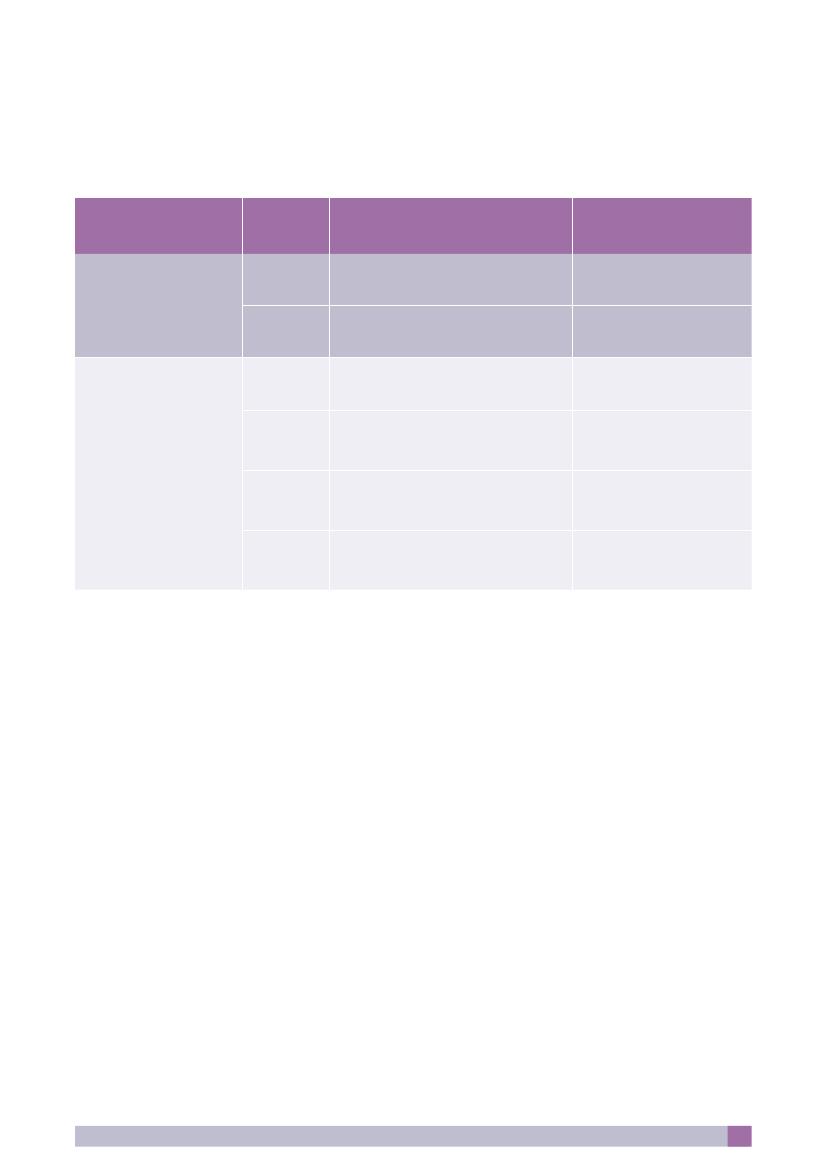
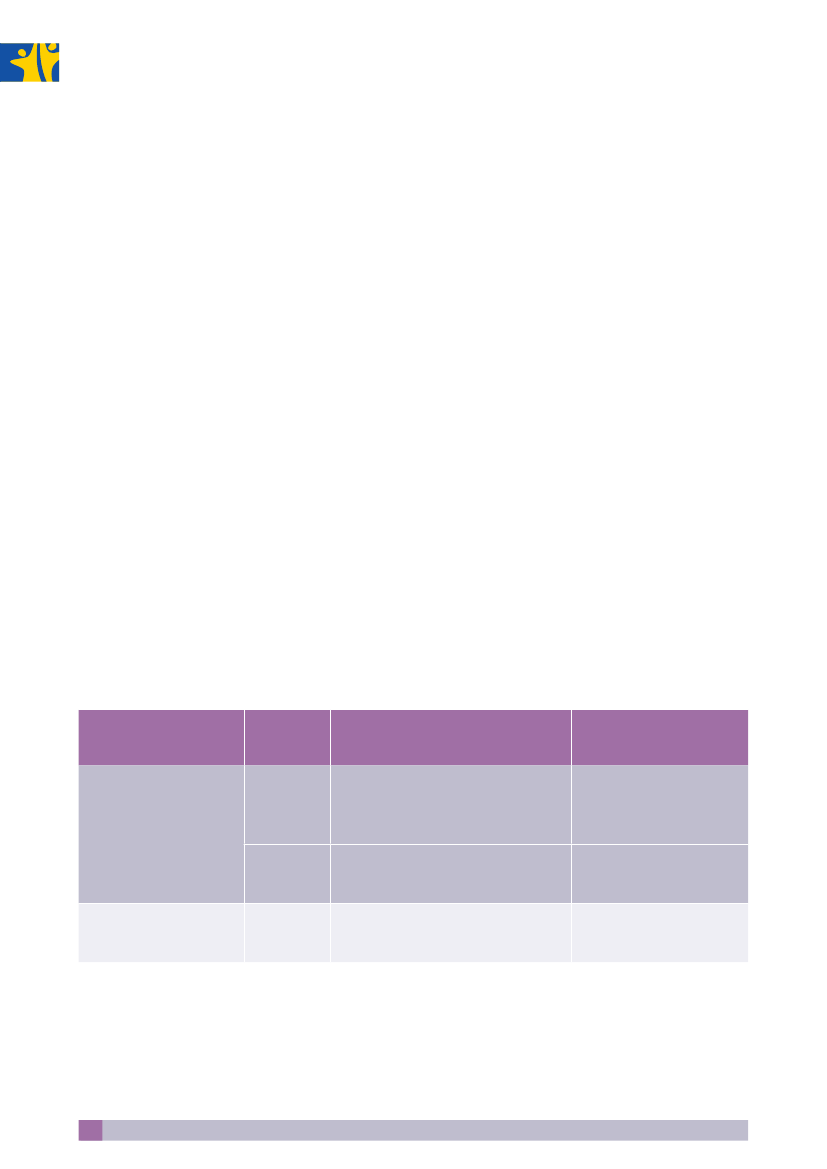
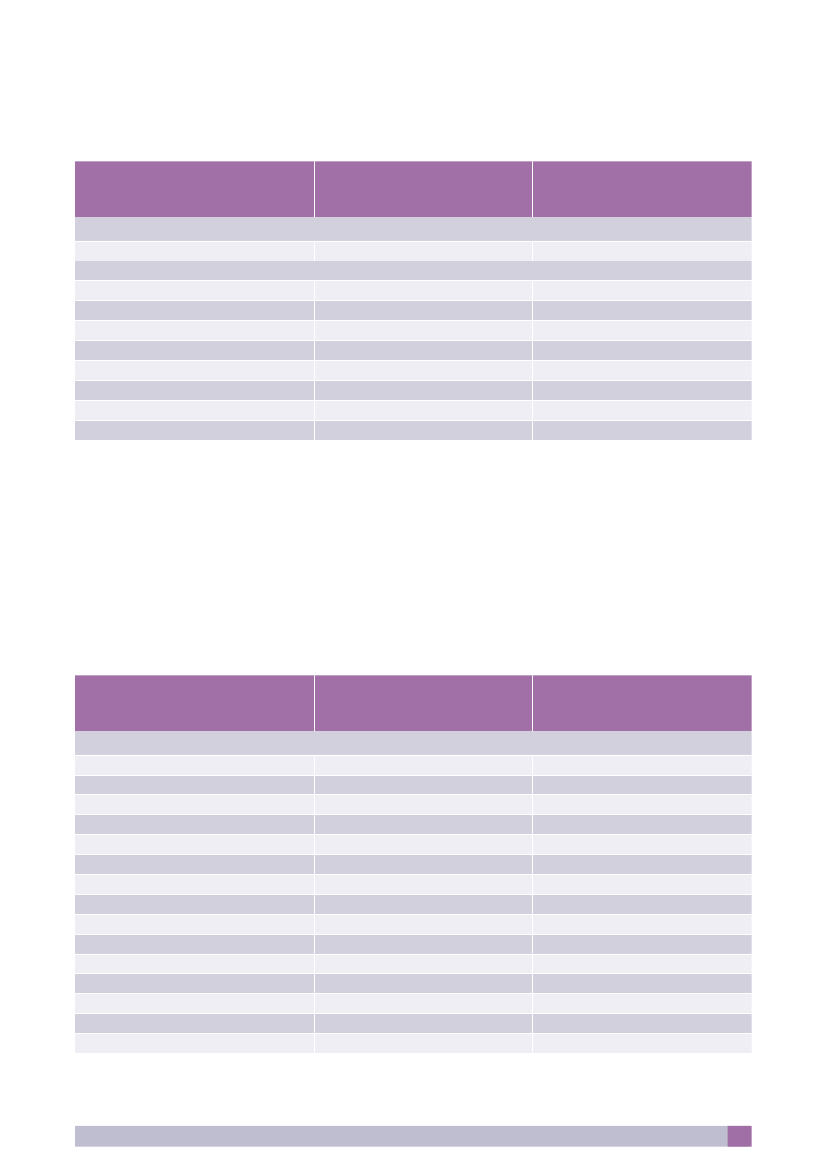
Table 1.1. Existing gender indices and their conceptual frameworkIndicesConceptual frameworkEducational attainmentLongevityIncomeParticipation in governmental, managerial decision-makingParticipation in professional roles and in economic activities in general
Source
Gender Development Index
UNDP
Gender EmpowermentMeasure
UNDP
Gender Inequality Index
Labour marketEmpowermentReproductive healthEconomic participation and opportunityEducational attainmentHealth and survivalPolitical empowermentEducationEconomic participationWomen empowermentDiscriminatory family codeRestricted physical integritySon biasRestricted resources and entitlementsRestricted civil libertiesRatio of the female and male index for education(educational attainment)Ratio of the female and male index for life expectancy (longevity)Relative female and male returns to labourHealth (inequality-adjusted life expectancy index)Education (inequality-adjusted education index)Income (inequality-adjusted income index: Quintile income ratio;income Gini)Equal sharing paid work (labour force participation,unemployment)Money (gender pay gap, income)Decision-making power (political power, socio-economic power)Knowledge (gender gap in education and training,gender gap in educational attainment)Unpaid time (caring time, leisure)Education (education level, lifelong learning and internet,educational segregation)Work (participation, contract conditions, occupational andpay segregation)Power (political, managerial)
UNDP
Gender Gap Index
World EconomicForum
Gender Equity Index
Social Watch
Social Institutionsand Gender Index
OECD
Relative Status of Women
Dijkstra and Hanmer (2000)
Inequality-adjusted HumanDevelopment Index
UNDP
European UnionGender Equality Index
Plantenga et al. (2009)
European GenderEquality Index
Bericat (2011)
Gender Equality Index – Report
11
The multiplicity of domains in the different conceptualframeworks of existing indices reflect the specificity of theobjectives and region that the index targets. For this rea-son, they may not provide an adequate tool for MemberStates comparisons at EU level.Criticisms of existing gender related indices also pointto the sometimes over-simplistic nature of what is beingmeasured and point to the need to extend to other dimen-sions that better reflect critical areas of gender equality, aswell as take into account more subtle and relevant indica-tors of gender equality. This section summarises the short-comings identified within the perspectives of human de-velopment, women’s empowerment and gender equality.While crude indicators such as life expectancy suggestthat women have a major advantage over men (and thismight also apply to levels of educational attainment) this isnot mediated by reference to quality of life and levels of illhealth and disability in later life. Critics are thus calling foran index that measures gendered well-being (Chant, 2006)or captures gender gaps in mortality and disability-free lifeexpectancy (Hooper, 2006).The uneven sharing of (paid and unpaid) work and theconsequences of this in terms of access to financial re-sources and the likelihood of falling into the poverty trap ispointed out as an important area. A gender equality indexshould therefore focus on sex-specific employment andunemployment rates (Cueva, 2006), on disposable income(Klasen, 2006), and on the economic returns of women’sand men’s labour (Chant, 2006). It needs to measure thetime spent on care (Schüler, 2006; Chant, 2006; Klasen,2006; Permanyer, 2011) and the time spent in the informalsector, including leisure activities (Permanyer, 2011; Klasen,2006). The importance of measuring individual disposabletime, net of financial and time responsibilities associatedwith care, has also been raised (Folbre, 2006).The absence of any provision in gender equality indicesin relation to gender-based violence and violence againstwomen, which ignores a major sphere in which gender in-equalities are sustained and magnified, in the home, work-place and society, has been heavily criticised. It is impera-tive that a gender equality index focus on forms of violenceagainst women (Ellsberg et al., 2008); more particularly, onphysical security and absence of violence (Klasen, 2006)or empowerment at the household level, related to vio-lence, control over one’s body, sexuality and reproduction(Cueva, 2006). The focus on gender-based violence against
women also calls for measures of gender equality normsand values (Klasen, 2006) as these are the root of genderinequality in the first place (Inglehart and Norris, 2003).Finally, there is a call for a gender equality index to takeinto consideration other vulnerable groups such as poorwomen, (Chant, 2006) in order to avoid a situation whichsolely reflects the position of economically advantagedwomen (Cueva, 2006; Bericat, 2011).Collectively, researchers agree on the need for a com-parative index that broadens the measures of genderequality, but such measures have not yet been collatedinto a cohesive inter-country index. Due to the lack ofavailable harmonised data, computation remains heavilyconstrained. However, this lack of data should not con-strain the conceptual base of the domains of genderequality to be measured. In summary, existing gender in-dices have fallen short of providing the kind of measuresthat would illuminate debate and contribute to decision-making at EU and national levels. It points to the needfor a more comprehensive, EU based index that feedsinto key policy decisions at EU and national levels.
1.5. The added-value of aGender Equality IndexThe Gender Equality Index provides a synthetic measureof gender equality that is both easy to understand and tocommunicate. This tool should play an important role bysupporting decision-makers in assessing how far a givenMember State is from reaching gender equality. The use ofthe Gender Equality Index allows meaningful comparisonsto be made between different policy areas. Last but notleast, it will give visibility to gender equality by making itpossible to measure its progress over time.In response to the shortcomings of other gender equalityindices, the Gender Equality Index provides a more com-prehensive framework of gender equality. In line with theEU’s framework on gender equality for both women andmen, the Index adopts a gender approach rather than fo-cusing on women’s empowerment. Moreover the GenderEquality Index benefited from the consultation processwith the National Statistics Offices and with the expertsfrom the National Machineries of the EU Members States.Their contribution has determined an important addedvalue to this Index.
12
Gender Equality Index – Report
The Gender Equality Index ensures that it draws upon allthree approaches to gender equality (sameness, differenceand transformative). It does so by relying on gender gaps,that is the difference in the levels of achievement betweenwomen and men on a given gender indicator. No distinc-tion is made as to the direction of this gap, meaning thatthe gender approach takes into account the situation ofwomen and men in various domains of economic and so-cial life, including those where men are in disadvantagedsituations. The target is the equality point, and a givenMember State is equally treated whether a gap is to theadvantage of women or men. However, levels of achieve-ment are also taken into account in order to avoid situationswhereby gender gaps are low, despite an adverse situationfor both women and men.A limitation of existing global gender equality indices isan apparent lack of sensitivity to location. There is a needto provide a more informative tool within a narrower geo-graphical area (Hooper, 2006; Plantenga et al., 2009). Theglobal approach of the Gender Development Index and theGender Empowerment Measure, in the context of Europe,may lose the subtleties of differences between MemberStates (Permanyer, 2011). As its purpose is to offer an arenafor debate and to support the development of policy andresearch at EU level, it is imperative that the GenderEquality Index remain closely aligned with domains perti-nent to both EU policy and specific gender equality policy.To sum up, in line with its policy foundations, the objec-tives of the Gender Equality Index are not only to measuregender equality throughout the Member States and the EU,but also to allow an analysis of gender equality both overtime and geographical areas; to give more visibility to thesituation of women and men in the Member States overalland in selected areas of concern for gender equality; andto support the evaluation of the degree of effectivenessbetween different measures and policies implemented inthe field of gender equality at EU level.Having set out the definition and approach taken by theGender Equality Index, and defined its added value, theReport now turns to the development and presentation ofits conceptual framework.
Gender Equality Index – Report
13
2. Conceptual frameworkA conceptual framework for gender equality is a prere-quisite to guide the way in which gender indicators willbe selected and combined to provide a suitable meas-ure of gender equality relevant to the EU policy context.Describing the dimensions of gender equality is a chal-lenging exercise. It is necessary to deal with the complex-ity of the concept, since it draws on different perspec-tives and disciplines, different age groups and a moregeneral heterogeneity within the population itself, addingfurther complexity to the attempt to construct a concep-tual framework of gender equality.It is also essential for the Gender Equality Index to renderwhat it seeks to describe as simple as possible. It is crucialto bear in mind that this simplicity is not a marker oftriviality. Instead, users should be aware that it representsthe main elements of an intricate concept. This process ofsimplification is the result of carefully negotiating thebalance of drawing out the main elements without losingthe essence of gender equality.The conceptual framework aims to provide a hierarchicaltree structure that can adequately map the main equalityconcerns within the framework of EU policy and EU gen-der equality policy. It establishes the domains and associ-ated sub-domains into which gender gaps within relevantindicators can be measured. The development of thisstructure is driven by both policy objectives and explicitreference to (gender) equality frameworks, which this sec-tion outlines before presenting in detail the domains andsub-domains of the conceptual framework.ness, difference and transformative frameworks to genderequality also adopted in the Gender Equality Index, andprovide various domains of gender equality to be takeninto account.
2.1.1. Equality and equity frameworksSeveral equality and equity frameworks, sometimes appliedspecifically to gender, have been developed. A perspectiveof ‘equality of condition’ is proposed by Baker et al. (2004)in a social equality framework. Although this concept ofequality is not specifically dedicated to the question ofgender equality, but rather to social equality in general,it provides a possible approach to determine relevantdomains of gender equality. This approach is particularlyrelevant to contemporary developed societies and aims ateliminating major inequalities. It sees inequalities as rootedin changing and changeable social structures, particularlyin structures of domination and oppression. Instead of see-ing individuals as responsible for their successes and failures,the approach of equality of condition emphasises the in-fluence of social factors on people’s choices and actions.The framework offers some interesting dimensions whichare adaptable to the context of gender and which includefive dimensions of equality which are seen to cover mostissues that contemporary egalitarians are concerned with:equal respect and recognition; equality of resources; love,care and solidarity; equality of power; and working andlearning as equals.Another framework that is focused specifically on genderhas been proposed by Pascall and Lewis (2004). This frame-work names five areas as key elements of gender regimes,for the purpose of analysing and assessing welfare systemsand social politics with respect to gender equality. It mapssocial politics for gender equality across the domains of paidwork, care work, income, time and voice. It argues that gen-der equality policies have been limited in effect, becausethey have addressed only part of the system rather thanthe whole, in particular, individual women’s possibilities forequal earning (Pascall and Lewis, 2004), which shows the im-portance of ensuring that a conceptual framework of gen-der equality is as comprehensive as possible.
2.1. Gender equality theoreticalframeworksIn order to make sense of the variety of meanings ofgender equality observed in EU policy documents, somekey frameworks that could explicate gender equality atthe macro level were analysed. They broadly cover twomain areas: equality or equity frameworks and capabilityapproaches. These, taken together, combine the same-
14
Gender Equality Index – Report
The gender framework developed by Fraser (1997) departsfrom the concept of gender equality, instead using the termgender equity and establishing principles for thinking sys-tematically about gender equity in the context of welfarestate models. This change in terminology reflects the ideathat equity is concerned with fairness and justice betweenwomen and men in relation to the share of benefits andresponsibilities. The equity concept moves from allocatingtasks equally to allocating them fairly. It suggests that genderequality can only be reached when both women and menchange their lifestyles and the way in which they allocateshares of social and economic participation. Gender equityis defined as a complex idea, and relies on shattering thedichotomy between sameness and difference. Against thebackground of a multi-dimensional concept, it determinesthe dimensions of gender equity as a compound of sevendistinct principles, to which welfare systems must conform inorder to meet the claim of gender equality: anti-poverty; anti-exploitation; income equality; leisure time equality; equalityof respect; anti-marginalisation; and anti-androcentric.
Some researchers have extended the original capability ap-proach and applied it to gender, such as Nussbaum (2003),whose considerations on gender equality build upon Sen’scapability approach. She argues that, in order to supplyconcrete and useful guidance, a definite list of the mostrelevant capabilities have to be formulated, even one thatis tentative and revisable. She has thus developed a list ofcentral human capabilities (in terms of universal humanneeds and entitlements) of which everyone should be en-titled to a minimum threshold, even while considering thislist as open-ended and subject to ongoing revision andrethinking. Nussbaum lists these capabilities as: life; bodilyhealth; bodily integrity; senses, imagination and thought;emotions; practical reason; affiliation; other species; play;control over one’s environment; and equal worth of indi-viduals. Each of these capabilities is seen as crucial to fullequality. Neglecting one or more of them is construed as afailing in gender justice.Robeyns (2003), like Nussbaum (2003), argues against com-pleting a definitive list of universal capabilities but sug-gests a procedural approach to defining relevant capabili-ties for determining what to measure and how to observegender inequality, where interested parties can proposefurther capabilities pending a reasonable argument. Thelist of gender equality capabilities she proposes consistsof: life and physical health; mental well-being; bodily in-tegrity and safety; social relations; political empowerment;education and knowledge; domestic work and nonmarketcare; paid work and other projects; shelter and environ-ment; mobility; leisure activities; time-autonomy; respect;and religion (Robeyns, 2003).These frameworks provide a solid basis on which to con-ceptualise gender equality in the EU policy context, in-cluding a list of overlapping domains. Before proceeding,however, the report provides an overview of the develop-ment of the concept of gender equality within legal andstrategic documents at EU and international level in orderto identify the domains of gender equality present in thesedocuments, and to map the concept of gender equality.
2.1.2. Capability approachesThe meaning of gender equality has also been taken fromthe perspective of capabilities. Attempts to measure gen-der equality, notably the Human Development Index andGender-related Development Index, have largely adoptedthis approach and drawn upon the framework of Sen’s ca-pability approach (Sen, 1980; 1993). It argues that a con-cept of equality should be concerned with what peopleare able to be and to do, and not with their income, orwhat they can consume. The focus should be on the realopportunities that people have for well-being and leadinga valuable life. According to this equality concept, it is notimportant to equate people with the distribution of mate-rial resources, but rather to ask how, against the concretebackground of their different individual situations, resourcescan be used to open options for choice and secure people’swell-being. People with physical disabilities, for example,require more resources to attain an equal degree of mobil-ity, power to act and choice. The parameters for equalityare capabilities, which are necessary for the realisation ofmeaningful activities and positive states of being. Sen’s ca-pability approach itself only provides a general frameworkwithout proposing a concrete list of capabilities because,in his opinion, it is not up to the theorist to make thesedecisions, but rather to a democratic process among therelevant agents (Robeyns, 2007).
Gender Equality Index – Report
15
2.2. Gender equalitypolicy contextTo understand the concept of gender equality in EU policy, athorough analysis of some key documents was undertaken.The EU treaties were the first main reference as the bindingagreement between EU Member States, complemented bythe body of other EU strategic documents promoting com-pliance with the principle of gender equality. Finally, relevantinternational frameworks such as the UN are discussed. Thefields of action and priority areas that appear in these policydocuments are set out in this section.
2.2.2. Gender equality in the EUstrategic policy documentsIn light of the increasing impetus for gender equality andin order to fulfil these gender equality ambitions, the trea-ties of the EU, the European Commission and other EU in-stitutions have developed several strategic and/or legisla-tive documents.Since 1996 the European Commission has followed a dualapproach to gender equality by both implementing gen-der mainstreaming and initiating specific measures the firstcomprehensive policy was introduced in the a Commu-nity Framework Strategy on Gender Equality (2001–2005)(COM(2000) 335 final) in 2000, having as its main objectiveto ‘establish a framework for action providing for gendermainstreaming in all Community activities in such a waythat they help to attain the goal of removing inequalitiesand promoting gender equality’. The framework identifiedseveral inter-related fields of action in the promotion ofgender equality in economic life: equal participation andrepresentation; equal access and full enjoyment of socialrights for women and men; gender equality in civil life;change of gender roles and stereotypes.Following this, the European Commission developedthe Roadmap for Equality between Women and Men(2006–2010) (COM(2006) 92 final), outlining six priority areas,each with specific key objectives and actions, and thereforemarking a clear advance in terms of providing measuresand targets. To measure progress, the roadmap calls for thedevelopment of comparable sex-disaggregated statistics,gender sensitive indicators to monitor progress towardsgender equality and the creation of a Gender Equality In-dex. Its priority areas consist of: equal economic independ-ence for women and men; the reconciliation of private andprofessional life; equal representation in decision-making;the eradication of all forms of gender-based violence; theelimination of gender stereotypes; and the promotion ofgender equality in developing countries.In 2010, on the occasion of International Women’s Day,the European Commission unveiled the Women’s Charter(COM(2010) 78 final), which aims at strengthening the Eu-ropean Commission’s commitment to ‘making equality be-tween women and men a reality’. This includes strengthen-ing gender perspectives in all policy work undertaken bythe Commission and dedicating the necessary resources toits realisation. The Charter is based on five gender equalityprinciples: equal economic independence; equal pay for
2.2.1. Gender Equality in the EU TreatiesPolicies in the area of gender equality have been drawnup since the creation of the European Economic Commu-nity in 1957 with the Treaty of Rome. Following the estab-lishment of this founding treaty, this basic principle wasgradually clarified and developed by several Council Direc-tives, which dealt mostly with economic perspectives, in-cluding pay, participation, health and safety, maternity andparental leave, as well as other issues pertinent to work-lifebalance (European Parliament, 2009). None of these legalmeasures, however, dealt specifically to the principle ofgender equality.The principle of gender equality has been strengthened,notably since the 1997 Treaty of Amsterdam (97/C 340/05),by inscribing the principle of gender mainstreaming ina foundation text of the EU. The perspectives of gen-der equality started to widen and, although still largelyadopting an economic perspective, it sought an im-proved understanding of gender equality and requestedthat gender mainstreaming be applied to all activities ofthe Community.Subsequently, the introduction of the Lisbon Treaty (2007/C306/01) in 2009 marked a turning point, as it directly ad-dressed the principle of gender equality, and the policiesto support it, as a central element of EU policy. It empha-sised the importance of eliminating all types of discrimina-tion, including those based on sex, through the Charter ofFundamental Rights of the European Union (2000/C364/01),and gave renewed attention to how gender-based vio-lence of the European Union (2000/C 364/01) threatenedthe integrity and dignity of women and men in the EU.
16
Gender Equality Index – Report
equal work and work of equal value; equality in decision-making; dignity, integrity and an end to gender-basedviolence; gender equality beyond the EU.In the same year, and following on from the Roadmap, theEuropean Commission developed the Strategy for Equal-ity between Women and Men (2010–2015) (COM(2010) 491final), which, building upon the Women’s Charter (COM(2010)78 final), presents current priorities. The Strategy aims at con-tributing ‘to improving the place of women in the labourmarket, in society and in decision-making positions both inthe European Union and the world’, and reiterates the callfor increased cooperation between all European institutionsand Member States. The main priority areas it identifies are:economic independence of women; equal pay; equality indecision-making; dignity, integrity and an end to gender-based violence; gender equality in external actions; andhorizontal issues. Importantly, in its action plan, the Strat-egy for Equality between Women and Men mandates theconstruction of the Gender Equality Index to the EuropeanInstitute for Gender Equality.The year 2010 also saw the launch of the European Union’s10-year growth strategy, Europe 2020 (IP/10/225), which,although it does not refer specifically to gender equality,emphasises the need to foster growth that is smart, sus-tainable and inclusive. Under both the smart and inclusivegrowth agendas, EU targets look at employment (makingspecific references to gender inequality and other groundsof inequality) and education. The employment target aimsfor 75 % of 20- to 64-year-olds to be employed, while theeducation targets aim to reduce school drop-out rates be-low 10 % and ensure that at least 40 % of 30- to 34-year-olds have completed third level education or equivalent.The inclusive agenda has an additional EU target for reduc-ing the number of people in or at risk of poverty and socialexclusion by at least 20 million.The work undertaken at European level by the EuropeanCommission was reinforced in 2006 by a commitment atMember State level. In the first European Pact for GenderEquality (2006) (7775/1/06 REV 1), the European Councilrequested that Member States strengthen attention togender equality and support the objectives of the road-map. In 2011 a new Pact for the period 2011–2020 (7349/11)was adopted. It urges the EU and Member States towork towards achieving equality, to close gender gaps inemployment, education and social inclusion, ensure equalpay for equal work and promote the equal access andparticipation of women and men in decision-making. The
Pact also calls for the promotion of work-life balance forboth women and men and action to reduce all forms ofviolence against women.
2.2.3. Gender equality ininternational platformsOutside of the EU context, United Nation (UN) institutionshave been significant actors in terms of their work in thefield of gender equality. The United Nations General Assem-bly adopted the Convention on the Elimination of All Formsof Discrimination against Women (CEDAW) on 18 Decem-ber 1979, providing a historic document positioning dis-crimination against women as a violation of fundamentalrights. Its scope is very wide and includes, for example, SexRole Stereotyping and Prejudice (Article 5); Prostitution (Ar-ticle 6); Political and Public Life (Article 7); Representation(Article 8); Education (Article 10); Employment (Article 11);Health (Article 12); or Marriage and Family Life (Article 16).At the conclusion of the United Nations 4th World Confer-ence on Women in 1995, the Beijing Platform for Action(BPfA) was unveiled. It highlighted 12 critical areas of con-cern for gender equality, which include: Women and Pover-ty; Education and Training of Women; Women and Health;Violence against Women; Women and Armed Conflict;Women and the Economy; Women in Power and Decision-making; Institutional Mechanisms for the Advancement ofWomen; Human Rights of Women; Women and the Me-dia; Women and the Environment; The Girl-child. The BPfAwas ratified by the EU Member States who have commit-ted to regularly monitor progress in each area. In addition,following the ratification of the BPfA, the establishment ofgender mainstreaming became a major global strategy forthe promotion of gender equality. Within this context, all27 Member States committed to a dual approach of gen-der equality, namely specific actions and gender main-streaming. Although the primary responsibility lies withthe EU Member States to advance the BPfA agenda, theEuropean Council committed the EU to its principles in thesame year. The High Level Group on Gender Mainstream-ing, established and chaired by the European Commission,undertook to review the implementation of each of thecritical areas of concern in an annual work programme,with which each EU Presidency country collaborates.The UN also adopted the Millennium Declaration in 2000,listing eight international development goals to be reachedby 2015. The third Millennium Development Goal (MDG3)is promoting gender equality and empowering women,
Gender Equality Index – Report
17
with targets that aim at tackling issues in employment, pay,political representation, education or poverty. The fifth Mil-lennium Development Goal (MDG5) also highlights thepromotion of maternal health and access to reproductivehealth, particularly when it comes to contraception andantenatal care coverage.The Council of Europe also works actively to promote gen-der equality. Article 14 and Protocol 12 of the EuropeanConvention for the Protection of Human Rights and funda-mental Freedoms, whose implementation is monitored bythe Council, have helped to improve the legal protectionand status of women in recent decades. In April 2010, theCommittee of Ministers of the Council of Europe adopt-ed a Convention on preventing and combating violenceagainst women and domestic violence, also known asIstambul Convention.This review of the main developments of gender equalitypolicy at EU and international level provides a solid baseon which to derive critical areas of gender equality for thepurpose of building the Gender Equality Index. They, to-gether with the theoretical frameworks reviewed above,have been mapped to provide a comprehensive concep-tualisation of gender equality issues at EU policy level.
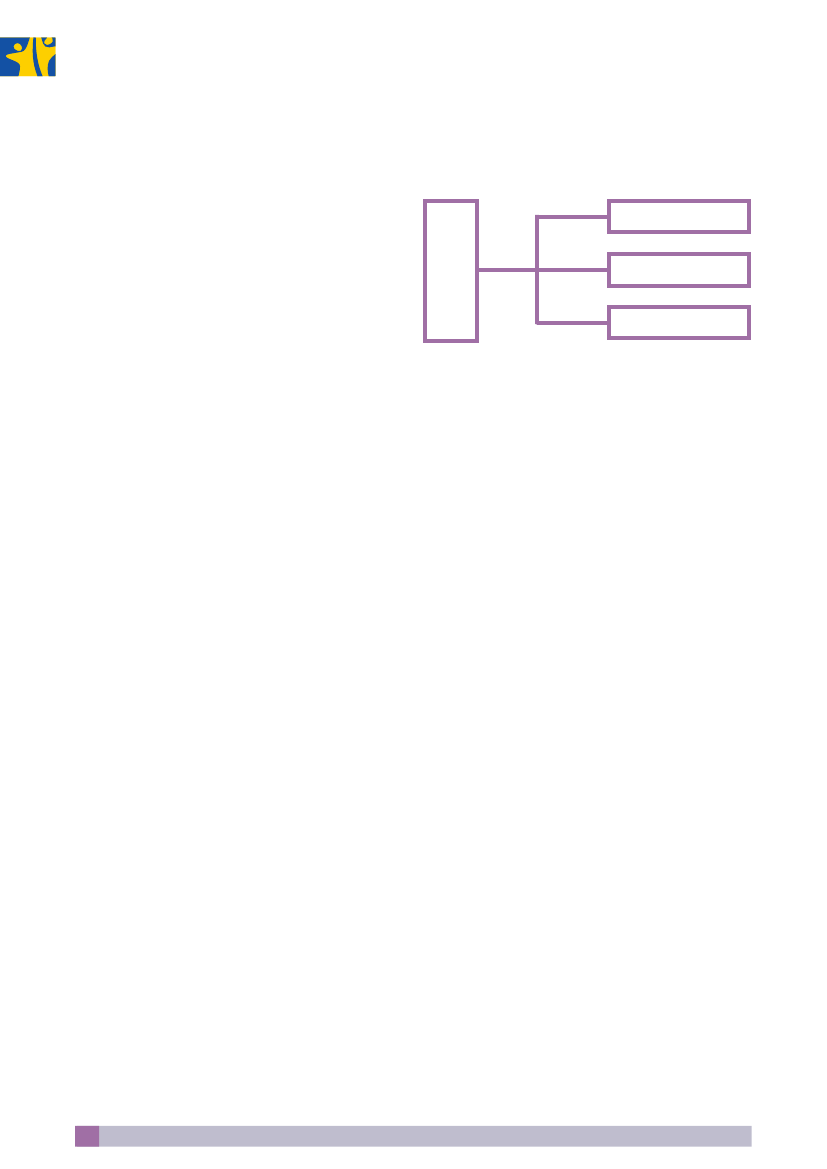
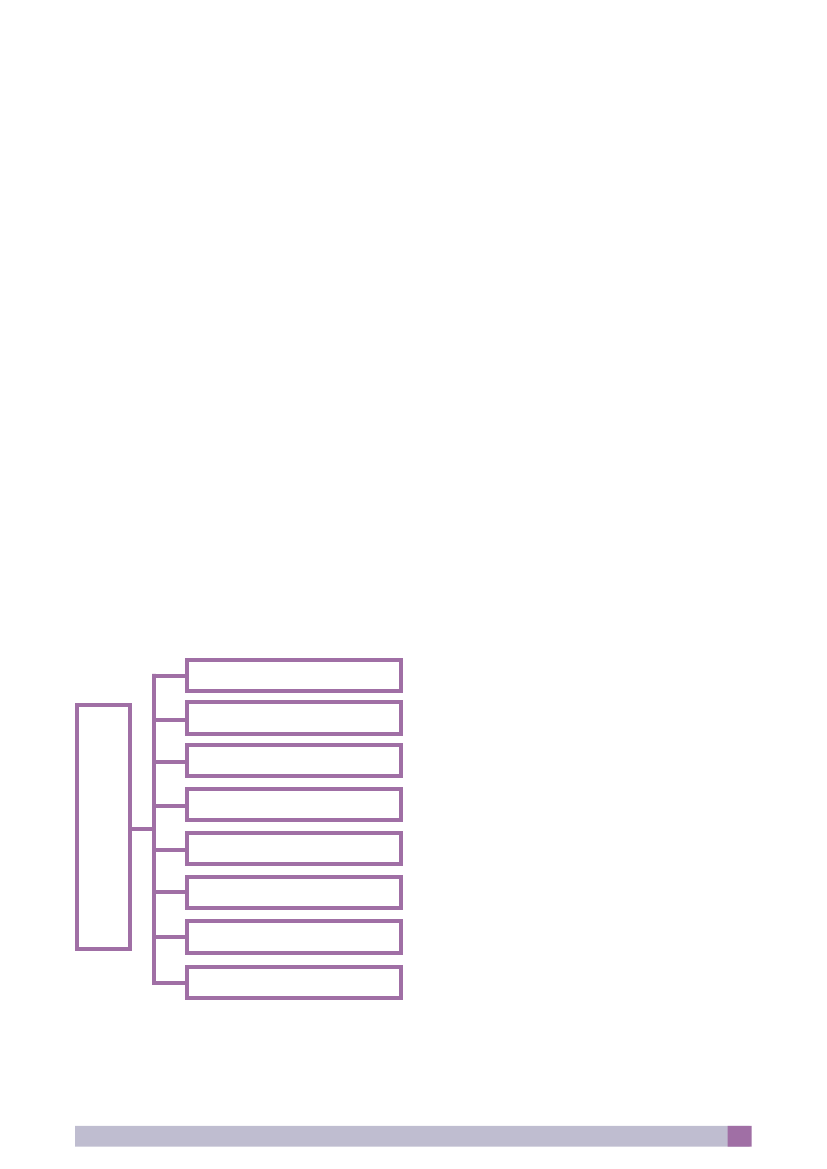
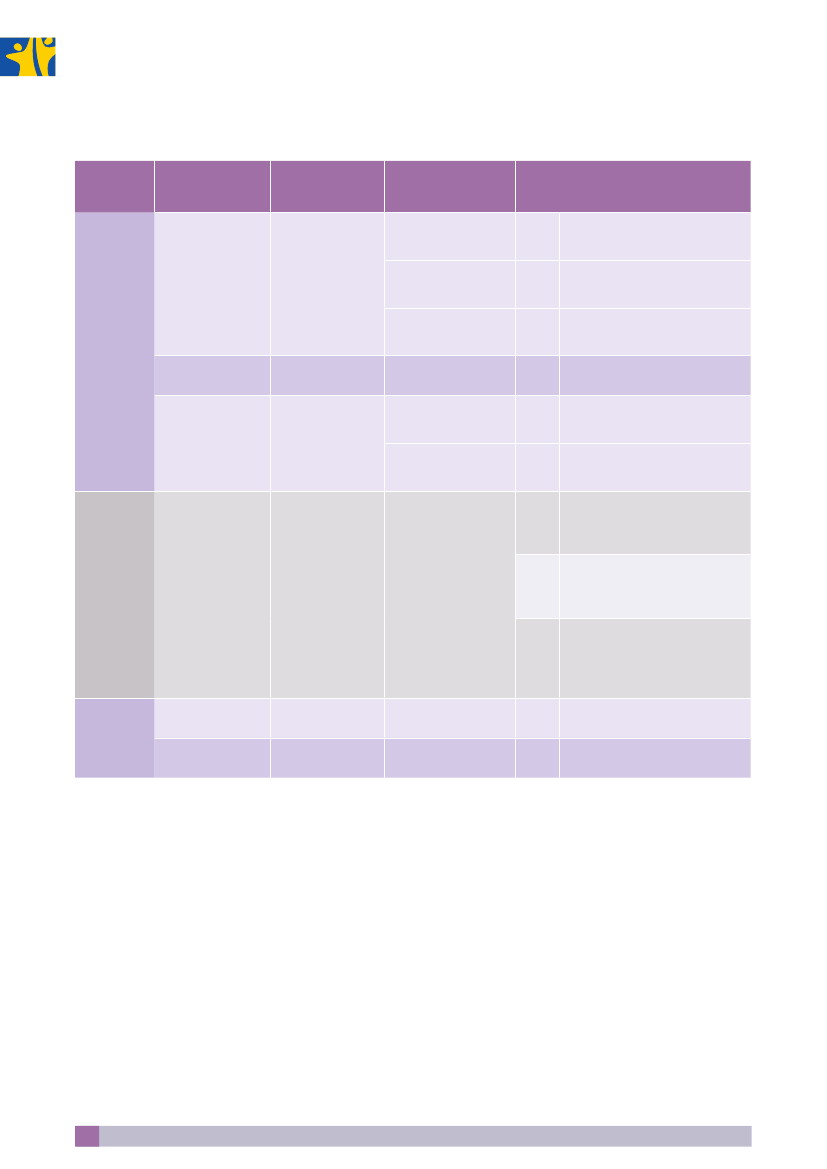
into a hierarchical tree structure. Each domain was thenfurther subdivided into sub-domains. The process of de-signing this structure1was carried out with the advice ofthe members of EIGE’s Experts Forum and Working Groupon the Gender Equality Index1. It was also based on a studyfor the development of the basic structure of a EuropeanUnion Gender Equality Index commissioned by the Euro-pean Institute for Gender Equality (Plantenga et al., 2011)and a feasibility study commissioned by and presented tothe European Commission (Plantenga et al., 2003).During this process, the domains and sub-domains werealso developed against the backdrop of wider interna-tional framework agreements, such as the CEDAW andthe BPfA. Where possible, the critical areas of the BPfAwere taken into account because they provide a world-wide framework and because a commitment exists bythe European Union to continue to review its indicatorsto review the progress of gender equality. A detailed ac-count of how each domain relates to the framework ex-amined is provided in Annex 1.Using some of the conceptualisations of gender equalityand key frameworks of gender equality reviewed above,the domains used in the Gender Equality Index are nowpresented (Figure 2.1.). It consists of eight domains, the firstsix being combined into a core index, and an additionaltwo satellite indices. The satellite indices are conceptu-ally related to gender equality, but cannot be included inthe core index because they measure an illustrative phe-nomenon – that is, a phenomenon that only applies to aselected group of the population. This occurs when con-sidering issues that are related to women only, as in thecase of gender-based violence against women, or whenexamining gender gaps among specific population groups(people with a disability; lone parents or carers; etc).Creating a framework of a core index with satelliteaccounts, as was initially proposed in the work of Plantengaet al. (2011), provides more flexibility to the Gender EqualityIndex and thus increases its usefulness.
2.3. Domains of gender equalityHaving reviewed the main domains of gender equality con-sidered by some leading theoretical frameworks, as well as in-ternational policy documents, this section now turns to howthese were organised into a coherent framework for the Gen-der Equality Index, before describing them in more detail.
2.3.1. From theory and policy to domainsAn analysis of key policy documents and gender equalityframeworks enabled the translation of the concept of gen-der equality, with all its complexity and layers of meaning,
1
The Working Group on the Gender Equality Index is a board officially established by EIGE’s Management board in 2011 to provide the technicalsupport in the construction of the Gender Equality Index and in developing a strategy to disseminate it. The Experts’ Forum is the Institute’s advisorybody. Its principle function is to provide expertise knowledge in the field of gender equality.
18
Gender Equality Index – Report
Figure 2.1. Domains of the Gender Equality Index
WorkViolenceMoney
Intersectinginequalities
Gender Equality inthe EU PolicyFramework
Knowledge
HealthPower
Time
Each of the domains is discussed in greater detail below,along with associated sub-domains. The link betweenthe concept of gender equality and each domain is out-lined, and the section expands on how domains relate totheoretical approaches of gender equality, as well as howeach addresses a gender equality policy concern at the EUlevel.
2.3.2. Domain 1: WorkThe first domain,work,relates to gender gaps in the posi-tion of women and men in the European labour market.This means that, in line with EU policy focus, it mostlyconsiders paid work. It is an important area to consider, asgender gaps in employment have been linked to slowerrates of economic growth because of an artificial reduc-tion in the pool of talent in the labour market (Klasen andLamanna, 2009).The domain ofworkrelates to the conceptual models ofgender equality identified in the literature. Access is em-phasised in equality frameworks with a focus on the ca-pability of individuals to work in the labour market or toundertake projects (Robeyns, 2003). Importance is given tothe equal value and share of work between women and
men (Pascall and Lewis, 2004), and to the equal distribu-tion of burdens and benefits of work. In addition to equalshare, the conditions under which people work need to bemuch more equal in character to achieve equality (Bakeret al., 2004). This may mean being capable of controllingone’s environment, including exercising practical reasonand entering into meaningful relationships of mutual rec-ognition with other workers (Nussbaum, 2003). This focuson the conditions in which work is undertaken to achievegender equality can be framed as a more general anti-ex-ploitation principle (Fraser, 1997).At policy level, the domain ofworkis relevant becauseof the importance given to increasing both the numberof jobs and labour market participation. Some of the keybenchmarks in this domain of EU policy are the Europe 2020(IP/10/225) and the European Employment (COM(2003) 6 fi-nal) strategies, with a target to achieve a participation ratein employment of 75 % of 20- to 64-year-old Europeans.Gender differences are tackled by a number of documents.The Treaty on the Functioning of the EU (Article 153) (2010/C83/01) includes a commitment to support Member Statesin achieving equality between women and men with re-gard to labour market opportunities and treatment atwork. This is reinforced by the European Commission, the
Gender Equality Index – Report
19
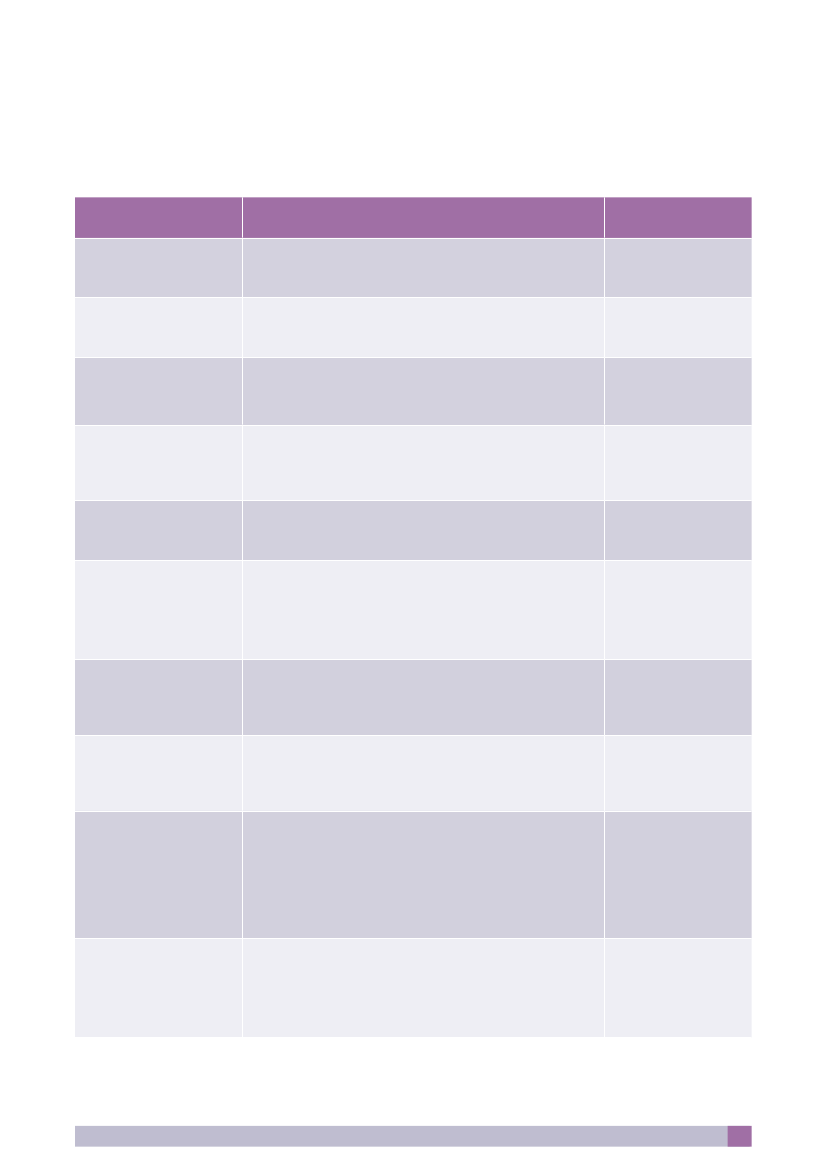
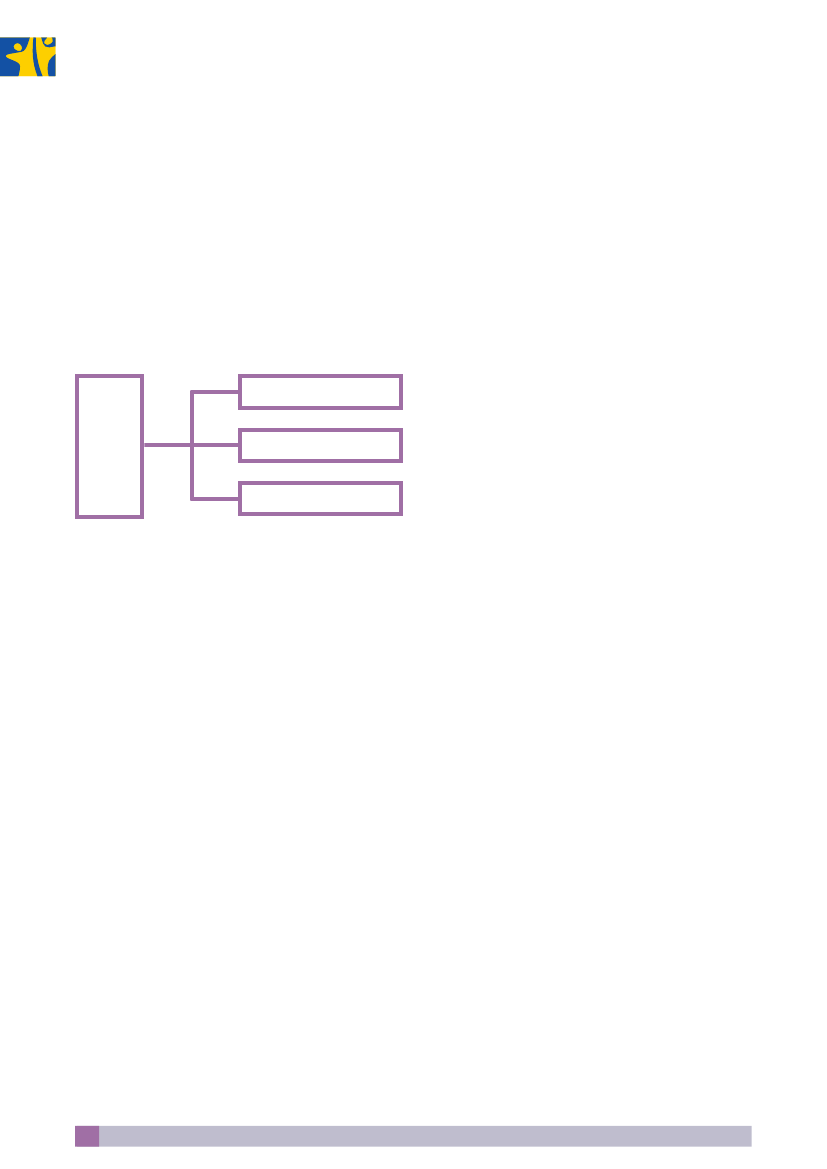
European Parliament and the European Council with Direc-tive 2006/54/EC, which deals with the implementation ofthe principle of equal opportunities and equal treatmentof women and men in matters of employment and oc-cupation. Furthermore, strategic documents such as theRoadmap (2006–2010) (COM(2006) 92 final), the Women’sCharter (2010) (COM(2010) 78 final), the Pact (2011) (7349/11)or the Strategy (2010) (COM(2010) 491 final)have translatedthese concerns mainly in terms of increasing women’s em-ployment, currently well below that of men’s, as well asreducing labour market segregation.The focus of EU policy has moved away from only attempt-ing to provide more jobs, to also ensuring that these arebetter jobs. Quality of work, for example, is at the heart ofthe European Social Model and the European EmploymentStrategy (COM(2003) 6 final). The Lisbon Strategy (2000)and Europe 2020 (IP/10/225) call not only for the creationof more jobs for women, but also better jobs for womenand men. The issue of quality can refer to a number of jobcharacteristics and may also be defined as the match be-tween the characteristics of the job and the worker, and theworkers’ subjective assessment of their job in terms of sat-isfaction, job security, career prospects and so forth (Green,2006; European Commission, 2001) (COM(2001) 313 final).The principles of quality of work were developed followingstatements from the Lisbon and Nice European Councils in2000, where there was an emphasis on the promotion ofquality in all areas, including quality of work (EMCO, 2010).Under the Lisbon Strategy, Member States have acknowl-edged the major contribution that guaranteeing qualityand productivity at work can play in promoting economicgrowth and employment (COM(2003) 728 final). The focusof EU policy on quality of work also includes the promotionof flexible working arrangements, with a strong emphasison work-life balance, often translating into policies relatedto family leave or childcare arrangements, for both womenand men, seen, for example, in the Pact (2011) (7349/11).Quality of work became a priority area of the Social PolicyAgenda of the European Union (2006–10) (COM(2005) 33final) and subsequently developed into the Europe 2020’scall for more and better jobs.The domain ofworkis divided into three sub-domainswhich consist ofparticipation, segregationandquality ofwork(Figure 2.2.).
Figure 2.2. Domain ofworkand its sub-domains
Participation
Work
SegregationQuality of work
The first sub-domain,participation,is important for genderequality given that gender gaps in participation have nar-rowed dramatically across the lifespan of the EU, althoughwomen remain less likely than men to participate in thelabour market. Furthermore, when women do participate,it is more frequently on a part-time basis, leading to in-creased patterns of segregation and lower quality of work(European Commission, 2009). Despite the EU policy focuson paid employment, it is important to point out that par-ticipation is also highly gendered by patterns of participa-tion in the formal and informal labour market. While theparticipation of women in paid employment has reachedone of the highest levels in history, women’s involvementin so-called ‘invisible’ areas should not be forgotten. Thiscan take the form of work performed at home (piece-ratelabour), in the black economy or working undeclared in afamily business (Chant and Pedwell, 2008).Women are more likely to move in and out of the labourmarket, because their disproportionate responsibility totake on caring roles leads to more career interruptionscompared with men (Annandale and Hunt, 2000). Theparticipation of women and men in work is fundamen-tally different and can be summarised by the so-called‘30:30:40’ model (Hutton, 1995). In this model, society isdivided into approximately 30 % of the population that areunemployed or inactive, a further 30 % that are active butin some form of precarious conditions (such as some formsof self-employment or forced part-time employment) andthe remaining 40 % in permanent employment or estab-lished and secure self-employment. Of course, adoptinga gender perspective for this model shows that a funda-mental difference is that women are disproportionatelyrepresented in the last two categories (Crompton, 1997).Many forms of policy can influence the participation rateof women, including fiscal policies; benefits, allowances orsubsidies; various forms of leave; flexible forms of workingincluding part-time work (Jaumotte, 2003).
20
Gender Equality Index – Report
The second sub-domain examines gendersegregation,asit continues to contribute to gender inequality in Europeand also results in less efficient economies (Anker, 1998).Segregation refers directly to patterns of segregation inthe labour force both horizontally and vertically. Segrega-tion in the labour market has been a pervasive issue over along period of time. Occupational, or horizontal, segrega-tion is defined as the concentration of women and menin different types and levels of activity and employment,with women being confined to a narrower range of oc-cupations than men. Often, the most feminised sectors arethose that provide market substitutes for services womenhistorically provided in the household, such as childcare,elder care, nursing or teaching (Folbre, 2006). The segrega-tion of the labour market has detrimental effects on thelabour market generally because it contributes to the gen-der pay gap, and impacts career advancement and accessto training (Magnusson and Nermo, 2009).Hierarchical, or vertical, segregation refers to the under-representation of women at the top of career ladders andover-representation in roles that are deemed more menial,with the ordering of occupations often done on the basisof desirable attributes such as income, prestige and condi-tions (Bettio and Verashchagina, 2009). Horizontal segrega-tion has had a tendency to shift towards fewer differencesover time, with an increase in the proportion of womenin most sectors. However, some sectors, such as scienceand technology, still lag behind. Vertical segregation alsoremains strong despite the increase in the number ofwomen entering top positions. A symbolic and very tellingexample of this is the lack of progress made regarding thenumber of women on company boards. Furthermore, evi-dence suggests that some degree of tokenism prevails, orthat within equal job descriptions, the tasks of women andmen remain fundamentally different. Importantly, researchsuggests that the power structures of the labour markethave remained largely intact despite women infiltrating alllevels and areas, with the most attractive positions still outof reach of women (Annandale and Hunt, 2000).The third sub-domain,quality of work,refers not only towork participation, but also looks at the features of thatemployment (COM(2001) 313 final). Indeed, the increase inthe number of jobs in response to EU policy may have beenat the expense of quality (Leschke et al., 2008), and the pat-terns of segregation of the labour market may heightendifferences in the quality of jobs between men and wom-en (European Commission, 2009). For example, segrega-tion entails that women-dominated jobs may hold fewer
opportunities for training and ensuing promotion, whichin turn contributes to further segregation and a wideningof the gap (Eurofound, 2012). The nature of employment,and thereby its quality, is being affected by new ways ofworking, the rise of new Internet technologies allowingfor a greater permeability between the private and publicspheres. The greater need for flexibility on the part of organ-isations has given rise to greater low-paid and less securetypes of employment, often on a part-time or temporarybasis, with positions that are filled by more women thanmen (Bradley and Healy, 2008). This is gendered, as it oftenentails that women become disproportionately involvedin non-standard and/or precarious work (Rubery, 2002).Quality of work can be examined at the individual level,but it is also possible to adopt a social (stemming fromquality of work) or an organisational (ensuring a productiveworkforce) perspective (UNECE, 2010). But only the individ-ual perspective can be implemented in a composite indi-cator. Quality of work is a multi-dimensional concept thatcan be summed up under several pillars (Eurofound, 2002).The first pillar is career and employment security. This isvery gendered because, despite their upward mobility,women’s progress in many sectors is still very uneven dueto a ‘glass ceiling’, masculine culture and lack of transpa-rent promotional processes (European Commission, 2007a).In addition, women hold a slightly higher percentage thanmen of fixed-term contracts, including involuntary short-term contracts (European Commission, 2009). The secondpillar is that of the health and well-being of workers, wherealthough historically men were more exposed to womenbecause of their greater involvement in industrial occupa-tions, the gaps are now starting to close (European Com-mission, 2009). The third pillar concerns skills and compe-tences, notably their under-utilisation in work (EuropeanCommission, 2009).The experience of women and men within the domainofworkvaries significantly, mostly to the detriment ofwomen because the tendency is for lower participation,greater segregation and differences in quality of work.Narrowing the segregation gender gap would positivelyimpact both women and men, as it would contribute toreducing the gap in participation and quality. Overall, it isimportant not to lose sight of the fact that quality of workshould also be improved for both women and men.
Gender Equality Index – Report
21
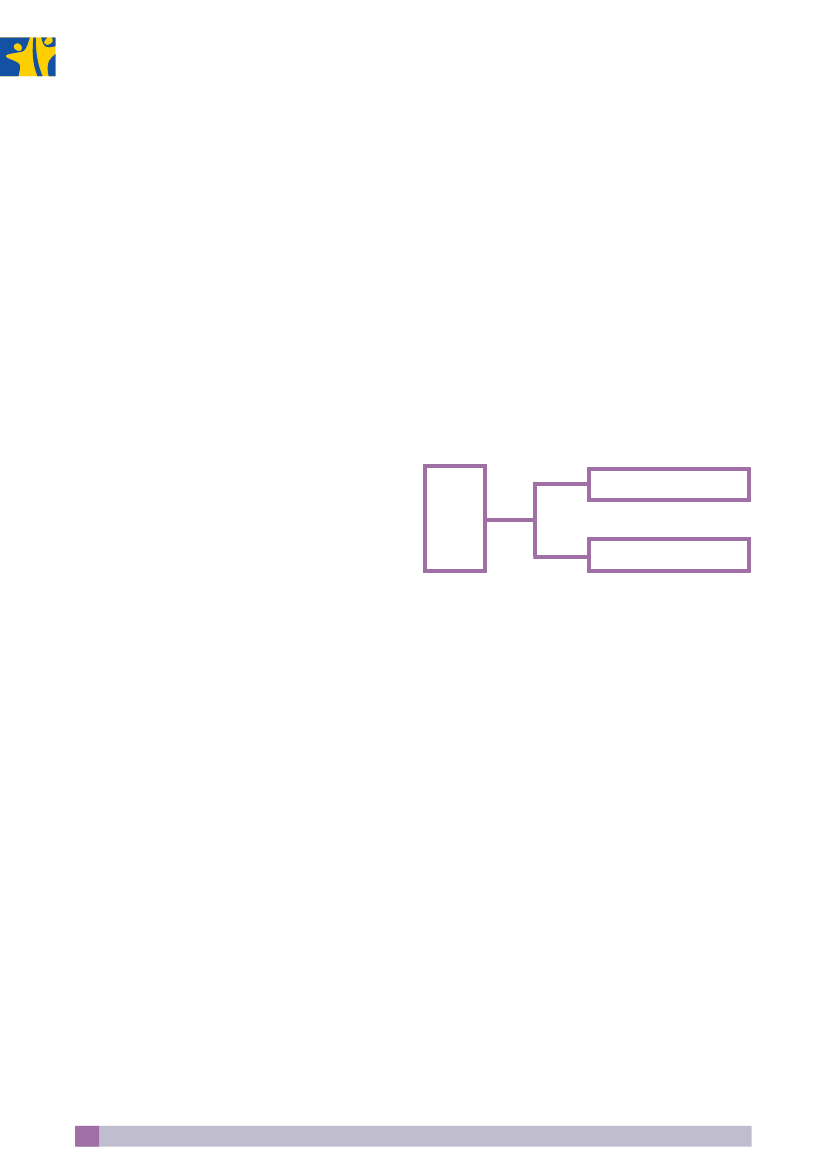
2.3.3. Domain 2: MoneyThe second domain,money,examines gaps between thefinancial resources and economic situation of women andmen. It is an important domain of gender equality giventhat women are generally disadvantaged financially, ex-posing them to greater risks of social exclusion.This domain echoes the majority of the theoretical frame-works of equality reviewed above. Equality can be viewedas having approximately the same range of key resourcesas others, such as income and wealth (Baker et al., 2004).Gender equality in pay and income rules out unequal payfor equal work and emphasises the importance of equalis-ing pensions and benefits between women and men (Fra-ser, 1997; Pascall and Lewis, 2004). This goes together witha call for a substantial reduction in the vast discrepancy be-tween women’s and men’s income – following divorce, forexample, when women’s income tends to decrease sharplywhile men’s increases (Fraser, 1997). Because of interruptedcareers, women tend to rely more often on social transfersand may be disadvantaged by transfer incomes which arecalculated on the basis of former income from employ-ment. Finally, because of the predominance of traditionalgender roles in the household, a considerable number ofwomen do not have a market income of their own, placingthem in a situation of financial dependence.Equalising money needs to be combined with prevent-ing poverty to achieve gender equity as seen in Fraser’s(1997) anti-poverty dimension. Eradicating gender-basedpoverty is achievable through the introduction of a decentminimum wage (Pascall and Lewis, 2004) and being ableto hold property (both land and movable goods) on anequal basis with others (Nussbaum, 2003).At EU policy level, the domain ofmoneyis part of the LisbonTreaty (2007/C 306/01), which requires Member States toensure that the principle of equal pay for male and femaleworkers for equal work or work of equal value is applied.This is central to the work of the EU and its commitmentto equal pay (Article 141 (ex 119) of the Treaty EC) (2010/C83/01). The elimination of the gender pay gap is empha-sised in all key policy documents (Roadmap 2006–2010(COM(2006) 92 final), Women’s Charter 2010 (COM(2010)78 final), Commission’s Strategy 2010–2015 (COM(2010)491 final), Pact 2011 (7349/11)). This includes not only pay,but also income in the form of transfers. This is flaggedby Europe 2020 (IP/10/225), which states that Mem-bers States need to ‘fully deploy their social security andpension systems to ensure adequate income support’.
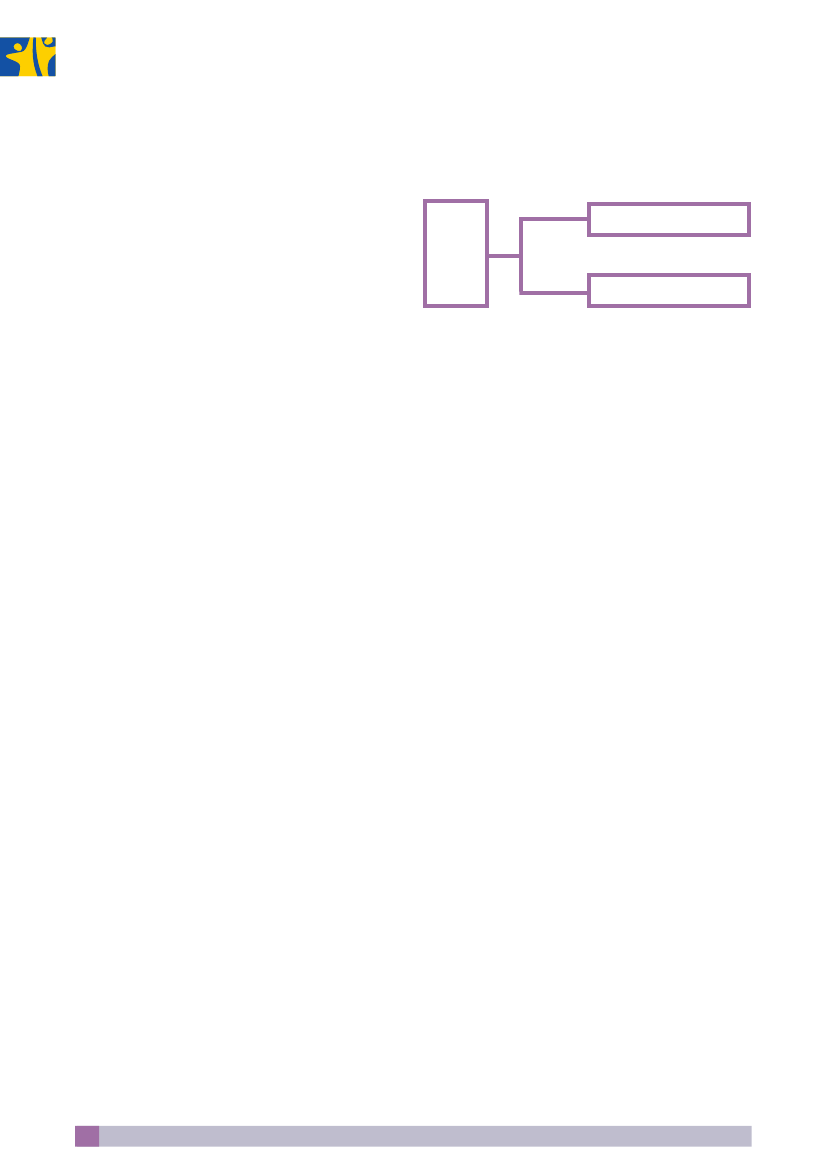
Another key priority of the European Union, related to eco-nomic situation, is the fight against poverty (Pact, 2011)(7349/11). Women have a higher risk of poverty, and tack-ling gender-based poverty can lead to equal economic in-dependence. Poverty can be defined as the non-fulfilmentof a person’s human rights to a range of basic capabilities(Office of the High Commissioner for Human Rights, 2002).Europe 2020 (IP/10/225) has a strong focus on poverty withthe aim to reduce the number of individuals living belowthe national poverty lines by 25 %, thereby decreasing thenumber of individuals at risk of poverty by 20 million.The domain ofmoneyexamines two sub-domains:financial resourcesandeconomic situation(Figure 2.3.).Figure 2.3. Domain ofmoneyand its sub-domains
Financial resources
Money
Economic situation
Examining gender gaps infinancial resourcesis importantbecause there are strong differences between womenand men’s income. Gender equality in pay can contrib-ute to an increase in economic growth, as it could leadto higher rates of savings, improved investments, bettercredit reimbursing and investing in the human capital ofthe next generation (Klasen and Lamanna, 2009). The maincauses of the gender pay gap in the EU have been attrib-uted to: discrimination in the workplace; structural factors;as well as workplace practices and promotion procedures(European Commission, 2011a).In addition to earnings, other incomes (for example, in-come from property, stock, and other financial assets) con-stitute another realm of unequal distribution among wom-en and men. Women are generally less likely than men tohold economic assets, such as property, with legislation fortransfer in the case of divorce often working to the detri-ment of women (UNECE, 2010). At the same time, womenare also less likely to be able to control economic assets,including their use of disposable income, which may berelated to their bargaining position in the household. Forexample, in a situation of necessity, women deplete theirassets to a greater extent than men (UNECE, 2010).
22
Gender Equality Index – Report
Another important source of income, especially for thosewho do not participate in the labour market, is transfer in-come. These are defined as monies received, usually fromthe government, in the form of social benefits or subsidies.Given that women in the EU consistently earn less per hourthan men, women earn less over their lifetimes. Therefore,women are often entitled to lower social benefits and pen-sions then men, and are at a greater risk of poverty, espe-cially in old age, than men.Finally, access to financial resources – for example, throughaccess to credit – is also gendered. Evidence suggeststhat, globally, access to the formal financial sector is morelimited for women because of their lower levels of collat-eral and assets, which means lower returns for banking in-stitutions (United Nations, 2009). For example, in the EU, wo-men are twice as likely as men to find themselves completelyexcluded from financial services (Lämmermann, 2010).The second sub-domain,economic situation,considers eco-nomic inequality and takes into account the vertical distri-bution of disposable income. These patterns often reflectlower work participation coupled with segregation in thelabour market. As a consequence, women are much moreat risk of poverty than men (European Commission, 2011),since men’s vulnerability to poverty is linked to labour mar-ket events as opposed to women which is their greater de-pendence on a partner’s income (Callens and Croux, 2009).A major limitation of research undertaken on gender andpoverty is its reliance on measuring economic resources atthe household level, assuming that all individuals in onehousehold are equally poor or rich (Bárcena-Martín andMoro-Egido, 2011), an approach which does not properlyreflect the impact of gender when considering poverty orincome inequality. Assessing poverty and income distribu-tion in general will remain problematic as long as it is onlyassessed on the assumption that there is a single head ofhousehold (Chant, 2006).In summary, there are notable gender gaps in the abilityto access money through the labour market, as well asthrough government transfers and benefits. In both cases,women may be at a financial disadvantage compared withmen due to the differences in earnings and other receivedincomes, which widens through the lifecourse for com-plex and interacting reasons (tenure, interruptions, work-ing time, segregation in the labour market, unpaid caringwork, allocation of income between household members,etc.), thus leaving women more exposed to lower levels ofincome and at a greater risk of poverty.
2.3.4. Domain 3: KnowledgeThe third domain,knowledge,examines gaps betweenwomen and men in terms of education and training. De-spite education’s recognised importance towards greatergender equality, including combating gender stereotypesand segregation in the labour market (European Associa-tion for the Education of Adults, 2007), gender differencesand inequalities persist in education in terms of subjectpreferences and performance (Lynch and Feeley, 2009).The historical dimension of gender and education shouldnot be underplayed. While the trend is now for womento reach or even to exceed men’s educational attainment,this is only a relatively recent social achievement. Up tothe 1980s, the differences between women and men weremore marked. This has important implications for today’ssociety, as the population consists of individuals who haveexperienced these two gender patterns in education, withmarked differences among older people. As time goes on,these differences will start to fade (Walby, 1997). A link be-tween gender inequality in education and economic per-formance has been noted. This is explained by this typeof gender inequality leading to decreased levels of invest-ment in human capital (Klasen and Lamanna, 2009).Many frameworks see education as a paramount pillarunder which to examine gender equality. Equality can beseen through the ability to learn as equals (Baker et al.,2004). People need to have access to the same educationalopportunities, ensuring that everyone is enabled to deve-lop their talents and abilities, and that everyone has a realchoice among occupations that they find satisfying or ful-filling. In the capability approach,capabilitymeans beingable to use the senses, to imagine, think, and reason – andto do these things in a ‘truly human’ way, a way informedand cultivated by an adequate education, including, butby no means limited to, literacy and basic mathematicaland scientific training. This includes, for example, beingable to use imagination and thought in connection withexperiencing and producing works and events (Nussbaum,2003). Education and knowledge are seen as providing thecapability to be educated and to use and produce knowl-edge (Robeyns, 2003).At policy level,the importance of gender equality in educa-tion and training has been highlighted in several EU policydocuments because of its potential to reduce risks of un-employment and social exclusion. In addition, it can helpfoster human potential (Council Resolution, 2007/C300/01).
Gender Equality Index – Report
23
Europe 2020’s targets on educational attainment includereducing the drop-out rate to 10 per cent from the current15 per cent, and increasing the share of the populationaged 30–34 having completed tertiary education from31 % to at least 40 % in 2020 (IP/10/225).Gender equality in the EU can be formulated not only interms of equal participation and equal success without agender bias, but also through the elimination of segrega-tion with regard to educational paths as well as to disci-plines and professions – as seen in the European Pact forGender Equality (2011–2020) (7349/11) – given that edu-cation and training paths are still heavily segregated bygender. In terms of segregation in education, educationalstereotypes affect the life choices and the economic in-dependence of many women, according to the Women’sCharter (2010) (COM(2010) 78 final). One of the key chal-lenges of European policy remains enabling and support-ing non-traditional educational paths to create equal pos-sibilities of choices.There is also a focus on lifelong learning since it is consid-ered an indispensable means for promoting adaptability,employability, active citizenship and personal and profes-sional fulfilment. Lifelong learning, according to the Coun-cil (2002/C 163/01), should enable all citizens to acquire thenecessary knowledge to take an active part in the knowl-edge society and the labour market. The Digital Agendafor Europe (COM(2010) 245 final/2) identifies a gap in digitalliteracy and skills, as well as a need to increase the supply ofICT practitioners by making the sector more attractive, par-ticularly to young women. Europe 2020 (IP/10/225) declaresthat Europe must act in the fields of education, training andlifelong learning to contribute to delivering smart growth.The domain ofknowledgeis divided between three sub-domains:educational attainment, segregation in educationandlifelong learning(Figure 2.4.).Figure 2.4. Domain ofknowledgeandits sub-domains
The first sub-domain,educational attainment,is importantin gender terms because a greater proportion of youngwomen now reach at least upper secondary school, andthey outnumber men as university graduates in the EU(European Commission, 2011). Given that educational at-tainment promotes greater labour market participationand provides greater economic independence, this revers-al needs to be taken into account. Gender-based attain-ment patterns are important to consider for gender equal-ity, as boys typically achieve lower levels of literacy. Thelower attainment of boys has been linked to a perceptionof masculinity which is associated with not being goodat school work and not overtly showing a commitmentto school (Phoenix, 2009). Girls also tend to obtain highergrades and perform better on final school examinations,leading the way to university entry. These patterns canbe compounded by social class, ethnicity or belonging toanother minority group.The second sub-domain,segregation,considers the un-equal representation of women and men in some fields ofstudy, despite the increased feminisation of education atall levels. If a greater number of women enter male-domi-nated fields, however, the contrary is not true, possibly be-cause of the risk of stigmatisation. The most visible fields ofsegregation are those of science, technology, engineeringand mathematics. While women have become increas-ingly present in fields such as medicine and law, theyremain over-represented in education, social sciences andhumanities (Lynch and Feeley, 2009). However, the major-ity of gender equality policies focus on the study choicesof girls, rather than on that of boys (Eurydice, 2010). Unfor-tunately, the subject-based areas preferred by women areless congenial to labour market participation and reinforcepatterns of both vertical and horizontal segregation in thelabour market (Annandale and Hunt, 2000).The third sub-domain examineslifelong learning.Skillsand competences are initially developed within formaleducation. However, throughout the lifecourse, they areexpanded through lifelong learning, within or outside for-mal structures. It is an important area from a gender per-spective because it is essential to improve quality of life,exercise a voice and engage in the labour market, com-munities, families and politics. Participation rates in lifelonglearning show that women are over-represented in thisarea of education (European Association for the Educationof Adults, 2007). Examples of key competencies for lifelonglearning could be the level of proficiency in language ordigital activities (European Commission, 2007). Lifelong
Educational attainment
Knowledge
SegregationLifelong learning
24
Gender Equality Index – Report
learning remains segregated in terms of access, participa-tion and outcomes (Leathwood and Francis, 2006).In summary, there are important gaps between womenand men when it comes to knowledge. Differences are setin the initial educational attainment of individuals, furthercemented by the segregation of subjects and leading tovery different outcomes in terms of further learning (life-long learning) and ultimately participation in the labourmarket and social activities.
2.3.5. Domain 4: TimeThe fourth domain istime,an area which is particularlygendered largely because of the disproportionate amountof care time apportioned to women. Time is not onlyabout the dichotomy of paid and care work, but also so-cial, personal and civic activities (Eurofound, 2006). This isan important area in terms of gender equality becausethe division of activities into productive and reproductivespheres, along with the devaluation of the latter againstthe former, form the basis of gender inequality (Crompton,2006; Walby, 1990).The basis of gender inequality is linked to important gapsin the division of time and responsibilities between womenand men (Robeyns, 2003). The division of work into catego-ries usually follows the lines of work that are performedin or out of the market. Market work can be measured interms of economic activities, while non-market work canbe seen as sub-divided between care work and work thatcontributes to social well-being, such as voluntary work,supporting charities or training sports teams (Miranda,2011). Greater involvement in any of these three areas (eco-nomic, care and social) represents a potential trade-offfrom other areas.In (gender) equality frameworks, a key element to under-stand gender regimes is that of care work and time (Pascalland Lewis, 2004). For instance, one of Robeyns’ (2003) capa-bilities is time autonomy: the ability to exercise autonomyin allocating one’s time. Time use surveys systematicallyidentify that women work (paid and unpaid) more thanmen. In addition to time allocation, theoretical frameworksassociate time sharing with values of love, care and solidar-ity (Baker et al., 2004). This can promote circumstances inwhich everyone has ample scope for forming valuable hu-man attachments. A key element in this task is to make surethat the work involved in providing love and care is prop-erly recognised, supported and shared. This emotional as-
pect of time sharing and care is also picked up by capabil-ity approaches (Nussbaum, 2003; Robeyns, 2003), in whichwomen and men should have the capability to engage indomestic work and nonmarket care, that is to raise chil-dren and to take care of others. Because the debate goesbeyond work and family, it is important to also considerleisure time, time for oneself. Being able to laugh, to play,to enjoy recreational activities is central to capability ap-proaches. The leisure time equality principle is also presentto examine the distribution of leisure time (Fraser, 1997).This principle, crucially, explicitly rules out arrangementsthat would equalise incomes while requiring a double shiftof work from women but only a single shift from men.Equality frameworks do not rely on the notion of timealone, but also on participation in activities. The participa-tion of individuals in decisions that influence their lives isemphasised. This is seen in terms of engagement, for ex-ample, through the principle of anti-marginalisation (Fra-ser, 1997), which entails the full participation of women onpar with men in all areas of social life – in employment, inpolitics, in the associational life of civil society. It can alsobe seen through the capability to have the right of politi-cal participation and to be able to participate effectively inpolitical choices that govern one’s life (Nussbaum, 2003),or to be able to choose to live or not to live according toa religion (Robeyns, 2003). Overall, gender regimes shouldenable a ‘voice’ (Pascall and Lewis, 2004).Atpolicy level,participation in economic, care and com-munity life is fundamental, requiring time to be allocatedto each of these activities. The emphasis on integratingwork and life is therefore at the heart of EU policy. Manykey documents emphasise the disproportionate share infamily responsibilities and the difficulties in balancing workwith private life affecting women, including the Strategy(2010–2015) (COM(2010) 491 final), the Women’s Charter(2010) (COM(2010) 78 final) and the Pact (2011) (7349/11).The European Commission has recognised the importanceof the issue of gender inequalities in the division of tasksby declaring the importance of promoting long-lastingchanges in parental roles, family structures, institutionalpractices and the organisation of work and time, and em-phasising that these do not merely affect women but alsomen and the whole of society. It concludes that there is aneed to adapt the organisation of society to a fairer distri-bution of women’s and men’s roles (European Commission,1996). As stated in the establishment document of the TaskForce on Eurostat’s Time Use Survey (ECE/CES/BUR/2010/
Gender Equality Index – Report
25
NOV/2/Add.2), the measurement of time use is not only es-sential to present the various aspects of people’s activities(for example, leisure, commuting, social connection or civicengagement), but it is also of central importance for theeconomy, for governmental economic and social policyand society at large.The domain oftimeis divided into three sub-domains:eco-nomic activities, care activitiesandsocial activities(Figure 2.5.).Figure 2.5. Domain oftimeand its sub-domains
because it constrains the ability to allocate time to otheractivities. Research suggests that the amount of care workperformed by women has decreased alongside greaterparticipation in the labour market, although the burdenof care remains disproportionately women’s responsibility(Walby, 1997). Despite the decreasing differences betweenwomen and men, this is seen as the result of women’s re-duced involvement rather than men’s greater contribution(Crompton, 1997). Among other means, time devoted forcare responsibilities could be further decreased by ensur-ing accessible and affordable childcare and elderly careprovisions.The third sub-domain examinessocial activities.Social activ-ities encompass the time spent on all activities other thanpaid work (economic) and unpaid work (care), and also in-corporates time spent on activities that relate to civic par-ticipation and personal development activities (Eurofound,2006). This sub-domain considers the ability of individualsto engage in leisure, political or educational activities, andtheir participation in organisations that include, for exam-ple, cultural or religious activities. When it comes to leisure,it appears that men enjoy a slightly higher amount of timethan women (Burda et al., 2007; OECD, 2009), but that theway in which this time is experienced is very different. Itmay be because the quality of women’s leisure time isundermined by interruptions of work; by having to com-bine both work and care (Bittman and Wajcman, 2000); orby the pressure of domestic work that cannot be put off(Robeyns, 2003).The share of time in different activities remains very dif-ferent for women and men within the EU, showing largegender gaps. It is an important domain of gender equalityto be considered, as it undermines to such an extent theabilities of women and men to engage equally in otherdomains of social and economic life, distorting the level ofeconomic resources that women and men have access tothroughout the lifecourse.
Economic activities
Time
Care activitiesSocial activities
The sub-domain ofeconomic activitiesis strictly concernedwith time spent in paid work or associated activities. Timespent in the economic sphere has been the subject of awide shift in the space of several decades. While the timespent by men in this sphere has remained relatively stable,women’s involvement in this area has strongly increased,despite similar time spent in caring activities and at theexpense of free time (Sayer, 2005). The amount of time in-vested in economic activities is strongly linked to the life-course, with the prime working age being between 25 and54, coinciding with a period of child rearing and in whichthe widest gap between the working time of womenand men can be observed (Eurostat, 2012) and part-timework disproportionately used by women in order to inte-grate different areas of their lives better (Eurofound, 2009).Another strategy to achieve better integration is to reducecommuting time, since women tend to commute shorterdistances than men by choosing places of employmentthat are closer to home (Crane, 2007).The second sub-domain focuses on time incare activities,such as housework, children or other dependent relatives.The committment of time to care constrains one’s possibil-ities to participate in the labour market and to gain equaleconomic independence as working counterparts. Thus,care time is a central domain to be analysed and a keyprio-rity to enhance equality between women and men
2.3.6. Domain 5: PowerThe fifth domain,power,focuses on women’s and men’sgap in different levels of representation in the political, so-cial and economic spheres and their share of positions ofpower. Gender equality is affected by the lack of partici-pation and access to decision-making, including political,social and economic spheres, all of which have detrimentalconsequences.
26
Gender Equality Index – Report
The topic ofpowerin decision-making appears in someconceptualisations of equality. Baker et al.’s (2004) frame-work is concerned with equality of power, in civil and per-sonal rights and liberal democracy. It examines the abilityof each person to influence the decisions that affect theirlives, recognising that power takes many forms, is oftendiffuse and has to be challenged in many different ways.Similarly, Robeyns (2003) sees this domain as the capabilityto participate in, and have a fair share of influence in, politi-cal decision-making.The domain of power is prominent atpolicy level.Poli-cy initiatives focus mostly on the equal participation ofwomen and men in decision-making according to theRoadmap (2006–2010) (COM(2006) 92 final), the Pact (2011)(7349/11) and the Women’s Charter (2010) (COM(2010) 78final). Greater gender balance and fairer representation arealso advocated in the Commission’s Strategy (2010–2015)(COM(2010) 491 final).There are three main areas in which equality in decision-making needs to be achieved, according to the main poli-cy documents. Political power is a central priority of the EUon gender equality. The Convention on the Elimination of AllForms of Discrimination against Women (CEDAW), Article 7,stipulates that States need to ensure equality between wom-en and men in political and public life, including public func-tions, non-governmental organisations or other associations.In Article 8, State parties are required to ensure that womenand men are equally represented in governments at inter-national level and in the work of international organisations.The issue of power is recognised at international level andis present within the framework of the Millennium Devel-opment Goals (MDG 3: equality of seats by sex in nationalparliaments). Increasing women’s representation in the po-litical process and government decision-making bodies wasreaffirmed in the 2005 World Summit.Other policy priority areas in gender equality at EU levelinclude economic and social areas. The increased partici-pation of women in science and technology is assumed tobe positively associated with a growth in innovation andimprovements in quality of research. For this reason, theEU set the goal of a female share of 25 % in leading posi-tions in the public research sector which is not yet fulfilled(Roadmap 2006–2010 (COM(2006) 92 final), Commission’sStrategy 2010–2015) (COM(2010) 491 final). The Strategy forEquality between Women and Men (European Commission,
2010–2015) (COM(2010) 491 final) promoted women’s in-clusion on boards with its ‘targeted initiatives to get morewomen into top jobs in decision-making’ and launcheda ‘Women on the Board Pledge for Europe’ (EuropeanCommission, 2011).The domain ofpoweris divided into three sub-domainsthat all examine representation of women and men indecision-making: political,socialandeconomic decision-making(Figure 2.6).Figure 2.6. Domain ofpowerand its sub-domains
Political
Power
SocialEconomic
In the first sub-domain,politicalpower, the focus lies onthe gender gap in the representation of women and men,causing a democratic deficit at EU levels emphasised inthe Roadmap (20006–2010) (COM(2006) 92 final) and theStrategy (2010–2015) (COM(2010) 491 final). It is importantto promote political legitimacy, but also to modify genderrelations by changing the attitudes, behaviours and opin-ions of women and men, and at the same time providerole-models (Tremblay, 1998). It is also important to consi-der that the feminisation of politics is currently constructedas being the responsibility of women, who must overcomesocial barriers (caring responsibilities) and psychologicalbarriers (confidence) to become more like men withoutquestioning why men do not accept to leave some ofthese spaces themselves (Meier et al., 2004).Socialpower is considered because of its symbolic im-pact on society. It includes access to positions of powerin the fields of science and technology, academia, media,religious organisations or civil society, all of which presentchallenges in terms of gender equality. For example, theproportion of women in top positions on scientific boardsis low, causing concern because of the potential impacton the research agendas of the future (European Commis-sion, 2012a). Similarly, the proportion of female professors
Gender Equality Index – Report
27
at university levels remains disappointingly low, and repre-sents a great waste of talent (European Commission, 2005).Another facet is the representation of women in the judici-ary, which, while rising, still comprises a low proportion ofwomen (European Commission, 2007).Finally, the last sub-domain considers theeconomicpowerof women and men. A balanced participation of womenand men is not only to be achieved from an equality pointof view, but also can contribute to better economic per-formance (Roadmap 2006–2010 (COM(2006) 92 final); Strat-egy 2010–2015 (COM(2010) 491 final)). The participation ofboth women and men is needed in business and economicareas, including boards of quoted companies and financialinstitutions such as central banks. To date, unfortunately,women remain greatly under-represented at board level inquoted companies (European Commission, 2007).Equality in the domain of power is important because itensures that both women and men are given the samevoice in top decision-making positions and are thus giventhe same opportunity to play a role in shaping the agendasin various sectors for the Europe of tomorrow. It is an areawhere large gender gaps remain, and which, because of itssymbolic impact on other domains, needs to be addressed.
hides many complexities (Annandale and Hunt, 2000). Thedomain of health is important to gender equality becauseit is positively related to economic independence and in-creased bargaining power in the household for women(Backhans et al., 2007).Health is a central feature in equality frameworks. Equalitymeans that individuals should have access to goods andservices, such as their right to public services and environ-mental factors, i.e., safe and healthy surroundings (Baker etal., 2004) while capabilities should focus on being able tolive to the end of a human life of normal length; not dy-ing prematurely, or before one’s life is so reduced as to benot worth living (Nussbaum, 2003). Equality is also seen asthe capability of individuals to be physically healthy, enjoya life of normal length and be mentally healthy (Roybens,2003).At the policy level, there is a strong focus on health andlong-term care (Roadmap 2006–2010) (COM(2006) 92 fi-nal); supporting research on health (Roadmap 2006–2010)(COM(2006) 92 final); and reducing health inequalities(Europe 2020) (IP/10/225). The Strategy for equality be-tween women and men (2010–2015) (COM(2010) 491 final)emphasises that gender-based inequalities are present inhealthcare and long-term care and health outcomes, andthat gender-specific health risks and diseases have to beadequately addressed. Recognising the gender domainin health is also one of the key priorities in the Roadmap(2006–2010) (COM (2006) 92 final).The focus of EU policy is to ensure better access to health-care systems (Europe 2020) (IP/10/225); Roadmap 2006–2010) (COM(2006) 92 final), particularly quality and respon-siveness to new specific needs (Roadmap 2006–2010)(COM(2006) 92 final) in relation to demographic change(Europe 2020) (IP/10/225). The EU also takes into accountthe problems of use of and access to health structures bypromoting the coordination of national healthcare policiesthrough the Open Method of Coordination with a par-ticular focus on access, quality and sustainability. The keyobjectives in these three areas are: access to health promo-tion, disease prevention and curative care (Social Protec-tion Committee, 2004).The domain ofhealthis divided in three sub-domains:health status, behaviourandaccess to health(Figure 2.7.).
2.3.7. Domain 6: HealthThe sixth domain ishealth.One of the main issues of gen-der and health relates to the necessity to go beyond thebiological aspect of health and consider the impact ofgender on women’s and men’s health (Annandale andHunt, 2000), where strong gaps persist.Differences between women and men have been ex-plained not only in terms of biological differences, butalso how these are mitigated by behavioural factors(Kirby, 2000; Doyal, 2001). However, biological differencesbetween women and men invariably mean that there aresex specificities, such as reproductive health for women,which can obviously not be analysed in a comparative way.Controversies have arisen regarding how to measure health,and how to move from essentially quantitative measuresto more qualitative ones in order to take these aspects intoconsideration (Popay and Groves, 2000). Gender, along withother grounds of inequality, mediates health inequalities,and the old adage ‘women get sicker but men die quicker’
28
Gender Equality Index – Report
Figure 2.7. Domain ofhealthand its sub-domains
Status
Health
BehaviourAccess
a car accident; to smoke and drink more; and to engagein unsafe sex (Doyal, 2000). While men were historicallymore likely than women to smoke and drink alcohol, thegap is now closing (World Health Organization, 2009). Thispotential has important implications for the future in termsof devising policies that address the specific needs ofwomen and men in Europe.The third sub-domain concernsaccessto health structures,particularly the strengthening of health promotion anddisease prevention, and the need to address barriers tohealth services (Social Protection Committee, 2004). Giventhat sex and gender are both related to health differences,it is important to ensure that the needs of both womenand men are taken into consideration in the planning anddelivery of care (Doyal, 2001). In this sub-domain, the con-cern is to capture the discrepancy between needs and pro-vision, for example, with unmet needs for medical exami-nation, and to look at the degree of access to health ser-vices for women and men in Europe. There are a numberof inequalities in access to health resources, as womenare more likely than men to access health structures visita doctor or hospital (Kirby, 2000). These different inter-actions with health structures can be explained by bio-logical differences; reproductive health needs (birth con-trol, pregnancy and menopause); greater interactions andfamiliarity with the structures as a result of caring respon-sibilities; and behavioural aspects linked to masculinityand social norms (Payne, 2009; Davis et al., 2011). However,some women can be deprived of access to healthcare dueto their household situation – often with few supportsand exposure to abuse. Gender roles may dictate thatthe health needs of others, often men, are given priorityover their own (Doyal, 2000). In addition, women are of-ten disadvantaged when it comes to access to health be-cause of poverty and discrimination (Doyal, 2001). Evidencesuggests that women’s issues may be less taken into ac-count than men’s and, as a result, women may not beafforded the same supportive attitude by medical prac-titioners and attention in research studies (Doyal, 2001).The domain ofhealthis an important element to under-stand gender equality at EU level. Gender gaps remain,with women living longer but in poorer health than men,at least in some part because of gender practices such asbehaviours and different interactions with health struc-tures and institutions. Health is also very important giventhat it is a prerequisite to participation in other domainsof activities.
The first sub-domain deals with healthstatus.Health in-cludes all aspects of women and men both physically andpsychologically, as well as the activities individuals are ableto engage in as a result of their health status. There arebiological differences between women and men, mostnotably in terms of reproductive functions. However, dif-ferences extend to genetic, hormonal and metabolic fac-tors, all of which shape the health status of women andmen. These differences may be responsible for the inci-dence, symptoms and prognosis of other health issues, in-cluding, most notably, the greater risk for men to developheart disease (Doyal, 2001). Women are usually advantagedcompared to men in terms of life expectancy (Doyal, 2000;Payne, 2009). But a paradox exists in terms of gender andhealth: Although women live longer, their length ofhealthylife – that is, living without debilitating chronic illness – ismore limited than men (Kirby, 2000). Differences in thehealth status of women and men can be linked to a va-riety of determinants of health, including socio-economicstatus, labour market participation, sector of employmentand income levels (Payne, 2009).The second sub-domain looks at thebehaviours,predomi-nantly from the perspective of risks that can affect health.It aims at capturing the gender related behavioural differ-ences behind inequalities in health. The influence of biol-ogy should be regarded as forming only part of the rangeof complex factors that affect the health status of womenand men; the importance of gendered patterns of behav-iours should not be underplayed (Waldron, 2000; Doyal,2001). The behaviours of men and women differ accord-ing to patterns of masculinity and femininity (Backhanset al., 2007). The consequence for men is that they may feelcompelled to take risks to assert their masculinity (Doyal,2000; Doyal, 2001). The factors affecting this domain in-clude lifestyles, behaviours and socio-economic factors.Men are more likely to be victims of murders; to die in
Gender Equality Index – Report
29
2.3.8. Domain 7: Intersecting inequalitiesIntersecting inequalitiesforms the seventh domain of theGender Equality Index. Since women and men are not ho-mogeneous groups, it is important to consider other cha-racteristics that may influence their experience. Intersect-ing inequalities are concerned with the effect of gendercombined with these other characteristics, and how gen-der operates within different groups. The domain of inter-secting inequalities explores gender gaps among specificgroups of women and men, particularly for these groupswhich may be more or less vulnerable or marginalised.Intersecting inequalities are present in some equalityframeworks. Fraser’s second principle, anti-exploitation,looks predominantly at vulnerable people (Fraser, 1997).When these vulnerable individuals are in receipt of aid,and where this aid is also stigmatised or discretionary, theprinciple of anti-exploitation is not satisfied. This frame-work makes a direct link between the economic situationof more vulnerable groups and the level of state supportthey may receive. Equality can also be about the capabilityto be treated as a dignified being whose worth is equal tothat of others (Nussbaum, 2003). This entails provisions ofnon-discrimination on the basis of race, sex, sexual orienta-tion, ethnicity, religion or national origin.The principle of intersecting inequalities is enshrined inEU Treaties,particularly following the Treaty of Amster-dam (97/C 340/05), which marked a turning point. Afterits enactment in 1997, discrimination moved beyond thetwo grounds of nationality and sex, to include race andethnicity, religion and belief, age, disability and sexual ori-entation. Furthermore, the use of the Treaty of Amsterdam(97/C 340/05) meant that for the first time, discriminationgrounds could not only be tackled separately but also bytaking the approach of looking at multiple discriminationhorizontally (Kantola, 2000). Article 10 of the Lisbon Treaty(2007/C 306/01) further declared that the European Unionshall aim to combat discrimination based on sex, racial orethnic origin, religion or belief, disability, age or sexual ori-entation; Article 19 declares that the EU may take appropri-ate action to combat such discrimination. The Charter ofFundamental Rights of the European Union (2000) (2000/C364/01) asserts that non-discrimination should be observednamely on the grounds of sex, race, colour, ethnic or socialorigin, genetic features, language, religion or belief, opin-ions, membership of a national minority, property, birth,disability, age or sexual orientation (Art 20–26).Other international documents, such as the BPfA, rely onthe notion of intersectionality by pledging to, ‘Intensify
efforts to ensure equal enjoyment of all human rights andfundamental freedoms for all women and girls who facemultiple barriers to their empowerment and advancementbecause of such factors as their race, age, language, eth-nicity, culture, religion or disability, or because they are in-digenous people’ (paragraph 32, BPfA). This emphasis goesas far back as the Universal Declaration of Human Rights,in Article 2, which stipulates that, ‘Everyone is entitled toall the rights and freedoms set forth in this Declaration,without distinction of any kind, such as race, colour, sex,language, religion, political or other opinion, national orsocial origin, property, birth or other status’ (Universal Dec-laration of Human Rights, 1948).In key documents of the EU’s gender equality policy, differ-ent groups of women are taken into account with a focuson ‘older women, single parents, women with a disability,migrant women and women from ethnic minorities’ (Com-mission’s Strategy 2010–2015) (COM(2010) 491 final). Thisrepresents an approach that considers differences and in-equalities within certain categories of concern rather thanthe true multiplicity of possible characteristics (McCall,2005). Thus, when it comes to ‘translating’ gender equal-ity objectives into indicators and variables to measure theextent of gender equality, the approach is often to takedifferent groups into account that are especially affectedby gender inequalities in terms of ‘double discrimination’(Roadmap 2006–2010) (COM(2006) 92 final). While the fieldof policy in this area is constantly developing, it is impor-tant to recognise that policy strategies need to be rootednot only within the similarities between groups, but alsotheir distinctiveness (Verloo, 2006).Taking intersectionality into consideration represents a dif-ficult balancing act. On the one hand, the concept of di-versity contends that focusing solely on the binary catego-ries of gender is not sufficient, while on the other hand thenumber of intersecting categories is theoretically as greatas the number of individuals concerned. The problem iscompounded by pragmatic issues such as determining theareas of gender equality that can be examined under theprinciple of intersectionality. Being a horizontal issue, dif-ferent gender gaps exist between different groups in all ofthe domains considered here. Following this argument, itwould therefore be necessary to build a multitude of Gen-der Equality indices, one for each group of interest – animpossible task in itself and one which would take awayfrom the power of a single composite measure.The approach of the Gender Equality Index is thereforeto focus on illustrative groups to examine how some in-tersectional groups fare. Although this masks both the
30
Gender Equality Index – Report
complexity of the inequalities that individuals face and thedifferences present within and between groups, it never-theless represents a pragmatic approach. At policy level,the viability of an analysis needs, by its very definition, tomove away from the complexity and to operate in moregeneral terms.Following the policy focus of Europe 2020 (IP/10/225) onpoverty and social exclusion, the focus ofintersectionalinequalitiesis employment. Employment has several ben-efits at diffe-rent levels. At the macro level, participationin the labour market is widely recognised as essential foreconomic and social development (UNECE, 2013). At theindividual level, employment has been seen as a routeto social inclusion (Dahl et al., 2009) and a tool to com-bat poverty by giving equal access to resources to bothwomen and men (UNECE, 2013). The relationship betweenemployment rate, access to resources and gender equalityis complex, making it unwise to regard employment rateas a sole explanatory factor for gender inequality. However,it provides a practical and interesting aspect to consider.At a minimum, the analysis of gender gaps in employmentamong selected illustrative population groups aims atstimulating greater actions and discussions.Figure 2.8. Domain ofIntersecting Inequalitiesand its sub-domains
The sub-domain combines potential illustrative groupsarising from thegrounds of discriminationthat individualsmay face, includingcitizenship, ethnicity, sexual orientation,disability, religionorage.Since intersectionality is aboutmore than multiple-discrimination, sub-domains can alsoinclude illustrativesocial categoriessuch associal class,a so-cietal construct which is mainly rooted in historical, socialand cultural developments, and also contribute greatly tolower levels of economic resources generally, as well as be-tween women and men.Focusing on intersectional inequalities is a challenging butnecessary step since women and men do not representhomogeneous groups. It takes into account a broaderperspective of diversity, without losing sight of the impor-tance of gender. In addition, while the conceptual struc-ture of a composite indicator does not easily lend itselfto a multi-discrimination perspective, its aims are to buildupon measures of gender gaps among illustrative groups,thereby feeding into the debates on intersectionality.
2.3.9. Domain 8: ViolenceThe eighth and final domain isviolence.It departs from theapproach of all the domains presented so far in that it doesnot focus on gaps but levels. Indeed, the aim is not to re-duce the gaps of violence between men and women butto eliminate violence altogether. Furthermore, the area fur-ther departs in that it does not adopt a gender approachand instead focuses on women’s perspectives.Violence,forthe purpose of the Gender Equality Index, is therefore as-similated to gender-based violence against women, sinceit recognises that violence is an expression of power linkedto the domination of some forms of masculinity, mostlyover women. It combines several forms of violence andanalyses them in terms of power relations and as some-thing that is common to all women (Bunch, 2008).Theoretical frameworks on gender equality examine bothviolence and gender-based violence against women. Thisis particularly prevalent in capabilities-based approacheswhere the emphasis is on being able to move freely fromplace to place; to be secure against violent assault, includ-ing sexual assault and domestic violence (Nussbaum, 2003);or the capability to be protected from violence of any sort(Robeyns, 2003). Another conceptualisation present in theliterature is that of cultural violence. This is linked to theability to be respected and treated with dignity (Robeyns,2003), equal respect and recognition in the freedom to liveone’s life without the burden of contempt and enmity fromthe dominant culture (Baker et al., 2004). This perspectivealso looks at the principle of equality of respect, which is
AgeCitizenship
Intersecting inequalities
DisabilityEthnicityReligionSexual orientationSocial class...
Gender Equality Index – Report
31
crucial to gender equity given the routine representationof post-industrial culture of women as sexual objects forthe pleasure of male subjects (Fraser, 1997). The principleof equal respect rules out social arrangements that objec-tify and depreciate women or trivialise women’s activitiesand ignore women’s contributions. Fraser’s last principle,that of anti-androcentric, problematises men’s dominantlife patterns as representing the norm for all, and women’srecognition and income security depend on their con-formity to those norms. This principle requires decentric-ing masculinist norms – in part by revaluing practices andtraits that are currently undervalued because they are as-sociated with women. It entails changing men as well aschanging women.There is a strong focus in EU measures on eradicatinggender-based violence and on the commitment of theEU to combat all forms of violence against women (Pact,2011 (7349/11); Roadmap, 2006–2010 (COM(2010) 92 final)(COM(2010); Women’s Charter, 2010 (COM(2010) 78 final);Commission’s Strategy, 2010–2015) (COM (2010) 491 final),including domestic violence, sexual harassment, rape andsexual violence. Gender-based violence against womenconstitutes a violation of fundamental rights (human dig-nity, the right to life, the right to the integrity of the per-son) and hampers exercising a self-determined life. In theLisbon Treaty (2007/C 306/01), the Declaration on Article 3of the Treaty on the Functioning of the European Uniondeclares that ‘in its general efforts to eliminate inequalitiesbetween women and men, the Union will aim in its dif-ferent policies to combat all kinds of domestic violence’(Treaty of Lisbon, 2007) (2007/C 306/01). There is a generalfocus on dealing with the consequences of gender-basedviolence against women, partly by supporting victims, butalso by addressing the cause by focusing on men and boys(Pact, 2011) (7439/11).In addition to measures specifically targeted at gender-based violence against women, policy has focused on theissue of stereotypes. Combating a stereotyped, degradingand offensive manner of portraying women in the me-dia was mainly included in prior policy documents as anarea of equality policy on its own (Framework, 2001–2005;Roadmap, 2006–2010) (COM(2006) 92 final). Outside of themedia area, policy and measures have started to tackle thearea of stereotypes in education and employment (Road-map, 2006–2010 (COM(2006) 92 final); Commission’s Strat-egy, 2010–2015 (COM(2010) 491 final); Pact, 2011) (7349/11).The domain ofviolenceis divided intotwo sub-domains:direct violence andindirect violence (Figure 2.9.).
Figure 2.9. Domain ofviolenceand its sub-domains
Violence
Direct
Indirect
The first sub-domain,direct violence,should be understoodas a violation of human rights and a form of discriminationagainst women. It focuses on all acts of gender-based vio-lence that result in, or are likely to result in, physical, sexualor psychological harm or suffering to an individual, includ-ing threats of such acts, coercion or arbitrary deprivation ofliberty, whether occurring in public or private life (EU guide-lines on violence against women and girls, 2008). The prob-lem of gender-based violence against women remains highin Europe; between one-fifth and one-quarter of all womenhave experienced physical violence at least once during theiradult lives (Council of Europe, 2011). Most violence is perpe-trated by men against men, but such violence differs signifi-cantly from patterns of violence perpetrated by some menagainst women and children in the context of gender-basedviolence. Violence itself can be seen as aggressive beha-viour which is an expression of masculinity and an assertionof power. In order to preserve the power structure betweenwomen and men, this aggressive behaviour is used in variousforms, such as sexual harassment to control the behaviour ofwomen in public or work spaces; rape to assert dominationboth on strangers or intimate partners; or assaults on lesbianwomen who may or may not transgress gender norms asa ‘corrective’ measure (O’Toole et al., 2007). The settings ofgender-based violence vary and take place in a variety ofsettings, including the home, public spaces and places ofemployment. A number of actions have taken place in thelatter to tackle forms of sexual harassment at work.The second sub-domain,indirect violence,focuses predomi-nantly on attitudes and stereotypes, as the slow progressin the area of gender equality has been attributed to lim-ited attention to the cultural norms and attitudes that un-derpin gendered practices (Friedman, 2011). Attitudes andstereotypes can be seen as being a cause of gender-basedviolence examined in the first sub-domain. Social attitudeson gender have consequences by imposing codes of femi-ninity and masculinity on women and men respectively.This ranges from the disapproval given to mothers whowork full-time to the collision of behavioural expectationsof femininity and leadership which can put women at a
32
Gender Equality Index – Report
disadvantage in terms of accessing positions of power in de-cision-making or normative expectations of care (Robeyns,2007). Although the attitudes of younger generations havechanged, behaviours remain largely unaltered, leaving muchwork to be undertaken (Tinklin et al., 2005).In addition, it is useful to focus on stereotypes. Stere-otypes are a manifestation of cognitive ability to classifyand comprehend the information present in the environ-ment, meaning that they reflect shared social beliefs, val-ues and norms that dictate gender roles (DeLamater andMyers, 2007). They are internalised unconsciously and arethe result of a cumulative learning process shaped by cul-ture and society. Unfortunately, while there is a degree oftruth in the stereotypes formed by individuals, and sharedby society, these represent gross oversimplifications of real-ity. In addition, the value system superimposed on thesestereotypes can be detrimental to gender equality (Robeyns,2007), as is the case in the accession for women to someemployment, positions of power or fields of education.In summary, focusing on violence as a critical area of gen-der equality is very important since the impact of gender-based violence against women is enormous from theviewpoint of the survivors, but also from the viewpointof its symbolic impact on society. Gender-based violenceagainst women is a direct form of violence which can beseen as indirectly underpinned by norms and attitudes insociety, themselves rooted and relayed by stereotypes.
2.4. ConclusionThis section has presented the conceptual framework forthe Gender Equality Index (Table 2.1.). The results of analys-ing EU policy documents and other theoretical frameworkslaid the basis for a conceptualisation of gender equality atEU level that consists of eight domains. A strong connec-tion exists between all domains. The strongest connec-tions occur between three of the domains:work; money;andknowledge.For example, the domain ofworkis stronglyconnected with bothmoneyandtimeand is disproportion-ately affected byknowledgeandhealth.In addition,workisalso strongly connected to the risk of gender related pov-erty among individuals facingintersecting inequalities.In thedomain ofmoney,differences persist despite the relativeadvantage of women in some areas ofknowledge,althoughthe greater level of educational attainment of womenmay counteract differences in pay (Dougherty, 2005). Thedomain ofknowledge,with educational attainment,segregation, skills and competences, dictates many of theinequalities in the domains ofworkandmoney.The scope of gender equality outlined in the conceptualframework is very comprehensive, even more so giventhat it underpins the construction of a composite indicatorwhich aims at simplifying the concept. This comprehen-siveness reflects the efforts that have been made to en-sure that all relevant gender equality policy areas can bemonitored for progress.
Table 2.1. Gender Equality Index domains and sub-domainsDomainsWorkMoneyKnowledgeTimePowerHealthIntersecting inequalitiesViolence
Sub-domainsParticipation; segregation; quality of workFinancial resources; economic situationEducational attainment; segregation; lifelong learningEconomic activities; care activities; social activitiesPolitical power; social power; economic powerStatus; behaviour; accessAge; citizenship; disability; ethnicity; marital status; religion; sexual orientation; …Direct violence; indirect violence
Overall, the conceptual framework outlined in this sectionprovides a very appropriate framework upon which to builda Gender Equality Index. The next section discusses how this
conceptual framework can be implemented amidst the tech-nical requirements of constructing a composite indicator ongender equality and presents the methodology adopted.
Gender Equality Index – Report
33
3. MethodologyPrevious sections have outlined the main theoretical gen-der approach of developing the Gender Equality Index,discussed the added-value that this new index of genderequality offers and provided a conceptual framework ofgender equality areas as framed by EU gender equalitypolicy. This section outlines how the Gender Equality Indexoperationalises this conceptual structure (underpinned bypolicy and theory) into a measurable structure (supportedby data and statistical considerations).As with any other composite indicator, the Gender EqualityIndex is a measure obtained by compiling individual indica-tors on the basis of an underlying model of the multi-di-mensional concept that is being measured. In other words, itis a mathematical combination of a set of individual indica-tors, which aims to provide a summary of a complex reality.The construction of composite indicators involves diffe-rent stages where several choices have to be made, whichis why it is essential to work with a solid and transparentmethodology based on sound statistical principles. Themethodology applied to compute the Gender Equality In-dex is based on the widespread and internationally accep-ted procedure developed by the OECD and the EuropeanCommission’s Joint Research Centre (Nardo et al., 2008),which establishes the following ten steps:1.Developing a theoretical framework,that definesand structures what is measured and provides the basisfor the selection and combination of variables into ameaningful index.2.Selecting variables,based on the analytical sound-ness, measurability, country coverage, cross-countrycomparability and relevance of indicators.3.Imputing missing data,in order to obtain a com-plete dataset for all countries.4.Conducting a multivariate analysisto study theoverall structure of the dataset, assess its suitability andguide subsequent methodological choices.5.Normalising the data,if needed, to ensure the com-parability of variables.6.Weighting and aggregating indicators,accordingto both the theoretical framework and the results ofthe multivariate analysis.7.Conducting an uncertainty and sensitivity analy-sis,to assess the robustness of the index in terms ofall possible sources of uncertainty in its development(choice of imputation method, normalisation scheme,weighting system or aggregation method).8.Returning to the datain order to analyse what do-mains and sub-domains are driving the index results.9.Identifying possible association with othervariables,as well as existing known and commonlyused indicators.10.Presenting and disseminating the index resultsin a clear and accurate manner.These 10 guiding principles ensure that the methodologyused for the construction of the Gender Equality Index isbased on transparent and robust methodological choi-ces consistent with the soundness of a strong theoreticalframework, while at the same time being user-friendly,simple and easy to understand.This section presents this process by outlining the method-ological considerations and choices that were made dur-ing the development of the Index. First, the criteria appliedfor selecting a potential set of variables to be included inthe Index are discussed, touching on how they were proc-essed to develop a metric of analysis. Second, the sectionpresents the multivariate analysis performed to developthe measurement framework. Third, the methodologicalchoices made in computing the Index are outlined, in-cluding the choices made in selecting, weighting and ag-gregation techniques. To remove as much subjectivity aspossible, a robustness analysis was carried out based onthe principle of multi-modelling, and served as a guide toselect the best index within all possible alternatives. Finally,the section concludes with a description of the analysiscarried out to assess the quality of the Index.
34
Gender Equality Index – Report
3.1. Indicators and measuresDuring the course of the development of the concep-tual framework, an initial inventory of gender indicatorswas created by screening the literature and all existingsources of official statistics at international level. The list ofsources that were scanned for potential variables includedEuropean Commission (Eurostat, Directorate-General forJustice, Directorate-General for Health and Consumers,and Directorate-General for Communication), Eurofound,UNECE and OECD.
After the initial selection of existing potential indicators aprocess of conceptual mapping was applied, classifyinggender indicators as measures in each domain and sub-domain with reference to the conceptual framework, not-ing which indicators are endorsed in the EU within theframework of either the Beijing Platform for Action or theEurope 2020 Strategy (IP/10/225).It is important to highlight that variables that representboth objective and perceptual data have been considered.Although perceptual data introduces a degree of subjectiv-ity, particularly across Member States due to varying culturalcontexts, they nevertheless generate important informa-tion on the underlying constructs measured by the GenderEquality Index. The validity of the perceptual indicators usedis further increased by ensuring that they are examined to-gether, and positively correlated, with other indicators.Another aspect taken into account was availability over timeand across Member States, as the construction of an indexrelies on a database that is free of missing values. There-fore, the reference year chosen was 2010, since it ensuresmaximum data availability. Where appropriate, imputationmethods were used1. Variables with fewer than 10 % of miss-ing values and where the imputation could be confidentlyestimated were retained, otherwise they were dropped.Having created a database of gender indicators, thenext step involved ensuring that all underlying variablesmeasured gender equality aspects in a homogeneousway, by transforming them where needed. This is the casewhen it comes to the sign or the direction of the interpre-tation of a variable. The direction of all indicators needs tostay homogenous and the Gender Equality Index can onlyconsider variables that have a positive sign. The majority ofvariables in the dataset already had a positive sign, meaningthat higher values could be regarded positively. For exam-ple, variables measuring participation in tertiary educationor healthy life years are deemed to have a positive direc-tion, as it is desirable to increase educational attainmentor to live a long healthy life. On the contrary, the variablemeasuring being at risk of poverty implies a negative sign orinterpretation, since its occurrence ought to be minimised.
3.1.1. Selection of indicatorsIn selecting the initial indicators several criteria were fol-lowed. First, the theoretical basis of the core domains andthe satellite domains were taken into account in the sensethat all the variables included needed to:focus on individuals, rather than on institutions orcountries;consist of outcome variables, which measure a currentstatus as opposed to process or input variables;reflect an equal share of assets and resources (appli-cable only to the domains that consider both womenand men).Second, the quality criteria defined by Eurostat (2005) inits ‘Code of Practice’ were used. Variables were consideredproviding they were sex-disaggregated and they met thefollowing properties:harmonised at EU level and thereby comparable be-tween Member States;accessible, updated on a regular basis, punctual andcomparable over time;relevant and selected with methodological soundness,measuring an aspect of gender equality and meetingthe objective of the Index;accurate, measuring in a reliable way the phenomenonit intends to measure and being sensitive to changes;coherent when they are originated from differentsources, being reliably combined.
1
An imputation is a mathematical procedure which allows the precise estimation of a data point when it is not available. Direct imputations havebeen applied where possible. This occurs where there is an equal proportion of women and men, and where the value for women (w), men (m) orfor the total (t) is missing, the value of the data point is calculated by applying the definition t = w + m. In some cases, where the proportions arenot equal, for example 75 % of women and 25 % of men, the missing category is calculated by applying the definition t = 0.75 w + 0.25 m. In othermore complex cases, a regression method was applied.Gender Equality Index – Report35
To reverse variables, a number of techniques exist de-pending on the nature of the variable, including calcula-ting the complementary value of the variables whendealing with percentages (20 % of people at-risk-of-povertyis equivalent to 80 % not at risk of poverty) or computing theinverse (S80/S20 income quintile share compares the 20 %of the population with the highest income with the 20 % ofthe population with the lowest, while its inverse, S20/S80,keeps comparing the same percentages but meaning thehigher the share the greater the equality).To allow comparisons between populations of differentstructures and sizes, most variables needed to be expressedin relative terms. This produced ratios that were obtainedby dividing the variable of interest by its closest referencepopulation. For example, to measure labour force partici-pation, the number of women and men in employmentwas divided by the active population (closest referencepopulation). In the case of measuring training at work, anindicator was calculated as the percentage of women andmen receiving training among all workers (closest refe-rence population). The variables were converted in relativeterms according to the following formula:(1)where the indicator X for group k, women (w), men (m) oraverage (a); for the i-th country in the period t is divided bythe closest reference population in order to be expressedin relative terms. When the variable does not need tobe expressed in relative terms (for example mean income),then.
An initial measure was developed as a metric basedon a number of properties. In line with the genderapproach of the Index, it needed to measure gender gaps bytaking into account the relative position of women andmen to each other. The approach of the Gender Equal-ity Index also implies that all gaps, regardless of whetherthey were to the advantage of women or men, were takeninto consideration and treated in the same way. However,this means that it becomes necessary for the measure toensure no compensatory effects can take place. A situa-tion where a Member State has a greater score of gen-der equality, because it scores badly in a domain wherewomen are disadvantaged and badly in another wheremen are disadvantaged should indeed be avoided. This issolved by using absolute values.In addition, the metric used needs: (i) to be bound, so thatit varies in a given interval with a fixed minimum and maxi-mum in order to allow for the interpretation and compari-son of the scores; (ii) to ensure that it is possible to identifya single value that can be associated with absolute equal-ity. Considering these properties, the starting point forcomputing gaps between women and men is:(2)where the calculation is carried out for the variableXforthei-thcountry in the period t in order to obtain the per-represent over the total averagecentage that womenfor both sexes.This is a relative indicator with values that fall in the interval[0; 1] and can be computed for any values for women andmen. In this wayalways identifies the gender equa-lity point at 0. For reasons of interpretability, this indicatoris reversed by taking:(3)
3.1.2. Development of the metricHaving compiled a database of variables that are valid,easily interpreted, sex-disaggregated, harmonised at EUlevel, available over time and complete for all MemberStates, homogenised and relative, attention turned to thedevelopment of a single measure of gender equality foreach variable that can be used to compute the GenderEquality Index.
36
Gender Equality Index – Report
This yields values where 1 stands for complete genderequality, with any value below that indicating a propor-tional lack of gender equality in a given indicator, with fullgender inequality at 0.This initial measure was used to compute gender gaps forall the indicators included in the database. Subsequently, acorrecting coefficient based on the average or total levels(original values) of the variables was applied to each gap.Its effect is to ensure that levels of achievement are takeninto account, by applying a correction to gender gapswhich also meet lower levels. This considers the context ofMember States and ensures that obtaining a score that isnear 1 is the reflection of both low gender gaps and high,levels of achievement. These correcting coefficients,have been calculated according to the following formula:(4)
In summary, the metric used is dimensionless (allowingcomparability since measurement units of variables havebeen eliminated) and bound between [1; 100]. It satisfiesthe property of interpretability of each variable consid-ered in terms of distance from the equality point, set at100, and maintains comparability among indicators withineach country. An added benefit of using this metric is thatthe normalisation step (step number 5 in the OECD-JRCmethodology) is not needed, since usingremovesthe presence of different units of measurement and thepotential distorting effect of different scales, making allindicators comparable across domains and sub-domains,across Member States and over time.Figure 3.1.InequalityEquality
1
100
whererepresents the maximum value of the ave-rage or total of each variable used for the correction (usu-ally the original variable2), expressed in relative terms andreversed if necessary, observed across all Member States.The final metric is provided by the product of the formulaused to compute gender gaps (equation 3) and the cor-recting coefficient (equation 4). However, for mathemati-cal reasons (avoiding the presence of zeroes which wouldimpede possibilities to aggregate indicators, sub-domainsand/or domains), the final metric is rescaled so that it can-not take a value below 1. This final metric,used inthe calculation of the Index, provides a measure of gendergaps adjusted by levels of achievement, and can be ex-pressed as:(5)
After the treatment and transformation of all potential in-dicators into comparable gender gaps, the next step in-volved choosing the final dataset for the Index calculation.The choice of indicators to be included in a compositeindicator is vital. This set must both conform to measur-ing the conceptual framework and also to a numberof strict methodological criteria. This selection processalso allows for the identification of data gaps, related toinexistent data, lack of harmonisation, comparability oravailability. However, not all indicators that fulfil the nec-essary conceptual and methodological criteria can be in-cluded in a composite indicator. Considering the principleof parsimony, a composite indicator should be a simplemeasure, easily interpretable, reflecting a good balancebetween the number of variables involved in its computa-tion and the conceptual coherence. The final selection isultimately determined through an exhaustive multivariateanalysis, which is discussed next.
2
Exceptions and greater details are provided in Table 3.2.
Gender Equality Index – Report
37
Table 3.1. Summary of the metrics usedInitial metric: Gender gapIt considers the position of women and men to each other, treating them in the sameway and avoiding compensation effects. It facilitates interpretability of the score towardsequality/inequality.
Correcting coefficient:
It considers the context and the different levels of achievement of Member States, ensuringthat a good score is the reflection of both low gender gaps and high levels of achievement.
Final metric: Gender gap corrected by levelsof achievement
It is bound between [1; 100]. It satisfies the interpretability of each variable consideredin terms of distance from the equality point, set at 100, and maintains comparability amongindicators within each country.
3.1.3. Multivariate analysisA composite indicator is formed when individual indica-tors are compiled into a single index, on the basis of anunderlying model of the multi-dimensional concept that isbeing measured. The principal aim of multivariate analysisis to examine the statistical structure by measuring the ex-tent to which the conceptual framework receives statisticalsupport from a selection of indicators.The validation of the underlying structure of the data alongthe indicators and countries has been mainly done by usingtwo multivariate analysis methods: cross-correlations analy-sis and principal component analysis (PCA). Both have beenapplied to the variables already processed following thesteps presented earlier, that means directly applied to.The cross-correlations analysis measures the associationbetween variables. It has been performed on all the vari-ables with a double aim: as a tool to understand the inter-relationship between them and as a tool to further refinethe dataset, keeping only variables with meaningful andcoherent correlations.This was followed by a statistical procedure called princi-pal component analysis (PCA) that attempts to find naturalgroupings (factors or components) based on the correla-tions among variables. The difficulty resides in finding asuitable set of variables forming together statistically co-herent groupings that can be related to a common model.Taken together, these factors provide the measurement
framework used for the Gender Equality Index. Ideally, thesefactors need to correspond as much as possible to the sub-domains of the conceptual framework, however, in prac-tice there are often slight differences between the mea-surement and conceptual framework at sub-domain level.Initially, variables were grouped according to theirmeaning within domains and sub-domains establishedusing conceptual mapping. Next, the PCA was applied atdomain level to the core structure, allowing for the deve-lopment of factors that could map sub-domains. The highnumber of variables used for the analysis relative to thenumber of observations prevented the use of a PCA tech-nique to reify the overall theoretical structure. For this rea-son the PCA was applied to each domain separately3. Dueto lack of data in the domains of Violence and Intersectinginequalities, the PCA was not applied.The results of these two multivariate analysis methods,shown in Annexes 2–4, have provided the final selectionof the variables to be used in the computation of the coreIndex as well as its structure, which will be fully describedin the next sections.Annex 2 presents the main descriptive measures for thefinal metricused in calculating the Gender EqualityIndex. Although the variability of the metric is not signifi-cantly high, meaning that this is therefore of little conse-quence, those with greater standard deviations will have agreater impact in the computation of the Index. In termsof data availability, it also shows the excellent data cover-
3
The data matrix of the Gender Equality Index had not enough degree of freedom. Statistic refers to degree of freedom (df) as the number of valuesin a final calculation of a statistics that are free to vary. If n is the number of observation and k the number of independent variables the df is (n-k).In other words the df is the minimal number of values which should be specified to determine all the data points.
38
Gender Equality Index – Report
age, as there is only one missing value for one country.It is the case of Greece for the variable ‘Mean monthlyearnings’, which has been imputed considering its lastavailable values (2006).Annex 3 offers the correlation matrix of the dataset, calcu-lated with the Pearson’s correlation coefficient. Althoughthe data come from different sources and are measuredpredominantly at macro level, significant levels of associa-tion between variables can be observed, suggesting thatthey are measuring a common concept. These associationsare the base of the statistical structure of the data, struc-ture which is summarised in Annex 4, where the main re-sults obtained in the PCA are presented.
3.1.4. Selected indicators andtheir treatmentThe quality criteria established for selecting indicatorsand the results provided by the multivariate analysisallowed to determine the final set of variables used inthe construction of the core Index, as well as its structurein domains and sub-domains. Table 3.2. provides thislist of indicators, together with detailed step by stepinformation on how the original variables,, weretreated regarding sign homogenisation, expression inrelative terms if needed,and application of the correct-ing coefficients.The final set consists of 27 indicators for the 27 MemberStates, processed at aggregated level (macro level) for2010. It was important to ensure that all variables refer tothe same year in order to provide a better and reliablecross-sectional picture of the gender equality situation inthe EU 27. Therefore the year of 2010 was chosen as it isthe last year for which all the variables considered wereavailable.
Gender Equality Index – Report
39
Table 3.2. Processing of variablesReferencepopulation usedto expressXin relativeterms if needed15+ populationVariable usedto calculatethe correctingcoefficient_____Original variable inrelative termsOriginal variableEmployment intertiary sector- NACERev. 2, categoriesG-U (% totalemployment)Original variable inrelative terms
Variables (X)
Signs andReversion
Expression of thevariable in relativeterms if needed
Source
Full-time equivalentemploymentDuration of working life (years)
+Not reversed+Not reversed
Full-time equivalent employment(% 15+ population)Duration of working life (years)
Eurostat – EULabour Force SurveyEurostat – EULabour Force Survey
-
Employment in Education,Human Health andSocial Work activities
+15–64 employedNot reversed
Employment in Education,Human Health and Social Workactivities (% 15–64 employed)
Eurostat – EULabour Force Survey
Employees with a fixed startand end of a working day orvarying working time asdecided by the employerWorkers perceiving that theirhealth or safety is not at riskbecause of their workWorkers having undergonetraining paid for or providedby their employer or bythemselves if self-employedMean monthly earnings –NACE Rev. 2, categories B-Sexcluding O, 10 employees ormore (PPS)
Employees with a non-fixed startand end of a working day or vary-+15–64 employedNot reverseding working time as decided bythe employer (% 15–64 employed)Workers perceiving that theirhealth or safety is not at riskbecause of their work(% 15+ workers)Workers having undergone train-ing paid for or provided by theiremployer or by themselves ifself-employed (% 15+ workers)Mean monthly earnings – NACERev. 2, categories B-S excludingO, 10 employees or more (PPS)
Eurostat – EULabour Force Survey
+Not reversed
15+ workers
Original variable inrelative terms
Eurofound –European WorkingConditions Survey
+Not reversed
15+ workers
Original variable inrelative terms
Eurofound –European WorkingConditions Survey
+Not reversed
-
Original variable
Eurostat – Structureof Earnings Survey
Mean equivalised net income,+Not reversed16+ population (PPS)–Reversedusing thecomple-mentary–Reversedusingthe inverse
-
Mean equivalised net income(PPS,16+ population)
Original variable
Eurostat – EUStatistics on Incomeand Living ConditionsEurostat – EUStatistics on Incomeand Living ConditionsEurostat – EUStatistics on Incomeand Living ConditionsEurostat – EU LabourForce Survey
At-risk-of-poverty, ≤60 %of median income
16+ population
Not-at-risk-of-poverty, ≥60 %of median income(% 16+ population)
Original variable inrelative terms andreversed
S80/S20 income quintileshare, total population
-
S20/S80 income quintile share(total population)
Original variablereversed
Graduates of tertiary education
+15–74 populationNot reversed
Graduates of tertiary education(% 15–74 population)Tertiary students in the fieldsof Education, Health and Welfare,Humanities and Art – ISCED 5–6(% tertiary students)People participating in formalor non-formal education andtraining (% 15–74 population)
Original variable inrelative terms
Tertiary students in the fields of+Education, Health and Welfare,Tertiary studentsNot reversedHumanities and Art – ISCED 5–6
Population withEurostat – UNESCO/tertiary level ofOECD/Eurostat (UOE)education attained –questionnaires onISCED 5–6Educational Statistics(% 15–74 population)Original variable inrelative termsEurostat – EU LabourForce Survey
People participating informal or non-formaleducation and training40
+15–74 populationNot reversed
Gender Equality Index – Report
Workers caring for andeducating their children orgrandchildren, everydayfor one hour or moreWorkers doing cooking andhousework, everyday forone hour or moreWorkers doing sporting,cultural or leisure activitiesoutside of their home,at least every other day
+Not reversed
15+ workers
Workers caring for and educatingtheir children or grandchildren,everyday for one hour or more(% 15+ workers)Workers doing cooking andhousework, everyday for one houror more (% 15+ workers)Workers doing sporting, culturalor leisure activities outside oftheir home, at least every otherday (% 15+ workers)Share of Ministers(% 18+ population)
Original variable inrelative terms
Eurofound –European WorkingConditions SurveyEurofound –European WorkingConditions SurveyEurofound –European WorkingConditions SurveyEC-DG Justice –Women and Men inDecision MakingEC-DG Justice –Women and Menin Decision MakingEC-DG Justice –Women and Men inDecision MakingEC-DG Justice –Women and Men inDecision Making
+Not reversed
15+ workers
Original variable inrelative terms
+Not reversed
15+ workers
Original variable inrelative terms
Share of Ministers
+Not reversed
18+ population
Not used
Share of membersof Parliament
+Not reversed
18+ population
Share of members of Parliament(% 18+ population)
Not used
Share of members ofRegional AssembliesShare of members of boardsin largest quoted companies,supervisory board or boardof directorsShare of members in all keydecision-making bodies inCentral Bank
+Not reversed
18+ population
Share of members of RegionalAssemblies (% 18+ population)Share of members of boardsin largest quoted companies,supervisory board or board ofdirectors (% 18+ population)Share of members in all keydecision-making bodiesin Central Bank(% 18+ population)Self-perceived health, good orvery good (% 16+ population)
Not used
+Not reversed
18+ population
Not used
+Not reversed
18+ population
Not used
EC-DG Justice –Women and Men inDecision MakingEurostat – EUStatistics on Incomeand Living ConditionsEurostat –DemographicStatisticsEurostat – EU Statis-tics on Income andLiving Conditionscombined withEurostat’s Demo-graphic StatisticsEurostat – EUStatistics on Incomeand Living ConditionsEurostat – EU Statis-tics on Income andLiving Conditions
Self-perceived health:good or very good
+Not reversed
16+ population
Original variablein relative terms
Life expectancy in absolutevalue at birth (years)
+Not reversed
-
Life expectancy in absolutevalue at birth (years)
Original variable
Healthy life years in absolutevalue at birth (years)
+Not reversed
-
Healthy life years in absolutevalue at birth (years)
Original variable
Population without unmetneeds for medical examina-tion
+Not reversed
16+ population
Population without unmetneeds for medical examination(% 16+ population)Population without unmetneeds for dental examination(% 16+ population)
Original variable inrelative terms
Population without unmet+needs for dental examination Not reversed
16+ population
Original variable inrelative terms
Gender Equality Index – Report
41
Table 3.2. shows that only two variables have been re-versed in order to work with a dataset with the same signof interpretation (i.e. the higher the value the better). Onlypopulation at risk of poverty and income quintile sharehad to be reversed. Most indicators had to be convertedinto relative terms, however, indicators with the measure-ment units years or Euros did not require transformation.The fifth column of Table 3.2. presents the variables usedin the calculation of the correcting coefficients.In most cases, the formula in equation (4) has been ap-plied to the original variable in relative terms,. How-ever, some exceptions exist:For the variable ‘Employment in Education, HumanHealth and Social Work activities (% 15–64 employed),the correcting coefficient has been calculated usingthe percentage of people employed in the tertiary sec-tor. The original variable cannot be used for the cor-rection because what matters are gender inequalitieswithin and across sectors (segregation) rather thanactual numbers in a particular sector. Because patternsof segregation are linked to the structure of the labourmarket, the employment rate in the tertiary sector hasbeen used as there are more opportunities for segre-gation among Member States where participation inthis sector is higher (Hakim, 1996; Charles and Bradley,2002).For the variable ‘Tertiary students in the fields of Educa-tion, Health and Welfare, Humanities and Arts – ISCED5–6 (% tertiary students) the correcting coefficient hasbeen calculated using the percentage of populationof which the highest level of education attained is thetertiary level, based on the same reasoning as afore-mentioned.For the five variables measuring the representation ofwomen and men as ministers, members of parliament,members of regional assemblies, members of boards inthe largest quoted companies and members in all keydecision-making bodies in central banks, the correct-ing coefficient was not applied because these variablesrepresent shares (i.e. the representation of women andthe representation of men adds up to 100 %). In addition,the number of persons in decision-making positionsis limited and it is therefore not desirable to maximisethe number of these positions. For example, what is im-portant is to increase the share of women on companyboards and not to increase the size of boards per se.
The last column of Table 3.2. presents the sources of thevariables. These include: EU Labour Force Survey (Eurostat),EU Statistics on Income and Living Conditions (Eurostat),Structure of Earnings Survey (Eurostat), UNESCO/OECD/Eurostat questionnaires on Educational Statistics (Eurostat),Demographic Statistics (Eurostat), Working Conditions Sur-vey (Eurofound) and Women and Men in Decision Making(European Commission, DG Justice). These sources provideharmonised data at EU level, allowing for comparabilityacross countries.
3.1.5. Data considerations andexcluded indicatorsNot all variables relevant to the concept of gender equalitycan be included into a composite indicator. Variables canbe excluded based on several criteria outlined previously,including their nature, poor quality, availability or double-counting.The nature of the variables is an important criteria sincethe Gender Equality Index needs to rely exclusively onoutcome variables. As a result, input variables such as pro-vision of childcare services or levels of social benefits, al-though very important in terms of gender equality, cannotbe part of the Index.The reliability, including precision and lack of stability overtime often due to small samples, of some variables forcertain countries was problematic. As a result a numberof variables were removed from further consideration, al-though they were important and relevant indicators in themeasurement of gender equality. This included, for exam-ple, variables such as involuntary part-time or temporarypart-time work.Another issue concerned the validity of data. The majorityof the data sources used in the analysis have been pro-duced with the aim of studying the labour force (i.e. LFS),or the income and material conditions of households orindividuals (i.e. EU-SILC), but not to focus on gender issuesdirectly. This has implications in terms of validity since po-tential gender biases in data collection are neither acknow-ledged nor assessed. It is the case when studying work-lifeintegration without taking into consideration different so-cial and cultural factors between women and men.
42
Gender Equality Index – Report
Additionally, several variables were excluded due to availa-bility problems, as it was the case of determinants of health(i.e., consumption of alcohol) as they were not available forall 27 Member States. Other variables were not sex dis-aggregated such as consumption of tobacco. Doublecounting problems were avoided, as for example with thevariables ‘duration of working life’ and ‘retirement age’,where only the first one could be included in the Index.Other indicators relevant to the measurement of genderequality had to be expressed with the metric developedfor the Index, rather than in their original form, in order tomaintain comparability between indicators. This is the caseof the gender pay gap, which is expressed as the ratio ofwomen’s earnings to average earnings, rather than men’searnings as in its original form.Another issue to take into account is the internal coherenceof the data. The structure that keeps together the variablesneeds to rely strictly on positive correlations, to avoid op-posite interactions creating compensations during the ag-gregation process. In the case of both segregation at workand in education, a negative correlation exists with othervariables in the domains measuring participation. As a re-sult, it has been necessary to adopt variables measuringparticipation in selected sectors, rather that those morecommon measures of segregation, such as the Gini indexor the Dissimilarity index.The final selection of variables needed to conform strictlyto the structure reified by the PCA analysis. This meansthat all variables must work together, according to a sta-tistical structure, in explaining a common phenomenon. Itwas relatively straightforward in most instances, however,it was difficult to identify a suitable measurement struc-ture that fitted this requirement in the case of quality ofwork, predominantly because of the multi-dimensionalaspect of this concept. The best subset of variables identi-fied that obeyed the statistical criteria in the sub-domainof quality of work covers three out of four aspects usedby Eurofound (2002) and the European Commission (2009)in defining job quality: health and well being of workers,flexible working time arrangement and skills development.The remaining uncovered aspect is related to career pros-pect and employment security. Variables, such as precari-ous employment were tested, but it was not possible tofind a structure which was statistically sound.
There are many variables which could have been included,however, technical and statistical issues have limited thesepossibilities. The Gender Equality Index is, nevertheless, asynthetic measure for assessing and monitoring genderequality in Europe, which analysed together with othervariables can provide valuable gendered analysis. For thispurpose, the Index is supported by contextual data pro-vided in a set of Country Profiles.
3.1.6. Comparison between conceptualand measurement frameworksThe measurement framework for the Gender Equality In-dex that results from the multivariate analysis is presentedin Table 3.3. Within the six domains of gender equalityidentified for the core index at theoretical level, it was pos-sible to derive a measurement structure consisting of 27indicators distributed across 12 sub-domains.This comparison of the statistical structure of the data andthe structure provided by the conceptual framework showsthat the majority of sub-domains remained unchanged.Two sub-domains were split in the statistical structure.Within the domain of work, the sub-domain of segrega-tion was merged by the statistical analysis with qualityof work. In the domain of knowledge, the sub-domaineducational attainment comprises both formal educationand segregation within the measurement framework. Thefact that segregation, in work and knowledge, consistentlyloaded with another sub-domain is typical of a high de-gree of correlations between related issues (see Annex 4for more detailed information).A further two of the sub-domains remained empty dueto lack of suitable data: social power in the domain ofpower and behaviour in the domain of health. In these casesseveral problems related to data quality, homogenised infor-mation or unavailable sex-disaggregated data, were found.Finally, no indicators were used for economic activities in thedomain of time because of concerns over double-countingas well as the trade-off nature of sharing time between eco-nomic, care and social activities. The two satellite domainsof intersecting inequalities and violence, because they aredealing with illustrative groups, were not included as part ofthe PCA, as it was mentioned before. The domain of inter-secting inequalities, is measured using available indicatorson employment, without aggregating them further, so as toprovide indicative results. The domain of violence remainsempty due to lack of suitable data.
Gender Equality Index – Report
43
Table 3.3. Comparison of conceptual and measurement frameworks in the Gender Equality IndexConceptualframeworkMeasurementframeworkConceptmeasuredFTE employmentParticipationParticipationDuration ofworking lifev2Duration of working life (years)v1
Domain
IndicatorsFull-time equivalent employment rate(% 15+ population)
Segregation
Sectoral segregation
v3
Employment in Education, HumanHealth and Social Work activities(% 15–64 employed)Employees with a non-fixed startand end of a working day orvarying working time as decidedby the employer (% 15–64 employed)Workers perceiving that theirhealth or safety is not at riskbecause of their work (% 15+ workers)Workers having undergone trainingpaid for or provided bytheir employer or by themselvesif self-employed (% 15+ workers)Mean monthly earnings – NACE Rev. 2,categories B-S excluding O,10 employees or more (PPS)Mean equivalised net income(PPS, 16+ population)Not-at-risk-of-poverty, ≥60 % ofmedian income (% 16+ population)S20/S80 income quintile share(total population)Graduates of tertiary education(% 15–74 population)Tertiary students in the fields ofEducation, Health and Welfare,Humanities and Arts – ISCED 5–6(% tertiary students)People participating in formal ornon-formal education and training(% 15–74 population)
Work
Flexibility ofworking time
v4
Quality of work
Segregation andquality of work
Health and safety
v5
Training at work
v6
EarningsFinancial resourcesFinancial resourcesIncomeMoneyPovertyEconomic situationEconomic situationIncome distribution
v7
v8
v9
v10
EducationalattainmentEducationalattainment andsegregation
Tertiary education
v11
Knowledge
Segregation
Segregation
v12
Lifelong learning
Lifelong learning
Lifelong learning
v13
44
Gender Equality Index – Report
Domain
ConceptualframeworkEconomic
Measurementframework-
Conceptmeasured--
Indicators
-Workers caring for and educating theirchildren or grandchildren, everyday forone hour or more (% 15+ workers)Workers doing cooking and housework,everyday for one hour or more(% 15+ workers)Workers doing sporting, cultural orleisure activities outside of their home,at least every other day (% 15+ workers)Workers involved in voluntary orcharitable activities, at least oncea month (% 15+ workers)Share of Ministers (%, 18+ population)Share of members of Parliament(%, 18+ population)Share of members of RegionalAssemblies (%, 18+ population)-Share of members of boards inlargest quoted companies, supervisoryboard or board of directors(%, 18+ population)Share of members in all keydecision-making bodies inCentral Bank (%, 18+ population)
Childcare activitiesCare activitiesCare activitiesDomestic activitiesTime
v14
v15
Sport, culture andleisure activitiesSocial activitiesSocial activitiesVolunteering andcharitable activities
v16
v17
Ministerial representationParliamentaryrepresentationRegional assembliesrepresentationPowerSocial--
v18
Political
Political
v19
v20
-
Members of boardsEconomicEconomicMembers of Central Bank
v21
v22
Gender Equality Index – Report
45
Domain
Conceptualframework
Measurementframework
ConceptmeasuredSelf-perceived healthv23
IndicatorsSelf-perceived health, good orvery good (% 16+ population)Life expectancy in absolutevalue at birth (years)Healthy life years in absolutevalue at birth (years)-Population without unmet needs fordental examination (% 16+ population)Population without unmet needs fordental examination (% 16+ population)Employment of people born in aforeign country (% 15–64 populationborn in a foreign country)
Status
Status
Life expectancy
v24
Healthy life yearsHealthBehaviour--
v25
-
Unmet medical needsAccessAccessUnmet dental needs
v26
v27
Employment rates:
v28
Intersectinginequalities
Discrimination andother social grounds
Discrimination andother social grounds
minorities and/ormigrantsolder workers
v29
Employment of peopleaged 55–64 (% 55–64 population)
lone parents/carers
v30
Employment rates of people livingin a household with one adult andone or more dependent children(% 15–64 corresponding population)-
DirectViolenceIndirect
-
-
-
-
-
-
-
This measurement framework provides the hierarchicalstructure used for computing the Gender Equality In-dex and the corresponding indices for each domain andsub-domain. This results in an overall index, six indices atthe domain level and 12 indices at the sub-domain level.Although not all domains and sub-domains reflected
in the conceptual framework can be incorporated, themeasurement framework provides a conceptually validand empirically reliable index, giving the possibility toemphasise lack of data and the need to increase effortsin data collection and harmonisation in some of thesecritical areas.
46
Gender Equality Index – Report
3.2. Computing the IndexThe Gender Equality Index is a powerful analytic tool forpolicymakers as it provides an easily interpretable synthe-tic measure of gender equality as a complex phenomenonover time and across Member States. The growing numberof composite indicators in various policy areas testifies totheir political importance and operational relevance indecision-making. Nevertheless, in their construction, com-posite indicators remain as tools that can include varyingdegrees of subjectivity.It is, however, essential to ensure that the Gender Equal-ity Index remains as objective as possible, by relying onstrong and transparent methodological choices that canbest represent gender equality. Its computation thereforeaims to eliminate as much subjectivity as possible.Subjectivity is introduced in composite indicators throughthe choices made to compute them. To remove this sub-jectivity, the Gender Equality Index adopts the principleof multi-modelling (Saisana and Saltelli, 2011). This meansthat instead of relying on a single model, a set of poten-tial indices are computed in order to select the one thatbest measures gender equality. This is the one that is mostrobust. An Index is said to be robust when changing as-sumptions do not significantly affect its ability to measurethe concept of interest.The four main grounds of subjectivity relate to assumptionsin operational choices such as imputation of missing data(see previous section); normalisation; weighting; and ag-gregation at the level of sub-domains and then domains.The different options considered to compute the GenderEquality Index are described below, before the sectiondiscusses which options were adopted as a result of con-ducting the robustness analysis.
ability, as it provides a measure of the distance of eachvariable from the equality point, set at 100, and maintainscomparability across domains and Member States.
3.2.2. WeightingThe second key decision concerns the weights, or relativeimportance, assigned to each indicator, sub-domain anddomain during the aggregation process, tested in the mul-ti-modelling procedure of the Index. Several methods forassigning weights can be applied. The four methods test-ed consist of equal weights, a modified version of equalweights, weights retrieved from statistical analysis and fi-nally weights derived from experts’ opinions.In the first method tested, all domains, sub-domains andindicators are assigned equal weights (this is equivalent tonot assigning weights). Although equal weights may ap-pear to be a simple solution, it is however far from a neu-tral one and, as with any other weighting method, involvesa normative judgement. This is because differences in thespread of values, or alternatively high correlations, someelements can have a greater degree of influence in thefinal composite score.Secondly, a modification to the methods of equal weightswas also tested within the two domains that involved in-dicators of segregation. Although, as stated in the concep-tual framework, the sub-domain of segregation (in workand in knowledge) was placed as a separate sub-domain,the multivariate analysis provided a structure wheresegregation consistently loaded with another sub-domain.As a result, this method attributed a weight representinghalf the sub-domain, distributing the other half equallyamong the remaining indicators. For example, in thedomain of work, segregation was assigned a weight of1/2, while the three indicators measuring quality of workreceived a weight of 1/6 each.The third method, as an alternative, retrieves weights en-dogenously from the data. The multivariate analysis, usedto confirm the structure of the Index through principalcomponent analysis (PCA), provides correlations betweenthe indicators selected and their respective domains.These correlations, called factor loadings, can be used todetermine weights by rescaling them so they add up toone in each domain. This weighting method can only beapplied at sub-domain levels, since the PCA can only beused to reify the structure at this level, as previously ex-plained. It is important to note that because this weightingmethod is based on the data correlation structure is not a
3.2.1. NormalisationThe normalisation is a process that ensures that variablescan be compared by harmonise the scales or units. With-in the multi-modelling approach applied in the GenderEquality Index, the only normalisation method used is themetric, presented in equation (5), which provides thegender gaps adjusted by levels of achievement. No otheralternative is considered because the metricis alreadya normalisation method. It adjusts for the measurementunit of the original variable and corrects for the range ofvariation of each variable by ensuring it is bound between[1;100]. Furthermore, it satisfies the property of interpret-
Gender Equality Index – Report
47
mere measure of theoretical importance among the indi-cators. It has the added benefit of correcting overlappinginformation, as evidenced by correlated variables.Finally, the fourth weighting method tested, AnalyticHierarchy Process (AHP), was based on experts’ opinions.Rather than relying on technical measurements, it is aparticipatory method which requires the input of genderexperts (Nardo et al, 2008). This method is particularlyrelevant since the Gender Equality Index is underpinnedby EU policy and the method provides a basis to assessand discuss gender policy action. Its strength is thus inprovi-ding a systematic representation of experts’ opin-ions, and is credited for increasing the transparency andlegitimacy of the Gender Equality Index as a tool to sup-port gender equality policy in the EU (Nardo et al, 2008).The experts consulted consisted of members of the EIGE’sWorking Group on the Gender Equality Index and EIGE‘sExpert Forum. Experts’ opinions on weights were sought atthe domain level, only for core domains. This consultationprocess was undertaken in the last quarter of 2012, andresulted in an acceptable response rate of almost 50 %.The Analytic Hierarchy Process (AHP) is time consumingbut easy to perform, even though assigning weights to acomplex phenomenon such as gender equality is a diffi-cult task. It combines both qualitative aspects, by asking toexpress a preference between two domains, and quantita-tive aspects, by giving a score to the preference intensity.The AHP is based on ordinal pairwise comparison of do-mains. Experts were first asked to make a pair-wise com-parisons of domains, and secondly, to assign a strength ofpreference to the chosen domain in a scale from 1 (equalimportance of domains) to 9 (the most important domain).The relative weights for each expert can then be comput-ed in order to obtain the overall score for each domain4.The procedure is able to determinate whether weights areconsistent, that is if they are numerically coherent acrosspair-wise comparisons. For example, if work is more impor-tant than power, and power more important than health,then health cannot be more important than work. Howev-er, since incoherence is an integral part of human thinking,an inconsistency threshold is generally tolerated (Saaty,1980). The AHP, after solving for inconsistency, was ableto keep 60 % of experts’ weights. These experts’ weightswere averaged before being tested. Only average experts’weights by domain were used.
In summary, there is no general consensus as to what anappropriate weighting measure should be. Furthermore,there exists an inherent bias in the selection of a weightingmethod, as they all represent a subjective choice which hasa bearing on the final scores. It is therefore necessary to con-sider them all as part of a multi-modelling procedure. Theselection of a weighting method goes hand in hand withchoices of aggregation methods, which are outlined next.
3.2.3. AggregationThe aim of this step is to group the data according to thestructure provided by the measurement framework. Firstall variables within each sub-domain are aggregated, cre-ating indices at the sub-domain level. Subsequently theseare aggregated at the domain level. Finally, all the do-main indices are aggregated, creating the overall GenderEquality Index.Three aggregation methods have been tested to calculatethe Index: arithmetic, geometric and harmonic means. Inthe context of composite indicators, the main differencesbetween these three types of averages are in the extent towhich they allow for compensations. The arithmetic meanbetween two values is always greater than or equal to thegeometric mean between those same values, and itselfalways greater than or equal to the harmonic one. The ta-ble below provides the mathematical expressions of thesethree different weighted averages, considering the sum ofall weights equal to 1.Table 3.4. Mathematical expression of the arithmetic,geometric and harmonic meansArithmetic mean
Geometric mean
Harmonic mean
4
The overall score for each domain for each expert is calculated using Saaty’s eigenvector method, EM (Saaty, 1990).
48
Gender Equality Index – Report
The arithmetic mean allows full compensability, and thushas the potential to offset a poor performance in somevariables by a sufficiently large advantage in other variables,while the geometric and harmonic decrease this potentialcompensatory effect. An illustrative numerical example isprovided in Table 3.5., which shows how the harmonic, ge-ometric and arithmetic means are progressively allowingmore compensability, and therefore a higher score.Table 3.5. Examples of compensatory effectwith different meansExample of data pointsArithmetic meanGeometric meanHarmonic mean
Table 3.6. Sources of uncertainty andalternatives testedSources of uncertaintyWeighting
AlternativesEqual weightsModified equal weightsPCA weightsAHP weights
(50; 50)505050
(50; 75)636160
(50; 100)757167
Aggregation
Arithmetic meanGeometric meanHarmonic mean100 simulations forimputed missing data
Imputation
3.2.4. Towards the selection ofthe best indexThe construction of the Gender Equality Index necessi-tates various decisions to be made as to the imputation ofmissing data, as well as the methods used for weightingand aggregation. The choice of one method instead ofanother has implications for the final result of the coun-try score, as well as in its ranking. However, it is possibleto evaluate how and how much the results change overthe different range of alternatives by considering themall through robustness analysis. This analysis follows amulti-modelling principle: this means that since it is notdesirable to trust one single model, the approach thenbecomes to test a multitude of possible scenarios basedon various combinations of normalisation, weighting, miss-ing data and aggregation methods. In other words, sincethere is no unique recipe in constructing composite indi-cators, the approach is to compute them all before makinga final selection.The robustness analysis of the Gender Equality Index isbased on the combination of the alternatives for weights,aggregation and imputation of missing data presented inTable 3.6.
First, weights present a large source of uncertainty, whichneeds to be accounted for. The four methods outlinedabove are used in the robustness analysis.Second, a gradually compensatory aggregation methodhas been adopted. This means that the compensation al-lowed is higher within the aggregation at indicators level,where the arithmetic average is always considered. How-ever, it becomes gradually less compensatory within sub-domain and domains level, where only geometric or har-monic means are allowed.The last source of uncertainty deals with the issue of theestimation of missing data. Since missing data was imput-ed, leading to greater uncertainty, it is necessary to ensurethat the final index remains robust to potential inaccura-cies in these estimated values. Estimations for missing datawere sampled from their probability distribution throughMonte Carlo simulations (100 runs).The robustness analysis involved combining all possi-ble sources of variations (simulations of imputed data, allweights and aggregation alternatives). Altogether, this re-sulted in the computation of 3 636 sets of scores, whichcorresponds to the overall index distribution of all possi-ble scenarios generated. The robustness analysis has beenused as a tool for selecting the best alternative within thisdistribution.
Gender Equality Index – Report
49
The selection process of the best Gender Equality Index firstrelied on the calculation of the median5Index by MemberState within these 3,636 scenarios. Second, the differencesby country between each scenario and the median indexwere computed. The best index, according to the robust-ness analysis, consists of the one that minimise these dif-ferences and lies closest to the median.(6)In particular, the best index was chosen considering the Eu-clidean distance , defined as the square root of the sumof the squared differences between each index and theoverall median index. The combination closest to themedianis the one which minimised the distance .Following this procedure, the combination presented inTable 3.7. was adopted to compute the Gender Equality In-dex. It consists of the arithmetic mean and equal weightsat variable level; the geometric mean and equal weights atsub-domain level; and the geometric mean and experts’weights at domains level.Table 3.7. Characteristics of the Gender Equality IndexVariablesMetricSub-domains Domains
where identifies the best Gender Equality Index for thei-th countryis the metric described in (5) aggrega-ting at variable level (v), sub-domain level (s) and domainlevel (d),stands for equal weights computed at variablelevel andfor the weights at sub-domain level, whilestands for the experts’ weights used at domain level andretrieved from the Analytic Hierarchical Process (AHP).The overall Index is composed of 6 domain indices and 12sub-domain indices, all of them bound between [1,100],where 1 stands for complete gender inequality, with anyvalue above indicating a proportional increase of genderequality, with full gender equality at 100.The Gender Equality Index, so defined, represents the mostrobust combination of assumptions among the possiblescenarios considered. This combination provides lowerlevels of compensability at sub-domain and domain levelssince it relies on geometric means. In addition, because ituses equal weights and arithmetic aggregation at the levelof variables, it allows higher compensability within sub-domains. The potential for higher compensability is notproblematic since the correlation matrix does not includeany correlations above 0.90.Finally, at domain level, the robustness analysis selects acombination of weights that relies on those provided byusing the Analytic Hierarchy Process with the networkof EIGE’s experts. Table 3.8. provides the mean experts’weights used for the Gender Equality Index at domainlevel. These weights are equally shared at sub-domain andindicator level.
NormalisationWeightingAggregation
by construction acts as anormalisation methodEqualGeometricAHPGeometric
EqualArithmetic
Mathematically, it is expressed as:
(7)
5
The median is the middle value in a distribution. Since it is not dependent on the observed values of the data set, only on their positions, it is notaffected by extreme values.
50
Gender Equality Index – Report
Table 3.8. Mean experts’ weights used for theGender Equality IndexWork0.193
Money0.154
Knowledge0.216
Time0.146
Power0.191
Health0.099
3.2.5. Quality assessmentFollowing the computation of the Gender Equality Index,several statistical methods were applied to verify its qualityand robustness. This section provides a summary of themain results.Conducting a robustness analysis, as described in the pre-vious section, allows quantifying the level of confidenceassociated with the selected final Index score. Figure 3.2.shows how the main results of the Index can change alongwith variations in assumptions. It shows the distribution ofthe difference between all possible ranks obtained out ofthe 3 636 scenarios considered and the rank of the Gen-der Equality Index selected,.It provides an overview ofthe robustness of the Index with respect to the sourcesof uncertainty considered and shows a clear peak aroundzero, which represents no differences in rankings. This is asign of robustness in itself. The overall range of variationbetween [-6,6].Figure 3.2. Histogram of all possible rank differences,Index_i rank – Gender Equality Index rank(27 * 3 636 values)450400350300250200150100500-8-5-214-26-23-20-17-14-117101316192225
Gender Equality Index – Report
51
Table 3.9. Percentage of cases in the shifted rankRank differenceinterval[-6,-4][-3,-1][0,2][3,5][6,8][9,11][12,14][ -2,2 ][ -1, 1 ][0]
Percentageof cases4.01 %27.78 %61.52 %4.12 %1.95 %0.00 %0.62 %85.91 %70.88 %41.67 %
correlations with the domains ofKnowledgeandTime(r = 0.90), as well as withPower(r = 0.81) andWork(r = 0.82). Strong correlations with the domains ofMoney(r = 0.68) andHealth(r = 0. 52) can also be observed. Theseresults confirm the structure of the domains as meaning-ful in explaining the overall Index. This means that thedomains of gender equality selected, individually or togeth-er, successfully describe overall levels of gender equality.Moreover, the correlation matrix reflects the weights as-signed through the participatory process (AHP) in that thedomains having received the highest weights correspondto those with higher correlations. The only exception is thatof the domain oftime,where the highest correlation (0.90)is despite having received a relatively low experts’ weightcompared to other domains. However, the correlation be-tween the Index and the domain itself remain high, as thestrong structure of the data has somewhat overturned theeffect of the attributed weights.The structure of the Gender Equality Index is alsoconfirmed at sub-domain level as highlighted in Table3.10.Consistently all sub-domains contribute most to theirrespective domains. For example,Financial resourcesregis-ters the highest correlation (r = 0.97) to its own domainMoney.An additional sign of good fit of the Index re-sides in that all the domains and sub-domains are signifi-cantly correlated with the Index at a 5 % level of significance(Table 3.10.).Overall, this analysis demonstrates that the Gender IndexEquality is a robust measure with an internal structure thatis both statistically coherent and consistent with the con-ceptual framework of the Index.
A closer look of the distribution in Table 3.9. shows that al-most 42 % of cases have not shifted positions, by keepingthe exact same ranking, while in 71 % the shift in rank isat most of one position, and in 86 % of cases changed atmost of two positions. Overall, this analysis demonstratesthat the Gender Equality Index is robust and stable withrespect of the selected sources of uncertainties.Additionally, in order to assess the structure of the se-lected index, the correlation matrix between the overallIndex, domains and sub-domains was examined. In Table3.10., the Pearson’s correlation matrix shows very strong
52
Gender Equality Index – Report
1
2
3
4
5
6
7
8
9
10
11
12
13
14
15
16
17
18
19
1
Index
1
211111-0.190.140.010.80***0.060.51***0.31* 0.43** 0.64***0.03110.230.50*** 0.69***-0.130.2510.200.44** 0.49***10.34*0.280.34*-0.220.65*** 0.78***10.080.48*** 0.62*** 0.42** 0.42** 0.56***0.210.54***0.000.60*** 0.53*** 0.47***0.290.32* 0.40**0.41**0.20-0.130.46***-0.140.47**10.060.2010.2510.34*1111
Work
0.82***
1
3
Money
0.68*** 0.70***
4
Knowledge
0.90*** 0.77*** 0.66***
5
Power
0.81*** 0.52***
0.24* 0.60***
60.120.50***0.35*
Time
0.90*** 0.69*** 0.69*** 0.82*** 0.57***
70.030.51*** 0.54***0.33* 0.66*** 0.78***0.180.65*** 0.85***0.240.43** 0.37**
Health
0.52*** 0.55*** 0.85*** 0.54***
8
Participation
0.50*** 0.59***
Level of significance for N=27: *** p<0.01; ** p<0.05, *p<0.100.26*0.38* 0.88*** 0.40**-0.170.49***0.090.300.75*** 0.68*** 0.54*** 0.49*** 0.79*** 0.66***0.130.40**0.140.39** 0.91***0.020.44** 0.63***0.41**
9
Segregation and qualityof work
0.72*** 0.88*** 0.84*** 0.65***
10
Financial resources
0.63*** 0.65*** 0.97*** 0.67***
11
Economic situation
0.42** 0.46** 0.56***
12
Educational attainmentand segregation
0.66*** 0.50*** 0.56*** 0.84*** 0.39** 0.57*** 0.57***
13
Lifelong learning
0.88*** 0.82*** 0.60*** 0.89*** 0.62*** 0.83*** 0.40** 0.56*** 0.68*** 0.55*** 0.40** 0.50***
Table 3.10. Pearson’s correlation matrix between the Index, domains and sub-domains
14
Political
0.84*** 0.65*** 0.56*** 0.69*** 0.83*** 0.63*** 0.42** 0.45** 0.54*** 0.54***
15
Economic
0.60***
0.31*
-0.04
16
Care activities
0.86*** 0.74*** 0.75*** 0.75*** 0.54*** 0.94*** 0.57***
17
Social activities
0.67*** 0.40**
0.32* 0.64*** 0.49*** 0.79***
Gender Equality Index – Report
18
Status
0.43** 0.42** 0.74*** 0.46**
19
Access
0.41** 0.50*** 0.60***
53
3.3. ConclusionThis section has outlined the methodology employedto construct the Gender Equality Index and presentedits measurement framework, including the selection ofgender indicators. The purpose of this section is to be astransparent as possible in regards to what computationprocess was used. This is crucial to ensure that the Indexprovides a measure of gender equality that is at the sametime unambiguous and accurate.The development of the Gender Equality Index relies onstrict statistical criteria combined with a solid theoreti-cal framework. First, it is essential to ensure that variablesare chosen on the basis of technical and methodologicalgrounds, as outlined in this section. Furthermore, this se-lection also showed how the validity of the measurementstructure was ascertained through multivariate analysis.The development of the measurement structure reifiedto a large extent the conceptual structure outlined inSection 2. Finally, the section presented the results of therobustness analysis. This is based on the principle of multi-modelling, whereby one single model is not trusted, andthe selection of the Index relies on selecting the bestmodel in terms of robustness out of all possible alterna-tives considered. This ensures that the Gender Equality In-dex is truly representative of the concept of Gender Equal-ity in the EU and across Member States, and not biased bya subjective choice in weights or aggregation method.Having described the methodology employed for theconstruction of the Gender Equality Index and shown howthe selected model was the most robust available, thereport now turns to a description of the indicators selectedin the Gender Equality Index to measure the concept ofgender equality within the EU policy framework.
54
Gender Equality Index – Report
Gender Equality Index – Report
55
4. IndicatorsThe Gender Equality Index provides a synthetic tool thatmeasures the progress made in reducing gender gapsthroughout Member States. Gender equality and its criticaldomains, within the context of EU gender equality policy,have been set out in Sections 1 and 2 of this report. Thetechnical and methodological decisions inherent to theconstruction of the Gender Equality Index have been setout in the previous section (Section 3), and show howthe conceptual framework can be implemented througha measurement framework. The measurement frameworkpresents the operationalised domains and sub-domains ofthe Gender Equality Index together with their associatedgender indicators.This section presents these gender indicators, along withtheir definitions and frequency of dissemination. Withineach domain, an analysis of the gender indicators used ispresented both in the EU-27 and across Member States.This includes looking at levels of achievement in 2010, butalso examining gender gaps. These gaps can work towardswomen (where women are over-represented comparedwith men) or towards men (when the reverse is true). Thisanalysis provides a comprehensive overview of the genderindicators selected and provides valuable data to illustratethe key gender equality issues identified by the conceptualframework of the Gender Equality Index.This domain includes three conceptual sub-domains tobe measured:participation, segregationandquality of work.Participation is measured by two gender indicators: partici-pation rates in employment in full-time equivalence (FTE),as well as gender gaps in duration of working life. Becauseof the strong link between sectoral segregation and work-ing conditions (European Commision, 2009; UNECE, 2013),a relationship confirmed by the correlation structure dur-ing the multivariate analysis, gender indicators measur-ing segregation and quality of work are aggregated intoone single sub-domain:Segregation and quality of work.Sectoral segregation is measured by an indicator lookingat the participation of women and men in the educationand the human health and social work activities. It is com-bined with indicators measuring gender gaps in flexibilityat work, with the start and end of the working day, healthrisks at work and work-based training (see Table 4.1.).Vertical segregation is left unmeasured, as it is partly cov-ered by the gender differences in earnings in the domainof money and the representation of women and menin the economic sphere of power. It is indeed metho-dologically essential to avoid overlaps in building compositeindicators.
4.1. WorkThe domain of work measures the extent to which womenand men can benefit from equal access to employmentand appropriate working conditions. These, together withthe elimination of all forms of discrimination and segrega-tion, allow equal access to economic resources and con-tribute to the elimination of poverty.
56
Gender Equality Index – Report
Table 4.1. Measurement framework for the domain of workMeasurementframeworkConceptmeasuredFTEemploymentParticipationDuration ofworking lifeSectoralsegregationDuration of workinglife (years)Employment in Education, Human Healthand Social Work activities (% 15–64 employed)Employees with a non-fixed start andend of a working day or varying working timeas decided by the employer (% 15–64 employed)Workers perceiving that their health or safety isnot at risk because of their work (% 15+ workers)Workers having undergone training paid foror provided by their employer or by themselvesif self-employed (% 15+ workers)Eurostat – EU LabourForce SurveyEurostat – EU LabourForce Survey
Indicator
Source
Full-time equivalent employment rate(% 15+ population)
Eurostat – EU LabourForce Survey
Segregation andquality of work
Flexibility ofworking time
Eurostat – EU LabourForce Survey
Health andsafety at work
Eurofound –European WorkingConditions Survey
Trainingat work
Eurofound –European WorkingConditions Survey
4.1.1. Full-time equivalentemployment rateWomen are less likely than men to participate in the la-bour market, that is, less likely to be employed or activelylooking for a job and moreover, when they do participate,women tend to work fewer hours than men (Eurostat,2008). A measure of participation adjusted by workinghours is therefore an important indicator as it relates to allother aspects of economic and social participation.Variable definition: Full-time equivalent (FTE) employmentrate (% 15 + population)
This indicator measures employment rates adjusted forworking time. It is obtained by dividing working hours bythe average number of full-time hours. Full-time equiva-lence is a more precise unit to measure participation inemployment as it takes into account the different numberof hours that individuals may work during the course ofa week. The unit is obtained by comparing the averagenumber of hours worked to the average number of hoursof a full-time worker. A full-time person is counted as oneFTE, while a part-time worker is awarded a score propor-tional to the hours worked (Eurostat, 2013) (corresponds toEurope 2020 targets, see annex 5).Data source: Labour Force Survey, Eurostat (emplrate_ft_equiv)Periodicity: annual
Gender Equality Index – Report
57
Full-time equivalent participation in the labour force wasconsistently higher for men in all Member States in 2010, withan EU-27 average of 41 % for women and 56 % for men (see
Figure 4.1.). Across Member States, this stretched between28 % (MT) and 48 % of women (FI, DK, SE and CY) comparedwith between 49 % (LT) and 63 % of men (CY and CZ).
Figure 4.1. Full-time equivalent participation by sex in EU Member States, 2010
100%FTE employment rate inpercent
Women
Men
Average
80%Women: 41%Men: 56%
60%
40%
20%
0%ITHUESELMT BEFR BGLTIELVDENLEEEU-27PLUK LUROSK ATFISIPT DK CZSE CY
Source: Eurostat, LFS (data calculated by Eurostat at EIGE’s request) (emplrate_ft_equiv)This corresponds to an EU-27 average gender gap of15 percentage points in 2010. The scale of this gender gapwas wide, ranging from less than 10 percentage points inLithuania, Latvia, Estonia, Finland and Bulgaria to as muchas 33 percentage points in Malta (see Figure 4.2.).
Figure 4.2. Gender gaps in full-time equivalent participation in EU Member States, 2010
Gender gap towards menGender gap in percentage point4015.5
30
20
10
0LTLVEEFIBG DKSESIHU FR PTIECYRO SKPLEU-27ESBE UK CZ DE ATELLUITNL MT
Source: Eurostat, LFS (data calculated by Eurostat at EIGE’s request) (emplrate_ft_equiv)
58
Gender Equality Index – Report
4.1.2. Duration of working lifeThe second gender indicator used to measure participa-tion is duration of working life. It is an important indicatorfrom a gender perspective as women are more likely thanmen to have career interruptions and/or to opt out of la-bour force participation.Variable definition: Duration of working life (years)The Duration of working life (DWL) indicator measures thenumber of years a person at a given age is expected tobe active in the labour market. It provides valuable infor-mation on participation in the labour force by adding alife course perspective, as it captures issues such as youthunemployment or early withdrawal from the labour force(Eurostat, 2012).
Data source: Labour Force Survey, Eurostat (lfsi_dwl_a)Periodicity: annualDuration of working life increased slightly for both womenand men between 2000 and 2010. During this period oftime, men’s duration in working life increased by about ayear, from 36 years to 37 years. Women saw a slightly largerincrease of three years, going from 29 years in 2000 to 32in 2010. The data presented in Figure 4.3. shows that onaverage in the EU-27, in 2010, women worked for 32 years,compared with 37 years for men. At Member States level,women worked as few as 22 and 24 years in Malta and Italyrespectively, but as much as 38 years in Denmark and 39years in Sweden. Duration of working life was longer formen, starting as low as 31 years in Hungary, but reaching41 years in Cyprus, the United Kingdom and Denmark and42 years in the Netherlands and Sweden.
Figure 4.3. Duration of working life by sex in EU Member States, 2010
Women
Men
Average
50Women: 32Men: 37
Duration ofworkinglife in years
403020100HUITMT BG PLLUROELSKBELTCZFRIESIESEU-27LVEEAT DEFIPT CYUKNL DK SE
Source: Eurostat, LFS (lfsi_dwl_a)
Gender Equality Index – Report
59
Duration of working life was in 2010 almost always exclu-sively longer for men than women, with an average ofsix years difference overall in the EU-27. This constitutesa slight decrease since 2000, when a seven year differ-ence existed. Differences between the duration of work-ing life of women and men were quasi-inexistent in the
three Baltic States (LT, LV and EE), with Lithuania the onlyMember State where women’s duration of working lifeexceeded that of men. Overall, men worked as much asan additional 10 years in Greece and Italy, or even 17 yearsextra in Malta (Figure 4.4.).
Figure 4.4. Gender gaps in duration of working life by in EU Member States, 2010
40Gender gap in years
Gender gap towardswomen
Gender gap towards men
30
5.7
20
10
0LTLVEEFISEBG DKSIPT FRHUPL BEAT DE RO NLEU-27SKUK ESCZLUCYIEELITMT
Source: Eurostat, LFS (lfsi_dwl_a)
4.1.3. SegregationThe third gender indicator used in the domain of workmeasures segregation. Segregation in the labour mar-ket encompasses the extent to which women and mentend to work in different sectors, or contractual terms andconditions. Gender-based patterns of segregation remainwidespread throughout the EU, which affects economicindependence and representation in decision-making.Segregation is measured by gender gaps in the proportionof women and men employed in the education and thehuman health and social work activities sectors, accordingto the second revision of the statistical classification of eco-nomic activities in the European Community (NACE Rev 2).Variable definition: Employment inEducation, Human health andsocial workactivities (% 15–64 employed in all NACE Rev. 2)This indicator reflects the percentage of women and menemployed in certain economic activities, as defined by theEuropean standard classification of productive economicactivities (NACE Rev 2). The indicator is based on employ-ment in two economic activities, which corresponds to themost feminised sectors: Education (P), Human health andsocial work activities (Q) (Eurostat, 2013b) (corresponds toEurope 2020 targets, see Annex 5).
Data source: Labour Force Survey, Eurostat (lfsa_egan2)Periodicity: annualSectoral segregation is flagrant at EU level. In 2010, womenrepresented over two-thirds of those involved inHumanhealth and social work activities(78 %),Education(72 %) orOther service activities(66 %). On the contrary, they weregreatly under-represented in other more men-dominatedeconomic activities, includingMining and quarrying(12 %)andConstruction(9 %). A detailed breakdown is providedin Annex 6.The two most feminised occupations in 2010 consist-ed ofHuman health and social work activities,as well asEducation.On average, in the EU-27, in 2010, 29 % of womenwere involved in these two sectors compared with just 8 %of men. While men’s presence in these sectors remained lowin all Member States, between just 4 % in Bulgaria, Latvia,Romania and Slovakia and 13 % in Denmark. Some MemberStates had more than a third of women involved in thesesectors, including Ireland (35 %), Finland (38 %), Belgium(38 %), the Netherlands (39 %), the United Kingdom (39 %),Denmark (43 %) and Sweden (44 %) (see Figure 4.5.).
60
Gender Equality Index – Report
Figure 4.5. Employment in theEducationand theHuman health and social work activitiessectorsby sex in EU Member States, 2010
100%Participation inpercent80%
Women
Men
Average
Women: 29%
Men: 8%
60%40%20%0%ROBG CY CZELPLESSKSIITLVPTHU EEAT MTLTLUEU-27DE FRIEFIBENLUKSE DK
Source: Eurostat, LFS (lfsa_egan2)An analysis of gender gaps shows that women are al-ways over-represented in the sectors ofEducation,as wellasHuman health and social work activities.This is neithersurprising, nor informative, as it is the premise upon whichthe indicator was built. However, what is more relevantis the size of the gender gap, which reached as much as22 percentage points on average at EU level. The gap wasnarrowest in Cyprus and Romania, with 12 percentagepoints, and widest for Sweden with 33 percentage points(see Figure 4.6.).
Figure 4.6. Employment in theEducationand theHuman health and social work activitiessectors by gendergap in EU Member States, 2010
40Gender gap inpercentage points21.5
Gender gap towardswomen
30
20
10
0SEFIDK NLUKBEIEFREU-27SKLTLVEEDE MT PT
HUPL CZ
SI
IT
AT
LU
ESBG
ELRO CY
Source: Eurostat, LFS (lfsa_egan2)
Gender Equality Index – Report
61
4.1.4. Possibility to vary the startand/or stop of the working dayfor family reasonsIn order to measure flexibility, as one aspect of quality ofwork, a gender indicator linked to work flexibility is used.It is an important indicator to consider given that womenand men may need to organise their working time in differ-ent ways, largely taking into account the disproportionateresponsibility for care attributed to women. Furthermore,flexibility can be strongly linked to segregation (EuropeanCommision, 2009), as some sectors are more favourablewhen it comes to support work-life balance. Flexibility ismeasured by the ability for women and men to vary thestart and/or the end of the working day.Variable definition: Employees with a non-fixed start andend of a working day or varying working time as decidedby the employer (% 15–64 employed)
This indicator examines flexibility of working time by pro-viding information on the ability of workers to have a flex-ible start and end of the working day (Eurostat, 2013c).Data source: Labour Force Survey, Eurostat (lfso_10fvareco)Periodicity: annualFlexibility of working time favours men throughout mostof the EU-27. This somewhat surprising pattern has beendocumented in other studies and linked to patterns ofsectoral segregation in the labour market (European Com-mision, 2009). On average, in the EU-27, in 2010, 39 % ofwomen and 45 % of men reported not having a fixed startand/or end of a working day or varying working time, asdecided by an employer. Across Member States, the datashows that this, however, varies enormously. Fewer thanone in five women could do so in Latvia (16 %), Hungary(16 %) and Bulgaria (18 %), while this appeared to be avail-able to over half of all women in Greece (51 %) and Finland(57 %). Corresponding figures showed a similar picture formen, with 20 % in Latvia and as many as 68 % in Finland(see Figure 4.7.).
Figure 4.7. Employees who do not have a fixed start and end of a working day or varying working timeas decided by the employer by sex, in EU Member States, 2010
100%Flexibility inworkingtimeinpercent80%60%
Women
Men
Average
Women: 39%
Men: 45%
40%20%0%LVHUBG SKLTESSIPTLUMTEEPLCYBE NLRO CZEU-27FR DKIEUKATDESEITELFI
Source: Eurostat, LFS (lfso_10fvareco)
62
Gender Equality Index – Report
The overall gender gap, for the percentage of employeesthat reported not having a fixed start and end of a work-ing day or varying working time, stood at six percentagepoints on average in the EU, for 2010. There were impor-tant differences across EU Member States, ranging from
a gender gap in the United Kingdom that is practically in-existent to as much as 10 percentage points, to differencesin Denmark and Estonia, 11 in Finland and 12 in Ireland (seeFigure 4.8.).
Figure 4.8. Gender gaps in employees who do not have a fixed start and end of a working day orvarying working time as decided by the employer in EU Member States, 2010
Gender gaps inpercentage points
40
Gender gap towardswomen
Gender gap towards men
30
206.010
0UKROEL LUMTLTES LVATDEEU-27PT BECYHUSIBG PLSEITSKCZFRNL DKEEFIIE
Source: Eurostat, LFS (lfso_10fvareco)
4.1.5. Health and safety risks at workGender gaps in health and safety at work, as a dimensionof quality of work, are included in the Gender Equality In-dex. This issue, in gender terms, is important given thathistorically, sectoral segregation has meant that men weremore likely to experience health and safety risks at work. Itis measured by looking at the percentage of women andmen who report not experiencing health and safety risksat work.Variable definition: Workers perceiving that their health orsafety is not at risk because of their work (% 15 + workers)This indicator measures workers’ self-perceived experience,over the past 12 months, of health and safety risks in theirworking environment (Eurofound, 2012).
Data source: European Working Conditions Survey,EurofoundPeriodicity: every five yearsThe data confirm that women are less likely to experiencehealth and safety risks at work. Figure 4.9. shows that, onaverage in the EU, in 2010, the majority of individuals, 81 %of women and 71 % of men, did not report experiencinghealth and safety risks at work. For women, this ranged be-tween 61 % of women in Latvia to 89 % in the Netherlands.The interval was much wider for men: as few as 45 % ofmen in Latvia and up to 84 % in Denmark.
Gender Equality Index – Report
63
Figure 4.9. Perceptions that health and safety is not at risk because of work by sex in EU Member States, 2010
Women
Men
Average
100%Healthand safety is not at riskbecause ofworkinpercent80%60%
Women: 81%
Men: 71%
40%20%0%LVSEEEBGELSIROESHUPLLTCYSKLUFIPT MTFREU-27BE ATCZDEUKITIENL DK
Source: Eurofound, EWCS, 2010In 2010, in all Member States except Finland, women wereless likely than men to report experiencing health andsafety risks at work. This represents a percentage pointdifference between women and men wider than 15 per-centage points in Bulgaria, Poland, Slovakia, Malta, Greeceand Latvia (see Figure 4.10.).
Figure 4.10. Gender gaps in perceptions that health and safety is not at risk because of work by EU MemberStates, 2010
Gender gap inpercentage points
40
Gender gap towardswomen
Gender gap towards men
30
20
9.9
10
0BGPL SKMTELLVHU LTESCYATEE UKCZEU-27IESE NL FRITPTSIDEBERO DKLUFI
Source: Eurofound, EWCS, 2010
64
Gender Equality Index – Report
4.1.6. Training at workThe final indicator used in the domain ofwork,to measuregender gaps in quality of work, examines the number ofwomen and men that have received training at work.Variable definition: Workers having undergone trainingpaid for or provided by their employer or by themselves ifself-employed (% 15+ workers)This variable provides information on workers’ access (em-ployees and self-employed), over the past 12 months, toemployer-paid training in order to improve their skills andexpertise (Eurofound, 2012).
Data source: European Working Conditions Survey,EurofoundPeriodicity: every five yearsAround a third of women and men, overall in the EU-27,benefited from training paid for or provided by their em-ployer (or themselves if self-employed), in 2010. AcrossMember States, the pattern is divided. Only 11 % of wom-en and 8 % of men underwent training at work in Bulgaria,compared with as many as 50 % of men in the Netherlandsand 55 % of women in Finland (see Figure 4.11.).
Figure 4.11. Gender gap in workers having undergone training paid for or provided by their employer(or themselves if self-employed) by sex in EU Member States, 2010
100%Havingundergone training atworkinpercent80%60%
Women
Men
Average
Women: 33%
Men: 34%
40%20%0%BGELROLTFRIT HUCYPTLV ESMT PLEU-27LUSKEEDEBE ATIEDKUKCZ SISENL FI
Source: Eurofound, EWCS, 2010Although there was only a very small difference betweenwomen and men on average in the EU, in 2010, some largedifferences existed in some Member States. Furthermore,gender gaps were not homogenously towards either womenor men. For example, as shown in Figure 4.12., women weremore likely to receive training at work in Estonia and Latvia,with a percentage point difference of 10 and 15 respectively.On the other side of the spectrum, men were more likelyto have received work-based training in Spain and Portugal,with a gender gap of 7 and 8 percentage points.
Gender Equality Index – Report
65
Figure 4.12. Gender gap in workers having undergone training paid for or provided by their employer(or themselves if self-employed) by EU Member States, 2010
Gender gap inpercentage points
40
Gender gap towardswomen
Gender gap towards men
30
20
10
1.3
0LVEEFILTLUBE MTHUBGUK ELATSERO CZ DKSI
SKEU-27PL NL
IT
FR
DEIECY
ESPT
Source: Eurofound, EWCS, 2010
4.1.7. SummaryThe gender indicators used by the Gender Equality Indexin the domain of work, when it comes to full-time equiva-lent employment rate, show the extent to which womenand men differ in terms of entering and working in the la-bour market. Not only are women less likely to participate,but throughout all EU Member States, they are also work-ing fewer hours when they do so, and spend fewer yearsoverall in work than men.Gender gaps also show the extent to which sectoral seg-regation remains a feature of the EU labour market, withwomen persistently representing a strong majority ofthose working in typically feminised sectors such as edu-cation, health services and social work.Notwithstanding the difficulties of measuring the multi-plicity of dimensions of quality of work, the three indica-tors used showed a mixed picture in gender terms. On av-erage, men in the EU, in 2010, were more likely to be ableto control their working hours; however, were still more atrisk when it came to health and safety at work. Training atwork did not present a uniform picture favouring women,men or equality, depending on Member State.
4.2. MoneyThe domain of money is important in gender terms be-cause of the need to ensure women’s and men’s equalrights and access to financial resources, as well as the needto address the feminisation of poverty and income ine-quality. This domain includes indicators that measure thegaps between the financial resources and economic situa-tion of women and men, consisting of two measurementsubdomains, matching the conceptual framework. The firstsub-domain, financial resources, is measured by differen-ces in earnings between women and men, as well as gen-der gaps in equivalised income. The issues of poverty andunequal income distribution form the second sub-domainand rely on indicators that measure gender gaps: thosenot-at-risk-of-poverty and the income quintile share ratiobetween poorest and richest in the population (variablesand data sources are presented in Table 4.2.).
66
Gender Equality Index – Report
Table 4.2. Measurement framework for the domain of moneyMeasurementframeworkConceptmeasured
Indicator
Source
EarningsFinancial resources
Mean monthly earnings – NACE Rev. 2, categoriesB-S excluding O, 10 employees or more (PPS)
Eurostat – Structureof Earnings Survey
Income
Mean equivalised net income(PPS,16+ population)
Eurostat – EU Statisticson Income and Living Conditions
PovertyEconomic situationIncomedistribution
Not-at-risk-of-poverty, ≥60 % of median income(% 16+ population)
Eurostat – EU Statistics on Incomeand Living Conditions
S20/S80 income quintile share (total population)
Eurostat – EU Statisticson Income and Living Conditions
4.2.1. EarningsDifferences in earnings between women and men repre-sent the first gender indicator in the domain of financialresources. It is an important aspect to measure, as differ-ences in earnings are directly related to gendered issuessuch as work and caring responsibilities.Variable definition: Mean monthly earnings – NACE Rev. 2,categories B-S excluding O (Purchasing Power Standard)Mean monthly earnings represent the earnings obtainedby an employed person, before any tax deductions andsocial security contributions, payable by wage earners andretained by the employer. These are restricted to grossearnings which are paid in each pay period during thereference month (Eurostat, 2012). The indicator takes into
consideration all sections of the NACE classification (B to S)with the exception of sector O, which corresponds to pub-lic administration and defence compulsory social security(Eurostat, 2008).Data source: Eurostat calculation based on the Structure ofEarnings Survey (SES), Eurostat (earn_ses10_20)Periodicity: annualExamining earnings shows the extent of the differencesbetween women and men throughout the EU-27. The av-erage monthly wage at EU level in 2010 was of 2,021 PPSfor women and 2,533 PPS for men. However, earnings wereas low as 713 PPS for women and 822 PPS for men monthly,in Bulgaria. In contrast, women earned 2,872 PPS in Luxem-bourg, and men 3,461 in Denmark (see Figure 4.13.).
Gender Equality Index – Report
67
Figure 4.13. Mean monthly earnings by sex in EU Member States, 2010
Women3,500Mean monhtly earnings (PPS)3,0002,5002,0001,5001,0005000BGRO LT LVSKEE HUCZ PLPTSIEL MT
Men
TotalWomen: 2,021Men: 2,533
ES
IT CY
FREU-27AT SE
FI
BE
NL DE UK
LU IE
DK
Source: Eurostat, SES (earn_ses10_20) (for EL: earn_ses06_20)These figures correspond to a gender gap of 20 % on aver-age in the EU, in 2010. However, although the gap is below10 % in Slovenia and Romania, in Estonia it is highest at29 % (see Figure 4.14.).
Figure 4.14. Mean monthly earnings by gender gap in EU member states, 2010
Gender gap towards men40%Gender gap inpercent
30%
20%
20%
10%
0%SIROLUBEBGLTITMTPTPLSEFRLVHUIEESDKNLEU-27SKFICYCZDEELUKATEE
Source: Eurostat, SES (earn_ses10_20) (for EL: earn_ses06_20)
68
Gender Equality Index – Report
4.2.2. Mean equivalised incomeIn addition to pay, women also tend to have lower over-all income than men, for example, in the form of financialinvestments or social benefits. This is measured by thesecond gender indicator in the domain of money, whichexamines differences in mean equivalised income.As a gender indicator, it is imperfect, as it assumes thatincome is equally shared among household members.This is likely to seriously under-estimate the true extent ofthe gap in overall income as it ignores gender norms andpower relations that may lead to inequalities in how theallocation of income is made. In the absence of an alterna-tive measure of income, it nevertheless provides a goodproxy to determine gender gaps in income.Variable definition: Mean equivalised net income (PPS,16+ population)Mean equivalised income is calculated by dividing the totaldisposable income of a household (after direct taxes, socialinsurance contributions and other deductions made andbenefits received) among household members accordingto an equivalence scale (Eurostat, 2013).
Data source: EU-Statistics on Income and Living Conditions,Eurostat (ilc_di03)Periodicity: annualIn 2010, mean equivalised income for women was16,512 PPS and 17,367 PPS for men on average, in the EU.As shown in Figure 4.15., mean equivalised net income(in PPS) of individuals in the EU Member States varied con-siderably, and women in 2010, without exception, had alower income compared with men. Romania had the low-est income, with 4,204 and 4,270 PPS for women and menrespectively. This is to be compared with incomes morethan seven times as large in Luxembourg, with 30,222 PPSfor women and 31,627 PPS for men.
Gender Equality Index – Report
69
Figure 4.15. Mean equivalised income by sex in EU Member States, 2010
Women35,000Mean equivalised income (PPS)30,00025,00020,00015,00010,0005,0000ROBGLVLTHUEEPLSKCZPTELSIES
Men
Total
Women: 16,512
Men: 17,367
MTEU-27ITDK FI
BE
SE
IE
DEUK
NL FR CY
ATLU
Source: Eurostat, EU-SILC (ilc_di03)Overall, at EU level, the average gap between women andmen was 5 %. It reached as much as 6 % in Estonia and theUnited Kingdom, but was only of 2 % in Romania, Polandand Spain (see Figure 4.16.).
Figure 4.16. Gender gap in mean equivalised income in EU Member States, 2010
Gender gap towards men40%Gender gap inpercent
30%
20%5%10%
0%ROPLESPTHULVSIMT DKBGLTNLFRELATIEFILUCYBE SKEU-27SE DE CZITUK EE
Source: Eurostat, EU-SILC (ilc_di03)
70
Gender Equality Index – Report
4.2.3. Not-at-risk-of-povertyThe feminisation of poverty, that is women’s greater pro-pensity to be affected by poverty, is a crucial area of genderequality throughout the EU. In terms of gender equality, itis therefore pertinent to include an indicator that providesinformation on the percentage of women and men thatare not at risk of poverty.Variable definition: Not-at-Risk-of-Poverty, ≥60 % of medianincome (% 16+ population)This indicator is defined as the percentage of individualswith an equivalised disposable income (after direct taxesand social transfers) that is equal to or above the at-risk-of-poverty threshold, set at 60 % of the national medianequivalised disposable income. It is looking at the per-centage of individuals that are therefore not consideredto be at-risk-of-poverty. Although this indicator providesa measure linked to poverty, it does not provide a directassessment of poverty as a relative measure of the per-centage of individuals on low income, in comparison toother residents in that country does not necessarily imply
a low standard of living (Eurostat, 2013). Given that thecalculation of this indicator is based on dividing incomeamong household members, using an equivalised scale,it also presents shortcomings in that it may underesti-mate the true extent of the existing gender gap (head-line indicator of Europe 2020 and included within theframework of the Beijing Platform for Action indicators,see Annex 5).Data source: EU-Statistics on Income and Living Conditions,Eurostat (ilc_li02)Periodicity: annualThe difference between women and men that were not-at-risk–of-poverty in 2010, at the EU level, is small, withmen slightly more likely not to be at-risk-of-poverty thanwomen. In 2010, 83 % of women were not at-risk-of-pover-ty compared to 85 % of men. Furthermore, the proportionof both women and men were not at-risk-of-poverty hashardly changed in the period between 2000 and 2010. Thesmall scale of the difference between women and men atEU level hides some important national differences.
Figure 4.17. Individuals not-at-risk-of-poverty by sex in EU Member States, 2010
Women100%Not a risk ofpovertyinpercent80%60%Women: 84%
MenMen: 85%
Total
40%20%0%LVESLTBGELRO PTITPLUKCYEEEU-27DEIEMT DK BE FISELUSIFRATSKHUNL CZ
Source: Eurostat, EU-SILC (ilc_li02)
Gender Equality Index – Report
71
Not being at-risk-of-poverty is heavily influenced by whereindividuals are located among EU Member States. As shownin Figure 4.17., in 2010, women were slightly more likely notto be at-risk-of-poverty than men in Lithuania and Ireland,with no gender gaps in a further three Member States (HU,
LV and DK). In all other Member States, the risk of povertyworked to the detriment of women. The gap was highestin Slovenia, Bulgaria and Cyprus, where it reached a 4 per-centage point difference (see Figure 4.18.).
Figure 4.18. Gender gap in individuals not-at-risk-of-poverty in EU Member States, 2010
Gender gap towardswomenGender gaps inpercentage points40
Gender gap towards men
30
201.8
10
0LTIEHU LVDK PLSKROLUEE ESBEFIELNL MT FREU-27UKDE PTCZITATSESIBG CY
Source: Eurostat, EU-SILC (ilc_li02)
4.2.4. Income distributionPoverty is one facet of the lack of equality in society interms of income distribution. The second gender indicator,used in the sub-domain of economic situation, focuses ondifferences between the wealthiest and poorest womenand men in society. As above, this indicator is calculatedon the basis of mean equivalised income, and may there-fore underestimate the true extent of gender gaps in in-come distribution.Variable definition: S20/S80 income quintile share (totalpopulation)This indicator is a reversal of the income quintile share ra-tio (S80/S20), and also provides a measure of differencesin income distribution. The original indicator (S80/S20) isobtained by dividing the total income received by the topquintile (the 20 % of women and men that receive the mostincome) by the total income of the bottom quintile (the
20 % of women and men that receive the least income)(Eurostat, 2013). As indicators need to provide a measure ofequality, rather than difference, the indicator is reversed bytaking the ratio S20/S80 before inclusion in the Index.Data source: EU-Statistics on Income and Living Conditions,Eurostat (ilc_di11)Periodicity: annualIncome distribution tended to be slightly more equalamong women than men overall, with on average inthe EU-27, the bottom quintile of men receiving 20.0 %of the income of the top quintile, compared with 20.4 %for women. Income distribution throughout the EU-27 ranged from the poorest quintile of women re-ceiving 15 % of the income of the richest women inSpain, to 30 % in Hungary. Corresponding figures formen ranged from 12 % in Lithuania to 29 % in Slovenia(see Figure 4.19.).
72
Gender Equality Index – Report
Figure 4.19. Income distribution (S20/S80) ratio of the bottom and top quintiles by sex inEU Member States, 2010
WomenIncomedistribution rate (S20/S80) (%)100%80%60%Women: 20.4%
Men
Total
Men: 20.0%
40%20%0%LTESLVROBGELPTUKIEITEEEU-27PLDEFR DK CY MTLUBESK ATNLFICZSEHUSI
Source: Eurostat, EU-SILC (ilc_di11)Gender gaps in income distribution were practically non-existent on average at EU level in 2010. However, acrossMember States, there was more heterogeneity in gen-der gaps. In Latvia and Lithuania, for example, incomeequality was higher among women than men, with overtwo percentage point difference. However, in Cyprus, theopposite was true, with slightly lower income equalityamong women than men (1.5 pp).
Figure 4.20. Income distribution (S20/S80) ratio of the bottom and top quintiles by sexin EU Member States, 2010
Gender gap towardswomenGender gap inpercentage points40
Gender gap towards men
30
200.4
10
0LTLVDK SKEE LUHUFIUKIEDE PLESEU-27PT ROEL ITFR MTBE SEATNLCZSIBG CY
Source: Eurostat, EU-SILC (ilc_di11)
Gender Equality Index – Report
73
4.2.5. SummaryUnequivocally, a gender analysis of gender gaps in the do-main ofmoneyshows that women are, with few exceptions,disadvantaged compared to men. In 2010, throughout theEU-27, women earned less than men, with progress in clos-ing the gender gap painstakingly slow. Across EU MemberStates, mean equivalised disposable income was also lowerfor women than for men. As a result, women on averagewere more likely than men to be at-risk-of-poverty. Finally,income inequalities were sightly more pronounced amongmen than women in the majority of Member States.The domain ofmoneyshowed the more precarious situ-ation of women throughout the EU in terms of acquiredfinancial resources and as a result their economic situa-tion. However, caution should be exercised in analysinggender indicators which calculations are based on equiv-alised income as they are measured at household leveland are likely to underestimate the true extent of thegender gap. This underestimation is largely due to thefact that the calculation assumes that income is sharedequally among all members of the household, therebyignoring possible gender and power relations that mayresult in further disparities in the allocation of income.However, in the absence of a more suitable measure,these gender indicators provide a pertinent assessmentof gender gaps in the domain ofmoney.
4.3. KnowledgeThe domain ofknowledgeexamines differences betweenwomen and men in education and training. This includesensuring equal access and attainment, eliminating gendersegregation in education fields and promoting lifelonglearning for both women and men. In line with the resultsof the multivariate analysis (Section 3), indicators for educa-tional attainment and segregation have been merged intoone sub-domain (see Table 4.3.).This combination is not surprising, because notwithstand-ing differences between the two concepts, they are highlyinter-related. It is measured by two cross-sectional genderindicators that examine the percentage of women and menthat have attained a tertiary level of education and segrega-tion in educational fields. The second sub-domain matchesthe conceptual framework and covers the area of lifelonglearning. It is measured by an indicator looking at participa-tion in formal or non-formal education and training.
Table 4.3. Measurement framework for the domain of knowledgeMeasurementframeworkConceptmeasured
Indicator
Source
TertiaryeducationEducational attainmentand segregationSegregation
Graduates of tertiary education(% 15–74 population)
Eurostat – Structureof Earnings Survey
Tertiary students in the fields of Education,Health and Welfare, Humanities and Arts(ISCED 5–6) (% tertiary students)People participating in formal or non-formaleducation and training (% 15–74 population)
Eurostat – UNESCO/OECD/Eurostat(UOE) questionnaireson Educational StatisticsEurostat – EU LabourForce Survey
Lifelong learning
Lifelonglearning
74
Gender Equality Index – Report
4.3.1. Tertiary educationThe gender gaps present in tertiary education are complex,and important to monitor, given that they are indicators ofa change in society, with women now outnumbering menamong university graduates.Variable definition: Graduates of tertiary education (% 15–74 population)This indicator measures educational attainment, defined asthe percentage of people aged 15–74 that have attaineda given educational level, as measured by InternationalStandard Classification of Education (ISCED) (Eurostat, 2013).This indicator focuses on educational attainment for ISCEDlevels 5 and 6, which represents those who have achievedthe first or second stage of tertiary education (Eurostat,
2013) (corresponds to Europe 2020 headline indicators,see Annex 5).Data source: EU(edat_lfs_9903)Periodicity: annualThe percentage of women and men at EU level who haveattained tertiary level education has increased markedly inthe space of a decade. In 2000, 15 % of women and 17 %of men had reached tertiary education, compared with22 % and 21 % in 2010 respectively. The attainment rate forwomen in 2000 was 2 percentage points lower than thatof men; however, since 2008, there has been a reversal inthe gender gap leading to a rate for men that is, in 2010,1 percentage point lower than that of women’s.LabourForceSurvey,Eurostat
Figure 4.21. Population having attained first and second stage of tertiary education(levels 5 and 6 ISCED) by sex in EU Member States, 2010
WomenEducationalattainment inpercent100%80%Women: 22%
Men
Total
60%40%20%0%ROITMT PTCZSKATHU
Men: 21%
BG PL
EL
SIEU-27LVDE FRLT
ES
DK NL
SE
LU
BEEE
CY
FI
UK
IE
Source: Eurostat, LFS (edat_lfs_9903)
Gender Equality Index – Report
75
The EU level analysis masks some wide gender differencesat member states level. In 2010, as few as 11 % of womenreached tertiary level education in Romania and 10 % ofmen in Portugal. Fewer than one in six women reachedthis level in Austria, the Czech Republic, Malta, Romania,Slovakia, Portugal and Italy. The situation was mirrored formen in the Czech Republic, Malta, Romania, Italy, Slovakia,Hungary, Portugal and Bulgaria, showing a clear imbalance
for men in terms of educational attainment. The gendergap reaches 7 percentage points towards men in Germany(26 % for men; 19 % for women) and Luxembourg (32 %;25 %). However, in most Member States, the gender gapoperates to the detriment of men with a gap as wide as14 percentage points in Estonia (36 % for women; 22 %for men) or nearly 10 percentage points in Latvia (26 % forwomen; 17 % for men) (see Figure 4.21. and Figure 4.22.).
Figure 4.22. Gender gap in population having attained first and second stage of tertiary education(levels 5 and 6 ISCED) in EU Member States, 2010
Gender gap towardswomenGender gap inpercentage points40
Gender gap towards men
30
200.7
10
0EELVLTFISEBGSIIEPLPTDK CYBEHUFR SKITES UKMTEU-27ROELCZ NLATLUDE
Source: Eurostat, LFS (edat_lfs_9903)
4.3.2. SegregationPatterns of segregation in educational fields remain verywidespread in the EU, with some very strong under andover-representations in some disciplines. Consequences ofthese patterns include greater gender gaps in labour mar-ket segregation, as well as pay.Variable definition: Tertiary students in the fields ofEdu-cation, Health and welfare, Humanities and arts(ISCED 5–6)(% tertiary students)This variable refers to students who are attending the firstand second stage of tertiary education by field of educa-tion, following the International Standard Classification ofEducation – ISCED (Eurostat, 2013). It takes into accountparticipation in the most feminised fields in 2010, whichinclude health and welfare, as well as teacher training andeducation science (headline indicator of Europe 2020, seeAnnex 5).
Data source: UNESCO/OECD/Eurostat (UOE) questionnaireson educational statistics, Eurostat (educ_enrl5)Periodicity: annualAn analysis of gender representation of these fields is tell-ing. In the EU-27 in 2010, women were over-representedin the educational fields ofeducation(77 %) orHealth andwelfare(74 %) (see Figure 4.23.). In all Member States, withthe exception of Greece, women represented over 70 %of students enrolled in the field ofEducation(as much as92 % in both EE and IT, 93 % in RO), and without excep-tion represent well above 60 % of students enrolled in thefields ofHealth and welfare(up to 88 % in EE). See Annex 7for detailed figures of participation in educational fields atMember State level.
76
Gender Equality Index – Report
On the contrary, at EU level in 2010, women were greatlyunder-represented in the field ofEngineering, manufac-turing and construction(25 %). Across Member States, wom-en usually represented much less than a third of studentsenrolled inEngineering, manufacturing and construction(as low as 16 % in IE). Although women represented 38 %of those studying in the field ofScience, mathematics and
computingin 2010, on average in the EU-27, an analysis atMember State level shows a more nuanced picture. Wom-en were greatly under-represented in some Member States,such as the Netherlands (20 %) or Belgium (29 %), however,differences are small or inexistent in other Member States,including Sweden (42 %), Portugal (46 %), Bulgaria (47 %),Malta (47 %), Italy (52 %) or Romania (53 %).
Figure 4.23. Tertiary students (ISCED 5–6) by field of education and sex in EU-27, 2010
Women
Men
Engineering,manufacturing andconstructionScience, mathematics andcomputingServicesAgriculture and veterinarySocial sciences, business and lawHumanitiesand artsHealthandwelfareTeachertraining and education science0%20%40%60%80%100%
Source: Eurostat, Education Statistics (educ_enrl5)The gender indicator used to compute the Gender Equal-ity Index consists of measuring gender gaps between thethree most feminised educational sectors, namelyTeach-er training and education science, Health and welfare, andHumanities and arts.On average, throughout the EU-27, in2010, the participation rate of women in these fields wasdouble that of men, with 44 % and 22 % participationrespectively. Although only 20 % of women were involvedin those fields in Romania, in other Member States partici-pation concerned more than half of women, including inFinland (50 %), Ireland (50 %), the Netherlands (51 %), theUnited Kingdom (53 %), Belgium (53 %), Germany (54 %),Sweden (54 %) and Denmark (58 %). Men’s participation inthese educational sectors never exceeded a third, rangingbetween 12 % in Latvia and Romania and 31 % in Malta(see Figure 4.24.).
Gender Equality Index – Report
77
Figure 4.24. Participation in the educational fields ofTeacher training and education science, Healthand welfare, Humanities and artsby sex in EU Member States, 2010
Women100%80%
Men
Total
Participation inpercent
Women: 44%60%40%20%
Men: 22%
0%RO BGSILVCYHUELLTEEPLPTITCZ FR ATLUEU-27ESFISKIENLDEMT BEUKSE DK
Source: Eurostat, Education Statistics (educ_enrl5)Gender gaps in educational fields of studies across Mem-ber States, were by construction of the indicator, always to-wards women. The relevant and important information istherefore that of the width of this gender gap. At EU levelin 2010, the difference in participation in these fields was22 percentage points. Figure 4.25. shows that across Mem-ber States, gender gaps were as small as 9 or 11 percent-age points in Romania and Bulgaria respectively, with thebiggest gaps above 30 percentage points in Germany orFinland.
Figure 4.25. Gender gap in participation in the educational fields of Teacher training and education science,Health and welfare, Humanities and Arts in EU Member States, 2010.
Gender gap towardswomenGender gap inpercentage points4022.1
30
20
10
0FIDE DKEENLIESEUKCZBE SKPTCYESEU-27ATLVFRLULTITPLELSIMTHUBG RO
Source: Eurostat, Education Statistics (educ_enrl5)
78
Gender Equality Index – Report
4.3.3. Formal and non-formal educationand trainingLifelong learning is a key driver of economic participationand social inclusion, following on from initial educationand training. From a gender perspective, it is importantas it contributes to greater gender equality in economicparticipation, access to economic resources and empower-ment (UNECE, 2013).Variable definition: People participating in formal or non-formal education and training (% 25–64 population)This indicator considers women and men’s participation informal or non-formal education and training. As this indi-cator relates to persons aged 25 to 64, it predominantly re-lates to the learning that takes place after an initial periodof formal education.
Data source: Labour Force Survey, Eurostat (trng_lfs_09)Periodicity: annualInvolvement in formal and non-formal learning suggeststhat a large proportion of Member States do not meet theEurope 2020 target of 15 % of adults (aged 25 to 64) partici-pating in lifelong learning.In 2010, an average of 17 % of women and 16 % of menparticipated in formal or non-formal education andtraining in the EU-27. Participation was highest in the Nordiccountries, including 39 % of individuals in Denmark (45 % ofwomen and 33 % of men), 30 % in Sweden (36 % of womenand 25 % of men) and 29 % in Finland (33 % of women and26 % of men). However, participation remained below 15 %for women and men respectively, in 10 Member States (BG,RO, EL, HU, PT, SK, MT, IT, LV and IE) (see Figure 4.26.).
Figure 4.26. Participation in formal or non-formal education and training by sex in EU Member States, 2010
WomenParticipation in life-long learning inpercent100%80%60%40%20%
Men
Total
Women: 17%
Men: 16%
0%
BG RO
EL HU
PT
SK
MT
IT
LV
IE
BE
CY
FRLT
CZ
DE
PLESEU-27ATLU
EE
SI
UK
NL
FI
SE DK
Source: Eurostat, LFS (trng_lfs_09)For the majority of Member States, in 2010, the gender gapwas small or non-existent, particularly where participa-tion was lowest. Higher participation therefore coincidedwith larger gender gaps, with a disproportionately greaternumber of women in Finland (7 percentage points), Swe-den (11 percentage points) and Denmark (12 percentagepoints) (see Figure 4.27.).
Gender Equality Index – Report
79
Figure 4.27. Gender gap in participation in formal or non-formal education and training in EU Member States, 2010
Gender gap towardswomenGender gap inpercentage points40
Gender gap towards men
30
201.4
10
0DKSEFIUKSIEEATLV ESEU-27PLITNL SKFRIECYLUBE CZMT BGELRO DEHU LTPT
Source: Eurostat, LFS (trng_lfs_09)
4.3.4. SummaryThe majority of gaps in other domains act to the detrimentof women; however, in knowledge the situation is morenuanced. Participation rates in tertiary education havereversed, and men have now become a minority. This isbound to have implications for the labour market and theeconomy and society in general, in the long run. It is cru-cial to begin to think about what this reversal in trends willmean for the gender equality landscape of the future.What remain largely unchanged are the gender-basedpatterns of segregation throughout Member States, withgreater under-representation of women and men in cer-tain fields, such as education for men or engineering, man-ufacturing and construction for women. It is important tomonitor segregation, given that it translates into genderinequality patterns at the level of labour market participa-tion and society more generally.Finally, there is very uneven participation in lifelong lear-ning across the EU-27. As identified by the strategic frame-work for European cooperation in education and train-ing (ET 2020), lifelong learning needs to be priority, as itcontributes greatly to employment, economic successand the full participation of women and men in society.However, in the majority of Member States, only a minorityof women and men participated in learning and training.In the few Member States where participation is higher,gender gaps indicate that this is disproportionatelywomen who do so.
4.4. TimeThe domain oftimeattempts to capture the genderednature of the allocation of the time spent betweeneco-nomic, careandsocial activities.It is important from a gen-der perspective, given the imperative to ensure a betterintegration of work and life for women and men. It shouldbe noted that there exists a strong trade-off between alltypes of activities (Miranda, 2011), meaning that measuringtwo types of activities is itself indicative of how individu-als divide their time. Furthermore, as some gender indica-tors already measure aspects of participation in the labourmarket, in the domain ofwork,no further gender indica-tors have been adopted for the sub-domain of economicactivities.The domain of time is therefore measured by two sub-domains (see Table 5). The first sub-domain, care activi-ties, considers gaps between women and men workers’involvement in caring and educating their children orgrandchildren, as well as their involvement in cooking andhousework. As for the sub-domain looking at social activi-ties it measures gender gaps in involvement in sporting,cultural or leisure activities, combined with involvement involunteering and charitable activities.
80
Gender Equality Index – Report
Table 4.5. Measurement framework of the domain of timeMeasurementframeworkConceptmeasuredChildcareactivitiesCare activitiesDomesticactivitiesSport, cultureand leisureactivitiesSocial activitiesVolunteeringand charitableactivitiesWorkers involved in voluntary or charitableactivities, at least once a month (% 15+ workers)Eurofound – European WorkingConditions SurveyWorkers doing cooking and housework,everyday for one hour or more (% 15+ workers)Workers doing sporting, cultural or leisureactivities outside of their home, at least everyother day (% 15+ workers)Eurofound – European WorkingConditions Survey
IndicatorWorkers caring for and educating theirchildren or grandchildren, everyday forone hour or more (% 15+ workers)
Source
Eurofound – European WorkingConditions Survey
Eurofound – European WorkingConditions Survey
4.4.1. Care and education ofchildrenand/or grandchildrenDifferences between women and men in the distributionof care activities (Eurofound, 2012), as dictated by genderroles, remain prevalent and have been repeatedly linkedto the lack of progress made in terms of achieving greatergender equality (Esplen, 2009). The second gender indica-tor used in measuring gaps in care activities examines theinvolvement of women and men in the care and educa-tion of children and/or grandchildren, every day for anhour or more.Variable definition: Workers caring for and educating theirchildren or grandchildren, every day for one hour or more(% 15+ workers)
This indicator measures women and men workers’ involve-ment in activities of caring and educating children outsideof their work, every day for one hour or more (Eurofound,2012).Data source: European Working Conditions Survey, Euro-found.Periodicity: every five yearsThere were important differences in the involvement ofwomen and men in the care and education of childrenand/or grandchildren in 2010, with an EU average of 41 %for women and 25 % for men. Men’s involvement rangedfrom 12 % in Bulgaria to a maximum of 42 % in Denmark.For women, involvement ranged from 25 % in Finland to55 % in Cyprus (see Figure 4.28.).
Gender Equality Index – Report
81
Figure 4.28. Involvement in thecareand education ofchildrenand/or grandchildrenevery day for an hour or more by sex in EU Member States, 2010
Women100%80%60%Women: 41%
Men
Total
Participation inpercent
Men: 25%
40%20%
0%
BG
FI
PL
EL
DE
AT
CZ
SE
ROUK
SKLTEU-27FRIEMT CY
LU
ES
SI
ITBE
PTHU LV
DK
EE
NL
Source: Eurofound, EWCSThe data shows clearly that women remained dispro-portionately responsible for the care and education ofchildren and grandchildren with an average percentagepoint difference of 16, in the EU-27, in 2010. Although thegender gap was relatively small in some Member States,with a 4 percentage point difference in Denmark,Finland and Sweden, in other countries important gendergaps prevailed. Differences were most important in theCzech Republic, Slovakia, Greece, Romania and Cyprus(see Figure 4.29.).
Figure 4.29. Gender gap in involvement in thecareand education ofchildrenand/or grandchildren,every day for an hour or more in EU Member States, 2010
Gender gap towardswomenGender gap inpercentage points40
30
16.1
20
10
0CYROELSKCZESLUSIBELTATPLFR PTITBGEU-27UK IEMTEENLLV HUDEDK FISE
Source: Eurofound, EWCS
82
Gender Equality Index – Report
4.4.2. Cooking and houseworkWide differences between women and men exist in termsof time spent on domestic tasks, such as cooking andhousework. It is an important area to monitor as it is linkedto gender roles in society (Sironi and Mencarini, 2009).Variable definition: Workers doing cooking and housework,every day for one hour or more (%15+ workers)This indicator measures women and men workers’ involve-ment in cooking and housework activities, every day forone hour or more (Eurofound, 2012).
Data source: European Working Conditions Survey, Eurofound.Periodicity: every five yearsThe mean hours per day spent on cooking and houseworkacross the EU-27 Member States, in 2010, ranged betweenjust over half an hour for men and nearly two hours forwomen (see Figure 4.30.). Differences between women andmen are manifest: women spend more than two hours onaverage on cooking and housework, in 10 Member States(SI, RO, UK, NL, PL, PT, IE, ES, CY and MT). However, althoughmen in Sweden spend just over an hour on these activities,in all other Member States, the average number of hours isbelow one, reaching less than half an hour in 10 MemberStates (EL, BG, IT, SK, RO, CY, MT, AT, CZ and HU).
Figure 4.30. Involvement incookingand housework, every day for an hour or more,by sex in EU Member States, 2010Women100%80%60%MenWomen: 77%
TotalMen: 24%
Participation inpercent
40%20%
0%
SK
MT CZ
EL
IT
BG
RO PL
HUCY AT FR
LUDEEU-27SI BE
PT
LT
NL
FI
IE
ES
DKUK
SE
EE LV
Source: Eurofound, EWCSWomen spent a greater number of hours per day on cook-ing and housework across all Member States. On average,throughout the EU-27, in 2010, women spent 1.3 additionalhours daily compared with men. This gender gap wassmallest, below one hour, in Estonia, Latvia, Denmark, Fin-land and Sweden; however, it reached over two hours inMalta (see Figure 4.31.).
Gender Equality Index – Report
83
Figure 4.31. Gender gap in Involvement in thecookingand housework,every day for an hour or more in EU Member States, 2010
Gender gap towardswomenGender gap inpercentage points8052.960
40
20
0PTELCYLTITRODE BG SIPLATHUSKEU-27CZ FRESMTLUBEUKNLIELVEEFI DK SE
Source: Eurofound, EWCS
4.4.3 Sporting,culturalor leisureactivitiesGiven women’s disproportionate responsibilities for careactivities, along with an increased feminisation of the la-bour market, it is important to measure gender gaps insome of the remaining time in the life of women and men.One aspect of social activities is measured with a genderindicator, examining participation of women and men insporting, cultural or leisure activities on a regular basis.Variable definition: Workers doing sporting, cultural or lei-sure activities outside of their home, at least every otherday (%15+ workers)This variable collects information on the level of workers’involvement in activities of sporting, culture or leisure out-
side of their home and work, every second day for more orless than one hour (Eurofound, 2012).Data source: European Working Conditions Survey, Euro-foundPeriodicity: every five yearsThe percentage of individuals in sporting, cultural or lei-sure activities at least every other day varies significantlythroughout the EU. This percentage was lowest in Roma-nia (1 % and 3 % for women and men respectively) andmarkedly high in Finland (38 % and 39 % respectively), withan average of 11 % of women and 14 % of men throughoutEurope, in 2010 (see Figure 4.32.).
84
Gender Equality Index – Report
Figure 4.32. Involvement in sporting,culturalor leisure activities at leastevery other day by sex in EU Member States, 2010
Women100%Participation inpercent80%60%
Men
Total
Women: 9%
Men: 12%
40%20%0%
RO
SK
PT BGHU EL
LVCY
PL
LT
DE CZ
AT
ESITEU-27FR
UKBEEEMT DK NL
SI
LUSE
IE
FI
Source: Eurofound, EWCSIn all EU Member States except Hungary, women’s partici-pation in sporting, cultural or leisure activities were lowerthan those of men’s in 2010. In six Member States (MT, LT,CZ, CY, LV and RO), men’s participation was over doublethe participation rate of women. Nevertheless, the biggestgender gaps were recorded in Malta, Estonia, Belgium (seeFigure 4.33.).
Figure 4.33. Gender gap in involvement in sporting,culturalor leisure activities at leastevery other day in EU Member States, 2010
Gender gap inpercentage points
403020
Gender gap towardswomen
Gender gap towards men
2.9
100HUNL DESKFIELATLURO SIPTEU-27BGIT
DKSE PLES UKFRLTIECY
LVCZ BE
EEMT
Source: Eurofound, EWCS
Gender Equality Index – Report
85
4.4. Voluntary orcharitableactivitiesThe focus on social activities also encompasses time spenton voluntary or charitable activities. This area has beenidentified as important in gender terms because voluntaryor charitable activities can be constructed as an extensionof women’s responsibility for caring activities (Neysmithand Reitsma-Street, 2000). The second gender indicatorused measures differences between women and men’sinvolvement in activities, other than in the care and eco-nomic spheres, is that of involvement in voluntary or chari-table activities.Variable definition: Workers involved in voluntary or chari-table activities, at least once a month (% 15+ workers)This variable collects information on the level of workers’involvement in voluntary or charitable activities outside oftheir work for at least once a month (Eurofound, 2012).
Data source: European Working Conditions Survey, Euro-found.Periodicity: every five yearsThe participation rate of women and men in voluntary andcharitable activities, at least once a month, varied greatlythroughout Member States, in 2010, with an average of15 % for women and 14 % for men overall in the EU-27. Theparticipation rates in voluntary and charitable activities fellbelow one in 10 in a significant number of Member States(PT, SK, EL, LT, BG, PL, ES, RO, CZ, LV and CY), with more sim-ilarities than differences between women and men. At theother extreme, in the Netherlands, more than one in threewere involved in these activities at least once a month,with 38 % of women and 34 % of men (see Figure 4.34.).
Figure 4.34. Involvement in a voluntary orcharitableactivity, at least once a month,by sex in EU Member States, 2010
Women100%Participation inpercent80%60%
Men
Total
Women: 15%
Men: 14%
40%20%0%
PT
SK
EL
LTBG PL
ES
CZ RO
LVCY
IT
HUMTUKFREU-27EE
BE
IE
FI
LU
SI
DK DE
SE AT
NL
Source: Eurofound, EWCSGender gaps in involvement in a voluntary or charitableactivity, at least once a month, were usually low or inexist-ent in 2010, with no difference on average in the EU-27.The gender gap was widest towards women in Hungaryand Luxembourg, and towards men in Sweden, Austria andSlovenia, showing that despite the perceived idea that vol-untary and charitable activities are more of a woman’s ac-tivity, this is not supported by the data (see Figure 4.35.).
86
Gender Equality Index – Report
Figure 4.35. Gender gap in involvement in a voluntary orcharitableactivity,at least once a month, in EU Member States, 201040
Gender gap towardswomen
Gender gap towards men
Gender gap inpercentage points
30
20
10
0.3
0HULUSKNLIEUKMTEEITELPTBEESCZBGLVEU-27FIPLLTDEDK ROCYFRSEATSI
Source: Eurofound, EWCS
4.4.5 SummaryThe amount of time spent by women and men in the EU-27, in activities other than economic, show strong differ-ences by sex. In 2010, men were more likely than women,in all Member States but one, to participate in sporting,cultural or leisure activities on a regular basis. The situationwas more divided when it came to involvement in volun-tary or charitable activities, as although inexistent in someMember States, in others gender gaps existed towardsboth women and men.This domain highlights the core of the division betweenwomen and men in the EU-27: the wide gender gap inactivities related to care. Throughout all Member States, itwas women that performed the bulk of these caring activi-ties, with extremely wide gender gaps between the timespent on caring and educating children and grandchildren,as well as time spent on cooking and housework.
4.5. PowerThe domain ofpowerfocuses on the representation ofwomen and men in decision-making positions, as there is ageneral consensus that greater gender balance in positionsof power will have a positive effect on gender equality.At the conceptual level, three sub-domains of decision-making power were identified:political, socialandecono-mic.Unfortunately, as the sub-domain of social power isnot well covered by gender indicators, the domain of pow-er is limited to only measure political and economic powerthrough participation at a decision-making level.The first sub-domain, political power, is measured bythree gender indicators that examine representation inministers, parliaments and regional assemblies. The othersub-domain, economic power, focuses on the share ofwomen and men on the boards of national largest quotedcompanies, in conjunction with the share of women andmen members of all key decision-making bodies in centralbanks across Member States.
Gender Equality Index – Report
87
Table 4.6. Measurement framework for the domain of powerMeasurementframeworkConceptmeasured
Indicator
Source
Ministerialrepresentation
Share of Ministers (%, 18+ population)
EC-DG Justice – Women andMen in Decision Making
Political
Parliamentaryrepresentation
Share of members of Parliament(%, 18+ population)
EC-DG Justice – Women andMen in Decision Making
Regionalassembliesrepresentation
Share of members of Regional Assemblies(%, 18+ population)
EC-DG Justice – Women andMen in Decision Making
Members ofboardsEconomicMembers ofcentral banks
Share of members of boards in largest quotedcompanies, supervisory board or boardof directors (%, 18+ population)
EC-DG Justice – Women andMen in Decision Making
Share of members in all key decision-makingbodies in Central Bank (%, 18+ population)
EC-DG Justice – Women andMen in Decision Making
4.5.1. MinistriesThe first gender indicator that measures political powermeasures high level representation, with a gender indicatorthat examines women’s and men’s share of ministerial posts.Variable definition: Share of Ministers (%)This indicator relies on the share of women and menministers in national governments. The positions coveredare senior ministers: members of the government whohave a seat on the cabinet or council of ministers andjunior ministers: members of the government who donot have a seat on the cabinet (EC, 2013) (Included within
the framework of the Beijing Platform for Action indicators,see Annex 5).Data source: Database on ‘Women & Men in Decision-Making’, DG Justice, European Commission (1st quarter 2010)Periodicity: quarterlyAt EU level, the representation of women at ministerial levelremained relatively stable between 2000 and 2010, with an av-erage of 24 % of women. At national level, in 2010, there wereimportant differences, ranging from no representation what-soever in Hungary and near parity or full parity in Sweden(45 %), Denmark (47 %) and Finland (52 %) (see Figure 4.36.).
88
Gender Equality Index – Report
Figure 4.36. Ministers by sex in EU Member States, 2010
Women100%80%60%75%
Men
40%20%0%FIDK SEESATFRNLSIUKBG DELU25%
EU-27EL LVBE
LTPL PT SK
IT
CY
CZ
IE
MTEE
RO
HU
Source: European Commission’s database ‘Women & Men in Decision-Making’
4.5.2. ParliamentsThe second indicator that measures political power exam-ines gender gap in the representation of women and menin national parliaments.Variable definition: Share of members of Parliament (%)This indicator provides data on the share of women andmen member of national parliaments. The count includesthe President, members of upper and lower houses and sin-gle houses. Where a Parliament has two houses, lower andupper, members of both houses are taken into considera-tion when available (European Commission, 2013) (Includedwithin the framework of the Beijing Platform for Action indi-cators, see Annex 5).
Data source: Database on ‘Women & Men in Decision-Making’, DG Justice, European Commission (1st quarter, 2010)Periodicity: quarterlyIn 2010, the average representation of women as mem-bers of parliament in the EU was just under a quarterof members (23 %). Women remained greatly under-represented in all Member States, except for Finland, andSweden where the percentage of women reached 40 %,and 47 % respectively of members of parliament. At theother extreme, in Malta, the representation of womenas members of parliament accounted for only 9 % (seeFigure 4.37.).
Gender Equality Index – Report
89
Figure 4.37. Members of parliaments by sex in EU Member States, 2010
Women100%80%60%40%20%23%
Men
77%
0%SEFIBENL DKESDE PT ATEU-27EEBGLVFRITLU UK LTCZ PLSKELIECYHUSI RO MT
Source: European Commission’s database ‘Women & Men in Decision-Making’
4.5.3. Regional assembliesThe third gender indicator to measure the representationof women and men in political decision-making measuresthe share of seats between women and men at the levelof regional assemblies.Variable definition: Share of members of regionalassemblies (%)This indicator measures the share of women and menmembers of regional assemblies. Although regional au-thorities are situated between the central governmentand local authorities, this does not necessarily imply ahierarchical relationship between regional and local. Inaddition, regional authorities are not applicable in allcountries (EC, 2013). In those cases the data on local andmunicipal members, including mayors and other leaders,
were taken (BG, EE, IE, CY, LT, LU, MT and SI) (Includedwithin the framework of the Beijing Plaform for Actionindicators, see Annex 5).Data source: Database on ‘Women & Men in Decision-Making’, DG Justice, European CommissionPeriodicity: annual except in the case of elections whenthe data for affected regions are updated with the nextquarterly update of political data.The representation of women at EU level in regional as-semblies increased steadily from 22 % to 30 % between2000 and 2010. At national level, this figure also masksdifferences. The representation of women in regionalassemblies ranges from just above one in 10 women inItaly (12 %) to near parity in Sweden (47 %) and France(48 %) (see Figure 4.38.).
90
Gender Equality Index – Report
Figure 4.38. Members of regional assemblies by sex in EU Member States, 2010
Women100%80%60%40%20%0%30%
Men
70%
FR
SE
ES
FI
BE
DK
NL DE
AT
UKEU-27EEBG
LT
MT
PT
SI
LU
EL
LV
CY
PL
CZ
IE
RO
SK
HU
IT
Source: European Commission’s database ‘Women & Men in Decision-Making’
4.5.4. Members of the boards of largestquotedcompaniesThe first gender indicator used to measure power throughrepresentation in decision-making in economic activitieslooks at the largest quoted companies at national level.Variable definition: Share of members of boards in larg-est quoted companies (supervisory board or board ofdirectors) (%).This indicator measures the share of women and men asboard members (including chairpersons) in the largestpublicly listed companies (traded on the stock exchange)at the national level.
Data source: Database on ‘Women & Men in Decision-Making’, DG Justice, European CommissionPeriodicity: annualThe representation of women on the boards of quotedcompanies increased from 9 % in 2000, to 12 % in 2010,representing a relatively small increase. Only five Mem-ber States (FI, SE, LV, RO and SK) had more than 20 %of women as members of the largest quoted compa-nies. In addition, a further five Member States had lessthan 5 % representation (CY, IT, LU, MT and PT) in 2010(see Figure 4.39.).
Gender Equality Index – Report
91
Figure 4.39. Members of the boards of the largest quotedcompaniesby sex in EU Member States, 2010
Women100%80%60%40%20%0%12%88%
Men
FI
SE
LV
SK
RO DK NLHU
DE
LT
UKCZEU-27FR
PL
BG BE
ES
SI
AT
IE
EE
EL IT
PT CY
LUMT
Source: European Commission’s database ‘Women & Men in Decision-Making’
4.5.5. Members ofcentralbanksThe second gender indicator used to measureeconomicpowerlooks at the representational distribution of womenand men as members of central banks.Variable definition: Share of members in all key decision-making bodies in Central Bank (%).This indicator measures the share of women and men inall key decision-making bodies in central banks, includingthe head governor (included within the framework of theBeijing Plaform for Action indicators, see Annex 5).
Data source: Database on ‘Women & Men in Decision-Making’, DG Justice, European CommissionPeriodicity: annualThe number of women members of central banks declinedslightly from 21 % in 2000, to 18 % in 2010, on average atthe EU-27 level. Across Member States, the proportionof women represented in central banks, in 2010, rangedfrom none (AT, CY, LT and LU) to more than the criti-cal mass of 30 % in other Member States (FR, FI and SE)(see Figure 4.40.).
Figure 4.40. Members of thecentralbank by sex in EU Member States, 2010Women100%80%60%40%20%18%82%
Men
0%
SE
FI
FR
DK
HU
NL PL
BE
LV
ES
LT
SI
EEEU-27PT
IE
BGCZ SK ROUKMTEL IT
AT
CY
DELU
Source: European Commission’s database ‘Women & Men in Decision-Making’
92
Gender Equality Index – Report
4.5.6. SummaryWomen, compared with men, are grossly under-repre-sented in some parts of political and economic decision-making. The level of representation of women in politicalspheres, although already low with less than a third atregional level, decreases even further in parliaments andministries (included within the framework of the BeijingPlatform for Action Indicators, see Annex 5).Although there is a dearth of representation of women inthe political sphere, this is even more pronounced in theeconomic sphere. Women are greatly under-representedamong board members of the largest quoted companiesand among members of central banks in the vast majorityof Member States.Addressing these democratic and economic gaps are cru-cial to ensure that gender equality is an issue seriouslyaddressed throughout policy in Member States and thatboth women and men are involved in the recovery follow-ing the current crisis.
4.6. HealthThe final core domain examines issues related to genderandhealth.Conceptually, it includes three critical areas:health status, health behaviours and access to health struc-tures.Because of constraints of data availability, it is only possi-ble to measure two sub-domains out of three indicated inthe conceptual framework. Notably, as variables related tohealth behaviours are not disaggregated by sex, the secondsub-domain is not measured. The gender indicators se-lected are thus divided into the first and third sub-domain.For health status, the gender indicators selected measuregender gaps in self-perceived health, life expectancy andhealthy life years. As for access to health structures, the se-lected indicators examine gender gaps in unmet medical,as well as dental needs.
Gender Equality Index – Report
93
Table 4.7. Measurement framework for the domain of healthMeasurementframeworkConceptmeasuredSelf-perceivedhealth
Indicator
Source
Self-perceived health, good or very good(% 16+ population)Life expectancy in absolutevalue at birth (years)
Eurostat –EU Statistics onIncome and Living ConditionsEurostat –demographicstatisticsEurostat – EU Statisticson Income and Living Conditionscombined with Eurostat’sdemographic statistics
Life expectancy
Status
Healthylife years
Healthy life years in absolutevalue at birth (years)
Access
Unmet medicalneeds
Population without unmet needs formedical examination (% 16+ population)
Eurostat – EU Statistics onIncome and Living Conditions
Unmet dentalneeds
Population without unmet needs for dentalexamination (% 16+ population)
Eurostat – EU Statistics onIncome and Living Conditions
4.6.1. Self-perceived healthThe first gender indicator used to measure health status isself-perceived health.Variable definition: Self-perceived health, good or verygood (% 16+ population)This indicator focuses on self-perceived health, based onan auto-evaluation that excludes any temporary healthproblem. It is a subjective measure, which although is in-fluenced by impressions or opinions from others, providesan account of a woman or man’s assessment of their healthrelative to their own beliefs and attitudes (Eurostat, 2013).The categories considered are ‘good’ and ‘very good’.Data source: EU-Statistics on Income and Living Conditions,Eurostat (hlth_silc_01)Periodicity: annual
Average self-perceived health throughout the EU-27 wasrelatively high in 2010, at 66 % for women and 71 % for men,having increased between 2005 and 2010, by 5 percentagepoint for women (up from 61 % in 2005) and 4 percentagepoints for men (up from 67 % in 2005).At national level, there were however vast differencesbetween Member States. Over three-quarters of womenand men perceived their health as good or very goodin the Netherlands (76 % for women; 80 % for men), theUnited Kingdom (79 %; 80 %), Sweden (78 %; 82 %) and inIreland (83 %; 84 %). This is to be compared with MemberStates such as Portugal, Latvia or Lithuania where com-paratively fewer of the women’s population feel in goodor very good health (44 %, 54 %, and 57 % respectively),although, the self-perceived health of their male coun-terparts was slightly higher (55 %, 54 % and 57 % respec-tively) (see Figure 4.41.).
94
Gender Equality Index – Report
Figure 4.41. Good or very good self-perceived health by sex in EU Member States, 2010
Women
Men
Total
100%Good or very goodself-perceivedhealth inpercentWomen: 66%Men: 71%
80%60%40%20%0%LVPTLTEEHUPL SICZ SKDEITBGFR MTEU-27FIATRODKESBECYLUELNLUKSEIE
Source: Eurostat, EU-SILC (hlth_silc_01)However, at EU level, in 2010, there was a gender gap of5 percentage points between women and men, as onlytwo-thirds (66 %) of women, compared with 71 % of men,assessed their health as good or very good. At nationallevel, women had a lower perception of their health inall Member States. While differences were very small orpractically inexistent in Ireland or the United Kingdom, thegender gap reached more than 10 percentage points inBulgaria and Portugal and stood at around 10 % in Roma-nia and Latvia (see Figure 4.42.).
Figure 4.42. Good or very good self-perceived health by gender gap in EU Member States, 2010
Gender gap inpercentage points
40
Gender gap towards men
30
205.310
0IEUKDE FILUDK MT SENLELBEEEATFRCZ CYEU-27PLSIESITHULTSKLVRO BG PT
Source: Eurostat, EU-SILC (hlth_silc_01)
Gender Equality Index – Report
95
4.6.2. Life expectancyThe second gender indicator used for the sub-domain ofhealth status is life expectancy. This is an indicator thatmeasures gaps not only in terms of gender, but also interms of sex. It is indeed complex to disentangle howbiological factors affect health outcomes and how muchthese are in fact mitigated by gender (Kirby, 2000).Variable definition: Life expectancy in absolute value atbirth (years)This indicator measures the mean additional number ofyears that a person can expect to live, assuming currentmortality conditions are maintained (Eurostat, 2013).
Data source: Eurostat’s demographic statistics, Eurostat(hlth_hlye)Periodicity: annualIn 2010, the average expectancy at birth in EU-27, forwomen was 83 years of age and 77 years for men, withlife expectancy lowest for women in Bulgaria (77 years)and for men in Lithuania (68 years). However, women livedan additional seven years, reaching 85 in countries such asFrance, Italy or Spain. Men lived as much as an additional12 years, reaching 80 years of age in Italy (see Figure 4.43.).
Figure 4.43. Life expectancy at birth by sex in EU Member States, 2010
Women
Men
Total
100Lifeexpectancy in years806040200LT LVBG ROHUSKEEPLCZDK
Women: 82.9
Men: 77.0
PT SIEU-27FI
BE
DE
EL UK
AT
LU
IE
NL
MT CY
SE
FR
ES
IT
Source: Eurostat, demographic statistics (hlth_hlye)Without exception, women outlived men across all Mem-ber States, in 2010, with an average gender gap at EU levelof just over six years. At national level, important differen-ces existed. Women lived as few as four years longer thanmen in Sweden, the Netherlands, the United Kingdom,Denmark, Malta and Greece; however, at the other end ofthe spectrum, there were much wider gaps. Women in theBaltic States (LT, EE, LV) lived for a decade or more longerthan their male counterparts (see Figure 4.44).
96
Gender Equality Index – Report
Figure 4.44. Life expectancy by gender gap in EU Member States, 2010
2015105
Gender gap towardswomen
Gender gap in years
5.9
0
LT
EE
LV
PL
HUSK
RO BG
FR
SI
FI
CZ
ESPTEU-27ATLU
BE
IT
DE CY
IE
ELMT DK NL SE
UK
Source: Eurostat, demographic statistics (hlth_hlye)
4.6.3. Healthy life yearsThe last gender indicator used to measure health statusis the number of healthy life years. Although women andmen’s life expectancy has been rising, health should beexamined in the context of factors that may affect thequality of these additional years (UNECE, 2013). Healthylife years measures quality of life, because it focuses onlyon years spent as being healthy, contrary to life expect-ancy (Eurostat, 2013) (included within the framework of theBeijing Platform for Action Indicators, see Annex 5).Variable definition: Healthy life years in absolute value atbirth (years)This indicator measures the number of healthy life yearsthat a person is expected to live without any severe ormoderate health problems. Health problems are based
on self-perceptions, including that of having limitationbecause of one’s health status (Eurostat, 2013).Data source: EU-Statistics on Income and Living Conditionscombined with Eurostat’s demographic statistics, Eurostat(hlth_hlye)Periodicity: annualWomen and men enjoyed a total of 63 and 62 years, re-spectively, of healthy life on average in the EU-27, in 2010.The range across Member States is enormous with somewomen and men enjoying as much as an additional20 years of healthy life between the lowest and highestMember State. The number of healthy life years was lowestfor both women and men in Slovakia, with 52 years, com-pared with nearly 72 years for women in Malta and men inSweden (see Figure 4.45.).
Gender Equality Index – Report
97
Figure 4.45. Healthy life years by sex in EU Member States, 2010
Women
MenWomen: 62.7
AverageMen: 61.9
100Healthylife years806040200SKSILVEEHURO PT DEFILTATPLNL DKEU-27FR BE CZESCYBGUK LUIEELITMT SE
Source: Eurostat, demographic statistics and EU-SILC (hlth_hlye)Despite important differences across the EU-27, differencesbetween women and men were more moderate withineach Member State. The gender gap only exceeded threeadditional years for women in Latvia, four years in Poland,Estonia and Bulgaria and finally five years in Lithuania,showing that generally, where there were larger differ-ences, women benefited from a greater number of healthylife years. Gender gaps towards men reached just little lessthan three additional healthy years for Portugal and morethan a year in Belgium and the Netherlands (see Figure 4.46.).
Figure 4.46. Healthy life years by gender gap in EU Member States, 2010
40
Gender gap towardswomen
Gender gap towards men
Gender gap in years
30
200.8
10
0LTEEBGPLLVHUCZLUFRELMT ATSIIEEU-27DEUK ITROFISKESSECYDK NL BE PT
Source: Eurostat, demographic statistics and EU-SILC (hlth_hlye)
4.6.4. Unmet medical needsThe first gender indicator used to measure access to healthstructures examines gender gaps in terms of unmet medi-cal needs.Variable definition: Population without unmet needs formedical examination (% 16+ population)This indicator examines people’s perceptions of theaccessibility to health care. It reflects respondents’ own
assessment of not having a need for medical examinationor treatment fulfilled (Eurostat, 2012) (included within theframework of the Beijing Platform for Action Indicators,see Annex 5).Data source: EU-Statistics on Income and Living Conditions,Eurostat (hlth_silc_08)Periodicity: annual
98
Gender Equality Index – Report
The issue of unmet medical needs is not problematic forthe vast majority of Europeans. Overall, there are no nota-ble differences between women and men, as respectively93 % and 94 % of them had no unmet medical needs in
2010, on average in the EU-27. These figures show a small,but welcome, improvement from the situation in 2003,where on average in the EU-27, 90 % of women and 91 %of men had no unmet medical needs (Figure 4.47.).
Figure 4.47. Individuals without unmet medical needs by sex in EU Member States, 2010
Women
Men
Total
Without unmet medical needsinpercent
100%80%60%40%20%0%LVBG PL RO SEHU ELIT
Women: 93%
Men: 94%
ES
CYEU-27DEEE
MT FI
SK
FR DK
UKCZ
LU
LT
IE
PT
AT
NL BE
SI
Source: Eurostat, EU-SILC (hlth_silc_08)Examining the situation at national level shows that differ-ences are also relatively small between women and men,combined with relative gender equality. Where gendergaps were widest, it was to the detriment of men with, forexample, 2 or more percentage point difference in Latvia,Greece, Sweden, Finland or Romania (see Figure 4.48.).
Figure 4.48. Individuals without unmet medical needs by gender gap in EU Member States, 2010
Gender gap inpercentage points
40
Gender gap towardswomen
Gender gap towards men
30
200.6
10
0ESLU HUFR ATCZBE DK NLSISK BG DEEU-27EE UKPTIEMTLTCYPLITLVELSEFIRO
Source: Eurostat, EU-SILC (hlth_silc_08)
Gender Equality Index – Report
99
4.6.5. Unmet dental needsThe second gender indicator used to measure access tohealth structures examines gender gaps in terms of unmetdental needs.Variable definition: Population without unmet needs fordental examination (% 16+ population)This indicator examines people’s perceptions of the ac-cessibility to health care. It reflects respondents’ own as-sessment of not having a need for dental examination ortreatment fulfilled (Eurostat, 2012). For the purpose of the
Gender Equality Index, the indicator is reversed, providingdata on individuals who do not have dental needs.Data source: EU-Statistics on Income and Living Conditions,Eurostat (hlth_silc_09)Periodicity: annualBy 2010, on average in the EU-27, 93 % of women and menhad no unmet dental needs, up from 88 % in 2003. The low-est level of unmet needs in 2010, was recorded in Latvia(79 % for women and 78 % for men) while in Slovenia itreached 99 % for both women and men (see Figure 4.49.).
Figure 4.49. Individuals without unmet dental needs by sex in EU Member States, 2010
WomenWomen: 93%
MenMen: 93%
Total
Without unmet dental needsinpercent
100%80%60%40%20%0%LVBG PT RO CYITPLESSEFRELEU-27EEFIHUATIECZSK MT DE DKLTLUUKBE NLSI
Source: Eurostat, EU-SILC (hlth_silc_09)The gender gap in terms of unmet dental needs was prac-tically inexistent in 2010, on average in the EU-27. Very smallgender gaps, just above 2 percentage points, were presentto the detriment of women in Denmark and to the detri-ment of men in Romania and Portugal (see Figure 4.50.).
100
Gender Equality Index – Report
Figure 4.50. Individuals without unmet dental needs by gender gap in EU Member States, 2010
Gender gap inpercentage points
40
Gender gap towardswomen
Gender gap towards men
30
200
10
0DKCYHU ESCZPLLU EENLSKBELVUKDEFR AT SE BGEU-27SIFIELMTLTIEITROPT
Source: Eurostat, EU-SILC (hlth_silc_09)
4.6.6. SummaryThe gender indicators used in the domain of health showthat there is a large degree of truth, both at EU level andacross Member States, to the old adage that ‘women getsicker and men die younger’. In terms of gender gaps, thedomain of health presents a mixed picture. Although thereare small or no gender gaps in terms of unmet needs,medical or dental, this hardly translates into health status,where important gender gaps can be seen.Furthermore, although the levels of indicators of healthstatus and unmet needs are relatively high in some Mem-ber States, it appears that in others, it remains necessary tofocus on the health of women and men. Given that healthis directly linked not only to economic independence, butalso to physical integrity and dignity, it is therefore crucialto ensure that efforts continue to go in this direction, whileat the same time maintaining small gender gaps or elimi-nating them altogether.
4.7. Intersecting inequalitiesThe domain of intersecting inequalities examines gendergaps within categories outside of the mainstream. The in-dicators selected explore employment rates, as these canserve as relevant proxies to illustrate how certain groups ofwomen and men fare in the EU in terms of economic par-ticipation, as a means of tackling poverty and social exclu-sion. Three illustrative groups are examined: people bornin a foreign country (as a proxy for migrants), people aged55 to 64 (older workers) and people living in a householdwith a single adult and one or more children (as proxy forlone parents or carers).As this is a satellite domain, each of the indicators se-lected are only indicative of existing gender inequalities.This means that they are not combined into a single sub-index of intersecting inequalities, nor aggregated into themain index.
Gender Equality Index – Report
101
Table 4.8. Measurement framework for the domain of intersecting inequalitiesMeasurementframeworkConceptmeasured
Indicator
Source
Employment of people born in a foreigncountry (% 15–64 corresponding population)Employment rates:minorities and/ormigrantsolder workersloneparents/carers
Eurostat – EU LabourForce Survey
Discrimination andother social grounds
Employment of people aged 55–64(% 55–64 population)Employment rates of people living ina household with one adultand one or more children(% 15–64 corresponding population)
Eurostat – EU LabourForce Survey
Eurostat – EU LabourForce Survey
4.7.1. Employment for people bornin a foreigncountryThe first gender indicator focused on individuals thatwere born in a foreign country and their participationrate in employment. Being born in a foreign country is adifficult proxy to understand, and although very imper-fect, goes some way towards providing information onpeople that may be part of a minority and/or who aremigrants. It is an important indicator from a gender per-spective given that women from a minority and/or mi-grant background tend to have lower rates of participationin employment, leading to greater disparities in incomeand higher risk of poverty (European Union Agency forFundamental Rights, 2010).Variable definition: Employment of people born in a foreigncountry (% 15–64 population born in a foreign country)
This indicator measures employment rates among peoplethat are foreign born – that is, outside of their country ofresidence (Eurostat, 2013).Data source: EU Labour Force Survey, Eurostat (lfsa_ergacob)Periodicity: annualThe average EU-27 participation rate for people born in aforeign country was 54 % for women and 70 % for men.Fewer than half of women born in a foreign country par-ticipated in the labour market in 2010, in Slovakia (39 %),Poland (44 %), Belgium (45 %), Malta (47 %) or Bulgaria(48 %), however, it reached as much as 71 % in Cyprus.Men’s participation was consistently higher, ranging fromjust over half in Bulgaria (52 %) but involving over three-quarters of men in a number of Member States, includ-ing Italy (76 %), Greece (77 %), Malta (77 %), Luxembourg(79 %), the CzechRepublic (79 %) and Romania (83 %)(see Figure 4.51.).
102
Gender Equality Index – Report
Figure 4.51. Employment rates for people born in a foreigncountryby sex in EU Member States, 2010
Women100%Employmentrate inpercent80%60%Women: 54%
Men
Total
Men: 70%
40%20%0%BGPLBESKESFREEIELVFIMT SEEU-27ITLTDK DEELNLSIHUATUKCZ PTLUCY RO
Source: Eurostat, LFS (lfsa_ergacob)Gender gaps in 2010, showed that men born in a foreigncountry were consistently more likely to participate in thelabour market across Member States than their womencounterparts, with an EU-27 average difference of 16 per-centage points. These differences varied enormously acrossMember States, ranging from a difference of 36 percent-age points in Slovakia, 31 percentage points in Malta, to apractically inexistent difference in Latvia (see Figure 4.52.).
Figure 4.52. Employment rates for people born in a foreigncountryby gender gap in EU Member States, 2010
Gender gap inpercentage points
40
Gender gap towards men
30
15.8
20
10
0LVCYEELTBGESDKHUPTSIIEFISEATNL PLEU-27BELUFRUKDECZELITROMT SK
Source: Eurostat, LFS (lfsa_ergacob)
4.7.2. Employment for older workersThe second gender indicator measures employment ratesamong older workers, defined as those aged between55 and 64 years of age. It is an important indicator as itrepresents one of the targets of the European EmploymentStrategy, that is to ensure that by 2010, at least 50 % of theEU population aged between 55 and 64 should participatein employment. Furthermore, gender gaps are particu-
larly acute within this age category and prove to be quiteresilient (Bosch and Schief, 2005).Variable definition: Employment of people aged 55–64(% 55–64 population)This indicator measures employment rates among olderworkers, defined as individuals aged 55 to 64 (Eurostat,2012).
Gender Equality Index – Report
103
Data source: EU Labour Force Survey, Eurostat (lfsa_ergacob)Periodicity: annualAlthough the average participation of men older workersis above the target of 50 % in the EU-27, in 2010, this wasnot true for women older workers, as they only represent-ed 39 % of labour force participants. Moreover, only six
Member States were above this target for women olderworkers, including the United Kingdom (50 %), Germany(51 %), Denmark (54 %), Estonia (55 %), Finland (57 %) andSweden (67 %), compared with 18 Member States whenmen older workers are concerned. For men older work-ers, participation rates reached 71 % in Cyprus and 74 %in Sweden (see Figure 4.53.).
Figure 4.53. Employment rates for older workers by sex in EU Member States, 2010
WomenEmploymentrate inpercent100%80%60%40%20%0%MTPLHUSIITBELUFRSKROELATBG
Men
Total
Women: 39%
Men: 55%
ESEU-27CZLV LT
PT
IE
NL
EE
FI
CY
UK
DE DK SE
Source: Eurostat, LFS (lfsa_ergacob)In the majority of Member States, men older workers hada higher participation rate than women older workers,with an EU-27 average of 16 percentage points in 2010.Differences were important in a large number of Mem-ber States, above 25 percentage points in Greece, Cyprusor Malta. The differences were almost inexistent thoughin favour of women in Estonia, Finland and Latvia (seeFigure 4.54.).
Figure 4.54. Employment rates for older workers by gender gap in EU Member States, 2010
Gender gap inpercentage points
4030
Gender gap towardswomen
Gender gap towards men
16.0
20100EEFILVFRLTSEHUDK PT BGDEUKEU-27IE
BELURO AT SI
PL
IT ESNL
CZ SK
EL
CY MT
Source: Eurostat, LFS (lfsa_ergacob)
104
Gender Equality Index – Report
4.7.3. Employment for lone parents/carersThe final gender indicator used to illustrate gender gapsamong intersecting inequalities examines employmentrates among lone parents or carers. It is important froma gender perspective, because lone parents are more of-ten than not lone mothers. This means that women maybe less able to participate in the labour market and henceface higher risks of poverty (EC, 2010).Variable definition: Employment of people living in ahousehold with one adult and one or more children (%15–64 population living in a household with one adult andone or more children)This indicator measures employment rates in householdscomposed of a lone adult with one or more children agedbelow 15, or under 25 years old, and in full social and eco-nomic dependence from other household member/-s(parents/adults) (Eurostat, 2012).
Data source: EU(lfst_hheredty)Periodicity: annual
Labour
Force
Survey,
Eurostat
Participation in the labour market among people thatwere living in a household with a single adult and one ormore children was relatively high on average at EU level, in2010, with a 66 participation rate among women and 80 %among men. Across Member States, participation was low-est among lone adults with children in Ireland and Malta,both with 46 % participation for women compared withrates of 57 and 58 % for men, respectively. Participationrates were very high for lone men with one more children,with nine in 10, or more, participating in the labour forcein Slovenia (90 %), the Czech Republic (91 %) and Slovakia(92 %) (see Figure 4.55.).
Figure 4.55. Employment rates for persons living in a householdcontaininga single adult with one or morechildrenby sex in EU Member States, 2010
Women
Men
Total
Employmentrate inpercent
100%80%60%40%20%0%IE
Women: 66%
Men: 80%
MTUKBEEU-27DE PLHU
NL
BGLT
SE
ES
ELCY FR
FI
IT
CZ
EERO SK
PT
LV
DK
AT SI
LU
Source: Eurostat, LFS (lfst_hheredty)Throughout most EU Member States, in 2010, men living ina household with a single adult and one or more childrenwere more likely than women in their situation to partici-pate in the labour force. On average, in the EU-27, the gen-der gap stood at 14 percentage points towards men. Theparticipation of men was as much as 20 percentage pointshigher than women’s in the Czech Republic. Exceptionscan be seen in Bulgaria and Luxembourg, where womenare more likely to participate, with gender gaps of threeand nine percentage points respectively (see Figure 4.56).
Gender Equality Index – Report
105
Figure 4.56. In employment rates for persons living in a householdcontaininga single adultwith one or morechildrenby gender gap in in EU Member States, 2010
Gender gap inpercentage points
4030
Gender gap towardswomen
Gender gap towards men
13.7
20100LUBG DKLVPTPLRO FIEELTCYHUATES
BEIE
EL
IT
DE
SI
MTEU-27SE FR NL SK
UKCZ
Source: Eurostat, LFS (lfst_hheredty)
4.7.4. SummaryExamining gender gaps in employment rates among illus-trative groups showed patterns of difference that providea valuable initial reflection point. In all the grounds takeninto consideration by the gender indicators selected, thatis country of birth (as a proxy for belonging to a minor-ity group and/or being a migrant), being older or beinga lone parent/carer, men on average were more likely to
participate in the labour force than women. Moreover,although differences were small or inexistent in someMember States, in others, large differences existed point-ing to the importance of measuring these gender gaps.Although relying on illustrative groups is not in itself suf-ficient to draw on strong conclusions as to how intersect-ing inequalities contribute to gender equality overall, theyrepresent an opportunity to debate this important area ingreater depth.
4.8. ViolenceThe final domain, that ofviolence,consists conceptually oftwo domains divided into direct and indirect violence.Table 4.9. Measurement framework for the domain of violenceConceptual frameworkDirectIndirect
Measurement framework--
106
Gender Equality Index – Report
4.8.1. Direct violenceThe first sub-domain, direct violence, attempts to measuregender-based violence against women, including violencethat can be physical, psychological, sexual or economic.Because of the dearth of available data, in particular inlight of the lack of comparable indicators, this sub-domaincannot be measured. Although several surveys exist atMember States level, their lack of consistency and harmo-nisation prevent international comparisons (UNECE, 2013).The development of indicators within the framework of adedicated survey in the EU is severely lacking. Developmentsare in process, notably through the European Union Agency’sfor Fundamental Rights Survey on gender-based violenceagainst women, to be released in 2013. The survey will cap-ture women’s experiences of physical, sexual and psycholog-ical violence in different settings. However, concerns remainregarding other types of violence, not covered by this surveyand the continuity of the survey in the future.The EU Safety Survey (SASU) proposed by Eurostat, origi-nally envisaged from 2013, has not been approved by theEuropean Parliament. The Commission is expected to pro-vide a new legislative proposal in support of the survey. Itremains unclear how the process will develop.The sub-domain ondirect violencethus remains blank,flagging that this is an important area in which to meas-ure gender equality, and with the hope that it will be soonpossible to rely on indicators. This space should be seenas a call to urgently measure this important dimension ofgender equality.
This sub-domain is also without indicators, as none havethus far been developed to monitor this dimension of gen-der equality. As emphasised for the sub-domain ofdirectviolence,it is crucial that this blank leads to reflections onhow to begin the monitoring of this dimension.
4.8.3. SummaryDespite the importance of gender-based violence againstwomen, in all its forms, and that of the gender norms, atti-tudes and stereotypes that underpin them, the availabilityof gender indicators is sorely lacking. Although no genderindicators could be selected to measure gender gaps inthis domain, it nevertheless remains as a blank space, readyto be filled at the first opportunity.
4.9. ConclusionThis section has provided a descriptive analysis of the gen-der indicators considered in the Gender Equality Index. Foreach critical area of gender equality, within the frameworkof EU policy, the gender gaps in each selected genderindicator depicts the situation across Member States. It isby focusing on closing the gender gaps in each on thesecritical areas of gender equality that policy can effectivelycontribute to progress in making gender equality a reality.This section provides a useful background upon which tobetter understand the scores of the Gender Equality Index.Following this analysis, at the level of gender indicators,these measures are now aggregated at sub-domain anddomain level according to the structure of the measure-ment framework to provide synthetic measures of genderequality, overall but also within domains and sub-domains.The aggregation and weighing is done in accordance withthe methodology outlined in Section 3 and the scores re-sulting from this process are the object of the followingsection.
4.8.2. Indirect violenceThe second sub-domain isindirect violence.It aims at meas-uring the gender norms, attitudes and stereotypes, whichunderpin current patterns of gender-based violence againstwomen, in addition to other forms of gender inequality.
Gender Equality Index – Report
107
5. Index resultsFor the first time, the Gender Equality Index provides a syn-thetic, yet comprehensive measure of the gender equalitygaps in the EU and across Member States based on theEU policy framework. It offers a valuable tool to supportthe EU’s efforts to close gender gaps and a strong call foraction at the level of Member States.This report on the development of the Gender EqualityIndex has provided a full picture of how this compositeindicator was constructed, from how it deals with genderapproaches (Section 1), through an extensive concep-tual framework (Section 2), and how to operationalise itthrough a measurement framework (Section 3). In the pre-vious section (Section 4), the report presented an in-depthanalysis of gender gaps and levels of achievement acrossMember States, for each of the gender indicators used inthe computation of the Index.Building upon this work, this section now focuses on thescores of the Gender Equality Index in each Member Stateand in the EU overall to offer a detailed assessment ofwhere EU Member States stand in achieving gender equal-ity. The section first discusses how scores can be interpret-ed, before giving a breakdown at domain and sub-domainlevel. It concludes with an analysis of how the GenderEquality Index performs in relation to other relevant andcommonly used indicators.position of women and men individually. It is therefore notpossible to derive sexed information from the scores. Notlosing sight of the overwhelmingly disadvantaged posi-tion of women throughout society, it is however impera-tive that EU decision-makers engage in a reflective proc-ess of how to make gender equality for both women andmen a reality. Because of the gender approach it takes, theGender Equality Index is precisely the tool that can assist inproviding evidence to back up and support this reflectionat EU level and across Member States.Furthermore, although the focus is on gender gaps, scoresare also taking into consideration levels of achievement, inorder to ensure that a low gender gap does not result in ahigh score in the context of low levels of achievement.Consequently, the scores of the Gender Equality Indexprovide a synthesis of gender equality in terms of gendergaps and levels of achievement. Although it represents auseful tool in itself, it can be further used in the contextof a detailed analysis of both gender gaps and levels ofachievement such as the one provided in the previoussection (Section 4) to allow a deeper analysis of thesescores. An outline of these results is provided in the fol-lowing section.
5.1. Scoring gender equalityThe scores of the Gender Equality Index range from 1 to100, where 1 stands for absolute gender inequality and100 marks the level of full gender equality. For example, ascore of 50 can be interpreted as half way or 50 % towardsgender equality.The Gender Equality Index adopts a gender perspec-tive, embracing both the gender equality approaches ofdifference and sameness present at policy level andinscribing them in a largely transformative perspective.The scores of the Index reflect this position and provideinformation on gender gaps, instead of on the specific
5.2. Far, far away fromgender equality?The scores, overall and in each core domain (work, money,knowledge, time, power and health) are presented in Table 5.1.Despite more than 50 years of gender equality policy atEU level, the report shows that gender gaps are prevalentacross the EU-27. With an average score of 54.0, the EU re-mains far from reaching its gender equality aim. The rangeacross Member States, from 35.3 to 74.3, shows the broadscale of variation throughout the EU in the level of Gen-der Equality achieved overall. The remainder of this sectionprovides a breakdown and outline of the scores in each ofthe domains of the Gender Equality Index.
108
Gender Equality Index – Report
Table 5.1. Scores of the Gender Equality IndexCountrySEDKFINLUKBEFRSIIEESDELUATEECZLVPLLTCYMTHUPTSKITELBGROEU-27
Index74.373.673.469.760.459.657.156.055.254.051.650.750.450.044.444.444.143.642.041.641.441.340.940.940.037.035.354.0
Work78.681.682.073.176.666.467.069.171.061.372.566.473.964.671.654.961.461.068.755.055.966.261.060.659.749.960.469.0
Money80.279.278.482.574.379.375.970.277.060.776.390.977.949.159.342.052.241.574.168.254.456.353.768.263.340.739.068.9
Knowledge66.375.167.065.568.854.749.451.452.853.544.161.144.653.037.338.844.047.452.934.035.130.435.032.136.732.028.848.9
Time63.964.963.871.343.245.335.849.153.433.841.648.940.051.423.235.220.924.125.337.532.522.417.833.017.417.317.838.8
Power74.360.068.852.235.245.250.336.026.547.228.014.724.327.529.638.634.532.112.218.724.430.633.118.624.433.824.938.0
Health93.191.889.994.795.494.190.688.796.490.789.593.991.683.889.677.182.684.991.193.283.784.585.890.892.484.584.090.1
5.2.1 Women at workIn the domain ofwork,on average, the EU-27 has achieveda score of 69.0, that is more than two-thirds of the waytowards equality. Moreover, all Member States are abovehalfway towards equality in this domain, but with only
four of them going over the threshold of three-quartersof the way towards gender equality. Scores for the do-main ofworkare highest for Finland with a value of 82.0,Denmark with 81.6 and Sweden having attained 78.6 %towards gender equality (see Table 5.2.). A more detailedbreakdown of scores is provided in Annex 8.
Gender Equality Index – Report
109
Table 5.2. Gender Equality Index scores for the domain of workSegregation andqualityof work76.173.967.773.769.168.868.666.468.157.755.659.162.362.751.149.251.352.545.449.363.449.054.445.757.036.233.062.2
CountryFIDKSEUKATNLDECZIESICYFRBELUPTEEPLESLTSKITROELHUMTLVBGEU-27
Work82.081.678.676.673.973.172.571.671.069.168.767.066.466.466.264.661.461.361.061.060.660.459.755.955.054.949.969.0
Participation88.390.191.279.779.077.676.777.373.982.784.976.170.770.385.684.973.471.681.975.357.874.565.468.353.083.275.576.6
Sectoralsegregation*31.845.838.142.439.936.940.125.936.627.749.143.241.253.028.624.725.243.030.922.335.820.944.031.945.522.725.437.0
Qualityof work*90.883.377.684.278.979.578.079.978.667.757.864.469.465.958.657.360.055.650.358.372.758.357.950.360.940.735.570.7
* during the computation of the overall Index, sectoral segregation and quality of work are aggregated into a singlesub-domain, with respective weights of 0.25 and 0.75, in line with the structure derived from the multivariate analysis.
110
Gender Equality Index – Report
Participationis measured by focusing on gender gaps infull-time equivalent employment rate and duration ofworking life. The analysis of the gender indicators in thissub-domain showed that men were, across all MemberStates, more likely to participate in the labour market (infull-time equivalent) and also to spend more years thanwomen working.The sub-domain ofparticipationis highest on averagein the EU-27 with a gender equality score of 76.6, nearlythree-quarters of the way towards gender equality. Genderequality in participation is highest for Finland, Denmarkand Sweden with scores of 88.3, 90.1 and 91.2 respectively.
Malta, however, with a score of 53.0 shows that progressneeds to be made in this subdomain. Figure 5.1. shows thatfull-time equivalent participation and duration of work-ing life are positively associated with the domain of work,which means that an increase in the values of these vari-ables implies a rise in the scores in the domain. The asso-ciation is measured by the Pearson´s correlation coefficient,registering a value r = 0.59. Taking into account that thiscoefficient reaches its maximum value in 1, it means thatthe intensity of the relationship is moderate. This providesinformation about the impact of the sub-domainparticipa-tionon gender equality scores in the domainwork.
Figure 5.1. Relationship between the domain ofworkandparticipationR2=0.3458990FI80Domain ofworkDE70BE60MTITELHUBGLUPLESSKROLVLTIEFRNLCZEU-27UKATSICYPTEEDKSE
50
40506070Participation8090100
Source: EIGE’s calculationsAs shown in Table 5.2.,segregation and quality of work,thesecond sub-domain of work, measures sectoral segregation(taking participation of women and men in selected seg-regated sectors, here beingEducation, Human health andSocial work activities),as well as aspects of quality of work,including flexibility, training at work and health and safety.Segregation into different sectors has repercussions onworking conditions (European Commission, 2009; UN-ECE, 2013) as can be seen in the statistical structure ofthe gender indicators employed in the Index (Annex 6).The structure shows a positive relationship between sec-toral segregation and not experiencing health and safetyrisks (r = 0.44), as well as being able to vary the start andend of the working day (r = 0.34).This second sub-domain has considerable variability, withscores that extend from low gender equality in Bulgaria(33.0) and Latvia (36.2) to higher levels of gender equalityin Denmark (73.9) and Finland (76.1). The EU average reach-es the value 62.2, nearly two-thirds of the way towardsgender equality.
Gender Equality Index – Report
111
The sub-domain ofsegregation and quality of workhasa strong positive relationship with the domain of work(r = 0.88), demonstrating that this combination of genderindicators contributes significantly to the overall domain ofwork(see Figure 5.2.).Regarding sectoral segregation, on average at EU level,gender equality is a distant goal, with an average score of37.0. Across all Member States, only Luxembourg makes itpast halfway towards gender equality, with a value of 53.0,and scores are below a quarter in Romania (20.9), Slovakia(22.3), Latvia (22.7) and Estonia (24.7).
The EU average score for quality of work stands at 70.7,suggesting a moderate level of gender equality. However,across Member States, nine have reached scores above 75.This includes Sweden (77.6), Germany (78.0), Ireland (78.6),Austria (78.9), the Netherlands (79.5), the Czech Republic(79.9), Denmark (83.3), the United Kingdom (84.2) and Fin-land (90.8). This is not the case in all Member States, withBulgaria (35.5) and Latvia (40.7) below halfway towardsgender equality.
Figure 5.2. Relationship between the domain ofworkandsegregation and quality of work
R2=0.77947
90DK80Domain ofworkEU-27EESK60LV50BG40LTROHUCYPTPLESELMTSIFRBELUITCZIEFISEATNLDEUK
70
3030405060Segregation and quality ofwork7080
Source: EIGE’s calculationsThis domain shows that much remains to be done in termsof equalising FTE employment and duration of workinglife, in addition to ensuring that gender gaps are closed inthe indicators measuring quality of work. The scores alsoshow that sectoral segregation remains a serious concernacross all Member States, one which can have a seriousimpact on overall scores for the domain of work. It istherefore important to measure not only the extent towhich women and men are getting in the labour market,but also how they are getting on there. The analysis ofthe domain of work in general, and quality of work inparticular, could benefit from harmonised and compa-rable gender-sensitive indicators on work-life balance atEU level for all Member States. It is an important aspectof analysis from a gender perspective, which could wellcomplement the measurement framework of the GenderEquality Index.
112
Gender Equality Index – Report
5.2.2. Money mattersThe domain ofmoney,with a score of 68.9 on average atEU level, shows that the EU-27 is over two-thirds of the wayin achieving gender equality when it comes to the financialresources and economic situation of its citizens. It is likelythat this score actually underestimates the true extent ofthe gap between women and men when it comes to theshare of income, as available gender indicators ignore thepower relations between women and men which can leadto an unequal sharing of income within households.Twenty-four Member States achieve a score that is abovehalfway towards gender equality, with three MemberStates going beyond four-fifths of the way towards gen-der equality: Sweden (80.2), The Netherlands (82.5) andLuxembourg (90.9). In other Member States, the domainofmoneyshows lower scores, with the lowest score forRomania with 39.0 (see Table 5.3.). A more detailed break-down of scores is provided in Annex 9.
Table 5.3. Gender Equality Index scores for the domain ofmoneyCountryLUNLSEBEDKFIATIEDEFRUKCYSIMTITELESCZPTHUSKPLEELVLTBGROEU-27
Money90.982.580.279.379.278.477.977.076.375.974.374.170.268.268.263.360.759.356.354.453.752.249.142.041.540.739.068.9
Financial resources95.071.867.769.774.866.365.976.870.667.072.766.551.854.160.254.354.235.942.330.531.734.631.026.726.823.221.059.5
Economic situation86.994.895.190.383.992.792.177.282.686.176.082.695.186.077.373.967.997.975.097.190.978.877.966.064.371.372.579.6
Gender Equality Index – Report
113
The first sub-domain,financial resources,measures gaps inearnings, as well as in disposable income. With an averagescore of 59.5 at EU level, it suggests that gender inequa-lities remain in this area. Even though Luxembourg, witha score of 95.0, attains a high level of gender equality, themajority of Member States reach a more moderate level,with over a third of Member States below halfway towards
gender equality. Gaps in earnings and income are lowestin Romania (21.0), Bulgaria (23.2) and Latvia (26.8).A very strong positive link exists betweenfinancial resourc-esand the domain ofmoney(r = 0.97), showing that thissub-domain makes a strong contribution to the genderscores ofmoney.
Figure 5.3. Relationship between the domain ofmoneyand financialresources
R2=0.93511100
90NLFI SE BEATFRDKIEDEUKCYITEL60SKHU50EE40RO302030405060Financial resources708090LVBGLTCZPLPTES
LU
Domain of money
80SIMTEU-27
70
100
Source: EIGE’s calculationsThe sub-domain ofeconomic situation,measured by indi-viduals not identified as being at risk of poverty and bythe distribution of income, shows a score of 79.6 in theEU-27. Lithuania, with a value of 64.3, shows the lowestscore of all Member States. In other Member States, scoresshow that women and men are relatively equal in terms oftheir economic situation, such as in Hungary (97.1) and theCzech Republic (97.9). This sub-domain is positively asso-ciated with the domain ofmoney(r = 0.46).
114
Gender Equality Index – Report
Figure 5.4. Relationship between the domain ofmoneyandeconomic situationR2=0.30881100
90DKUK70ELES60PTPL50LV40LTBGROEEIEEU-27ITDEFRCY
LUNL
Domain of money
80
BEAT
FI
SE
SIMTCZSKHU
30607080Economicsituation90100
Source: EIGE’s calculationsThe scores of the Gender Equality Index show that progressremains to be made in terms ofmoney,overall in the EU,particularly since the indicators available to measure theseissues are likely to underestimate the true extent of thegaps. The situation is not homogenous across MemberStates, with some being near to closing gender gaps, whileothers remain far away from gender equality. Not-at-risk-of-poverty and income distribution, although far from per-fect in all Member States, occasionally show relatively highscores, while earnings and income show large degrees ofgender inequality in some Member States.
5.2.3. Knowledge exchangeThe domain ofknowledgeshows that on average,EU Member States have only attained the middle pointtowards gender equality with a mean value of 48.9 atEU level, showing that the domain ofknowledgeremainsunequal in terms of gender, although this varies greatly acrossMember States. Gender equality scores range from aslittle as 28.8 in Romania to just above three-quarters of theway towards gender equality in Denmark (75.1) (Table 5.4.).A more detailed breakdown of scores is providedin Annex 10.
Gender Equality Index – Report
115
Table 5.4. Gender Equality Index scores for the domain ofknowledgeEducationalattainmentand segregation66.681.367.468.367.572.278.669.357.373.578.546.264.358.339.549.746.545.736.150.842.338.035.231.345.229.932.257.2
CountryDKUKFISENLLUBEESEECYIESIFRLTATDEPLLVCZELHUSKMTITBGPTROEU-27
Knowledge75.168.867.066.365.561.154.753.553.052.952.851.449.447.444.644.144.038.837.336.735.135.034.032.132.030.428.848.9
Educationalattainment*78.597.385.576.380.581.789.081.770.391.690.953.875.467.145.260.452.254.144.262.049.043.638.536.049.033.436.669.0
Educationalsegregation*54.665.449.260.254.562.668.256.944.455.566.138.753.249.533.839.040.937.428.039.535.732.531.826.641.426.327.945.4
Lifelonglearning84.758.266.664.363.551.838.041.349.038.035.457.138.038.550.239.041.632.938.526.529.132.132.932.922.730.925.841.8
* during the computation of the overall Index, attainment and segregation are aggregated into a single sub-domain,using equal weights, in line with the structure derived from the multivariate analysis.The first sub-domain measures both educationalattain-ment and segregationin tertiary education, since theyare very closely associated (r = 0.95), and that this strongrelationship is picked up by the statistical structure ofthe Gender Equality Index. Educational attainment ismeasured by the percentage of the population that hasachieved third-level education, while segregation mea-sures women and men’s participation in selected segre-gated sectors (here beingEducation, Health and welfare,Humanities and art).
116
Gender Equality Index – Report
The sub-domaineducational attainment and segregationpresents scores that vary from 29.9 for Portugal to 81.3for the United Kingdom. The EU-27 average registers thevalue 57.2, with 13 countries that are below halfwaytowards gender equality (see Table 5.4.).The contribution of gender indicators oneducationalattainment and segregationis asserted by the strongcorrelation between them and the domain ofknowledge(r = 0.84), as shown in Figure 5.5. This illustrates that an im-provement in this sub-domain has direct implications onthe increase of the gender scores ofknowledge.In terms of educational attainment, there is a large degreeof gender equality in the majority of Member States, with
an average score of 69.0 at EU level. However, althoughsome countries are close to the equality point, for exam-ple the United Kingdom with a value of 97.3, others re-main far away. A third of Member States (PT, IT, RO, MT, CZ,SK, AT, HU and BG) remain below halfway towards genderequality.Relatively high levels of gender equality in educational at-tainment, where they occur, are mitigated by lower scoresin terms of educational segregation, with an EU averageof 45.4, showing that high levels of gender segregationprevail. Scores extend from very low gender equality ineducational segregation in Portugal (26.3) and Italy (26.6),to relatively higher scores in the United Kingdom (65.4),Ireland (66.1) and Belgium (68.2).
Figure 5.5. Relationship between the domain ofknowledgeandeducational attainment and segregation
R2=0.7079880DK70FISEDomain of knowledgeNL60BE50AT40IT30PTMTROCZSKHUBGSIPLDELVELEEEU-27LTFRESCYIELUUK
202030405060708090
Educationalattainment and segregation
Source: EIGE’s calculationsThe second sub-domain focuses on measuring genderequality in lifelong learning participation. Its scores showthat the EU remains quite far from gender equality in termsoflifelong learning,with an average score of 41.8. Moreover,throughout Member States, only eight are above halfwaytowards gender equality, although the maximum scoreextends to 84.7. In contrast, gender equality scores remainvery low in a significant number of Member States, not ex-ceeding 30.0 in Bulgaria, Romania, Greece and Hungary.The sub-domain oflifelong learningis another strong con-tributor to the domain ofknowledge,displaying a strongpositive association (r = 0.89). An improvement in this sub-domain implies a similar increase in the gender scores ofknowledge.
Gender Equality Index – Report
117
Figure 5.6. Relationship between the domain ofknowledgeandlifelong learning
R2=0.7876480DK70UKNLDomain of knowledge60BEIE50FRCYLTPL40BG30RO202030405060Lifelonglearning708090PTELHULVSKMTITDECZATESEU-27EESILUSEFI
Source: EIGE’s calculationsThe domain ofknowledgeshows a mixed picture in termsof gender equality. Overall, gender equality patterns displaylarge variations across Member States. Some see a moder-ate to high level of gender equality in terms of participationin tertiary education and lifelong learning, although pat-terns of educational segregation continue to show a moreunequal side to knowledge in terms of gender. In otherMember States, both levels of achievement and gendergaps in all aspects of knowledge remain lead to low genderequality scores. The domain of knowledge therefore showsnot only the need to close gender gaps, but also to reduceexisting differences between Member States.
5.2.4. Time is of the essenceThe Gender Equality Index shows that there are very im-portant differences between women and men in the divi-sion of time spent on care and social activities. The domainof time presents the lowest gender equality scores, withan average of 38.8 at EU level, well below halfway towardsgender equality. Scores range from below 20.0 in Bulgaria,Greece, Slovakia and Romania to a maximum of 71.3 in theNetherlands (Table 5.5.). A more detailed breakdown ofscores is provided in Annex 11.
118
Gender Equality Index – Report
Table 5.5. Gender Equality Index scores for the domain oftimeCountryNLDKSEFIIEEESILUBEUKDEATMTFRLVESITHUCYLTCZPTPLROSKELBGEU-27
Time71.364.963.963.853.451.449.148.945.343.241.640.037.535.835.233.833.032.525.324.123.222.420.917.817.817.417.338.8
Care activities70.780.469.754.460.275.451.152.056.956.640.135.644.443.676.258.242.553.535.940.228.950.627.627.027.020.020.945.5
Social activities71.952.458.774.847.535.147.246.036.132.943.345.031.629.316.319.625.619.717.814.518.79.915.811.811.715.114.333.0
The first sub-domain examines gender gaps in the propor-tion of women and men that spend an hour or more everyday in caring for and educating children and/or grandchil-dren, as well as on domestic tasks such as cooking andhousework. The average score at EU level shows that thesituation remains a long way from gender equality with ascore of 45.5.
This average score at EU level masks some very largevariations between Member States. There is a widedegree of gender inequality when it comes to care activi-ties in Greece and Bulgaria with scores of 20.0 and 20.9respectively. However, scores reach over three-quarters ofthe way towards gender equality in Estonia (75.4), Latvia(76.2) and Denmark (80.4). A very strong association existsbetween participation in care and domestic activities andthe domain of time (r = 0.79).
Gender Equality Index – Report
119
Figure 5.7. Relationship between the domain oftimeandcare activitiesR2=0.6308680NLFI60SILUDE40ATEU-27MTFR30CZPLSKCYITLTPTHUESLVBEUKIEEESEDK
70
Domain of time
50
20ELBG101020RO
30
40
50Care activities
60
70
80
90
Source: EIGE’s calculationsThe sub-domain ofsocial activities,measured by partici-pation in sport, cultural and leisure activities as well asvolunteer or charitable activities shows a significant level ofgender inequality with an average EU score of 33.0. Scoresare below 20.0 in 12 of the Member States (PT, SK, RO, BG,LT, EL, PL, LV, CY, CZ, ES and HU) with the vast majority ofcountries not reaching a score of 50.0. Exceptions to theselow scores are the Netherlands and Finland, which achievescores of 71.9 and 74.8, respectively. Figure 5.8. shows thecontribution this sub-domain makes to the domain of time,with a very strong positive association (r = 0.94).
Figure 5.8. Relationship between the domain oftimeandsocial activitiesR2=0.8850280NL70DK60IEDomain of time50UK40LVHUPT20LTSKRO BG10010203040Social activities50607080PLELCYCZESFRITMTEEBEDELUATSISEFI
EU-27
30
Source: EIGE’s calculations120Gender Equality Index – Report
In conclusion, gender equality in terms of the division oftime proves to be one of the most challenging areas. Al-though some Member States achieve a relatively highscore, it should be noted that the indicator used to meas-ure involvement in care activities refer to a short period oftime during the course of a day (at least one hour a day). Ittherefore does not mean that high scores could be main-tained for other indicators measuring greater periods oftime spent in care activities. However, even with this lowthreshold, nearly half of Member States achieve relativelylow scores. In addition, involvement in leisure, cultural andcivic activities shows strong gender inequality. In order totransform the lives of both women and men, and impor-tantly, to transform gender relations, it is crucial to startaddressing the large gender gaps present in this domain.
5.2.5. Low powerEnsuring gender balance in decision-making, to safeguardthe equal share of power between women and men, ispositively associated with gender equality. The GenderEquality Index in this domain highlights a significant deficitin gender equality with an average score of 38.0 at EU level.Indeed, only five Member States have achieved a score thatis above halfway towards gender equality in the domain ofpower(FR, NL, DK, FI and SE) with a maximum score of 74.3in Sweden. Other Member States score below 20 in Cyprus,Luxembourg, Italy and Malta (Table 5.6.). A more detailedbreakdown of scores is provided in Annex 12.
Table 5.6. Gender Equality Index scores for the domain ofpowerCountrySEFIDKNLFRESBELVSIUKPLBGSKLTPTCZDEEEIEROHUELATMTITLUCYEU-27
Power74.368.860.052.250.347.245.238.636.035.234.533.833.132.130.629.628.027.526.524.924.424.424.318.718.614.712.238.0
Political91.585.977.869.263.875.465.738.943.552.435.147.931.835.644.134.459.434.730.420.115.141.463.130.131.244.831.949.9
Economic60.355.146.339.439.729.631.138.329.923.634.023.934.429.021.225.513.221.723.030.739.414.49.311.711.14.84.729.0
Gender Equality Index – Report
121
The first sub-domain ofpowermeasures political decision-making by measuring gender gaps in representation inministries, parliaments and regional assemblies. The EU-27,on average, has almost reached the halfway point towardsequality when it comes to political power, with a score of49.9. However, the scores throughout Member States interms of thepolitical representationof women and menshows very wide differences. Scores range from 15.1 in
Hungary to 91.5 in Sweden, showing the range of differ-ences in national situations. In total, four Member Stateshave reached scores above three-quarters of the way to-wards gender equality (ES, DK, FI and SE). There is a verystrong association betweenpolitical representationin deci-sion-making and the domain ofpower(r = 0.83) as can beseen in Figure 5.9.
Figure 5.9. Relationship between the domain ofpowerandpolitical decision-making
R2=0.6816480SE7060504030HU201011020304050Political60708090100ROSKCZIEMTITCYLUEEEU-27SILTELPTBGUKDEATFRBEPLLVNLESDKFI
Source: EIGE’s calculationsDistance towards gender equality is even farther in thesub-domain of equal representation in economic decision-making, measured by representation of women and menas members of boards in the largest quoted companiesand as members of the central bank. The EU average valueof only 29.0 stands for the lowest scores in the GenderEquality Index. In this subdomain, three Member States areextremely far from this gender equality score, with valuesbelow five in Cyprus and Luxembourg, and below 10 inAustria. An additional nine Member States (IT, MT, DE, EL,PT, EE, IE, UK and BG) stand below a quarter. Only Finlandand Sweden make it past halfway towards gender equalitywith scores of 55.1 and 60.3 respectively. Figure 10 showsthe strong correlation between this sub-domain and thedomain of power (r = 0.88).
122
Domain ofpower
Gender Equality Index – Report
Figure 5.10. Relationship between the domain ofpowerand economicdecision-making
R2=0.7826880SE7060NLDomain ofpower504030AT201010102030Economic40506070LUCYITMTDEELPTEE IEESBEEU-27UKBGCZSILTROPLSKHULVFRFIDK
Source: EIGE’s calculationsThe domain ofpowercalls for measures to increase gen-der equality in decision-making. Furthermore, the scoresshow the extent of the gender inequalities that exist inpolitical and economic power. While less than a hand-ful of Member States attain satisfactory gender equalityscores inpolitical power,the situation is even worse in thesub-domain ofeconomic power.The low gender equal-ity scores observed in this domain give a clear proof thaturgent action is needed.
5.2.6. To good healthThe scores of the Gender Equality Index show that EUMember States are, on average, close to gender equalitywhen it comes to health issues, with a score of 90.1 towardsgender equality, reflecting both the small gender gaps andhigh level of unmet needs that characterise health provi-sion in the EU. As a result, both the United Kingdom andIreland achieve nearly full equality with values at or above95 (Table 5.7.). A more detailed breakdown of scores is pro-vided in Annex 13.
Gender Equality Index – Report
123
Table 5.7. Gender Equality Index scores for the domain ofhealthCountryIEUKNLBELUMTSEELDKATCYITESFRFICZDESISKLTPTBGROEEHUPLLV
Health96.495.494.794.193.993.293.192.491.891.691.190.890.790.689.989.689.588.785.884.984.584.584.083.883.782.677.190.1
Status95.893.990.689.191.391.496.792.287.886.490.989.489.486.785.683.484.578.677.374.275.483.081.974.575.878.671.086.6
Access97.097.099.099.396.695.089.692.695.997.291.492.292.194.694.496.194.799.995.397.194.785.986.294.292.486.783.793.7
EU-27
Similar patterns emerge among the scores of the GenderEquality Index that examinehealth statusand absence ofunmet needs.Health status combines indicators that mea-sure self-perceived health, life expectancy and the numberof healthy life years at birth. An average score of 86.6 atEU level shows that there is a small gender gap inhealth
status,with two Member States achieving scores above 95(IE, SE). In other Member States progress is needed withscores below three-quarters in Latvia (71.0), Lithuania (74.2)and Estonia (74.5). This combination of indicators is strong-ly associated with the domain ofhealth(r = 0.91), as can beseen in Figure 5.11.
124
Gender Equality Index – Report
Figure 5.11. Relationship between the domain ofhealthandstatusR2=0.83232100IEBEAT90Domain of healthSILTEEHU80LVPTSKBGPLROCZDEFIFRESEU-27DKITCYNLLUMTELSEUK
707080Status90100
Source: EIGE’s calculationsAbsence ofunmet needs,measured in the second sub-domain by how much both medical and dental needs ofwomen and men were met, shows high achievements ofgender equality, with an EU average score of 93.7. Genderequality in terms of fulfilment of needs is virtually achievedin the Netherlands (99.0), Belgium (99.3) and Slovenia (99.9),although a small level of gender inequality remains inLatvia (83.7), Bulgaria (85.9), Romania (86.2), Poland (86.7)and Sweden (89.6). Figure 12 shows the positive associa-tion that exists between the sub-domain of access and thedomain of health (r = 0.63).
Figure 5.12. Relationship between the domain ofhealthandaccessR2=0.39353100IESECYELEU-27ESITFIBGROHUEE80LVPLDESKPTLTMTFRDKCZUKLUATSINLBE
90Domain of health
708090Access100
Source: EIGE’s calculationsGender Equality Index – Report125
The domain ofhealthshows a very optimistic pictureof gender equality, with high scores in the vast majorityof Member States overall and also for health status andaccess to health structures in particular. Although thesehigh scores are heartening, it is essential that MemberStates with lower scores are attentive to improvements,and that the very small level of gender gaps is maintainedor even decreased in the future.
ed) into the core Gender Equality Index. They provide,individually, a measure of gender gaps in employmentrates. They are, however, presented together with thescores calculated for employment rate among the popula-tion aged 15–64 to provide a comparative perspective.The results presented in Table 5.8. show that for workersborn in a foreign country, the overall gender equality scorefor the EU stands at just over three-quarters (75.6). Thescore is lowest for Slovakia (54.8) but reaches near equal-ity in Cyprus, where employment rates for foreign-bornworkers are both relatively high and with a low gender gap.Differences with the population aged 15 to 64 are mixedacross Member States. The gender equality score is higherfor foreign born individuals by over 10 points in Luxem-bourg (10.5), Malta (12.3), Cyprus (14.1) and Hungary (19.2).By contrast, there is a lower gender equality score of over10 points in the other direction, pointing to greater genderinequality in eight other Member States (SK, SE, BE, FI, NL,DE, DK and FR).
5.2.7. Intersecting inequalitiesScores within the domain ofintersecting inequalitiesweremeasured through gender gaps in employment ratesamong three groups of population: people that were for-eign-born (as a proxy for belonging to an ethnic minor-ity and/or being a migrant); older workers (aged 55 to 64);and people in households consisting of a single adult withone or more children (as a proxy for lone parents or carers).Since these represent illustrative groups only, and that thisstructure has not been reified with a multivariate analysis,the scores are not aggregated (nor by definition weight-
Table 5.8. Gender Equality Index scores for the variable ‘employment rate for people born in a foreign country’Intersecting inequalitiesForeign bornEmployment rateCYPTHULUDKLTLVATSIEEUKNLCZROSEDEFIIE98.690.287.387.384.784.783.883.783.781.281.280.978.678.678.677.777.275.884.582.068.176.895.276.479.589.084.081.386.692.875.669.993.288.689.775.0
Country
Population 15–64
126
Gender Equality Index – Report
Country
Intersecting inequalitiesForeign bornEmployment rate
Population 15–64
ESELFRITBGMTBEPLSKEU-27
75.471.869.969.466.765.463.261.754.875.6
70.364.780.162.175.753.175.971.270.378.1
Source: Eurostat, LFS (lfsa_ergacob)The lowest scores for the domain of intersecting inequalitiesconcern the gap in employment rate for older workers (55 to64 years-old), with an average of 55.2 at EU level (Table 5.9.).This presents a very mixed picture throughout the EU witha very wide range. Malta appears to be very far from genderequality with a score of 19.3, while Sweden is at the otherend of the spectrum with a score near equality of 94.7.Gender equality scores for older workers (55 to 64) are con-sistently lower than those for the population aged 15 to 64(with the exception of SE), with an EU average difference of22.9. Differences in gender equality scores reach as muchas 40.6 in Austria and 48.5 in Slovenia.
Table 5.9. Gender Equality Index scores for the variable ‘employment rate for older workers’Intersecting inequalitiesOlderworkersEmployment rateSEFIDKEEDEUKLVLTPTNLCYIEBGFRCZ94.779.176.374.472.070.667.965.462.161.160.760.254.053.750.993.289.795.281.388.686.679.576.482.092.884.575.075.780.175.6
Country
Population 15–64
Gender Equality Index – Report
127
Country
Intersecting inequalitiesOlderworkersEmployment rate
Population 15–64
ATESROLUHUBEELSKITSIPLMTEU-27
48.447.747.445.043.342.041.641.337.835.435.019.355.2
89.070.369.976.868.175.964.770.362.184.071.253.178.1
Source: Eurostat, LFS (lfsa_ergacob)Among households with a single adult and one or morechildren, the gender equality score for employment ratestands at 78.8 at EU level (Table 5.10.). While Luxembourgalmost reaches the gender equality point with a scoreof 94.6, in other Member States, differences are moremarked. This is the case of Malta (54.7), Ireland (55.6) andthe UK (66.1).Despite scores for lone parents or carers being closeto gender equality, on average in the EU, the situationva-ries across Member States. The level of gender equali-ty is higher for people living as a single adult with one ormore children than for the population aged 15–64 in themajority of Member States, with the greatest differencesregistered in Luxembourg (17.8), Slovakia (18.8), Romania(18.9), Greece (19.7) and Italy (24.4). However, in Ireland orthe United Kingdom the situation is reversed in favour ofthe population aged 15–64.
128
Gender Equality Index – Report
Table 5.10. Gender Equality Index scores for the variable ‘employment rate for personsliving in a household containing a single adult with one or more children’Intersecting inequalitiesLone parents/carersEmployment rateLUATSIDKLVPTSKEEROFIITCYCZELESLTFRHUPLBGNLSEDEBEUKIEMTEU-2794.693.393.292.391.090.989.289.088.886.686.485.785.684.484.284.184.082.282.081.680.480.279.874.266.155.654.778.876.889.084.095.279.582.070.381.369.989.762.184.575.664.770.376.480.168.171.275.792.893.288.675.986.675.053.178.1
Country
Population 15–64
Source: Eurostat, LFS (lfst_hheredty)
Gender Equality Index – Report
129
The scores are provided on an illustrative basis only andit is important to note that the issue of heterogeneity ofthe population is a pertinent aspect to address within a
gender equality perspective. The findings show that gen-der equality scores vary widely across Member States.
5.2.8. ViolenceTable 5.11. Gender Equality Index scores for the domain ofviolenceCountryBEBGCZDKDEEEIEELESFRITCYLVLTLUHUMTNLATPLPTROSISKFISEUKEU-27
Violence
No suitableindicators available
130
Gender Equality Index – Report
The domain ofviolence,due to a lack of harmonised andcomparable gender indicators at the EU level, remainsempty. It nonetheless represents an indispensable domainfor the measurement of gender equality. Maintaining thissatellite domain is motivated by the pressing need to startmeasuring this void, which, supported by suitable indica-tors could provide essential information in this domain.
Considering that the Gender Equality Index measures acomplex concept that is related to both social and eco-nomic spheres, this comparative analysis examines itsscores in the context of Gross Domestic Product (GDP),and in the context of spending on selected areas such associal protection, education, research and developmentand active labour market policies.The Gender Equality Index uses economic prosperity as ameasure of the situation and current development levelof Member States. Economic affluence measured throughGDP per inhabitant (in Purchasing Power Standard – PPS)is very varied in the EU, going from as little as 10,700 PPS inBulgaria to six times as much in Luxembourg (65,200 PPS)in 2010. The relation between the Gender Equality Indexand the GDP per capita (in PPS) shows a moderate positivecorrelation (r = 0.47). This means that there is a tendencyfor higher scores of gender equality among richer MemberStates, although this association is relatively low.
5.3. The bigger picture:the Gender Equality Indexin contextIn order to better understand the Gender Equality Index,scores are analysed together with other relevant variables.The identification of possible associations with other com-monly used indicators is an important step to contextual-ise the information extracted from the Index, as outlinedin the methodology developed by the OECD and the Eu-ropean Commission’s Joint Research Centre, which wereused to construct the Gender Equality Index.
Figure 5.13. Relationship between the Index and GDP per inhabitant (PPS)
R2=0.2217980SEFI70DKNL
GenderEquality Index
UK
60SIES50LVPL40BGRO3001020LTEECZMT CYIT
BEIEFR
DE
AT
LU
HUSK PTEL
30
40
50
60
70
80
GDPperinhabitant (PPS)
Source: EIGE’s calculations; Eurostat, Annual National Accounts (nama_gdp_c)
Gender Equality Index – Report
131
The association between the score of the Gender EqualityIndex and GDP per inhabitant (PPS) is affected by Luxem-bourg, which appears to be a strong outlier. This is likelyto be related to Luxembourg’s atypical characteristics as asmall Member State with sectoral labour market character-istics (large financial sector combined with international or-ganisations) that result in very high GDP per capita relativeto other Member States.When Luxembourg is removed (see Figure 5.14.), there isa significant improvement in association (r = 0.57), which
shows that richer Member States tend to have higherlevels of gender equality, as measured by the Index.However, it is important to stress that the results of gen-der equality can vary for Member States that share similarlevels of economic wealth. For example, the level ofwealth in Scandinavian countries (DK, FI, NL and SE) issimilar to that of other Western European Member States(AT, BE, DE, FR, IE and UK), but with significantly higherlevels of gender equality in the former than the latter.
Figure 5.14. Relationship between the Index and GDP per inhabitant (PPS) – Luxembourg omitted
R2=0.5665780SEFI70DKNL
GenderEquality Index
UK60SI50LVLT40BGRO301020GDPperinhabitant (PPS)3040PLHUSK
FRESDE
BE
IE
EECZPTCYITEL
AT
MT
Source: EIGE’s calculations; Eurostat, Annual National Accounts (nama_gdp_c)Spending on social protection ranged, in 2010, fromless than 20 % of GDP in Romania, Latvia, Bulgaria, Es-tonia, Slovakia, Poland, Lithuania and Malta, to as muchas one-third of GDP in Denmark or France. Spending onsocial protection is a more important predictor of highergender equality than GDP per person, given the positiveassociation between the scores of the Gender EqualityIndex and spending by Member States (r = 0.69). This as-sociation shows that countries that generally spend moreon social protection are also those with relatively higherscores of gender equality (Figure 5.15.).
132
Gender Equality Index – Report
Figure 5.15. Relationship between the Index and percentage of GDP on social protectionR2=0.4764880757065UK
SEDKFINL
GenderEquality Index
60SI55EE504540BG35RO30152025%of GDP on Social ProtectionPLLVSKLTCZHUMTCYPTELLU
BEFR
ES
IEDEAT
IT
30
35
Source: EIGE’s calculations; Eurostat, Social Protection statistics (spr_exp_sum)Gender equality scores also tend to rise with the spend-ing of Member States on education (r = 0.65) with Slovakia,Romania and the Czech Republic spending under 4 % oftheir GDP on education in 2010, compared with nearly 9 %in Denmark (Figure 5.16.). This shows that there is a generaltendency for higher proportions of spending on educa-tion in Member States which have higher scores of genderequality. Data on Greece and Luxembourg are not avail-able on Eurostat’s database.
Figure 5.16. Relationship between the Index and percentage of GDP on Education
90
R2=0.42633
80GenderEquality IndexFI70NLSEDK
UK60ES50CZSK40RO30456BGITPLHUMTLTPTDESILVATEEFR
BE
IE
CY
7%of GDP onEducation
8
9
Source: EIGE’s calculations; Eurostat, Education statistics (educ_figdp) (2009) Source: EIGE’s calculations; Eurostat,Education statistics (educ_figdp) (2009)Gender Equality Index – Report133
There are large differences in the spending allocated onresearch and development (R&D), as a percentage of GDP,among Member States in 2010, with as little as 0.5 % in Ro-mania and Cyprus, to nearly eight times as much (3.9 %) inFinland. This spending is strongly positively associated with
higher levels of gender equality (r = 0.84) as can be seen inFigure 17. This is an important finding which suggests thatMember States which spend a greater percentage of theirGDP on R&D tend to have higher scores of gender equality.Data on Greece are not available on Eurostat’s database.
Figure 5.17. Relationship between the Index and percentage of GDP on R&D
90
R2=0.69903
80DKSEFI
NL70GenderEquality Index
60ESLU50LVCY40RO3001SKBGPLLTMTSKHUITPTCZ
UKIEEE
BESIFRDEAT
2%of GDP on R&D
3
4
Source: EIGE’s calculations; Eurostat, Statistics on research and development (rd_e_gerdtot)Finally, spending on active labour market policies showsmoderate association (r = 0.70) with levels of gender equal-ity. Spending in Member States ranges from less than 0.1 %in Romania, Malta, the United Kingdom and Bulgaria, tomore than 1 % in Belgium and Denmark (Figure 5.18.). Thisrelationship shows that there is greater proportional spend-ing on active labour market policies among Member Stateswhere scores show greater levels of gender equality.
134
Gender Equality Index – Report
Figure 5.18. Relationship between the Index and percentage of GDP on Active Labour Market Policies
R2=0.4950390
80SEFIGenderEquality Index70UK
DK
NL
60EE50MT40RO3000.2BGCYSKELLTCY
SILUDELVPLITHUPT
BEESIEATFR
0.4
0.6
0.8
1
1,2
1,4
1,6
%of GDP on ActiveLabourMarket Policies
Source: EIGE’s calculations; Eurostat, Labour market policy 2010 (lmp_ind_exp) (for UK year 2009)The results show that, despite a relatively weak relation-ship between the overall economic development of Mem-ber States (measured by GDP per inhabitant) and genderequality, much stronger links exist between how closeMember States are to achieving gender equality and theirstructure of public expenditure: percentage of GDP spenton social protection, education, research and develop-ment, as well as active labour market policies. The highestassociation was found between the Index and the spend-ing on research and development, followed by spendingon active labour market policies and social protection ingeneral. These findings suggest that the structure of pub-lic expenditure – that is, the financial resources allocatedto particular public policy areas – is more important forachieving gender equality than economic affluence itself.
5.4. ConclusionThis section has presented the overall scores of the Gen-der Equality Index at EU level, as well as for each MemberState. Scores have, in addition, been provided at domainlevel, giving a comprehensive overview of how far Mem-ber States have come towards achieving gender equality.Furthermore, these scores have been analysed in light ofthe economic situation of Member States, to assess the ex-tent to which gender equality relates to levels of economicdevelopment and the structure of public expenditure. Thenext section closes the report by discussing the main find-ings of the report and some concluding comments.
Gender Equality Index – Report
135
6. ConclusionThe Gender Equality Index is a unique measurement toolof gender equality that combines indicators, according toa multidimensional framework, into a single composite in-dicator. It relies on sound and transparent methodologicalprinciples, and is easy to interpret and communicate.The Gender Equality Index consists of six core domains:work, money, knowledge, time, power, healthand two sat-ellite domains:intersecting inequalitiesandviolence.Thesatellite domains are conceptually related to the Indexbut are not included in the core Index because theymeasure specific population groups, such as lone par-ents or people with disabilities for intersecting inequali-ties, instead of the full population. The Index providesresults on three levels: EU level (EU average), MemberStates level and scores in each domain and sub-domain.It measures gender equality in 2010 by showing how far(or close) each Member State is from achieving genderequality.gender equality effects are taken into account in impactassessments of EU policies. The Council encourages tofurther develop existing statistics and indicators disaggre-gated by sex to support this process. The Gender Equal-ity Index can play an important role by allowing MemberStates to analyse the situation with regards to gender gapsand levels of achievement in indicators measured at the in-dividual level, make comparisons with the EU average andassess how far a given Member State is from reaching gen-der equality. The scores within each domain, rather thansolely in the overall Index, represent a valuable supportin identifying the direction to take to tackle gender gapswithin a specific policy area. Moreover, the results of theIndex may suggest where policy action can be directedby allowing meaningful comparisons to be made betweendifferent domains.Another added-value of the Gender Equality Index is that itcomplements a broader analysis of policy achievements atnational level, by providing a measure of gender equalityat individual level. Through analysing the impact on indi-vidual women and men, the Index can demonstrate theprogress of the Member States in the implementation ofEU policies, and add additional perspective to the processof assessing the achievement of targets defined in the Eu-ropean Semester.In the future, each new release of the Index can also pro-vide an overview of the progress made by Member Statesover time in closing gender gaps and improving the levelof achievement in gender equality overall.
6.1. What value does it add?The Gender Equality Index presents some unique featureswhen it comes to measuring gender equality. Specifically, itadopts a gender approach (considering both women andmen) rather than a women’s empowerment approach, re-lies on a more comprehensive framework of gender equal-ity than other women’s or gender equality indices, and isspecifically tailored towards the EU gender equality policyframework and objectives.The Gender Equality Index aims to be as comprehensiveas possible in terms of mapping gender equality issueswithin the frame of EU policy, and is not conceptuallybound by concerns over data availability. As a result, itoffers a powerful tool that highlights gaps in data, andcalls for harmonised, comparable and reliable data thatare both disaggregated by sex and available for all Mem-ber States.In the European Pact for Gender Equality 2011–2020, theCouncil (2011) reaffirms its commitment to reinforce gov-ernance through gender mainstreaming by integrating agender perspective into all policy areas and ensuring that
6.2. How is it built?The Gender Equality Index is formed by combining genderindicators, according to a conceptual framework, into a sin-gle summary measure. The framework provides a concep-tual map of what the critical domains of gender equalityare within the remit of the EU gender policy agenda.The Gender Equality Index relies on a statistical metho-dology that is both solid and transparent. The computa-tion of the Index involves different steps where severalchoices have to be made. It is essential to work with a
136
Gender Equality Index – Report
methodology based on sound statistical principles. Themethodology applied is based on the widespread andinternatio-nally accepted procedure developed by theOECD and the European Commission’s Joint ResearchCentre (Nardo et al., 2008).Stringent quality criteria are applied to the gender indi-cators that can be included. The minimum requirementsare that variables refer to the same year (the latest year forwhich all variables are available is 2010) and are also bothavailable and comparable across all Member States. Allthe variables used are transformed by using a metric thatmeasures gender gaps adjusted by levels of achievement.This takes into account the context of Member States, en-suring that gender gaps cannot be regarded positivelywhen they point to an adverse situation for both womenand men (for example low gender gaps combined withlow levels of educational attainment.The methodology creates a measurement framework,providing valuable information on which indicators areselected and how they are aggregated, based on theoriginal conceptual framework. Finally, the Gender Equal-ity Index distances itself from the subjectivity of choosinga weighting and aggregation method by relying on a ro-bustness analysis based on a multi-modelling procedure.This means calculating the set of all potential indices, andselecting the one that adheres most closely to the medianscore of all indices: in other words the most robust Indexamong them all.The quality assessment of the Gender Equality Index con-firms that it is a robust measure with an internal structurethat is both statistically coherent and consistent with thesoundness of a strong theoretical framework. In order toensure full transparency, every step followed in the con-struction of the Index is explained in detail in the report,facilitating the replication of the process to the users.
and sub-domains, which illustrates the key gender equal-ity issues identified by the conceptual framework of theGender Equality Index.The scores of the Gender Equality Index show that, overallin the EU, gender equality remains far from a reality, withthe most problematic areas in the domains ofpower, timeandviolence.
6.4.1. Power: EU and Member Stateschallenged by large imbalance indecision-makingGender imbalance in decision-making remains an im-portant challenge at EU level and for all Member States.Women are greatly under-represented in top positionsof decision-making in the majority of Member States.Despite the fact that women make up nearly half of theworkforce and account for more than half of tertiary oflevel graduates, the proportion of women involved intop-level decision-making remains very low. This dis-crepancy shows a waste of highly-qualified and skilledhuman resources.The domain ofpowershows the extent of the low levels ofgender equality in decision-making, political and econom-ic, with an overall score at EU level of 38. This is the areawhere the lowest gender equality score can be observed,with the majority of Member States below this level.Low levels of gender equality in political decision-makingIn political decision-making, few Member States attaingender equality scores above 50 (up to a maximum scoreof nearly 75), despite the strong policy focus in this area atEU level or in wider international frameworks such as theBeijing Platform for Action (BPfA) or the Convention for theElimination of All Forms of Discrimination against Women(CEDAW). This finding proves the importance of the key ac-tions to be taken by the Commission as underlined in theStrategy for Equality between Women and Men 2010–2015(COM(2010) 491 final) to ‘consider targeted initiatives toimprove the gender balance in decision-making’; ‘monitorprogress towards the aim of 40 % of members of one sexin committees and expert groups established by the Com-mission’ and ‘support efforts to promote greater participa-tion by women in European Parliament elections includingas candidates.’
6.3. Main resultsThe scores of the Gender Equality Index, overall and inboth domains and sub-domains, provide a detailed assess-ment of where EU Member States stand with achievinggender equality in selected policy areas. Scores representthe distance covered in reaching gender equality, with 100representing full equality. These were supported by ananalysis of the gender indicators selected for the domains
Gender Equality Index – Report
137
The lowest gender equality score can be found ineconomic-decision makingIn economic decision-making, women are even moregreatly under-represented in the vast majority of MemberStates, with the lowest score of the Gender Equality Indexobserved in the context of the representation of womenand men on the boards of the largest quoted companies.This is an important finding, given the launch by the Eu-ropean Commission in 2011 of the ‘Women on the BoardPledge for Europe’ – a call on publicly listed companiesin Europe to sign a voluntary commitment to increasewomen’s presence on corporate boards to 30 % by 2015and 40 % by 2020, by means of actively recruiting qualifiedwomen to replace outgoing male members.Indicators to measure social power in decision-making areof insufficient data qualityAt present, the Gender Equality Index does not cover thesub-domain of social power because none of the availablegender indicators in this area fulfill the statistical criteria,given that harmonised and comparable sex-disaggregatedstatistics are not available across all Member States.Strategic policy documents focus on the potential of in-creased participation of women in science and research toincrease competitiveness and maximise innovation potential,however, one of the EU goals of achieving at least a quarterof women in leading positions in the public research sector(Strategy for Equality between Women and Men 2010–2015(COM(2010) 491 final), has not yet been achieved. Althoughdata is available on decision-making in the social sphere, thedata covering science and technology, academia, media, re-ligious organisations or civil society does not meet the sta-tistical criteria for inclusion in the Index.The domain ofpowerprovides an opportunity to addressgender inequality fastThe issue of power in decision-making is one of the mostrelevant measures of gender equality. Not only is it a do-main where some of the lowest scores have been ob-tained, but it is also a domain that has a huge potentialimpact on all other domains of gender equality. Secondly,as opposed to other domains of gender equality, it hasthe potential to be changed within a relatively short time.For example, while increase in labour market participationtakes place over the mid to long-term, the evidence fromMember States with more women in top decision-makingpositions shows that political will and targeted measures(such as implementing a system of quotas) can make a dif-ference in a relatively short amount of time.138Gender Equality Index – Report
6.4.2. Time: inequalities in the divisionof time between women and menpersistThe use oftimefor work and private life is a particularlygendered issue because of the disproportionate amountof care time attributed to women. Personal time spent oncare plays an important role in the individual’s capabilityto integrate or balance work and private life. This is a keyelement which impacts on participation in employment,quality of work and care responsibilities. The domain oftimepresents the second lowest overall score of genderequality, with an average EU score of 38.8. The divisionof time is very uneven across Member States, with scoresranging from well below a quarter to nearly three-quartersof the way towards gender equality.Women remain disproportionately responsible for caringactivitiesWomen are, throughout all Member States, disproportion-ally responsible for caring and educating children, grand-children and other dependents, as well as cooking andhousework. The findings of time-use surveys in severalcountries offer some evidence that the gender gap in theallocation of time for caring activities may have gone upduring the crisis, in countries where gender disparities inhousework and care work are especially pronounced (Eu-ropean Commission, 2013).The unequal division of time extends to other activitiesGender differences in how time is spent extend to othersocial activities such as cultural, leisure or civic activities.The division of time largely represents a trade-off betweenvarious activities. While women spend a disproportionateamount of time on caring activities, compared with men,they participate less in other social activities, such as sport-ing, cultural or leisure activities. Gender differences are un-even across Member States when it comes to voluntary orcharitable activities, with instances where gaps are small orinexistent, but also Member States with large gaps that caneither disadvantage women or men.Addressing the division of time can provide an opportu-nity towards transformative changeThe importance of gender inequality in the division oftime and participation in different tasks, including the pro-motion of long-lasting changes and a fairer distribution inparental roles, family structures, institutional practices andorganisation of work and time, for both women and men,
is an important area of gender equality, considered by theEU policy agenda. The findings of the Gender Equality In-dex reaffirms the importance of the measures to promotebetter work-life balance for women and men, namely theobjectives set at the European Council in Barcelona in 2002(SN 100/1/02 REV 1), with regard to adequate, affordableand high-quality childcare provision or the call to promotecohesion and employment opportunities for workers,including promoting men´s role in the family, equalitybetween women and men and reconciliation of work andfamily life as stipulated in the Council Conclusions of June2011 (EUCO/2311).Improvements in indicators to measure time are neededThe domain oftimewould benefit from indicators producedin the Harmonised European Time Use Survey (HETUS),however, these indicators are thus far unusable because ofa serious lack of reliable country and time coverage (datacollection ranges from as early as 1990 in 8 countries to2008 in 15 countries) combined with important concernsover data harmonisation and comparability.Differences in the division of time among women andmen have consistently been referred to as both a causeand a consequence of gender inequality. Women’s dispro-portionate responsibilities for care impede their chancesto fully participate in other domains such as work. At thesame time, within a gender transformative approach, agreater involvement of men in care activities is to be wel-comed, to facilitate the transformation of gender relations.These are therefore important aspects for measurement,analysis and transformation.
that conceptually combines direct and indirect violence,recognising that women are exposed to higher risks ofgender-based violence than men and that gender-basedviolence disproportionally affects women.Insufficient gender indicators to measure gender-basedviolence against womenThere are generally few indicators that can measure gen-der-based violence against women, since principles ofcrime classification systems for statistical use have yet tobe established in the EU. The possibility of obtaining com-parable administrative data on gender-based violence isalso very limited at the EU level as there is no commonmethodology agreed within the Member States.The norms, attitudes and stereotypes that largely underpingender-based violence against women also remain criti-cally under-measured, with, as a result, a strong dearth ofpotential indicators. There are to date no data sources thatprovide reliable, harmonised and comparable data for allMember States on these aspects.Coupled with the methodological constraints of the GenderEquality Index that require harmonised, available data overtime, it was not possible to identify suitable indicators. This issymptomatic of a deeper dearth of information and data atnational and international level, although some of these datagaps may soon be partly addressed by the EU-wide surveyon gender-based violence against women carried out by theEuropean Union Agency for Fundamental Rights.Statistical gaps in measuring gender-based violence againstwomen is important evidence in supporting the EuropeanParliament’s resolution on priorities and the outline of arecent EU policy framework to fight violence against wom-en. It calls on the European Commission to develop andprovide annual statistics on violence against women. Thisresolution also calls on Member States to show clearly intheir national statistics the magnitude of violence againstwomen, including its gender-based nature, and to takesteps to ensure that data is collected on the sex of thevictims, the sex of the perpetrators, their relationship, age,crime scene, and injuries (2010/2209(INI). The Council inits Conclusions of December 2012 (17444/12) also calls toimprove the collection and dissemination of comparable,reliable and regularly updated data on victims and per-petrators of all forms of violence against women at bothnational and EU level.The extent to which the absence of indicators reflectsgender relations should be questioned. The issue of what
6.4.3. Violence: the biggest gap of all?Gender-based violence against women remains one of themost pervasive human rights violations of our time, under-mining women’s dignity and integrity, as well as imposingserious harm on individuals, families, communities and so-cieties. It is a manifestation of historically unequal powerrelations between women and men, which poses a majorobstacle to the achievement of equality between womenand men. In the EU, 9 out of 10 victims of intimate partnerviolence are women. Even if the data are scarce, it is esti-mated that up to one quarter of all women in the EU havesuffered physical violence at least once during their adultlives (Council of Europe, 2006).The domain ofviolencerepresents the largest statisticalgaps in measuring the progress of gender equality at EUlevel in this area. It is a crucial domain of gender equality
Gender Equality Index – Report
139
is being measured, or in this instance, not measured andwhy, are important questions. Therefore, the Gender Equal-ity Index should be seen as a tool that calls for this data tobe collected to fully measure gender equality within theframework of EU policy.
Participation in lifelong learning remains low and is morefeminised where participation is higherWomen are over-represented in lifelong learning, despitethe fact that in many Member States, participation ratesremain low. This trend points to the need to pay attentionto both improvements in levels of achievement along witha reduction of disparities between Member States, andthe elimination of gender gaps. To promote adaptabilityand employability, active citizenship, as well as personaland professional fulfilment, the policy agenda focuses onenabling women and men to take part in lifelong learn-ing. The findings of the Gender Equality Index reaffirmsthe importance of one of the key targets of the EuropeanCooperation in Education and Training (ET2020) to have atleast 15 % of adults (25–64) involved in lifelong learning by2020, a target that is currently still out of the reach in themajority of Member States.The importance of lifelong learning in the policy agendahas also emerged, stemming from the necessity to increas-ingly adapt and shape a new environment, characterisedby rapid advances in innovative technological advances,including but not limited to the emergence of new formsof information and communication technologies. The Dig-ital Agenda for Europe, as a flagship initiative under theEurope 2020, aims to support growth and jobs by focusingon several areas, including ensuring the development ofdigital skills.
6.4.4. Knowledge: women’s educationalattainment overtakes men’s butsegregation patterns persistThe domain ofknowledgecombines different areas relatedto education and training. From a gender perspective, it is animportant area since it appears to be a precursor to changein gender terms, with women now outnumbering menwithin third-level education, although gender segregationin different fields of education remains largely unchanged.The scores in the domain ofknowledgein the GenderEquality Index show that the Europe 2020 remains far fromequality, with an EU average score of 48.8, just below half-way towards gender equality. There are different situationsin Member States, where scores range as low as just abovea quarter to three-quarters of the way towards equality.The role of higher education in society is essential to fosterknowledge and promote innovation. The Europe 2020 Stra-tegy calls for Europe to act in the fields of education, train-ing and lifelong learning to contribute to delivering smart,sustainable and inclusive growth. Gender equality in edu-cation is an important precondition to reach this objective.The results of the Gender Equality Index on educational at-tainment provides important findings, given one of the keytargets of the Europe 2020 Strategy is to increase the shareof the population aged 30–34 having completed tertiaryeducation from 31 % to at least 40 % in 2020(IP/10/225).Gender segregation in educational fields remain highDespite the changes in educational attainment of womenand men, segregation patterns remain deeply entrenchedthroughout Member States, with women over-representedin feminised sectors such as education, health and welfare,humanities and arts. The number of women graduatesin technical sciences and engineering remains dispropor-tionally low. It is important to tackle gender segregationin education as it translates into further inequalities in thelabour market and contributes to differences in economicindependence of women and men. Addressing patternsof segregation is an essential feature of building a moregender equal society.
6.4.5. Work: gender disparities in howwomen and men are getting in andgetting on in the labour marketThe domain ofworkexamines not only patterns of howwomen and men are getting into the labour market, butalso how they are getting on there. It captures some ofthe gendered patterns that exist within the labour market:participation, segregation and quality of work. Althoughthe domain presents a relatively high overall score of 69on average at EU level, there remains much room for im-provement before reaching full gender equality. The find-ings show that segregation patterns remain strong andthat they are associated with quality issues such as train-ing, health and safety at work, as well as flexible work-ing arrangements, with a mixed picture across MemberStates. It also considers participation of women and menin the labour market, corroborating evidence that differ-ences exist in terms of part-time work and duration ofworking life.
140
Gender Equality Index – Report
Women remain less likely to participate in the labour marketDespite an encouraging trend towards gender equality inemployment at EU level, the gender gap in employmentrates still persists. Given the fact that more women thanmen work on a part-time basis, gender gaps in employ-ment may in fact be underestimated, without resorting tocomparisons in the full-time equivalence. Full-time equiva-lent employment rates show that gender gaps in employ-ment are even wider. Women continue to be less likely toparticipate in the labour force, throughout all EU MemberStates, they are working fewer hours when they do so,and spend fewer years overall in work than men. Thesetrends show that women are at higher risk of economicdependence in terms of income, responsibility and power.However, it is important to note, that developments in em-ployment and unemployment during the last four yearsof recession provide evidence of a downward levelingof gender gaps through greater employment losses andhigher unemployment expansions among men (EuropeanCommission, 2013).At policy level, the Gender Equality Index scores show thatwide gender gaps remain in achieving the Europe 2020target of ensuring that 75 % of the population aged 20–64should be employed (IP/10/225). Experiences of workinglives for women and men represent the heart of the EUpolicy agenda on gender equality. Incentives to increasewomen’s participation in the labour market have been in-creasingly supported by ensuring that gender gaps in fam-ily-related entitlements, such as parental or carer’s leave ormeasures to support greater work-life balance, are beingaddressed.Large gender segregation in the labour market remain prevalentGender segregation of labour markets is another issuewhich exacerbates gender inequalities in terms of thegaps in earnings, impacts on career advancement, qual-ity of work and eventually on economic independenceof women and men. The scores show the level of genderinequality in terms of segregation, with women persist-ently representing a strong majority of those workingin typically feminised sectors such as education, healthservices and social work.The gendered nature of quality of work needs to be measuredThe EU policy focuses not only on providing more jobs,but also on ensuring the provision of better jobs as partof the Europe 2020 Strategy. The Gender Equality Index
includes indicators of quality of work, measuring flexibil-ity of working time, health and safety at work and trainingat work, which show persisting gender inequalities whichvary widely across Member States. Due to stringent sta-tistical criteria, several other indicators of quality of work(e.g., work-life balance) were excluded from analysis. Nev-ertheless, the findings of the Index provide a qualitativecontribution to the broader analysis of work-life balanceprovisions, such as flexible work arrangements, childcare,elderly care or parental leave provisions, which comprisea major focus area of the EU policy agenda and EuropeanSemester recommendations. Given that work-life balanceis a highly gendered issue, the interpretation of the scoresof the Gender Equality Index in relation to work-life bal-ance provisions represents important avenues of furtheranalyses.
6.4.6. Money: lower earnings and incomeamong women lead to greater riskof poverty and higher disparities ofincomeEconomic independence is seen as a prerequisite for Eu-ropean citizens, both women and men, to exercise con-trol and make genuine choices in their lives. However,women remain in more precarious situations throughoutthe EU in terms of access to financial resources and eco-nomic situation. Women experience higher disadvantagesin the labour market than men, women also earn less thanmen, with progress in closing the gender gaps in earningspainstakingly slow, the feminisation of poverty prevails.The domain ofmoneyshows scores of gender equalitythat are similar to the domain of work, on average at theEU level. However, it is important to interpret these scoreswith caution since available indicators may underestimatethe true extent of gender gaps in this area. The domainmeasures two key aspects: financial resources, that is, gen-der gaps in earnings and income, combined with econom-ic situation by focusing on being at-risk-of-poverty and in-come distribution.Women receive lower earnings and income than men inthe EUThe focus on equal pay is prominent in key policy docu-ments at EU and Member States’ level. Despite the fact thatMember States are required by the Lisbon Treaty (Article157) to ensure that the principle of equal pay for womenand men workers for equal work or work of equal value
Gender Equality Index – Report
141
is applied, there remains a long way to go towards fullgender equality. Scores for gender gaps in earnings andincome range enormously across Member States, from lessthan a quarter to near gender equality, with a gender gapthat constantly works to the advantage of men.In addition to pay, the policy focus extends to income inthe form of social transfers, with for example the Europe2020 Strategy emphasising the need to ensure adequate in-come support from social security and pension systems inMember States. However, the Gender Equality Index scoresshow the necessity to close gender gaps in this area, withwomen having less income after social transfers than men.Women are at a disadvantage in terms of their economicsituationDifference in earnings and income do not translate in astraightforward manner to economic situation, where gen-der gaps range from nearly two-thirds to a level, close toequality, suggesting that there is more gender inequalityin earnings and incomes than in the resulting economicsituations. It is important to note, however, that when gapsremain in being at-risk-of-poverty, it is an issue that dispro-portionately touches women.Tackling poverty remains a focus of EU policy, as defined bythe Europe 2020 target (IP/10/225) to reduce the numberof individuals at-risk-of-poverty by 20 million, by reducingthe number of individuals living below the national povertyline by 25 %, the majority of which are women. Lower earn-ings and income, however, appear to be related to higherincome differences between the poorest and richest wo-men and men, a finding which highlights how genderequality can be related to a fairer society for all.Individual rather than household level indicators couldmeasure gender differences in a more sensitive waySerious concerns with indicators available to measurethe domain ofmoneyalso exist, with a dire need fordata on income disaggregated at the individual level.Indeed, most of the gender indicators which are includedin the domain ofmoney(mean equivalised income, in-come distribution, at-risk-of-poverty) are collected at thehousehold level and rely on the assumption of equaldistribution of financial resources between members ofthe household. This is problematic since it ignores pos-sible power relations within the family, and thus under-estimates the true extent of gender gaps in this domain.
The need for better disaggregated data at individual levelarises. Moreover, additional information, on access to mi-crocredits, as well as the inflows from other financial as-sets (bonds, stock, real estate, etc.) would provide a bet-ter picture of gender gaps in terms of financial resourcesand economic situation.
6.4.7. Health: low gender gaps throughoutmost EU Member StatesGender gaps, coupled with high levels of achievement inthe domain ofhealthpresent a picture with a high score ofgender equality (90.1) throughout the EU Members States.The challenge in this area is to ensure that needs of womenand men are met with levels of achievement, in genderequality raised without increasing gender gaps, as healthis directly linked not only to economic independence, butalso to dignity and physical integrity.Low gender gaps exist in access to health structuresThe domain overall shows small or inexistent gender gapsin unmet medical or dental medical needs, although thescores in the latter are relatively lower. Ensuring better ac-cess to a healthcare system remains central to EU policy,specifically in relation to the demographic changes takingplace across Europe.The economic crisis also brought new challenges relatedto public healthcare provisions. Evidence exists that somecountries have boosted health and long-term care facilitiesbut many others have raised fees or reduced health or carerelated monetary benefits as part of public expenditurecuts. This has a disproportionate impact on women (Euro-pean Commission, 2013) and means that it will be impor-tant to monitor gender gaps in the future.The old adage that ‘women get sicker and men die young-er’ remains largely trueLow gender gaps combined with high levels of achieve-ment in meeting medical needs of women and men donot however fully translate into fewer differences in termsof health status. Indeed, healthy life years continue to showthat small gender gaps remain. In line with EU policy in thisarea it is important to recognise the gender dimension inhealth and continue to address health outcomes, includinggender-specific health risks and diseases.
142
Gender Equality Index – Report
Sex-disaggregated indicators to measure health behaviourare lackingIt was not possible to identify suitable gender indicators onhealthy or unhealthy behaviour of women and men thatfulfilled the necessary criteria for inclusion in the GenderEquality Index (sex-disaggregated, harmonised and avail-able for all Member States). Information of the smokingand drinking patterns of individuals, collected by WHO andEurostat, does not provide sex-disaggregated data or thedata are not available for the majority of the EU countries.This evidence reaffirms the importance of promotion andstrengthening the comparability and compatibility of gen-der-specific information on health across Member Statesand at EU level through the development of appropriatedata, as stipulated in the Council Conclusions on Women’sHealth in 2006 (2006/C 146/02).
ing inequalities contribute to gender equality overall, theyrepresent an opportunity to debate this important area ingreater depth.The process of building a composite indicator has beengreatly impaired by working at macro-level, using a mergeddata set that merges several sources. A dedicated survey,collecting micro-data would facilitate significantly propermeasuring of gender equality and would sufficiently ex-pand current data collection efforts. Such data would alsoallow, sample size permitting, to calculate the index hori-zontally for different groups of people, following the princi-ple of intersectionality.
6.5. Use and interpretation of theGender Equality IndexThe Gender Equality Index is a synthetic statistical tool thatprovides a measure of gender equality within the EU policyframework. However, since this measure is based on individ-ual level variables, it needs to also be analysed further withinthe framework of wider gender policy perspectives, whichare not bound by the stringent statistical considerations ofbuilding a composite indicator. It is therefore fundamentalto analyse its general score, and scores at sub-domain level,in connection with institutional or macro level variables. Forexample, the results of the Gender Equality Index can beanalysed in relation to the provision of legal frameworks,policy measures and services. To contextualise the GenderEquality Index on national level, a set of country profiles asan Annex to the publication is provided.The Gender Equality Index can also become a very valu-able tool of gender analysis by adopting a cross-domainperspective. The creation of the composite indicator al-lows measuring gender equality in relevant domains;however, the complexity of gender equality can indeedbe better understood by analysing the links between twoor more domains.The interpretation of the Gender Equality Index and gendergaps in relevant domains requires a consideration of theimpact of economic crisis on women and men. For exam-ple, an unintended consequence of the crisis has been atemporary reduction in certain gender gaps. This, however,has not been a sign of improved gender equality, but thatof worsening conditions for both women and men (Euro-pean Commission, 2013). It is therefore imperative to ana-
6.4.8. Intersecting inequalities: disparitiesbetween women and men amongdifferent groups matter as thesemay be linked to different levels ofgender equalityThe principle of intersecting inequalities is enshrined in theEU Treaties. The Treaty of Amsterdam (97/C 340/05) markeda turning point by adding the grounds of race, ethnicity,religion and belief, age, disability and sexual orientationto the already present ground of nationality and sex. Thisprinciple is also reinforced in the Charter of FundamentalRights of the European Union (2000).Within the Gender Equality Index, illustrative scores areprovided, showing that focusing on intersecting factorsis a pertinent aspect of gender equality to consider, sincethey can greatly affect gender scores. The indicators consid-ered were proxies that analysed employment rates amongmigrants and/or minority groups, older workers and loneparents or carers. The focus on gender patterns of specificgroups of population is particularly relevant in times of ma-jor economic, social or demographic transformations. Forexample, it is noted by several studies, the most vulnerablegroup during the recent economic crisis is male migrants(from outside the EU), who were worst hit by job losses (Eu-ropean Commission, 2013).The aim of inclusion of those indicators in the initial Gen-der Equality Index is to provide an initial reflection point.Although relying on illustrative groups is not in itself suf-ficient to draw on strong conclusions as to how intersect-
Gender Equality Index – Report
143
lyse gender gaps in conjunction with a thorough analysis oflevels of achievement in gender equality, as they are proneto change in the context of the crisis or other social andeconomic transformations.The Gender Equality Index provides a comprehensivemeasure of equality between women and men relevant tothe EU policy framework. The results have shown that theEU is halfway towards gender equality, although there arelarge differences between Member States in how close theyare to the equality point. The biggest gender gaps can befound in the areas of decision-making and the division oftime, with the Gender Equality Index also pointing to theabsence of suitable data to measure gender-based violenceagainst women. These results show the extent of the workthat remains to be done to make gender equality a reality.The Gender Equality Index serves the decision-makers, poli-cy implementers and individuals as reliable reference points,which present the current gaps between the women and
men of Europe, in the context of EU policies. The Index canadd a qualitative perspective to the macro-level analysis ofachievements of the EU within the area of equality betweenwomen and men. Comparison over time, through the firstupdate of the Gender Equality Index in 2015, will provide aninvaluable assessment of progress of the Member States inreaching greater gender equality.The Gender Equality Index provides decision-makers, pol-icy implementers and other users with a reliable source ofreference, which presents the current gaps between thewomen and men of Europe, in the context of EU policies.The Gender Equality Index enriches perspectives based onmacro-level analyses by providing a synthetic, yet compre-hensive and flexible, measure that can support the evalua-tion of the effectiveness of gender equality policies. Com-parison over time, through the first update of the GenderEquality Index in 2015, will provide an invaluable assess-ment of the progress made by Member States in reachinggreater gender equality.
144
Gender Equality Index – Report
7. AnnexesAnnex 1: Domains of the Gender Equality Index within various theoretical frameworksand strategic policy documentsTable 1.1. Domains of the Index in various theoretical frameworksDomainBaker et al.FraserPascall &LewisPaid work
Nussbaum
Robeyns
Work
Working andlearning as equalsEqualityof resources
Anti-exploitation
Control overone’s environmentControl overone’s environment
Paid work and other projects
Money
AntipovertyAnti-exploitationIncome equalityAnti-marginalisation
Income
Power
Equalityof powerWorking andlearning as equals
Voice
Control overone’s environmentSenses, imagination,and thoughtPractical reason
Political empowerment
Knowledge
Education and knowledge
Time
Love, care andsolidarity
Leisure time equality
Care workTime
EmotionsAffiliationPlay
Social relationsDomestic work and non-marketcare Leisure activitiesTime-autonomyLife and physical healthMental well-being
Health
Equality ofresources
LifeBodily healthBodily integrityAnti-exploitationAnti-marginalisationEquality of respectEquality of respectAnti-androcentrismEqual worth
Intersectinginequalities
Equal respectand recognition
MobilityReligionEquality of respectBodily integrity and safetyRespect
Violence
Equal respectand recognition
Bodily integrityAffiliation
Gender Equality Index – Report
145
Table 1.2. Domains of the Index in EU strategic policy documentsDomainCommunityFrameworkStrategyon GenderEquality(2001–2005)Equalparticipationand repre-sentationRoadmap forEquality betweenWomenand Men(2006–2010)European Pactfor GenderEquality(2006)Women’sCharter (2010)Strategy forEqualitybetweenWomen and Men(2010–2015)Europe 2020(2010–2020)The New EuropeanPact for GenderEquality(2011–2020)
Work
Equal economicindependence forwomen and men
Gender gaps inemploymentand socialprotectionGender gaps inemploymentand socialprotection
Equaleconomicindepen-denceEqual pay forequal work andwork of equalvalueEquality indecision-making
Economicindependenceof womenEqual pay
75 % of the 20–64year-olds to beemployedReducing the numberof people in or at riskof poverty and socialexclusion by at least20 million
Promoting genderequality in the labourmarket
Money
Power
Equalparticipationandrepresentation
Equalrepresentation indecision-making
Equality indecision-making
Ensuring equal accessand participationof women and menin decision-makingpositionsReducing schooldrop-out rates below10 % Ensuring thatat least 40 % of30–34 year-olds havecompleted thirdlevel education orequivalentPromoting genderequality in ineducation andtraining
Knowledge
Time
Equal accessand fullenjoy-mentof social rightsfor womenand men
Reconciliationof private andprofessional life
Promotingbetter work-lifebalance
Promoting betterwork-life balance forboth women and men
HealthInter-sectinginequalitiesViolenceGenderequality incivil lifeChangeof genderroles andstereotypesThe eradication ofall forms of gender-based violence;the elimination ofgender stereotypesCombat allforms ofviolence againstwomenDignity,integrity andan end togender-basedviolenceDignity, integrityand an end togender-basedviolenceEliminate violenceagainst women
146
Gender Equality Index – Report
Table 1.3. Domains of the Index in the third UN Millennium Development Goal (MDG3) and the fifthUNMillennium Development Goal (MDG5)
Domain
MDG 3.1
MDG 3.2
MDG 3.33.3Proportionof seats heldby womenin nationalparliament
MDG 5.1
MDG 5.2
MDG 5.3
MDG 5.4
MDG 5.5
MDG 5.6
3.13.2Ratios of girls toShare ofboys in primary, women in wagesecondaryemploymentand tertiaryin the non-educationagriculturalsectorWorkMoneyPowerKnowledgeTimeHealthInter-sectinginequalitiesViolence
5.15.25.35.45.55.6MaternalProportion ofContraceptive Adolescent Antenatal care Unmet needmortality births attendedprevalencebirth ratecoverage (atfor familyratioby skilled healthrateleast one visitplanningpersonneland at leastfour visits)
x
xx
x
x
x
xx
Gender Equality Index – Report
147
Table 1.4. Domains of the Index in Convention on the Elimination of All Forms of Discrimination againstWomen (CEDAW)CEDAWWorkMoneyKnowledgeTimePowerHealthIntersecting inequalitiesViolence
Art. IDiscriminationArt. IIPolicy MeasuresArt. IIIGuarantee of BasicHuman Rights andFundamental FreedomsArt. IVSpecial measuresArt. VSex Role Stereotypingand PrejudiceArt. VIProstitutionArt. VIIPolitical and Public LifeArt. VIIIRepresentationArt. IXNationalityArt XEducationArt XIEmploymentArt XIIHealthArt. XIIIEconomic andSocial BenefitsArt XIVRural WomenArt. XVLawArt. XVIMarriage and Family Life
XXXXX
X
X
XXXXXXXXXX
XXXX
148
Gender Equality Index – Report
Table 1.5. Domains of the Index covered by Beijing Platform for Action (BPfA)
Domain
AWomenandpoverty
BCEducation Womenandandtraininghealthof women
DViolenceagainstwomen
EFWomen Women andandthe economyarmedconflicts
GWomen inpowerand decisi-on-making
HInstitutionalmechanismsfor theadvance-ment ofwomen
IHumanrights ofwomen
JWomenand themedia
KWomen andtheenvironment
LThegirlchild
Work
A3a. A3b.
B2.
F1. F8b. F9c.F10b. F11a, c.F12a, b. F13a.F15. F16. F17.F8a, c, d, e, f.F9a. F10a.F11b, d.F12a, b, c.F14. F15.F16. F17.
Money
A1. A2.
Power
B3b.
E2
G1. G2. G3.G4. G5. G6.G7. G8. G9.G10. G11. G12.G13.G14. G15.G16. G17. G18.
K1. K2. K3.
KnowledgeTime
B1. B3a.F2. F3. F4. F5.F6. F7. F9c.F17.C1. C2.C3.F7.
K4.
L3.
HealthIntersectinginequalitiesViolence
D1. D2.D3. D4.D5. D6.D7. D8.D9. D10.
L2.
Note: BPfA addresses 12 main areas of concern:
Gender Equality Index – Report
149
Women and Power (A)A1. At-risk-of-poverty rate by age and sexA2. At-risk-of-poverty rate by type of household and sex, including at-risk-of-povery rate of single parents with depend-ent childrenA3a. Inactivity by age and sex: share of women and men who are inactive by ageA3b. Inactivity by age and sex: share of inactive women and men who are not looking for a job for family care reasonsEducation and Training of Women (B)B1. Proportion of female graduates and male graduates of all graduates in mathematics, the sciences and technicaldisciplines (tertiary education)B2. Employment rate of women and men (aged between 25 and 39 years; and aged between 40 and 64) by highestlevel of education attainedB3a. Proportion of female/male ISCED 5a-graduates of all ISCED 5a-graduates and proportion of female/male PhD gradu-ates of all PhD graduates by broad field of study and totalB3b. Proportion of female and male academic staff differentiated by level of seniority and in totalWomen and Health (C)C1. Healthy life yearsC2. Access to healthcare (unmet demand)C3. Cardio-vascular diseasesViolence Against Women (D)D1. Domestic violence against women: profile of female victims of violenceD2. Domestic violence against women: profile of male perpetratorsD3. Domestic violence against women: victim supportD4. Domestic violence against women: measures addressing the male perpetrator to end the circle of violenceD5. Domestic violence against women: training of professionalsD6. Domestic violence against women: state measures to eliminate domestic violence against womenD7. Domestic violence against women: evaluationD8. The number of employees who report incidents of sexual harassment at the workplace, as a percentage of the totalworkforceD9. The number of private and public enterprises which have a preventive policy regarding sexual harassment at theworkplace, as a percentage of the total number of employersD10. The number of private and public enterprises which have procedures for sanctions in place for perpetrators ofsexual harassment at the workplace, as a percentage of the total number of employersWomen and Armed Conflict (E)E1. Proportion (number and percentage) of men and women trained specifically in gender equality among:– diplomatic staff and civilian and military defence staff employed by the Member States and Community institutions;– staff participating in UN peacekeeping operations (PKOs) and ESDP missions, including military and police staff.E2. Proportion (number and percentage) of women and men among:– heads of diplomatic missions and EC delegations;– staff participating in UN peacekeeping operations and ESDP missions, including military and police staff.E3. Funding (as a total amount and as a percentage of cooperation programmes) allocated by the Member States andthe European Commission, in countries affected by armed conflict or in post-conflict situations, to support genderequality, broken down, where possible, to reflect funding to support:– female victims of violence;– the participation of women in peace-building and post-conflict reconstruction.E3a. Proportion of funding for these programmes allocated to NGOs working for gender equality and women’sempowermentE4. Proportion (number and percentage) and country of origin of female and male asylum seekers who have obtainedthe status of refugee, or benefit from subsidiary protection
150
Gender Equality Index – Report
Women and the Economy (F)F1. Employed men and women on parental leave (paid and unpaid) within the meaning of Directive 96/34/EC on theframework agreement between the social partners on parental leave, as a proportion of all employed parentsF2. Allocation of parental leave between employed women and men as a proportion of all parental leaveF3. Children cared for (other than by the family) as a proportion of all children of the same age group:- before entry into the non-compulsory pre-school system (during the day);- in the non-compulsory or equivalent pre-school system (outside pre-school hours);- in compulsory primary education (outside school hours).F4. Comprehensive and integrated policies, particularly employment policies, aimed at promoting a balance betweenwork and family life for both men and women (including, for example, a description of available child care facilities,parental leave and flexible working time arrangements, of services offered by companies for their employees, andof flexible opening hours of public services such as local authority offices, post offices, crèches, and shops)F5. Dependent elderly men and women (unable to look after themselves on a daily basis) over 75- living in specialised institutions;- who have help (other than the family) at home;- looked after by the family;- as a proportion of men and women over 75F6. Total ‘tied’ time per day for each employed parent living with a partner, having one or more children under 12 yearsold or a dependent:- paid working time;- travelling time;- basic time spent on domestic work;- other time devoted to the family (upbringing and care of children and care of dependent adults).F7. Total ‘tied’ time per day for each employed parent living alone, having one or more children under 12 years old ora dependent- paid working time;- travelling time;- basic time spent on domestic work;- other time devoted to the family (upbringing and care of children and care of dependent adults).F8. Ratio for all employeesF8a. Gender pay gap based on gross hourly male and female wages, full-time and part-time employees of all sectorsF8b. Employment rate of women and menF8c. Gender pay gap based on gross hourly male and female wages, full-time and part-time employees of all sectors andseparate for the private and public sectorsF8d. Gender pay gap based on gross yearly male and female wages, full-time and part-time employees of all sectors andseparate for the private and public sectorsF8e. Gender pay gap based on gross monthly male and female wages, full-timeF8f. Gender pay gap based on gross monthly male and female wages, full-time and part-timeF9. Ratio for the total sum of wageF9a. Share of all wages by sexF9b. Repartition of the total number of wage-earners by sexF9c. Repartition of the total number of actual working days by sexF10. Ratio for part-time workF10a. Gross hourly wages and pay gap: female (part-time) – male (part-time); female (part-time) – female (full-time); male(part-time) – male (full-time); female (part-time) – male (full-time)F10b. Part-time employment rate by sexF11. Ratio by age and educationF11a. Employment rate by age and sexF11b. Pay gap according to age group (< 24, 25–34, 35–44, 45–54, 55–64 and 65+) based on hourly wages of female andmale workers, full-time and part-time workersF11c. Employment rate by educational level (ISCED, 3 levels)
Gender Equality Index – Report
151
F11d. Pay gap by educational level (ISCED, 3 levels), full-time and part-time workersF12. Segregation in the labour marketF12a. Average gross hourly wages of female and male workers in the five industry sectors (NACE, 2 digits) with the highestnumbers of female workers and the highest numbers of male workersF12b. Average gross hourly wages of female and male workers in the five professional categories (ISCO categories, 2 digits)with the highest numbers of female workers and the highest numbers of male workersF12c. Pay gap in management (ISCO 12 and 13)F13. Ratio according to personal characteristicsF13a. Employment rate by family situation and civil status (crossed)F13b. Gender pay gap by family situation and civil statusF13c. Gender pay gap by country of birthF14. Breakdown of the hourly wage gap between men and women using the Oaxaca techniqueF15. Measures to promote equal pay and combat the gender pay gapF16. Influence of collective bargaining on the promotion of equal pay and the elimination of the gender pay gapF17. Effect of part-time work, parental leave, time credit systems and career breaks on the gender pay gapWomen in Power and Decision-making (G)G1. The proportion of women in the single/lower houses of the national/federal parliaments of the Member States andin the European ParliamentG2. The proportion of women in the regional Parliaments of the Member States, where appropriateG3. The proportion of women in local assemblies in the Member StatesG4. Policies to promote a balanced participation in political electionsG5. The proportion of women among the members of the national/ federal governments and the proportion of womenamong members of the European CommissionG6. The number of women and men among senior/junior ministers in the different fields of action (portfolios/ministries)of the national/federal governments of the Member StatesG7. The proportion of the highest ranking civil servants who are womenG8. The distribution of the highest ranking women civil servants in different fields of actionG9. The proportion of women among the members of the supreme courts of the Member States and the proportionof women among the members of the European Court of Justice and the Court of First InstanceG10. The proportion and number of women and men among governors and deputy/vice-governors of the centralbanksG11. The proportion and number of women and men among members of the decision-making bodies of the centralbanksG12. The proportion and number of women and men among ministers and deputy ministers/vice-ministers of theeconomic ministriesG13. The proportion and number of women and men among presidents and vice-presidents of the labour confederationsG14. The proportion and number of women and men among members of total governing bodies of the labourconfederations
152
Gender Equality Index – Report
G15. The proportion and number of women and men among presidents and vice-presidents of the employer confederationsG16. The proportion and number of women and men among members of total governing bodies of the employerconfederationsG17. The proportion and number of women and men among chiefs of executive boards of the top 50 firms publiclyquoted on the national stock exchangeG18. The proportion and number of women and men among members of executive boards of the top 50 firms publiclyquoted on the national stock exchangeInstitutional Mechanisms for the Advancement of Women (H)H1. Status of governmental responsibility in promoting gender equalityH2a. Personnel resources of the governmental gender equality bodyH2b. Personnel resources of the designated body or bodies for the promotion of equal treatment of women and menH3. Gender mainstreamingHuman Rights of Women (I)Women and the Media (J)Women and the Environment (K)K1. Proportion of women and men in climate change decision-making bodies at the national level in the EU MemberStatesK2. Proportion of women and men in climate change decision-making in the European Parliament and the CommissionK3. Proportion of women and men in climate change decision-making bodies at the international levelK4. Proportion of women and men among tertiary graduates of all graduates (ISCED levels 5 and 6) in natural sciencesand technologies at the EU and Member State levelThe Girl Child (L)L1. Sex and relationship education: parameters of sexuality-related education in schooling (primary and secondary)L2. Body self-image: dissatisfaction of girls and boys with their bodiesL3. Educational accomplishments: comparison of 15-year-old students’ performance in mathematics and science andthe proportion of girl students in tertiary education in the field of science, mathematics and computing and in thefield of teacher training and education science
Gender Equality Index – Report
153
Annex 2: Descriptive of the final metric
154
ID27272727272726272727272727272727272727272727272727272748.1145.0550.7823.7131.5077.5792.0085.4993.3994.1035.6828.2319.5920.9024.1720.2620.1112.3518.7712.134.546.905.113.5438.6919.8357.5918.2525.6712.734.238.381.0018.4523.104.871.0053.5782.7073.2477.8086.2842.9414.5322.6945.1912.8926.3134.7532.8943.6121.7913.9518.8532.5133.4736.1314.3919.9069.8487.3880.9392.1091.9363.8519.4633.4247.0873.6216.3942.0161.6091.733.6385.6188.9092.2974.1162.0241.4438.5160.7634.5623.5630.5344.4238.2743.4222.8131.0079.6894.2386.1394.1995.2649.4319.7514.4629.7249.3857.1020.7523.6636.3959.1974.4864.5594.1388.3781.0955.0451.0167.6256.8537.5146.1763.4659.3464.2827.7143.8185.9995.5590.1696.6296.7163.2121.3617.0148.0163.1482.5979.5311.8453.2171.4177.7289.3799.5295.0292.2897.7598.6597.0997.3068.2384.6993.1478.5799.0194.8798.9392.8192.8151.5269.1699.4696.8899.5899.9599.9554.2017.6725.8341.7849.8268.2991.6235.288.8920.9326.7736.5842.6952.9779.149.7554.3373.2180.5086.4296.3074.119.2051.7268.1774.3081.2587.12
Indicators
N
mean
sd
min
p25
p50
p75
max
v1
Full-time equivalent employment
v2
Duration of working life
v3
Employment in Education, Human Health and Social Work activities
v4
Employees with a fixed start and end of a working dayor varying working time as decided by the employer
v5
Workers perceiving that their health or safety is not at risk because of their work
Gender Equality Index – Report
v6
Workers having undergone training paid for or providedby their employer or by themselves if self-employed
v7
Mean monthly earnings – NACE Rev. 2, categories B-S excluding O
v8
Mean equivalised net income
v9
Not-at-risk-of-poverty, ≥60 % of median income
v10
S20/S80 income quintile share
v11
Graduates of tertiary education
v12
Tertiary students in the fields of Education, Health and Welfare, Humanities and Art – ISCED 5–6
v13
People participating in formal or non-formal education and training
v14
Workers caring for and educating their childrenor grandchildren, every day for one hour or more
v15
Workers doing cooking and housework, every day for one hour or more
v16
Workers doing sporting, cultural or leisure activitiesoutside of their home, at least every other day
v17
Workers involved in voluntary or charitable activities, at least once a month
v18
Share of ministers
v19
Share of members of parliament
v20
Share of members of regional assemblies
v21
Share of members of boards in largest quoted companies,supervisory board or board of directors
v22
Share of members in all key decision-making bodies in Central Bank
v23
Self-perceived health: good or very good
v24
Life expectancy in absolute value at birth
v25
Healthy life years in absolute value at birth
used in calculating the Gende Equality Index
v26
Population without unmet needs for medical examination
v27
Population without unmet needs for dental examination
v1
v2
v3
v4
v5
v6
v7
v8
v9
v10 v11 v12 v13 v14 v15 v16 v17 v18 v19 v20 v21 v22 v23 v24 v25 v26 v27
v1
--
v2
0.80***
--
v3
-0.07
0.17
--
v4
0.14
0.35* 0.48***
--
v5
0.07
0.30 0.55*** 0.60***
--
v6
0.40** 0.58*** 0.29 0.48*** 0.60***
--
v7------0.190.17 0.96***--------------------0.37** 0.56*** 0.59*** 0.54*** 0.44** 0.52*** 0.240.270.120.27 0.49*** 0.54*** 0.57*** 0.47** 0.54***-0.050.230.200.38** 0.33* 0.39** 0.33* 0.40**0.44** 0.47*** 0.35*0.31*0.35*0.36*0.00-0.060.120.130.07--0.7***--0.12 0.76*** 0.71***0.160.21------
0.06
0.36* 0.82*** 0.62*** 0.75*** 0.63***
--
v8
0.10
0.36* 0.87*** 0.60*** 0.69*** 0.57*** 0.93***
v9
0.19
0.27
0.27
0.26 0.56*** 0.74*** 0.43** 0.48***
v10
0.24
0.27
0.29
0.34* 0.42** 0.72*** 0.42** 0.48*** 0.88***
v11
0.33* 0.55*** 0.63*** 0.39** 0.41** 0.46** 0.71*** 0.67*** 0.23
Level of significance for N=27: *** p<0.01; ** p<0.05, *p<0.100.290.15 0.69*** 0.69*** 0.75*** 0.66***0.34*0.34* 0.54***0.220.38** 0.54*** 0.52*** 0.78*** 0.22 0.59*** 0.68*** 0.65***0.37* 0.50*** 0.51*** 0.69*** 0.40** 0.67*** 0.62*** 0.69*** 0.79***0.36* 0.64*** 0.64*** 0.65*** 0.29 0.65*** 0.60*** 0.64*** 0.82*** 0.82***0.34*0.260.080.080.39** 0.37*0.34*0.24 0.52*** 0.19 0.52*** 0.48*** 0.41** 0.53*** 0.56*** 0.46**0.36* 0.39** 0.54*** 0.47** 0.60*** 0.52*** 0.36* 0.48*** 0.55*** 0.58*** 0.67***0.210.42** 0.48*** 0.270.43** 0.59*** 0.26--0.41** 0.47*** 0.18 0.87***--
v12
0.27 0.48*** 0.64*** 0.29
0.38** 0.43** 0.72*** 0.66*** 0.22
v13
0.49*** 0.72*** 0.46** 0.50*** 0.52*** 0.80*** 0.66*** 0.63*** 0.51*** 0.50*** 0.60*** 0.57***
v14
0.20
0.41** 0.32*
0.00
0.38** 0.44** 0.43** 0.35* 0.42**
v15
0.45** 0.73*** 0.30
0.30
0.25 0.58*** 0.54*** 0.43**
v16
0.32* 0.47** 0.43** 0.58*** 0.50*** 0.70*** 0.68*** 0.65*** 0.52*** 0.54*** 0.59*** 0.55*** 0.78*** 0.43** 0.66***
v17
0.22 0.60*** 0.49*** 0.53*** 0.57*** 0.73*** 0.72*** 0.71*** 0.58*** 0.59*** 0.52*** 0.51*** 0.80*** 0.52*** 0.63*** 0.73***
v18
0.41** 0.66*** 0.51*** 0.56*** 0.39** 0.58*** 0.62*** 0.64*** 0.27
v19
0.33* 0.69*** 0.38** 0.49*** 0.42** 0.55*** 0.56*** 0.53*** 0.32*
v20
0.28 0.63*** 0.52*** 0.50*** 0.34* 0.48*** 0.58*** 0.59*** 0.30
v21
0.56*** 0.61***-0.10
0.34*
0.11
0.47**
0.13
v22
0.44** 0.53*** 0.01
0.16
0.13
0.43**
0.18
v23
0.02
0.25 0.72*** 0.67*** 0.55*** 0.49*** 0.79*** 0.76*** 0.34* 0.38** 0.68*** 0.69*** 0.48*** 0.10
v24
-0.07
0.22 0.79*** 0.65*** 0.64*** 0.52*** 0.85*** 0.84*** 0.34* 0.45** 0.48*** 0.46** 0.45**
Annex 3: Correlation matrix of the final metric used in calculating the Gender Equality Index
Gender Equality Index – Report
v25
-0.13
0.02 0.73*** 0.55*** 0.39**
0.22 0.60*** 0.61*** 0.13
v26
0.19
0.34* 0.52*** 0.35* 0.75*** 0.61*** 0.59*** 0.61*** 0.60*** 0.54*** 0.42** 0.40** 0.47** 0.38**
155
v27
0.11
0.33* 0.45** 0.35* 0.64*** 0.70*** 0.60*** 0.59*** 0.63*** 0.53*** 0.45** 0.44** 0.55*** 0.44** 0.37** 0.57*** 0.59*** 0.39** 0.33*
Annex 4: Principal component analysisDomain WorkWorkFull-time equivalent employmentDuration of working lifeEmployment in Education, Human Health and Social Work activitiesEmployees with a fixed start and end of a working day or varyingworking time as decided by the employerWorkers perceiving that their health or safety is not at risk because of their workWorkers having undergone training paid for or providedby their employer or by themselves if self-employed
Participation-0.1540.1040.4520.5090.5760.413
Segregation andquality of work0.6400.632-0.2450.039-0.0420.358
% of variance explainedKMO
0.700.62
Screeplot: Work2.52.01.51.00.50123Eigenvalues45Mean6
156
Gender Equality Index – Report
Domain MoneyMoneyMean hourly earningsMean equivalised net incomeNot-at-risk-of-poverty, ≥60 % of median incomeS20/S80 income quintile share
Financial resources0.018-0.0190.7210.692
Poverty0.6980.714-0.0370.040
% of variance explainedKMO
0.870.52
Screeplot: Money2.52.01.51.00.5012Eigenvalues3Mean4
Gender Equality Index – Report
157
Domain KnowledgeKnowledgeGraduates of tertiary educationTertiary students in the fields of Education, Health and Welfare,Humanities and Art – ISCED 5–6People participating in formal or non-formal education and training
Educationalattainment and segregation0.6940.720-0.001
Lifelong learning0.036-0.0340.999
% of variance explainedKMO
0.980.59
Screeplot: Knowledge2.52.01.51.00.5011,52Eigenvalues2,5Mean344
Domain TimeTimeWorkers caring for and educating their children orgrandchildren, every day for one hour or moreWorkers doing cooking and housework, every day forone hour or moreWorkers doing sporting, cultural or leisure activitiesoutside of their home, at least every other dayWorkers involved in voluntary or charitable activities,at least once a month
Care activities-0.0950.3240.7220.604
Social activities0.8640.479-0.1450.052
% of variance explainedKMO
0.830.68
158
Gender Equality Index – Report
Screeplot: Time2.52.01.51.00.5012Eigenvalues3Mean4
Domain PowerPowerShare of ministersShare of members of parliamentShare of members of regional assembliesShare of members of boards in largest quoted companies,supervisory board or board of directorsShare of members in all key decision-making bodies in Central Bank
Political0.5960.5490.586-0.0190.018
Economic-0.0490.059-0.0020.7190.691
% of variance explainedKMO
0.820.72
Screeplot: Power3
2
1
0123Eigenvalues4Mean5
Gender Equality Index – Report
159
Domain HealthHealthSelf-perceived health: good or very goodLife expectancy in absolute value at birthHealthy life years in absolute value at birthPopulation without unmet needs for medical examinationPopulation without unmet needs for dental examination
Status0.5750.5230.6270.021-0.044
Access0.0440.196-0.1780.6740.688
%of variance explainedKMO
0.870.65
Screeplot: Health3
2
1
0123Eigenvalues4Mean5
160
Gender Equality Index – Report
IndicatorsX
Europe 2020
BPfA indicators
Full-time equivalent employment rate (% 15+ population)Duration of working life (years)X
Employment in Education, Human Health and Social Work activities (% 15–64 employed in all NACE Rev. 2)
Employees with a non-fixed start and end of a working day or varying working time as decided by the employer (% 15–64 employed)
Workers perceiving that their health or safety is not at risk because of their work (% 15+ workers)
Workers having undergone training paid for or provided by their employer or by themselves if self-employed (% 15+ workers)
Mean monthly earnings – NACE Rev. 2, categories B-S excluding O (PPS)
Mean equivalised net income, 16+ population (PPS)XA1
Not-at-risk-of-poverty, ≥60 % of median income (% 16+ population)
S20/S80 income quintile share (total population)
Graduates of tertiary education (% 15–74 population)X
Tertiary students in the fields of Education, Health and Welfare, Humanities and Arts (ISCED 5–6) (% tertiary students)
People participating in formal or non-formal education and training (% 15–74 population)
Workers caring for and educating their children or grandchildren, every day for one hour or more (% 15+ workers)
Workers doing cooking and housework, every day for one hour or more (%15+ workers)
Workers doing sporting, cultural or leisure activities outside of their home, at least every other day (%15+ workers)hour
Workers involved in voluntary or charitable activities, at least once a month (%15+ workers)Share of ministers (%)G6G1G2+G3G17+G18G10+G11
Share of members of parliament (%)
Share of members of regional assemblies (%)
Share of members of boards in largest quoted companies (supervisory board or board of directors) (%)
Share of members in all key decision-making bodies in Central Bank (%)
Self-perceived health, good or very good (%16+ population)
Life expectancy in absolute value at birth (years)C1C2
Annex 5: Indicators correspondence to Europe 2020 and BPfA indicators
Healthy Life Years in absolute value at birth (years)
Population without unmet needs for medical examination (% 16+ population)
Population without unmet needs for dental examination (% 16+ population)
Employment of people born in a foreign country (% 15–64 population born in a foreign country)
Gender Equality Index – Report
Employment of people aged 55–64 (% 55–64 population)
Employment rates of people living in a household with one adult and one or more children (% 15–64 corresponding population)
161
Employment rates by sex, age and country of birth (% 15–64 population)
Annex 6: Segregation by economic activity
Cells are highlighted when women are under/over-represented in a given economical sector
Table 6.1. Percentage of women (15–64) by field of economic activity (from 2008, NACE Rev. 2)in EU Member States 2010 [lfsa_egan2]
16272 %69 %82 %77 %60 %69 %85 %74 %66 %66 %68 %76 %73 %87 %81 %60 %77 %66 %63 %70 %78 %77 %75 %78 %81 %67 %74 %73 %61 %61 %68 %71 %54 %53 %69 %61 %73 %56 %52 %52 %44 %38 %57 %55 %60 %50 %73 %61 %55 %64 %68 %56 %66 %43 %67 %66 %65 %63 %53 %47 %71 %62 %61 %48 %68 %52 %44 %46 %67 %32 %:58 %32 %49 %54 %55 %44 %55 %54 %59 %51 %43 %47 %70 %57 %53 %69 %54 %58 %47 %:41 %46 %67 %78 %51 %79 %56 %74 %78 %45 %67 %65 %40 %45 %48 %43 %33 %50 %57 %40 %48 %33 %50 %38 %52 %48 %44 %63 %52 %53 %60 %46 %57 %63 %51 %45 %43 %41 %58 %72 %48 %57 %55 %47 %48 %46 %42 %38 %69 %62 %35 %52 %35 %50 %46 %58 %47 %53 %52 %56 %50 %51 %48 %69 %54 %47 %46 %49 %56 %43 %54 %47 %52 %50 %42 %51 %43 %73 %56 %46 %52 %50 %49 %45 %41 %46 %49 %46 %45 %61 %60 %56 %43 %53 %42 %41 %51 %52 %57 %53 %49 %57 %45 %41 %42 %81 %74 %63 %69 %62 %42 %65 %59 %70 %58 %51 %51 %53 %48 %49 %52 %2.82.92.62.83.63.22.92.52.93.33.02.33.12.72.62.43.14.12.62.52.73.72.559 %56 %34 %50 %45 %47 %52 %45 %3.266 %57 %53 %58 %55 %46 %50 %50 %2.760 %62 %64 %64 %55 %29 %48 %64 %2.967 %48 %43 %45 %46 %53 %44 %46 %3.066 %55 %52 %51 %49 %49 %48 %47 %2.8
WholesaleAccomAdministra-Arts,Professional,HumanFinancialand retailAssoci-OthermodationRealtive andentertain- scientific andhealth andandtrade; repairationCountryEducation service and foodestatesupportment andtechnicalsocial workinsuranceof motorindexactivities service activitiesservicerecreationactivitiesactivitiesactivities vehicles andactivitiesactivitiesmotorcycles
EU27
78 %
BE
79 %
BG
81 %
Gender Equality Index – Report
CZ
80 %
30 % or below
DK
82 %
70 % and above
DE
77 %
Between 60 and 69 %
Between 31 and 40 %
Between 41 and 59 %
EE
86 %
IE
82 %
EL
68 %
ES
78 %
FR
79 %
IT
69 %
CY
71 %
LV
87 %
LT
86 %
LU
76 %
HU
80 %
Equality or near-equality
MT
58 %
NL
83 %
AT
78 %
PL
82 %
PT
84 %
RO
80 %
SI
81 %
SK
84 %
FI
89 %
Over-representation of women above a critical mass of men
Under-representation of women above a critical mass of women
Over-representation of women below a critical mass of men
SE
82 %
UK
79 %
Under-representation of women, below a critical mass of women
: not available
Electricity,Water supply;Public admini-Informationstration andAgriculture,Transpor- gas, steam sewerage, waste MiningandManufac-Construc- AssociationCountrydefence;forestrytation andand airmanagementandcommuni-turingtionIndexcompulsory social and fishingstorage conditioning and remediation quarryingcationsecuritysupplyactivities37 %30 %36 %27 %17 %34 %32 %11 %41 %26 %29 %30 %31 %33 %39 %27 %24 %:29 %46 %44 %45 %45 %44 %24 %32 %23 %23 %30 %28 %34 %29 %33 %35 %37 %27 %24 %23 %36 %43 %32 %41 %34 %33 %21 %19 %18 %19 %24 %21 %23 %20 %30 %27 %22 %23 %23 %24 %26 %25 %15 %:27 %15 %20 %:22 %15 %18 %21 %28 %25 %32 %38 %25 %30 %30 %21 %14 %:45 %46 %26 %:::18 %20 %17 %25 %24 %25 %28 %19 %22 %21 %17 %18 %38 %42 %27 %20 %31 %37 %38 %30 %::33 %27 %19 %19 %14 %32 %29 %28 %20 %20 %:17 %::::::::9%:15 %:::15 %15 %32 %25 %18 %21 %14 %7%34 %25 %14 %24 %15 %:30 %29 %19 %26 %18 %:7%3%8%9%6%10 %11 %13 %12 %8%4%9%12 %6%6%9%10 %4%9%7%11 %34 %43 %28 %25 %:21 %7%34 %27 %25 %24 %21 %12 %13 %28 %30 %22 %26 %18 %:8%3.22.82.92.62.83.63.22.92.52.93.33.02.33.12.72.62.43.14.12.62.52.73.72.527 %34 %26 %17 %26 %17 %8%2.744 %49 %23 %19 %25 %17 %8%2.927 %25 %22 %26 %17 %:8%3.032 %30 %22 %22 %20 %12 %9%2.8
EU27
46 %
BE
48 %
BG
45 %
CZ
48 %
30 % or below
DK
54 %
Cells are highlighted when women are under/over-represented in a given economical sector
Table 6.2. Percentage of women (15–64) by field of economic activity (from 2008, NACE Rev. 2)in EU Member States 2010 [lfsa_egan2] (continued)
70 % and above
DE
47 %
Between 60 and 69 %
Between 31 and 40 %
Between 41 and 59 %
EE
59 %
IE
48 %
EL
38 %
ES
42 %
FR
53 %
IT
34 %
CY
39 %
LV
51 %
LT
52 %
LU
39 %
HU
52 %
Equality or near-equality
MT
32 %
NL
40 %
AT
45 %
PL
50 %
PT
37 %
RO
39 %
SI
49 %
SK
49 %
FI
57 %
Over-representation of women above a critical mass of men
Under-representation of women above a critical mass of women
Over-representation of women below a critical mass of men
Under-representation of women, below a critical mass of women
Gender Equality Index – Report
SE
56 %
UK
49 %
163
: not available
Cells are highlighted when women are under/over-represented in a given economical sector
Annex 7: Segregation by academic field. Female students (ISCED 5–6) enrolled by fieldas a percentage of male and female students in each field (2010) [educ_itertp]
164Humanitiesand artSocial science,Science,Engineering,Agriculture and Health andbusinessmathematics manufacturing,Servicesveterinarywelfareand lawand computing constructionGINIcoefficient585464625251665454586058406867526458485664586368666061553939394237534638362330263025291929192017472632183318:45365160535537564851636335215432215136245660858271736374647477687778838077523047663625447133284673504447645744:60574851514442524468585738264567513816437646382453885136184877470.440.470.410.330.370.340.340.310.410.420.300.370.270.370.350.340.400.270.400.380.520.380.3834355981250.3835255778430.4047324867460.2929235373510.3538254974490.3665566967636674607059687368777361646054667056656965716161
Country Education
EU27
77
BE
72
BG
72
CZ
79
Gender Equality Index – Report
DK
72
DE
71
30 % or below
70 % and above
EE
92
Between 60 and 69 %
Between 31 and 40 %
Between 41 and 59 %
IE
76
EL
63
ES
77
FR
81
IT
92
CY
77
LV
83
LT
76
LU
70
HU
80
MT
82
Equality or near-equality
NL
73
AT
76
PL
77
PT
83
RO
93
SI
81
SK
75
FI
80
SE
77
Over-representation of women above a critical mass of men
Under-representation of women above a critical mass of women
Over-representation of women below a critical mass of men
UK
76
Under-representation of women, below a critical mass of women
: notavailable
Gap adjusted by levelsof achievementFTE employmentDuration ofworking life84.074.875.182.776.185.294.388.468.977.390.480.568.475.360.782.770.485.954.390.472.687.772.396.381.573.886.979.068.851.351.149.067.757.749.373.762.257.036.262.745.430.953.022.745.536.925.228.620.938.127.722.342.437.063.435.868.136.645.731.959.143.262.426.965.075.736.045.325.845.649.846.443.663.673.239.433.174.962.576.131.891.652.543.040.054.444.082.249.224.744.266.364.273.088.184.673.693.193.974.988.153.277.794.670.484.675.164.670.672.291.784.573.945.864.699.568.640.173.992.066.425.960.589.689.768.285.861.527.254.092.846.250.477.848.439.964.243.159.494.063.147.736.395.093.169.785.965.055.649.147.776.049.633.025.428.960.717.062.341.251.689.167.369.139.971.685.579.4Segrega-tion andquality ofworkSectoralsegregationFlexibility ofworking timeHealthand safetyTrainingat work
Gap adjusted by levelsof achievement
Country
Index
Work
Participa-tion
AT70.775.584.977.376.790.184.965.471.688.376.168.373.957.881.970.383.253.077.673.485.674.591.282.775.379.776.672.474.176.883.986.276.783.674.364.851.780.470.281.154.972.568.271.686.366.062.081.485.868.178.487.176.066.5
50.4
73.9
79.0
74.1
BE
59.6
66.4
BG
37.0
49.9
CY
42.0
68.7
CZ
44.4
71.6
DE
51.6
72.5
DK
73.6
81.6
EE
50.0
64.6
EL
40.0
59.7
ES
54.0
61.3
FI
73.4
82.0
FR
57.1
67.0
HU
41.4
55.9
IE
55.2
71.0
IT
40.9
60.6
LT
43.6
61.0
LU
50.7
66.4
LV
44.4
54.9
MT
41.6
55.0
NL
69.7
73.1
PL
44.1
61.4
Annex 8: Scores of the Gender Equality Index and the domain of work
PT
41.3
66.2
RO
35.3
60.4
SE
74.3
78.6
SI
56.0
69.1
Gender Equality Index – Report
SK
40.9
61.0
UK
60.4
76.6
165
EU-27
54.0
69.0
Annex 9: Scores of the Gender Equality Index and the domain of money
166Gap adjusted by levels of achievementEarnings62.078.223.763.636.476.089.033.651.159.272.165.536.489.764.329.192.329.558.975.540.045.827.673.555.833.279.765.236.718.318.140.060.438.182.968.037.562.330.164.330.764.386.966.086.094.878.875.072.595.195.190.976.079.670.777.331.877.230.997.186.586.175.192.793.594.897.192.388.886.694.686.892.797.790.689.087.993.093.296.789.991.062.167.986.860.173.986.835.777.991.376.483.993.738.082.691.174.174.164.561.149.091.977.497.162.165.742.079.245.379.291.966.961.157.197.197.185.162.168.344.597.998.797.179.082.689.575.728.571.385.657.129.590.393.487.281.192.194.789.5IncomeGap adjusted by levels of achievementPovertyIncomedistribution
Country
Index
Money
Financialresources65.969.723.266.535.970.674.831.054.354.266.367.030.576.860.226.895.026.754.171.834.642.321.067.751.831.772.759.5
Economicsituation
AT
50.4
77.9
BE
59.6
79.3
BG
37.0
40.7
CY
42.0
74.1
CZ
44.4
59.3
Gender Equality Index – Report
DE
51.6
76.3
DK
73.6
79.2
EE
50.0
49.1
EL
40.0
63.3
ES
54.0
60.7
FI
73.4
78.4
FR
57.1
75.9
HU
41.4
54.4
IE
55.2
77.0
IT
40.9
68.2
LT
43.6
41.5
LU
50.7
90.9
LV
44.4
42.0
MT
41.6
68.2
NL
69.7
82.5
PL
44.1
52.2
PT
41.3
56.3
RO
35.3
39.0
SE
74.3
80.2
SI
56.0
70.2
SK
40.9
53.7
UK
60.4
74.3
EU-27
54.0
68.9
Gap adjusted by levels of achievementLifelonglearningTertiary education45.289.049.091.644.260.478.570.362.081.785.575.449.090.936.067.181.754.138.580.552.233.436.676.353.843.697.369.054.540.926.327.960.238.732.565.445.431.837.462.649.526.632.938.551.832.932.963.541.630.925.864.357.132.158.241.866.135.435.729.153.238.049.266.656.941.339.526.544.449.049.026.541.366.638.029.135.432.938.551.832.932.963.541.630.925.864.357.132.158.241.854.684.784.739.039.039.028.038.538.555.538.038.041.422.722.768.238.038.033.850.250.2SegregationLifelong learning
Gap adjusted by levels of achievement
Country
Index
Knowledge
Educationalattainment andsegregation39.578.645.273.536.149.766.657.350.869.367.464.342.378.531.358.372.245.735.267.546.529.932.268.346.238.081.357.2
AT
50.4
44.6
BE
59.6
54.7
BG
37.0
32.0
CY
42.0
52.9
CZ
44.4
37.3
DE
51.6
44.1
DK
73.6
75.1
EE
50.0
53.0
EL
40.0
36.7
ES
54.0
53.5
FI
73.4
67.0
FR
57.1
49.4
HU
41.4
35.1
IE
55.2
52.8
IT
40.9
32.1
LT
43.6
47.4
LU
50.7
61.1
LV
44.4
38.8
MT
41.6
34.0
NL
69.7
65.5
PL
44.1
44.0
PT
41.3
30.4
RO
35.3
28.8
SE
74.3
66.3
SI
56.0
51.4
SK
40.9
35.0
Annex 10: Scores of the Gender Equality Index and the domain of knowledge
UK
60.4
68.8
Gender Equality Index – Report
EU-27
54.0
48.9
167
Annex 11: Scores of the Gender Equality Index and the domain of time
168Gap adjusted by levelsof achievementTimeChildcareactivities40.045.317.325.323.241.664.951.417.433.863.835.832.553.433.024.148.935.237.571.320.922.417.863.949.117.843.238.845.556.627.051.169.727.034.360.865.541.451.154.250.670.927.633.170.786.144.466.722.155.322.130.319.678.636.612.762.136.776.282.869.652.063.041.040.245.834.642.568.216.925.614.546.016.331.671.915.89.911.858.747.211.732.933.060.261.958.447.553.582.324.819.743.652.235.029.354.447.461.474.899.023.615.751.123.813.248.110.332.748.914.011.44.250.946.113.929.625.058.262.853.719.620.820.026.913.115.116.375.484.266.635.130.280.493.167.752.442.340.149.430.743.322.664.062.539.913.818.350.635.123.843.927.515.744.022.330.594.917.78.419.466.448.49.536.341.128.941.216.718.716.720.635.950.321.517.810.924.820.925.716.214.312.116.656.967.146.836.129.642.635.640.830.545.024.066.1DomesticactivitiesSport. culture and Volunteering andleisure activities charitable activitiesCare activitiesSocialactivitiesGap adjusted by levelsof achievement
Country
Index
AT
50.4
BE
59.6
BG
37.0
CY
42.0
CZ
44.4
Gender Equality Index – Report
DE
51.6
DK
73.6
EE
50.0
EL
40.0
ES
54.0
FI
73.4
FR
57.1
HU
41.4
IE
55.2
IT
40.9
LT
43.6
LU
50.7
LV
44.4
MT
41.6
NL
69.7
PL
44.1
PT
41.3
RO
35.3
SE
74.3
SI
56.0
SK
40.9
UK
60.4
EU-27
54.0
Gap adjusted by levelsof achievementPoliticalMinisterialrepresentation63.165.747.931.934.459.477.834.741.475.485.963.815.130.431.235.644.838.930.169.235.144.120.191.543.531.852.449.932.558.247.964.988.912.134.156.719.592.822.134.338.944.135.833.964.776.428.218.441.838.353.339.641.636.543.866.635.841.628.892.843.428.760.157.535.033.338.632.438.123.127.829.833.61.020.323.939.423.011.129.04.838.311.739.434.021.230.760.329.934.423.629.062.237.791.339.798.977.481.455.178.066.381.929.649.233.741.414.412.520.050.322.825.716.310.222.98.740.04.929.722.810.140.151.520.241.925.523.314.139.750.421.712.492.374.666.746.335.654.261.961.913.225.533.135.035.025.523.627.41.057.031.016.339.259.956.553.129.812.035.01.036.518.449.145.132.221.469.239.526.821.734.632.625.138.24.78.41.054.941.647.323.921.126.744.475.377.331.119.742.574.755.459.29.317.61.0ParliamentaryrepresentationRegionalassembliesrepresentationMembersof boardsMembers ofCentral BankEconomic
Gap adjusted by levelsof achievement
Country
Index
Power
AT
50.4
24.3
BE
59.6
45.2
BG
37.0
33.8
CY
42.0
12.2
CZ
44.4
29.6
DE
51.6
28.0
DK
73.6
60.0
EE
50.0
27.5
EL
40.0
24.4
ES
54.0
47.2
FI
73.4
68.8
FR
57.1
50.3
HU
41.4
24.4
IE
55.2
26.5
IT
40.9
18.6
LT
43.6
32.1
LU
50.7
14.7
LV
44.4
38.6
MT
41.6
18.7
NL
69.7
52.2
PL
44.1
34.5
PT
41.3
30.6
RO
35.3
24.9
Annex 12: Scores of the Gender Equality Index and the domain of power
SE
74.3
74.3
SI
56.0
36.0
SK
40.9
33.1
Gender Equality Index – Report
UK
60.4
35.2
EU-27
54.0
38.0
169
Annex 13: Scores of the Gender Equality Index and the domain of health
170Gap adjusted by levelsof achievementStatusSelf-perceivedhealthLife expectancy94.694.285.596.290.594.793.885.895.296.093.495.085.995.696.982.794.683.496.295.887.693.285.296.692.887.195.693.575.298.384.582.179.580.799.675.073.291.186.890.381.194.792.497.092.297.196.683.795.099.086.794.786.289.699.995.397.093.779.192.486.794.681.794.489.692.192.593.495.392.097.192.296.796.577.894.299.385.297.384.887.8100.094.896.593.492.992.691.476.094.294.286.195.996.681.394.793.895.695.394.393.791.795.594.092.897.092.197.596.889.795.998.888.292.287.791.599.995.897.594.087.296.196.695.790.091.493.189.688.485.985.586.387.899.399.799.083.597.297.796.7Healthy life years86.489.183.090.983.484.587.874.592.289.485.686.775.895.889.474.291.371.091.490.678.675.481.996.778.677.393.986.679.494.971.668.193.979.753.666.291.579.854.489.158.876.599.562.478.581.782.588.461.683.677.572.586.675.385.481.1Unmet medicalneedsUnmet dentalneedsAccessGap adjusted by levelsof achievement
Country
Index
Health
AT
50.4
91.6
BE
59.6
94.1
BG
37.0
84.5
CY
42.0
91.1
CZ
44.4
89.6
Gender Equality Index – Report
DE
51.6
89.5
DK
73.6
91.8
EE
50.0
83.8
EL
40.0
92.4
ES
54.0
90.7
FI
73.4
89.9
FR
57.1
90.6
HU
41.4
83.7
IE
55.2
96.4
IT
40.9
90.8
LT
43.6
84.9
LU
50.7
93.9
LV
44.4
77.1
MT
41.6
93.2
NL
69.7
94.7
PL
44.1
82.6
PT
41.3
84.5
RO
35.3
84.0
SE
74.3
93.1
SI
56.0
88.7
SK
40.9
85.8
UK
60.4
95.4
EU-27
54.0
90.1
8. ReferencesAnker, R. (1998), Gender and jobs: sex segregation of occupations in the world, Geneva: ILO.Annandale, E. and Hunt, K. (2000), ‘Gender inequalities in health: research at the crossroads’, in Annandale, E. and Hunt,K. (eds), Gender Inequalities in Health, Berkshire, UK: Open University Press. Available at: http://epp.eurostat.ec.europa.eu/cache/ITY_OFFPUB/KS-77-07-026/EN/KS-77-07-026-EN.PDFBacchi, C. (1996), The Politics of Affirmative Action, London: Sage.Backhans, M. C., Lundberg, M., and Mansdotter, A. (2007), ‘Does increased gender equality lead to a convergence ofhealth outcomes for men and women? A study of Swedish municipalities’, Social Science & Medicine, 64(9)pp.1892–1903.Baker, J. Lynch, K., Cantillon, S. and Walsh, J. (2004), Equality: From Theory to Action, Basingstoke: Palgrave Macmillan.Bárcena-Martín, E. and Moro-Egido, A. (2011), Country differences in the gender effect on poverty in Europe.Bardhan, K and Klasen, S. (1999), ‘UNDP’s Gender-Related Indices: A Critical Review’, World Development, 27(6) pp. 985–1010.Bericat, E. (2011), ‘The European Gender Equality Index: Conceptual and Analytical Issues’, Social Indicators Research,108 (1) pp.1–28.Bittman, M., and Wajcman, J. (2000), ’The rush hour: The character of leisure time and gender equity’, Social Forces, 79(1)pp.165–189.Bradley, H. and Healy, G. (2008), Ethnicity and Gender at Work, Inequalities, Careers and Employment Relations, Basing-stoke: Palgrave MacMillan.Bunch, C. (2008), ‘Feminist quandaries on gender and violence: agency, universality and human security’, in Bahun-Radunović, S. and Rajan, V. G. Julie, Violence and Gender in the Globalized World: the Intimate and the Extimate,Surrey: Ahsgate.Burda, M.C., D.S. Hamermesh and P. Weil (2007), Total Work, Gender, and Social Norms, IZA Discussion Paper No. 2705,Institute for the Study of Labor, Bonn, March.Callens, M. and Croux, C. (2009), ‘Poverty Dynamics in Europe A Multilevel Discrete-Time Recurrent Hazard Analysis’, Inter-national Sociology, 24(3) pp. 368–396.Chant, S. (2006), ‘Re-thinking the ‘‘Feminization of Poverty’’ in Relation to Aggregate Gender Indices’, Journal of HumanDevelopment, 7(2) pp. 201–220.Chant, S. and Pedwell, C. (2008), Women, gender and the informal economy: An assessment of ILO research and suggested ways forward. Available at: http://www.ilo.org/wcmsp5/groups/public/---dgreports/---dcomm/documents/publication/wcms_091228.pdfCharles, M. and Bradley, K. (2002), ‘Equal but separate? A cross-national study of sex segregation in higher education’,American Social Review. 67(4) pp. 573–99.Cockburn, C. (1991), In the Way of Women: Men’s Resistance to Sex Equality in Organisations, Basingstoke: Macmillan.
Gender Equality Index – Report
171
Commission of the European Communities (1993), Growth, Competitiveness, Employment: The Challenges and WaysForward into the 21st Century – White Paper (COM(94) 333 final)Council of Europe (2006), Combating violence against women. Stocktaking study on the measures and actions taken inCouncil of Europe member States. Directorate General of Human Rights: Strasbourg. Available at: http://www.coe.int/t/dghl/standardsetting/equality/03themes/violence-against-women/CDEG%282006%293_en.pdfCouncil of Europe (2011), Convention on preventing and combating violence against women and domesticviolence (CM(2011)49 final), 7 April 2011. Availablew at: https://wcd.coe.int/ViewDoc.jsp?Ref=CM(2011)49&Language=lanEnglish&Ver=final Council of the European Union. Lisbon European Council 23 and 24 March 2000.Presidency Counclusions. Available at : http://www.europarl.europa.eu/summits/lis1_en.htm#Council of the European Union, Council Resolution of 27 June 2002 on lifelong learning (2002/C 163/01). Available at:http://eurlex.europa.eu/JOHtml.do?uri=OJ:C:2002:163:SOM:en:HTMLCouncil of the European Union, European Pact for Gender Equality, 23/24 March 2006 (7775/1/06 REV 1.). Available at:http://www.consilium.europa.eu/uedocs/cms_data/docs/pressdata/en/ec/89013.pdfCouncil of the European Union, Council conclusions on women’s health. 22 June 2006 (2006/C 146/02). Available at:http://eur-lex.europa.eu/LexUriServ/site/en/oj/2006/c_146/c_14620060622en00040005.pdfCouncil of the European Union, Council Resolution, Conclusions of the Council and of the Representatives of theGover-nments of the Member States, meeting within the Council of 15 November 2007, on improving the qualityof teacher education. (2007/C300/01). Available at: http://eur-lex.europa.eu/LexUriServ/LexUriServ.do?uri=OJ:C:2007:300:0006:0009:EN:PDFCouncil of the European Union. Council Conclusions of 12 May 2009 on a strategic framework for European cooperationin education and training (ET 2020) [Official Journal C 119 of 28.5.2009].Available at: http://europa.eu/legislation_summaries/education_training_youth/general_framework/ef0016_en.htmCouncil of the European Union, Council Decision 21 October 2010 on guidelines for the employment policies of theMember States [Official Journal L of 24.11.2010]. (2010/707/EU) Available at: http://eur-lex.europa.eu/LexUriServ/LexUriServ.do?uri=OJ:L:2010:308:0046:01:EN:HTMLCouncil of the European Union, 3073th Employment, Social Policy, Health and Consumer Affairs, Council meeting Brussels,7 March 2011 Council Conclusions on the European Pact for gender equality for the period 2011–2020. Availableat: http://www.consilium.europa.eu/uedocs/cms_data/docs/pressdata/en/lsa/119628.pdfCouncil of the European Union. European Pact for gender equality for the period 2011–2020 (7349/11). Available at:http://www.consilium.europa.eu/uedocs/cms_data/docs/pressdata/en/lsa/119630.pdfCouncil of the European Union, Combating Violence Against Women, and the Provision of Support Services for Victimsof Domestic Violence – Council Conclusions Brussels, 6 December 2012. (17444/12). Available at: http://register.consilium.europa.eu/pdf/en/12/st17/st17444.en12.pdfCrane, R. (2007), ‘Is there a quiet revolution in women’s travel? Revisiting the gender gap in commuting’, Journal of theAmerican Planning Association, 73(3) pp. 298–316.Crompton, R. (1997), Women and Work in Modern Britain, Oxford: Oxford University Press.Crompton, R. (2006), Employment and the family: the reconfiguration of work and family life in contemporary societies,Cambridge: Cambridge University Press.
172
Gender Equality Index – Report
Cueva, B. H. (2006), ‘What is Missing in Measures of Gender Empowerment?’ Journal of Human Development, 7(2)pp. 221–241.Dahl, S., Nesheim,T., OlsenK, K.M. (2009), ‘Quality of work – concept and measurement’, REC-WP 05/2009, Working Paperson the Reconciliation of Work and Welfare in Europe, RECWOWE Publication, Dissemination and Dialogue Centre,Edinburgh.Daly, M. (2005), ‘Gender Mainstreaming in Theory and Practice’, Social Politics: International Studies in Gender, State andSociety, 12(3) Fall, pp. 433–450.Davis, J., Buchanan, K., Katz, R and Lee Green, B. (2011), ‘Gender Differences in Cancer Screening Beliefs, Behaviors, andWillingness to Participate: Implications for Health Promotion’, American Journal of Men’s Health, 6(3) pp. 211–217.DeLamater, J.D. and Myers, D.J. (2007), Social Psychology (sixth edition), Belmont, CA: Thomson Wadsworth.Dijkstra, A.G. and Hanmer, L.C. (2000), ‘Measuring socio-economic gender equality: towards an alternative for UNDP’s GDI’,Feminist Economics, 6(2) pp. 41–75.Dougherty, C. (2005), ‘Why are Returns to Schooling Higher for Women than for Men?’ Journal of Human Resources,40 (Fall) pp. 969–88.Doyal, L. (2000), ‘Gender equity in health: debates and dilemmas’, Social Science & Medicine, 51(6) pp. 931–939.Doyal, L. (2001), Sex, gender, and health: the need for a new approach, BMJ, 323 (7320) pp.1061–1063.EIGE (2010), Mid-Term Programme 2010–2012 Available at: http://www.eige.europa.eu/sites/default/files/Mid-term_Work_Programme%202010-2012_en.pdfEllsberg, M., Jansen, H., Heise, L., Watts, C. and García-Moreno, C. (2008), (on behalf of the WHO Multi-country Study onWomen’s Health and Domestic Violence against Women Study Team), Intimate partner violence andwomen’s physical and mental health in the WHO multi-country study on women’s health and domestic violence:an observational study, Lancet 371, pp. 1165–1172.EMCO Report (2010), Ad Hoc Group report on the 2010 thematic review [part 2. ‘Quality in work’], 24 Novemeber 2010.Available at: http://ec.europa.eu/social/BlobServlet?docId=6441&langId=enEpstein, C. (1988), Deceptive Distinctions: Sex, Gender and the Social Order, New Haven: Yale University Press.Eurofound (2002), ‘Quality of work and employment in Europe: Issues and challenges’, Foundation Paper No. 1, PublicationsOffice of the European Union, Luxembourg.Eurofound (2006), ‘Reconciliation of work and family life and collective bargaining in the European Union: An analysis ofEIRO articles’. Available at: http://eurofound.europa.eu/pubdocs/2006/06/en/1/ef0606en.pdfEurofound (2009), European Company Survey 2009, Part-time work in Europe. Available at: http://www.eurofound.europa.eu/pubdocs/2010/86/en/3/EF1086EN.pdfEurofound (2012), Fifth European Working Conditions Survey, Luxembourg: Publications Office of the European Union.European Association for the Education of Adults (EAEA) (2007), Gender Aspects in Lifelong Learning, Study for theEuropean Parliament’s Committee on Culture and Education, Brussels: European Parliament.
Gender Equality Index – Report
173
European Commission (1994), European Social Policy, ‘A way forward the Union. A White paper on Social Policy’ (COM(94)333). Available at: http://aei.pitt.edu/1118/1/social_policy_white_paper_COM_94_333_A.pdfEuropean Commission (1996), ‘Incorporating equal opportunities for women and men into all community policies andactivities’. Available at: http://eur-lex.europa.eu/LexUriServ/LexUriServ.do?uri=COM:1996:0067:FIN:EN:PDFEuropean Commission (2000), Commission Communication of 7 June 2000,Towards a Community framework strategy ongender equality (2001–2005), (COM(2000) 335 final), not published in the Official Journal. Available at: http://europa.eu/legislation_summaries/other/c10932_en.htmEuropean Commission (2001), Communication from the commission, Employment and social policies: a framework forinvesting in quality, 30 October 2001 (COM(2001) 313 final). Available at: http://eur-lex.europa.eu/LexUriServ/LexUriServ.do?uri=COM:2001:0313:FIN:EN:PDFEuropean Commission (2003), ‘Improving quality in work: a review of recent progress’, (COM(2003) 728 final) 26.11.2003.Available at: http://eur-lex.europa.eu/LexUriServ/LexUriServ.do?uri=COM:2003:0728:FIN:EN:PDFEuropean Commission (2003a), Communication from the Commission to the Council, the European Parliament, theEconomic and Social Committee and the Committee of the Regions, The future of the European EmploymentStrategy (EES),’A strategy for full employment and better jobs for all’ (COM(2003), 6 final).European Commission (2005), Communication from the Commission, The Social Agenda 9 February 2005 (COM(2005)33 final). Available at: http://eur-lex.europa.eu/LexUriServ/LexUriServ.do?uri=COM:2005:0033:FIN:EN:PDFEuropean Commission (2005), Women and Science Excellence and Innovation – Gender Equality in Science, CommissionStaff Working Document, Brussels: European Commission.European Commission (2006), Indicators for Monitoring the Employment Guidelines, 2006 Compendium. Update from01/08/2006. Brussels, European Commission.European Commission (2006), Communication from the Commission to the Council, the European Parliament, the Euro-pean Economic and Social Committee and the Committee of the Regions, A Roadmap for equality betweenwomen and men 2006–2010 (COM(2006) 92 final). Available at: http://europa.eu/legislation_summaries/employment_and_social_policy/equality_between_men_and_women/c10404_en.htmEuropean Commission (2007), ’Key competences for lifelong learning’, European Reference Framework. Available at:http://ec.europa.eu/dgs/education_culture/publ/pdf/ll-learning/keycomp_en.pdfEuropean Commission (2007a), ‘Women and men in decision-making. Analysis of the situation and trends’, EuropeanCommunities, 2008, Luxembourg.European Commission (2009), ‘Expert Group on Gender and Employment’ (EGGE), Gender segregation in the labourmarket Root causes, implications and policy responses in the EU, Publication of the European Union. Luxembourg.European Commission (2010), Glossary. Available at: http://ec.europa.eu/justice/glossary/index_en.htmEuropean Commission (2010), Europe 2020, Commission proposes new economic strategy in Europe, Brussels, 3rd March2010 (IP/10/225). Available at: http://ec.europa.eu/europe2020/index_en.htm
174
Gender Equality Index – Report
European Commission (2010), Communication from the Commission of 5 March 2010, A Strengthened Commitment toEquality between Women and Men. A Women’s Charter – Declaration by the European Commission on theoccasion of the 2010 International Women’s Day in commemoration of the 15th anniversary of the adoption of aDeclaration and Platform for Action at the Beijing UN World Conference on Women and of the 30th anniversaryof the UN Convention on the Elimination of All Forms of Discrimination against Women (COM(2010) 78 final).Available at: http://ec.europa.eu/commission_2010-2014/president/news/documents/pdf/20100305_1_en.pdfEuropean Commission (2010), Communication from the Commission to the European Parliament, the Council, theEuropean Economic and Social Committee and the Committee of the Regions, ’A Digital Agenda for Europe’(COM/2010/0245 final). Available at: http://eur-lex.europa.eu/LexUriServ/LexUriServ.do?uri=COM:2010:0245:FIN:EN: HTMLEuropean Commission (2010), Strategy for equality between women and men 2010–2015, Brussels, 21.9.2010 (COM(2010)91 final). Available at: http://ec.europa.eu/justice/gender-equality/document/index_en.htmEuropean Commission (2010), Actions to implement the Strategy for Equality between Women and Men 2010–2015.(SEC(2010) 1079/2)European Commission (2011), ‘Women on the Board Pledge for Europe’, Available at: http://ec.europa.eu/commissio_2010–2014/reding/womenpledge/index_en.htmEuropean Commission (2011a), Tackling the Gender Pay Gap in the European Union, Luxembourg: Publications Office ofthe European Union.European Commission (2011b), Report on the progress on Equality between women and Men 2010. Available at: http://www.europarl.europa.eu/meetdocs/2009_2014/documents/sec/com_sec(2011)0193_/com_sec(2011)0193_en.pdfEuropean Commission (2012a), Structural Change in Research Institutions: Enhancing Excellence, Gender Equality andEfficiency in Research and Innovation, Brussels: European Commission.European Commission (2012b), ’Women in economic decision-making in the EU: Progress report’, Justice, A Europe 2020initiative, Luxembourg: Publications Office of the European Union.European Commission (2013), The impact of the economic crisis on the situation of women and men and on genderequality policies, Luxembourg, Publications Office of the European Union. Available at: http://ec.europa.eu/justice/gender-equality/files/documents/130410_crisis_report_en.pdfEuropean Economic Community, Treatyestablishing the European Economic Community, EEC (Treaty, 25/03/1957), Rome. Available at: http://europa.eu/legislation_summaries/institutional_affairs/treaties/treaties_eec_en.htmEuropean Council, Conclusion of the Presidency, Nice, 7–10 DECEMBER 2000. Available at: http://www.europarl.europa.eu/summits/nice1_en.htmEuropean Council, Presidency Conclusion, Barcelona European Council 15–16 March 2002, (SN 100/1/02 REV1). Available at:http://www.consilium.europa.eu/ueDocs/cms_Data/docs/pressData/en/ec/71025.pdfEuropean Council, Conclusions, (EUCO 23/11) 23–24 June 2011. Available at: http://ec.europa.eu/commission_2010–2014/president/news/speeches-statements/pdf/20110624_1_en.pdfEuropean Parliament (2009), ’Women’s Rights and Gender Equality: Basic Information’. Available at: http://www.europarl.europa.eu/document/activities/cont/200907/20090728ATT59207/20090728ATT59207EN.pdf 36:en:PDF
Gender Equality Index – Report
175
European Parliament, Directive 2006/54/EC of the European Parliament and the Council of 5 July 2006 on the implemen-tation of the principle of equal opportunities and equal treatment of men and women in matters of employmentand occupation. Available at: http://eur-lex.europa.eu/LexUriServ/LexUriServ.do?uri=OJ:L:2006:204:0023:0036:en:PDFEuropean Parliament, European Parliament resolution of 5 April 2011 on priorities and outline of a new EU policy framework to fight violence against women (2010/2209(INI). Available at: http://www.europarl.europa.eu/oeil/popups/ficheprocedure.do?id=587248#documentGatewayEuropean Union, Treaty of Amsterdam amending the Treaty on European Union, the Treaties establishing the EuropeanCommunities and related acts, Official Journal C 340, 10 November 1997. (97/C 340/05). Available at: http://eur-lex.europa.eu/en/treaties/dat/11997D/htm/11997D.htmlEuropean Union, Charter of Fundamental Rights of the European Union (2000/C 364/01), 7 December 2000, Official Journalof the European Communities, 18 December 2000. Available at: http://www.europarl.europa.eu/charter/pdf/text_en.pdfEuropean Union, Consolidated Version of the treaty on European Union and of the treaty establishing the European Community (C 321 E/1. 29.12.2006). Available at: http://eur-lex.europa.eu/LexUriServ/LexUriServ.do?uri=OJ:C:2006:321E:0001:0331:EN:PDFEuropean Union, Treaty of Lisbon Amending the Treaty on European Union and the Treaty Establishing the EuropeanCommunity, 13 December 2007 (2007/C 306/01). Available at: http://eur-lex.europa.eu/LexUriServ/LexUriServ.do?uri=OJ:C:2010:083:0047:0200:en:PDFEuropean Union, EU guidelines on violence against women and girls and combating all forms of discrimination againstthem, General Affairs Council of 8 December 2008 (Not published in the Official Journal). Available at: http://europa.eu/legislation_summaries/human_rights/human_rights_in_third_countries/dh0003_en.htmEuropean Union, Consolidated versions of the Treaty on European Union and the Treaty on the Functioning of the Euro-pean Union (2010/C 83/01). Available at: http://eur-lex.europa.eu/JOHtml.do?uri=OJ:C:2010:083:SOM:en:HTMLEuropean Union, Consolidated version of the Treaty of the European Union and the Treaty on the Functioning of theEuropean Union, TEU (2010), 2010/C 83/01. Available at: http://eur-lex.europa.eu/LexUriServ/LexUriServ.do?uri=OJ:C:2010:083:0013:0046:en:PDFEurostat (2005), European Statistics Code of Practice for the National and Community Statistical Authorities. Available at:http://epp.eurostat.ec.europa.eu/cache/ITY_OFFPUB/KS-77-07-026/EN/KS-77-07-026-EN.PDFEurostat (2012), Labour market participation by sex and age – Statistics Explained (2012/10/5). Available at: http://epp.eurostat.ec.europa.eu/statistics_explained/index.php/Labour_market_participation_by_sex_and_ageEurydice (2010), Gender Differences in Educational Outcomes: Study on the Measures Taken and the Current Situation inEurope, Brussels: Education, Audiovisual and Culture Executive Agency.Folbre, N. (2006), ’Measuring Care: Gender, Empowerment, and the Care Economy’, Journal of Human Development, 7(2)pp. 183–200.Fraser, N. (1997), Justice Interruptus: Critical Reflections on the ‘Postsocialist’ Conditio, New York, Routledge.Friedman, M. (2011), ‘A holistic Approach to Gender Equality and Social Justice’, OD Practitioner, 43(1), 12.Green, F. (2006), Demanding Work. The Paradox of Job Quality in the Affluent Economy, Woodstock: PrincetonUniversity Press.
176
Gender Equality Index – Report
Hakim, C. (1996), Key Issues in women’s work. Female heterogeneity and the polarisation of women’s employment,London: Athlone.Hooper, L. (2006), ‘A look at the health dimension of the GDI’, Background Paper, Produced for Revisiting UNDP’sgenderelated measures, HDRO, New York.Hutton, W. (1995), The state we’re in, London: Jonathan Cape.Iceland, J. and Bauman, Kurt J. (2007), ‘Income poverty and material hardship: how strong is the association?’, inThe Journal of Socio-Economics, 36(2) pp. 376–396.Inglehart, R. and Norris, P. (2003), Rising tide : gender equality and cultural change around the world, Cambridge:Cambridge University Press.Jaumotte, F. (2003), ‘Labour Force Participation of Women: empirical evidence on the role of policy and other determi-nants in OECD countries’, OECD Economic Studies, No. 37, pp. 51–108.Kantola, J. (2000), Gender and the European Union, Basingstoke: Palgrave Macmillan.Kirby, M. (2000), Sociology in Perspective, Oxford: Heinemann.Klasen, S. (2006), ’UNDPs Gender Related Measures: Some Conceptual Problems and Possible Solutions’, Journal of HumanDevelopment. 7(2) pp. 243–274.Klasen, S., and Lamanna, F. (2009), ’The Impact of Gender Inequality in Education and Employment on Economic Growth:New Evidence for a Panel of Countries’, Feminist Economics, 15(3) pp. 91–132.Lämmermann, S. (2010),’Financial Exclusion and Access to Credit’, European Social Watch Report, 2010. Available at: http://ww.socialwatch.eu/wcm/financial_exclusion.htmlLeathwood, C. Francis, B. (ed) (2006), ‘Gender and Lifelong Learning’, Critical feminist engagements, New York: Routledge.Leschke, J., Watt, A. and, with Finn, M. (2008), Putting a number on job quality? Constructing a European Job QualityIndex, Working paper, ETUI-REHS.Lynch, K. and Feeley M. (2009), Gender and Education (and employment) Gender imperatives and their implications forwomen and men Lessons from research for policy makers, Nesse Network of Experts, Brussels: EuropeanCommission.Maddock, S. (1999), Challenging Women: Gender, Culture and Organisation, London: Sage Publications:.Martin, J. (2003), ’Feminist theory and critical theory: unexplored synergies’, in Alvesson, M. and Willmott, H. (eds) StudyingManagement Critically, pp. 66–91. London: Sage.Martin, P. Y. (2003), ‘Gender as a social institution’, Social Forces, 82, pp.1249–1274.McCall, L. (2005), ’The complexity of intersectionality’, Signs, 30(3) pp. 1771–1800.Meier, P., Lombardo, E., Bustelo, M. and Pantelidou Maloutas, M. (2004), ‘Women in Political Decision-Making and GenderMainstreaming: Obvious Partners?’, Paper presented at 2nd Pan-European Conference on EU Politics of the ECPRStanding Group on the EU, Bologna, June 24–26.
Gender Equality Index – Report
177
Miranda, V. (2011), Cooking, caring and volunteering: Unpaid work around the world, OECD Publishing.Nardo, M. M., Saisana, A., Saltelli, Tarantola, S., Hoffman, A. and E. Giovannini (2008), Handbook on Constructing Compo-site Indicators: Methodology and User Guide, OECD, European Commission, Joint Research Centre. Available at:http://composite-indicators.jrc.ec.europa.eu/Handbook.htmNussbaum, M. (2003), ’Capabilities as fundamental Entitlements: Sen and Social Justice’, Feminist Economics 9/2-3, pp.33–59.O’Toole, L., Schiffman, J. R.; Kiter, E. and Margie L. (2007), ‘Preface: conceptualizing gender violence,’ in O’Toole, Laura L.,Schiffman, J. R.; Kiter, E. and Margie L. (eds) Gender Violence: Interdisciplinary Perspectives, Second Edition,New York: New York University Press.OECD (2009),’Special Focus: Measuring Leisure in OECD Countries’, Society at a Glance, Geneva: OECD.OECD, Social Institutions and Gender Index (SIGI). Available at: http://genderindex.org/Ono, H., & Zavodny, M. (2003), Gender and the Internet*, Social Science Quarterly, 84(1) pp.111–121.Pascall, G., and Lewis, J. (2004), ’Emerging gender regimes and policies for gender equality in a wider Europe’, Journalof Social Policy, 33(3)pp.373–394.Payne, S. (2009), ‘How can Gender Equity be addressed through Health Systems?’, Health Systems and Policy analysis,Policy Brief 12, Copenhagen: WHO.Permanyer, I. (2011), ‘Are UNDP Indices Appropriate to Capture Inequalities in Europe?’ Social Indicator Research, Springer,DOI 10.1007/s11205-011-9975-6.Phoenix, A. (2009), ’Is there a crisis of masculinity?’, Paper presented at Gender Differences in Educational Achievement,Uppsala, Sweden, 17–18 November 2009.Plantenga, J. C. Fagan, Maier, F. and Remery, C. (2011), Study for the development of the basic structure of a EuropeanUnion Gender Equality Index. Final report. Commissioned by the European Institute for Gender Equality (EIGE),unpublished.Plantenga, J., Remery, C., Figueriredo, H. and Smith, M. (2009), ‘Towards a European Union Gender Equality Index’, Journalof European Social Policy, 19(1), pp. 19–33.Plantenga, J.U, Figueiredo, C. Remery and M. Smith (2003), ‘Towards an EU gender equality index’, Feasibility studycommissioned by and presented to the European Commission.Popay, J. and Groves, K. (2000), ‘Narrative’ in research on gender inequalities in health, in Annandale, E. and Hunt, K. (eds),Gender Inequalities in Health, Berkshire, UK: Open University Press.Rees, T. (1992), Women and the Labour Market, London: Routledge.Richardson, D. and Monro, S. (2012), Sexuality, Equality and Diversity, Basingstoke: Palgrave Macmillan.Robeyns, I. (2003), ‘Sen’s Capability Approach and Gender Inequality: Selecting Relevant Capabilities’, Feminist Economics,9 (2) pp. 61–92.Robeyns, I. (2007), ‘When will society be gender just?’, In J. Browne, ed., The Future of Gender, Cambridge, UK: CambridgeUniversity Press. pp. 54–76
178
Gender Equality Index – Report
Rubery, J. (2002),’Gender mainstreaming and gender equality in the EU: the impact of the EU employment strategy’,Industrial Relations Journal, 33(5), pp. 500–23.Saaty, T. L. (1990), ‘Eigenvector and logarithmic least squares’, European Journal of Operational Research 48 (1990), pp 156–160.Saisana, M. Saltelli A. (2011), ‘Rankings and Ratings: Instructions for Use’, Hague Journal on the Rule of Law, 3. pp. 247–268.Sayer, L. (2005), ‘Gender, time and inequality: Trends in women’s and men’s paid work, unpaid work and free time’,Social forces, 84(1) pp. 285–303.Schüler, D. (2006), ‘The Uses and Misuses of the Gender-related Development Index and Gender Empowerment Measure:A Review of the Literature’, Journal of Human Development and Capabilities. 7(2) pp. 161–82.Sen, A. (1980), ’Equality of What?’, in: McMurrin, Sterling M. ed. The Tanner Lectures on Human Values. Cambridge,Cambridge University Press. pp. 195–220.Sen, A. (1993), ‘Capability and Well-Being’, in: M. Nussbaum and A. Sen, eds., The Quality of Life, New York: OxfordUniversity Press, pp. 30–53.Social Protection Committee (2004), Open Method of Co-ordination on social inclusion, health care and long-term care aswell as pensions (‘Social’ OMC). Available at: http://ec.europa.eu/social/main.jsp?catId=758&langId=enSquires, J. (2008), ’Intersecting Inequalities: Reflecting on the Subjects and Objects of Equality’, The Political Quarterly,Vol. 79, No. 1, pp. 53–61.Statistical Commission and Economic Commission for Europe, ECE/CES/BUR/2010/NOV/2/Add.2 (2010) TERMS OFREFERENCE FOR THE TASK FORCE ON TIME USE SURVEYS. Available at: http://www.unece.org/fileadmin/DAM/stats/documents/ece/ces/bur/2010/mtg1/2.add.2.e.pdfTinklin,T., Croxford, L., Ducklin, A. and Frame, B. (2005), ’Gender and attitudes to work and family roles: the views of youngpeople at the millennium’, Gender and Education, 17 (2) May, pp. 129–142.Tremblay, M. (1998), ‘Do Female MPs Substantively Represent Women?’, Canadian Journal of Political Science, 31 (3)pp. 435–65.UDHR (1948), The Universal Declaration of Human Rights. Available at: http://www.ohchr.org/en/udhr/pages/introduction.aspxUN Office of the High Commissioner for Human Rights (2002), Draft Guidelines: A Human Rights Approach to PovertyReduction Strategies, 10 September 2002. Available at: http://www.unhcr.org/refworld/docid/3f8298544.htmlUNDP (1990), ’Concept and Measurement of Human Development’, Human Development Report. Available at: http://hdr.undp.org/en/reports/global/hdr1990/UNECE (2010), Developing Gender Statistics: A Practical Tool, United Nations: Geneva. Available at: http://www.unece.org/fileadmin/DAM/stats/publications/Developing_Gender_Statistics.pdfUNECE (2010), ’Measuring Quality of Employment’, Country Pilot Reports, Geneva: United Nations.UNECE (2013), Indicators of Gender Equality in the UNECE Region, Conference of European Statisticians Task Force onIndicators of Gender Equality. Forthcoming
Gender Equality Index – Report
179
United Nations (1995), Beijing Declaration and Platform for Action. The Fourth World Conference on Women, Beijing from4 to 15 September 1995. Available at: http://www.un.org/womenwatch/daw/beijing/platform/United Nations (2000), United Nations Millennium Declaration (A/55/L.2). Available at: http://www.un.org/millennium/declaration/ares552e.htmUnited Nations (2005), Resolution adopted by the General Assembly, 60/1, 2005 World Summit Outcome. Available at:http://daccess-dds-ny.un.org/doc/UNDOC/GEN/N05/487/60/PDF/N0548760.pdf?OpenElementUnited Nations (2009), Department of Economic and Social Affairs Division for the Advancement of Women, 2009 WorldSurvey on the Role of Women in Development, Women’s Control over Economic Resources and Access toFinancial Resources, including Microfinance, New York. Available at: http://www.un.org/womenwatch/daw/public/WorldSurvey2009.pdfUnited Nations General Assembly adopted the Convention on the Elimination of All Forms of Discrimination againstWomen (CEDAW) (1979). Available at: http://www.un.org/womenwatch/daw/cedaw/text/econvention.htmVerloo, M. (2005), ‘Displacement and Empowerment: Reflections on the Concept and Practice of the Council of EuropeApproach to Gender Mainstreaming and Gender Equality’, Social Politics: International Studies in Gender, Stateand Society, 12(3), Fall, pp. 344–365.Verloo, M. (2006), ‘Multiple Inequalities, Intersectionality and the European Union’, European Journal of Women’s Studies13(3) pp.211–28.Verloo, M., and Lombardo, E. (2007), ‘Contested gender equality and policy variety in Europe: Introducing a critical frameanalysis approach’, Multiple Meanings of Gender Equality: a critical frame analysis of gender policies in Europe,Budapest: Central European University Press.Walby, S. (1990), Theorising Patriarchy, Oxford: Blackwell.Walby, S. (1997), Gender Transformations, London: Routledge.Walby, S. (2005), ‘Gender Mainstreaming: Productive Tensions in Theory and Practice’, Social Politics: International Studiesin Gender, State and Society, 12(3) Fall, pp. 321–343.Walby, S. (2009), ‘Beyond the Politics of Location’, The Power of argument in gender equality politics, pp. 36–51 inE. Lombardo, P. Meier and M. Verloo (eds), The Discursive Politics of Gender Equality: Stretching, Bending andPolicymaking. London: Routledge.Waldron, I. (2000), ‘Trends in gender differences in mortality: relationships to changing differences in behaviour and othercausal factors’, in Annandale, E. and Hunt, K. (eds), Gender Inequalities in Health, Berkshire: Open University Press.World Bank, (2003), Gender Equality and the Millennium Development Goals, Gender and Development Group,Washington: World Bank.World Economic Forum (2012), ’The Global Gender Gap Report 2012’. Available at: http://www.weforum.org/reports/global-gender-gap-report-2012World Health Organization (2009), ’Health in the European Union Trends and analysis’. Mladovsky,P., Allin,S., Masseria,C.,Hernández-Quevedo,C., McDaid,D. and Mossialos, E., Observatory Studies Series No 19, prepared at the request of theEuropean Commission’s Directorate-General for Employment, Social Affairs and Equal Opportunities, EuropeanObservatory on Health System and Policies.
180
Gender Equality Index – Report
European Institute for Gender EqualityGender Equality Index Report2013 – 182 pp. – 21.0 x 29.7 cmISBN 978-92-9218-224-3doi: 10.2839/69597
MH-31-13-572-EN-C
http://eige.europa.eu