Udenrigsudvalget 2011-12
URU Alm.del Bilag 7
Offentligt
Levels & Trends in
ChildMortality
Report 2011Estimates Developed by theUN Inter-agency Group forChild Mortality Estimation
United NationsDESA/Population Division
This report was prepared at UNICEF Headquarters by Danzhen You, Gareth Jones and Tessa Wardlaw on behalf of theUnitedNations Inter‑agency Group for Child Mortality Estimation.Organizations and individuals involved in generating country-specific estimates on child mortalityUnited Nations Children’s FundDanzhen You, Tessa WardlawWorld Health OrganizationTies Boerma, Colin Mathers, Mie Inoue, Mikkel OestergaardThe World BankEmi SuzukiUnited Nations Population DivisionFrancois Pelletier, Gerhard Heilig, Kirill Andreev, Patrick Gerland, Danan Gu, Nan Li, Cheryl Sawyer, Thomas SpoorenbergUnited Nations Economic Commission for Latin America and the Caribbean Population DivisionDirk Jaspers Faijer, Guiomar Bay, Tim MillerSpecial thanks to the Technical Advisory Group of the Inter-agency Group for Child Mortality Estimation for providingtechnical guidance on methods for child mortality estimationKenneth Hill (Chair), Harvard UniversityLeontine Alkema, National University of SingaporeSimon Cousens, London School of Hygiene and Tropical MedicineTrevor Croft, Measure DHS, ICF MacroGareth Jones, ConsultantMichel Guillot, University of PennsylvaniaJon Pedersen, FafoNeff Walker, Johns Hopkins UniversityJohn Wilmoth, University of California, Berkeley
Further thanks go to Priscilla Akwara, Mickey Chopra, Archana Dwivedi, Jimmy Kolker, Richard Morgan, Holly Newby andIan Pett from UNICEF for their support as well as to Joy Lawn from Save the Children for her comments. And special thanks toMengjia Liang from UNICEF for her assistance in preparing the report.Communications Development Incorporated provided overall design direction, editing and layout.Copyright � 2011by the United Nations Children’s FundThe Inter‑agency Group for Child Mortality Estimation (IGME) constitutes representatives of the United Nations Children’sFund, the World Health Organization, the World Bank and the United Nations Population Division. The child mortality esti‑mates presented in this report have been reviewed by IGME members. As new information becomes available, estimates willbe updated by the IGME. Differences between the estimates presented in this report and those in forthcoming publicationsby IGME members may arise because of differences in reporting periods or in the availability of data during the productionprocess of each publication and other evidence. While every effort has been made to maximize the comparability of statisticsacross countries and over time, users are advised that country data may differ in terms of data collection methods, populationcoverage and estimation methods used.The designations employed and the presentation of the material in this publication do not imply the expression of any opinionwhatsoever on the part of UNICEF, the World Health Organization, the World Bank or the United Nations Population Divisionconcerning the legal status of any country, territory, city or area or of its authorities, or concerning the delimitation of its fron‑tiers or boundaries. Dotted lines on maps represent approximate border lines for which there may not yet be full agreement.On 9 July 2011 the Republic of South Sudan seceded from the Republic of the Sudan and was subsequently admitted to theUnited Nations on 14 July 2011; disaggregated data for Sudan and South Sudan as separate states are not yet available. Data andmaps in this report refer to Sudan as it was constituted in 2010.United Nations Children’s Fund3 UN Plaza, New York, New York, 10017 USAThe World Bank1818 H Street, NW, Washington, DC, 20433 USAWorld Health OrganizationAvenue Appia 20, 1211 Geneva 27, SwitzerlandUnited Nations Population Division2 UN Plaza, New York, New York, 10017 USA
PROGRESS TOWARDS MillEnniuM DEvElOPMEnT GOAl 4:KEY FACTS AnD FiGuRES• Overall, substantial progress has been made towards achieving MDG 4. The number of under-five deaths worldwide has declined from more than 12 mil-lion in 1990 to 7.6 million in 2010. Nearly 21,000 children under five died every day in 2010—about 12,000 fewer a day than in 1990. • Since 1990 the global under-five mortal-ity rate has dropped 35 percent—from 88 deaths per 1,000 live births in 1990 to 57 in 2010. Northern Africa, East-ern Asia, Latin America and the Carib-bean, South-eastern Asia, Western Asia and the developed regions have reduced their nder-five mortality rate by 50 per-ucent or more. • The rate of decline in under-five mortality has accelerated—from 1.9 percent a year over 1990–2000 to 2.5 percent a year over 2000–2010—but remains insuffi-cient to reach MDG 4, particularly in Sub-Saharan Africa, Oceania, Caucasus and Central Asia, and Southern Asia. • The highest rates of child mortality are still in Sub-Saharan Africa—where 1 in 8 children dies before age 5, more than 17 times the average for developed regions (1 in 143)—and Southern Asia (1 in 15). As under-five mortality rates have fallen more sharply elsewhere, the disparity be-tween these two regions and the rest of the world has grown. • Under-five deaths are increasingly con-centrated in Sub-Saharan Africa and Southern Asia, while the share of the rest of the world dropped from 31 per-cent in 1990 to 18 percent in 2010. • In Sub-Saharan Africa the average annual rate of reduction in under-five mortal-ity has accelerated, doubling from 1990–2000 to 2000–2010. Six of the fourteen best-performing countries are in Sub-Sa-haran Africa, as are four of the five coun-tries with the largest absolute reductions (more than 100 deaths per 1,000 live births). • About half of under-five deaths occur in only five countries: India, Nigeria, Dem-ocratic Republic of the Congo, Pakistan and China. India (22 percent) and Nigeria (11 percent) together account for a third of all under-five deaths. • Over 70 percent of under-five deaths occur within the first year of life.• The proportion of under-five deaths that occur within the first month of life (the neonatal period) has increased about 10 percent since 1990 to more than 40 percent.• Almost 30 percent of neonatal deaths occur in India. Sub-Saharan Africa has the highest risk of death in the first month of life and has shown the least progress.• Globally, the four major killers of chil-dren under age 5 are pneumonia (18 percent), diarrhoeal diseases (15 per-cent), preterm birth complications (12 percent) and birth asphyxia (9percent). Undernutrition is an underlying cause in more than a third of under-five deaths. Malaria is still a major killer in Sub-Saha-ran Africa, causing about 16 percent of under-five deaths.
1
IntroductionOnly four years remain to achieve MillenniumDevelopment Goal 4 (MDG 4), which calls forreducing the under-five mortality rate by two-thirds between 1990 and 2015. Since 1990 theunder-five mortality rate has dropped 35 percent,with every developing region seeing at least a 30percent reduction. However, at the global levelprogress is behind schedule, and the target is atrisk of being missed by 2015. The global under-five mortality rate needs to be halved from 57deaths per 1,000 live births to 29—that impliesan average rate of reduction of 13.5 percent ayear, much higher than the 2.2 percent a yearachieved between 1990 and 2010.Child mortality is a key indicator not only of childhealth and nutrition but also of the implemen-tation of child survival interventions and, morebroadly, of social and economic development. Asglobal momentum and investment for accelerat-ing child survival grow, monitoring progress atthe global and country levels has become evenmore critical. The United Nations Inter-agencyGroup for Child Mortality Estimation (IGME)updates child mortality estimates annually formonitoring progress. This report presents theIGME’s latest estimates of under-five, infant andneonatal mortality and assesses progress towardsMDG 4 at the country, regional and global levels.
2
The UN Inter-agency Group forChild Mortality EstimationThe IGME was formed in 2004 to share data onchild mortality, harmonize estimates within theUN system, improve methods for child mortal-ity estimation, report on progress towards theMillennium Development Goals and enhancecountry capacity to produce timely and prop-erly assessed estimates of child mortality. TheIGME, led by the United Nations Children’sFund (UNICEF) and the World Health Organiza-tion (WHO), also includes the World Bank andthe United Nations Population Division of theDepartment of Economic and Social Affairs asfull members.The IGME’s independent Technical AdvisoryGroup, comprising leading academic scholarsand independent experts in demography andbiostatistics, provides guidance on estimationmethods, technical issues and strategies for dataanalysis and data quality assessment.Generating accurate estimates of child mortal-ity poses a considerable challenge because of thelimited availability of high-quality data for manydeveloping countries. Complete vital registra-tion systems are the preferred source of data onchild mortality because they collect informationas events occur and they cover the entire popula-tion. However, many developing countries lackfully functioning vital registration systems thataccurately record all births and deaths. There-fore, household surveys, such as the UNICEF-supported Multiple Indicator Cluster Surveys andthe US Agency for International Development–supported Demographic and Health Surveys, arethe primary sources of data on child mortality indeveloping countries.The IGME seeks to compile all available national-level data on child mortality, including data fromvital registration systems, population censuses,household surveys and sample registration sys-tems. To estimate the under-five mortality trendseries for each country, a statistical model is fittedto data points that meet quality standards estab-lished by the IGME and then used to predict atrend line that is extrapolated to a common ref-erence year, set at 2010 for the estimates in thisreport. To predict infant mortality rates, modellife tables are used to transform under-five mor-tality rates. To predict neonatal mortality rates, a
statistical model is used to transform under-fivemortality rates.
Changes to data sourcesand methodologyThe IGME updates its child mortality estimatesannually after reviewing newly available dataand assessing data quality. In preparing theestimates in this report, the IGME recalculateddirect estimates from all available Demographicand Health Surveys for calendar year periods,using single calendar years for reference peri-ods shortly before the survey and then gradu-ally increasing the number of years for referenceperiods further in the past. For a given surveythe cut-off points for shifting from estimates forsingle calendar years to two years, or two yearsto three and so on are based on the coefficientsof variation (a measure of sampling uncertainty)of the estimates. The Technical Advisory Groupsuggested this recalculation because the sam-ple sizes of many household surveys have grownin recent years, allowing for shorter referenceperiods. The recalculated direct estimates withshorter reference periods replace the five-yearperiods used in previous estimations, therebyincreasing the number of data points for morerecent years.In addition, a substantial amount of newly avail-able data has been incorporated: data fromthe most recent surveys and censuses for about30 countries, new data from vital registrationsystems for more than 50 countries and datafrom more than 70 surveys and censuses con-ducted before 2000 for about 20 countries. Theincreased data availability has resulted in sub-stantial changes in the estimates for some coun-tries from previous years. Because the fittedunder-five mortality rate trend line is based onthe entire time series of data available for eachcountry and because model life tables and a sta-tistical model are used to derive estimates ofinfant and neonatal mortality rates based onunder-five mortality rates, the estimates pre-sented in this report may differ from and not becomparable with previous sets of IGME estimatesand the most recent underlying country data.Furthermore, this year the IGME used a differentcurve-fitting methodology. More details on thedata and methods used in deriving the estimatesare available in the IGME’s child mortality data-base, CME Info (www.childmortality.org).3
Support for data collectionat country levelModelled estimates of child mortality can only beas good as the underlying data. The IGME mem-bers, including UNICEF, the WHO and otherUN agencies, are actively involved at the countrylevel in strengthening national capacity in datacollection, estimation techniques and interpreta-tion of results.Population-based survey data are critical fordeveloping sound estimates for countries lack-ing functioning vital registration systems. TheUNICEF-supported Multiple Indicator ClusterSurveys programme has been working since 1995to build country-level capacity for survey imple-mentation, data analysis and dissemination. Thesurveys are government owned and implemented,and UNICEF provides financial and technicalsupport through workshops, technical consulta-tions and peer-to-peer mentoring. More than230 surveys have been conducted in more than100 countries. In addition to population-basedsurveys, the WHO and the UN Statistics Divi-sion work with countries to strengthen vital reg-istration systems. UNICEF supports this work bypromoting birth registration and monitoring itsprogress. The United Nations Population Fundprovides technical assistance for population cen-suses, another important source of child mortal-ity data.The IGME strengthens capacity by working withcountries to improve understanding of child
mortality data and estimation. CME Info (www.childmortality.org ), a comprehensive data por-tal on child mortality funded by UNICEF andlaunched by the IGME, is a powerful platform forsharing underlying data and collaborating withnational partners on child mortality estimates.Since 2008 a series of regional workshops has beenheld, training more than 250 participants from94 countries in the use of CME Info as well as thedemographic techniques and modelling methodsunderlying the estimates. In the last three yearsUNICEF and the IGME have sent experts to about10 countries to conduct training on child mor-tality estimation. As part of the data review pro-cess, UNICEF’s network of field offices providesopportunities to assess the plausibility of estimatesby engaging in a dialogue about the estimatesand the underlying data. WHO also engages itsMember States in a country consultation processthrough which governments provide feedback onthe estimates and their underlying data.Guiding this capacity strengthening work is afundamental principle: child mortality estima-tion is not simply an academic exercise but afundamental part of effective policies and pro-gramming. UNICEF works with countries toensure that child mortality estimates are usedeffectively at the country level, in conjunctionwith other data on child health, to improvechild survival programmes and stimulate actionthrough advocacy. This work involves partneringwith other agencies, organizations, and initiativessuch as the Countdown to 2015.
4
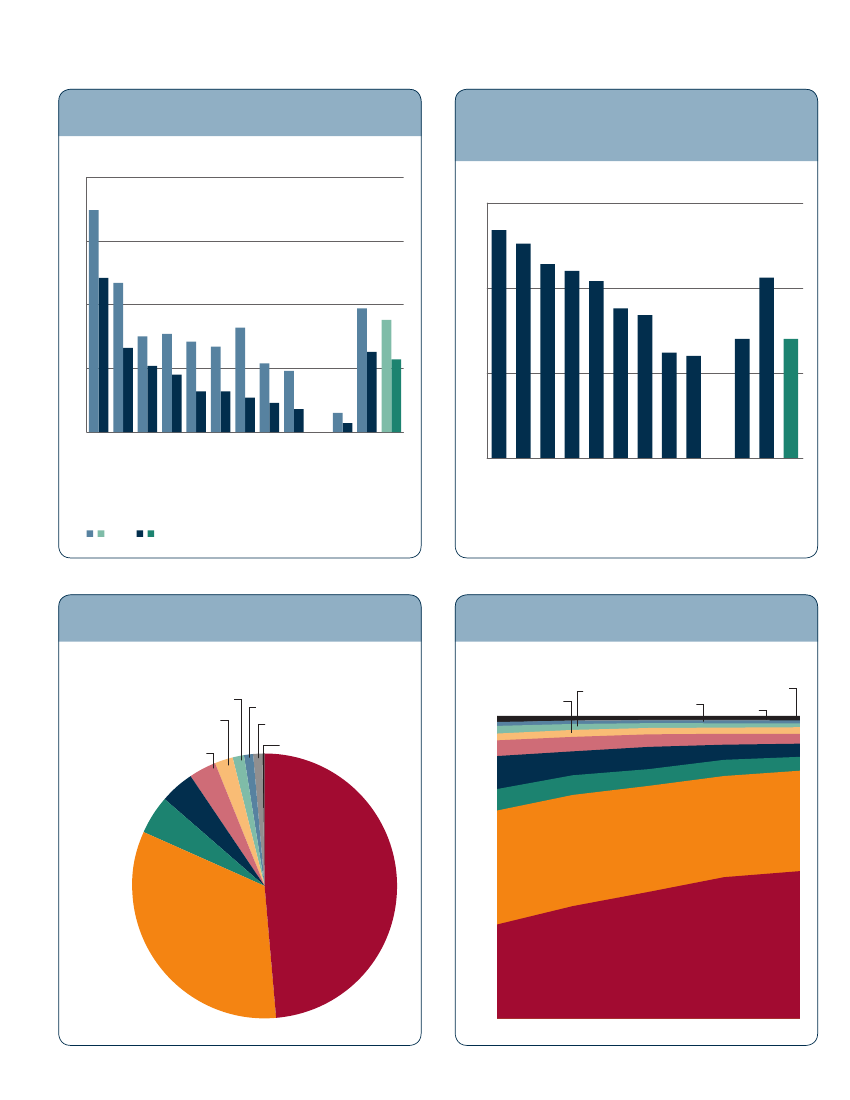
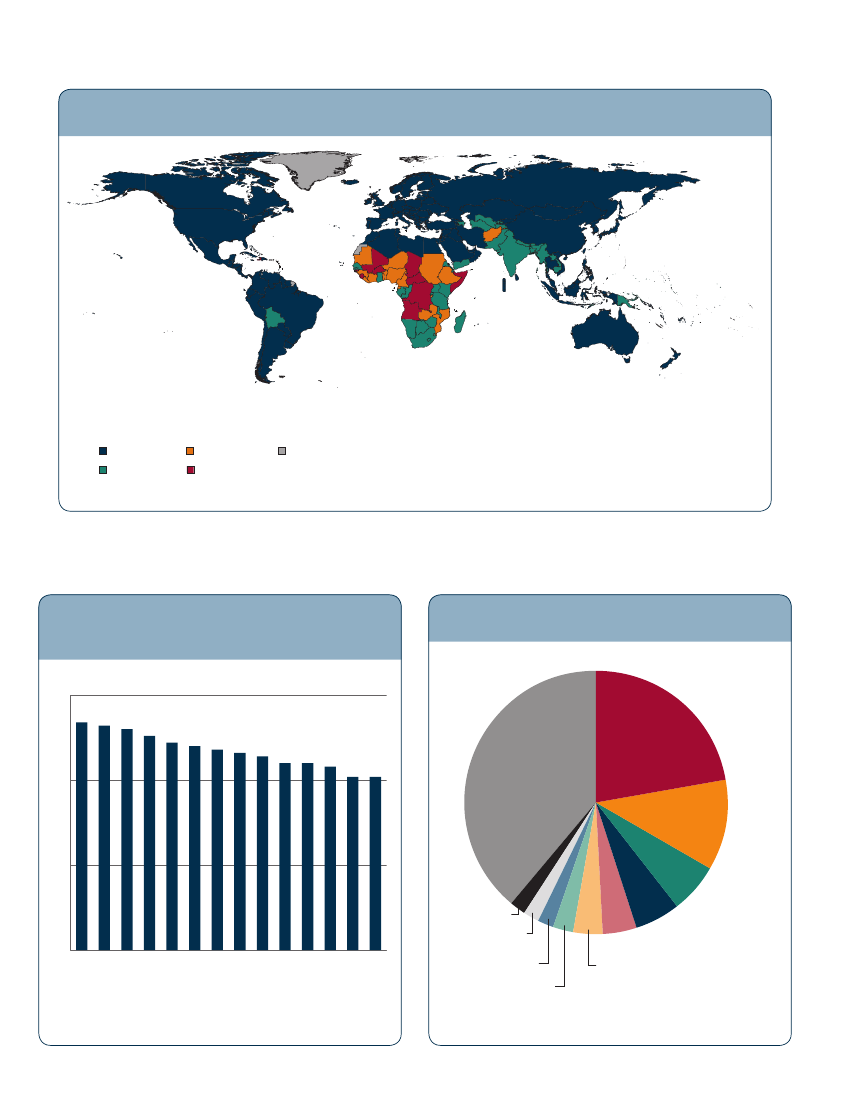
Levels and Trends inChildMortality, 1990–2010Under-five mortalityThe latest estimates of under-five mortality fromthe UN Inter-agency Group for Child Mortalityestimation (IGME) show a 35 percent decline inthe under-five mortality rate globally, from 88deaths per 1,000 live births in 1990 to 57 in 2010(table 1 and figure 1). Over the same period, thetotal number of under-five deaths in the worldhas declined from more than 12 million in 1990to 7.6 million in 2010 (table 2).Five of nine developing regions show reductionsin under-five mortality of more than 50 per-cent over 1990–2010 (figure 2). Northern Africahas achieved MDG 4, with a 67 percent reduc-tion, and Eastern Asia is close, with a 63 percentreduction.Sub-Saharan Africa and Oceania have achievedonly around a 30 percent reduction in under-fivemortality, less than half that required to reachMDG 4. However, Sub-Saharan Africa—also com-bating the HIV/AIDS pandemic that has affectedcountries in the region more than elsewhere inthe world—has doubled its average rate of reduc-tion from 1.2 percent a year over 1990–2000 to2.4 percent a year over 2000–2010.A major reason for the limited progress in reduc-ing child mortality at the global level, despitemore than half the regions having alreadyachieved reductions of more than 50 percent, isthe large and growing share of under-five deathsthat occur in Sub-Saharan Africa and SouthernAsia (82 percent; figures 3 and 4). Of the 26 coun-tries with under-five mortality rates above 100deaths per 1,000 live births in 2010, 24 are in Sub-Saharan Africa (map 1). Thus, to achieve MDG 4,substantial progress is needed in both regions.Fourteen of sixty-six countries with at least 40under-five deaths per 1,000 live births in 2010reduced their under-five mortality rate by at leasthalf between 1990 and 2010 (figure5). Timor-Leste, Bangladesh, Nepal, the Lao People’sDemocratic Republic, Madagascar and Bhutanrecorded declines of at least 60 percent, or morethan 4.5 percent a year on average. In absoluteterms the greatest reductions were in Niger,Malawi, Liberia, Timor-Leste and Sierra Leone(surpassing 100 deaths per 1,000 live births dur-ing the period). That 9 of the 14 countries arefrom Sub-Saharan Africa and Southern Asia, thetwo regions most in need of a faster reduction ofthe under-five mortality rate, shows that substan-tial progress can be made in these regions.Among developed regions under-five mortalityrates exceeded 10 deaths per 1,000 live births in2010 in the Republic of Moldova, Albania, Roma-nia, Ukraine, Bulgaria, Russian Federation andThe former Yugoslav Republic of Macedonia.Some 70 percent of the world’s under-five deathsin 2010 occurred in only 15 countries, and abouthalf in only five countries: India, Nigeria, Demo-cratic Republic of the Congo, Pakistan and China(figure 6). India (22 percent) and Nigeria (11percent) together account for a third of under-five deaths worldwide.Overall, substantial progress has been madetowards achieving MDG 4. About 12,000 fewerchildren died every day in 2010 than in 1990, thebaseline year for measuring progress. Improve-ment in child survival is evident in all regions.The number of countries with under-five mor-tality rates of 100 deaths per 1,000 live births orhigher has been halved from 52 in 1990 to 26 in2010. In addition, no country had an under-fivemortality rate above 200 deaths per 1,000 livebirths in 2010, compared with 13 countries in1990. The rate of decline has accelerated from1.9 percent a year over 1990–2000 to 2.5 percenta year over 2000–2010. Moreover, in Sub-SaharanAfrica, the region with the greatest burden ofunder-five deaths, the rate of decline doubled.But these rates are still insufficient to achieveMDG 4 by 2015: only 6 of 10 regions are on trackto achieve the MDG 4.5
TAblE
1
levels and trends in the under-five mortality rate, by Millennium Development Goal region,1990–2010 (deaths per 1,000 live births)Averageannual rateof reduction(percent)1990–2010Progress towardsMillenniumDevelopment Goal4target2010
Region
1990
1995
2000
2005
2009
2010
MDGtarget2015
Decline(percent)1990–2010
Developed regionsDeveloping regionsNorthern AfricaSub-Saharan AfricaLatin America and the CaribbeanCaucasus and Central AsiaEastern AsiaExcluding ChinaSouthern AsiaExcluding IndiaSouth-eastern AsiaWestern AsiaOceaniaWorld
1597821745477482811712371677588
1190621684471423610210758576882
10804715435623330879148456373
8713513827532519758039385765
7642812422471918677334335358
7632712123451817667232325257
53227581826169394124222529
5335673057426339444155523135
3.82.25.61.84.32.74.92.52.92.74.03.71.82.2
On trackInsufficient progressOn trackInsufficient progressOn trackInsufficient progressOn trackOn trackInsufficient progressInsufficient progressOn trackOn trackInsufficient progressInsufficient progress
a“On track” indicates that under-five mortality is less than 40 deaths per 1,000 live births in 2010 or that the average annual rate of reduction is at least 4 percent over1990–2010; “insufficient progress” indicates that under-five mortality is at least 40 deaths per 1,000 live births in 2010 and that the average annual rate of reduction is atleast 1 percent but less than 4 percent over 1990–2010. These standards may differ from those in other publications by Inter-agency Group for Child Mortality Estimationmembers.
TAblE
2
levels and trends in the number of deaths of children under age five, by MillenniumDevelopment Goal region, 1990–2010 (thousands)Share of globalunder-five deaths(percent)2010
Region
1990
1995
2000
2005
2009
2010
Decline(percent)1990–2010
Developed regionsDeveloping regionsNorthern AfricaSub-Saharan AfricaLatin America and the CaribbeanCaucasus and Central AsiaEastern AsiaExcluding ChinaSouthern AsiaExcluding IndiaSouth-eastern AsiaWestern AsiaOceaniaWorld
22711,7823043,7346231551,308294,5211,4438532701412,010
15110,5502103,977511119845463,9301,2336962471510,702
1299,4461534,00639786704303,3541,060530201159,575
1128,3551213,95630580423162,829875453173148,467
1027,6541003,75223779349172,588837368167147,756
997,515953,70924978331172,526830349165147,614
56366916050754144425939037
1.398.71.248.73.31.04.30.233.210.94.62.20.2100.0
6
FiGuRE
1
under-five mortality declined in allregions between 1990 and 2010
FiGuRE
2
Under-five mortality rate, by Millennium Development Goal region,1990 and 2010 (deaths per 1,000 live births)200174
Many regions have reduced theunder-five mortality rate by at least50percent between 1990 and 2010
Decline in under-five mortality rate, by Millennium Development Goal region,1990–2010 (percent)75676357121
150117
55
5097828842
52
100757771
44
35
5331
66
67
63
52
54
50
45
48
57
25323227231815
Sub-Saharan Africa
South-eastern Asia
Western Asia
Northern Africa
Southern Asia
Oceania
Caucasus andCentral Asia
Latin America andthe Caribbean
Eastern Asia
Developed regions
Developing regions
World
0
7
Northern Africa
South-eastern Asia
Western Asia
Sub-Saharan Africa
Eastern Asia
Latin America andthe Caribbean
Southern Asia
Caucasus andCentral Asia
Developing regions
1990
2010
FiGuRE
3
in 2010, 7.6 million children diedbefore their fifth birthday
FiGuRE
4
The global burden of under-five deaths isincreasingly concentrated in Sub-Saharan Africa
Number of under-five deaths, by Millennium Development Goal region,2010 (thousands)Developed regions99Western Asia165Latin America and theCaribbean249Eastern Asia331South-easternAsia349
Northern Africa95Caucasus and Central Asia78Oceania14
Share of under-five deaths, by Millennium Development Goal region,1990–2010 (percent)Developed regionsNorthern AfricaWestern AsiaCaucasus and Central AsiaOceania100Latin America and the CaribbeanEastern Asia80South-eastern Asia
60Southern AsiaSub-SaharanAfrica3,709SouthernAsia2,52620Sub-Saharan Africa
40
0
1990
1995
2000
2005
Developed regions
Oceania
World2010
0
30
35
7
MAP
1
Children in Southern Asia and Sub-Saharan Africa face ahigher risk of dying before their fifth birthday
Under-five mortality rate (deaths per 1,000 live births)Less than 4040–99100–149150 or moreData not available
Note: Data for Sudan refer to the country as it was constituted in 2010, before South Sudan seceded on 9 July 2011.
FiGuRE
5
Of the 66 countries with high under-fivemortality, 14 have seen reductions of atleast 50 percent between 1990 and 2010
FiGuRE
6
Half of under-five deaths occurin just five countries
Number of under-five deaths, by country, 2010 (thousands)
Decline in under-five mortality rate, 1990–2010 (percent)75676665
58
57
India1,696555554
63
61
60
59
50
Othercountries2,958Nigeria861
25Dem. Rep. ofthe Congo465Pakistan423China315Ethiopia271
51
51
Uganda141Sudana143Timor-LesteBangladeshBhutanCambodiaEritreaBoliviaLiberiaUnited Republicof TanzaniaLao People’sDemocratic RepublicMadagascarAzerbaijanNepalMalawiNiger0Indonesia151Afghanistan191
a. Data refer to Sudan as it was constituted in 2010, before South Sudanseceded on 9 July 2011.
8
As under-five mortality rates have fallen moresharply in richer developing regions, the dispar-ity between Sub-Saharan Africa and other regionshas grown. In 1990 a child born in Sub-SaharanAfrica faced a probability of dying before age 5that was 1.5 times higher than in Southern Asia,3.2 times higher than in Latin America and theCaribbean, 3.6 times higher than in Eastern Asiaand 11.6 times higher than in developed regions.By 2010 that probability was 1.8 times higher thanin Southern Asia, 5.3 times higher than in LatinAmerica and the Caribbean, 6.7 times higherthan in Eastern Asia and 17.3 times higher thanin developed regions. The disparity betweenSouthern Asia and richer regions has also grown,though not as much.Of the 66 countries with at least 40 deaths per1,000 live births in 2010, only 11 are on track toachieve MDG 4 (map 2). But substantial advanceshave been made, particularly in Sub-SaharanAfrica. Six of the fourteen best-performing coun-tries are in Sub-Saharan Africa (see figure 5),as are four of the five countries with the largestabsolute reductions in under-five mortality.Thus, there is increasing evidence that MDG 4 canbe achieved, but only if countries in Sub-SaharanMAP
Africa and Southern Asia give high priority toreducing child mortality, particularly by targetingthe major killers of children (including pneumo-nia, diarrhoea, malaria and undernutrition) witheffective preventative and curative interventions.Neonatal mortality
Neonatal mortality, covering deaths in the firstmonth after birth, is of interest because thehealth interventions needed to address the majorcauses of neonatal deaths generally differ fromthose needed to address other under-five deaths.Neonatal mortality is increasingly importantbecause the proportion of under-five deaths thatoccur during the neonatal period is increasing asunder-five mortality declines.Over the last two decades almost all regions haveseen slower declines in neonatal mortality thanin under-five mortality. Globally, neonatal mor-tality has declined 28 percent from 32 deaths per1,000 live births in 1990 to 23 in 2010—an aver-age of 1.7 percent a year, much slower than forunder-five mortality (2.2 percent per year) andfor maternal mortality (2.3 percent per year).The fastest reduction was in Northern Africa(55 percent), followed by Eastern Asia and LatinAmerica and the Caribbean (52 percent); the
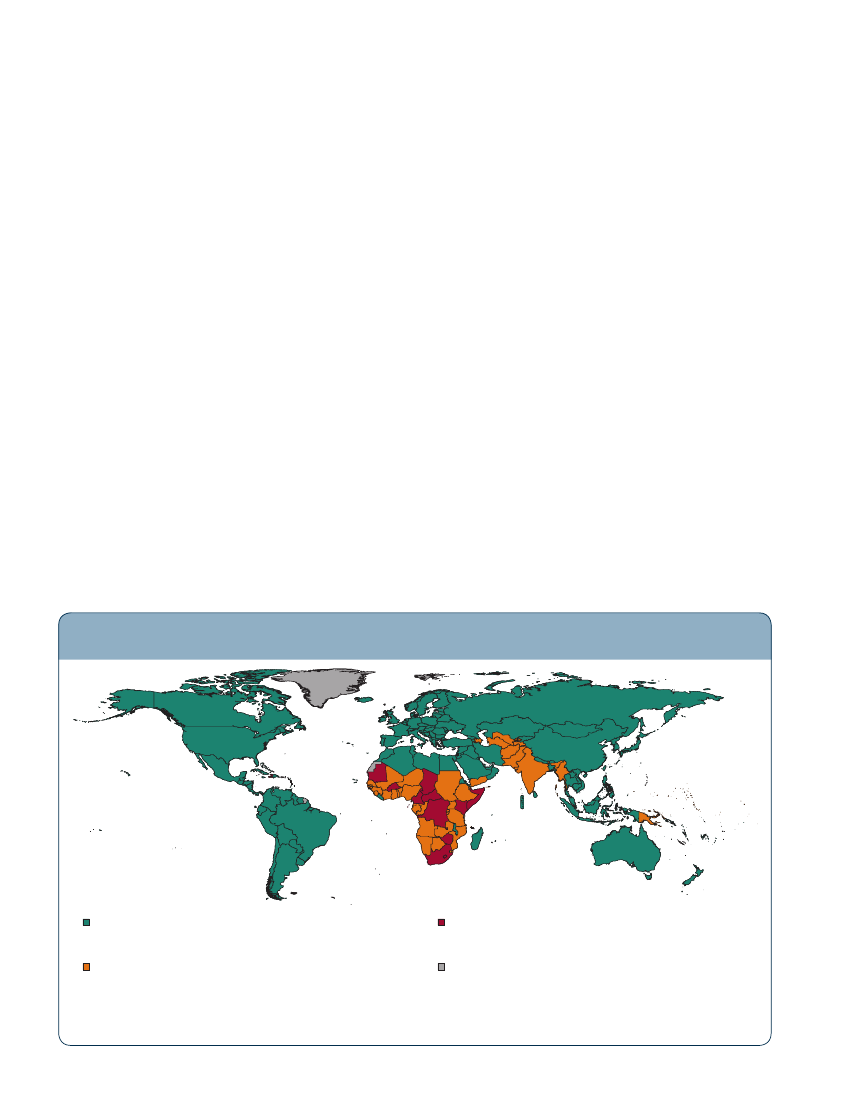
2
Many countries were on track in 2010 to achieve Millennium Development Goal 4, but progressneeds to accelerate in several regions, particularly in Southern Asia and Sub-Saharan Africa
On track: under-five mortality is less than 40 deaths per 1,000 livebirths in 2010 or the average annual rate of reduction of under-five mortalityis at least 4 percent over 1990–2010.Insufficient progress: under-five mortality is at least 40 deaths per1,000 live births in 2010 and the average annual rate of reduction is at least1 percent but less than 4 percent over 1990–2010.
No progress: under-five mortality is at least 40 deaths per1,000 live births in 2010 and the average annual rate of reduction isless than 1 percent over 1990–2010.Data not available.
Note: These standards may differ from those in other publications by Inter-agency Group for Child Mortality Estimation members. Data for Sudanrefer to the country as it was constituted in 2010, before South Sudan seceded on 9 July 2011.
9
slowest reduction was in Oceania and Sub-Saha-ran Africa (19 percent; table 3).Over the same period the share of neonataldeaths among under-five deaths has increasedfrom about 37 percent to slightly above 40percent worldwide and is expected to furtherincrease as under-five mortality declines. Whilethe relative increase is modest (9 percent) atthe global level, there are differences acrossregions. The largest increases have been inNorthern Africa (37 percent) and Eastern Asia(27 percent), the smallest in Oceania (7 per-cent; see table 3). In Eastern Asia, which hadone of the largest declines in under-five mortal-ity, neonatal deaths accounted for 57 percent ofunder-five deaths in 2010. Eastern Asia, North-ern Africa and other richer developing regionswill have to pay more attention to health inter-ventions that address neonatal mortality inorder to continue their success in reducingunder-five mortality.Southern Asia also needs to address neonatalmortality: neonatal deaths account for 50 per-cent of under-five deaths, and almost 30 percentof global neonatal deaths occurred in India.Sub-Saharan Africa, which accounts for morethan a third of global neonatal deaths, has thehighest neonatal mortality rate (35 deaths perTAblE
1,000 live births in 2010) and has shown theleast progress in reducing that rate over the lasttwo decades.With the proportion of under-five deaths duringthe neonatal period increasing in every regionand almost all countries, systematic action isrequired by governments and partners to reachwomen and babies with effective care. Highlycost-effective interventions are feasible even atthe community level, and most can be linkedwith preventive and curative interventions formothers and for babies. For example, early post-natal home visits are effective in promotinghealthy behaviours such as breastfeeding andclean cord care as well as in reaching new moth-ers. Case management of neonatal infectionscan be provided alongside treatment of child-hood pneumonia, diarrhoea and malaria. Careat birth brings a triple return on investment,preventing stillbirths and saving mothers andnewborns.
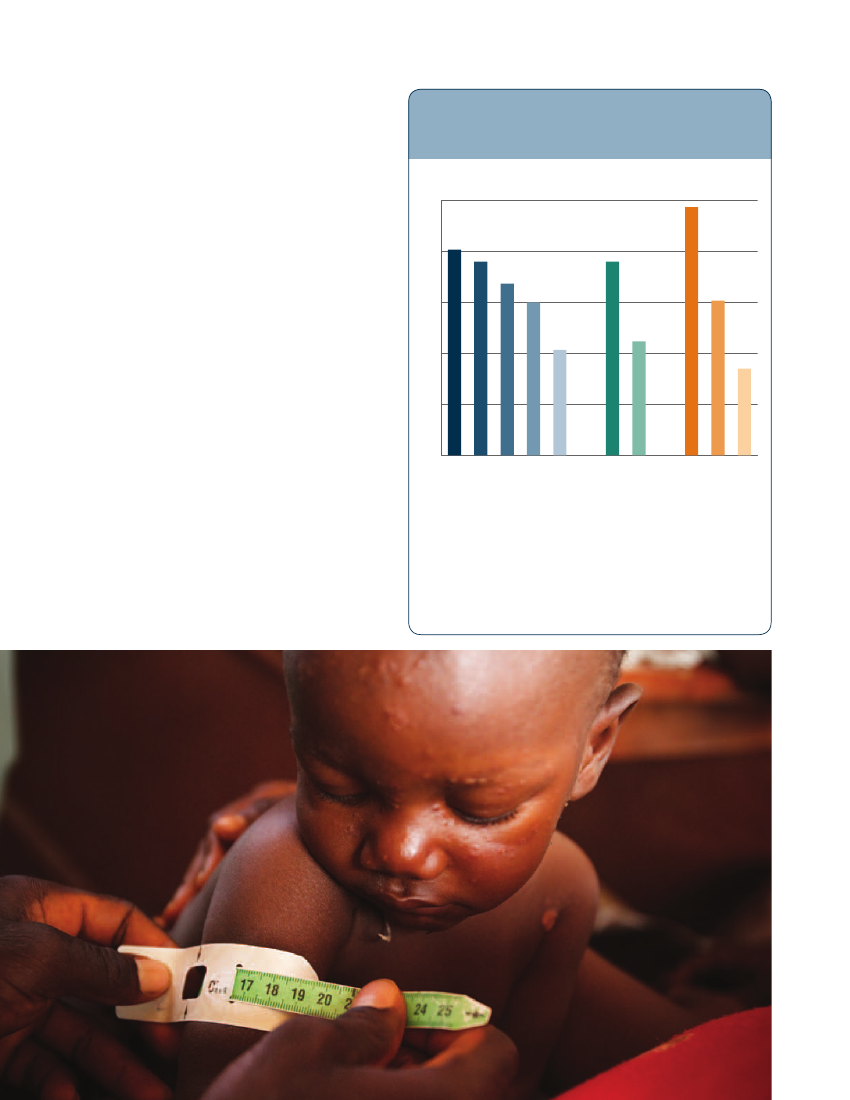
Disparity in child mortalityDespite substantial progress in reducing under-five deaths, children from rural and poorerhouseholds remain disproportionately affected.Analyses based on data from household surveysfor a subset of countries indicate that childrenin rural areas are about 1.7 times as likely to die
3
neonatal mortality rate, number of neonatal deaths and neonatal deaths as a share ofunder-fivedeaths, by Millennium Development Goal region, 1990 and 2010Neonatal mortality rate(deaths per 1,000 live births)Decline(percent)1990–2010Number of neonatal deaths Neonatal deaths as a share of under-five deaths(thousands)(percent)Relativeincrease(percent)1990–2010
Region
1990
2010
1990
2010
1990
2010
Developed regionsDeveloping regionsNorthern AfricaSub-Saharan AfricaLatin America and the CaribbeanCaucasus and Central AsiaEastern AsiaExcluding ChinaSouthern AsiaExcluding IndiaSouth-eastern AsiaWestern AsiaOceaniaWorld
736294323302312484828282632
42513351121119323315162123
4331551952305225333146431928
1064,31910796926558589141,87557633511654,425
533,019461,1231173418981,2563811697953,072
4737352642374547414039433737
5340493047445748504648484040
1510371711182712015231279
10
before their fifth birthday as those in urban areasand that children from the poorest 20 percent ofhouseholds are nearly twice as likely to die beforetheir fifth birthday as children in the richest 20percent of households (figure 7).Similarly, mother’s education remains a pow-erful determinant of inequity. Children ofeducated mothers—even mothers with onlyprimary education—are more likely to survivethan children of mothers with no education(see figure 7).Accelerating the decline in under-five mor-tality is possible by expanding interventionsthat target the main causes of deaths and themost vulnerable newborn babies and children.Empowering women, removing financial andsocial barriers to accessing basic services, devel-oping innovations that make the supply of criti-cal services more available to the poor andincreasing local accountability of health systemsare examples of policy interventions that haveallowed health systems to improve equity andreduce mortality. An equity-focused approachcould bring vastly improved returns on invest-ment by averting far more child deaths andepisodes of undernutrition and by markedlyexpanding effective coverage of key primaryhealth and nutrition interventions.
FiGuRE
7
Children who live in poorer householdsand rural areas and whose mothers have lesseducation are at higher risk of dying before age 5
Under-five mortality rate, by wealth quintile, residence and mother’seducation, 2000–2010 (deaths per 1,000 live births)15014612111410111490626791
120
90
30
Poorest
Second
Fourth
Richest
Middle
Urban
Rural
Primary
Wealth
Residence
Mother’s education
Note: Calculation is based on 39 countries with most recentDemographic and Health Surveys conducted after 2005, with furtheranalyses by UNICEF for under-five mortality rates by wealth quintile, 45countries for rates by residence and 40 countries for rates by mother’seducation. The average was calculated based on under-five mortality ratesweighted by number of births. Country-specific estimates obtained fromDemographic and Health Surveys refer to a 10-year period prior to thesurvey. Because levels or trends may have changed since then, cautionshould be used in interpreting these results.
Secondaryor higher
None
0
51
60
11
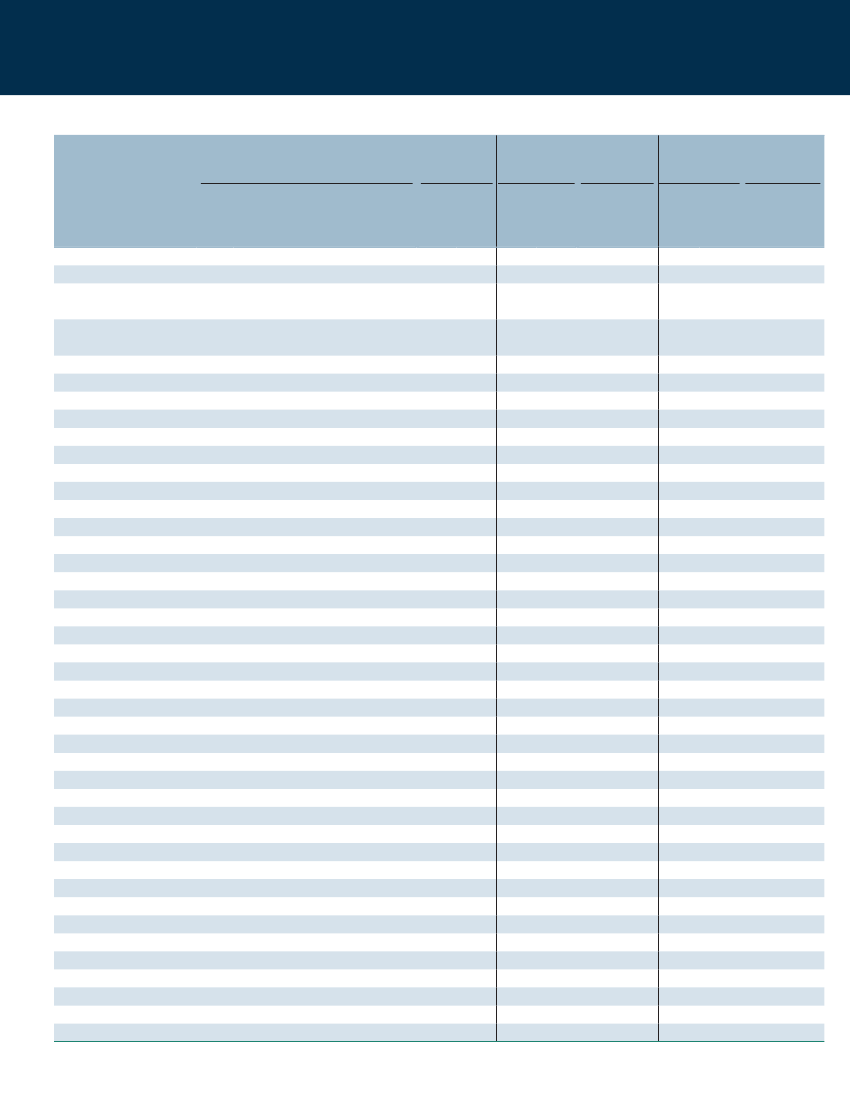
StatiStical table
country, regional and global estimates ofunder-five, infant and neonatal mortalityNumber ofunder-fivedeaths(thousands)Infantmortality rate(deaths per1,000 live births)Number ofinfantdeaths(thousands)Neonatalmortality rate(deaths per 1,000live births)Number ofneonataldeaths(thousands)
Under-fivemortality rate(deaths per 1,000 live births)MillenniumDevelopment Average annualGoalrate of reductiontargetfor(percent)201020151990–20101491836416181420544616104820641711556548481971317614251136636159173918198693910123667014233819918333176486631559464062020476861404632055696161242397650441.74.13.24.12.15.93.35.12.94.13.51.62.75.5–0.55.24.64.82.24.54.04.31.05.72.72.60.81.34.30.01.42.50.20.93.74.93.31.91.14.02.71.03.93.9
Country or territoryAfghanistanAlbaniaAlgeriaAndorraAngolaAntigua and BarbudaArgentinaArmeniaAustraliaAustriaAzerbaijanBahamasBahrainBangladeshBarbadosBelarusBelgiumBelizeBeninBhutanBolivia (Plurinational State of)Bosnia and HerzegovinaBotswanaBrazilBrunei DarussalamBulgariaBurkina FasoBurundiCambodiaCameroonCanadaCape VerdeCentral African RepublicChadChileChinaColombiaComorosCongoCook IslandsCosta RicaCôte d'IvoireCroatiaCuba
1990209416892432627559993221714318171044178139121195959122220518312113785916520719483712511620171511313
19901283530123020421190052703103732813210038545386631195561,27933210017613
20101911260121010110900140011039114025501120381693202380231518213018001
1990140365571442324468874181599161493510796841746509181031108785746110113163830887417151051111
2010103163139871218443914938174414734442836176119388438452910699816176361898655
199087343074018421150036302102322012174024327244231133051,0252717015312
2010133122072091108001090000251100248016424145820164622721528015600
199053172935113152654319655974184045391222287114149383442143459242040339104687
201045918141471132197427103283226235191247384222344144241511123229564133
19904012302801121060020801109191110201181216172051335761913012401
20106201303305110400830000110601360027127241072011811114002700
12
StatiStical table(ContInuED)
country, regional and global estimates ofunder-five, infant and neonatal mortalityNumber ofunder-fivedeaths(thousands)Infantmortality rate(deaths per1,000 live births)Number ofinfantdeaths(thousands)Neonatalmortality rate(deaths per 1,000live births)Number ofneonataldeaths(thousands)
Under-fivemortality rate(deaths per 1,000 live births)MillenniumDevelopment Average annualGoalrate of reductiontargetfor(percent)201020151990–20104433170491122720221612161510617347498224744113213015030165—2462633526394542445156034162117312163477611023315516341472676702250—196238282215343135.16.31.60.34.11.51.74.24.87.36.82.34.27.22.82.84.24.11.12.63.84.12.55.93.24.52.81.73.9–0.4—4.45.85.53.04.44.60.84.14.44.62.3
Country or territoryCyprusCzech RepublicDemocratic People'sRepublic of KoreaDemocratic Republicof the CongoDenmarkDjiboutiDominicaDominican RepublicEcuadorEgyptEl SalvadorEquatorial GuineaEritreaEstoniaEthiopiaFijiFinlandFranceGabonGambiaGeorgiaGermanyGhanaGreeceGrenadaGuatemalaGuineaGuinea-BissauGuyanaHaitiHoly SeeHondurasHungaryIcelandIndiaIndonesiaIran (Islamic Republic of)IraqIrelandIsraelItalyJamaica
1990111445181912317625294621901412118430799316547912213217822921066151—581961158565469121038
1990021631213013151741031813981063747681026589138—11303,078403122300152
201000124650206641231102710033613571014488045—5101,69615134430121
199010122311779514484168481188717111256768784077711175613512550104—4517581565037810831
20103326112373112218191481424681523545720350392581922570—20524827223134320
19900272060201012126821202450052346431019355126—8202,18526192240152
2010009306020553522801710032412380011315019—4101,30511529350121
199059224844011292028184531134812433142274389102851483438—231234731282356613
201022184623481510963518335822263115228251538401927—1241321714202229
199001989010665031401120031223221010142110—4201,29914951160131
2010006132010331811309200212122200715207—2008757318230010
13
StatiStical table(ContInuED)
country, regional and global estimates ofunder-five, infant and neonatal mortalityNumber ofunder-fivedeaths(thousands)Infantmortality rate(deaths per1,000 live births)Number ofinfantdeaths(thousands)Neonatalmortality rate(deaths per 1,000live births)Number ofneonataldeaths(thousands)
Under-fivemortality rate(deaths per 1,000 live births)MillenniumDevelopment Average annualGoalrate of reductiontargetfor(percent)201020151990–20103223385491138541022851031727362926151786261111517424328361356640405046271431432232131933295244871330761536353746348541741816193366297337241347342310471533.52.72.70.82.91.63.24.93.72.70.24.04.98.04.44.94.74.45.59.61.83.03.40.62.45.31.44.16.04.14.42.42.63.00.05.23.53.04.63.92.0–2.35.5
Country or territoryJapanJordanKazakhstanKenyaKiribatiKuwaitKyrgyzstanLao People's DemocraticRepublicLatviaLebanonLesothoLiberiaLibyan Arab JamahiriyaLiechtensteinLithuaniaLuxembourgMadagascarMalawiMalaysiaMaldivesMaliMaltaMarshall IslandsMauritaniaMauritiusMexicoMicronesia (FederatedStates of)MonacoMongoliaMontenegroMoroccoMozambiqueMyanmarNamibiaNauruNepalNetherlandsNew ZealandNicaraguaNigerNigeriaNiueNorway
19906385799871572145213889227451017815922218102255115112424495691071886219112734014181168311213149
1990852397011024135215010789291102001011150080611231204099211012487200
201034131220158025152000445630120001303700202311456203510410086100
199053248646413591001631721513391479713115741311040802138447761667146794932977952132126127
201021829553910334281965741325243585149952275131434326730925029324145237388193
19905419630181712414301050558152006191006046818530691175351600
2010331180015601411200031363068009031002020774320291035253700
1990320263129930391218365322—10440449375771942161722527113651442522545425484974
201011317281961921512353410—3122273948412399718212519393217222833123240102
1990331030004701252—1020195024003041002026314710401042121100
201012643002301251—0016182034005016001012352610201022425400
14
StatiStical table(ContInuED)
country, regional and global estimates ofunder-five, infant and neonatal mortalityNumber ofunder-fivedeaths(thousands)Infantmortality rate(deaths per1,000 live births)Number ofinfantdeaths(thousands)Neonatalmortality rate(deaths per 1,000live births)Number ofneonataldeaths(thousands)
Under-fivemortality rate(deaths per 1,000 live births)MillenniumDevelopment Average annualGoalrate of reductiontargetfor(percent)201020151990–201022987192061251929648519141291816212028018757141743832718057517103317835166313151641111130172620657312129549899431154610692363156020411421732231339113.68.31.82.82.51.93.57.13.65.26.64.82.43.34.94.12.96.31.81.31.59.00.84.63.17.11.02.34.94.16.02.60.00.33.93.21.02.61.04.22.44.33.14.5
Country or territoryOccupied Palestinian TerritoryOmanPakistanPalauPanamaPapua New GuineaParaguayPeruPhilippinesPolandPortugalQatarRepublic of KoreaRepublic of MoldovaRomaniaRussian FederationRwandaSaint Kitts and NevisSaint LuciaSamoaSan MarinoSao Tome and PrincipeSaudi ArabiaSenegalSerbiaSeychellesSierra LeoneSingaporeSlovakiaSloveniaSolomon IslandsSomaliaSouth AfricaSpainSri LankaSudanaSurinameSwazilandSwedenSwitzerlandSyrian Arab RepublicTajikistanThailand
199045471243333905078591715218373727163282327129445139291727681810451806011321255296783811632
19904355102127501209204315605200000025424045010152644111260411172535
2010314230112411663003132038000000123410390000705826143030081211
1990363696272665405542151117630292299221821231161367025141626159361084792678447067319126
2010208701517472115235374161195971419172531550612114272231084141466275524145211
1990334310295368581043124832000000192130260100335049800310142029
2010303470110395220021316250000001023102600004241259202007109
1990—22511414302427231171031515124117131610528204016957412518521861839212434183717
2010—54199231491442429862951013812510274845142125218310351421239258
1990—22300143184661021525120000001213201001001520364301008818
2010—01940152632100102101300000061300100000211914500100457
Saint Vincent and the Grenadines27
15
StatiStical table(ContInuED)
country, regional and global estimates ofunder-five, infant and neonatal mortalityNumber ofunder-fivedeaths(thousands)Infantmortality rate(deaths per1,000 live births)Number ofinfantdeaths(thousands)Neonatalmortality rate(deaths per 1,000live births)Number ofneonataldeaths(thousands)
Under-fivemortality rate(deaths per 1,000 live births)MillenniumDevelopment Average annualGoalrate of reductiontargetfor(percent)201020151990–201012551031627161856339913757681152141823771118013564981216273319587735248261311174361265.95.61.82.21.65.67.52.82.72.82.45.72.93.61.63.72.05.13.04.02.52.5–0.1
Country or territoryThe former YugoslavRepublic of MacedoniaTimor-LesteTogoTongaTrinidad and TobagoTunisiaTurkeyTurkmenistanTuvaluUgandaUkraineUnited Arab EmiratesUnited KingdomUnited Republic of TanzaniaUnited StatesUruguayUzbekistanVanuatuVenezuela (BolivarianRepublic of)Viet NamYemenZambiaZimbabwe
1990391691472537498098571752122915511237739335112818378
19901422011110713014315171664415601999756029
2010021901324601417141333213101134696029
199034127872132396678441061818895920633128379010952
2010104666132414144727631165507944121619576951
19901313019871108813161033714601670523619
2010021200319509261490280270928523819
19901748401123233333223691254061130161723434027
20108243281891023142664326462371012323027
199012601547403161445221220945271410
201001600213203930248180130618291810
Estimates of under-five, infant and neonatal mortality by Millennium Development Goal regionb,cDeveloped regionsDeveloping regionsNorthern AfricaSub-Saharan AfricaLatin America & CaribbeanCaucasus & Central AsiaEastern AsiaExcluding ChinaSouthern AsiaExcluding IndiaSouth-eastern AsiaWestern AsiaOceaniaWorld15978217454774828117123716775887632712123451817667232325257532275818261693941242225293.82.25.61.84.32.74.92.52.92.74.03.71.82.222711,7823043,7346231551,308294,5211,4438532701412,010997,515953,70924978331172,526830349165147,614126762105436338178490495255616442376183916145156252541401868,2022272,2734911271,042173,2391,053582211118,389835,346812,35019167285141,958653271131115,429736294323302312484828282632425133511211193233151621231064,31910796926558589141,87557633511654,425533,019461,1231173418981,2563811697953,072
16
StatiStical table(ContInuED)
country, regional and global estimates ofunder-five, infant and neonatal mortalityEstimates of under-five, infant and neonatal mortality by uniCEF regioncUnder-fivemortality rate(deaths per 1,000 live births)MillenniumAverageDevelopment annual rate ofGoalreductiontargetfor(percent)20151990–20105358526526294018181.81.82.31.63.22.92.94.14.3Number ofunder-fivedeaths(thousands)Infantmortality rate(deaths per1,000 livebirths)Number ofinfantdeaths(thousands)Neonatalmortality rateNumber of(deaths per 1,000 neonatal deathslive births)(thousands)
RegionAfricaSub-Saharan AfricaEastern and Southern AfricaWest and Central AfricaMiddle East and North AfricaAsiaSouth AsiaEast Asia and PacificLatin America and CaribbeanCentral and EasternEurope/Commonwealth ofIndependent StatesIndustrialized countriesDeveloping countriesLeast developed countriesWorld
199016017415619677861205554
2010111121981434148672423
19904,0383,7341,5592,0467186,5754,3992,175623
20103,8043,7091,3222,2414153,1862,492694249
199099105971155662864143
2010717663883137521918
19902,5002,2739821,2085264,7813,1471,634491
20102,4312,3508581,3983162,4961,929567191
1990414339472937492523
2010333530391824331311
19901,0769694115142712,7541,824930265
20101,1691,1234256471801,6021,239363117
50109717088
2366311057
173325729
3.92.62.22.22.2
37111811,7843,49712,010
136657,5162,9497,614
4196710661
195447140
303978,2042,2008,389
114555,3461,9125,429
215364732
113253423
149614,3201,0244,425
65363,0199563,072
Estimates of under-five, infant and neonatal mortality by World Health Organization regioncUnder-fivemortality rate(deaths per 1,000 live births)MillenniumAverageDevelopment annual rate ofGoalreductiontargetfor(percent)20151990–2010571433113716291.84.21.94.33.44.62.2Number ofunder-fivedeaths(thousands)Infantmortality rate(deaths per1,000 livebirths)Number ofinfantdeaths(thousands)Neonatalmortality rateNumber of(deaths per 1,000 neonatal deathslive births)(thousands)
RegionAfricaAmericasEastern MediterraneanEuropeSouth-East AsiaWestern PacificWorld
199017242100331114888
2010119186814561957
19903,6066701,3924314,2991,60712,010
20103,5202841,0701612,1104677,614
1990104347427783761
201075145112441640
19902,2005301,0313533,0131,2578,389
20102,2362218141351,6273935,429
199042183814452232
2010349287291123
19909332895331811,7807094,425
20101,064137444791,0962523,072
17
StatiStical table(ContInuED)
country, regional and global estimates ofunder-five, infant and neonatal mortalityEstimates of under-five, infant and neonatal mortality by World bank regioncUnder-fivemortality rate(deaths per 1,000 live births)MillenniumAverageDevelopment annual rate ofGoalreductiontargetfor(percent)20151990–201055283816321916182540584292.12.42.54.52.24.23.84.34.02.91.83.52.2Number ofunder-fivedeaths(thousands)Infantmortality rate(deaths per1,000 livebirths)Number ofinfantdeaths(thousands)Neonatalmortality rateNumber of(deaths per 1,000 neonatal deathslive births)(thousands)
RegionLow incomeMiddle incomeLower middle incomeUpper middle incomeLow and middle incomeEast Asia & PacificEurope & Central AsiaLatin America & CaribbeanMiddle East & North AfricaSouth AsiaSub-Saharan AfricaHigh incomeWorld
1990164831134996564954741201741288
2010107516920622423233367121657
19903,1948,6566,3272,33011,8502,1713736225574,3993,72815512,010
20102,6674,8604,1636987,5276911362492552,4923,704857,614
19901035978396742414356861051061
20107038501644201918275276540
19902,0156,2444,3791,8658,2591,6303044904183,1472,2691278,389
20101,7313,6233,0365885,3555651141912101,9292,346725,429
19904633412335252123294943632
20103323291125131111163335423
19909443,4022,3741,0284,3469271492642141,824967794,425
20108662,1611,7873743,027362651171231,2391,121453,072
Estimates of under-five, infant and neonatal mortality by united nations Population Division regionCUnder-fivemortality rate(deaths per 1,000 live births)MillenniumAverageDevelopment annual rate ofGoalreductiontargetfor(percent)20151990–2010532572737585328618412293.82.22.22.62.31.81.83.04.74.32.31.72.2Number ofunder-fivedeaths(thousands)Infantmortality rate(deaths per1,000 livebirths)Number ofinfantdeaths(thousands)Neonatalmortality rateNumber of(deaths per 1,000 neonatal deathslive births)(thousands)
RegionMore developed regionsLess developed regionsLeast developed countriesExcluding least developedcountriesExcluding ChinaSub-Saharan AfricaAfricaAsiaEuropeLatin America & CaribbeanNorthern AmericaOceaniaWorld
1990159717082110174160831854113588
201076311049701211114672372557
199022611,7843,4968,28710,5043,7344,0387,116168623471712,010
2010997,5162,9494,5677,2013,7093,8043,4535924935167,614
1990126710659751059960154392661
201064471374976713661861940
19901858,2042,1996,0057,1792,2732,5005,20713849139138,389
2010835,3461,9123,4355,0752,3502,4312,7164919130125,429
199073647333943413582361332
201042534222735332341141023
19901054,3201,0243,2963,7449691,0762,977762652474,425
2010533,0199562,0632,8381,1231,1691,729311172063,072
— not available.Note: The data on population used to calculate the number of under-five and infant deaths and the data on live births used to calculate neonatal deaths are fromWorld Population Prospects: The 2010 Revision,published by the United Nations Department of Economic and Social Affairs.aData refer to Sudan as it was constituted in 2010, before South Sudan seceded on 9 July 2011.bSee next page for country classifications by region.cThe sum of the number of deaths by region may differ from the world total because of rounding.
18
RegionalClassificationsThe regional classifications that are referred to in the report and for which aggregate data are provided inthe statistical table are Millennium Development Goal regions (see below). Aggregates presented for memberorganizations of the Inter-agency Group for Child Mortality Estimation may differ. Regions with the same namesin different agencies may include different countries.
Developed regionsAlbania, Andorra, Australia, Austria, Belarus, Bel-gium, Bosnia and Herzegovina, Bulgaria, Canada,Croatia, Cyprus, Czech Republic, Denmark, Estonia,Finland, France, Germany, Greece, Hungary, Iceland,Ireland, Israel, Italy, Japan, Latvia, Liechtenstein,Lithuania, Luxembourg, Malta, Monaco, Montenegro,Netherlands, New Zealand, Norway, Poland, Portugal,Republic of Moldova, Romania, Russian Federation,San Marino, Serbia, Slovakia, Slovenia, Spain, Sweden,Switzerland, The former Yugoslav Republic of Mace-donia, Ukraine, United Kingdom, United States
Oceania
Cook Islands, Fiji, Kiribati, Marshall Islands,Micronesia (Federated States of), Nauru, Niue, Palau,Papua New Guinea, Samoa, Solomon Islands, Tonga,Tuvalu, VanuatuSouth-eastern Asia
Brunei Darussalam, Cambodia, Indonesia, LaoPeople’s Democratic Republic, Malaysia, Myanmar,Philippines, Singapore, Thailand, Timor-Leste,VietNamSouthern Asia
Developing regionsCaucasus and Central Asia
Armenia, Azerbaijan, Georgia, Kazakhstan, Kyrgyz-stan, Tajikistan, Turkmenistan, UzbekistanEastern Asia
Afghanistan, Bangladesh, Bhutan, India, Iran(Islamic Republic of), Maldives, Nepal, Pakistan,SriLankaSub-Saharan Africa
China, Democratic People’s Republic of Korea,Mongolia, Republic of Korealatin America and the Caribbean
Antigua and Barbuda, Argentina, Bahamas, Barba-dos, Belize, Bolivia (Plurinational State of), Brazil,Chile, Colombia, Costa Rica, Cuba, Dominica, Domin-ican Republic, Ecuador, El Salvador, Grenada, Gua-temala, Guyana, Haiti, Honduras, Jamaica, Mexico,Nicaragua, Panama, Paraguay, Peru, Saint Kitts andNevis, Saint Lucia, Saint Vincent and the Grenadines,Suriname, Trinidad and Tobago, Uruguay, Venezuela(Bolivarian Republic of)northern Africa
Angola, Benin, Botswana, Burkina Faso, Burundi,Cameroon, Cape Verde, Central African Republic,Chad, Comoros, Congo, Côte d’Ivoire, DemocraticRepublic of the Congo, Djibouti, EquatorialGuinea, Eritrea, Ethiopia, Gabon, Gambia, Ghana,Guinea, Guinea-Bissau, Kenya, Lesotho, Liberia,Madagascar, Malawi, Mali, Mauritania, Mauritius,Mozambique, Namibia, Niger, Nigeria, Rwanda,Sao Tome and Principe, Senegal, Seychelles, SierraLeone, Somalia, South Africa, Sudan*, Swaziland,Togo, Uganda, United Republic of Tanzania,Zambia, ZimbabweWestern Asia
Algeria, Egypt, Libyan Arab Jamahiriya, Morocco,Tunisia
Bahrain, Iraq, Jordan, Kuwait, Lebanon, OccupiedPalestinian Territory, Oman, Qatar, Saudi Arabia,Syrian Arab Republic, Turkey, United Arab Emirates,Yemen
* Data refer to Sudan as it was constituted in 2010, before South Sudan seceded on 9 July 2011.
19
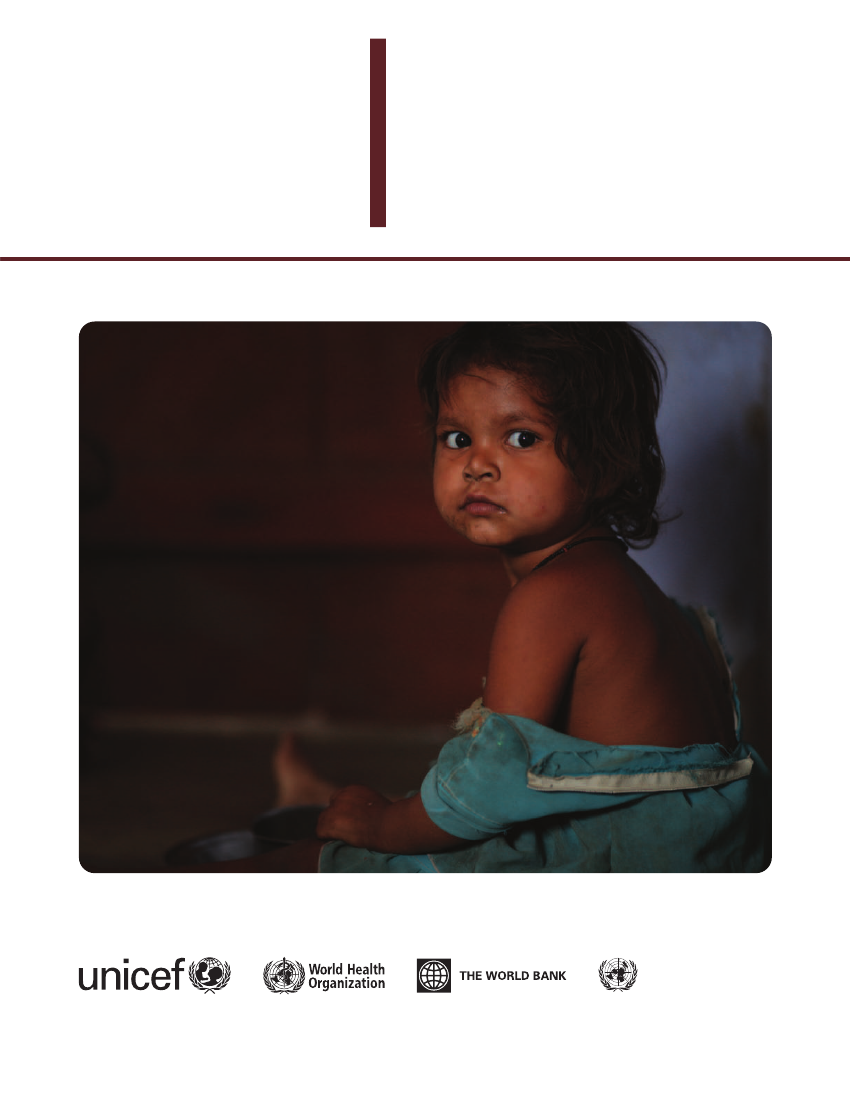
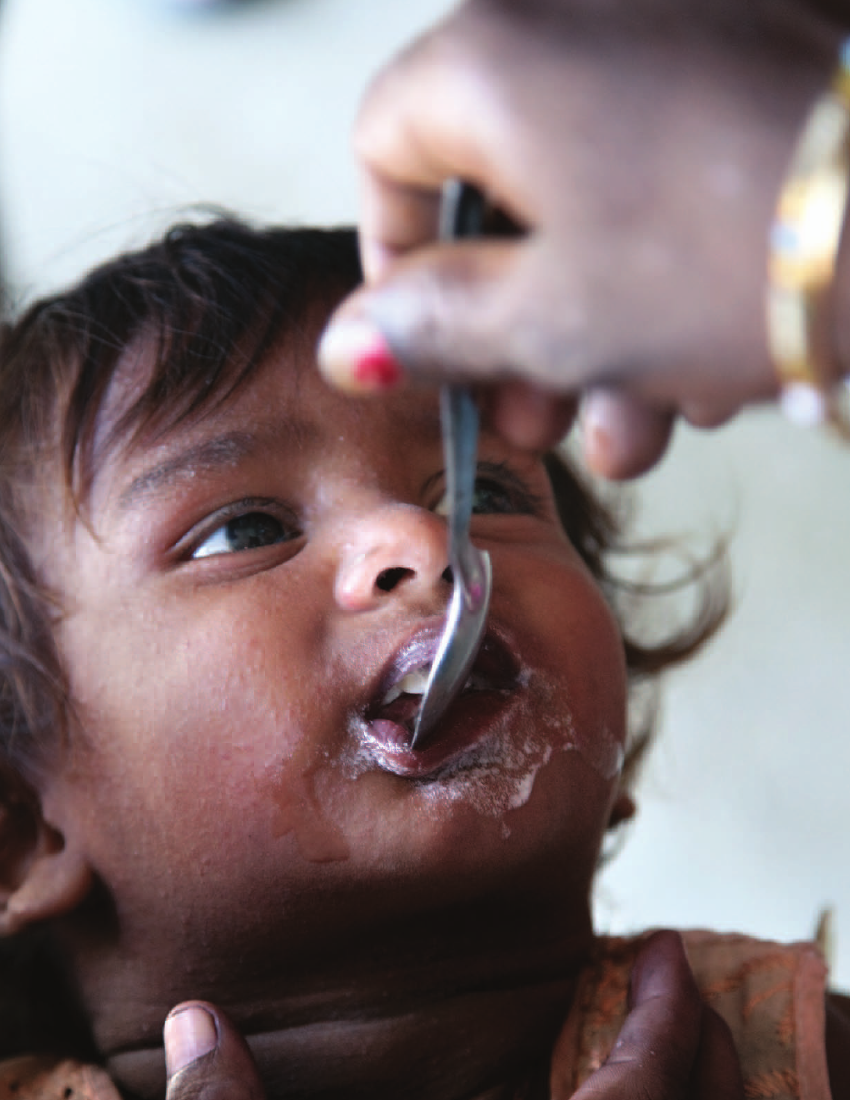
On the cover photo: A malnourished child waits for a meal of rice and dal at an anganwadi centre in SullineabadVillage, Bihar State, India. Anganwadis are part of the national Integrated Child Development Services programme,which provides basic health education, nutrition and related services at the village level for children and womenin impoverished areas. Some 29 percent of children in the village suffer from severe acute malnutrition.Photo credits: cover, � UNICEF/NYHQ2009‑0908/Brian Sokol; page 2, � UNICEF/NYHQ2011‑1115/KateHolt;page 4, � UNICEF/INDA2011‑00039/Graham Crouch; page 20, � UNICEF/INDA2010‑00212/Graham Crouch.
United NationsDESA/Population Division
The UN Inter-agency Group for Child Mortality EstimationThe Inter-agency Group for Child Mortality Estimation (IGME) was formed
in 2004 to share data on child mortality, harmonize estimates within
the UN system, improve methods for child mortality estimation, report
on progress towards the Millennium Development Goals and enhance
country capacity to produce timely and properly assessed estimates of
child mortality. The IGME, led by the United Nations Children’s Fund and
the World Health Organization, also includes the World Bank and the
United Nations Population Division of the Department of Economic and
Social Affairs as full members.
The IGME’s independent Technical Advisory Group, comprising eminent
scholars and independent experts in demography, provides technical
guidance on estimation methods, technical issues and strategies for data
analysis and data quality assessment.
The IGME updates its child mortality estimates annually after reviewing
newly available data and assessing data quality. This report contains
the latest IGME estimates of child mortality at the country, regional and
global levels. Country-specific estimates and the data used to derive them
are available at www.childmortality.org.
