Udenrigsudvalget 2011-12
URU Alm.del Bilag 209
Offentligt
Inclusive Green GrowthThe Pathway to Sustainable Development
Overviewwww.worldbank.org/inclusivegreengrowthSee the full report at
This booklet contains an Overview for the forthcoming book,Inclusive Green Growth: The Pathwayto Sustainable Development.See the full report at www.worldbank.org/inclusivegreengrowth.To order copies of the full-length book, published by the World Bank, please use the form at theback of this booklet.
� 2012 International Bank for Reconstruction and Development / International Development Association orThe World Bank1818 H Street NWWashington DC 20433Telephone: 202-473-1000Internet: www.worldbank.orgThis volume is a product of the staff of The World Bank with external contributions. The findings, interpre-tations, and conclusions expressed in this volume do not necessarily reflect the views of The World Bank, itsBoard of Executive Directors, or the governments they represent.The World Bank does not guarantee the accuracy of the data included in this work. The boundaries,colors, denominations, and other information shown on any map in this work do not imply any judgmenton the part of The World Bank concerning the legal status of any territory or the endorsement or acceptanceof such boundaries.Rights and PermissionsThe material in this work is subject to copyright. Because The World Bank encourages dissemination of itsknowledge, this work may be reproduced, in whole or in part, for noncommercial purposes as long as fullattribution to the work is given.For permission to reproduce any part of this work for commercial purposes, please send a request withcomplete information to the Copyright Clearance Center Inc., 222 Rosewood Drive, Danvers, MA 01923,USA; telephone: 978-750-8400; fax: 978-750-4470; Internet: www.copyright.com.All other queries on rights and licenses, including subsidiary rights, should be addressed to the Officeof the Publisher, The World Bank, 1818 H Street NW, Washington, DC 20433, USA; fax: 202-522-2422;e-mail: [email protected].
Contents
Foreword . . . . . . . . . . . . . . . . . . . . . . . . . . . . . . . . . . . . . . . . . . . . . . . . . . . . . . . . . . . . . . . vAcknowledgments . . . . . . . . . . . . . . . . . . . . . . . . . . . . . . . . . . . . . . . . . . . . . . . . . . . . . . . viiAbbreviations . . . . . . . . . . . . . . . . . . . . . . . . . . . . . . . . . . . . . . . . . . . . . . . . . . . . . . . . . . . ix
Greening growth is necessary, efficient, and affordable . . . . . . . . . . . . . . . . . . . . . . . . .4But obstacles are plentiful, and green growth is no substitute for good, inclusivegrowth policies . . . . . . . . . . . . . . . . . . . . . . . . . . . . . . . . . . . . . . . . . . . . . . . . . . . . . .12The way forward: Good and inclusive growth policies tailored to real-worldchallenges . . . . . . . . . . . . . . . . . . . . . . . . . . . . . . . . . . . . . . . . . . . . . . . . . . . . . . . . . . . .15Conclusions . . . . . . . . . . . . . . . . . . . . . . . . . . . . . . . . . . . . . . . . . . . . . . . . . . . . . . . .23Notes . . . . . . . . . . . . . . . . . . . . . . . . . . . . . . . . . . . . . . . . . . . . . . . . . . . . . . . . . . . . .25References . . . . . . . . . . . . . . . . . . . . . . . . . . . . . . . . . . . . . . . . . . . . . . . . . . . . . . . . .25
iii
iv
Contents
BoxesO.1O.2O.3O.4O.5O.6What is the aggregate economic support to the (over)use of natural capital?US$1 trillion to US$1.2 trillion annually . . . . . . . . . . . . . . . . . . . . . . . . . . . . . . . . 9The many ways in which green policies can contribute to growth . . . . . . . . . . . . 11Why “grow dirty and clean up later” is misleading . . . . . . . . . . . . . . . . . . . . . . . 16Morocco: The importance of political economy . . . . . . . . . . . . . . . . . . . . . . . . . . 18“Green” cash transfers are helping poor communities in the Brazilian Amazon . . 24Joining forces: A common platform to move forward on greening oureconomies and growth processes . . . . . . . . . . . . . . . . . . . . . . . . . . . . . . . . . . . . . 24
FiguresO.1O.2O.3O.4O.5O.6O.7O.8The three pillars of sustainable development . . . . . . . . . . . . . . . . . . . . . . . . . . . . . 2As incomes increase . . . . . . . . . . . . . . . . . . . . . . . . . . . . . . . . . . . . . . . . . . . . . . . . 5As incomes increase . . . . . . . . . . . . . . . . . . . . . . . . . . . . . . . . . . . . . . . . . . . . . . . . 6The Loess plateau, before and after the watershed restoration program . . . . . . . . . 8Up-front investment costs for energy supply and energy efficiency could besubstantial. . . . . . . . . . . . . . . . . . . . . . . . . . . . . . . . . . . . . . . . . . . . . . . . . . . . . . . 10Reducing environmental degradation would provide substantialeconomic benefits . . . . . . . . . . . . . . . . . . . . . . . . . . . . . . . . . . . . . . . . . . . . . . . . . 12Developing countries may have substantial unexploited potential ingreen exports . . . . . . . . . . . . . . . . . . . . . . . . . . . . . . . . . . . . . . . . . . . . . . . . . . . . 14Fossil fuel subsidies benefit primarily the rich . . . . . . . . . . . . . . . . . . . . . . . . . . . . 15
TablesO.1O.2Some guiding principles for establishing green growth strategies . . . . . . . . . . . . . 17Financing mechanisms need to be tailored to the maturity of the localfinancial sector . . . . . . . . . . . . . . . . . . . . . . . . . . . . . . . . . . . . . . . . . . . . . . . . . . . 23
Foreword
Inclusive green growth isthepathway to sus-tainable development.Over the past 20 years economic growthhas lifted more than 660 million people outof poverty and has raised the income levelsof millions more, but growth has too oftencome at the expense of the environment. Avariety of market, policy, and institutionalfailures mean that the earth’s natural capitaltends to be used in ways that are economi-cally inefficient and wasteful, without suf-ficient reckoning of the true social costs ofresource depletion and without adequatereinvestment in other forms of wealth. Thesefailures threaten the long-term sustainabil-ity of growth and progress made on socialwelfare. Moreover, despite the gains fromgrowth, 1.3 billion people still do not haveaccess to electricity, 2.6 billion still have noaccess to sanitation, and 900 million lacksafe, clean drinking water. Growth has notbeen inclusive enough.This report argues that sustained growthis necessary to achieve the urgent develop-ment needs of the world’s poor and that thereis substantial scope for growing cleaner with-out growing slower. Green growth is neces-sary, efficient, and affordable. It is the onlyway to reconcile the rapid growth requiredto bring developing countries to the level
of prosperity to which they aspire with theneeds of the more than 1 billion people stillliving in poverty and the imperative of a bet-ter managed environment.Indeed, green growth is a vital tool forachieving sustainable development. But sus-tainable development has three pillars: eco-nomic, environmental, and social sustainabil-ity. We cannot presume that green growth isinherently inclusive. Green growth policiesmust be carefully designed to maximize ben-efits for, and minimize costs to, the poor andmost vulnerable, and policies and actionswith irreversible negative impacts must beavoided.Green growth also requires improved indi-cators to monitor economic performance.National accounting indicators like GDPmeasure only short-term economic growth,whereas indicators like comprehensivewealth—including natural capital—help usdetermine if growth is sustainable in the longrun.The Conference on Environment andDevelopment, held in Rio in 1992, focusedon inclusion and the environment but failedto mention growth. In the lead up to Rio+20,we are reminded that, in 1987, Gro HarlemBrundtland, then Prime Minister of Norway,framed the call for governments to changev
vi
foreword
their approach to growth:“What is needednow is a new era of economic growth—growth that is forceful and at the same timesocially and environmentally sustainable .”Rachel KyteVice PresidentSustainable Development NetworkThe World Bank
Today, more than ever, we must payattention to the triple bottom line. Inclusivegrowth must be green. Green growth must beinclusive.
Acknowledgments
his report was written by a team ledby Marianne Fay and Stéphane Halle-gatte and composed of Marjorie-AnneBromhead, Alex Bowen, Michael Chaitkin,Mark Dutz, Atsushi Iimi, Urvashi Narain,and David Tréguer. Significant contributionswere made by Antonio Estache, Adrian Foz-zard, Kirk Hamilton, Tim Kelly, MasamiKojima, Andreas Kopp, Somik Lall, EduardoLey, Marcelino Madrigal, Diego Rodriguez,Siddharth Sharma, and Adrien Vogt-Schilb.Geoffrey Heal acted as adviser to thereport, in addition to being a key contributorto developing the analytical framework.This report benefited from extensive dis-cussions with Milan Brahmbhatt. We grate-fully acknowledge the comments and adviceprovided by our peer reviewers: Rosina Bier-baum, Richard Damania, Uwe Deichmann,Vivien Foster, Jean-Charles Hourcade, MikeToman, David Popp, Thomas Sterner, JeffVincent, and Zhang Yongsheng. Other use-ful inputs and suggestions were provided byZoubida Allaoua, Edward Andersen, JockAnderson, Ruben Bibas, Dan Biller, JamesBrumby, Christophe Crepin, JacquelineDevine, Casper Edmonds, Louis-Gaëtan
T
Giraudet, Céline Guivarch, Bernard Hoek-man, Guy Hutton, Vijay Jagannathan, NalinKishor, Franck Lecocq, Robert Lempert,Robin Mearns, Aurélie Méjean, Christo-pher Neal, Junko Narimatsu, Elisa Portale,Valentin Przyluski, Riika Rajalhati, ApurvaSanghi, Randeep Sudan, Nancy Vandycke,Xiodong Wang, and Monika Weber-Fahr.Finally, the report drew on backgroundpapers produced for the inaugural conferenceof the Green Growth Knowledge Plat-form (available at http://www.greengrowthknowledge.org) by Brian Copeland; StefanDercon; Jaime de Melo; Tony Gomez-Ibañez;Winston Harrington, Richard Morgenstern,and Daniel Velez-Lopez; Larry Karp andMegan Stevenson; Howard Kunreuther andErwann Michel-Kerjan; David Popp; GuidoPorto; Andreas Schäfer; Sjak Smulders andCees Withagen; Jeff Vincent; and Elke Weberand Eric Johnson.The report was edited by Barbara Karniand Laura Wallace.This report was sponsored by the Sustain-able Development Network of the WorldBank under the leadership of Inger Andersenand Rachel Kyte.
vii
Abbreviations
CO2CO2-eqCOMTRADEDHESCOEUGDPGGKPIFIOECDPESPM10ppmPPPR&DR$REDDSMEUNEPUS$
carbon dioxidecarbon dioxide equivalentCommodity Trade Statistics databasedirham (Morocco)energy service companyEuropean Uniongross domestic productGreen Growth Knowledge Platforminternational financial institutionOrganisation for Economic Co-operation and Developmentpayments for environmental servicesparticulate matter up to 10 micrometers in sizeparts per millionpurchasing power parityresearch and developmentreal (Brazil)Reducing Emissions from Deforestation and Forest Degradationsmall and medium enterpriseUnited Nations Environment Programmedollar (United States)
ix
Overview
Key Messages• reening growth is necessary, effi-Gcient, and affordable.It is critical toachieving sustainable developmentand mostly amounts to good growthpolicies.• bstacles to greening growth are polit-Oical and behavioral inertia and a lack of financing instruments—notthe costof green policies as commonly thought.• reen growth should focus on what Gneeds to be done in the next five to 10 yearsto avoid getting locked intounsustainable paths and to generateimmediate, local benefits.• he way forward requires a blend of T economics, political science, and social psychology—smartsolutions to tacklepolitical economy constraints, over-come deeply entrenched behaviors andsocial norms, and develop the neededfinancing tools.• here is no single green growth model. TGreen growth strategies will varyacross countries, reflecting local con-texts and preferences—but all coun-tries, rich and poor, have opportuni-ties to make their growth greener andmore inclusive without slowing it.
ur current growth patterns are notjust unsustainable; they are alsodeeply inefficient. As a result, theystand in the way of sustainable developmentand its objectives of social, environmental,and economic sustainability (figure O.1). Thepast 20 years have shown that the economic
O
and social goals are not only highly compat-ible, but also largely complementary. Growthdrives poverty reduction (though the extentto which it does so depends on the degree ofinequality). And improved social outcomes,such as better health and education andgreater equality of opportunity, are good1
2
i n c lu s i v e G r e e n G r o w t h: t h e Pat h way to s u s ta i n a b l e D e v e lo Pm e n t
Figure O.1
The three pillars of sustainable development
Economicsustainability
damage. As such, efforts to foster greengrowth must focus on what is required inthe next five to 10 years to sustain robustgrowth, while avoiding locking economiesinto unsustainable patterns, preventing irre-versible environmental damage, and reducingthe potential for regret.Moreover, rapid action is needed to keepthe costs of greening growth manageable andavoid irreversible losses. This urgency appliesto developing and developed countries alike:• Developing countries—which will accountfor the vast majority of global growth inincome, infrastructure, and populationin the coming decades—need to choosewhether to build right or risk facing costlypolicy reversals in the future.• High-income countries—which, with 16percent of world population, still accountfor more than 75 percent of global con-sumption and 41 percent of global emis-sions of carbon dioxide (CO2)—must actaccording to their responsibility. Mostimportant are changes in the patterns ofconsumption and production that boostdemand for green technologies. This isessential to stimulate technological innova-tion and the scale of production necessaryfor prices to drop and green technologiesto become competitive. Thus, Germany’saggressive solar feed-in tariff was criti-cal in boosting global demand for solarpanels, thereby reducing their cost.As tohowto make growth greener, text-books going back at least to the 1950s offerthe basic instruments, with environmentaltaxation, norms, and regulations being themain tools of a green growth strategy. Today,technology is making it easier to implementthese measures and monitor their impacts.However, making these measures workis complex in real-world settings plaguedby governance failures, market failures,and entrenched interests and behaviors. Itrequires complementary policies, includingpublic investments, innovation and indus-trial policies, education and training, labormarket reforms, and communication. Mak-ing matters worse is the urgency with which
Sustainabledevelopment
Socialsustainability
Environmentalsustainability
Note:Economic and social sustainability, on the one hand, and social and environmental sustain-ability, on the other, have been found to be not only compatible, but also largely complementary.Not so with economic and environmental sustainability, as growth has come largely at the expenseof the environment—hence, the dotted line on this figure—which is why green growth aims toensure that economic and environmental sustainability are compatible.
for growth. Not so with the economic andenvironmental pillars: for the past 250 years,growth has come largely at the expense of theenvironment. And environmental damagesare reaching a scale at which they are begin-ning to threaten both growth prospects andthe progress achieved in social indicators.What can be done to turn this situationaround? We argue that what is needed isgreen growth—that is, growth that is effi-cient in its use of natural resources, clean inthat it minimizes pollution and environmen-tal impacts, and resilient in that it accountsfor natural hazards and the role of environ-mental management and natural capitalin preventing physical disasters. And thisgrowth needs to be inclusive.Inclusive green growth is not a new para-digm. Rather, it aims to operationalize sus-tainable development by reconciling develop-ing countries’ urgent need for rapid growthand poverty alleviation with the need toavoid irreversible and costly environmental
overview
3
these policies must be designed and imple-mented, especially in the face of enormousuncertainty about the future climate andtechnology.Although we have much theoretical andempirical knowledge to draw on, greengrowth raises challenging questions, espe-cially when it comes to the developing world.For example, how can developing countriesavoid locking in unsustainable and inefficientsocioeconomic systems? Will technologyallow developing countries to pursue a lessenvironmentally damaging development paththan industrial countries did? What is thebest way to manage growth with scarce fiscalresources and limited planning and technicalknow-how? Is green growth just an aspira-tional goal—desirable from an environmen-tal and ethical point of view, but unattain-able given competing economic needs?At heart, these are questions of economics,which is why the report takes an economicapproach—using the standard tools of main-stream growth and environmental econom-ics—with some forays into what social psy-chology can tell us about the determinantsof human behavior. Chapter 1 examineswhether green growth is, in fact, feasible andthe implications for welfare—the ultimategoal of economic policy. It argues that ourcurrent system is inefficient, thereby offeringopportunities for cleaner (and not necessarilyslower) growth. And it identifies the flaws inthe “grow now, clean up later” argument.The next two chapters tackle the cross-cutting issues of market and governance fail-ures. Chapter 2 looks at the range of toolsthat can be marshaled to change behaviorwith respect to environmental and naturalresources—tools that aim to improve socialwelfare through greener growth. Theseinclude effective market signals, properlyframed and judiciously used information,and rules and regulations. Chapter 3 exploresthe need to navigate between market andgovernance failures through the careful useof innovation and industrial policies, such asresearch and development (R&D) subsidiesfor drought-resistant crops, national strate-gies for electric cars, and efforts to create
new green industries (such as China’s promo-tion of solar photovoltaic production).The subsequent three chapters focus onhuman, natural, and physical capital andtheir roles in a greener production function.Chapter 4 tackles the debate on whethergreen growth will create jobs, with politicalleaders keen to promote the idea of green jobsto reduce high unemployment levels. It findsthat, while there is surely potential to creategreen jobs, the net impact is what matters,and that will depend largely on the natureof the policy chosen and the soundness oflabor markets and the business environment.Importantly, evidence on past regulation sug-gests that fears about massive job losses aremisplaced.Chapter 5 reviews what we know aboutmanaging natural capital. Depending on thetype of resource (such as extractable or cul-tivated renewable), the tools include definingproperty rights, helping firms to move up thevalue chain, managing trade-offs betweenhigher growth and greener outcomes, andincorporating the economic values of servicesin policy decisions.Chapter 6 explores why infrastructure isat the core of inclusive green growth poli-cies, underscoring the high potential for bothregret (given the tremendous inertia builtinto infrastructure investments) and benefits(given the need for massive increases in infra-structure services in developing countries).Chapter 7 filters the key lessons through apolitical economy lens and provides a frame-work for building an inclusive green growthstrategy—in light of the technical tools avail-able, the need to maximize local and immedi-ate benefits while minimizing lock-in, and theuncertainties about the future climate andtechnologies.What are the overall messages of thereport?First, inclusive green growth is neces-sary, efficient, and affordable.It is neces-sary because sustainable development cannotbe achieved without it. It is efficient in thataddressing the market and governance fail-ures that plague our economic systems willcreate plenty of scope for growing cleaner
4
i n c lu s i v e G r e e n G r o w t h: t h e Pat h way to s u s ta i n a b l e D e v e lo Pm e n t
without necessarily growing slower. The bestexample is the US$1 trillion to US$1.2 tril-lion currently being spent on environmentallyharmful subsidies for fossil fuel, agriculture,water, and fisheries. Green growth is afford-able because many green policies pay forthemselves directly, and the others make eco-nomic sense once externalities are priced andecosystem services are valued.Second,greening growth is constrained by social and political inertia and by a lack of financing instruments—not affordability, as is commonly believed.Entrenched behavior,special interests, and the complicated politi-cal economy of reform explain why measuresthat amount to good growth policies havenot yet been implemented. Also, many greengrowth measures require increased up-frontcapital. Yet the debate on financing remainsfocused on who pays what, rather thanon how to finance economically (let alonesocially) profitable investments.Third,greening growth should be care-fully sequenced— not occur in one fell swoop—with priority going to what needs to be done in the next 5 to 10 years, both to avoid getting locked into unsustainable paths and to offer immediate, local benefits.Those benefits will help to reduce the costof the transition and facilitate the politicaleconomy of reform. Urban forms that arecreated today will affect city structures andhousing and transport options for decadesor even centuries. With urban populationsin developing countries set to increase by 1.5billion over the next 20 years, there is a win-dow of opportunity to affect urban patternsat low cost.Fourth,the search for solutions needs to shift from a search for more financial resources (difficult anyway amid today’s fis-cal woes) to “getting smart”:• Smart about learning the lessons of com-plex reforms to tackle difficult politicaleconomy questions, given that many greenpolicies trade immediate costs for later ben-efits or redistribute benefits from one groupto another. Notable successes include tradereforms across the world, reform of fish-
eries in Namibia, reform of the CommonAgricultural Policy in the European Union(EU), and progress on fossil fuel subsidiesin the Islamic Republic of Iran, where carewas taken to manage the losers and publi-cize the benefits.• Smart about changing the behavior of con-sumers and firms and the view of societiesabout what constitutes social success andacceptable behavior. This entails combin-ing economic incentives with well-framedinformation and the marketing techniquesthat public health specialists (or car sales-men) commonly use.• Smart about developing the appropriatefinancing tools for the private sector, espe-cially small firms, for local governments(China’s cities are developing in a sprawl-ing fashion in part because land sales attheir peripheries are an important source ofrevenue for city governments; World Bankand DRC 2012), and for national govern-ments, which are sometimes so fiscallyconstrained that they have to choose theinvestment with the lowest up-front cost(such as a thermal power plant) over onethat may be less expensive in the mediumterm (such as a hydroelectric plant in acountry with abundant water resources).Fifth,there is no single green growth model.Inclusive green growth strategieswill vary across countries, reflecting localcontexts, preferences, and resources, but allcountries—rich and poor—have opportuni-ties to green their growth without slowing it.
greening growth is necessary,efficient, and affordableNecessary: Making developmentsustainable requires inclusive greengrowthGrowth— even measured with such animperfect metric as gross domestic prod-uct (GDP)—is now recognized as a criti-cal driver of poverty reduction (figure O.2,panel a; Ferreira and Ravallion 2009). It hasresulted in an 80 percent increase in GDP
overview
5
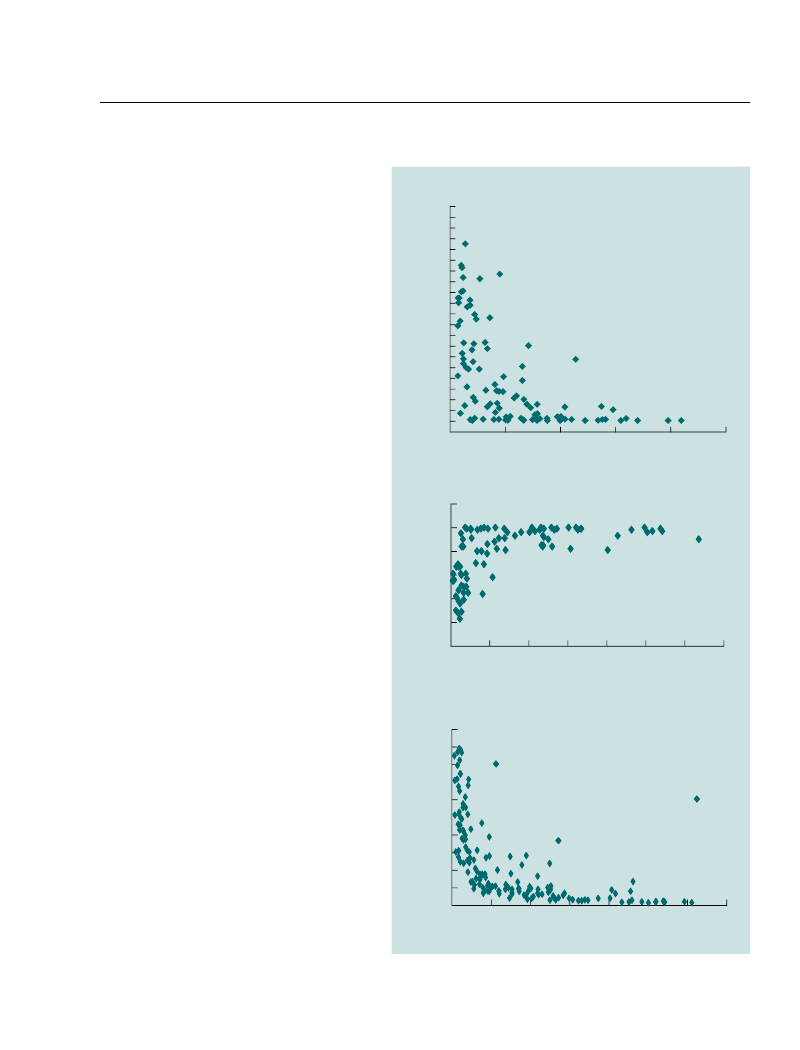
per capita in developing countries over thepast 20 years, despite substantial increases inpopulation. Living standards have improvedfor many (figure O.2, panels b and c), withmore than 660 million rising out of povertyand remarkable progress being made in lit-eracy, education, life expectancy, malnutri-tion, and infant, child, and maternal mortal-ity. And while China drove much of globalpoverty reduction, other countries that expe-rienced growth also saw poverty decline rap-idly. Ghana, for example, grew much fasterthan the African average and managed toreduce its poverty rate from 51 to 30 percentbetween 1990 and 2005 (World Bank 2011c).Moreover, growth need not cause incomeinequality. The famous Kuznets curve argu-ment, which posits that inequality firstincreases and then decreases with income, isnot supported by the evidence. Inequality hasincreased substantially in recent decades inChina, but also in the United States and mostof Europe. And it has declined in much ofLatin America (Milanovic 2010). Some coun-tries reduce inequality as they grow; otherslet it increase. Policies matter.Thus, the links between the economic andsocial pillars of sustainable development aregenerally self-reinforcing. But the story isnot so simple when it comes to the economicand environmental pillars. Economic growthcauses environmental degradation—or hasfor much of the past 250 years—driven bymarket failures and inefficient policies. Aswith inequality, overall environmental per-formance does not first get worse and thenimprove with income—no Kuznets curvehere either. Of course, some local and vis-ible environmental public goods do worsen atfirst and eventually improve with income—typically local air quality. But this is not trueof local pollutants with invisible or long-termimpacts (such as the accumulation of pesti-cides and toxic chemicals in land and water)or global pollutants (such as greenhousegases in the atmosphere). These often getworse with higher income (figure O.3).Against this backdrop, some observers,mostly in high-income countries, have arguedagainst the need for more growth, suggesting
Figure O.2
As incomes increase . . .
a. . . . Poverty recedes (poverty headcount and GDP per capita)10095908580757065605550454035302520151050–5
% of the population living onUS$1 a day or less
0
5,000
10,000
15,000
20,000
25,000
GDP per capita (US$, PPP)b. . . . Literacy rises (female literacy rate and GDP per capita, 2009)female literacy rate(% of females ages 15 and above)12010080604020005,00010,000 15,000 20,000 25,000 30,000 35,000GDP per capita (2005 US$, PPP)c. . . . Child mortality falls (mortality rate for children under veand GDP per capita, 2010)200mortality rate (deaths of childrenunder 5 per 1,000 live births)18016014012010080604020005,00010,00015,00020,00025,00030,00035,000
GDP per capita (2005 US$, PPP)Source:For panel a, Ferreira and Ravallion 2009; for panels b and c, World Bank 2011c.
6
i n c lu s i v e G r e e n G r o w t h: t h e Pat h way to s u s ta i n a b l e D e v e lo Pm e n t
Figure O.3
As incomes increase . . .
a. . . . Local and visible pollutants tend to decline (PM10 concentrationand income per capita, 2008)180country-level PM10 concentration(micrograms per cubic meter)16014012010080604020005,000 10,000 15,000 20,000 25,000 30,000 35,000 40,000GDP per capita (2005 US$, PPP)b. . . . Global pollutants, such as CO2emissions, tend to increase(CO2emissions and income per capita, 2008)40CO2emissions(metric tons per capita)3530252015105005,000 10,000 15,000 20,000 25,000 30,000 35,000 40,000GDP per capita (2005 US$, PPP)Source:For both panels, World Bank 2011c.
that what is needed instead is a redistribu-tion of wealth (Marglin 2010; Victor 2008).They point to the happiness literature, whichsuggests that above a country average ofUS$10,000 to US$15,000 per capita, furthergrowth does not translate into greater well-being (Easterlin 1995; Layard 2005).While this argument has value, it remainsmore relevant for high-income countries,where average annual incomes hover aroundUS$36,000. Developing countries—withaverage income of around US$3,500 percapita—are still far from the point at whichmore wealth will bring decreasing returns to
well-being. In fact, in low-income countries,average income is only about US$500 (WorldBank 2011c).1A redistribution of worldincome across rich and poor countries—evenif it were politically feasible—would leave allwith an income of about US$8,000 per per-son per year.Further, even after the rapid growth of thepast decade, some 1.3 billion people do nothave access to electricity, 900 million do nothave access to clean water, 2.6 billion lackaccess to improved sanitation, and around800 million rural dwellers do not have accessto an all-weather road and are cut off fromthe world in the rainy season (Fay and others2010; IEA 2011). Even with the rapid declinein the share of people living in poverty, closeto 1 billion could still be living on US$1.25per day in 2015. With continued growth atabout the same speed as during the past 20years, developing countries would accountfor about half of the world’s income andconsumption (but close to 90 percent of theworld population) by 2050.Continued rapid population growth inseveral developing regions further compli-cates matters. Current projections are thatthe world will reach some 9 billion peopleby 2050. This implies that even more rapidgrowth is needed to tackle poverty, and moreaggressive social policies are needed to ensurethat children, especially girls, and mothersreceive the care, nutrition, schooling, andemployment opportunities they need. And, ofcourse, this demographic challenge puts fur-ther stresses on the environment, particularlybecause much of the rapid population growthis happening in environmentally fragile loca-tions, notably in Africa.Thus, growth is a necessary, legitimate,and appropriate pursuit for the developingworld, but so is a clean and safe environment.Without ambitious policies, growth will con-tinue to degrade the environment and depleteresources critical to the welfare of current andfuture generations. And what about the argu-ment that ambitious policies would be toocostly and destroy jobs? The evidence reviewedin this report suggests that there is plenty ofroom to green growth without slowing it.
overview
7
efficient: Current patterns of growthare not only unsustainable, but alsowastefulThere is mounting evidence that our patternsof growth and consumption are unsustain-able at the scale required by our current andprojected population. Much of this, however,is owing to inefficient production and con-sumption and poor management of naturalresources.UnsustainablePopulation and income growth and theresulting increase in demand for food havedriven the expansion of agricultural pro-duction around the world.2Intensificationand productivity increases have helped tolimit ecosystem loss in many countries, butpoorly managed intensification has also exac-erbated agrochemical and water pollution,soil exhaustion, and salinity. Extensive farm-ing, driven by large-scale expansion in someregions and poverty-level subsistence agricul-ture in others, has contributed to land degra-dation and deforestation; forest losses aver-aged 5.2 million hectares annually between2000 and 2010, mostly in tropical—and,hence, more intensely biologically diverse—regions (FAO 2010). By 2008 one quarter ofthe world’s land surface was degraded as aresult of soil erosion, salinization, nutrientdepletion, and desertification (Bai and others2008).Income and population growth have alsostretched water supplies. Water withdrawalshave tripled in the past 50 years, leading towater scarcity and groundwater depletion(World Bank 2007b). Withdrawals are pro-jected to increase in developing countries byanother 50 percent by 2025, by which timeroughly 5.5 billion people—two thirds ofthe projected global population—will live inareas facing moderate-to-severe water stress(UNESCO and WWAP 2006).Growth has similarly strained ecosystems,with roughly 60 percent of ecosystem ser-vices now of lower quality than 50 years ago(MEA 2005). Additionally, the current rateof species extinction, stemming mainly from
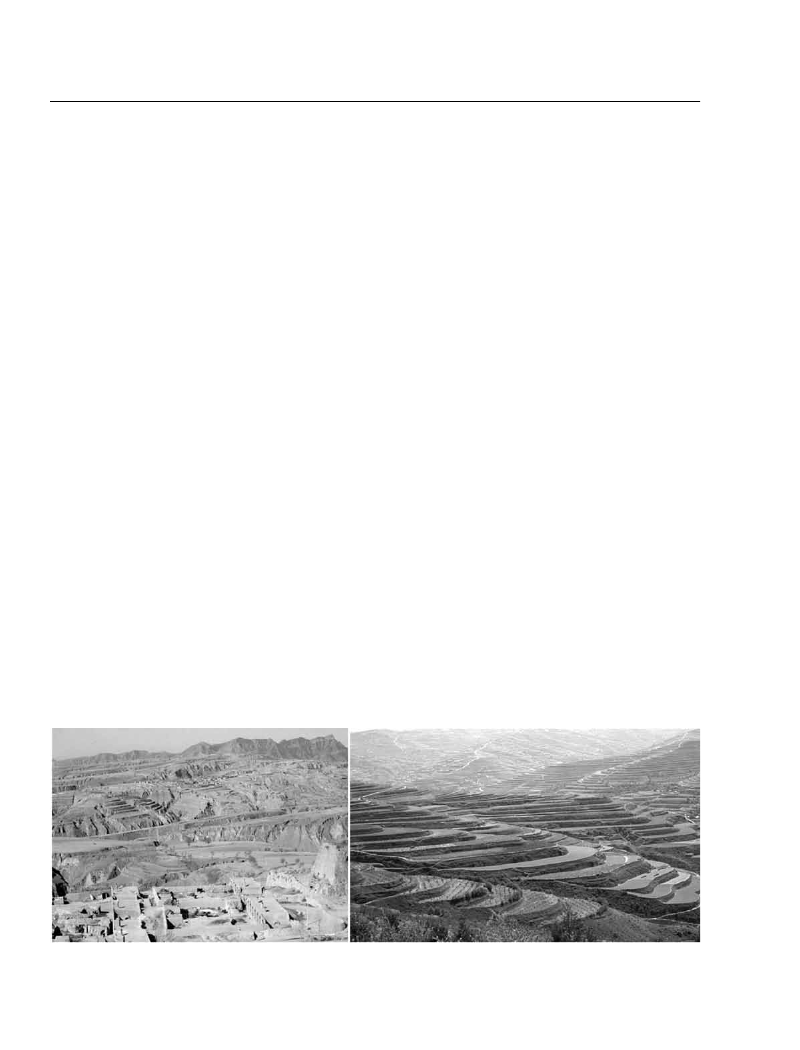
habitat loss and degradation, is 100 to 1,000times higher than before humans walked theplanet (Pimm and others 1995). In 2008,875 species became extinct, and more than17,000 others are at high risk (IUCN 2009).Carbon dioxide emissions are accumulat-ing in the atmosphere, approaching a level thatwill make it impossible to maintain globalmean temperature below 2�C in excess ofthe preindustrial level, even though the prob-ability of irreversible environmental changesis increasing with temperature (for example,rapid ice loss in Greenland and forest die-back in the Amazon). Carbon dioxide is alsoaffecting the world’s oceans. Because of globalwarming, we have already committed to highprobabilities of coral bleaching and mortal-ity by the late twenty-first century, which willsignificantly harm reef ecosystems (WorldBank 2010d). The concurrent acidification ofoceans, which absorb about one quarter ofthe excess carbon dioxide in the atmosphere,is threatening marine food webs and couldundermine the global fishing industry andfood security (Laffoley and Baxter 2009).Lastly, energy prices are likely to be highin the future, because oil resources that areeasy and cheap to extract and use have alreadybeen extracted, and the world is now turningtoward fossil fuels that are more expensive—and more damaging to the environment—suchas shale gas, tar sands, oil from deep offshorewells, or even liquefied coal. Without signifi-cant changes in energy policy, the amountof resources the world economy will have todedicate to fossil fuel extraction and energyproduction is likely to increase substantially,making higher energy efficiency even moredesirable in the future than it is today.WastefulThe environment can be thought of as natu-ral capital that is often inefficiently managed,with many precious resources wasted. Invest-ing in natural capital—just like investing inhuman or physical capital—is therefore goodgrowth policy. The value of the services pro-vided by well-managed ecosystems is illus-trated by the impact of reforestation andwatershed restoration programs. In China’s
8
i n c lu s i v e G r e e n G r o w t h: t h e Pat h way to s u s ta i n a b l e D e v e lo Pm e n t
Loess plateau, such programs were associatedwith a near doubling of household incomesas a result of higher-value agricultural pro-duction as well as reduced frequency of land-slides and flooding and increased resilience todrought (figure O.4; World Bank 2005b).This inefficiency stems partly from thefact that many natural resources are com-mon property, so consumption by one personprecludes consumption by another, and it ishard to exclude potential users. Open-accessregimes for common property create incen-tives to use up such resources as quickly aspossible. Open access fisheries are a classicexample in which catch per fisher and pervessel has been declining steadily because ofoverfishing, and continued depletion threat-ens the livelihood of more than 100 millionpeople and the food security of many more.Subsidies exacerbate common propertyproblems, yet substantial resources are allo-cated to environmentally harmful price sup-port schemes (box O.1). Global subsidies tofisheries are estimated at US$10 billion toUS$30 billion and are partly to blame forthe sixfold increase in the fleet capacity indexbetween 1970 and 2005 (World Bank andFAO 2009).3In Mexico, subsidies for energyused in irrigation, amounting to around 1percent of GDP, are exacerbating excessivegroundwater withdrawals and the depletion
of key aquifers. India suffers from the sameproblem in addition to spending some 2 per-cent of GDP on a fertilizer subsidy overlyweighted in favor of nitrogen; the resultinguse of fertilizer is causing serious pollutionproblems.Production and consumption processesare often wasteful, too. This is particularlyobvious in the energy sector. Existing energyefficiency technologies can cost-effectivelyreduce energy use in new buildings by at least30 percent. In fact, making new buildings inChina more energy efficient would reduceenergy costs by more than 50 percent, whileincreasing construction costs by only 10 per-cent. Waste also plagues food production.Some 15 to 30 percent of food produced indeveloping countries is lost before it reachesthe market due to poor storage and transportfacilities. In high-income countries, mean-while, one third of food is wasted throughlosses in supermarkets and homes and “plate-waste” (Foresight 2011).The possibility of solving market andgovernance failures opens the way to poli-cies that have both economic and environ-mental benefits and is at the heart of greengrowth strategies. (In that respect, greeninggrowth is first and foremost based on goodgrowth policies.) These market and gover-nance failures have long been understood,
Figure O.4The Loess plateau, before and after the watershed restoration program
Source:For the left-hand image, Till Niermann, March 25, 1987, http://en.wikipedia.org/wiki/File:Loess_landscape_china.jpg; for the right-hand image, http://digitalmedia.worldbank.org/slideshows/china1005/.
overview
9
BOx O.1What is the aggregate economic support to the (over)use of natural capital?uS$1 trillion to uS$1.2 trillion annuallyA compilation of estimates by international organi-zations of aggregate support for the use of naturalcapital suggests an approximate total of US$1 tril-lion to US$1.2 trillion, consistent with McKinsey’sestimate of US$1.1 trillion (McKinsey and Company2011). This support includes the following:• Fossil fuel subsidies: US$455 billion–US$485 bil-lion. Thisincludes subsidies to fossil fuel productionor use in Organisation for Economic Co-operationand Development (OECD) countries (US$45 billionto US$75 billion a year between 2005 and 2010)and consumption in developing economies (US$409billion in 2010; IEA 2011).• Water subsidies: US$200 billion–US$300 billion. This represents subsidies to groundwater extrac-tion or irrigation infrastructure—estimated as thedifference between the market value of water andthe part of costs covered by tariffs. Limited dataare available, but Myers and Kent (2001) estimatewater sector subsidies at US$230 billion in 2000and McKinsey (2011) cites estimates of US$200billion to US$300 billion.• Fishery subsidies: US$10 billion to US$30 billion. This encompasses a wide variety of instrumentssuch as fuel price supports, grants, concessionalcredit and insurance, and direct payments to indus-try. Estimates range from US$10 billion per year(World Bank and FAO 2009) to US$27 billion peryear (UNEP 2011).• Transfers to agriculture: US$370 billion. Thisrep-resents total support to the agriculture sector inOECD countries (OECD 2011a) and includes dif-ferent types of instruments, some environmentallyharmful, such as market price supports, but somenot, such as payments decoupled from productionlevels.While these estimates suffer from errors of inclu-sion (some of the OECD countries’ agricultural sub-sidies that were included are not environmentallyharmful) and exclusion (they do not include devel-oping countries’ subsidies to agriculture, estimatedby the OECD at about US$200 billion for the fewemerging economies for which data were available)and are therefore neither precise nor exhaustive,they do suggest that substantial resources go to envi-ronmentally harmful subsidies.
and their persistence suggests that the dif-ficulty of correcting them should not beunderestimated.
Affordable: Much of green growthpaysfor itself, and an innovativeprivatesector keeps costs in checkEnvironmental policies should, in principle,improve social welfare and economic effi-ciency by reducing excessive pollution andother environmental bads. Nevertheless, suchpolicies clearly have costs. They can hit tax-payers who have to pay the bill (for subsidiesto renewable energy or public spending ongreen R&D) or producers and consumers ifthe policies mandate the use of more expen-sive or less productive technologies (such asrenewable energy resources that are more
costly than fossil fuel). Environmental poli-cies alter relative prices and therefore changethe structure of demand, requiring costlyadjustments in the structure of production.Demand may decrease in sectors that havehigh capacity (coal production) and increasein sectors that have limited capacity (publictransport). As a result, efficiency may fall, atleast during an adjustment phase, jobs maybe lost, and the poor may suffer if compensa-tory measures are not adopted.Moreover, the up-front capital require-ments are high. The energy investmentsneeded globally to achieve greenhouse gasconcentration of 450 parts per million (ppm)carbon dioxide equivalent (CO2-eq; the levelneeded to maintain a 50 percent chance ofnot exceeding global warming of 2�C abovepreindustrial temperatures) could amount to
10
i n c lu s i v e G r e e n G r o w t h: t h e Pat h way to s u s ta i n a b l e D e v e lo Pm e n t
Figure O.5up-front investment costs for energy supply andenergy efficiency could be substantial(additional investment needed in the energy sector, both in energy supply anddemand, in 2030 to reach a 450 ppm and a 550 ppm CO2-eq objective, according tofour global models)1,200additional annual investmentin 2030 (US$ billions)1,0008006004002000550ppm450ppm550ppm450ppm550ppm450ppm450ppmIEA
MESSAGE
TIAM-WORLD
REMIND
Source:More information on these models can be found in the following sources: on MESSAGE, vanVliet and others 2012; on ReMIND, Luderer and others 2012; on TIAM-WORLD, Loulou and Labriet2008; on IEA, IEA 2011.Note:IEA (2011) does not provide estimates for a 550 ppm scenario.
between US$350 billion and US$1.1 trillionper year by 2030 (figure O.5). A 550 ppm tar-get appears much easier to achieve, requiringsome US$50 billion–US$300 billion of addi-tional investments per year, but an additionalUS$75 billion to US$100 billion would stillbe needed to adapt to climate change (WorldBank 2010d). Adding needed investmentsin water and land to energy, annual invest-ments of US$900 billion to US$1,700 billioncould be needed over and above business-as-usual requirements (McKinsey and Company2011).But many of these capital investments willbe recouped through subsequent savings, sothe net financial costs will be much lower. Forexample, the high capital cost of wind andsolar energy or hydropower is offset by theirlow operating costs. Globally US$1 spenton energy efficiency saves US$2 throughinvestments in new supply, with the savingseven greater in developing countries (WorldBank 2010d). As a result, the World Bankestimates that more than half the measuresneeded to decarbonize the energy systems ofdeveloping countries would eventually pay
for themselves, bringing the financial costsdown to between US$140 billion and US$175billion per year in 2030 or perhaps half a per-centage point of developing countries’ GDP(World Bank 2010d). In East Asia, the esti-mated additional net financing required fora sustainable energy path is US$80 billion,not much more than the US$70 billion theregion currently spends on fossil fuel subsi-dies (Wang and others 2010; IEA 2008).Furthermore, determining affordabilityis about more than a financial ledger. Greenpolicies can contribute to growth (box O.2)and boost a nation’s overall wealth. And theyhelp to reduce the damage done by environ-mental degradation, which is costly for aneconomy: equivalent to 8 percent of GDPacross a sample of countries representing 40percent of the developing world’s population(figure O.6). As a result, benefits may welloutweigh the costs (implying a negative neteconomic cost). US$900 billion to US$1,700billion of green investments in land, water,and energy could yield economic returnsof around US$3 trillion per year, rising toUS$3.7 trillion with carbon at US$30 per tonand no energy, agricultural, or water subsi-dies (McKinsey and Company 2011).Thanks to such benefits, the net costsof greening growth appear manageable,although affordability will, of course, dependon the speed and ambition of the greening (asillustrated by the difference between the 450ppm and 550 ppm targets) and on the designof policies. But the worse the environmentaldegradation and existing inefficiency, thegreater the potential benefits to be obtainedfrom green policies.At the firm level, the cost of environmentalregulation to firms is typically modest, withcosts lower than expected thanks to the abil-ity of firms to adapt and innovate (chapter 3).As a result, there is no evidence that environ-mental regulation systematically hurts prof-itability. While studies from the 1980s and1990s found negative impacts, more recentpapers find more positive results, partlybecause they allow a few years for firms toadapt and partly perhaps because we havebecome better at designing environmental
overview
11
BOx O.2
The many ways in which green policies can contribute to growthpromoting greater efficiency (Nidumolu and others2009).Third,green policies stimulate innovation.Studyafter study reports that well-designed environmen-tal regulations stimulate innovation by firms, asmeasured by R&D spending or patents (see chapter3). Surveys of firms in the European Union identifyexisting or future environmental regulation as themain driver for the adoption of incremental inno-vations. Similarly, international sustainability stan-dards can help local firms to upgrade their environ-mental practices, a form of catch-up innovation. Indeveloping countries, green policies can also encour-age the adaptation and adoption of greener technol-ogies that have been developed elsewhere.Finally,green policies also accrue non-growth gains to welfare.They can reduce inequality throughjob creation and poverty alleviation, and they canreduce output volatility by increasing resilience toenvironmental and economic shocks, like naturaldisasters or spikes in commodity prices. A model-ing exercise suggests that half of the cost of climatepolicies to limit greenhouse gas concentration at 550ppm could be paid for by less vulnerability to oilscarcity (Rozenberg and others 2010).
Green policies and practices can contribute to growththrough three channels (see chapter 1). First,they can help to increase the amount of natural, physical, and human capital available:Better-managed soil ismore productive. Well-managed natural risks resultin lower capital losses from natural disasters (Hal-legatte 2011). Healthier environments result in moreproductive workers: a recent California study showsa strong impact of air quality on the productivity offarm workers (Graff Zivin and Neidell 2011).Second,they can promote efficiency.For instance,imposing environmental taxes (taxing “bads”) andremoving distortionary subsidies creates fiscal spacefor governments to lower labor taxes or subsidizegreen public “goods” such as public transport orrenewable energy. In London, congestion taxes,besides reducing traffic, helped to finance invest-ments in the aging public transport system, therebyincreasing effectiveness of the price signal by reduc-ing the costs or “disutility” associated with switch-ing from single-car use to public transport (Trans-port for London 2008). And many firms—includinglarge multinationals such as Hewlett Packard, Cisco,Clorox, and FedEx—are finding that embracing sus-tainability has improved the bottom line in part by
regulations that promote efficiency gains(Ambec and others 2011). Further, where rev-enues from environmental taxes are used toreduce taxes on labor and income, the impacton GDP is likely to be neutral or positive, asfound in an analysis of seven EU countries(Andersen and others 2007, cited in Ambecand others 2011).Other ex-post analyses confirm this con-clusion. The EU Emissions Trading Sys-tem has no negative impact on net importsin the aluminum, steel, and cement sectors(Ellerman and others 2010; Quirion 2011;Sartor 2012) or on the performance of Ger-man firms in general (Anger and Oberndor-fer 2008). Meanwhile, the climate levy onU.K. firms seems to affect energy efficiency,but not economic performance and firm exit(Martin and others 2009).Refineries located in Los Angeles sig-nificantly increased productivity in the late
1980s and early 1990s, a time of dramati-cally expanded regulation in California anddecreasing refinery productivity in the rest ofthe United States. Interviews with plant man-agers suggest productivity increases resultedfrom a careful redesign of production pro-cesses to comply with the new regulations(Berman and Bui 2001 and others). Simi-larly, the productivity of the Mexican food-processing industry increased with strongerenvironmental regulations (Alpay and others2002, cited in Ambec and others 2011).Moreover, there is no evidence that envi-ronmental policies have led to an exodus offirms to “pollution havens” (locations withlax environmental policies). Tighter environ-mental regulation may cause firms to relo-cate, but they will choose locations that aremore attractive overall, as pollution abate-ment costs represent a small share of pro-duction costs for most industries (Copeland
12
i n c lu s i v e G r e e n G r o w t h: t h e Pat h way to s u s ta i n a b l e D e v e lo Pm e n t
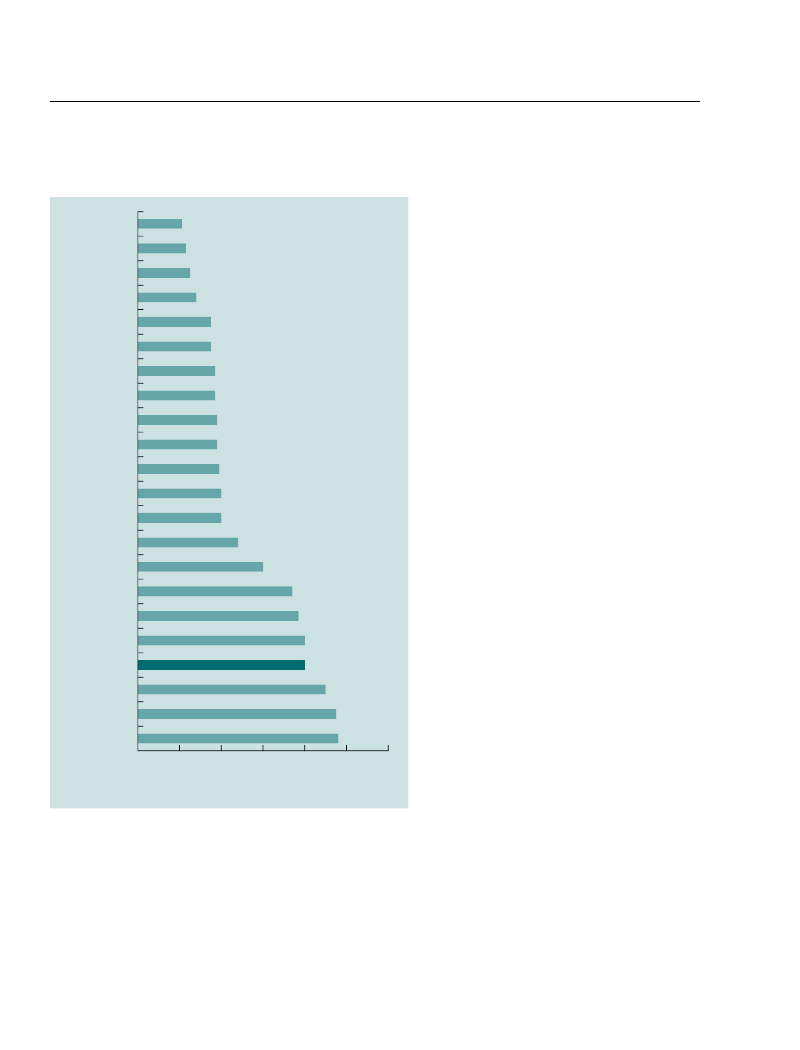
Figure O.6reducing environmental degradation would providesubstantial economic benefits(cost of enviromental degradation expressed as percentage of GDP equivalent)
But obstacles are plentiful, andgreen growth is no substitute forgood inclusive growth policiesIf green growth is necessary, efficient, andaffordable, what is impeding it? Acrosscountries and income levels, a mix of gover-nance and market failures, complex politicaleconomy, entrenched interests and behav-iors, and financing constraints are significantobstacles. Further, despite much rhetoric tothe effect, green growth is no panacea andwill not substitute for a good business envi-ronment and the reforms that are needed topromote growth and protect the poor.
TunisiaJordanEl SalvadorGuatemalaSyrian ArabRepublicNepalLebanonColombiaMoroccoAlgeriaPeruBeninBangladeshEgypt, Arab Rep.PakistanIran, Islamic Rep.NigeriaCentral AfricanRepublicAverageChinaTajikistanGhana024681012cost of environmental degradation as% of GDP equivalentSources:World Bank 2004, 2005a, 2006a, 2006b, 2006c, 2006d, 2006e, 2006f, 2007a, 2007b, 2007c,2008, 2009, 2010a, 2010b, 2010c, 2011a, World Bank and DRC 2012.
When first-best recommendations meetsecond-best situationsMuch of green growth is about good growthpolicies—addressing market failures and“getting the price right” by introducing envi-ronmental taxation, pricing environmentalexternalities (such as carbon pricing), cre-ating tradable property rights, and reduc-ing inappropriate subsidies. These measuresare critical for enabling the private sector toundertake needed investments and innova-tions and for getting consumers to internalizethe true costs of their behavior. But as withall good economic policy making, textbookpolicy recommendations, however appropri-ate, must be applied with insights into behav-iors, political economy, and governance andmarket failures. This is an enormous chal-lenge for a variety of reasons.First,getting prices right may be difficult because of political or social acceptability issues.The benefits are usually diffuse anduncertain, while the costs (the burden of theprice increase) are immediate, visible, andoften concentrated on a vocal minority. Thisis why price changes can be achieved onlywhen political economy issues are managedwith appropriate complementary policies.Second,getting prices right may not be sufficient because other market imperfec-tions can prevent prices from being the silver bullet of environmental policies.These mar-ket imperfections include the following:
2012). Factors such as availability of capital,labor abundance, location, institutions, andagglomeration effects are more importantthan environmental policy in determiningthe location choice and competitiveness offirms.
overview
13
• ow price elasticity.The ability of pricesLto trigger changes in behavior and technol-ogy is sometimes limited by substitutionpossibilities: the responsiveness of driversto higher fuel prices is low in the absenceof alternative means of transportation. Theability of firms in the renewable energy sec-tor to respond to incentives will dependon whether transmission lines are builtbetween centers of consumption and pro-duction. In these cases, price-based policiesmay have to be complemented with directinfrastructure investments (such as publictransportation and transmission lines) andother policy actions, like changes in urbanplanning or in norms and regulations. Butif substitution capacity is limited by alter-natives, their provision may increase theeconomy’s efficiency and boost income orpromote economic growth, making theprice increase more politically acceptable.• issing markets or institutions. SpecificMinstitutional measures may be required totransform the “right price” into the rightincentive. Where tenants are paying energybills, for instance, owners and developershave little incentive to “build right” or toinvest in more energy-efficient appliancesunless they can recoup their investmentsthrough higher rents or sales price. This“principal-agent” problem can be tackledthrough information (such as energy effi-ciency labels for homes), specific schemesto finance investments in energy efficiency,or norms (such as compulsory retrofitwhen homes are sold).• ack of credibility and predictability of Lprice signals. Governmentscannot com-mit to maintaining environmental priceinstruments over the long term, whichputs them in a poor position to encouragefirms to undertake long-term, risky invest-ments (notably in R&D and long-livedinfrastructure).• oordination failures and knowledge exter-Cnalities. Pricesare ill-suited to address the“classic” market failures usually invoked tojustify innovation and industrial policies.Think about electric cars whose develop-ment requires coordination between elec-
tricity providers, city planners, battery pro-ducers, and car manufacturers.Third,inertia and biases in behavior are such that many efficiency measures that might pay for themselves are not imple-mented.Household responses to higherenergy prices are often disappointing, andfirms do not always exploit all opportunitiesto improve efficiency (Gillingham and oth-ers 2009; Allcott and Mullainathan 2010).Energy savings of 20–25 percent could beachieved through improved industrial pro-cesses in high-income and emerging econo-mies (World Bank 2010d).Fourth,financing tools to tackle up-front investments are inadequate.Take the case ofsolar, wind, or hydroelectric energy, whichis characterized by much higher capitalcosts than fossil-based energy, but extremelylow operating costs, or energy efficiencythat requires up-front investments in newequipment or add-ons whose costs are thenrecouped over time through energy savings.Even with agriculture or fisheries, a shift tomore sustainable practices typically resultsin lower returns and investments in earlyyears that are then offset by higher returnsin the future. The need for up-front financingcan be a binding constraint for developing-country governments (especially local oneswith limited access to capital markets and asmall tax base) and the private sector (espe-cially small and medium enterprises). Fewcountries have a well-developed banking sec-tor, let alone energy service companies thatspecialize in financing investments in energyefficiency.
No substitute for good growth policy:The private sector needs an enablingenvironmentGreen growth strategies are growth strategieswith the additional goal of fostering a betterenvironment. As such, they cannot substi-tute for good growth policies: environmen-tal measures are unlikely to offset distortedlabor markets, illiquid financial systems, orpoor business environments.
14
i n c lu s i v e G r e e n G r o w t h: t h e Pat h way to s u s ta i n a b l e D e v e lo Pm e n t
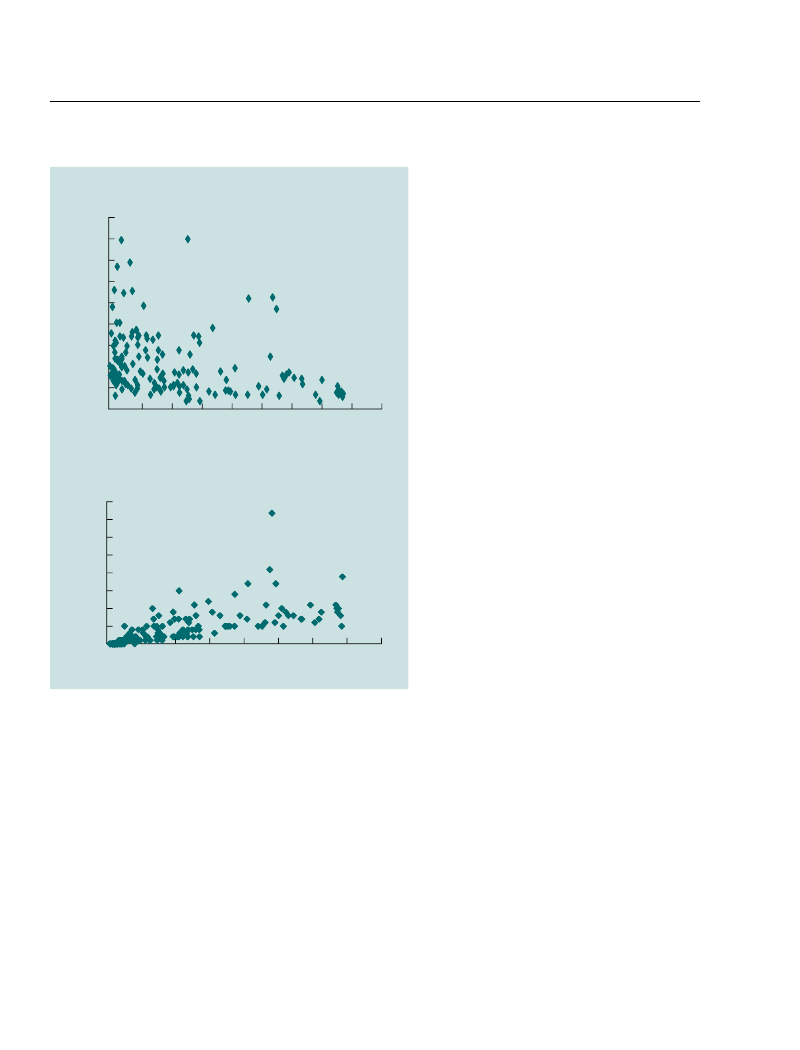
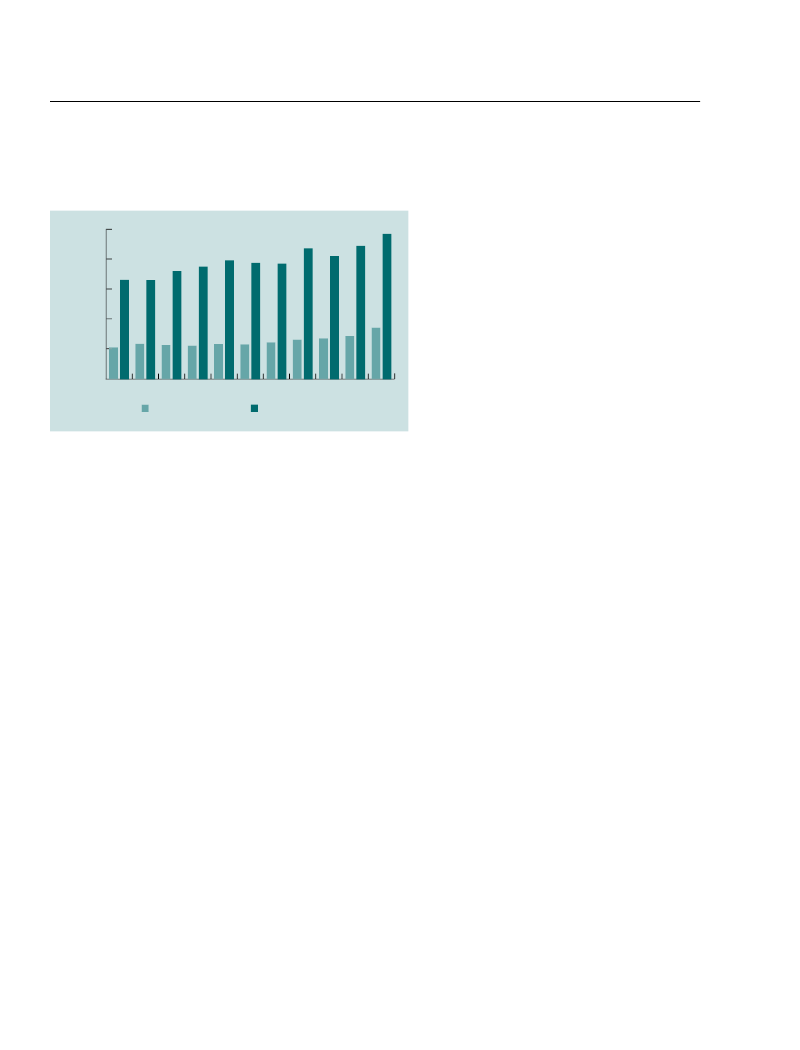
Figure O.7Developing countries may have substantialunexploited potential in green exports(green and close-to-green exports as a share of total exports from developingcountries, 2000–10)10% of total exportsfrom developing countries864202000 2001 2002 2003 2004 2005 2006 2007 2008 2009 2010green exportsclose-to-green exports
Source:Dutz and Sharma 2012, based on data from the Commodity Trade Statistics database(COMTRADE) and a six-digit proximity matrix based on COMTRADE.Note:Close-to-green exports are exports of goods that are not “green” but require similar skills—inthe way growing apples requires the same set of skills as growing pears so that a country that isgood at the former is likely to be good at the latter.
A case in point is “green jobs,” a topic thathas attracted substantial attention followingthe recent global financial crisis. Advocatesstress that, in a situation of high unemploy-ment, a green fiscal stimulus could effectivelyaddress recession-induced unemploymentand set the stage for cleaner post-recessiongrowth patterns. The argument is attractive:although green projects may not be the mostlabor intensive or “shovel ready,” they havethe added advantage of carrying environmen-tal benefits. That said, a fiscal stimulus—green or not—is effective only if unemploy-ment is linked to insufficient demand ratherthan to structural issues (such as lack ofskilled workers or a poor investment climate).Beyond stimulus effects, some countries—including Brazil, China, Germany, Japan, theRepublic of Korea, and Morocco—are look-ing at green growth as a potential source oflonger-term growth through which to cre-ate new markets. And even though not everycountry can become the world leader in solarpanels or wind turbines, developing countriesmay have substantial unexploited potentialin green exports (figure O.7). Many develop-ing countries have natural endowments that
create a potential comparative advantagein green activities (such as water resourcesand hydropower potential or insolation andsolar power potential). Realizing this poten-tial could generate jobs and exports, therebyboosting growth and output.But green policies cannot address struc-tural constraints to growth and employmentcreation, at least if deployed alone. They willnot be effective at creating green jobs wherelabor markets are distorted and regulationsdiscourage small business development. Theywill not offset an unattractive business envi-ronment. And where the labor force’s skillsare inappropriate for developing a competi-tive manufacturing sector, environmentalpolicies can hardly replace education. Thus,a recent study of South Africa concludes that,while the idea of developing green industries(such as solar power) is appealing, it haslittle chance of succeeding unless structuralproblems such as regulatory obstacles to thecreation of small enterprises and the lack ofskilled workers are addressed (World Bank2011b).Skill shortages already appear to beimpeding the greening of growth. In Chinaand India, rural electrification programs aresuffering from a lack of skilled workers. Rea-sons for these shortages include a scarcityof scientists and engineers, the poor reputa-tion and limited attractiveness of some sec-tors important for the green transition suchas waste management, and a limited numberof teachers and trainers in environmental ser-vices (ILO and CEDEFOP 2011).In countries where the business environ-ment is not conducive to investment andgrowth, better economic policies must be thefirst step. Lessons from trade liberalizationare telling: where labor mobility is limitedby skills and regulations and where invest-ments in the sectors that benefit from tradeliberalization are impaired by inappropriatepolicies, both workers and the private sectortake longer to adjust. The benefits from moretrade take longer to materialize, and adjust-ment costs are much higher. Similarly, eco-nomic benefits from green policies are morelikely to be large and immediate if economic
overview
15
policies are conducive to change and favorthe development of more environmentallyfriendly and more productive activities.
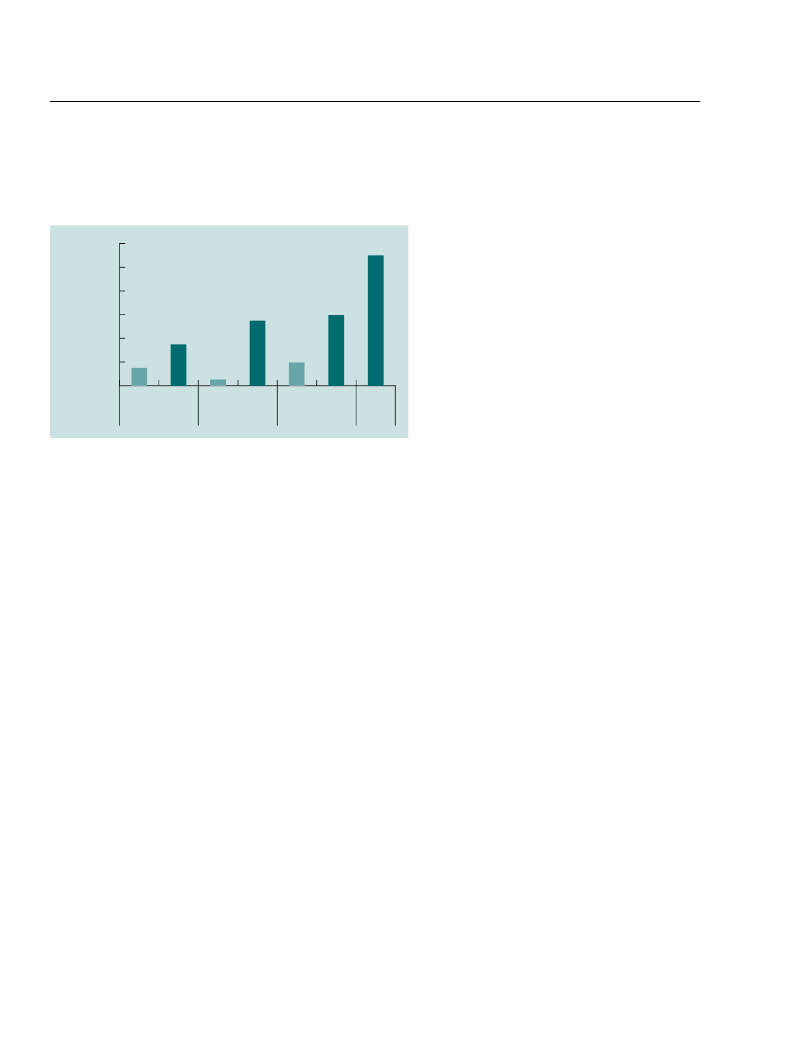
The poor and vulnerable needsocialprotectionWhile there is a general presumption that thepoor suffer most from environmental deg-radation and its impact, this need not implythat they would benefit automatically fromgreen growth policies. For example, remov-ing fossil fuel subsidies would clearly reducethe poor’s purchasing power unless compen-sated for by other measures.But subsidies are often regressive and canbe replaced by better-targeted transfers at afraction of the cost (figure O.8). By one esti-mate, the cost to the budget of transferringUS$1 to the poorest 20 percent of the popu-lation via gasoline subsidies is US$33 (Arzedel Granado and others 2010). Similarly,consumption subsidies for water and electric-ity can usefully be replaced by connectionsubsidies that are invariably better targeted,
as the poor account for the majority of thosewithout access to basic services.In sum, hopes that green growth will single-handedly solve countries’ employment, com-petitiveness, or poverty problems are probablyas unfounded as the fear that environmen-tal policies will lead to massive loss of jobsor competitiveness. Adjustment costs mayvary across industries because some sectorsare inherently more innovative than othersand tend to adapt better. Better regulation—particularly if supported by training, R&Dsupport, and the recycling of environmentaltaxes into other tax cuts—will help to mini-mize these adjustment costs and maximizebenefits. Also needed are steps to protect thepoor from the potential downsides of greenpolicies and to ensure that they benefit fullyfrom the likely upsides.
The way forward: good andinclusive growth policies tailoredto real-world challengesSo greening growth requires good growthpolicies adapted to political economy realitiesand entrenched behaviors. It entails reformsin the patterns of pricing, regulation, andpublic investment that trigger resistance. Itrequires complex changes in behaviors andsocial norms because, even with efficiencygains and new technology, it is unlikely thatmiddle-class consumers (whether in rich or inpoor countries) can stick to current consump-tion patterns. And it requires knowing whento go for the politically expedient rather thanthe economically optimal, carefully deploy-ing social marketing tools and making finan-cial tools available.Complicating matters is the fact thatopportunities to green growth at a man-ageable cost are not evenly distributed overtime. This creates urgency for some, thoughnot all, green policies and is one of severalarguments for why “grow dirty and cleanup later” is not a good option even for poorcountries (box O.3).What follows is a three-prong strategy fortackling entrenched interests and behaviors,financing constraints, and the risk of lock-in.
Figure O.8Fossil fuel subsidies benefitprimarily the rich(fossil fuel subsidy allocation, by income quintile, average across20 countries, various years)bottom quintile7%topquintile43%Q411%
Q316%
Q223%Source:Arze del Granado and others 2010.
16
i n c lu s i v e G r e e n G r o w t h: t h e Pat h way to s u s ta i n a b l e D e v e lo Pm e n t
BOx O.3
Why “grow dirty and clean up later” is misleadingSimilarly, mismanaging water resources impairspeople’s ability to grow crops and feed their fami-lies. Where natural assets like soil quality, water,and standing forests serve as critical inputs intoeconomic production, good environmental policiesenhance income generation and poverty alleviation.Second, it may be impossible or prohibitivelyexpensive to clean up later. The loss of many envi-ronmental assets—most obviously biodiversity—is irreversible. This is also the case with climate.Because greenhouse gases reside in the atmospherefor a long time, each emitted molecule will influencethe climate over decades (for methane), centuries(for CO2), or longer. Irreversibility may also occurbecause of economic and technological lock-in. A lotof infrastructure is long lived, and today’s choiceswill be hard to reverse. Urban forms are largelydetermined when city populations are increasingrapidly and most buildings and transport systemsare being built. The consequences of developmentbased on a low-density, individual-vehicle transpor-tation model are largely irreversible, as evidenced bythe current struggles of U.S. urban planners to den-sify and develop public transport systems.
Many argue that poor countries should focus on sat-isfying human needs before attending to nature, espe-cially given their relatively small environmental foot-print. This argument is misleading for several reasons.First, not all environmental goods are superiorgoods whose share in total consumption increaseswith income. Individuals who struggle to feed andhouse themselves may not see biodiversity protectionand climate change mitigation as priorities, but localenvironmental goods affect their daily lives, withsignificant impact on income and welfare. The lackof solid waste disposal, for example, is not merely anenvironmental issue. By clogging drains, it leads tohealth hazards and flooding, with serious economicand human consequences:• In Haiti, poor solid waste disposal is to blame forthe resurgence of diseases such as dengue and forvulnerability to storms.• In India, better solid waste disposal systems were aprincipal recommendation of the fact-finding com-mittee established to investigate the causes of the2005 Mumbai floods, which caused almost US$2billion in damages and killed an estimated 500people.
Prong 1: Tailored strategies thatmaximize local and immediate benefitsand avoid lock-inGreen growth policies require governmentsto do a better job of managing both marketand governance failures. This is obvious inany discussion of green innovation or indus-trial policies, but also of the regulatory andmarket (“good growth”) reforms that areneeded, some of which are complex. Evensophisticated administrations may strugglewith market-based instruments, as experi-ence with the European Trading System hasdemonstrated (Betz and Sato 2006). Opti-mal solutions will differ across countrieswith varying degrees of institutional capac-ity, transparency, accountability, and civilsociety capacity. Therefore, green growthstrategies need to be tailored to a country’s
circumstances, and “best practices” shouldbe imported with caution.Maximize local and immediate benefits. Inaddition to being tailored to local circum-stances, strategies need to address the politi-cal economy of reform. Green growth strate-gies should aim to minimize transition costsby offsetting them to the extent possible, withvisible and immediate benefits. This impliesdesigning policies to maximize short-term,local benefits, such as increased efficiencyand productivity, safety and resilience, jobcreation, and poverty alleviation.Avoid lock-in. Governments cannot makeall of the changes needed at once: they havelimited resources and limited implementationcapacity to devote to complex problems; theyalso have limited political capital to defend
overview
17
TABLe O.1Some guiding principles for establishing green growth strategiesLocal and immediate benefitsLOWER(Trade-offs exist between short-andlong-term or local and global benefits)LOWer(action is less urgent)inertia and/or risk of lock-inandirreversibilityHIGHER(Policies provide localand immediate benefits)• Drinking water and sanitation, solid waste management• Lower-carbon, lower-cost energy supply• Loss reduction in electricity supply• Energy demand management • Small-scale multipurpose water reservoirs• • • • • Land use planningPublic urban transportFamily planningSustainable intensification in agricultureLarge-scale multipurpose water reservoirs
• Lower-carbon, higher-cost energy supply• Carbon pricing• Stricter wastewater regulation
HigHer(action is urgent)
• Reduced deforestation• Coastal zone and natural area protection • Fisheries catch management
policies against interest groups and politi-cal opposition. A focus on the sectors andinterventions that are most urgent—that is,those that can help to prevent irreversibilityor reduce inertia—is thus called for.Table O.1 illustrates the implications forpriority setting of emphasizing local andimmediate benefits and urgency. While lower-carbon energy from renewable sources ishighly desirable, it is easier to build renewableplants later (even if this requires retiring ther-mal power plants) than to try and reverse poorland-use planning that has resulted in sprawl-ing cities. Good land-use planning and urbanpublic transport can provide short-term bene-fits—for instance, by reducing congestion andexposure to disasters and by favoring denserand more energy-efficient development. TableO.1 provides general statements on a fewgreen policies; this analysis needs to be car-ried out at regional, national, and local scalesto take into account specific contexts (see, forinstance, an application to the Mediterraneancountries in CMI 2012).Developing countries (especially low-income countries) should prioritize policiesthat (a) have a negative or zero economic costthanks to synergies with development (suchas developing hydropower where appropri-ate, implementing effective urban plans, or
scaling up family planning policies to managepopulation pressures and improve health andeducation outcomes), (b) have a positive eco-nomic cost but large direct welfare impacts(that is, when they target local environmen-tal goods such as local air pollution or natu-ral risks), or (c) are financed from externalresources (including through carbon trading).Actively manage the political economy of reform. Managing the political economyof reform also entails measures that targetthose segments of the population that wouldotherwise oppose reforms. For example, in2010 the Islamic Republic of Iran increaseddomestic energy prices by up to 20 times,reducing fossil fuel subsidies by some US$50billion–US$60 billion. It offset them withUS$30 billion in cash transfers that benefited80 percent of its population, thereby address-ing the fact that opposition to the reform ofsuch subsidies usually comes from the middleclass. The combination of cash transfers witha well-orchestrated public relations campaignwas critical to the success of the reform (Guil-laume and others 2011).Understanding the sources of resistance toa reform helps to design the reform processin a way that minimizes this resistance (boxO.4). Sound information about winners and
18
i n c lu s i v e G r e e n G r o w t h: t h e Pat h way to s u s ta i n a b l e D e v e lo Pm e n t
BOx O.4
Morocco: The importance of political economyThe results are astonishing: more than 70 percentof the population was unaware of the existence ofenergy subsidies. Thus, the vast majority of buyersof 12 liter cooking gas bottles—a product as wide-spread as bread—did not know that the real marketprice was more than DH 100 (US$14) instead of thestandard retail price of DH 40 (US$5.6). In addi-tion, a large majority opposed the idea of reducingsubsidies—although this majority decreased onceoffered a well-targeted social program, and fell evenfurther when the program was explained in detail.In the end, it was the wealthy that remained thegroup most opposed to reform.This simple exercise in revealing political aware-ness and preferences helped the previous governmentdevelop a communication strategy over the mediumterm, starting from informing the population of theexistence of the subsidy system and explaining itsdisadvantages. A communication campaign ensuedin the first months of 2011, and the governmentelected in November 2011 now has energy subsidyreform at the top of its agenda.
A sound understanding of the winners and losers ofpossible green growth strategies helps policy makersfind ways to address tough economic reforms—asMorocco has recently learned in its quest to overhaula universal subsidy system that rewards fossil fuelconsumption. By gaining insights into the politicaleconomy of reform, Morocco is now poised to reformits energy subsidy, which would sharply reduce fiscalcosts and facilitate a greener growth path.The problems with the energy subsidy are multi-ple. Its fiscal impact reached 5.5 percent of GDPin 2011, absorbing roughly 17 percent of the totalinvestment budget. It undercuts Morocco’s ambi-tious mitigation goals by keeping the price of fossil-based energy products low, thus making renewableand efficiency investments less competitive. And itis regressive, with the wealthy benefitting the most.So why has Morocco hesitated to reform thesubsidy? A big reason is that the subsidy reformwas believed to be unpopular, although the govern-ment had never done a survey to ascertain just howunpopular, among which segments of society, andwhether alternatives could motivate changes. Forthat reason, the World Bank offered to conduct sucha poll in 2010 using a nationally representative sam-ple of 1,600 households.
Box text contributed by Andrea Liverani.
losers enables an information campaign to betailored to potential critics.One way of improving public decisionsand determining priorities is to inform deci-sion makers of the value of the services pro-vided by natural ecosystems, so that thisvalue can be compared directly with the eco-nomic costs and benefits of their decisions.Indeed, most environmental assets do nothave widely accepted prices either for theirintrinsic value or for the services they pro-vide (such as flood protection). As a result,decisions that involve a trade-off betweeneconomic interests and natural assets (such asbuilding a road through a rain forest) are dif-ficult to assess.Green accounting extends beyond thevaluation of natural assets and focuses on acountry’s stock of natural and other assets(its wealth) rather than on a flow measure
like GDP. By doing so, it helps to identifysituations in which economic growth doesnot create wealth (because natural assets areconsumed more rapidly than other assets arecreated) and is not sustainable. For instance,a green accounting exercise suggests thatChina’s growth would be much lower thanits official GDP growth of nearly 10 percent ayear if environmental depletion and degrada-tion were included. Indeed, calculations putChina’s adjusted net national income growthat about 5.5 percent a year (World Bank andDRC 2012).
Prong 2: Measures that promote andincentivize smart decision makingEven though the information provided bygreen accounting can help inform and bal-ance the debates on political choices and
overview
19
public investments, it does not constitute anincentive for firms and individuals. To influ-ence their behavior, additional measures arerequired, and it is here that governments canplay a critical role by ensuring that marketincentives promote green behavior on thepart of firms and individuals.Getting the prices right will influence con-sumer demand as well as firms’ choice of pro-duction processes (for example, higher energyprices will make firms use more energy-efficient technologies to minimize their pro-duction costs) and products (to respond toconsumer demand that changes with relativeprices). But it will also make them innovate,develop, and implement new technologiesand processes.Getting prices right also has a central rolein shaping the built-up structure of cities.Land developers respond to price signals sothat higher land prices lead to higher den-sity—enhancing productivity spillovers andthe supply of affordable housing and manag-ing demand for transport. When “official”land prices do not reflect demand and aredepressed at the urban periphery, sprawl orsuburbanization likely will be excessive.But market incentives will not suffice. Forgreen policies to succeed, governments willneed all of the arrows in the public policyquiver.Informing and nudging to influenceindividuals and address behavioral biasesBehavioral biases limit the impact of mar-ket incentives and complicate the design ofenvironmental policies. For example, oneexplanation for the large unexploited poten-tial that exists in energy efficiency springsfrom the “cognitive myopia” that preventsindividuals from accurately weighing futurebenefits against immediate costs. Also, indi-viduals measure gains and losses with respectto a reference point and weigh losses morethan gains (Tversky and Kahneman 1992);as a result, they tend to consider the cost ofnew environmental policy as a loss and todisregard environmental damages avoided.People are biased toward the status quo, tendto choose the default option, and have anaversion to ambiguity, resulting in a tendency
to delay decision making related to complexproblems such as climate change (Tverskyand Shafir 1992). At the same time, peoplelike to “do the right thing” and are heavilyinfluenced by social norms.As a result, how messages are framed, whatvalues are appealed to, and how the neededefforts are presented are critical. When giventhe choice of voluntarily paying for a carbonoffset for an airline ticket, some 60 percentof Americans will do so regardless of politi-cal affiliation. When the offset is referred toas a carbon tax, support falls from 60 to 25percent among Republicans (Hardisty andothers 2010). More generally, framing greenpolicies as a way to reach an ambitious andpositive social goal (such as becoming carbonneutral by 2050 or becoming a leader in solartechnologies) makes them more acceptable(and less prone to reversal at the next changeof government) than if they are perceived as aconstraint to economic development.Another approach showing promisingresults is tweaking “choice architectures” to“nudge” people to make better decisions forthe environment or other desirable outcomeswithout restricting their freedom of choice(Thaler and Sunstein 2008). To count asa nudge, the intervention must be easy andcheap, but not constitute a mandate. Chang-ing the default options—without changingthe options themselves—can be an efficientway to promote greener behaviors. In twocases where the default option offered by theelectricity provider was a cleaner but moreexpensive one, fewer than 5 percent of cus-tomers requested a shift to a cheaper, butless green, source of electricity (Picherta andKatsikopoulos 2008).Policies that unleash the power of theprivate sectorFirms have a major role to play in provid-ing solutions to green growth. Through theircapacity to innovate and adjust their produc-tion processes, firms are key to keeping thecost of green policy in check. This means thatgovernments need to influence the behaviorof firms by providing appropriate incentivesand regulations in addition to the right eco-nomic incentives.
20
i n c lu s i v e G r e e n G r o w t h: t h e Pat h way to s u s ta i n a b l e D e v e lo Pm e n t
Use information. Besides prices, firms aresubject to pressures from their customers,stakeholders, and investors, and this pressurecan be used to green their behavior. Promot-ing transparency and access to informationon environmental impacts can create socialpressure to reduce these impacts. A 1996amendment to the U.S. Safe Drinking WaterAct requiring community drinking water sys-tems to report regulatory violations publiclyhas been sufficient to reduce the incidence ofsubsequent violations, even in the absence ofadditional financial incentives.In China, Indonesia, the Philippines, andVietnam, performance evaluation and ratingsprograms that reported emissions data andassessed plants’ environmental performancehelped a large number of plants initially ratedas “noncompliant” to rise to “compliant” (incontrast, plants rated as “flagrant violators”and “compliant” stayed in those categories).One reason these programs work is that theyprovide the information needed for civil soci-ety and legal and political systems to act toreduce pollution. But it also works becausethey attract the attention of managers to effi-ciency-increasing opportunities, which canbe implemented at low or even negative cost.Impose where it makes sense. Market andprice instruments are sometimes difficult toimplement or to enforce, they lack predict-ability and credibility over the long term,and they may be inefficient when economicactors do not take them fully into account,such as not fully valuing fuel economy whenbuying a car (Greene 2010). This is why it issometimes easier to implement norms andregulations, as is done by Australia, Canada,China, the European Union, Japan, Korea,and the United States for car fuel efficiencystandards (An and others 2007).Use innovation and industrial policy, but with caution. Prices are notoriously limitedinstruments for transforming economies ortriggering investments with long-term oruncertain payoffs. Since they depend on gov-ernment actions, they have long-term cred-ibility and predictability issues. They also
cannot address the “classic” market failuresthat are usually invoked to justify innovationor industrial policies: increasing returns andknowledge externalities in new industries,information asymmetries, capital marketimperfections, and the coordination neededacross different sectors to permit a techno-logical transition. As a result, most countriesresort to some form of innovation and indus-trial policies in their growth strategies.Such policies need to be used with careand tailored to the country context. Today,frontier innovation and basic R&D are highlyconcentrated in high-income countries and afew large emerging economies. High-incomecountries have a critical responsibility to stepup their efforts on green innovation and itsdeployment as well as to take new technolo-gies to scale through demand-side policies.Failure to do so will severely compromisethe ability of developing countries to pursuegreen growth.In lower-income countries, capacity isoften not sufficient for frontier innovation;what is needed are policies to support theadaptation and dissemination of existingtechnologies. These technologies have beendeveloped and tested in richer countries,making their support through trade, dissemi-nation, and industrial policies less risky thanthe development of new technologies. Thebest way to accelerate technology diffusionis to reduce trade barriers. In China, photo-voltaic panel fabrication technologies wereintroduced mainly through the import ofmanufacturing equipment from Europe. Alsocritical are policies to increase adaptationand adoption capacity through education andtraining as well as trade and industrial poli-cies (such as local content requirements).Moreover, several developing countriesare pursuing green industrial policies—bio-fuels in Brazil and solar energy in China andMorocco. Lessons from past successes andfailures of standard industrial policies areclear: governments should subject firms tocompetition, have clear sunset clauses, andfocus on well-identified market failures, spill-over, or latent comparative advantages (forexample, solar potential in North Africa). But
overview
21
most green industries will require some typeof policy support, making a market test morecomplex to design (is a technology not com-petitive because the government is not pricingthe externality correctly or because the tech-nology is not the most competitive available?)and making it even more imperative for gov-ernment to navigate carefully the twin risks ofpolicy and market failures. Typically, environ-mental policy (such as a carbon tax) shouldaddress the environmental externality, whilethe standard tools of innovation and indus-trial policies are used to address knowledgeexternalities and other market failures such aseconomies of scale and coordination failures.
Prong 3: innovative financing tools thattackle higher up-front financing needsEven when environmental or green infra-structure policies and investments pay forthemselves, they can involve significantup-front costs and require specific finan-cial tools. Innovative financing is thereforeurgently needed, especially where gains frombetter environmental management cannotimmediately be monetized.Resources are available but remain smallrelative to need, so they need to be leveraged.With respect to climate change mitigation,recent estimates suggest that a package ofpublic sources (including a redirection of sub-sidies currently destined for fossil fuels), mul-tilateral development bank flows, and carbonoffset flows could leverage some US$200billion to US$400 billion in 2020 in addi-tional private flows (MDB Working Groupon Climate Finance 2011). This is close to theexpected investment needed to reach a 550ppm CO2-eq target, but about half of whatis needed to reach a 450 ppm CO2-eq target.As for the biodiversity market, offset andcompensation programs officially amount tosome US$2.4 billion to US$4 billion per year,but may be much bigger, given that most ofthe existing markets are not transparent oranalyzed enough to estimate their size (Mad-sen and others 2011).Increasing the role of the private sectoris critical. Many of the needed investments
could benefit from public-private partner-ships. Private participation in infrastructurehas grown at a steady pace (13 percent ayear) over the past 20 years but remains con-centrated in a few middle-income countriesand a few sectors, namely, telecom and, to alesser extent, energy (World Bank and PPIAF2012). New investments in renewable energyare largely private (some US$143 billion ofthe US$211 billion invested in renewables in2010), but 82 percent of private renewableenergy investments that take place in devel-oping countries occur in Brazil, China, andIndia (UNEP and Bloomberg New EnergyFinance 2011). Yet the need for innovation,efficiency, and “smart investments” (smartgrids, smart transportation, and smarthouses) makes the role of the private sectoreven more critical in green growth policiesthan it already is in traditional infrastructurefinance.Three weaknesses hold back private financ-ing of infrastructure—green or not (MDBWorking Group on Infrastructure 2011):• he scarcity of resources to prepare proj-Tects and bring them to a stage at whichthey are “bankable” (that is, attractive toprivate sectors). Developing-country gov-ernments—at least those with limited expe-rience with public-private partnerships—are often reluctant to borrow to prepareuncertain projects, while private investorsare unwilling to invest in preparing a proj-ect they may have to bid for and not win.• The mismatch between the tenor of thefunds available, with the preference ofinvestors for short-term funds and theneeds of infrastructure for long-termfunds (15–25 years). Few countries havewell-developed capital markets or bank-ing institutions able to transform short-term deposits into long-term products, andnot enough refinancing tool options areavailable.• The challenge of cost recovery. The abilityto charge at full cost is behind the mas-sive expansion in telecom services, but fewother infrastructure sectors are able to doso, although where they have, investors
22
i n c lu s i v e G r e e n G r o w t h: t h e Pat h way to s u s ta i n a b l e D e v e lo Pm e n t
have come, as they did in Colombia’s watersector. Solutions include measures to priceinfrastructure services close to cost recov-ery, while ensuring affordability for low-income households.Another weakness springs from the addi-tional policy risk created by the fact that theprofitability of green investments is oftendependent on public policies (such as feed-in tariffs or environmental taxation). Thus,Spain’s retroactive reductions in solar feed-in tariffs, Germany’s and France’s decisionsto reduce the amount of support for futureprojects, and the lack of progress on a U.S.energy bill all combined to depress the privatesector’s appetite for renewable energy invest-ments in 2010. As a result, clean energy shareprices dipped, reflecting investor concerns,despite continued strong government supportfor renewable energy in China (UNEP andBloomberg New Energy Finance 2011).Renewable energy and energy efficiencyillustrate the need for innovative publicfinancing instruments (World Bank forth-coming b). Renewable energy is capital inten-sive with a long payback period and may facethe technology risks associated with emergingtechnologies (such as concentrated solar) orunique resource risks (drilling for geother-mal). Energy efficiency suffers from the factthat most local banks rely on balance sheetfinancing, rather than project-based financingthat is based on the cash flow generated by theinvestments. The result is that the customersmost in need of financing (small businessesand households) are typically deemed notcreditworthy. And energy efficiency invest-ments tend to be small, with high transactioncosts, so that banks may not find them attrac-tive in the absence of dedicated credit lines toincrease confidence and capacity and instru-ments to aggregate small deals.Furthermore, access to financing is par-ticularly problematic for small and mediumenterprises (SMEs), which account for a largeshare (60 percent in many countries) of pol-lution and resource use. Some 65 to 72 per-cent of all SMEs (between 240 million and315 million firms) lack access to credit, with
a particularly daunting picture in Asia andAfrica (Global Partnership for FinancialInclusion 2011). Even in the more sophis-ticated markets, most firms find it tough toget credit for investments aimed at businessactivities other than expansion.How can these obstacles to green invest-ments be overcome? The public sector, inter-national financial institutions (IFIs), andbilateral donors can help by providing fundsfor project preparation as well as conces-sional elements for pioneer investments. Suchsupport can go a long way toward changingrisk-return profiles and giving investors moreconfidence in the long-term viability of theirprojects.More generally, well-designed publicfinance mechanisms help to mobilize privateinvestments in energy efficiency and renew-able energy (World Bank forthcoming b). Inthe case of renewable energy and energy effi-ciency, the following tends to have the great-est leverage:• Credit lines or guarantee instruments toengage private banks. The experience ofthe International Finance Corporationis telling: between 1997 and 2011 someUS$65 million in concessional funding,primarily for risk-sharing facilities, gener-ated US$680 million in sustainable energyfinance investments (IFC 2011).• “Fund of funds” under which the govern-ment invests a relatively small amount oflong-term capital in a range of private, pro-fessionally managed funds that then investin clean energy or energy efficiency• Public funds to reduce interest rates forconsumer financing, typically throughfinancial institutions or utilities.In addition, energy service companies(ESCOs), which provide clients with energyauditing, propose energy-savings measures,and financing, can help consolidate multiplesmall transactions. ESCOs as an industryoften require public support to establish: inChina, it took more than a decade of sup-port by the government and the World Bankbefore the ESCOs grew to a US$1 billionindustry in 2007 (World Bank 2010d).
overview
23
TABLe O.2Financing mechanisms need to be tailored to the maturity of the local financial sector(context-dependent financing tools for clean energy in East Asia and the Pacific)Level of financial sector developmentIndicatorCountry income levelBanking servicesNon-bank financial servicesLowLow income (e.g., Lao PDR)Basic banksNoneMediumMiddle income (e.g., Thailand)Full-range banks• Government bonds• EquityHighUpper middle income (e.g., Malaysia)Universal banks• overnment and Gcorporate bonds• Equity• lternatives (private equity, Aventure capital)Fully market basedReadily availableFull (up to 15 years)Robust• ines of credit L(demonstration)• artial risk guaranteeP• Equity funds• Consumer financing
Interest rateAccess to finance for SMEsAvailability of long-term financingRisk managementAppropriate cleanenergy financinginstruments
Administrative settingLimitedLimited (up to 1 year)Weak• ines of credit L(liquidity support)• Concessional financing• Dedicated debt funds
Largely market basedPartialPartial (up to 7 years)Adequate• ines of credit L(demonstration)• Partial risk guarantee
Source:World Bank forthcoming b.
Overall, the relevant mix of financinginstruments will depend on the market barri-ers (access to credit, transaction cost, or per-ception of risk), market segments (SMEs, largedevelopers, or polluters), and local context(such as the maturity of the local financial sec-tor) in which they seek to operate (table O.2).In addition, payments for environmentalservices (PES)—whereby farmers and land-owners are compensated for maintainingtheir land’s ability to provide ecosystem ser-vices (such as the regulation of water flows,water purification, control of soil erosion,and habitats for wildlife)—are promising, butunderutilized. Fortunately, efforts to developREDD+ are helping to develop PES schemes.4In addition, in developing countries, policymakers have tried to design PES programs tobenefit the poor. But whether these schemesin fact benefit the poor depends on the natureof the scheme. Brazil appears to have beensuccessful in this regard, building on its
experience in developing social safety nets forthe poor (box O.5).
ConclusionsIn sum, this report approaches green growthfrom a pragmatic point of view. The currentmodel is not just unsustainable, it is ineffi-cient. Improving it is good economics, so let’sfix market failures, internalize externalities,assign property rights, improve governance,and influence behaviors. But making greengrowth happen and ensuring it is inclusivewill also require an acute understanding ofpolitical economy and social psychology.As such, this report speaks primarily tothose who fear that greening growth maybe too expensive, may be too ambitious atan early stage of development, or shouldconcern only high-income countries. Tothem, the report makes a clear case thatgreening growth is neither unaffordable nortechnically out of reach, there are plenty of
24
i n c lu s i v e G r e e n G r o w t h: t h e Pat h way to s u s ta i n a b l e D e v e lo Pm e n t
BOx O.5
“green” cash transfers are helping poor communities in the Brazilian AmazonInvestments for administrative support to com-munity associations make up 10 percent of the totalpaid to families during the year.Bolsa Florestaisbeing implemented by the State Government ofAmazonas and the Funda§ão Amazônia Sustentável(Sustainable Amazonia Foundation). The funds aregenerated by the interest on an endowment initiallyestablished with contributions from the state govern-ment and private donors. Deforestation is monitoredon a yearly basis by the Amazonas State Secretariatfor the Environment and Sustainable Developmentthrough satellite imagery analyzed by independentinstitutions. The program currently benefits 7,614families in 15 protected areas, covering around 10million hectares of forests. The State of Amazonashas succeeded in halving the deforestation rate overthe past five years.
An innovative addition to the BrazilianBolsa Famí-lia (family allowance) conditional cash transferprogram—the world’s largest and one of the bestregarded in terms of coverage and targeting—isbeing implemented for communities living insideprotected areas in the Amazon region.TheBolsa Floresta(forest allowance) rewards tra-ditional communities for their commitment to stopdeforestation by distributing payments for ecosystemservices to families, communities, and family associa-tions. In order to be eligible to receive the grants, fam-ilies must enroll their children in school, sign a zerodeforestation commitment, and attend a two-daytraining program on environmental awareness. Eacheligible family receives a monthly stipend of R$50(US$30), paid to the mother. Community associa-tions can also be eligible to receive payments of up toR$4,000 (US$2,500) to support sustainable incomegeneration activities, such as honey production, fishfarming, and sustainable forest management.
Box text contributed by Adriana Moreira.
BOx O.6Joining forces: A common platform to move forward on greening oureconomies and growth processesHow does the World Bank’s definition of greengrowth as economic growth that is environmentallysustainable compare to those advocated in recentmajor reports on green growth? The OECD definesgreen growth as “fostering economic growth anddevelopment, while ensuring that natural assetscontinue to provide the resources and environmen-tal services on which our well-being relies” (OECD2011b). The United Nations Environment Programme(UNEP) defines a green economy as “one that resultsin improved human well-being and social equity,while significantly reducing environmental risks andecological scarcities” (UNEP 2011). Like the approachpromoted in this report, these definitions are consis-tent with sustainable development as an ultimateobjective and with green growth or a green economyas a means to reconcile its economic and environmen-tal pillars, without ignoring social aspects.So while the three reports differ in their focusand target audience, they are fully consistent intheir broad vision and policy advice. This commonvision is being developed further in the context ofthe Green Growth Knowledge Platform (GGKP), apartnership of the three institutions and the GlobalGreen Growth Institute. The GGKP—launched inJanuary 2012—is a global network of researchersand development experts seeking to identify andaddress major knowledge gaps in green growth the-ory and practice. Through widespread consultationand world-class research, the GGKP aims to providepractitioners and policy makers with better tools tofoster economic growth and implement sustainabledevelopment (http://www.greengrowthknowledge.org).
overview
25
immediate benefits and a poor country canreap economic benefit from better environ-mental management. And although high-income countries, which still account for 75percent of global consumption and a dispro-portionate share of environmental degrada-tion, absolutely have to implement ambitiousenvironmental measures, all countries willgain from starting early.Greening growth need not entail slowergrowth and is affordable. However, achievinga green economy overnight probably is not.The costs of greening growth will dependon the degree of ambition. Rapidly anddramatically decreasing our impact on theplanet would be quite costly. So, too, woulddelaying action for too long. Dramatic shiftswould entail much slower growth at least inthe medium run, and avoiding a brutal tran-sition is the main incentive to start acting asearly as possible.This report adds to the chorus started bythe Organisation for Economic Co-operationand Development and United Nations Envi-ronment Programme (U NEP) in recentreports supporting the idea that inclusivegreen growth is good economics and gooddevelopment policy (box O.6). While weare still far from being able to price ecosys-tem services properly, they clearly are valu-able. As such, neglecting natural capital, likeneglecting human and physical capital, issimply bad management, bad economics, andbad for growth.
forests, offering incentives for developing coun-tries to reduce emissions from forested landsand invest in low-carbon paths to sustainabledevelopment. REDD+ goes beyond deforesta-tion and forest degradation and includes therole of conservation, sustainable managementof forests, and enhancement of forest carbonstocks (http://www.un-redd.org/).
referencesAllcott, H., and S. Mullainathan. 2010. “Behav-ior and Energy Policy.”Science327 (5970):1204–05.Alpay, E., S. Buccola, and J. Kerkvliet. 2002.“Productivity Growth and EnvironmentalRegulation in Mexican and U.S. Food Manu-facturing.”American Journal of Agricultural Economics84 (4): 887–901.Ambec, S., M. A. Cohen, S. Elgie, and P. Lanoie.2011. “The Porter Hypothesis at 20: Can Envi-ronmental Regulation Enhance Innovation andCompetitiveness?” Resources for the FutureDiscussion Paper 11-01, Washington, DC.An, F., D. Gordon, H. He, D. Kodjak, andD. Rutherford. 2007. “Passenger VehicleGreenhouse Gas and Fuel Economy Standards:A Global Update.” International Council onClean Transportation, Washington, DC.A ndersen, M. S ., T. Barker, E . Christie,P. Ekins, J. F. Gerald, J. Jilkova, S. Junan-kar, M. Landesmann, H. Pollitt, R. Salmons,S. Scott, and S. Speck, eds. 2007. “Competi-tiveness Effects of Environmental Tax Reforms(COMETR).” Final report to the EuropeanCommission, DG Research, and DG TAXUD(Summary Report), National EnvironmentalResearch Institute, University of Aarhus.Anger, N., and U. Oberndorfer. 2008. “Firm Per-formance and Employment in the EU Emis-sions Trading Scheme: An Empirical Assess-ment for Germany.”Energy Policy36 (1):12–22.Arze del Granado, J., D. Coady, and R. Gilling-ham. 2010. “The Unequal Benefits of FuelSubsidies: A Review of Evidence for Develop-ing Countries.” IMF WP/10/02, InternationalMonetary Fund, Washington, DC.Bai, Z. G., D. L. Dent, L. Olsson, and M. E.Schaepman. 2008. “Proxy Global Assessmentof Land Degradation.”Soil Use and Manage-ment24 (September): 223–34.Berman, E., and L. T. M. Bui. 2001. “Environ-mental Regulation and Productivity: Evidence
Notes1. The equivalent amount using purchasing powerparity (PPP) that allows for better cross-countrycomparisons of purchasing power is US$6,000,PPP for all developing countries and US$1,300,PPP in low-income countries.2. This section is based on World Bank (forth-coming a).3. The fleet capacity index is the relationshipbetween the capacity of a fishing fleet to catcha particular quantity of fish and the quantity offish that it actually catches.4. Reducing Emissions from Deforestation andForest Degradation (REDD) is an effort to cre-ate a financial value for the carbon stored in
26
i n c lu s i v e G r e e n G r o w t h: t h e Pat h way to s u s ta i n a b l e D e v e lo Pm e n t
from Oil Refineries.”Review of Economics and Statistics83 (3): 498–510.Betz, R., and M. Sato. 2006. “Emissions Trading:Lessons Learnt from the First Phase of the EUETS and Prospects for the Second Phase.”Cli-mate Policy6 (4): 351–59.CMI (Center for Mediterranean Integration).2012. “Toward Green Growth in Mediter-ranean Countries: Implementing Policies toEnhance the Productivity of Natural Assets.”CMI, Marseille.Copeland, B. R. 2012. “International Trade andGreen Growth.” Paper presented at the GreenGrowth Knowledge Platform inaugural confer-ence, Mexico City, January 12–13.Dutz, M. A., and S. Sharma. 2012. “GreenGrowth, Technology, and Innovation.” PolicyResearch Working Paper 5932, World Bank,Washington, DC.Easterlin, R. A. 1995. “Will Raising the Incomeof All Increase the Happiness of All?”Journal of Economic Behaviour and Organization27:35–47.Ellerman, A. D., F. Convery, and C. de Perthuis.2010.Pricing Carbon.Cambridge, U.K.: Cam-bridge University Press.FAO (Food and Agriculture Organization ofthe United Nations). 2010. “Global ForestResources Assessment 2010: Main Report.”FAO Forestry Paper 163, FAO, Rome.Fay, M., A. Iimi, and B. Perrissin-Fabert. 2010.“Financing Greener and Climate ResilientInfrastructure in Developing Countries: Chal-lenges and Opportunities.”EIB Papers15 (2):35–59.Ferreira, F. H. G., and M. Ravallion. 2009. “Pov-erty and Inequality: The Global Context.” InOxford Handbook of Economic Inequality,ed. B. Nolan, W. Salverda, and T. Smeeding,ch. 24. Oxford: Oxford University Press.Foresight. 2011.The Future of Food and Farm-ing: Final Project Report.London: Govern-ment Office for Science.Gillingham, K., R. Newell, and K. Palmer. 2009.“Energy Efficiency Economics and Policy.”Annual Review of Resource Economics1:597–619.Global Partnership for Financial Inclusion. 2011.“Report to the Leaders of the G20.” G20,Can nes. ht tp: //w w w.mofa.go.jp/polic y/economy/g20_summit/2011/pdfs/annex06.pdf.Graff Zivin, J. S., and M. J. Neidell. 2011. “TheImpact of Pollution on Worker Productivity.”NBER Working Paper 17004, National Bureauof Economic Research, Cambridge, MA.
Greene, D. L. 2010. “How Consumers Value FuelEconomy: A Literature Review.” EPA–420–R–10– 008, U.S. Environmental ProtectionAgency, Washington, DC.Guillaume, D., R. Zytek, and M. R. Farzin. 2011.“Iran: The Chronicles of the Subsidy Reform.”IMF Working Paper WP 11/167, InternationalMonetary Fund, Washington, DC.Hallegatte, S. 2011. “How Economic Growth andRational Decisions Can Make Disaster LossesGrow Faster Than Wealth.” Policy ResearchWorking Paper 5617, World Bank, Washing-ton, DC.Hardisty, D. H., E. J. Johnson, and E. U. Weber.2010. “A Dirty Word or a Dirty World? Attri-bute Framing, Political Affiliation, and QueryTheory.”Psychological Science21 (1): 86–92.IEA (International Energy Agency). 2008.World Energy Outlook.Paris: IEA.———. 2011.World Energy Outlook.Paris: IEA.IFC (International Finance Corporation). 2011.“Sustainable Energy Finance: Innovative Con-cessional Finance with Financial Intermediar-ies.” IFC, Washington, DC.ILO (International Labour Organization) andCEDEFOP (European Centre for the Develop-ment of Vocational Training). 2011.Skills for Green Jobs: A Global View.Geneva: ILO.I UCN (International Union for Conserva-tion of Nature). 2009.Extinction Crisis Continues Apace. Gland: I UCN. http://w w w.iuc n .or g / k nowle d ge /ne w s / ?4143/Extinction-crisis-continues-apace.Laffoley, D. d’A., and J. M. Baxter, eds. 2009.“Ocean Acidification: The Facts; A SpecialIntroductory Guide for Policy Advisers andDecision Makers.” Ocean Acidification Refer-ence User Group, European Project on OceanAcidification.Layard, R. 2005.Happiness: Lessons from a New Science.London: Penguin Press.Loulou, R., and M. Labriet. 2008. “ETSAP-TIAM: The TIMES Integrated AssessmentModel Part I: Model Structure.”Computa-tional Management Science 5(1, special issue:Managing Energy and the Environment):41–66.Luderer, G., R. Pietzcker, E. Kriegler, M. Haller,and N. Bauer. 2012. “Asia’s Role in Mitigat-ing Climate Change: A Technology and Sec-tor Specific Analysis with ReMIND-R.”Preprint.Madsen, B., N. Carroll, D. Kandy, and G. Ben-nett. 2011. “Update: State of Biodiversity Mar-kets.” Forest Trends, Washington, DC.
overview
27
Marglin, S. 2010. “What’s Wrong with UnlimitedGrowth?” Department of Economics, HarvardUniversity, Cambridge, MA.Martin, R., U. J. Wagner, and L. B. de Preux.2009. “The Impacts of the Climate ChangeLevy on Business: Evidence from Microdata.”CEP Discussion Paper, Centre for EconomicPerformance, London School of Economics,London, U.K.McKinsey and Company. 2011. “Resource Revo-lution: Meeting the World’s Energy, Materials,Food, and Water Needs.” McKinsey GlobalInstitute.MDB (Multilateral Development Banks) WorkingGroup on Climate Finance. 2011. “MobilizingClimate Finance” Paper prepared at the requestof G20 Finance Ministers. http://climatechange.worldbank.org/content/mobilizing-climate-finance.MDB (Multilateral Development Banks) WorkingGroup on Infrastructure. 2011. “SupportingInfrastructure in Developing Countries.” Papersubmitted to the G20.MEA (Millennium Ecosystem Assessment). 2005.Ecosystems and Human Well-being: Synthe-sis. Washington,DC: Island Press.Milanovic, B. 2010. “Global Inequality Recal-culated and Updated: The Effect of New PPPEstimates on Global Inequality and 2005 Esti-mates.”Journal of Economic Inequality.DOI10.1007/s10888-010-9155-y.Myers, N., and J. Kent. 2001. “Perverse Subsidies:How Tax Dollars Can Undercut the Environ-ment and the Economy.” International Insti-tute for Sustainable Development, Winnipeg.Nidumolu, R., C. K. Prahalad, and M. R. Ran-gaswami. 2009. “Why Sustainability Is Nowthe Key Driver of Innovation.”Harvard Busi-ness Review87 (9, September): 56–64.OECD (Organisation for Economic Co-operationand Development). 2011a.Agricultural Pol-icy Monitoring and Evaluation 2011.Paris:OECD.———. 2011b.Towards Green Growth.Paris:OECD.Picherta, D., and K. V. Katsikopoulos. 2008.“Green Defaults: Information Presentationand Pro-Environmental Behaviour.”Journal of Environmental Psychology28: 63–73.Pimm, S. L., G. J. Russell, J. L. Gittleman, andT. M. Brooks. 1995. “The Future of Biodiver-sity.”Science269 (5222): 347–50.Quirion, P. 2011. “Les quotas échangeables d’émis-sion de gaz à effet de serre: Éléments d’ana-lyse économique.” Mémoire d’Habilitation à
diriger les recherches, Ecole des Hautes Étudesen Sciences Sociales, Paris.Rozenberg, J., S. Hallegatte, A. Vogt-Schilb, O.Sassi, C. Guivarch, H. Waisman, and J-CHourcade. 2010. “Climate Policies as a Hedgeagainst the Uncertainty on Future Oil Supply:A Letter.”Climatic Change Letters101 (3):663–69.Sartor, O. 2012. “Carbon Leakage in the PrimaryAluminium Sector: What Evidence after 6½Years of the EU ETS?” CDC Climat ResearchWorking Paper 2012-12, Caisse des Dépots,Toulouse.Thaler, R., and C. Sunstein. 2008.Nudge.NewHaven, CT: Yale University Press.Transport for London. 2008. “Central LondonCongestion Charging Impacts Monitoring:Sixth Annual Report, July 2008.” Mayor ofLondon, London. http://www.tfl.gov.uk/assets/downloads/sixth-annual-impacts-monitoring-report-2008-07.pdf.Tversky, A., and D. Kahneman. 1992. “Advancesin Prospect Theory: Cumulative Represen-tation of Uncertainty.”Journal of Risk and Uncertainty5: 297–323.Tversky, A., and E. Shafir. 1992. “The Disjunc-tion Effect in Choice under Uncertainty.”Psy-chological Science3 (5): 305–09.U N EP (United Nations Environment Pro-gramme). 2011.Towards a Green Economy: Pathways to Sustainable Development and Poverty Eradication.Geneva: UNEP. http://www.unep.org/greeneconomy.UNEP (United Nations Environment Programme)and Bloomberg New Energy Finance. 2011.Global Trends in Renewable Energy Invest-ment 2011.Nairobi: UNEP.UNESCO (United Nations Educational Scien-tific and Cultural Organization) and WWAP(World Water Assessment Program). 2006.“Water: A Shared Responsibility.” UnitedNations World Water Development Report2, UNESCO, Paris. http://www.unesco.org/water/wwap/wwdr/wwdr2/table_contents.shtml.Van Vliet, O., K. Volker, D. McCollum, S.Pachauri, Y. Nagai, S. Rao, and K. Riahi.Forthcoming 2012. “Synergies in the AsianEnergy System: Climate Change, Energy Secu-rity, Energy Access and Air Pollution.”Energy Economics,in press. Published online Febru-ary 14, 2012.Victor, P. A. 2008.Managing without Growth: Slower by Design, Not Disaster. Cheltenham,U.K.: Edward Elgar.
28
i n c lu s i v e G r e e n G r o w t h: t h e Pat h way to s u s ta i n a b l e D e v e lo Pm e n t
Wang, X., N. Berrah, S. Mathur, and F. Vinuya.2010.Winds of Change: East Asia’s Sustain-able Energy Future.Washington, DC: WorldBank.World Bank. 2004. “Tunisia Country Environ-mental Analysis (1992.2003).” Report 25966-TN, World Bank, Washington, DC.———. 2005a. “Arab Republic of Egypt CountryEnvironmental Analysis (1992.2002).” Report31993-EG, World Bank, Washington, DC.———. 2005b. “China: Second Loess PlateauWatershed Rehabilitation Project.” Implemen-tation Completion and Results Report 34612,World Bank, Washington, DC.———. 2006a. “Republic of Bangladesh CountryEnvironmental Analysis.” Report 36945-BD,World Bank, Washington, DC.———. 2006b. “Republic of Colombia: Miti-gating Environmental Degradation to Fos-ter Growth and Reduce Inequality.” Report36345-CO, World Bank, Washington, DC.———. 2006c. “Republic of El Salvador CountryEnvironmental Analysis: Improving Environ-mental Management to Address Trade Liberal-ization and Infrastructure Expansion.” Report35226-SV, World Bank, Washington, DC.———. 2006d. “Republic of Guatemala CountryEnvironmental Analysis: Addressing the Envi-ronmental Aspects of Trade and InfrastructureExpansion.” Report 36459-GT, World Bank,Washington, DC.———. 2006e. “Nigeria Rapid Country Environ-mental Analysis (CEA).” World Bank, Wash-ington, DC.———. 2006f. “Pakistan Country Environmen-tal Analysis.” Report 36946-PK, World Bank,Washington, DC.———. 2007a. “Ghana Country EnvironmentalAnalysis.” Report 36985-GH, World Bank,Washington, DC.———. 2007b. “Nepal Country EnvironmentalAnalysis: Strengthening Institutions and Man-agement Systems for Enhanced EnvironmentalGovernance.” Report 38984-NP, World Bank,Washington, DC.———. 2007c. “Republic of Peru EnvironmentalSustainability: A Key to Poverty Reduction inPeru.” Report 40190-PE, World Bank, Wash-ington, DC.———. 2008. “Tajikistan Country Environmen-tal Analysis.” Report 43465-TJ, World Bank,Washington, DC.———. 2009. “Hashemite Kingdom of JordanCountry Environmental Analysis.” Report47829-JO, World Bank, Washington, DC.
———. 2010a. “Central African Republic Coun-try Environmental Analysis: EnvironmentalManagement for Sustainable Growth.” WorldBank, Washington, DC.———. 2010b. “The Cost of Environmental Deg-radation Case Studies from the Middle Eastand North Africa.” Report 56295, WorldBank, Washington, DC.———. 2010c. “République du Bénin AnalyseEnvironnementale Pays.” Report 58190-BJ,World Bank, Washington, DC.———. 2010d.World Development Report: Development and Climate Change.Washing-ton, DC: World Bank.———. 2011a. “Republic of Lebanon CountryEnvironmental Analysis.” Report 62266-LB,World Bank, Washington, DC.———. 2011b. “South Africa: Economic Update;Focus on Green Growth.” World Bank, Wash-ington, DC.———. 2011c. World Development Indicators.Washington, DC: World Bank.———. Forthcoming a.How Environment Sus-tains Development: The World Bank Group Environment Strategy; Toward a Green, Clean, and Resilient World for All.Washington, DC:World Bank.———. Forthcoming b.Maximizing Leverage of Public Funds to Unlock Commercial Financ-ing for Clean Energy in East Asia.Washing-ton, DC: World Bank.World Bank and DRC (Development ResearchCenter of the State Council, China). 2012.“Seizing the Opportunity of Green Develop-ment in China.” Supporting Report 3 forChina 2030: Building a Modern Harmonious, and Creative High-Income Society.Wash-ington, DC: World Bank. http://www-wds.worldbank.org/external/default/WDSContentServer/ WDSP/ IB/2012/02/28/000356161_20120228001303/ Rendered / PDF/671790WP0P127500China020300complete.pdf.World Bank and FAO (Food and AgricultureOrganization). 2009. “The Sunken Billions:The Economic Justification for FisheriesReform.” World Bank, Washington, DC; Foodand Agricultural Organization, Rome.World Bank and PPIAF (Public-Private Infra-structure Advisory Facility). 2012. Private Par-ticipation in Infrastructure Database. WorldBank, Washington, DC. http://ppi.worldbank.org/.
http://publications.worldbank.org/booksellers