Transportudvalget 2011-12
TRU Alm.del Bilag 144
Offentligt
2012-01-06
Stockholm Congestion ChargeDaniel FirthCity of Stockholm Traffic Administration
2012-01-06
Congestion chargingStudied since 1960sFirst plan in 1990sSep 2002: General electionJune 2003: City council votes toimplement a trialJune 2004: New lawJuly 2004: Contract awardedMarch 2005: Appeal rejectedJanuary 2006: Charging starts
2012-01-06
Improved public transport 22 Aug 2005New park-and-ride sites Autumn 2005Congestion charging 3 Jan-31 July 2006Referendum 17 Sept 2006
Aim: 10 - 15 % less traffic to/from inner cityAim: increased accessibilityAim: decreased emissions and pollutants
Aim: improved urban environmentAim: more resources to local transport
2012-01-06
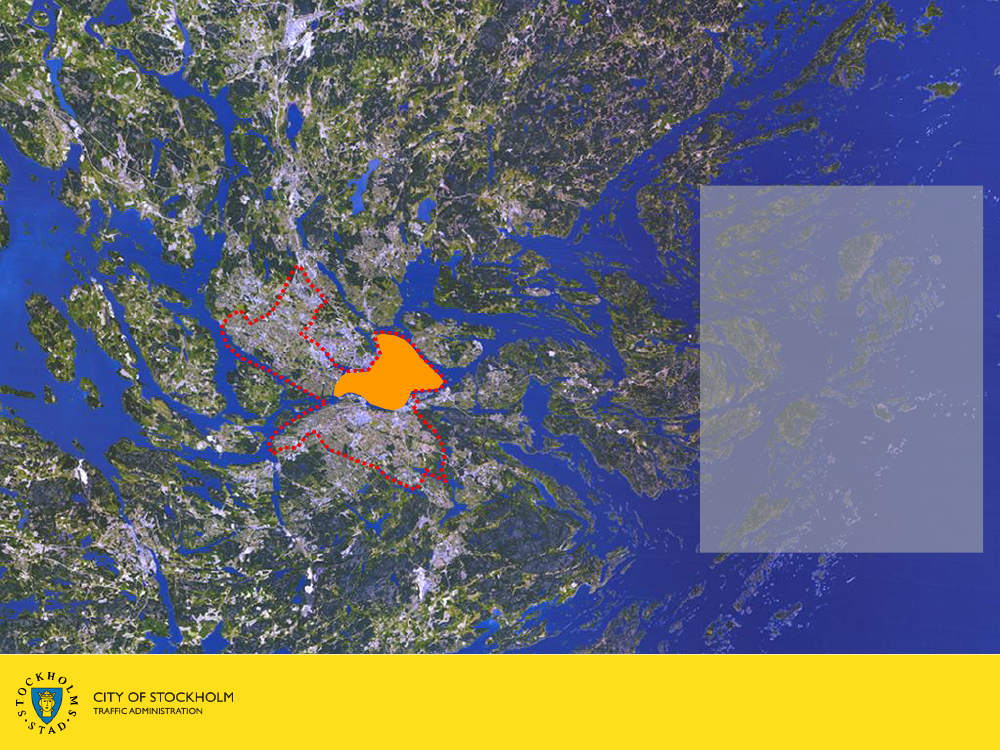
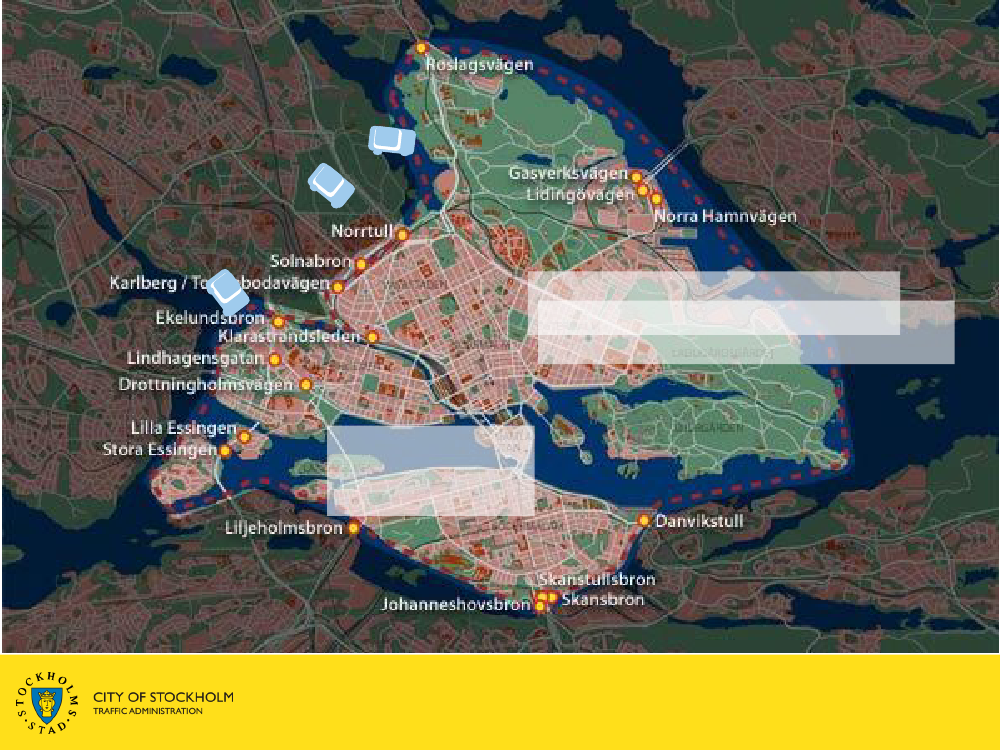
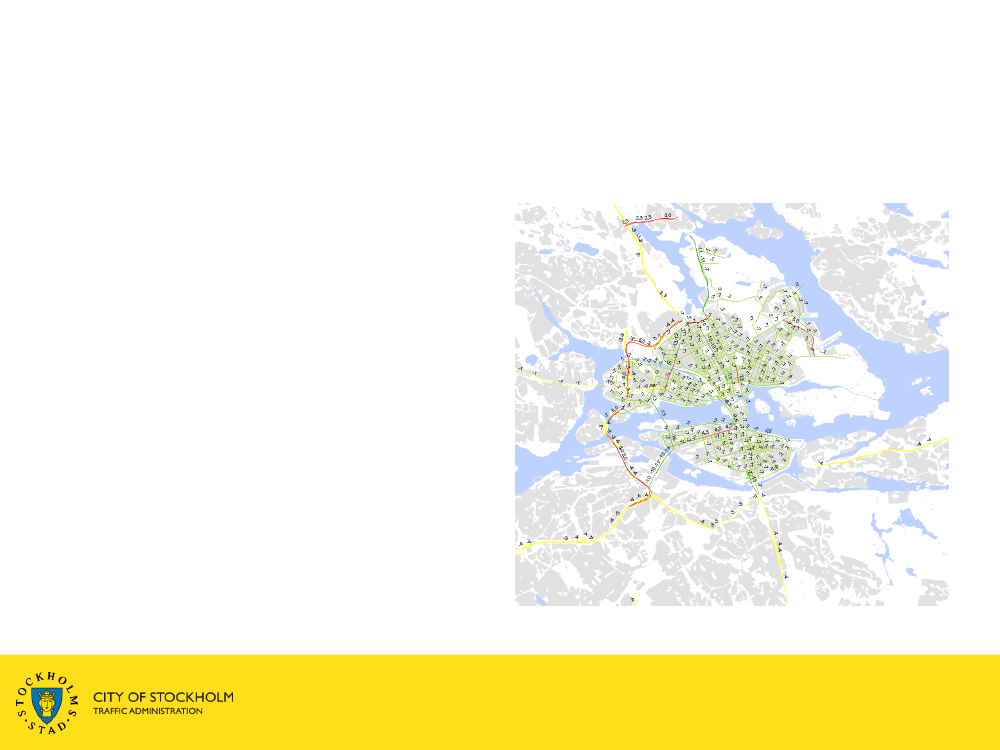
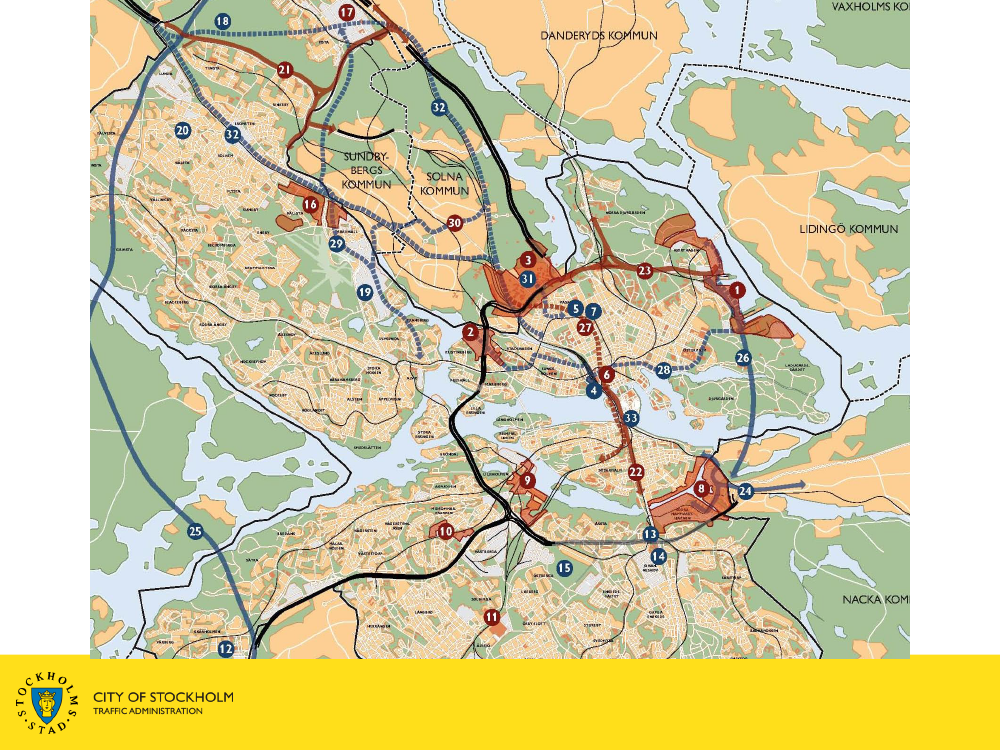
Congestion tax area:•40 km2•310 000 residents•360 000 jobs
The City of Stockholm•188 km2•850 000 residents•580 000 jobs
2012-01-06
2012-01-06
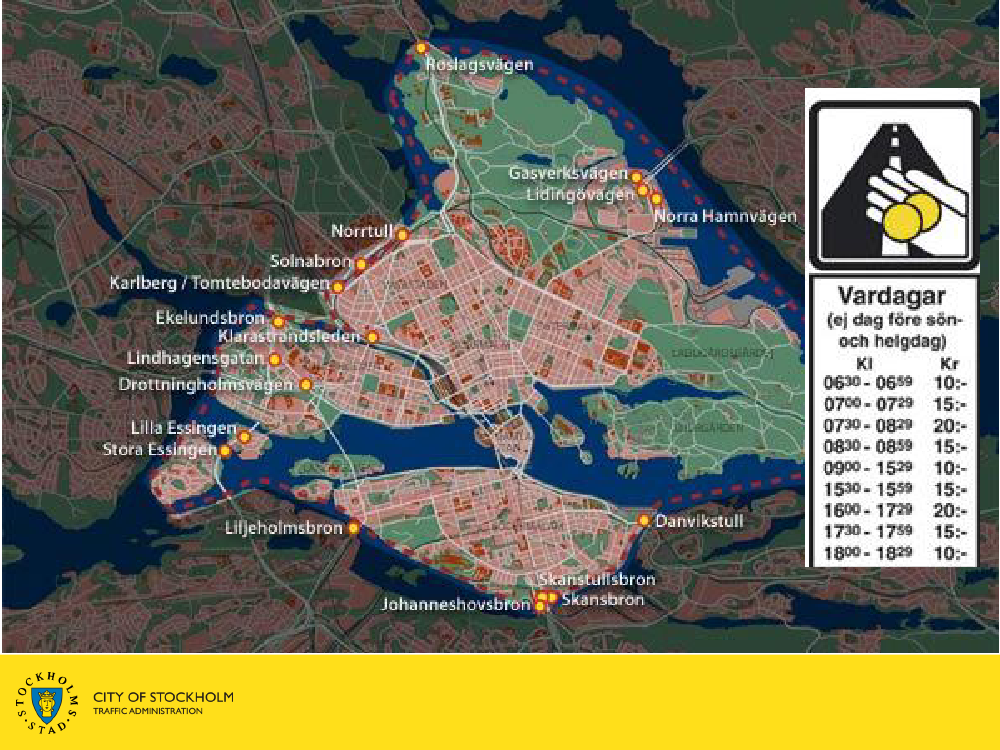
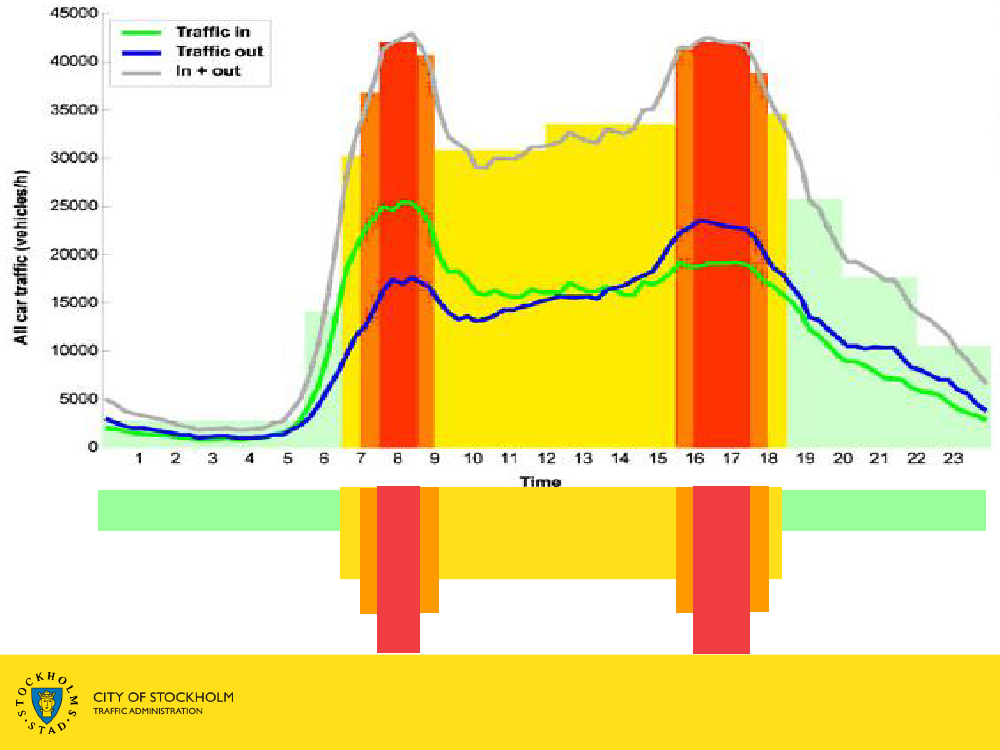
SEK0SEK10SEK15SEK20Max daily charge:SEK602012-01-06
2012-01-06
2012-01-06
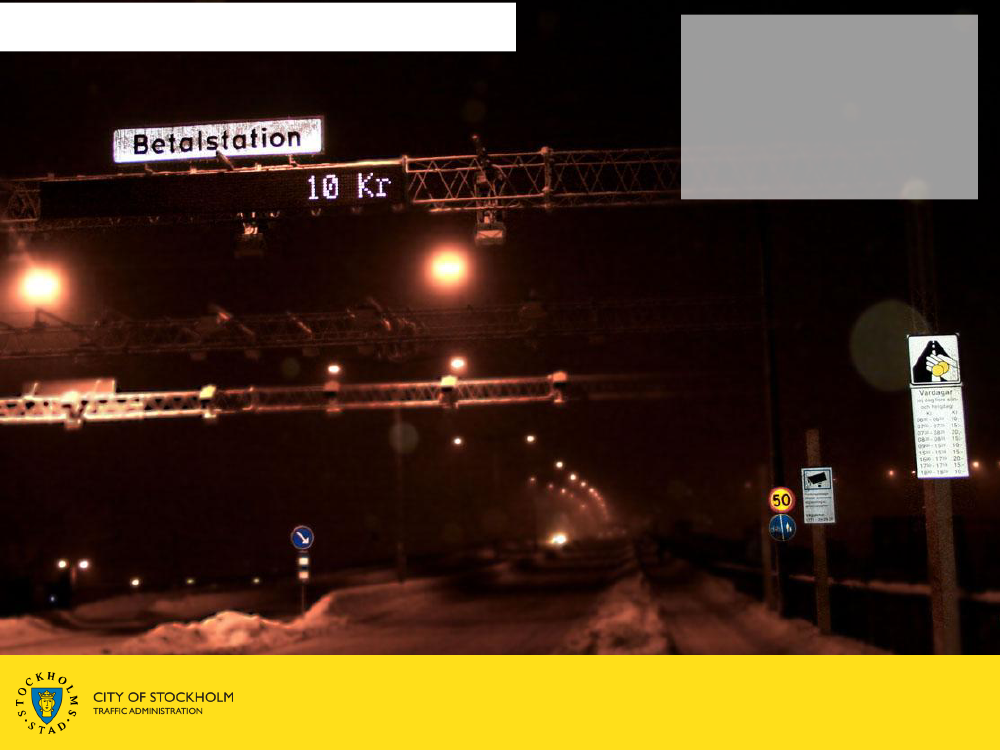
10 krJourneys crossing the cordoncost 10, 15 through the zone to or fromJourneys or 20 SEK 06:30-18:30Lidingö are exempted
Journeys onEssingeleden areexempted
10 kr
2012-01-06
2012-01-06
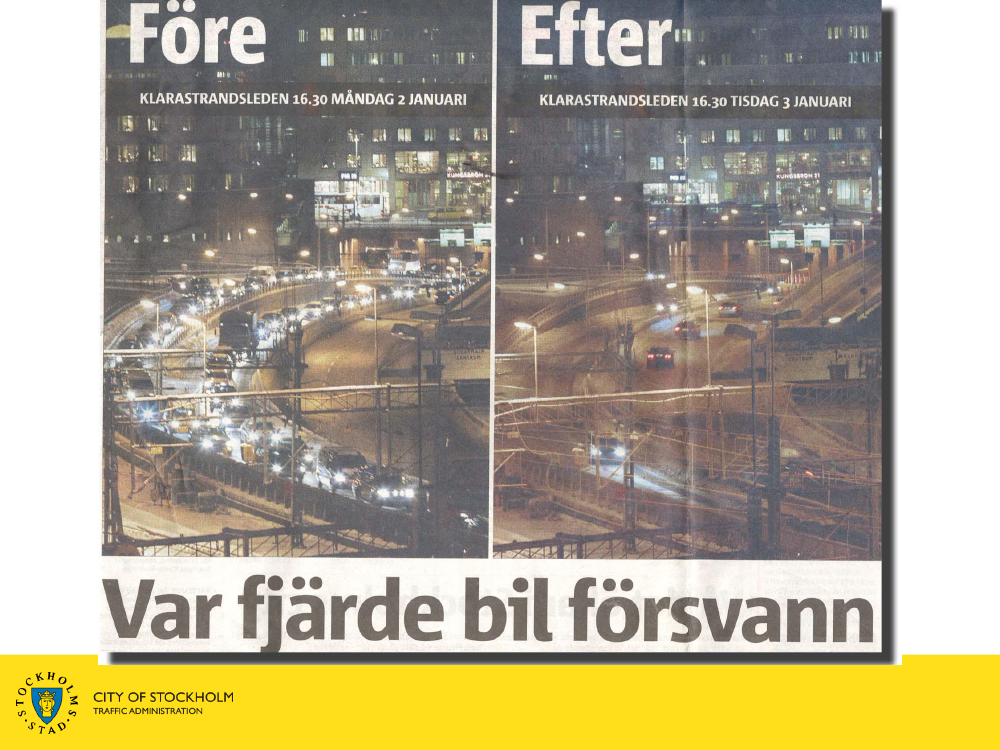
First day – January 3 2006
Passages over thecharging cordon de-creased by 25 percent compared tothe previous day
2012-01-06
Aim: 10 - 15 % less traffic to/from inner city– Result: 18-20%Aim: increased accessibilityAim: decreased emissions and pollutants
Aim: improved urban environmentAim: More resources to local transport
2012-01-06
Aim: 10 - 15 % less traffic to/from inner city– Result: 18-20%Aim: increased accessibility– Queue times down 30-50% in/near the inner cityAim: decreased emissions and pollutantsAim: improved urban environmentAim: More resources to local transport
2012-01-06
Aim: 10 - 15 % less traffic to/from inner city– Result: 18-20%Aim: increased accessibility– Queue times down 30-50% in/near the inner cityAim: decreased emissions and pollutants– 10-14% less in inner city; 2-3% in total countyAim: improved urban environmentAim: More resources to local transport
2012-01-06
Aim: 10 - 15 % less traffic to/from inner city– Result: 18-20%Aim: increased accessibility– Queue times down 30-50% in/near the inner cityAim: decreased emissions and pollutants– 10-14% less in inner city; 2-3% in total countyAim: improved urban environment– Unclear – difficult to define and measureAim: More resources to local transport
2012-01-06
Aim: 10 - 15 % less traffic to/from inner city– Result: 18-20%Aim: increased accessibility– Queue times down 30-50% in/near the inner cityAim: decreased emissions and pollutants– 10-14% less in inner city; 2-3% in total countyAim: improved urban environment– Unclear – difficult to define and measureAim: More resources to local transport– Net revenues of SEK660m (€66m) 2009
2012-01-06
Aim: 10 - 15 % less traffic to/from inner city– Result: 18-20%Aim: increased accessibility– Queue times down 30-50% in/near the inner cityAim: decreased emissions and pollutants– 10-14% less in inner city; 2-3% in total countyAim: improved urban environment– Unclear – difficult to define and measureAim: More resources to local transport– Net revenues of SEK660m (€66m) 2009No negative impacts for local commerce
2012-01-06
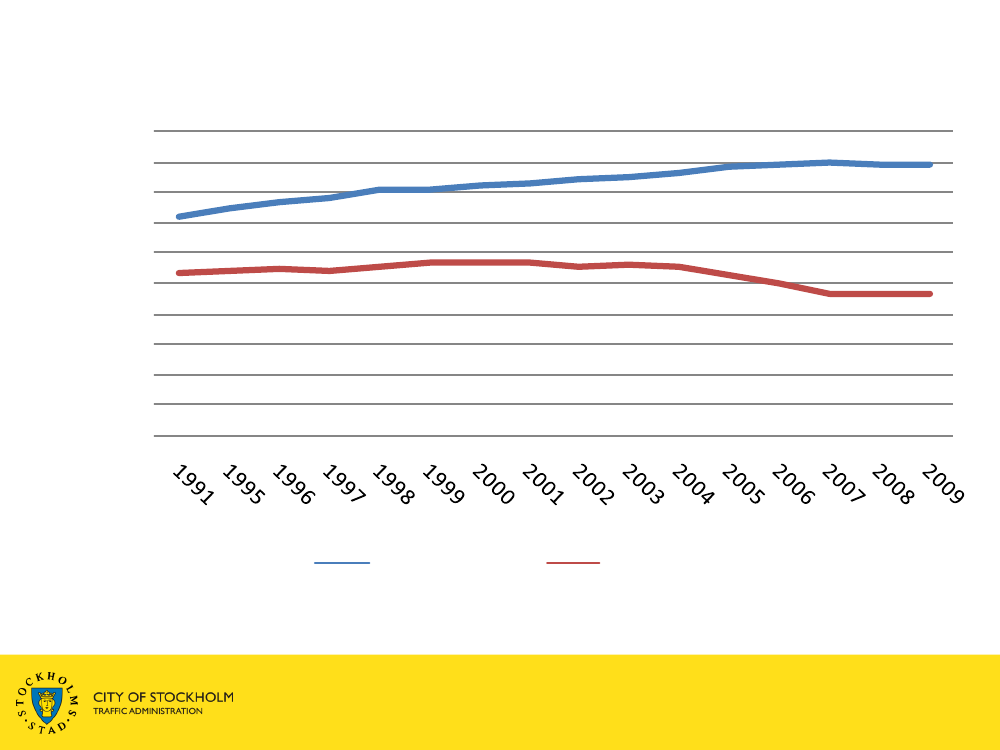
Trafikutvecklingen över regioncentrum och innerstadssnittet1 000 000900 000800 000700 000600 000500 000400 000300 000200 000100 0000
Regioncentrum
Innerstad
2012-01-06
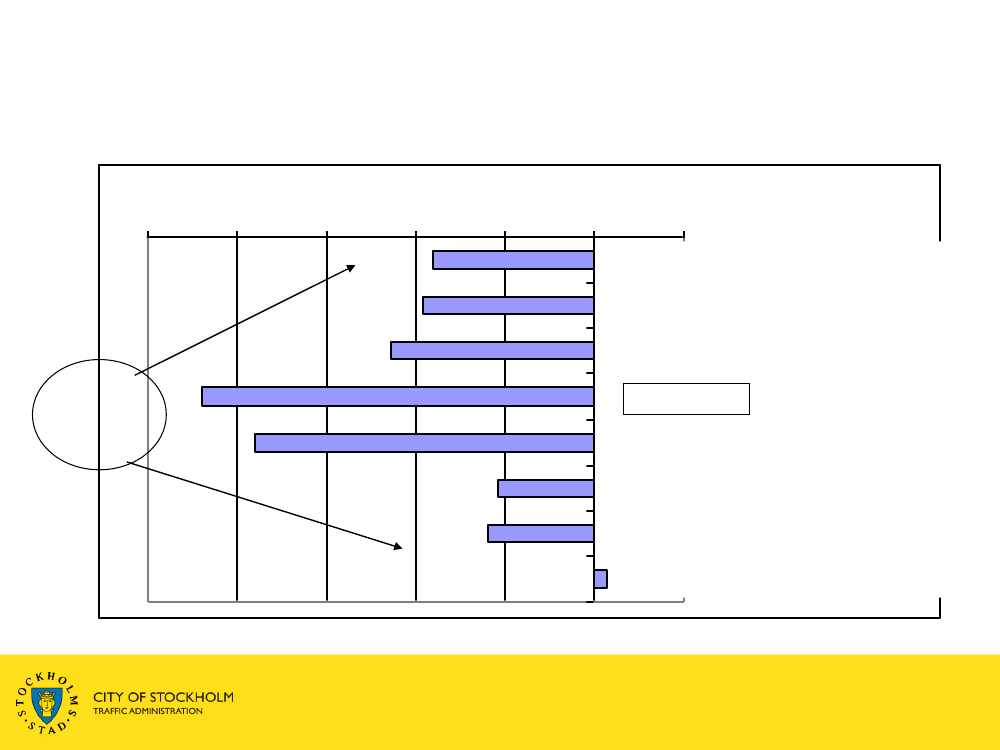
Less traffic also further out and inside the cordon
-25%
-20%
-15%
-10%
-5%
0%
5%InnerstadsgatorStreets insideInnerstadsgator,Streets inside, largestora
MainInnerstadslederroads insideDiluteddecreaseAvgiftssnittetCordon
InnerInre infartermain roadsOuterYttre infartermain roads
Streets, outsideYtterstadsgator”RingTvärlederroads”
30-50% less time in queues300%
Kötid, morgonrusning
Delay time, AM peak250%
fm 2005
fm 2006
200%
150%
100%
50%
0%inreinfartINinreinfartUTinnerstadsledNInnerInner maininnerstadsgataInner main roads,innerstadsledSroads,Inner mainInner mainstreetsnorthboundsouthboundroads, inboundroads, outbound
Less emissions improve healthEmissions are reduced in the”right” areaAccording to new findings, asmany as 30 premature deathscan be saved (app. 300 livingyears)Climate effects large for a singlemeasureOne step towards nationalclimate target
Inner city10-14% reductionCounty
2-3% reduction
Industry & commerceMarginal influence,compared to other factors,on:– land use,– real estate prices– regional economyNegligible effects on retailat aggregate levelInfluence on householdspurchasing powernegligible
2012-01-06
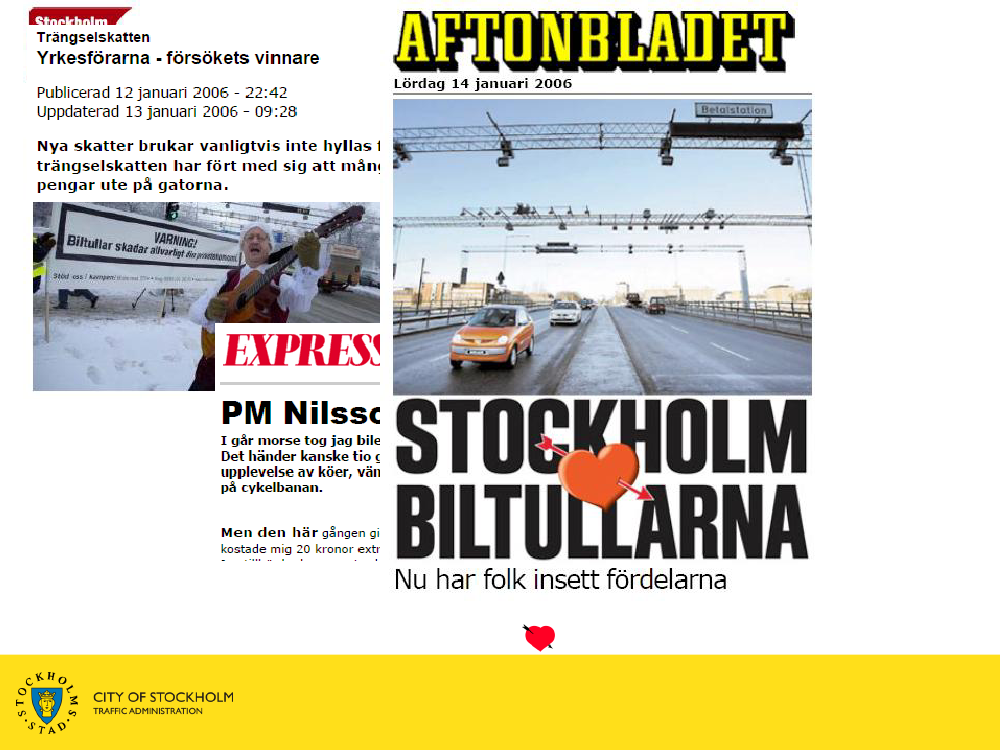
”Stockholm
the congestion tax”2012-01-06
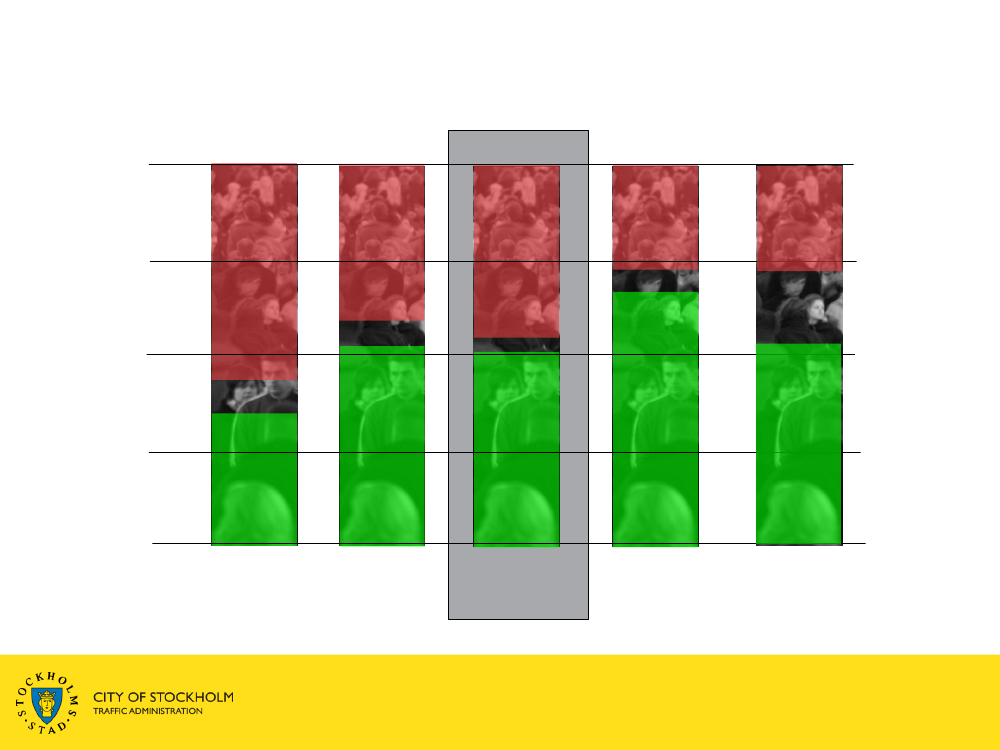
Public opinion towards the congestion tax100%Against75%50%
25%0%
For
2005 before 2006 end of2006the trialthe trialreferendum
Autumn2007
Autumn2010
2012-01-06
Did you change opinion during the trial?70%60%50%40%30%20%10%0%No changeMore positiveMore negative
Do you think that the congestion tax gives80%70%60%50%40%30%20%10%0%Less cogentionin/out from theinner cityLess congestionin the inner cityBetter air in theinner cityLess noiceBetter road safetyBetter publictransit
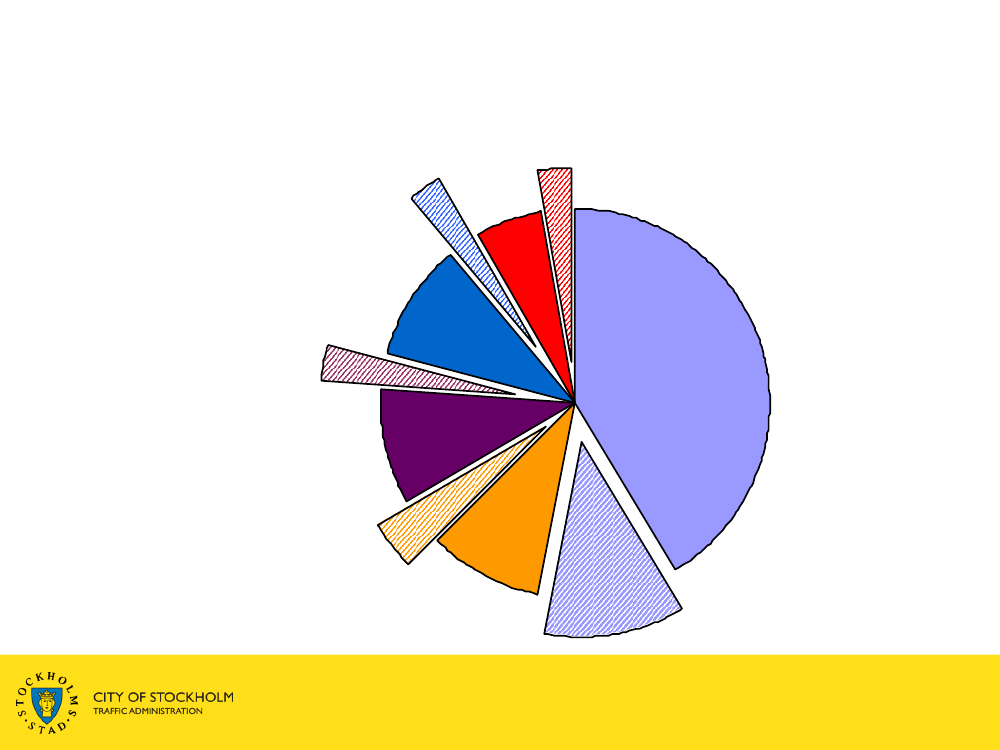
Which car trips disappeared?other -33%Spare time -23%
arbete/stjänste
arbete/stjänsteinköpinköpfritidfritidövrigt
Shoping -27%
service -30%Work/school -22%
övrigt
How many are affected by thecongestion tax?Many pay sometimes – few pay often– During two weeks 50 % of the car owners in greater Stockholmpaid at least once …– …but less than 5 % paid more than 100 SEK/2 weeks
A small group pays a large part
– 5 % of private cars pay more than 1/3 of the taxes
Who pays the most?People living inside the cordon– pay twice as much as people living outsideHigh income households– pay three times as much as lower income households
Employed people– pay three times as much as people not in employmentMen– pay twice as much as womenHouseholds with childrenortwo adults– pay 50% more than the rest (per person)
2012-01-06
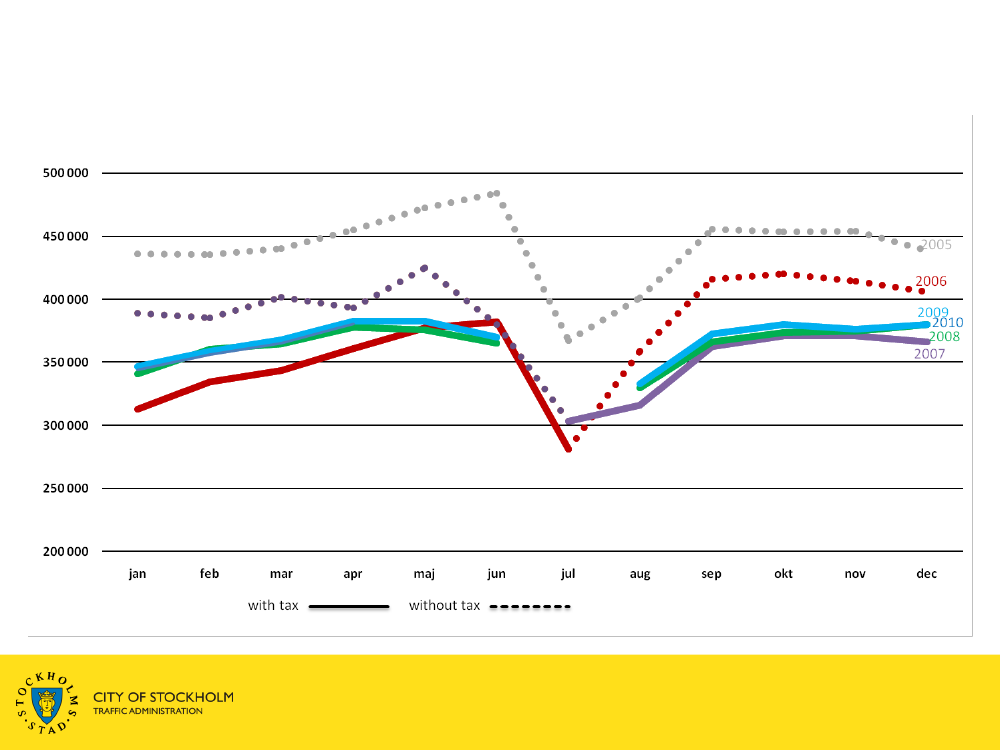
Vehicle passages over the tax cordon 06:00-19:00
2012-01-06
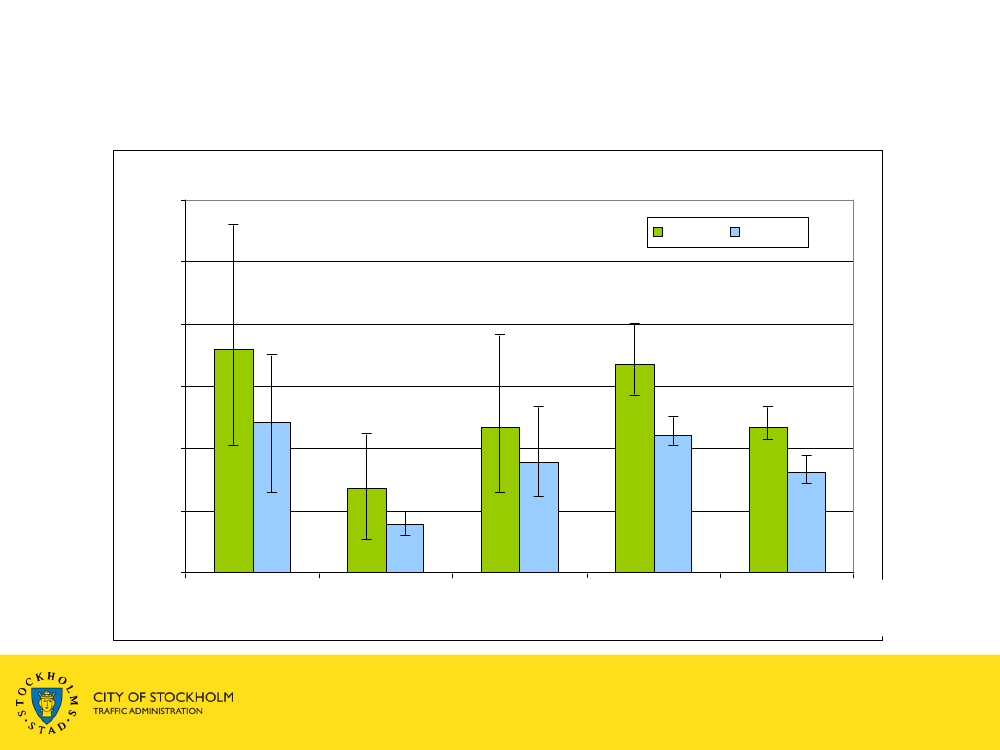
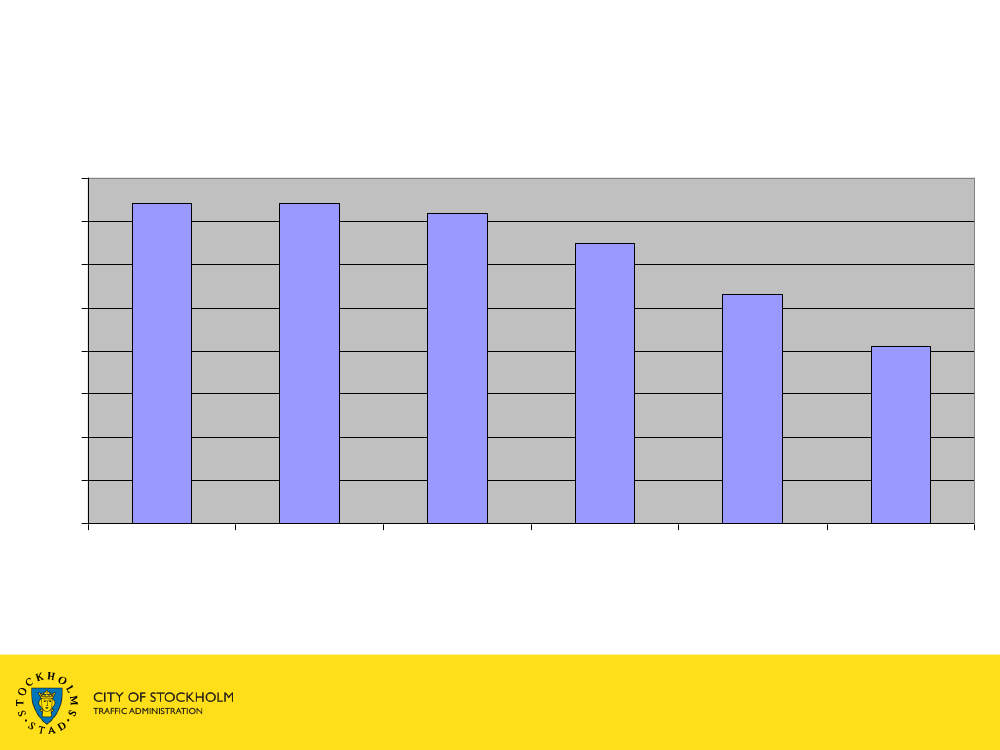
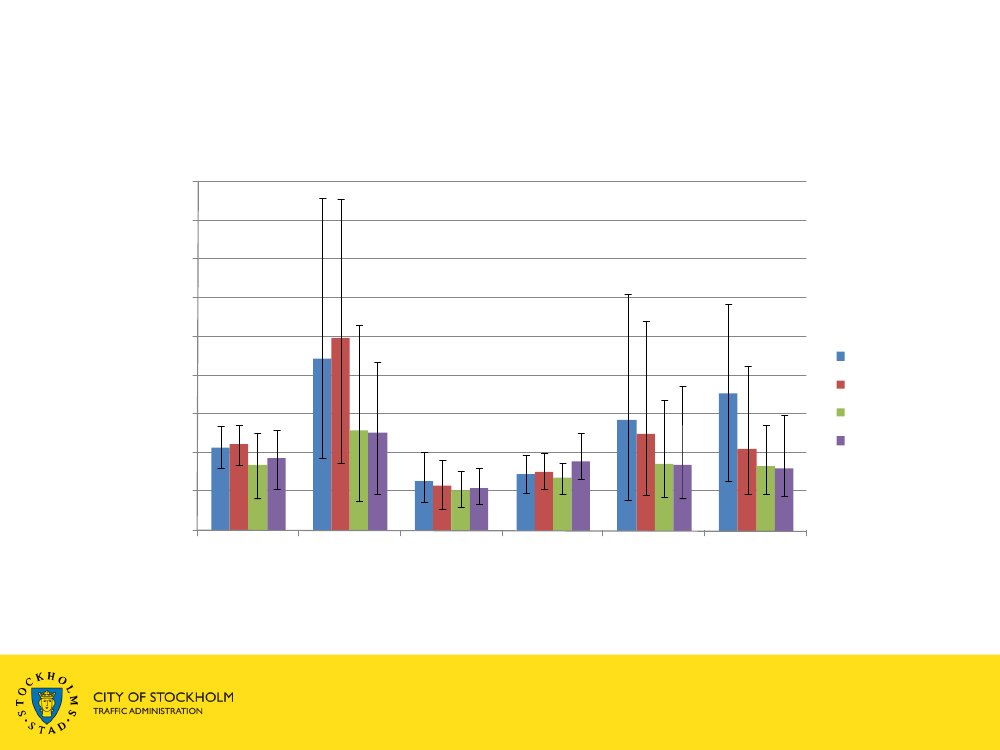
30-50% less time in queuesDelay time, AM peakSeptember-Oktober450%400%350%300%250%2005200%150%100%50%0%
Trängsel, morgonrusning
200620072008
Inner city
inner radialinbound
inner radialoutbound
orbital
outer radial outer radialoutboundinbound
2012-01-06
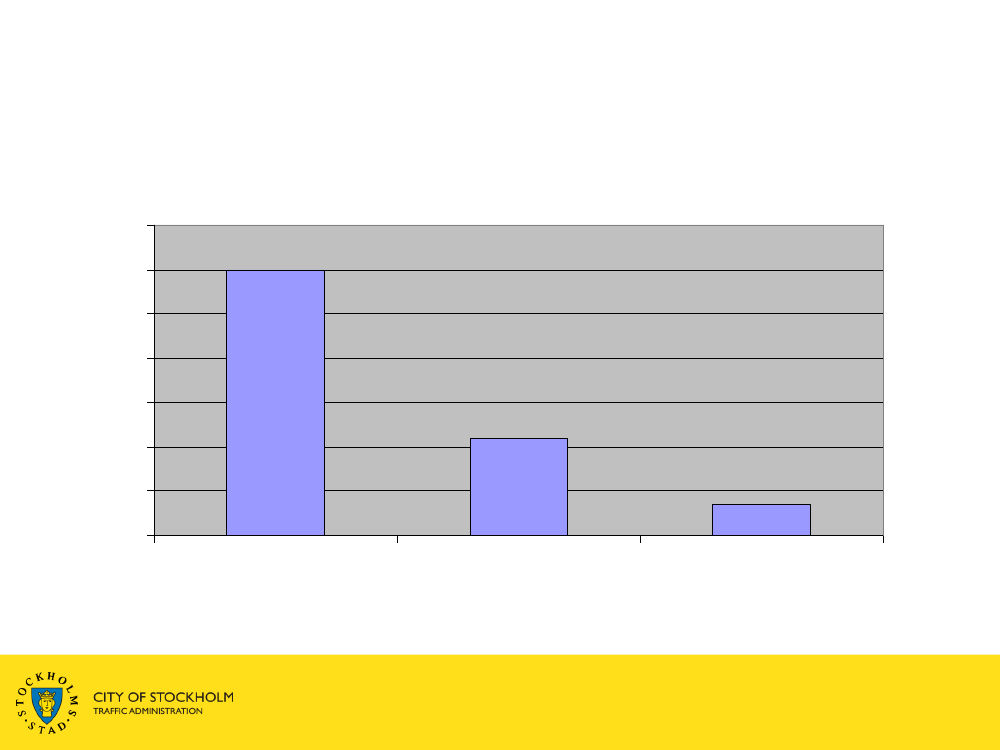
Costs for the trialCongestion tax: investmest,operation year 11900 mkrPublic transit1340 mkr––––Bus purchasesBus operationsPar & rideTrain operations580 mkr580 mkr70 mkr80 mkr
Road measures94 mkrInformation, evaluation etc 210 mkrTotal3500 mkr
Cost-benefit analysis of the congestion chargesShorter, more reliable travel timesPaid congestion chargesHealth and environmentTraffic safetyRevenues from congestion chargesOther revenues/costsMaintenance and running costsNet benefit590-76090120760190-220760mkr/yearmkr/yearmkr/yearmkr/yearmkr/yearmkr/yearmkr/yearmkr/year
Investment and running costs 2006Shadow prices etc.Total initial costPayback time: 4 years.
-2000 mkr-1100 mkr-3100 mkr
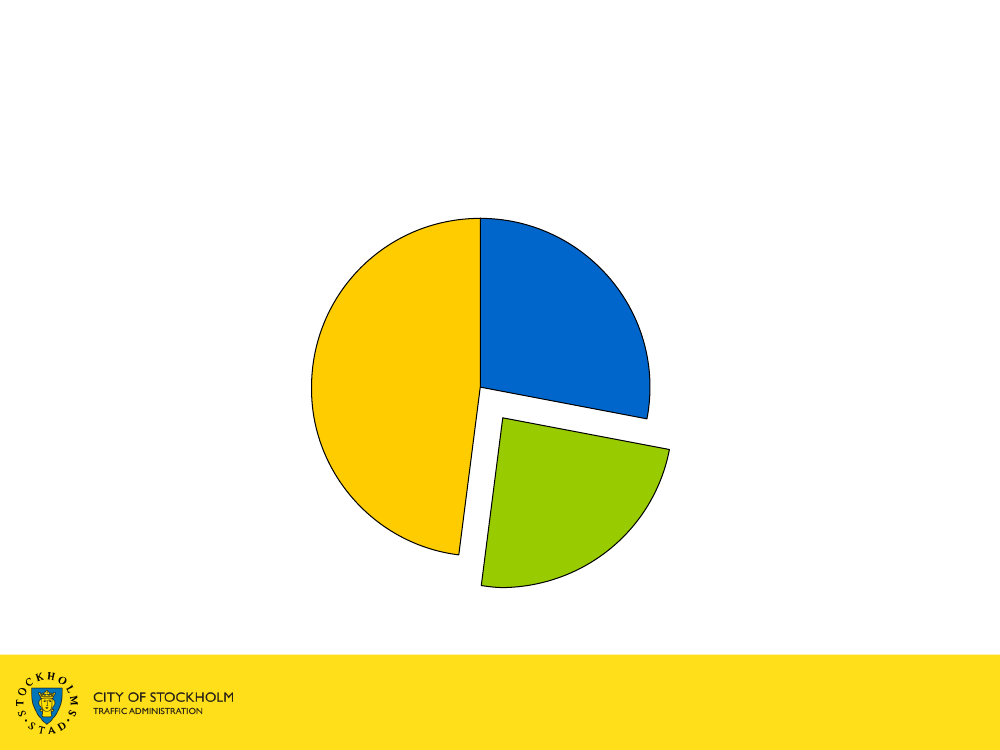
Infrastructure investment of 100 billion kronor(€10 billion) 2010-2020LocalgovernmentNationalgovernment
Congestion tax
2012-01-06
2012-01-06
2012-01-06
