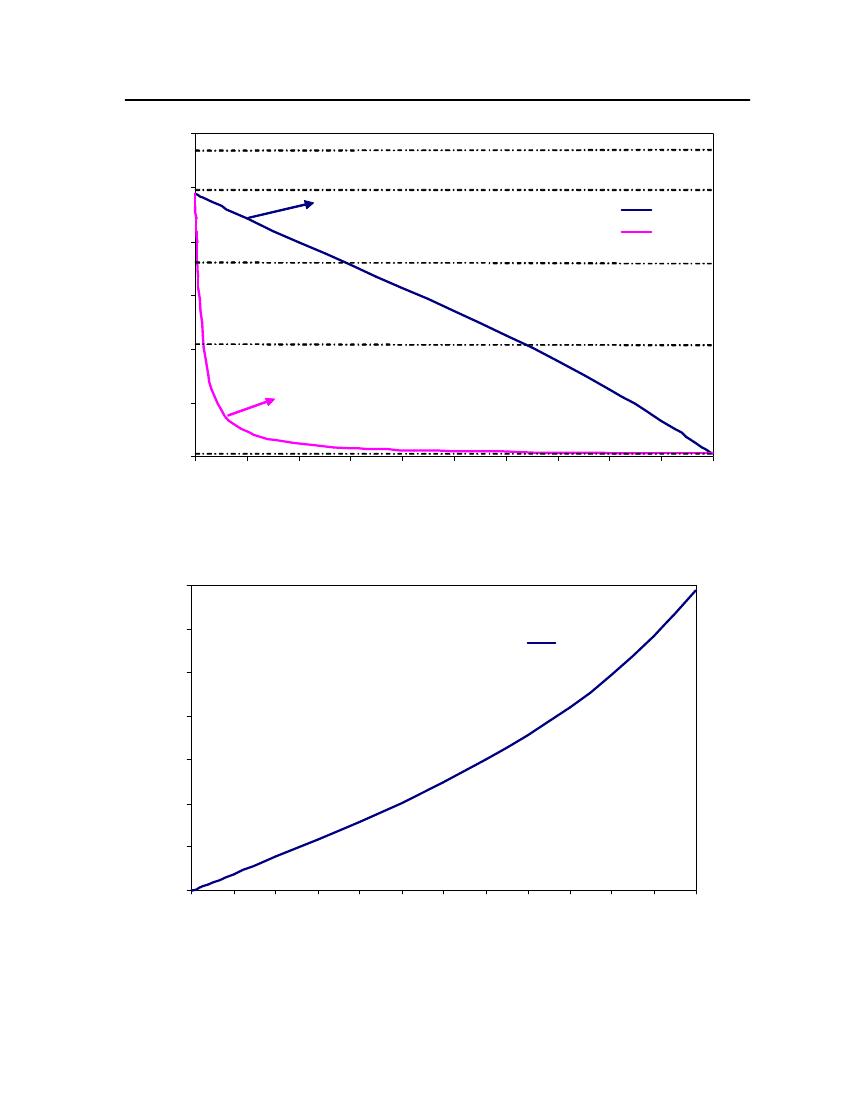
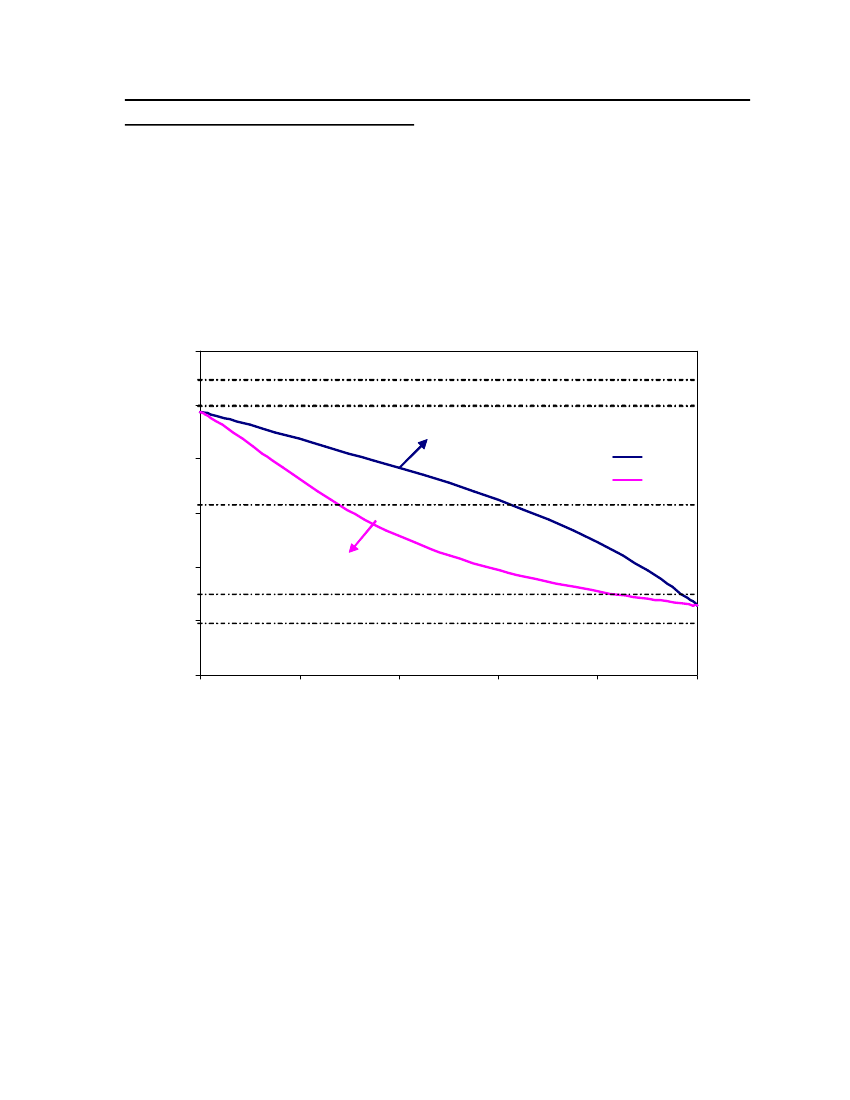
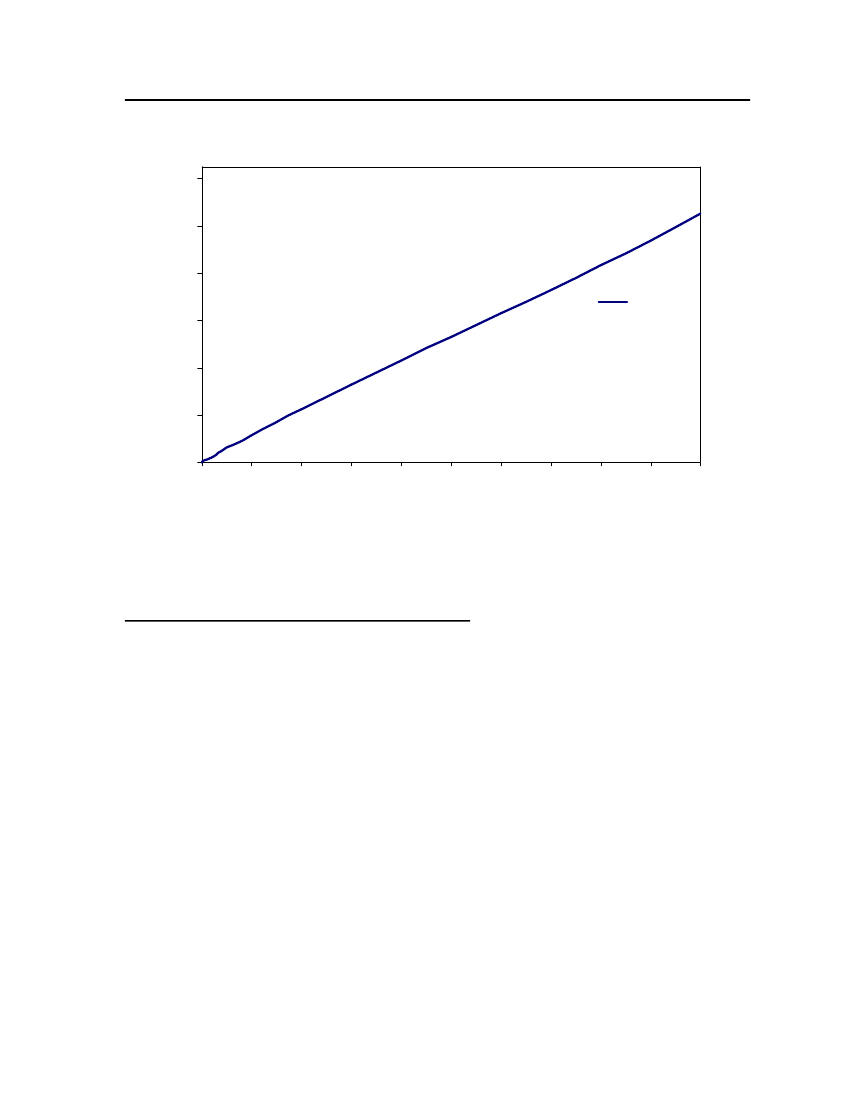
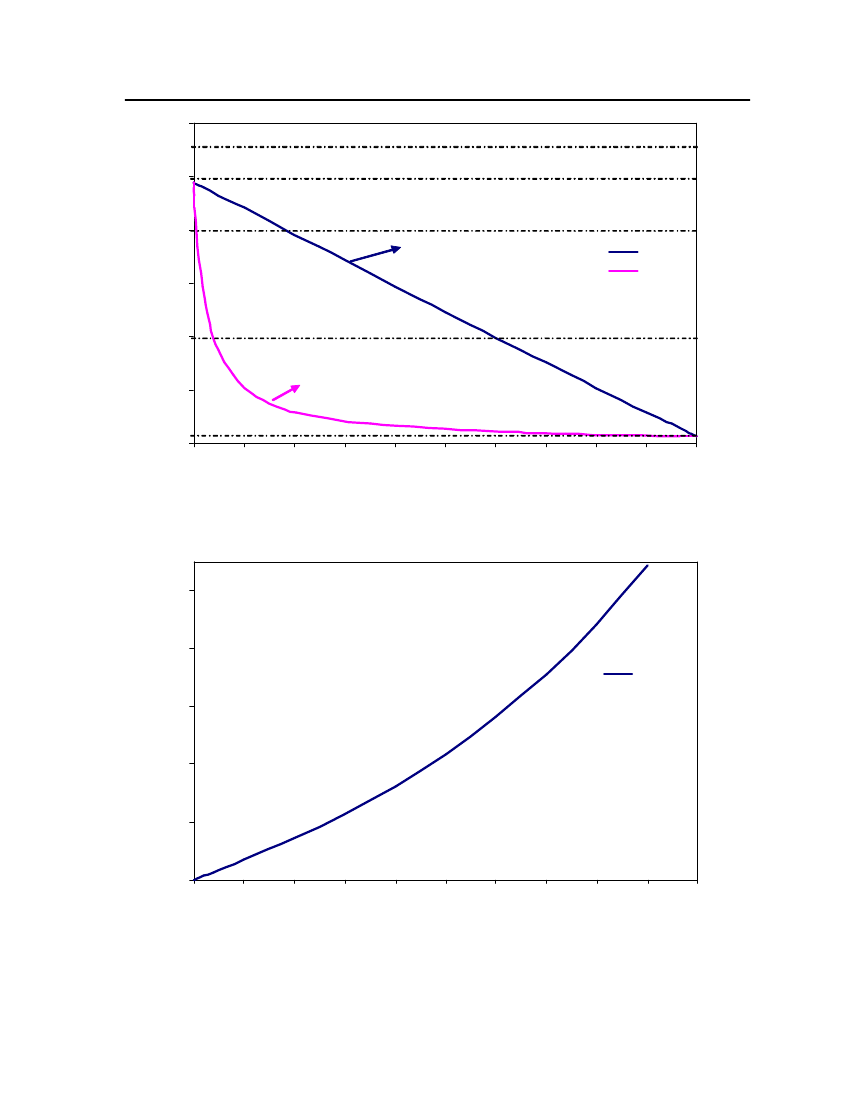
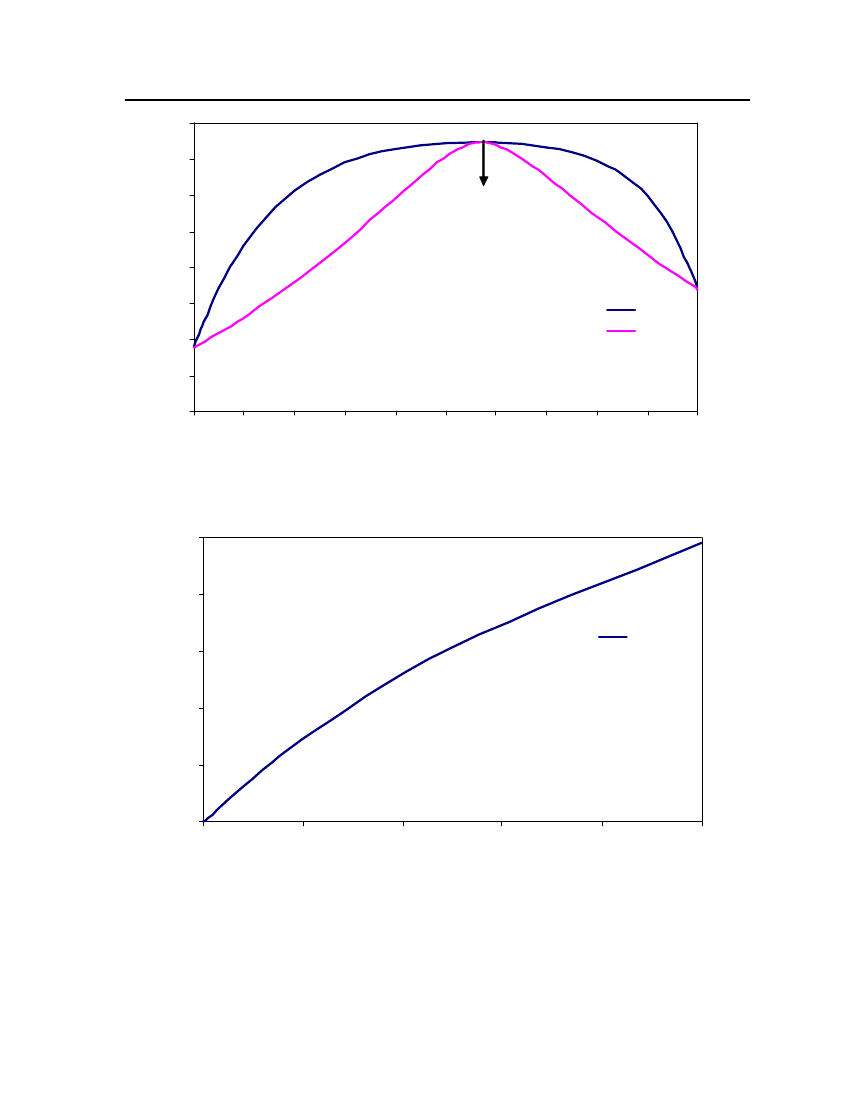
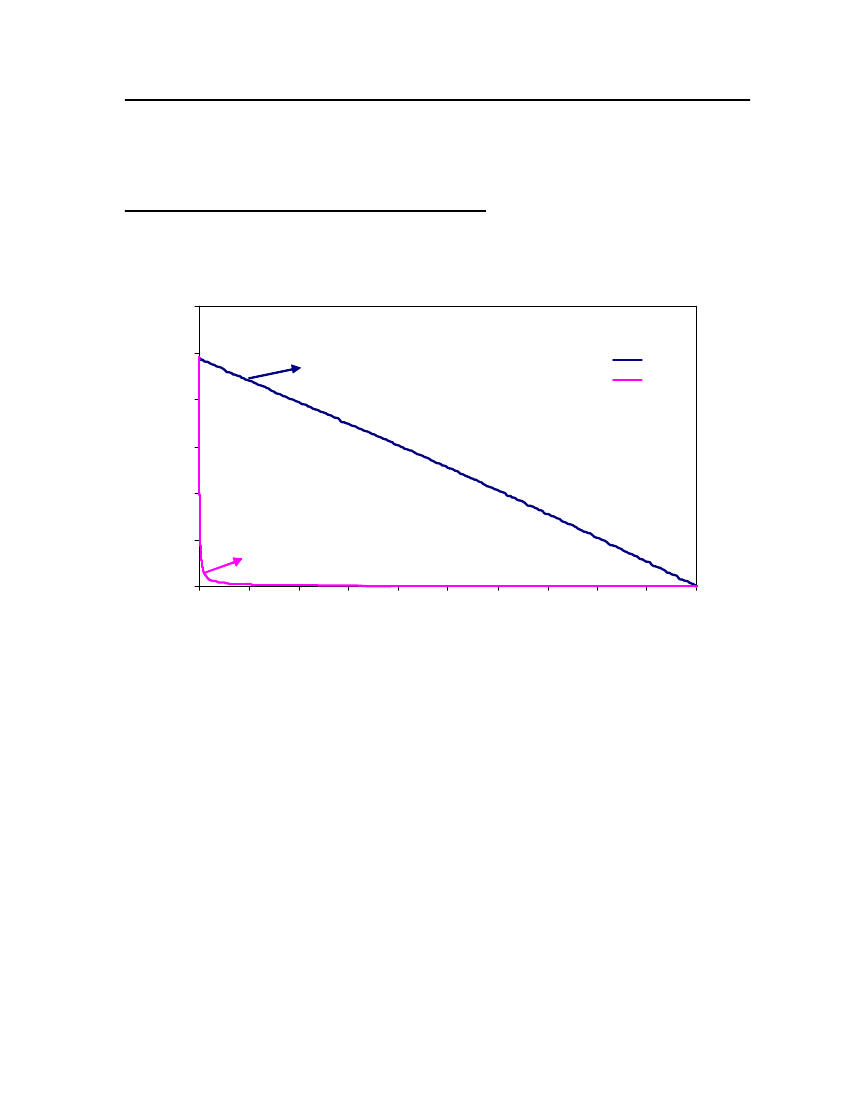
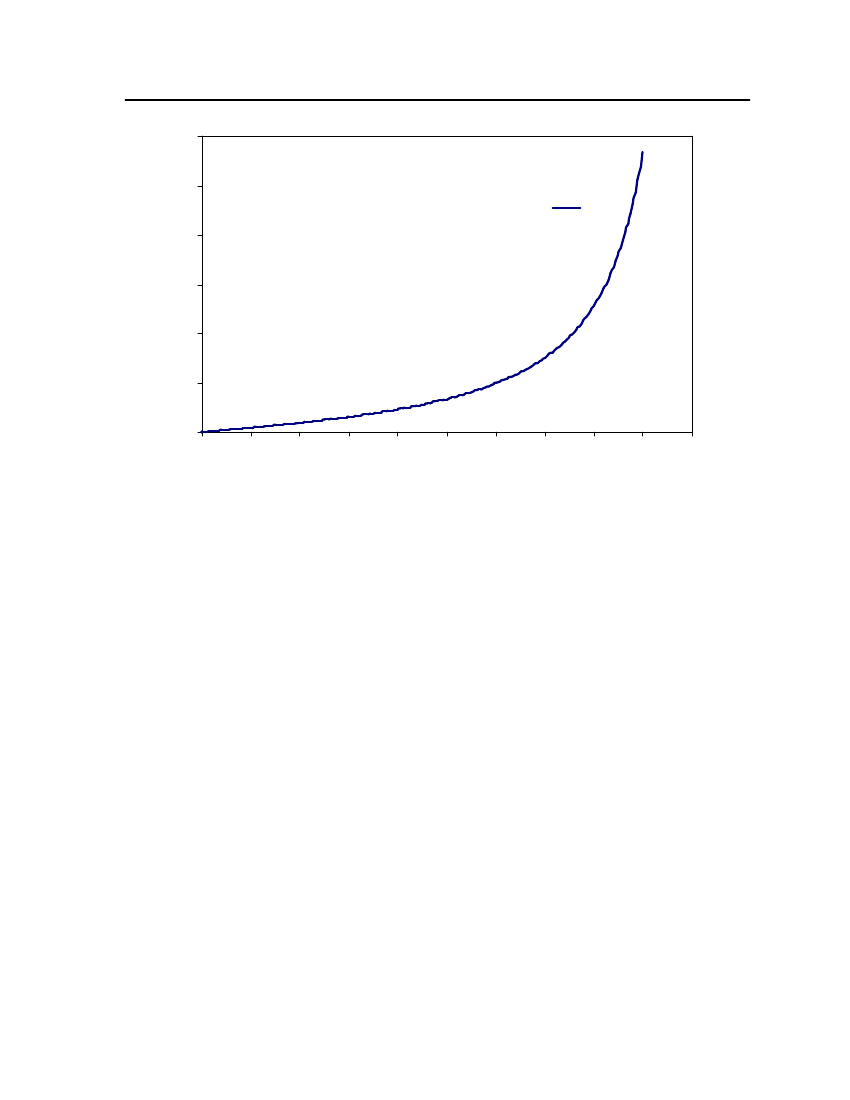
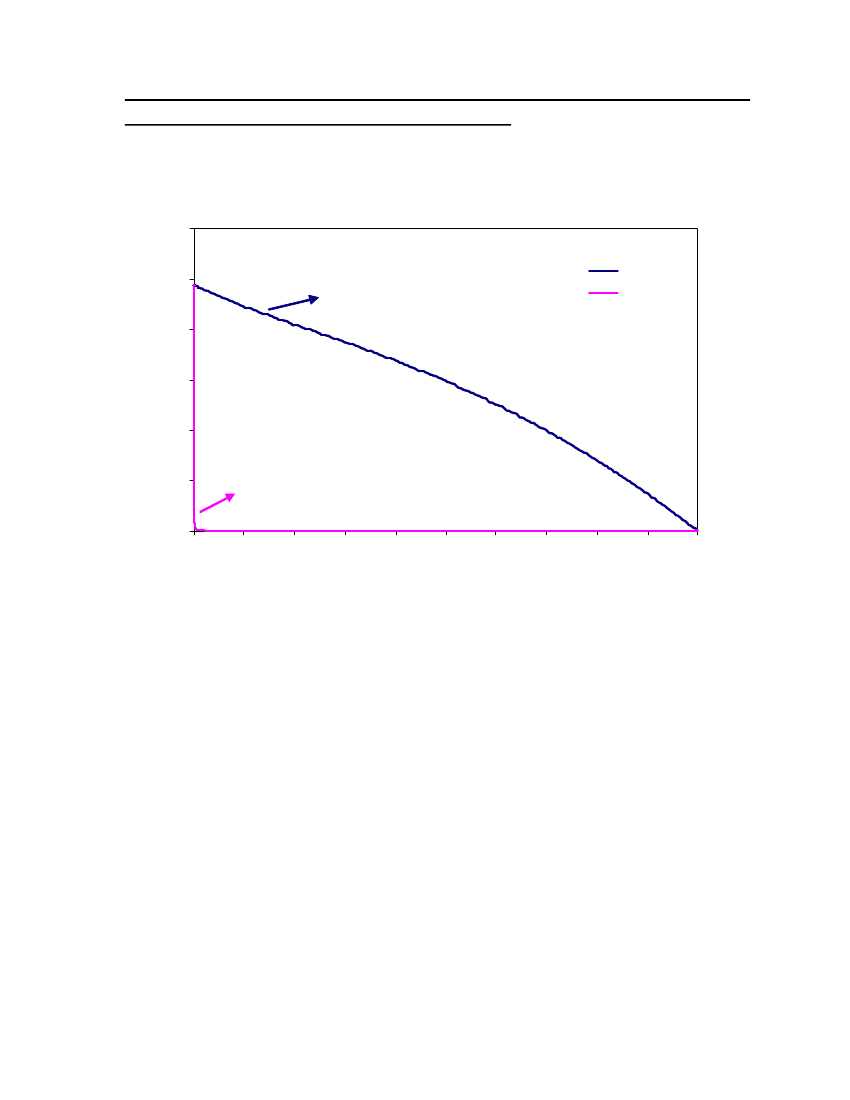
Sundheds- og Forebyggelsesudvalget 2011-12
SUU Alm.del Bilag 370
Offentligt
Addition of malodorants to lighter gas – a study of thephysical properties of mixtures of lighter gas and selectedsubstancesVasu Neela and Nicolas von Solms
Center for Phase Equilibria and Separation Processes (IVC-SEP)Department of Chemical and Biochemical EngineeringTechnical University of Denmark
i
Table of ContentsList of Tables -------------------------------------------------------------------------------------------- ivList of Figures ------------------------------------------------------------------------------------------- vi1234Introduction ---------------------------------------------------------------------------------------- 1Background----------------------------------------------------------------------------------------- 4Chemical ingredients in inhalants ------------------------------------------------------------- 6Effects of butane volatile substance abuse --------------------------------------------------- 74.14.2567Short term effect ....................................................................................................... 7Long term effect........................................................................................................ 7
Preventing volatile substance abuse ----------------------------------------------------------- 9The basic idea and its approach---------------------------------------------------------------10Theory and modeling ----------------------------------------------------------------------------127.17.27.37.3.17.3.27.3.37.3.47.3.57.3.67.3.77.3.87.3.97.3.107.3.117.3.127.3.137.3.147.3.157.3.16CPA (Cubic-plus-Association) Equation of State................................................... 12The COSMO-based thermodynamic model: .......................................................... 13Malodorants ............................................................................................................ 19Triethylamine --------------------------------------------------------------------------21Denatonium Benzoate (Bitrex) ------------------------------------------------------21Isobutyraldehyde-----------------------------------------------------------------------22Tetrahydrothiophene ------------------------------------------------------------------22Dimethylsulfide ------------------------------------------------------------------------232, 2, 4-Trimethyl pentane-------------------------------------------------------------24Picoline (2-methyl pyridine) ---------------------------------------------------------24Eucalyptol (1.8 Cineole)--------------------------------------------------------------25Nitrobenzene ---------------------------------------------------------------------------251-Pentanol-------------------------------------------------------------------------------26Sulfuryl chloride -----------------------------------------------------------------------27Cyanogen chloride---------------------------------------------------------------------27Bis-(2-chloroethyl) sulfide -----------------------------------------------------------28Bis-(2-chloroethyl) ethylamine ------------------------------------------------------28Ethyldichloroarsine--------------------------------------------------------------------29Bromobenzylcyanide------------------------------------------------------------------30ii
7.3.177.3.187.3.197.3.207.3.217.3.227.3.237.3.247.3.257.3.267.3.277.47.57.689
Chloropicrin ----------------------------------------------------------------------------30Diphenylcyanoarsine ------------------------------------------------------------------30Ethyl mercaptan------------------------------------------------------------------------31Bis(chloromethyl)ether ---------------------------------------------------------------322-Amino phenol------------------------------------------------------------------------32Propyleneglycol------------------------------------------------------------------------33s-Trioxane-------------------------------------------------------------------------------332-Chloroacetophenone ----------------------------------------------------------------34Indole ------------------------------------------------------------------------------------34Pyridine ---------------------------------------------------------------------------------35n-Butylamine---------------------------------------------------------------------------35
Estimation of pure compound parameters (CPA equation of state) ....................... 36Sigma Profiles ......................................................................................................... 38Vapor-liquid Equilibria........................................................................................... 57
Conclusion -----------------------------------------------------------------------------------------95References------------------------------------------------------------------------------------------96
iii
List of TablesTable 1: Death attributed to specific volatile substances in those under 18 from 1981-1990 .. 5Table 2: Chemical ingredients in inhalants............................................................................... 6Table 3 : Possible consequences from butane inhalant substances [9]..................................... 8Table 4: Malodorants .............................................................................................................. 19Table 5: Properties of Triethylamine ...................................................................................... 21Table 6: Properties of Denatonium benzoate (Bitrex) ............................................................ 22Table 7: Properties of Isobutyraldehyde ................................................................................. 22Table 8: Properties of Tetrahydrothiophene .......................................................................... 23Table 9: Properties of Dimethylsulfide................................................................................... 23Table 10: Properties of 2. 2. 4-Trimethyl pentane .................................................................. 24Table 11: Properties of Picoline.............................................................................................. 25Table 12: Properties of Eucalyptol ......................................................................................... 25Table 13: Properties of Nitrobenzene ..................................................................................... 26Table 14: Properties of 1-Pentanol ......................................................................................... 26Table 15: Properties of sulfuryl chloride ................................................................................ 27Table 16: Properties of cyanogen chloride ............................................................................. 28Table 17: Properties of Bis-(2-chloroethyl) sulfide ................................................................ 28Table 18: Properties of Bis-(2-chloroethyl) ethylamine ......................................................... 29Table 19: Properties of Ethyl dichloroarsine .......................................................................... 29Table 20: Properties of Bromobenzylvyanide ........................................................................ 30Table 21: Properties of Trichloronitromethane....................................................................... 30Table 22: Properties of Diphenylcyanoarsine......................................................................... 31Table 23: Properties of Ethylmercaptan ................................................................................. 31Table 24: Properties of Bis (chloromethyl) ether ................................................................... 32Table 25: Properties of 2-Aminophenol ................................................................................. 32Table 26: Properties of Propylene glycol................................................................................ 33Table 27: Properties of s-Trioxane ......................................................................................... 33Table 28: Properties of Chloroacetophenone.......................................................................... 34Table 29: Properties of Indole................................................................................................. 34
iv
Table 30: Properties of Pyridine ............................................................................................. 35Table 31: Properties of butylamine......................................................................................... 35Table 32: CPA Parameters for the compounds involved in this study ................................... 36
v
List of FiguresFigure 1: Ideal solvation process in COSMO-based models [18] .......................................... 13Figure 2: Schematic illustration of contacting molecular cavities and contact interactions[14].......................................................................................................................................... 15Figure 3: Comparison of Triethylamine Vapor pressure between CPA, COSMOtherm andDIPPR ..................................................................................................................................... 38Figure 4: Comparison of Isobutyraldehyde Vapor pressure between CPA, COSMOtherm andDIPPR ..................................................................................................................................... 39Figure 5: Comparison of Tetrahydrothiophene Vapor pressure between CPA, COSMOthermand DIPPR .............................................................................................................................. 39Figure 6: Comparison of DimethylsulfideVapor pressure between CPA, COSMOtherm andDIPPR ..................................................................................................................................... 40Figure 7: Comparison of 2,2,4 Trimethylpentane Vapor pressure between CPA,COSMOtherm and DIPPR...................................................................................................... 41Figure 8 Comparison of 2-MethylpyridineVapor pressure between CPA, COSMOtherm andDIPPR ..................................................................................................................................... 41Figure 9: Comparison of NitrobenzeneVapor pressure between CPA, COSMOtherm andDIPPR ..................................................................................................................................... 42Figure 10: Comparison of 1-Pentanol Vapor pressure between CPA, COSMOtherm andDIPPR ..................................................................................................................................... 42Figure 11: Comparison of Sulfurylchloride Vapor pressure between CPA, COSMOtherm andDIPPR ..................................................................................................................................... 43Figure 12: Comparison of CyanogenchlorideVapor pressure between CPA, COSMOthermand DIPPR .............................................................................................................................. 43Figure 13: Comparison of Ethylmercaptan Vapor pressure between CPA, COSMOtherm andDIPPR ..................................................................................................................................... 44Figure 14: Comparison of Bis(chloromethyl)ether Vapor pressure between CPA,COSMOtherm and DIPPR...................................................................................................... 44Figure 15: Comparison of Propyleneglycol vapor pressure between CPA, COSMOtherm andDIPPR ..................................................................................................................................... 45
vi
Figure 16: Comparison of s-Trioxane vapor pressure between CPA, COSMOtherm andDIPPR ..................................................................................................................................... 45Figure 17: Comparison of Indole vapor pressure between CPA, COSMOtherm and DIPPR 46Figure 18: Comparison of Pyridine vapor pressure between CPA, COSMOtherm and DIPPR................................................................................................................................................. 46Figure 19: Comparison of Butylamine vapor pressure between CPA, COSMOtherm andDIPPR ..................................................................................................................................... 47Figure 20: Vapor-Liquid Equilibrium of Ethylmercaptan (1) /n-Butane(2) with CPA(Association scheme-2B) and COSMOtherm at 50oC............................................................ 49Figure 21: Vapor-Liquid Equilibrium of Ethylmercaptan (1) /n-Butane(2) with CPA (Nonassociation) and COSMOtherm at 50oC ................................................................................. 49Figure 22: Vapor-Liquid Equilibrium of Ethylmercaptan (1) /n-Butane(2) with CPA(Association scheme-2B) and COSMOtherm at 100oC.......................................................... 50Figure 23: Vapor-Liquid Equilibrium of Ethylmercaptan (1) /n-Butane(2) with CPA (NonAssociation) and COSMOtherm at 100oC .............................................................................. 50Figure 24: Sigma profiles for the lighter gas components (butane. isobutane and propane).. 51Figure 25: Sigma profiles of 1,8 cineole, 1-pentanol and 2-methylpyridine .......................... 52Figure 26: Sigma profiles of cyanogen chloride and dimethylsulfide .................................... 53Figure 27: Sigma profiles for the sulfurylchloride and triethylamine .................................... 54Figure 28: sigma profile for the ethyl mercaptan, Isobutanal and pyridine............................ 55Figure 29: sigma profile for the nitrobenzene and tetrahydrothiophene................................. 55Figure 30: sigma profile for the Bitrex anion and Bitrex cation............................................. 56Figure 31: Vapor-Liquid equilibrium for Triethylamine (1) /n-Butane(2) at 25oC. The solidcurve shows the COSMOtherm predictions ........................................................................... 58Figure 32: The X-Y diagram for Triethylamine (1) /n-Butane(2) at 25oC. The solid curveshows the COSMOtherm predictions ..................................................................................... 59Figure 33: Vapor-Liquid equilibrium for Isobutyraldehyde (1) /n-Butane(2) at 25oC. Thesolid curve shows the COSMOtherm predictions................................................................... 60Figure 34: The X-Y diagram for Isobutyraldehyde (1) /n-Butane(2) at 25oC. The solidcurve shows the COSMOtherm predictions ........................................................................... 61
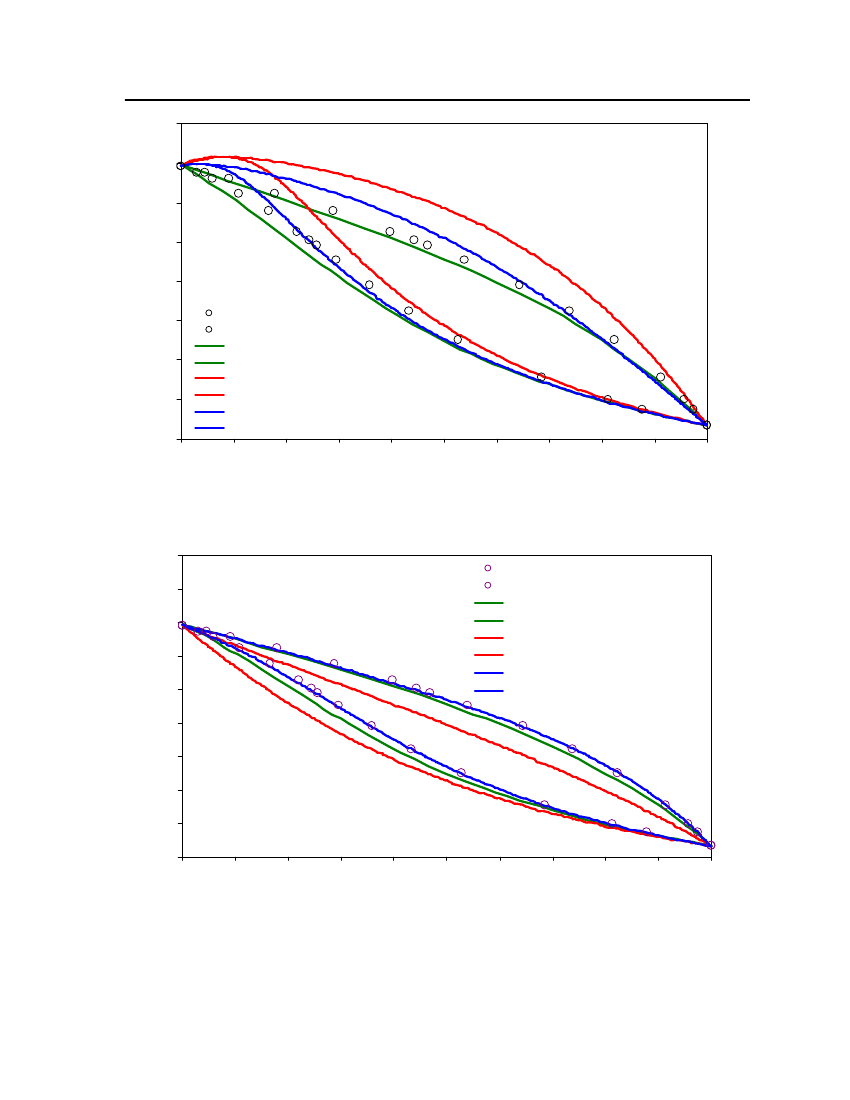
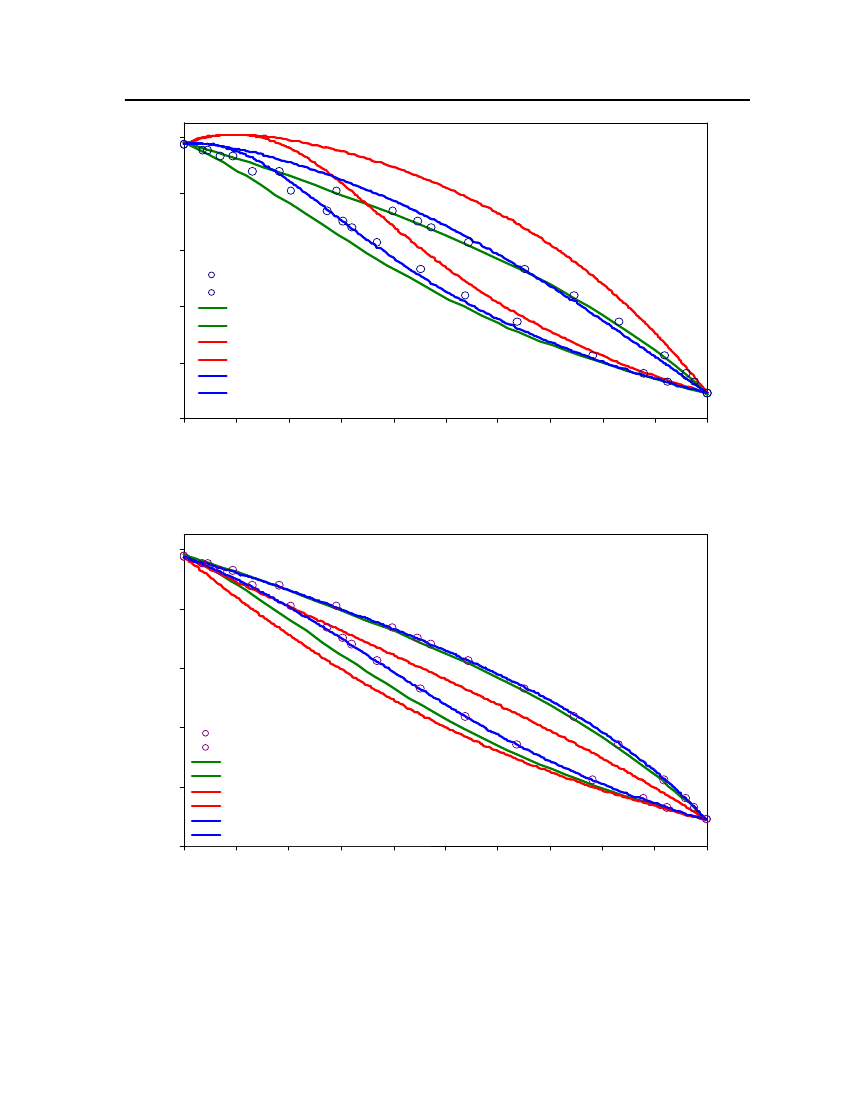
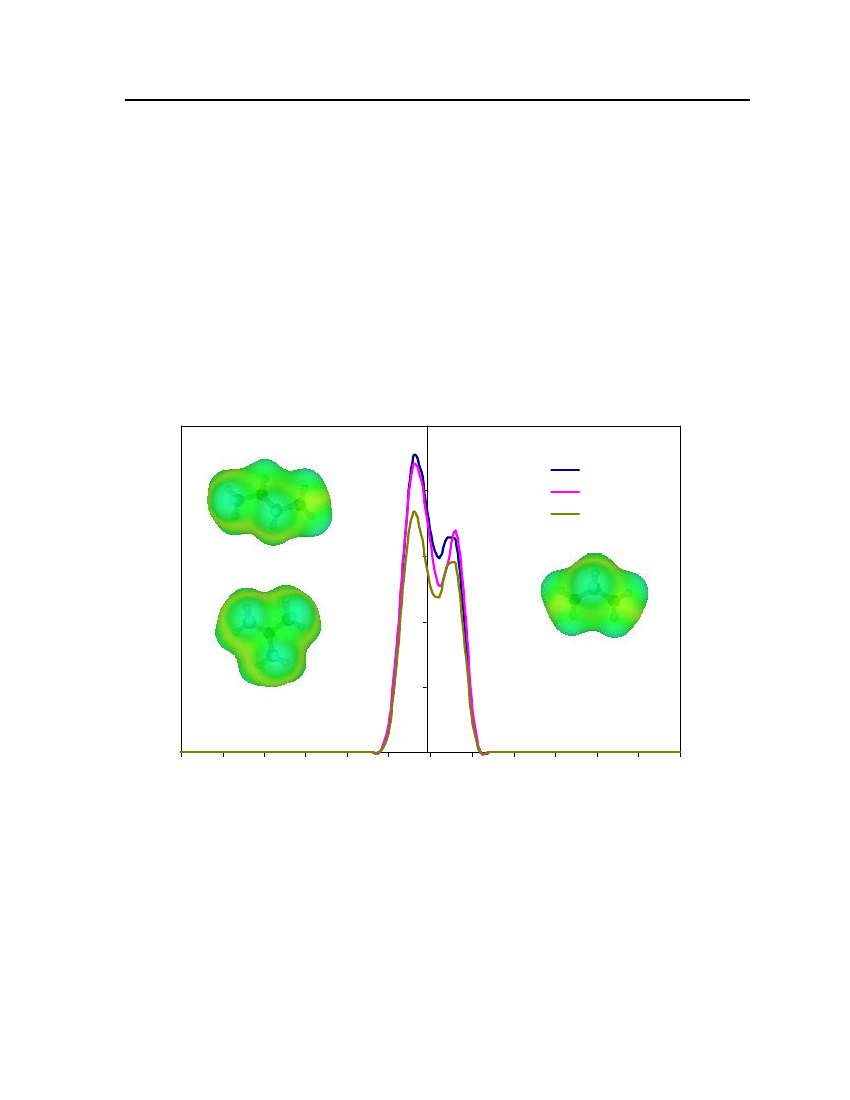
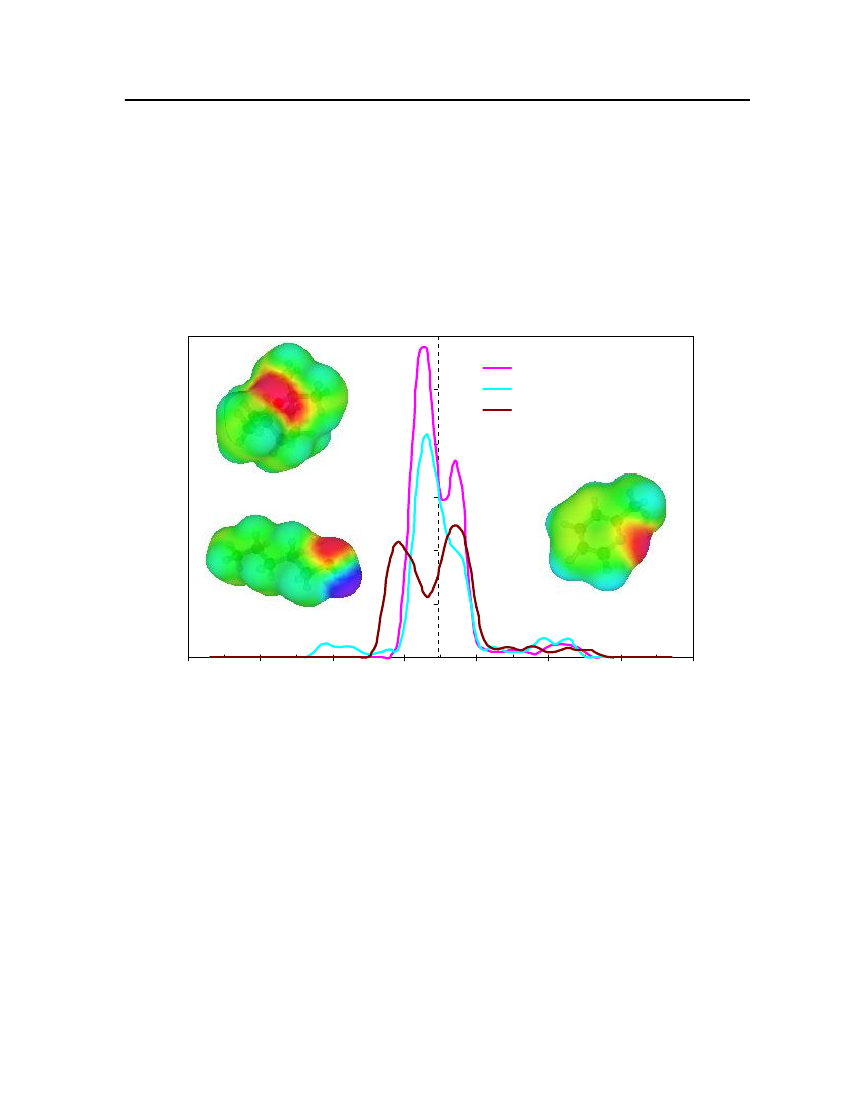
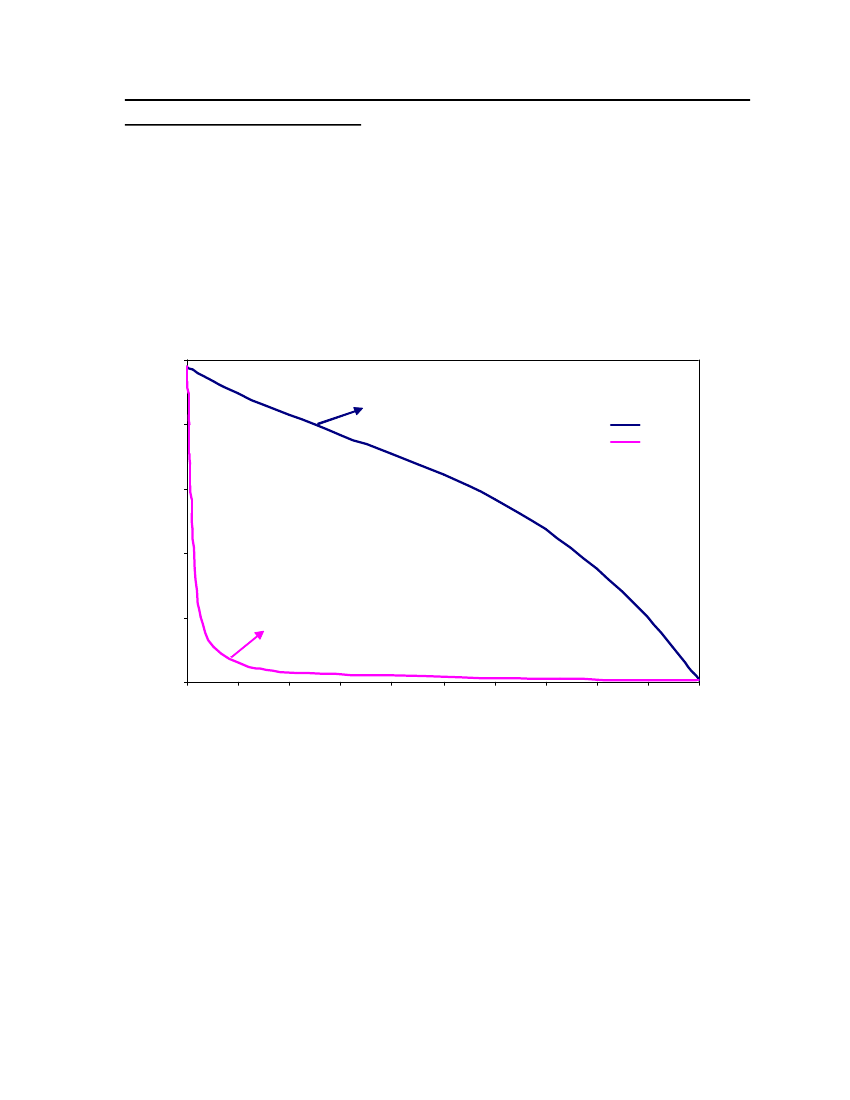
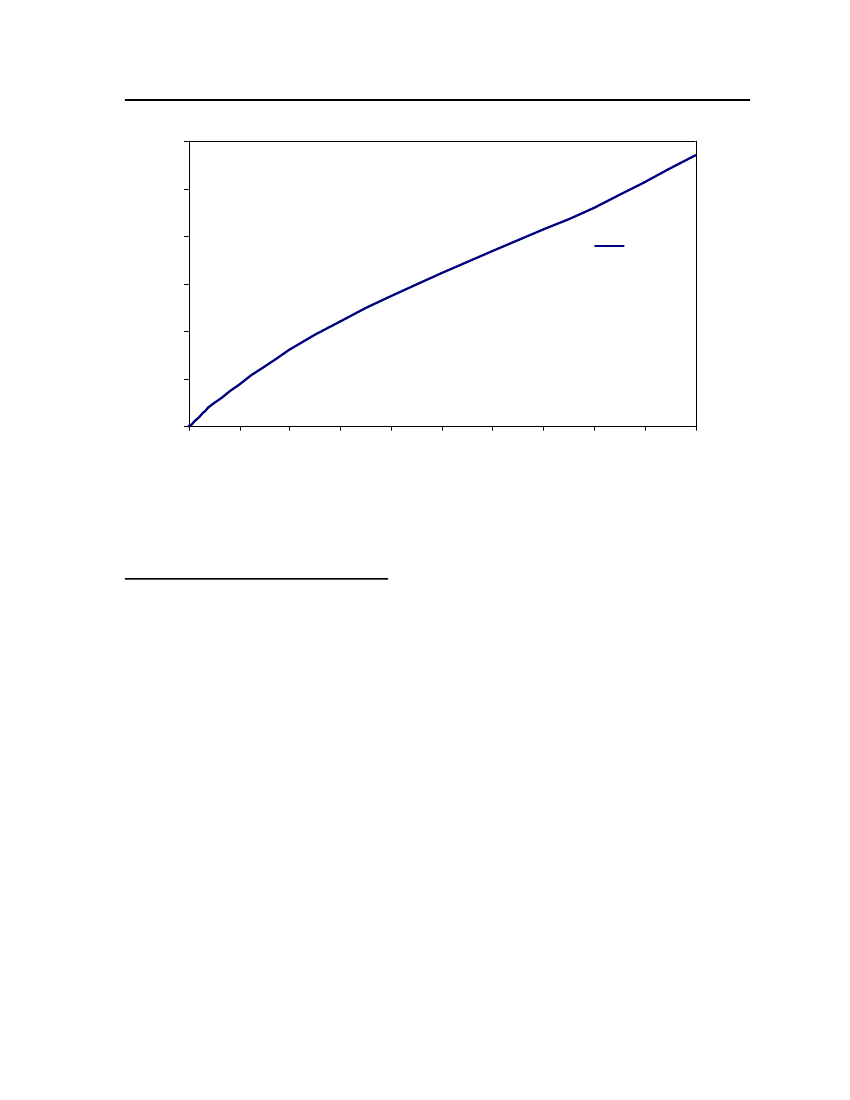
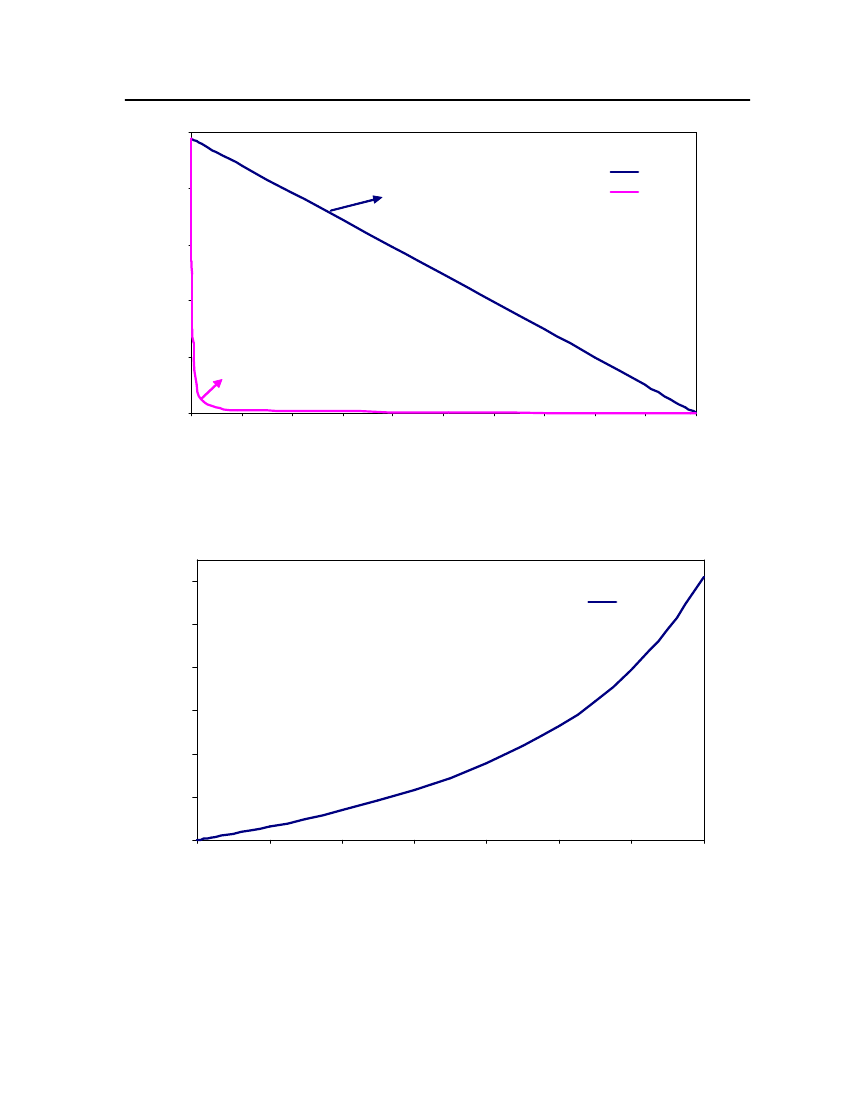
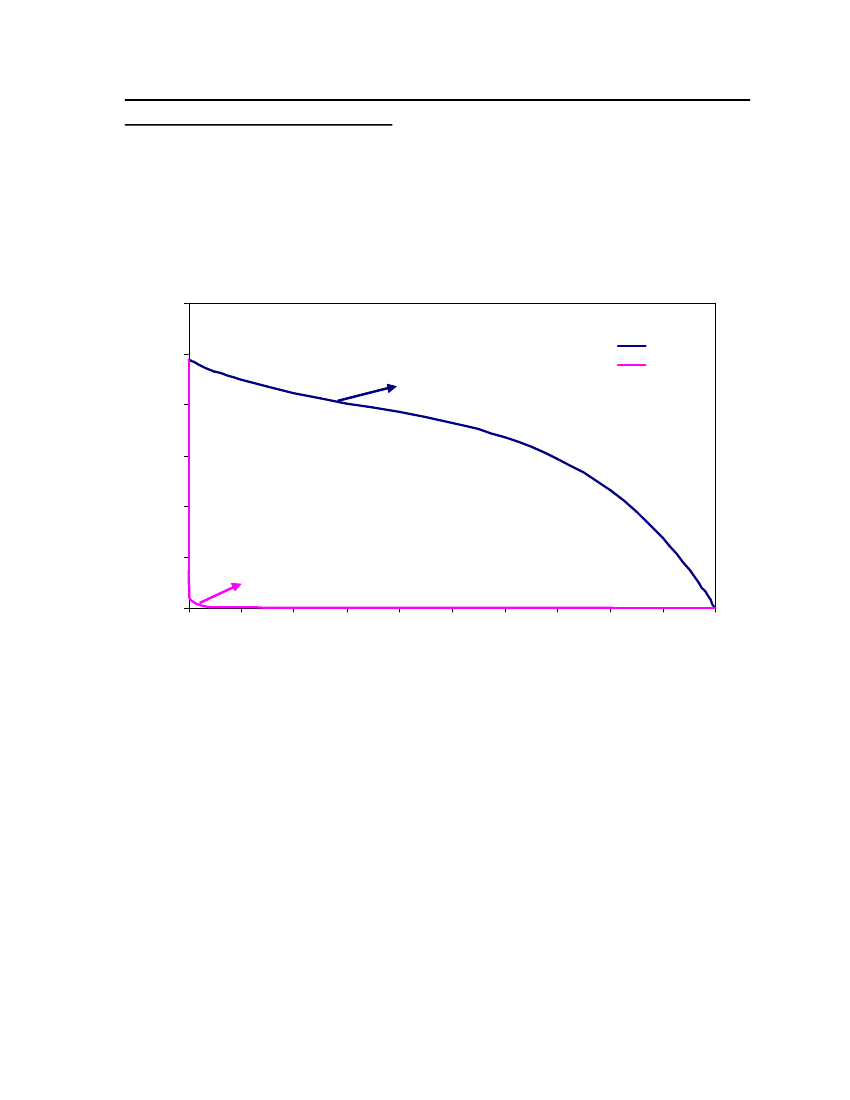
vii
Figure 35: Vapor-Liquid equilibrium for Tetrahydrothiophene (1) /n-Butane(2) / at 25oC.The solid curve shows the COSMOtherm predictions ........................................................... 62Figure 36: The X-Y diagram for Tetrahydrothiophene (1) /n-Butane(2) at 25oC. The solidcurve shows the COSMOtherm predictions ........................................................................... 62Figure 37: Vapor-Liquid equilibrium for Dimethylsulfide (1) /n-Butane(2) at 25oC. Thesolid curve shows the COSMOtherm predictions................................................................... 63Figure 38: The X-Y diagram for Dimethylsulfide (1) /n-Butane(2) at 25oC. The solid curveshows the COSMOtherm predictions ..................................................................................... 64Figure 39: Vapor-Liquid equilibrium for 2, 2, 4Trimethyl-2-pentane (1) /n-Butane(2) at 25o
C. The solid curve shows the COSMOtherm predictions ..................................................... 65
Figure 40: The X-Y diagram for 2, 2, 4 Trimethyl-2-pentane (1) /n-Butane(2) at 25oC. Thesolid curve shows the COSMOtherm predictions................................................................... 65Figure 41: Vapor-Liquid equilibrium for 2-methylpyridine (1) /n-Butane(2) at 25oC. Thesolid curve shows the COSMOtherm predictions................................................................... 66Figure 42: The X-Y diagram for 2-methylpyridine (1) /n-Butane(2) at 25oC. The solidcurve shows the COSMOtherm predictions ........................................................................... 67Figure 43: Vapor-Liquid equilibrium for 1, 8 Cineole (1) /n-Butane(2) at 25oC. The solidcurve shows the COSMOtherm predictions ........................................................................... 68Figure 44: The X-Y diagram for 1, 8 Cineole (1) /n-Butane(2) at 25oC. The solid curveshows the COSMOtherm predictions ..................................................................................... 68Figure 45: Vapor-Liquid equilibrium for Nitrobenzene (1) /n-Butane(2) at 25oC. The solidcurve shows the COSMOtherm predictions ........................................................................... 69Figure 46: The X-Y diagram for Nitrobenzene (1) /n-Butane(2) at 25oC. The solid curveshows the COSMOtherm predictions ..................................................................................... 70Figure 47: Vapor-Liquid equilibrium for 1-Pentanol (1) /n-Butane(2) at 25oC. The solidcurve shows the COSMOtherm predictions ........................................................................... 71Figure 48: The X-Y diagram for 1-Pentanol (1) /n-Butane(2) at 25oC. The solid curveshows the COSMOtherm predictions ..................................................................................... 71Figure 49: Vapor-Liquid equilibrium for Sulfuryl chloride (1) /n-Butane(2) at 25oC. Thesolid curve shows the COSMOtherm predictions................................................................... 72
viii
Figure 50: The X-Y diagram for Sulfuryl chloride (1) /n-Butane(2) at 25oC. The solid curveshows the COSMOtherm predictions ..................................................................................... 73Figure 51: Vapor-Liquid equilibrium for Cyanogen chloride (1) /n-Butane(2) at 25oC. Thesolid curve shows the COSMOtherm predictions................................................................... 74Figure 52: The X-Y diagram for Cyanogen chloride (1) /n-Butane(2) at 25oC. The solidcurve shows the COSMOtherm predictions ........................................................................... 74Figure 53: Vapor-Liquid equilibrium for Bis(2-chloroethyl)sulfide (1) /n-Butane(2) at 25o
C.
The solid curve shows the COSMOtherm predictions .............................................. 75
Figure 54: The X-Y diagram for Bis(2-chloroethyl)sulfide (1) /n-Butane(2) at 25oC. Thesolid curve shows the COSMOtherm predictions................................................................... 76Figure 55: Vapor-Liquid equilibrium for Bis(2-chloroethyl)ethylamine (1) /n-Butane(2) at25oC.25oC.The solid curve shows the COSMOtherm predictions ......................................... 77
Figure 56: Vapor-Liquid equilibrium for Bis(2-chloroethyl)ethylamine (1) /n-Butane(2) atThe solid curve shows the COSMOtherm predictions ......................................... 78Figure 57: Vapor-Liquid equilibrium for Dichloroethylarsine (1) /n-Butane(2) at 25oC. Thesolid curve shows the COSMOtherm predictions................................................................... 79Figure 58: The X-Y diagram for Dichloroethylarsine (1) /n-Butane(2) at 25oC. The solidcurve shows the COSMOtherm predictions ........................................................................... 80Figure 59: Vapor-Liquid equilibrium for Bromobenzylcyanide (1) /n-Butane(2) at 25oC.The solid curve shows the COSMOtherm predictions ........................................................... 81Figure 60: The X-Y diagram for Bromobenzylcyanide (1) /n-Butane(2) at 25oC. The solidcurve shows the COSMOtherm predictions ........................................................................... 81Figure 61: Vapor-Liquid equilibrium for Chloropicrin (1) /n-Butane(2) at 25oC. The solidcurve shows the COSMOtherm predictions ........................................................................... 82Figure 62: The X-Y diagram for Chloropicrin (1) /n-Butane(2) at 25oC. The solid curveshows the COSMOtherm predictions ..................................................................................... 83Figure 63: Vapor-Liquid equilibrium for Chloropicrin (1) /n-Butane(2) at 25oC. The solidcurve shows the COSMOtherm predictions ........................................................................... 84Figure 64: Vapor-Liquid equilibrium for Ethylmercaptan (1) /n-Butane(2) at 25oC. Thesolid curve shows the COSMOtherm predictions................................................................... 85
ix
Figure 65: The X-Y diagram for Ethylmercaptan (1) /n-Butane(2) at 25oC. The solid curveshows the COSMOtherm predictions ..................................................................................... 85Figure 66: Vapor-Liquid equilibrium for Bis(chloromethyl)ether (1) /n-Butane(2) at 25oC.The solid curve shows the COSMOtherm predictions ........................................................... 86Figure 67: Vapor-Liquid equilibrium for 2-Amino phenol (1) /n-Butane(2) at 25oC. Thesolid curve shows the COSMOtherm predictions................................................................... 87Figure 68: Vapor-Liquid equilibrium for Propylene glycol (1)/n-Butane(2) at 25oC. Thesolid curve shows the COSMOtherm predictions................................................................... 88Figure 69: Vapor-Liquid equilibrium for 1, 3, 5 Trioxane (1) /n-Butane(2) at 25oC. Thesolid curve shows the COSMOtherm predictions................................................................... 89Figure 70: Vapor-Liquid equilibrium for Chloroacetophenone (1) /n-Butane(2) at 25oC.The solid curve shows the COSMOtherm predictions ........................................................... 89Figure 71: Vapor-Liquid equilibrium for Indole (1) /n-Butane(2) at 25oC. The solid curveshows the COSMOtherm predictions ..................................................................................... 90Figure 72: Vapor-Liquid equilibrium for Pyridine (1) /n-Butane(2) at 25oC. The solid curveshows the COSMOtherm predictions ..................................................................................... 91Figure 73: The X-Y diagram for Pyridine (1) /n-Butane(2) at 25oC. The solid curve showsthe COSMOtherm predictions ................................................................................................ 91Figure 74: Vapor-Liquid equilibrium for Butylamine (1) /n-Butane(2) at 25oC. The solidcurve shows the COSMOtherm predictions ........................................................................... 92Figure 75: The X-Y diagram for Butylamine (1) /n-Butane(2) at 25oC. The solid curveshows the COSMOtherm predictions ..................................................................................... 93Figure 76: The X-Y diagram for possible additives (1) /n-Butane(2) at 25oC. The solidcurve shows the COSMOtherm predictions ........................................................................... 94
x
1 IntroductionThis project involves studying some relevant physical properties of mixtures createdby adding agents to lighter gas which discourage its abuse. These additives are called“malodorants” here, although it is to be understood in a more general sense and includes anyeffect which discourages abuse (e.g. bittering agents, irritants, etc).In this work, the majority of the compounds considered have been selected based ontheir unpleasant odor. The aim is to find a substance that has not only the correctphysiological effect (discourages abuse) but also the correct physical behavior on addition tolighter gas (solubility, phase behavior). This means that the additive should not be toovolatile (so that it disappears quickly if the lighter gas canister is held open for a short while– a process know as “weathering”). Conversely, it should not be too heavy (i.e. have avolatility much less than lighter gas) since it would then be required to be added in largerquantities in the liquid in order for it to be present in the vapor in sufficient quantities to havethe required deterrent effect. This would also mean that in time the additive would be becomemore and more concentrated in the liquid and might finally affect the normal use of the gascanister. Finally, addition of the malodorants should not affect the normal use of lighter gas.The influence of physical factors such as temperature, pressure and concentration ofthe selected substances with lighter gas is studied in this work. It should be emphasized thatthis report represents only one component in a larger study examining the possibility ofadding malodorants to lighter gas and focuses on the physical chemistry or chemicalengineering aspects of the problem. Issues of toxicity, for example, have not been taken intoaccount although it may be mentioned that highly toxic substances such as mercaptans arealready added to natural gas as malodorants in very small amounts, so the toxicity of the puresubstance may not be the only factor that needs to be considered. Dosage and concentrationare of course also relevant.Lighter gas consists primarily ofn-butane(referred to in the remainder of the reportsimply as butane) isobutane and propane. Butane is a volatile substance and is a gas atatmospheric temperature and pressure. It is stored as a liquid in lighters and lighter-gas refillcans by increasing its pressure. Butane’s vapor pressure at room temperature (25oC) is 2.28atm which means that pure liquid butane in lighter gas containers is at a pressure of around
1
2.28 atm, depending on the temperature. The pressure of actual lighter gas is somewhatabove this value due to the presence of the lighter isobutane and propane.Cigarette lighter refill cans are the most commonly used butane product althoughbutane is also used as a propellant in aerosols. There are a wide range of butane productsincluding cigarette lighters and portable stoves. Butane is a colorless gas with a faintlydisagreeable odor and it is poorly soluble in water. The lower explosive limit of butane is1.9% and its toxicity is low. A typical lighter refill contains 54%n-butane,20% isobutane,and 26% propane. Refill cans for stoves contain 71%n-butane,28% isobutane, and 1%propane [2]. Butane is the main component of gas lighter refills and for the purposes of thisinvestigation it is assumed that lighter gas is pure butane. This assumption is not expected tohave an important influence on the results obtained here.In this investigation we have used two thermodynamic models - Cubic-Plus-Association (CPA) and COSMOtherm to predict the phase behaviour of the mixtures studied.The CPA equation of state combines the very widely used Soave-Redlich-Kwong (SRK)equation of state combined with an extra expression which accounts specifically forhydrogen-bonding substances, such as amines or alcohols. This equation is applicable tomulticomponent, multiphase equilibria for systems containing associating components. Inthis work, the CPA Equation of state is used to describe the vapor liquid equilibrium ofadditive (malodorants)-butane systems at different pressures and temperature is studied.The COSMOtherm software also used in this work, and is a commercially availablesoftware program. Predictions from this model are generally very good at pressures whichare not very elevated (for example the pressure of lighter gas at room temperature).COSMOtherm (Conductor like screening model) is a program that computes thermophysicaldata of fluid mixtures. COSMOtherm is developed based on COSMO-RS theory. COSMO-RS (Conductor like screening model for real solvents) is a theory of interacting molecularsurfaces as computed by quantum (QM) continuum solvation models (CSMs). Quantumchemical methods originally developed for isolated molecules i.e. for molecules in a vacuumor a gas. The basis of the COSMO model is the ‘‘solvent accessible surface’’ of a solutemolecule. COSMO places the molecule inside a cavity formed within a homogeneousmedium, taken to be the solvent. COSMO is a valuable tool for the chemical engineeringproblems to find out the activity coefficients and other thermo physical data of compounds in
2
fluid phase. A small number of adjustable and universal parameters, theσprofiles, surfaces,volume of the molecules and the molecule-specific charge distribution are required toperform the COSMO-RS calculations [14].COSMO-RS can be used for the prediction of vapor-liquid equilibria, liquid-liquidequilibria, solid-liquid equilibria, vapor pressures of pure compounds and mixtures, partitioncoefficients, heats of vaporization, activity coefficients, solubilities, excess Gibbs freeenergies, and excess enthalpies, etc. COSMO-RS has also been extended to ionic liquids. Theequilibrium behavior of mixtures of various additives in butane is studied in terms primarilyof their vapour-liquid equilibrium behaviour. This means that for a given composition of anadditive in the butane liquid we are interested in the composition in the vapour phase and theoverall pressure of the mixture. In some cases the additive is not soluble in butane and inthese cases liquid-liquid equilibrium behaviour is observed (i.e. two separate liquid phasesresult, although there will be a small degree of mutual solubility of each component in theother liquid phase).There is a very important difference between CPA and COSMOtherm which shouldbe borne in mind: In order to use CPA (or indeed any equation of state model)it is necessaryto have experimental data availablefor the pure components in the form of both liquiddensity and vapor pressure as a function of temperature. While this is usually not a problemfor commonly occurring substances, this data is lacking for ten of the twenty-sevenmalodorants considered in this study. Even when pure-component data is available, there isno guarantee that predictions of the behavior ofbinarysystems will be adequate.Experimental data for binary systems is even scarcer. Experimental data exists for only onebinary system studied here –n-butane– ethyl mercaptan, which enables an assessment of theperformance of the two models.COSMOtherm on the other hand requires no experimental data (pure or binary) and isbased solely on the chemical structure of the molecules combined with a quantum chemicalcalculation. This calculation only needs to be performed once to give a so-called chargesurface and charge profile for the molecule, after which thermodynamic calculations can bedone quickly and in a straightforward manner. Since no experimental data is required,COSMOtherm will not predict pure-component vapor pressures as accurately as CPAforsubstances for which experimental data exists,since the CPA parameters are fitted to the
3
experimental data. In general, however the uncertainty of prediction of pure-componentvapor pressures was deemed to be acceptable, and in particular, COSMOtherm performedvery well for the only binary system for which experimental data were available.
2 BackgroundLiquefied petroleum gas is used in cigarette lighter refills, small blow torches andcamping gas stoves. The liquefied petroleum gas usually consists of butane, isobutane andpropane in various proportions. Products other than cigarette lighter refills contain up to 40% of unsaturated hydrocarbons. Butane is odorless and heavier than air, with a flash point of-40oC and flammability limit of between 1.8 and 8.4% volume.n-butane,iso-butane andpropane vaporize at ordinary temperature and atmospheric pressure, the boiling points ofthese are -0.5, -11.7 and -42.1oC respectively.Volatile substances are generally separated into four groups, namely volatile solvents,aerosols, gases and nitrites. Volatile solvents are liquids or semi solids which vaporize atroom temperature. These products include paints, paint thinners and strippers, dry cleaningfluids, nail polish remover. Aerosols contain propellants and solvents. These include spraypaints, hair sprays and vegetable oil sprays. The aerosols contain substances such as butane,toluene, propane and acetate. Volatile substances classified as “gases” include gas lighters,fire extinguishers, fuel gas, and anesthetic gases. These products contain butane, isopropaneand nitrous oxide.These products are often available in inexpensive packs and are thus attractive tomisusers. Butane is most usually inhaled directly into the mouth from cigarette lighter refillcans. Cigarette lighter refills are misused by clenching the nozzle between teeth and pressingto release the gas. If the can is tilted then a jet of fluid cooled to at least -60oC by expansionmay be inhaled directly and there is also a risk of fire and explosion associated with themisuse of cigarette lighter refills. Butane gas affects the body about 5 minutes afterinhalation and its effect lasts for 15-45 minutes. After this, the inhaler may feel nausea up to9 to 12 hours. At the early stage of inhalation, the inhaler feels euphoria, a floating sensation,dizziness, slurred speech, sense of heightened power and hallucination. These symptoms mayresult in impulsive actions such as attacking other people [5].
4
In the United Kingdom 605 people under the ago of 18 have died from volatilesubstance abuse in the period 1981-1990. Table 1 shows the deaths attributed to specificproducts in those under 18 from 1981-1990 in United Kingdom [6] and the largest number ofdeaths was attributed due to butane gas cigarette lighter fuel.Table 1: Death attributed to specific volatile substances in those under 18 from 1981-1990
ProductButane gas lighter fuelCalor gas (Propane)Butane gas cylinderPR sprayFire extinguisherAntiperspirantsOther spraysUnknown spray canisterEvostickOther gluesDry cleaning agentsOther cleaning agentsTypewriter correcting fluidChloroformPetrolUnknown gluesOther productsTotal
No of deaths20771026338815153522130673131511600
Frequency (%)34.51.21.74.35.514.74.52.55.83.70.25.011.20.52.20.81.8100
5
3 Chemical ingredients in inhalantsSolvents and volatile products contain many different chemicals. Table 2 shows theactive ingredients present in a sampling of products. These chemicals include both gases andliquids [13].Table 2: Chemical ingredients in inhalants
ProductAdhesivesAirplane glueRubber cement
Major volatile components
Toluene, ethyl acetateHexane, toluene, methyl chloride, acetone,methylethylketone, methylbutylketone
AerosolsSpray paintHair sprayAir freshenersFabric protection sprayComputer cleanerCleaning productsDegreaserSpot removerSolventsNail polish removerPaint thinnerCorrection fluidTolueneLighter fluidFood productswhippetsCanned whipped creamNitrous oxideNitrous oxideAcetone, ethyl acetate, tolueneToluene, methylene chloride, methanol, acetoneToluene, trichloroethylene, trichloroethaneMethylbenzeneButane, isopropaneTetrachloroethylene, trichloroethane, methanolXylene, petroleum distillates, trichloroethaneButane, fluorocarbons, toluene, hydrocarbonsButane, fluorocarbons, propaneButane, fluorocarbonsButane, trichloroethaneDimethylether, hydrofluorocarbons
6
4 Effects of butane volatile substance abuseVolatile substances such as butane gas produce can be inhaled to induce a psychoactive,or mind altering effect [9]. Butane vapors displace oxygen and can result in loss ofconsciousness and directly damage lung tissue. The vapors are easily absorbed through thelungs and carried to the brain where they act to depress the central nervous systems [9].4.1Short term effectThe short term effects are most rapid and relatively brief in duration. Immediateeffects may last only a minute or several minutes. These rapid effects are due to high lipidsolubility which allows for rapid absorption from the lungs to blood stream. Hydrocarbonspresent in volatile substances are easily absorbed into fatty tissues in the brain where they actas depressants [10]. Intensive use of inhalants may result in irregular heart rhythms andsudden death. The sudden sniffing death is particularly related to inhalation of butane andpropane fuels. Other inhalants, such as aerosols have been reported to induce sudden andfatal cardiac arrest, even in first time use. Recently, several deaths are associated with typecorrection fluid and lighter fluid [8]. Table 3 represents a range of possible consequences thatmay result from short term and long term chemical exposure [10].4.2Long term effectA long term effect may present itself after prolonged exposure. These effects dependon the amount which is inhaled over a period of time. Long term use is linked with muscleweakness, reduced bone density, leukemia and other cancer [9]. Long term chemicalexposure can cause damage to the liver, heart and lungs. A long term consequence ofinhalant use depends on four factors: the user, the substance used, the context of use andculture of use. Long term solvent abuse may lead to permanent neurological damage.
7
Table 3 : Possible consequences from butane inhalant substances [9]
Short term effectEuphoria/Feeling of well beingLoss of inhibitionDrowsiness/sedationSlurred speech/incoherenceWeaknessNauseaVomitingHeadachesLoss of short term memoryAggressionHallucinationsUncoordinated movements
Long term effectChronic headacheSinusitisTinnitusDiminished cognitive functionNosebleedsExtreme tirednessRed, watery eyesShortness of breathIndigestionDizzinessStomach ulcersChest pain or angina
8
5 Preventing volatile substance abuseThe following modifications have been proposed to prevent volatile substance abuse [10].••
Replacement of harmful or psycho- active components;Additions of deterrent chemicals such as odorants have been proposed to modifythe butane gas in lighter refill cans. Research by the CSIRO in Australia concludedthat adding mercaptans to butane gas at a level of 50 ppm would result in theproduct having unpleasant odor and emetic properties sufficient to deter misuse [1];
••
Package modification;Modifying the butane cigarette lighter refill container, where the product isdelivered from container to container (modification of nozzles of cans) ;
•
Replacement of the abusable or toxic elements of the product with a non abusablealternative;
••
Reformulation of products to remove or minimize abusable substances;Adding substances such as bittering agents (e.g. Bitrex) to make the product lessappealing to inhalers;
•
Ban on abusable chemicals (from legitimate products).
The purpose of this work is to consider a number of possible deterrent additives, andspecifically whether it is possible to add these to lighter gas, from a physicochemicalperspective.
9
6 The basic idea and its approachThe main objective of this work is to investigate compounds which are suitable formodifying the cigarette lighter fuel without affecting its performance. Compounds(malodorants) are selected based on physical and chemical properties such as compoundswhich are irritants, have an unpleasant odor or are bittering. The main volatile constituents ofcigarette lighter and butane fuel gases aren-butaneand isobutane. Butane is a straight chainaliphatic hydrocarbon gas at room temperature. The addition of mercaptans to butane gas hasbeen shown not to affect the short term performance of butane-burning devices such ascigarette lighters but further research is required to assess the long term effect [1]. The focusof this work is on compoundsotherthan those based on sulfur (such as hydrogen sulfide andmercaptans). However, a single comparison has been made for the system butane-ethylmercaptan, since some binary experimental data is available for this system. This has enabledthe theoretical approach used here to be verified.The physical properties of malodorants and their mixtures have been calculated using theCPA equation of state and the COSMOtherm program. If experimental data for the purecompounds is available (they are available for 17 out of 27 compounds), pure componentparameters can be found for the CPA equation of state by fitting the model to theexperimental data. The behaviour of the binary system (butane-malodorant) can then bepredicted. The COSMOtherm program can compute the physical properties of purecompounds and mixtures, without the need for experimental data. The results from the CPAmodel and the COSMOtherm program can then be compared with each other and withavailable experimental data (if available). Since there is only data for one binary system(butane – ethyl mercaptan) it is difficult to comment on which model is preferable. However,COSMOtherm performed very well for this system and our feeling is that the predictions ofbinary phase behaviour are reliable in nearly all cases studied here. CPA is probably asreliable, but can only be used if experimental data is available for the pure compounds.COSMOtherm is a program that computes thermophysical data of fluids. This programis based on the COSMO-RS theory and the computational procedure is takes place in threesteps. First, a molecule is “built” and a quantum chemistry calculation is performed in orderto calculate a sigma potential and a sigma profile by COSMO-RS. This calculation is time-
10
consuming but is performed only once for each compound and the profiles are then stored ina database. In fact the sigma profiles for most of the malodorants considered here had alreadybeen calculated and were already available in the program’s extensive database.Vapor pressures and vapor liquid equilibrium calculations can then be performed for thepure compounds and for mixtures. These calculations are relatively quick. Section 7.5discusses the sigma profiles and surfaces in detail.
11
7 Theory and modeling7.1CPA (Cubic-plus-Association) Equation of State
The CPA equation of state was developed by Kontogeorgis et al. [20,21]. This equation hasbeen applied to systems containing mainly hydrocarbons with associating compounds. Anassociating compound is one which exhibits hydrogen bonding (such as water, alcohols andamines). This equation combines a so-called “physical” interaction with an association termwhich accounts for hydrogen bonding. The physical interactions are accounted for using theSRK (Soave-Redlich-Kwong) equation of state. This equation of state (SRK) is very widelyused in the oil and gas industry and CPA was developed with this industry in mind – ratherthan develop a completely new equation of state, a term was simply added to the SRKequation to account for water, alcohols, etc. for which SRK was not performing adequately.In the absence of hydrogen bonding, CPA simply reduced to SRK. The result has been thatCPA has been adopted by the oil industry (traditionally a rather conservative industry)because it can be readily integrated into existing software. A detailed description of the CPAequation of state can be found in Kontogeorgis et al [20, 21].Without going into detail here, it is useful to know that the CPA equation of staterequires five parameters to describe a single pure associating compound - three for thephysical part, and two for the association part – an association energy (εAB) and anassociation volume(βAB). For a non-associating compound, such as butane, only threeparameters are required. These parameters are determined by fitting to experimental data(saturated vapor pressures and liquid density) for the pure compound. An extensivecollection of this data exists for many pure compounds (for example 17 of the 27 consideredhere). This compilation has been performed by the Design Institute for Physical Properties(DIPPR).
12
7.2
The COSMO-based thermodynamic model:The COSMO model has been covered extensively in the literature [14, 18, 19], so
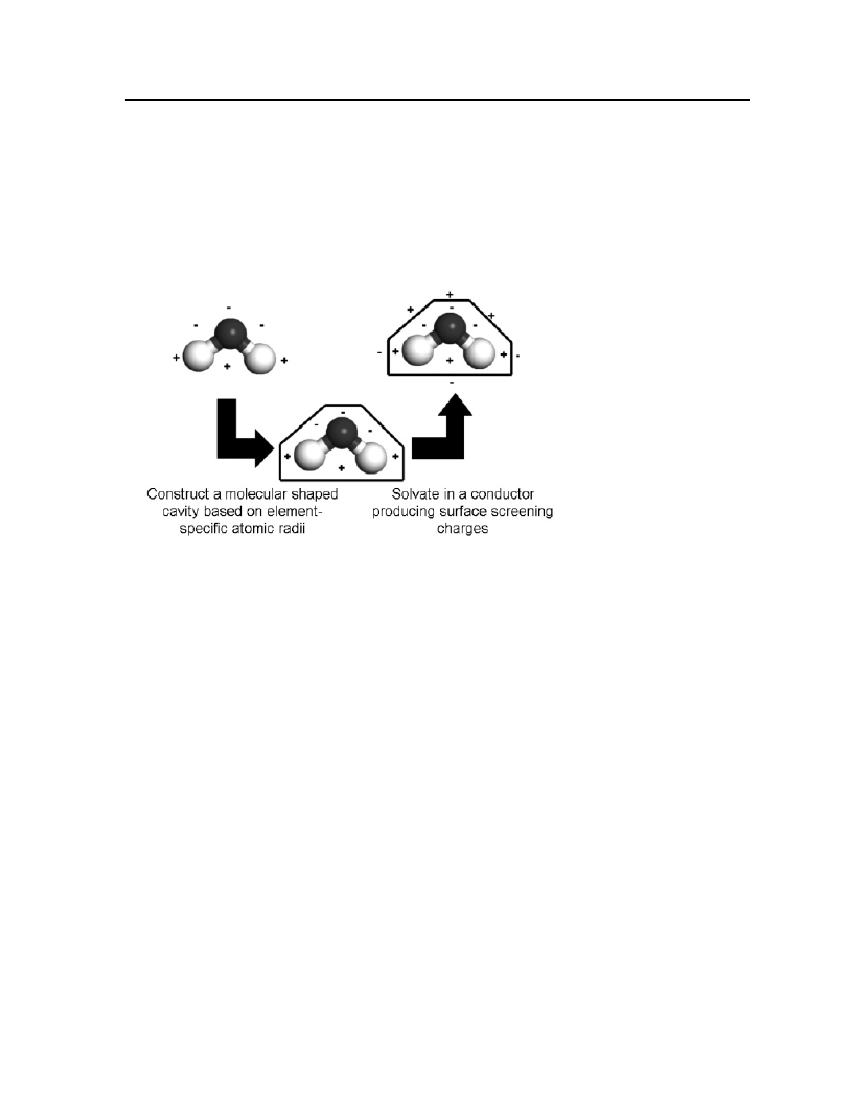
only a comparatively short discussion is given here. The basis of COSMO-based model is the“solvent-accessible surface” of a solute molecule. These COSMO-based models generate asurface charge distribution. Figure 1 shows the ideal solvation process in the COSMO-basedmodels [18].
Figure 1: Ideal solvation process in COSMO-based models[18]
COSMO-based models construct a molecular-shaped cavity within a perfectconductor according to a specific set of rules and atom-specific dimensions. Then themolecule’s dipole and higher moments draw charges from surrounding medium to thesurface of the cavity to cancel the electric field both inside the conductor and tangential to thesurface.The induced surface charges on the solute surface in discretized space is given by thefollowing equation(0)Φtot= Φi+ Φ(q∗)= Φi+Aq∗=0
(7.1)
Φtotis the total potential on the cavity surface,Φiis the potential due to the chargedistribution of solute moleculei,Φ(q∗) is the product of ideal screening chargeq*andcoulomb interaction matrixA. This coulomb interaction matrix describes the potentialinteractions between surface charges and is a function of cavity geometry [18].
13
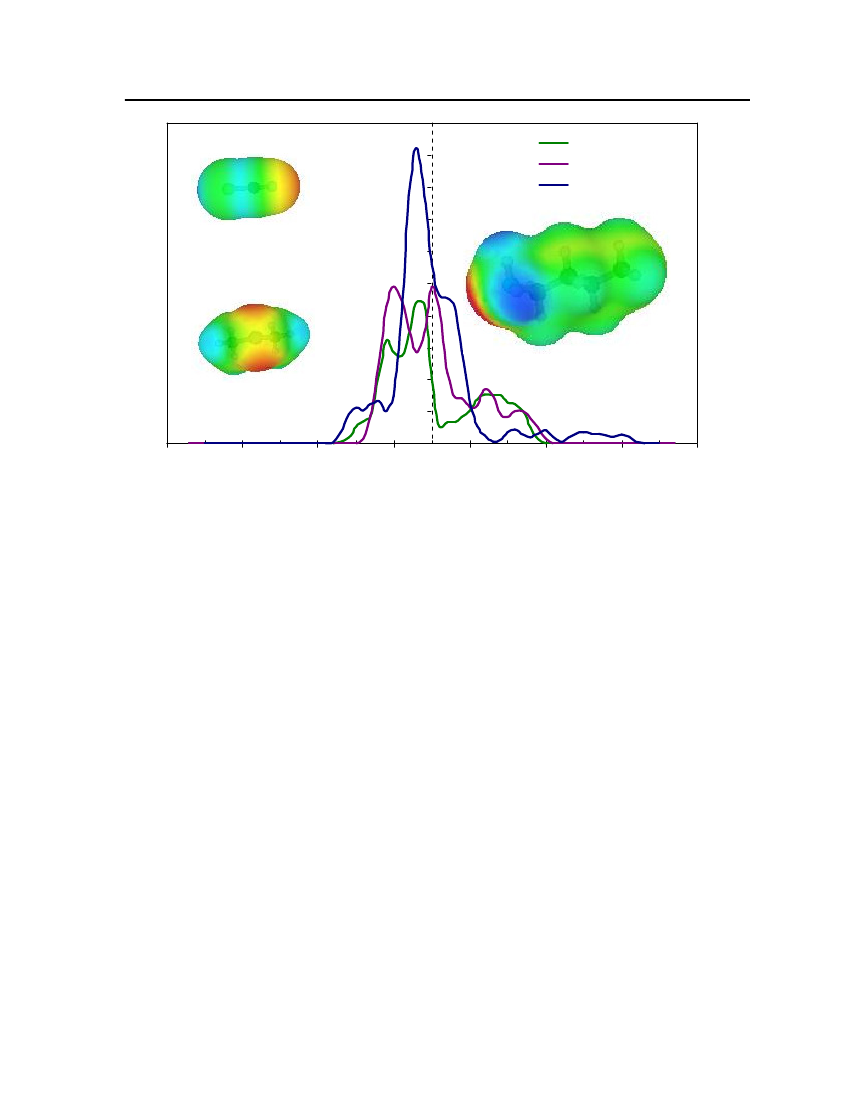
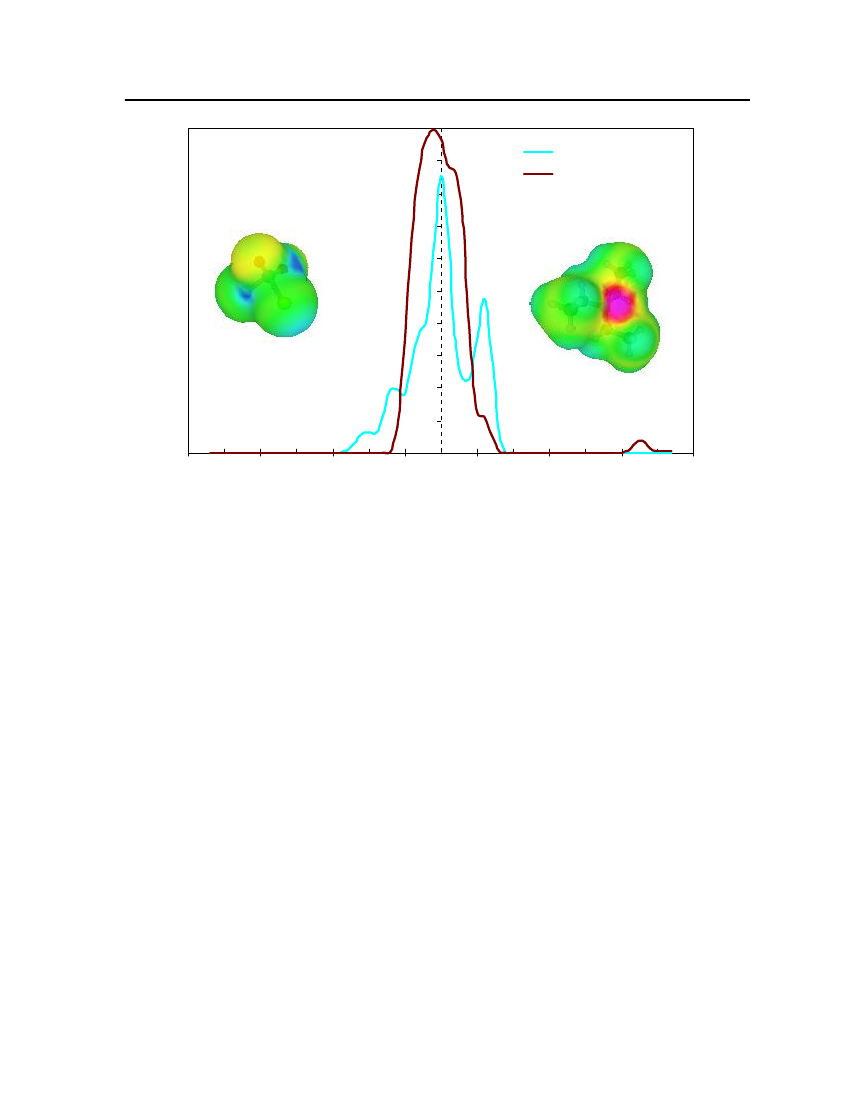
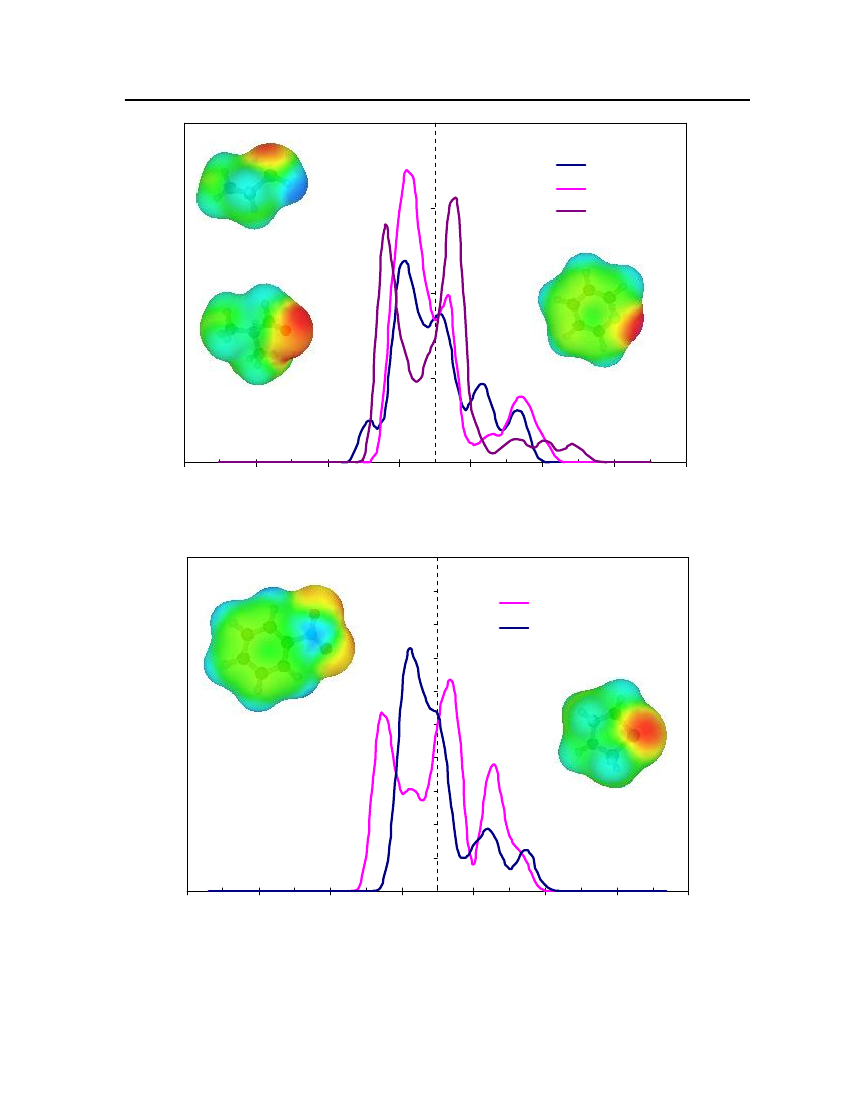
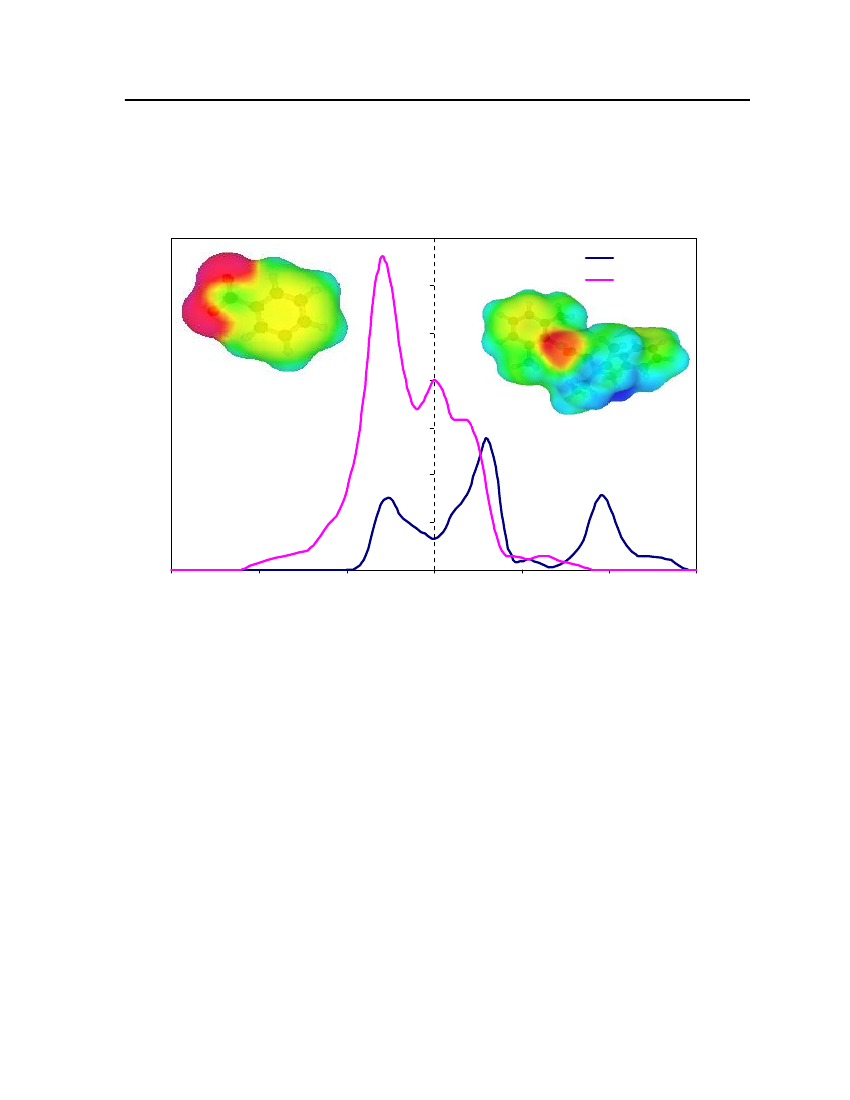
For the calculation of sigma profiles, a construction of the molecular–shaped cavity inthe solvent continuum is required and surface segments need to be distributed over the cavitysurface. The charge density distribution (σprofile,pi(σ) ) is calculated from the averagedsurface charge densities. The charge distribution is represented as probability distribution ofa molecular surface segment having a specific charge density. This probability distribution iscalled the sigma profile (pi(σ) ). The sigma profile for a moleculeiis defined aspi(σ)=ni(σ)Ai(σ)=niAi
(7.2)
whereni(σ) is the number of segments with charge densityσin a single moleculeiandAi(σ) is the total surface area from all these segments.The probability of finding a segment with charge densityσin a mixture is theweighted sum of theσprofiles of all the components
∑x n p(σ)∑x A p(σ)p(σ)==xn∑∑x Ai iiiiiiisi iiiii
(7.3)
Theσprofile which ispi(σ) as a function ofσ, quantifies the electronic properties of afluid and is the most important characteristic of each species in the COSMO-RS model.The effective surface charge density can be calculated by using the following equation.22rn2ravdmn∑σnr2+r2exp−r2+r2nnavn avσm=22rn2ravdmnexp−2 22rn2+ravrn+rav*
(7.4)
whereσmis surface-charge density on segmentm,rnis the radius of the actual surfacesegment (assuming circular segments),ravis the averaging radius (adjustable parameter), anddmnis the distance between the two segments. The paired segmentsmandnhave segmentcharge densitiesσmandσnrespectively [16]. Sigma profiles and sigma surfaces are readilyvisualized – see section 7.5.
14
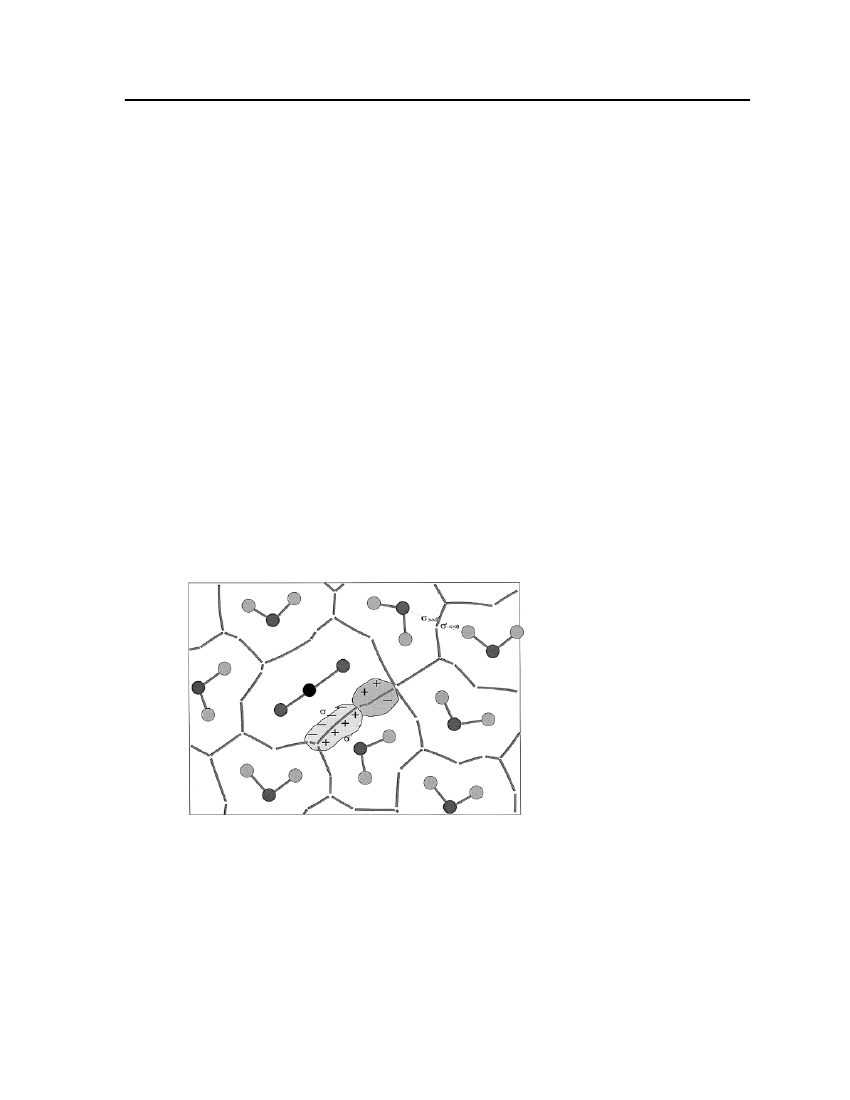
COSMO-RS theoryCOSMO-RS is a theory of interacting molecular surfaces as computed by quantumchemical methods (QM). Quantum chemical methods originally developed for isolatedmolecules i.e. for molecules in vacuum or in gas phase. The COSMO-RS is basis of COSMO(conductor-like screening model), which belongs to the class of QM continuum solvationmodels (CSMs). These CSMs are an extension of the basic QM methods towards thedescription of liquid phases. CSMs are describes the molecule in solution through a quantumchemical calculation of solute molecule with surrounding solvent as a continuum [14].COSMO theory of real solvents integrates concepts from quantum chemistry,dielectric continuum models, electrostatic surface interactions and statisticalthermodynamics. Basically QM-COSMO calculations provide a discrete surface around amolecule embedded in a virtual conductor. Figure 2 shows that each segmentiischaracterized by its areaaion the surface and the screening charge densityσion thissegment. A liquid is now considered to be an ensemble of closely packed ideally screenedmolecules as shown in Figure 2. The system has to be compressed in order to get closepacking and the molecules are slightly deformed from their original positions.
Figure 2: Schematic illustration of contacting molecular cavities and contact interactions [14].
Each piece of molecular surface is in close contact with another one. Assuming that eachmolecule is enclosed by virtual conductor and then the electrostatic interaction arises fromthe contact of two different screening charge densities (SCDs). The energy differencebetween the real situation of such contact and ideally screened situation is defined as a localinteraction energy, which results from the contact of molecules. The difference between the
15
screening charge densitiesσandσ'of a contact pair is a measure of the misfit of the SCDon both segments in the real system, compare to the situation inside the ideal conductor.Emisfit(σ,σ')=aeff
α'2
(σ+σ')2
(7.5)
whereaeffis the effective contact area between two surface segments andα'is an energyfactor.Hydrogen bonding can also described between two adjacent SCDs. Hydrogen bondingdonors having a strongly negative SCD and acceptors have strongly positive SCDs. If twopolar pieces of surface with opposite polarity are in contact with each other then hydrogenbonding occurs. This interaction energy is expressed asEHB=aeffcHBmin(0; min(0;σdonor+σHB) max(0;σdonor−σHB))
(7.6)
wherecHBandσHBare adjustable parameters. COSMO-RS can also counts the van derWaals interaction between segments by the following expressionEvdW=aeff(τvdW+τ'vdW)
(7.7)
whereτvdWandτ'vdWare element specific adjustable parameters. The van der Waals energydepends only on the element type of the atoms that are involved in surface contact. Statisticalthermodynamics provides the link between microscopic surface interaction energies andmacroscopic thermodynamic properties of a liquid. Since in COSMO-RS all molecularinteractions consist of local pair-wise interactions of surface segments, the statisticalaveraging can be done in the ensemble of interacting surface pieces. The composition of thesurface segment ensemble with respect to the interaction can be described by sigma profiles.The sigma profile of the whole system/mixture is just the sum of theσ-profiles of thecomponentsXiweighted with their mole fraction in the mixturexips(σ)=∑xipxi(σ)i∈S
(7.8)
The chemical potential of a surface segment with SCDσin an ensemble described bynormalized distribution functionps(σ) is given byaeffRT�s(σ)= −lnps(σ') exp(�s(σ')−Emisfit(σ,σ')−EHB(σ,σ'))dσ'aeff∫RT
(7.9)
16
�s(σ) is a measure of the affinity of the systemSto a surface of polarityσ. It is acharacteristic function of each system and is called “σpotential”. The COSMO-RSrepresentation of molecular interactions is namely theσprofiles andσpotentials ofcompounds and mixtures.COSMO-RS is also able to provide a reasonable estimate of a pure compoundschemical potential in the gas phaseXXXXX�Gas=EGas−ECOSMO−EvdW+ωRingnRing+ηGasRTiiiii
(7.10)
XiXiwhereEGasandECOSMOare the quantum chemical total energies of the molecule in the gasXiphase and in the COSMO conductor respectively.EvdWis the van der Waals energy ofXi.
The remaining contributions consist of a correction term for ring shaped molecule withXinRingbeing the number of ring atoms in the molecule.ωRingis an adjustable parameter and the
parameterηGasprovides the link between the reference states of the system’s free energy inthe gas phase and in the liquid [14].Once the chemical potential of pure compound has been computed in solution and in theideal gas phase, the vapor pressure of the pure compound can be calculated as:XXi�Xii−�GasP(T)=expkTXivap
(7.11)
XWherePvapiis the vapor pressure of pure compoundXi,kis the Boltzmann constant,Tis theXtemperature and�Xiiis the pseudo-chemical potential of pure compoundXiin a liquidXi.
After the vapor pressure of the pure compound has been calculated, COSMO-RS can predictvapor liquid equilibrium in mixtures using the standard thermodynamic relation:.
γSXi
X�SXi−�Xii=expRT
(7.12)(7.13)
Xiptotal=∑pvapxiγSXiiXipvapxiγSXi
yi=
ptot
(7.14)
17
In equation (7.12)γSXiis the activity coefficient of pure compoundXiin solution which isconsidered the continuum medium according to COSMO model,ptotalis the total vaporpressure of the mixture that is used to predict the vapor liquid equilibrium diagram,Xiis themole fraction of compounds in the liquid phase andYiis the mole fraction of compounds inthe gas phase. The vapor liquid equilibrium calculations in COSMO-RS are thus done basedon vapor pressure and the activity coefficients of the compounds in solution.
18
7.3
Malodorants
These compounds were initially chosen based on their deterrent effect (mainly odor) and thenchecked for suitability with respect to their physical properties (phase behavior andsolubility). The compounds selected for study are shown in Table 4.Table 4: MalodorantsS.NoMalodorants1.2.3.4.5.6.7.8.9.10.11.12.13.14.15.16.17.18.19.20.21.22.23.24.25.26.TriethylamineDenatonium benzoateIsobutyraldehydeTetrahydrothiopheneDimethylsulfide2,2,4 TrimethylpentanePicoline(2-Methylpyridine)Eucalyptol (1,8 Cineole)Nitrobenzene1-PentanolSulfurylchlorideCyanogenchlorideBis-(2-chloroethyl)sulfideCAS-number Chemicalformula121-44-83734-33-678-84-2110-01-075-18-3540-84-1109-06-8470-82-698-95-371-41-07791-25-5506-77-4505-60-2C6H15NDeterrent effectStrong fishyDIPPRdatabaseYesNoYesYesYesYes
C28H34N2O3Bitter tasteC4H8OC4H8SC2H6SC8H18C6H7NC10H180C6H5NO2C5H12OSO2Cl2CClNC4H8Cl2SC6H13Cl2NC2H5AsCl2C8H6BrNCCl3NO2C13H10AsNC2H6SC2CH4Cl2OC8H7NOC3H8O2C3H6O3C8H7ClOC8H7NC5H5NExtremely unpleasantStrong unpleasant odorUnpleasant odorGasoline/Petrol
Unpleasant (strong) odor YesStrong aromatic and spicy Nobitter (Almond-like odor) YesCharacteristic odor, stench YesBitter, Pungent odor,YesirritatingBitter, Pungent odor,YesirritatingGarlic or Horse radishFaint, Fishy, or mustyFruity but biting andirritatingSoured or rotting fruitStinging, pungent odorNoNoNoNoNo
Bis-(2-chloroethyl)ethylamine538-07-8EthyldichloroarsineBromobenzylcyanideChloropicrinDiphenylcyanoarsineEthylmercaptanBis(chloromethyl)ether2-AminophenolPropyleneglycols-Trioxane2-ChloroacetophenoneIndolePyridine598-14-116532-79-976-06-223525-22-675-08-1542-88-195-55-657-55-6110-88-3532-27-4120-72-9110-86-1
Garlic and bitter almonds NoGarlic odorStrong unpleasant odorPhenol-like (strongirritating)Mild odorIrritating odorEye, throat, skin irritantUnpleasant (strong)Characteristic fish likesmellYesYesNoYesYesNoYesYes
19
27.
Butylamine
109-73-9
C4H11N
Characteristic fish likesmell
Yes
A brief discussion of each component follows in sections 7.3.1 – 7.3.27.
20
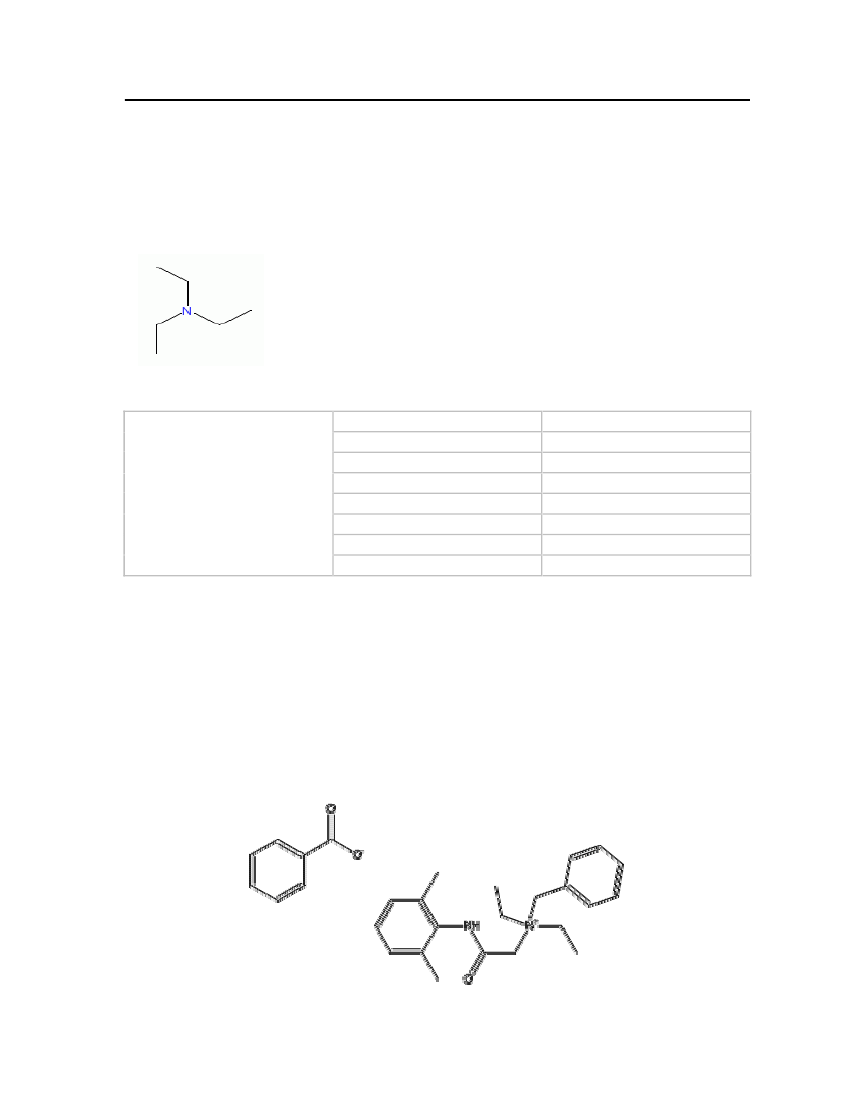
7.3.1 TriethylamineTriethylamine occurs as a colorless flammable liquid and it is soluble in water and otherorganic solvents. It has been selected based on its strong fishy ammonia-like odor. Theproperties of triethylamine are shown in Table 5.Molecular Structure:
Table 5: Properties of Triethylamine
Triethylamine
OdorMolecular WeightCritical TemperatureCritical PressureCritical VolumeMelting PointNormal Boiling PointLiquid Molar Volume
Strong fishy101.19 kg/kmol535.15 K30.4 bar0.39 m�/kmol158.45 K361.92 K0.139672 m�/kmol
7.3.2 Denatonium Benzoate (Bitrex)Denatonium Benzoate has an extremely bitter taste. It is easily soluble in water, alcohol andother solvents. Bitrex is not a very toxic substance and has been added to a wide range ofchemicals to deter ingestion. Addition of Bitrex to alcohol makes it unfit for consumption. Itis also added to all kinds of harmful liquids including solvents, paints, varnishes, toiletriesand other household products. The physical and chemical properties are shown in Table 6.Molecular Structure:
21
Table 6: Properties of Denatonium benzoate (Bitrex)
Denatonium benzoate
OdorMolecular WeightFreezing/Melting Point
Bitter taste446.581 kg/kmol163-170oC
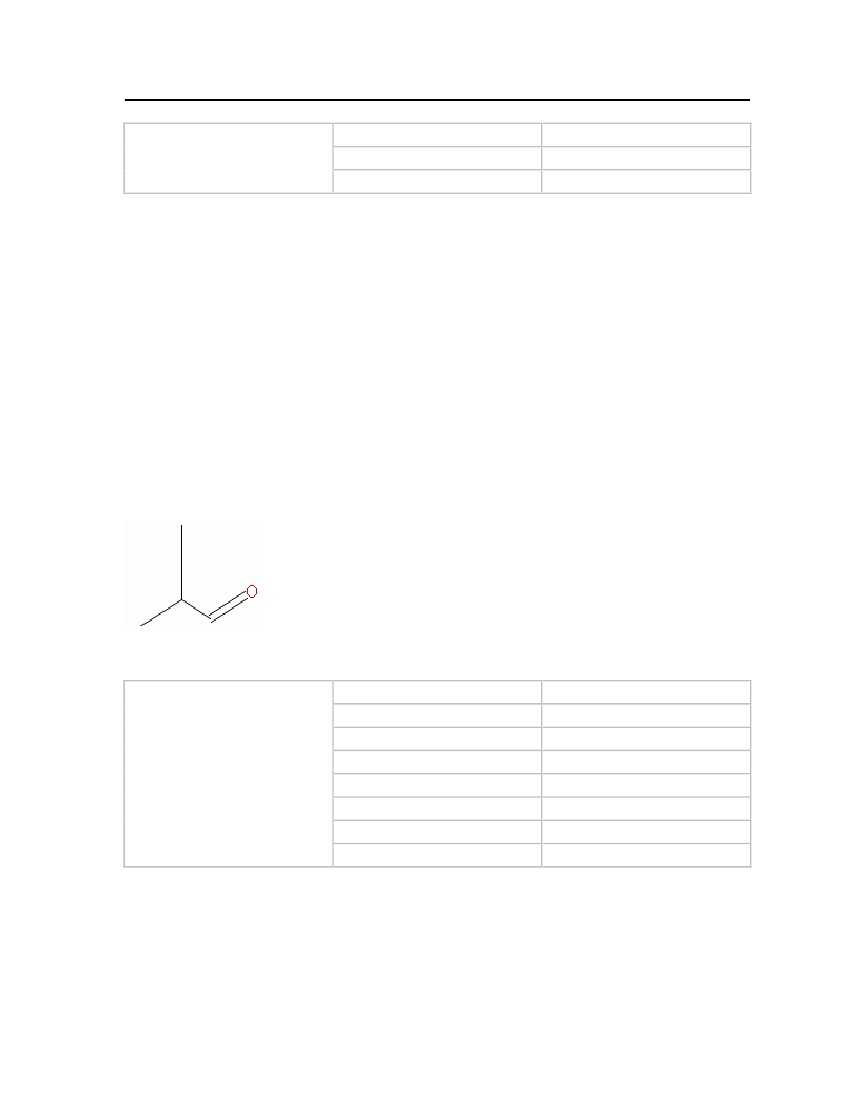
It is considered that this comparatively large molecule would not be a suitable deterrentadditive to butane because of its low vapor pressure. However it is included here forcompleteness since it is one of the few examples of deterrents which is actually added tocommercial products.7.3.3 IsobutyraldehydeIsobutyraldehyde (isobutanal) is a liquid at ambient temperatures and is soluble in water. It isconsidered a highly flammable liquid which can easily be ignited by heat, spark or flame.Isobutanal is selected based on its unpleasant smell. The physical and chemical properties areshown in Table 7.Molecular Structure:
Table 7: Properties of Isobutyraldehyde
Isobutyraldehyde
OdorMolecular WeightCritical TemperatureCritical PressureCritical VolumeFreezing/Melting PointNormal Boiling PointLiquid Molar Volume
Extremely unpleasant smell72.10572 kg/kmol507 K41.0 bar0.263 m�/kmol208.15 K337.25 K0.0920264 m�/kmol
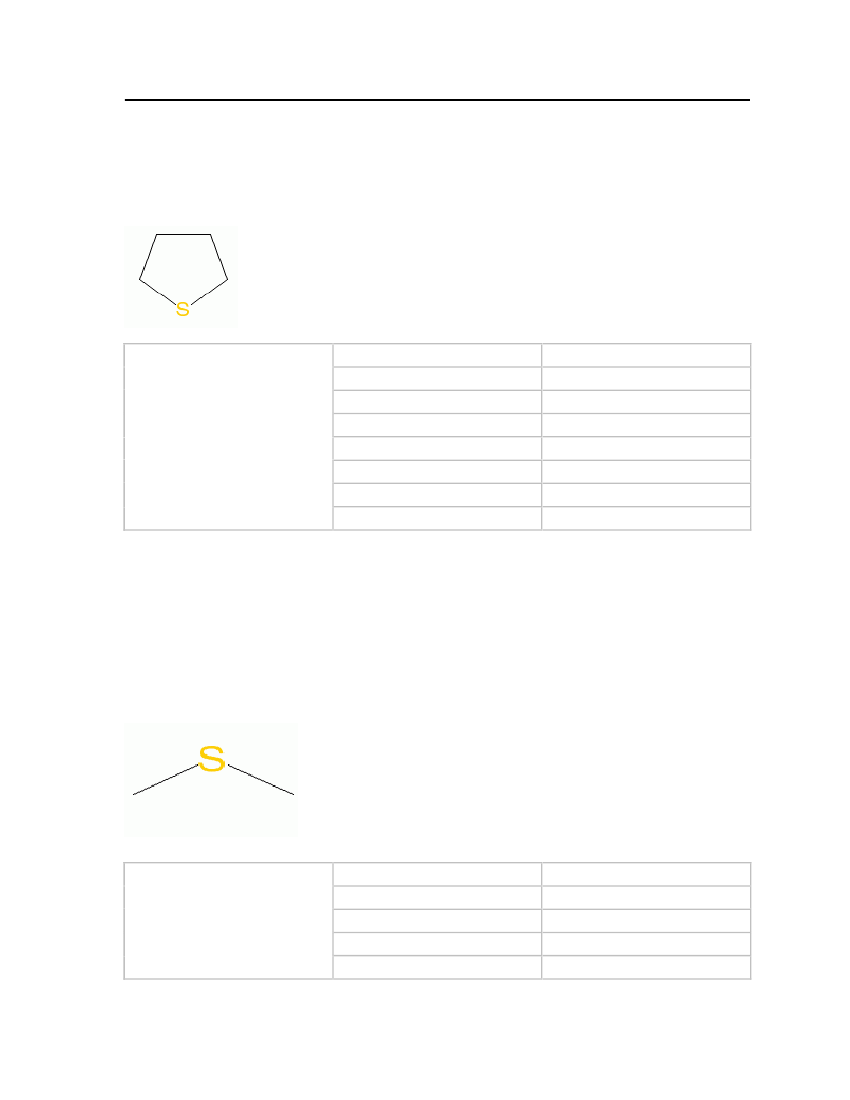
7.3.4 TetrahydrothiopheneTetrahydrothiophene (thiolane) is a heterocyclic organic compound. It consists of a five-membered ring containing four carbon atoms and one sulfur atom. It has a strong unpleasant
22
odor and is used as an odorant in natural gas. Thiolane is easily soluble in water but isinsoluble in other solvents such as ether and ethanol.
Molecular Structure:
Table 8: Properties of Tetrahydrothiophene
Tetrahydrothiophene
OdorMolecular WeightCritical TemperatureCritical PressureCritical VolumeMelting PointNormal Boiling PointLiquid Molar Volume
Strong unpleasant odor88.17132 kg/kmol631.95 K51.6 bar0.249 m�/kmol176.99 K394.267 K0.0887032 m�/kmol
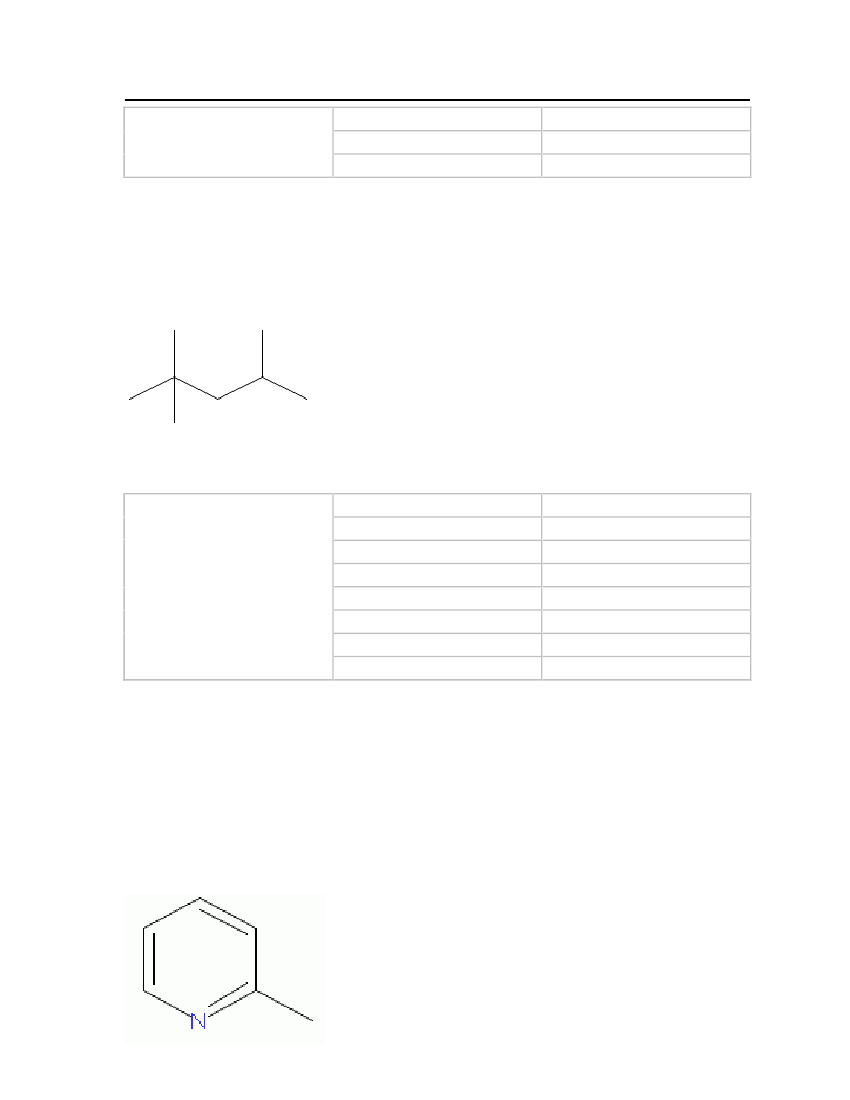
7.3.5 DimethylsulfideDimethyl sulfide is a low molecular weight organosulfur compound with a garlic-like odor. Itis stable and incompatible with strong oxidizing agents. This compound is slightly soluble inwater. It is used as a flavor in other products. The physical and chemical properties areshown in Table 9.Molecular Structure:
Table 9: Properties of Dimethylsulfide
Dimethylsulfide
OdorMolecular WeightCritical TemperatureCritical PressureCritical Volume
Garlic like odor62.13404 kg/kmol503.04 K55.3 bar0.201 m�/kmol
23
Melting PointNormal Boiling PointLiquid Molar Volume7.3.6 2, 2, 4-Trimethyl pentane
174.88 K310.48 K0.0737373 m�/kmol
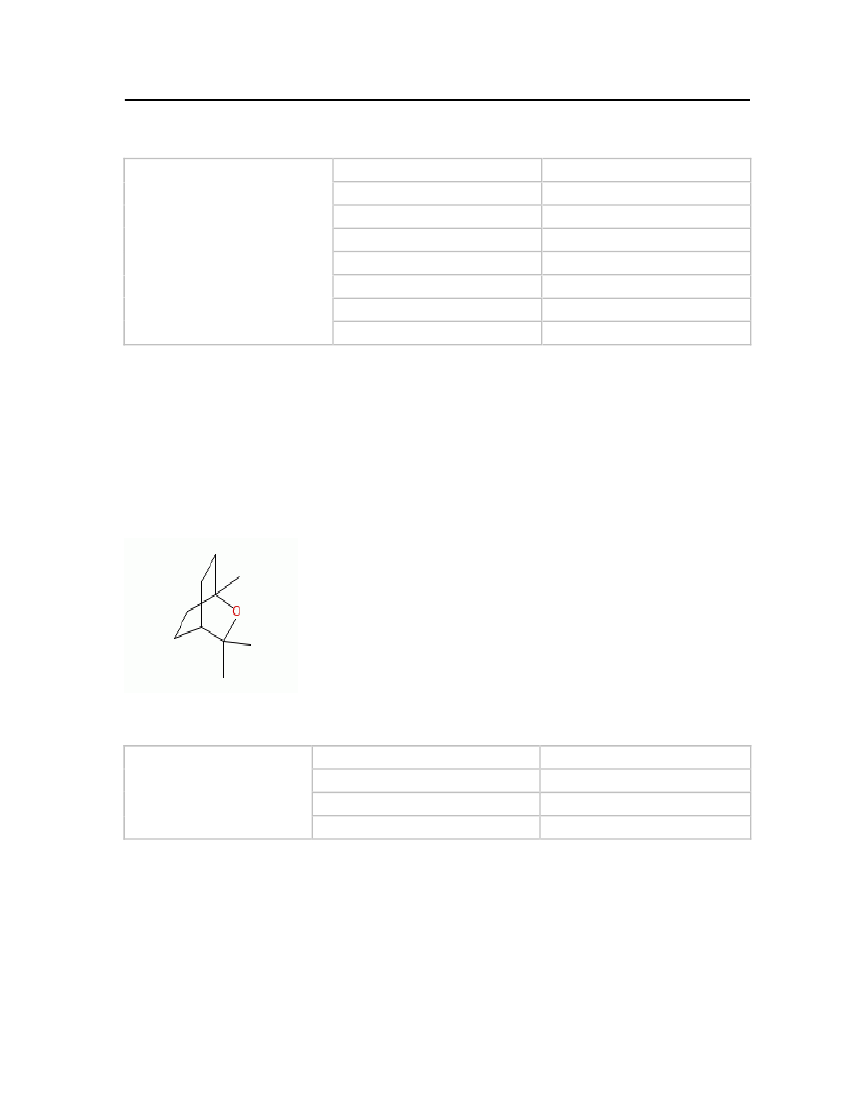
Isooctane is clear, colorless liquid which smells like gasoline. It is used as a solvent and todetermine the octane number of fuels.Molecular Structure:
Table 10: Properties of 2. 2. 4-Trimethyl pentane
2,2,4 Trimethylpentane
OdorMolecular WeightCritical TemperatureCritical PressureCritical VolumeFreezing/Melting PointNormal Boiling PointLiquid Molar Volume
Gasoline smell114.22852 kg/kmol543.8 K25.7 bar0.468 m�/kmol165.777 K372.388 K0.165478 m�/kmol
7.3.7
Picoline (2-methyl pyridine)
Picoline is a colorless liquid at room temperature and pressure. It is obtained from coal tarand has a putrid fish-like odor. Picoline is useful as a solvent and as a raw material forvarious chemical products used in polymers, textiles, fuels and pharmaceuticals. Theproperties are shown in Table 10.Molecular Structure:
24
Table 11: Properties of Picoline
2-Methylpyridine (Picoline)
OdorMolecular WeightCritical TemperatureCritical PressureCritical VolumeMelting PointNormal Boiling PointLiquid Molar Volume
Unpleasant (Strong)93.12648 kg/kmol621 K46.0 bar0.335 m�/kmol206.44 K402.55 K0.0990828 m�/kmol
7.3.8
Eucalyptol (1.8 Cineole)
Eucalyptol is obtained from oil of eucalyptus and it is natural organic compound. It is acolorless liquid and having strong aromatic odor. It is used in flavoring, fragrances andcosmetics. It is also ingredient in many brands of mouthwash and cough suppressant. Theproperties are shown in Table 12.Molecular Structure:
Table 12: Properties of Eucalyptol
Eucalyptol (1, 8 Cineole)
OdorMolecular WeightFreezing/Melting PointNormal Boiling Point
Strong aromatic odor and spicy154.2491.5oC176-177oC
7.3.9
Nitrobenzene
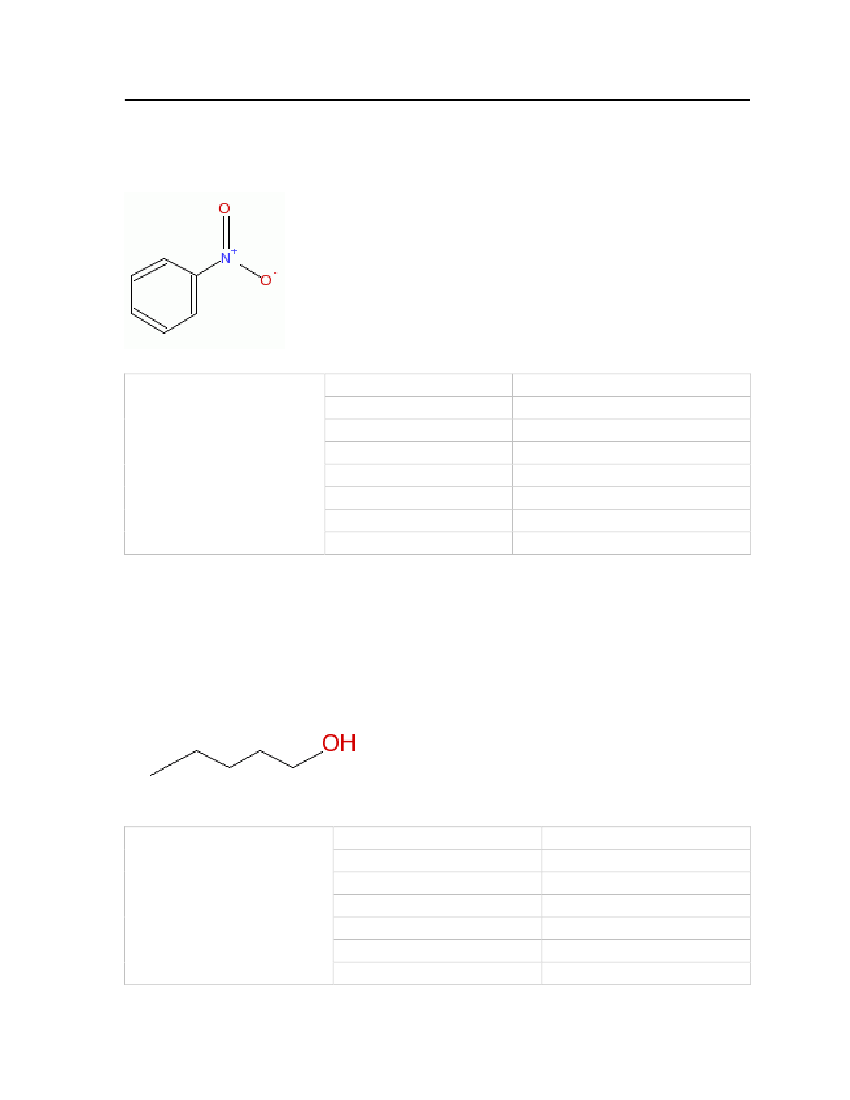
Nitrobenzene is an aromatic nitro compound with an odor resembling that of bitter almonds.It is colorless to pale yellow, oily liquid or as greenish yellow crystals. Mostly nitrobenzeneis used in the manufacturing of aniline. Nitrobenzene is used in pesticides, rubber chemicals,
25
pharmaceuticals and dyes. It is also used as solvent in petroleum refining and synthesis ofother organic compounds. The properties are shown in Table 13.Molecular Structure:
Table 13: Properties of Nitrobenzene
Nitrobenzene
OdorMolecular WeightCritical TemperatureCritical PressureCritical VolumeMelting PointNormal Boiling PointLiquid Molar Volume
Strong bitter (Almond-like odor)123.11 kg/kmol719.00 K44.0 bar0.35 m�/kmol278.91 K483.95 K0.10 m�/kmol
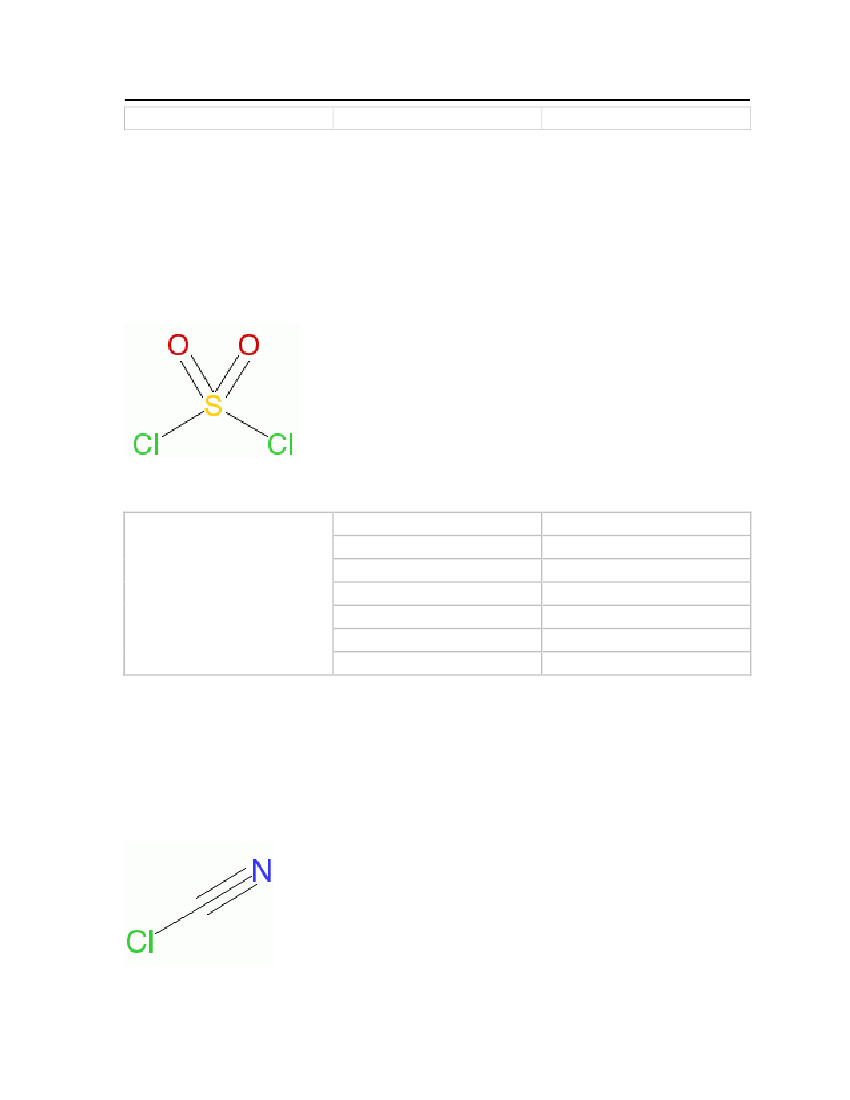
7.3.10 1-Pentanol1-Pentanol is clear, colorless liquid with characteristic choking odor. It is obtained by thefermentation of starches and from the distillation of petroleum. The physical and chemicalproperties are shown in Table 14.Molecular Structure:
Table 14: Properties of 1-Pentanol
1-Pentanol
OdorMolecular WeightCritical TemperatureCritical PressureCritical VolumeMelting PointNormal Boiling Point
Characteristic odor. stench88.1482 kg/kmol588.1 K38.97 bar0.326 m�/kmol195.56 K410.9 K
26
Liquid Molar Volume7.3.11 Sulfuryl chloride
0.10854 m�/kmol
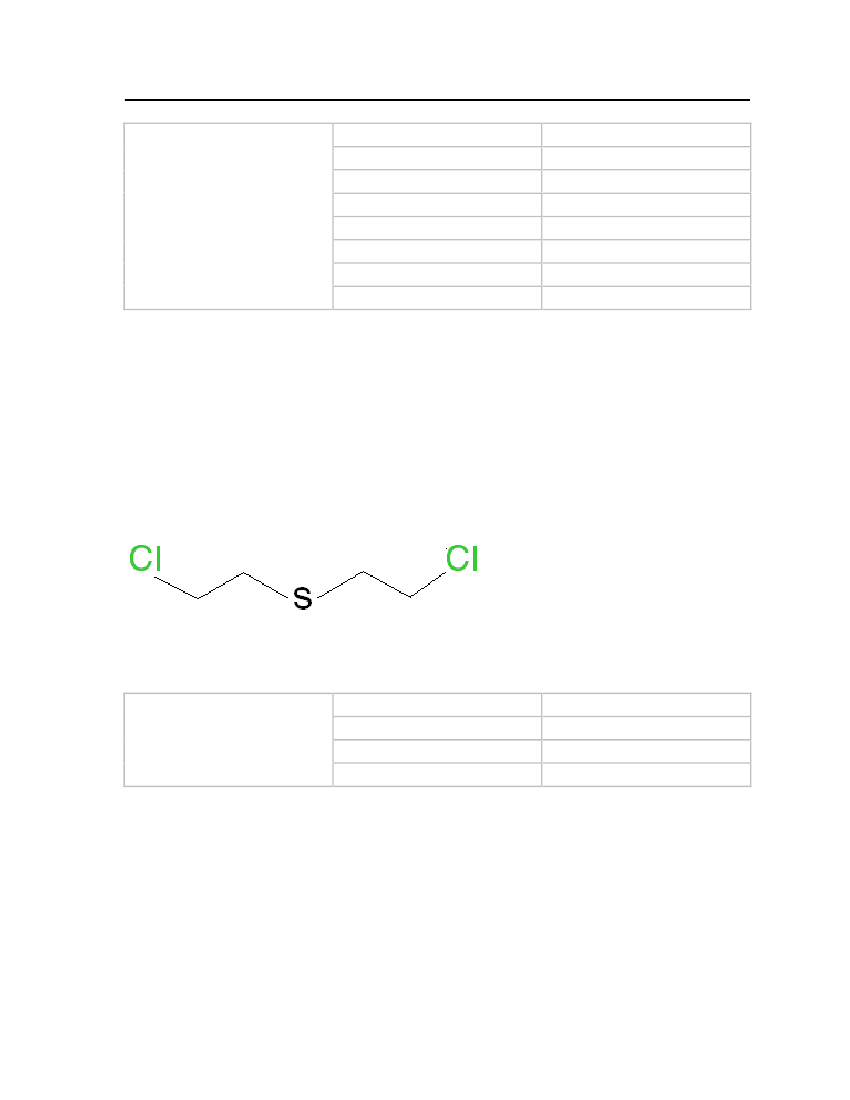
Sulfuryl chloride is colorless liquid and having a pungent odor. It is used as chlorinating anddehydrating agent and boils at 69oC. It is decomposed by hot water and alkaline substances.It is soluble in most organic solvents like benzene, chloroform, carbon tetrachloride andacetic acid. The chemical and physical properties are shown in Table 15.Molecular Structure:
Table 15: Properties of sulfuryl chloride
Sulfurylchloride
OdorMolecular WeightCritical TemperatureCritical PressureCritical VolumeMelting PointNormal Boiling Point
Bitter, Pungent odor, irritating134.9698 kg/kmol545 K46.1 bar0.234 m�/kmol219 K342.55 K
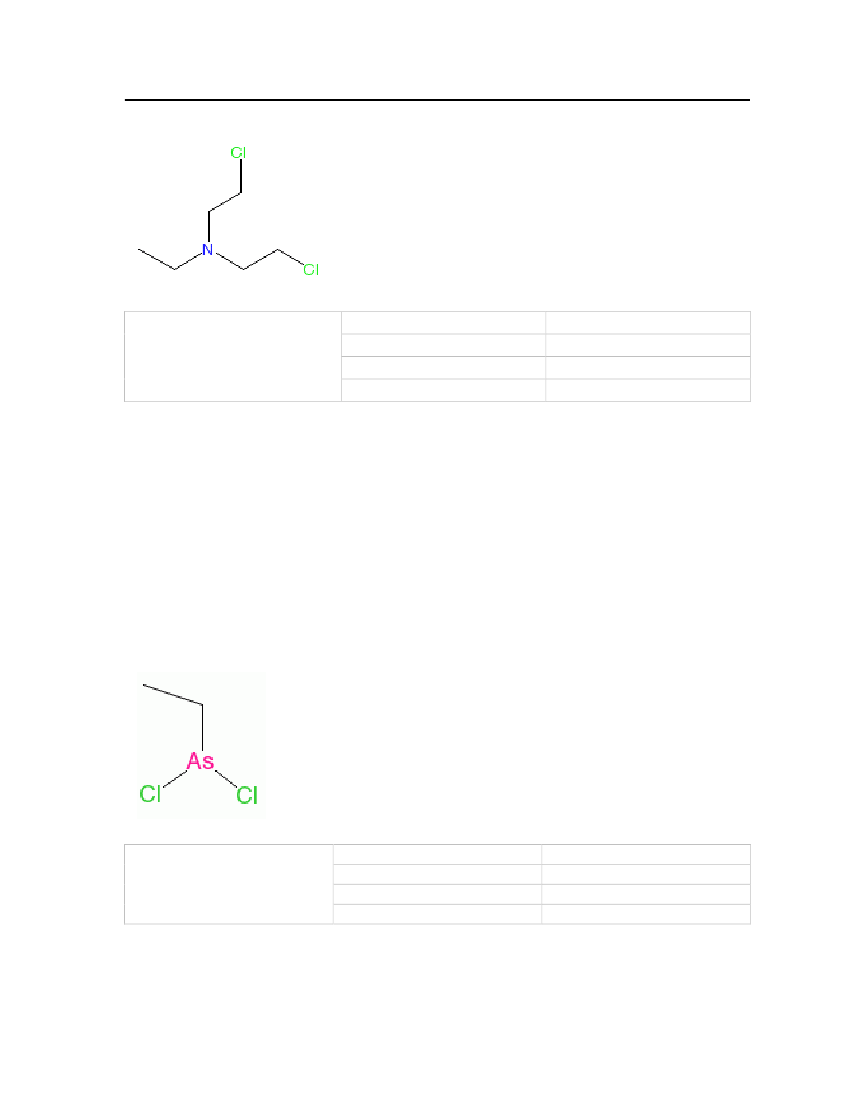
7.3.12 Cyanogen chlorideCyanogen chloride is a colorless, highly volatile liquid with a pungent, biting odor. Thiscompound is selected because of its tearing and irritating properties. Normally cyanogenchloride is non-persistent and is used as a quick-acting casualty agent.Molecular Structure:
27
Table 16: Properties of cyanogen chloride
Cyanogenchloride
OdorMolecular WeightCritical TemperatureCritical PressureCritical VolumeMelting PointNormal Boiling PointLiquid Molar Volume
Pungent, biting and irritating61.4704 kg/kmol449 K59.9 bar0.163 m�/kmol266.65 K286 K0.0524536 m�/kmol
7.3.13 Bis-(2-chloroethyl) sulfideBis-(2-chloroethyl) sulfide is a colorless to amber-colored liquid with garlic like odor and itis more stable in storage. This compound is lighter than water and small droplets will float onwater surfaces and present a hazard. It was selected because of its garlic like odor. Theeffects from this compound are vomiting, fever and skin reddening. The physical andchemical properties are shown in Table 17.Molecular Structure:
Table 17: Properties of Bis-(2-chloroethyl) sulfide
Bis-(2-chloroethyl) sulfide
OdorMolecular WeightFreezing/Melting PointNormal Boiling Point
Garlic or horse radish159.0814.45oC227.8oC
7.3.14 Bis-(2-chloroethyl) ethylamineBis-(2-chloroethyl) ethylamine is more volatile, colorless liquid with a fishy or musty odor. Itwas selected because of its fishy odor and it is easily soluble in organic solvents. Severevapor exposure will result in redness of the skin, causing irritation and itching.
28
Molecular Structure:
Table 18: Properties of Bis-(2-chloroethyl) ethylamine
Bis-(2-chloroethyl) ethylamine OdorMolecular WeightFreezing/Melting PointNormal Boiling Point
Faint, fishy, or musty170.08-34oC194oC
It is considered that this comparatively large molecule with a high boiling point would not bea suitable deterrent additive to butane.7.3.15 EthyldichloroarsineTable 19 shows the physical and chemical properties of ethyldichloroarsine and it is a liquidwith a fruity but biting and irritating odor. It is selected due to its biting and irritating odor. Itis easily soluble in alcohol and acetone. Arsine-containing agents irritate the eyes and theliquid may produce severe eye injury.Molecular Structure:
Table 19: Properties of Ethyl dichloroarsine
Ethyldichloroarsine
OdorMolecular WeightMelting PointNormal Boiling Point
Fruity but biting and irritating174.88 kg/kmolLess than -65oC156oC
29
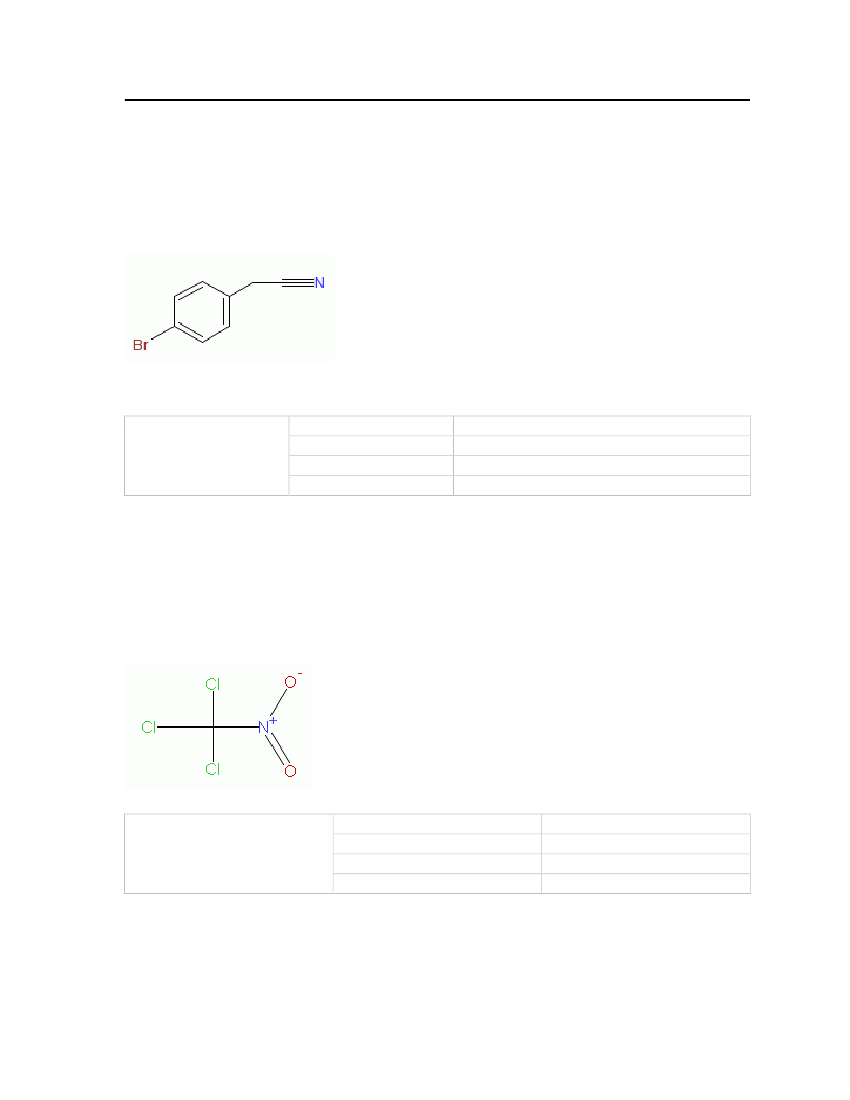
7.3.16 BromobenzylcyanideBromobenzylcyanide was the first tearing agent used and it produces irritation and tearing ofthe eyes with pain in the forehead. It is mainly considered based on the fact that it is anirritant. The physical and chemical properties are shown in Table 20.Molecular Structure:
Table 20: Properties of Bromobenzylvyanide
Ethyldichloroarsine
OdorMolecular WeightMelting PointNormal Boiling Point
Soured or rotting fruit. Irritant, tearing agent196 kg/kmol25.5oC242oC
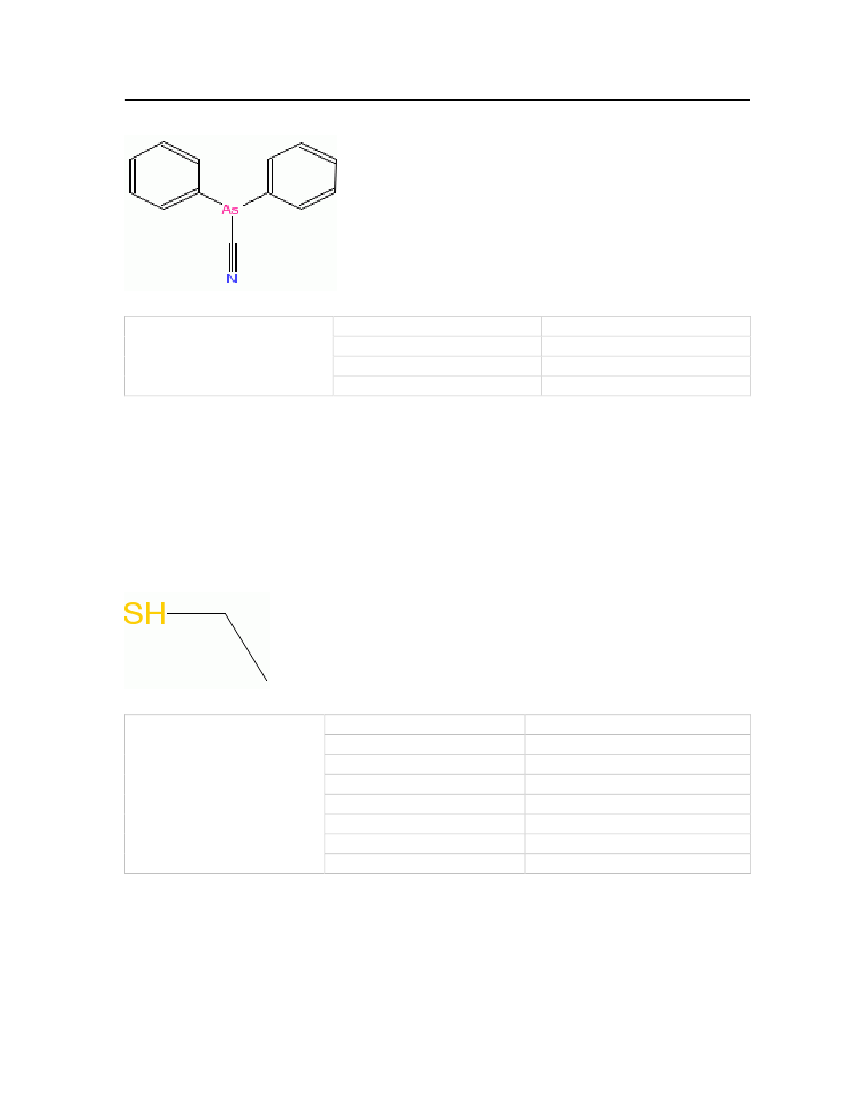
7.3.17 ChloropicrinChloropicrin is a pungent. Colorless, oily liquid and it was shown in Table 21. It is veryvolatile and a powerful irritant. The vapors cause irritation, coughing and vomiting. It isconsidered based on odor and its solubility in organic solvents.Molecular Structure:
Table 21: Properties of Trichloronitromethane
Chloropicrin
OdorMolecular WeightFreezing/Melting PointNormal Boiling Point
Stinging. Pungent odor164.375 kg/kmol-69oC112oC
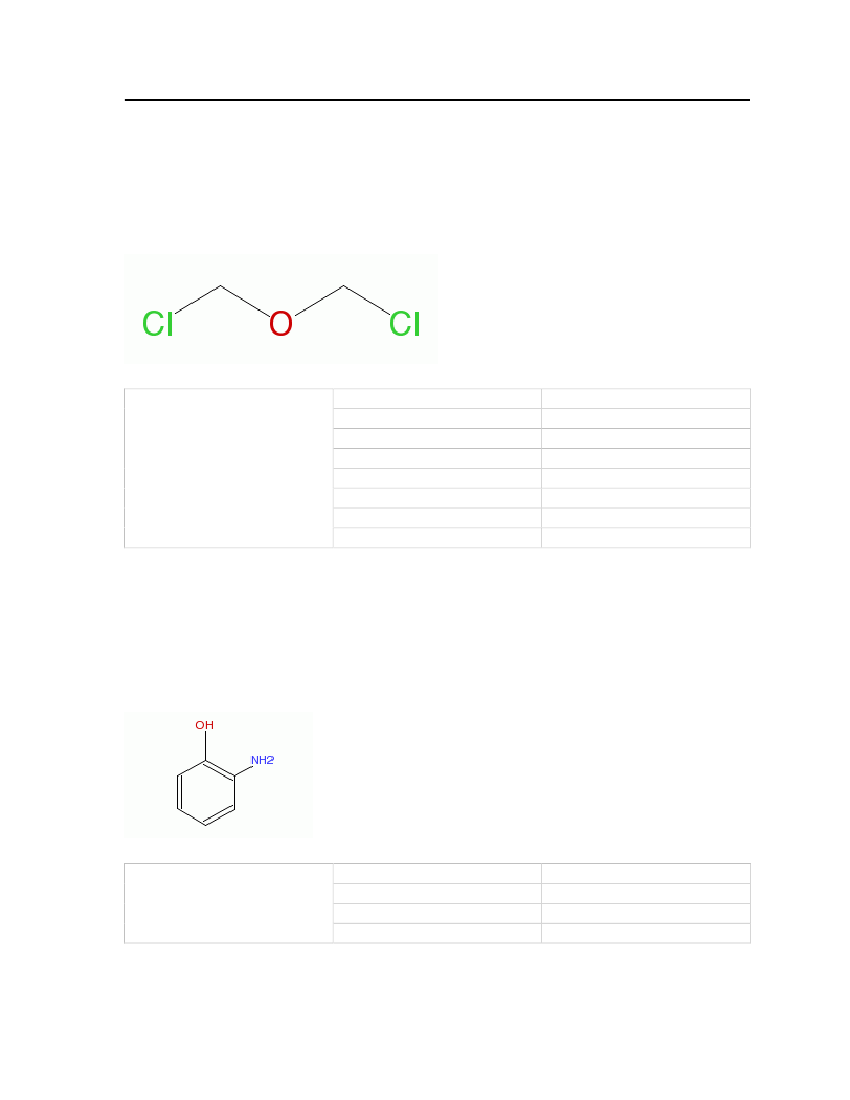
7.3.18 DiphenylcyanoarsineThe properties of diphenylcyanoarsine are shown in Table 22. This compound producesstrong irritation, vomiting and it is selected based on its odor of garlic and bitter almonds.
30
Molecular Structure:
Table 22: Properties of Diphenylcyanoarsine
Diphenylcyanoarsine
OdorMolecular WeightFreezing/Melting PointNormal Boiling Point
Garlic and bitter almonds255.147 kg/kmol-31.5oC350oC
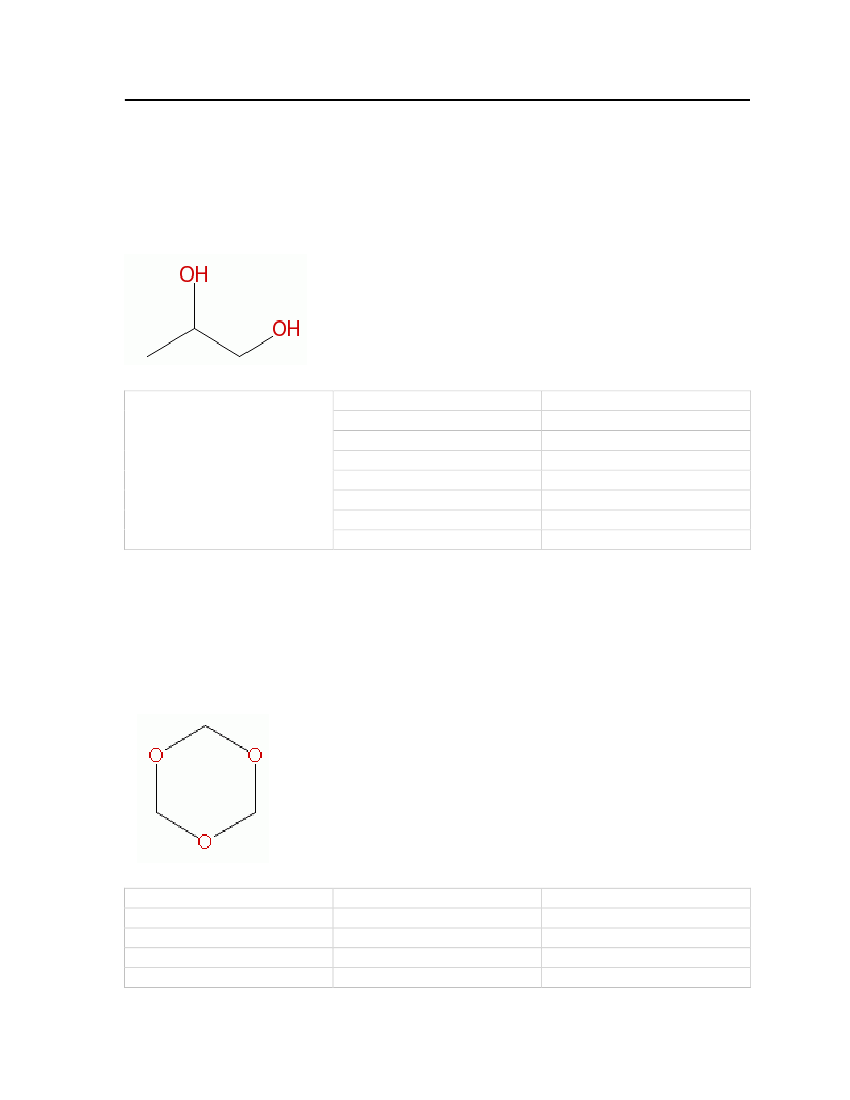
7.3.19 Ethyl mercaptanEthyl mercaptan is a colorless liquid and it has a strong garlic odor. Mercaptans are added tofuel at the refinery and local distribution centers. Addition of mercaptans to petrol increasessulfur levels. It is included here partly because some experimental data for the binary systemethyl mercaptan – butane exists.Molecular Structure:
Table 23: Properties of Ethylmercaptan
Ethylmercaptan
OdorMolecular WeightCritical TemperatureCritical PressureCritical VolumeMelting PointNormal Boiling PointLiquid Molar Volume
Garlic odor62.13404 kg/kmol499.15 K54.9 bar0.207 m�/kmol125.26 K308.153 K0.0746133 m�/kmol
31
7.3.20 Bis(chloromethyl)etherBis(chloromethyl)ether is a chemical with a strong unpleasant odor. It is clear liquid at roomtemperature, but readily evaporates into air. Table 24 shows the physical and chemicalproperties of Bis(chloromethyl)ether.Molecular Structure:
Table 24: Properties of Bis (chloromethyl) ether
Bis(chloromethyl)ether
OdorMolecular WeightCritical TemperatureCritical PressureCritical VolumeMelting PointNormal Boiling PointLiquid Molar Volume
Strong unpleasant odor114.95856 kg/kmol579 K45.8 bar0.258 m�/kmol231.65 K378 K0.0876502 m�/kmol
7.3.21 2-Amino phenol2-Amino phenol is used as an intermediate for azo and sulfur dyes. It is off-white in colorand has a strong irritating odor. This compound is selected based on odor and solubilityproperties. The physical and chemical properties are shown in Table 25.Molecular Structure:
Table 25: Properties of 2-Aminophenol
2-Aminophenol
OdorMolecular WeightMelting PointNormal Boiling Point
Phenol-like (strong irritating)109.13 kg/kmol172oC164oC
32
7.3.22 PropyleneglycolPropyleneglycol is a colorless, viscous and hydroscopic liquid and it is used in anti freezingsolutions, hydraulic fluids, and as a solvent. The physical and chemical properties are shownin Table 26.Molecular Structure:
Table 26: Properties of Propylene glycol
Propyleneglycol
OdorMolecular WeightCritical TemperatureCritical PressureCritical VolumeMelting PointNormal Boiling PointLiquid Molar Volume
Mildodor76.09442 kg/kmol626 K61 bar0.239 m�/kmol213.15 K460.75 K0.0736939 m�/kmol
7.3.23 s-Trioxanes-Trioxane is a stable cyclic trimer of formaldehyde with a chloroform odor. It is a colorless,crystalline solid. It is easily soluble in water at room temperature and the physical andchemical properties are shown in Table 27.Molecular Structure:
Table 27: Properties of s-Trioxane
s-Trioxane
OdorMolecular WeightCritical TemperatureCritical PressureCritical Volume
Irritating odor90.07794 kg/kmol604 K58.2 bar0.224 m�/kmol
33
Melting PointNormal Boiling PointLiquid Molar Volume7.3.24 2-Chloroacetophenone
334.65 K387.65 K0.0766816 m�/kmol
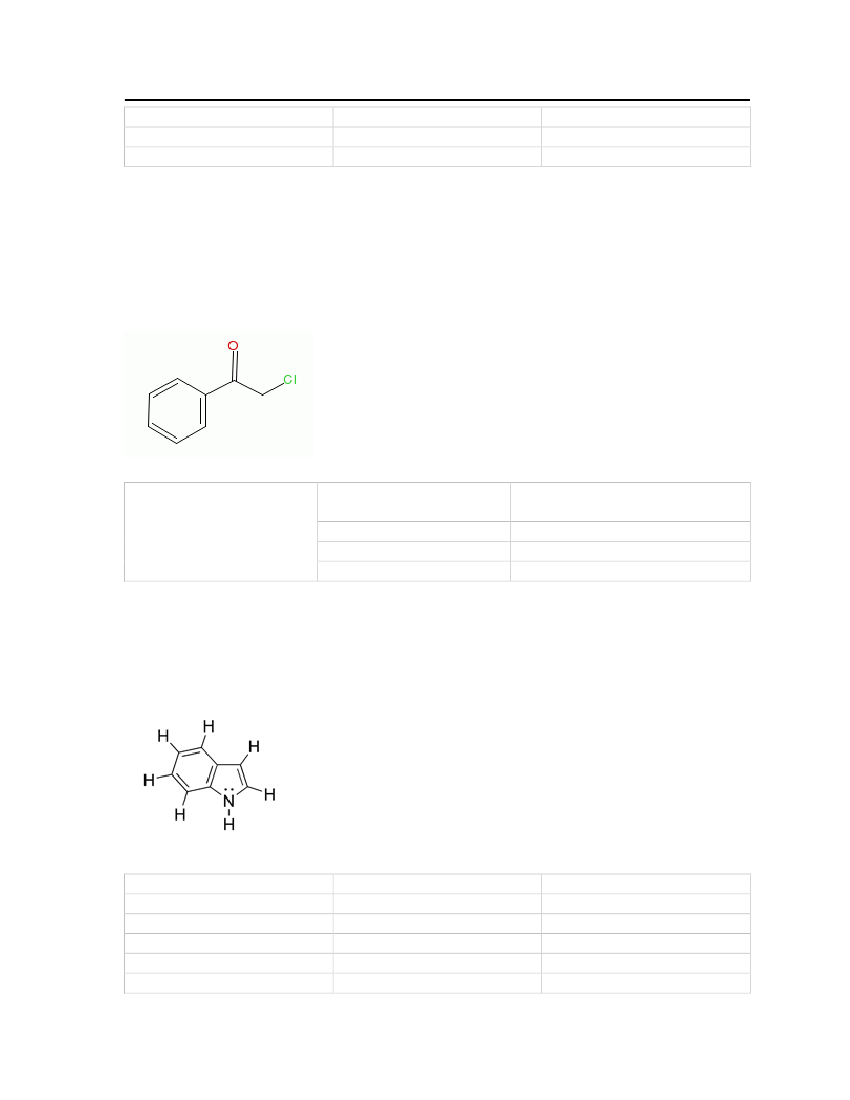
Chloroacetophenone has is easily soluble in organic solvents. In higher concentrations itcauses a tingling sensation, irritation, burning and pain of the nose and throat. Is used in teargas and chemical mace. The physical and chemical properties are shown in Table 28.Molecular Structure:
Table 28: Properties of Chloroacetophenone
ChloroacetophenoneOdorMolecular WeightMelting PointNormal Boiling Point
Fragrant: similar to apple blossoms.Irritant to nose and throat154.59 kg/kmol54oC248oC
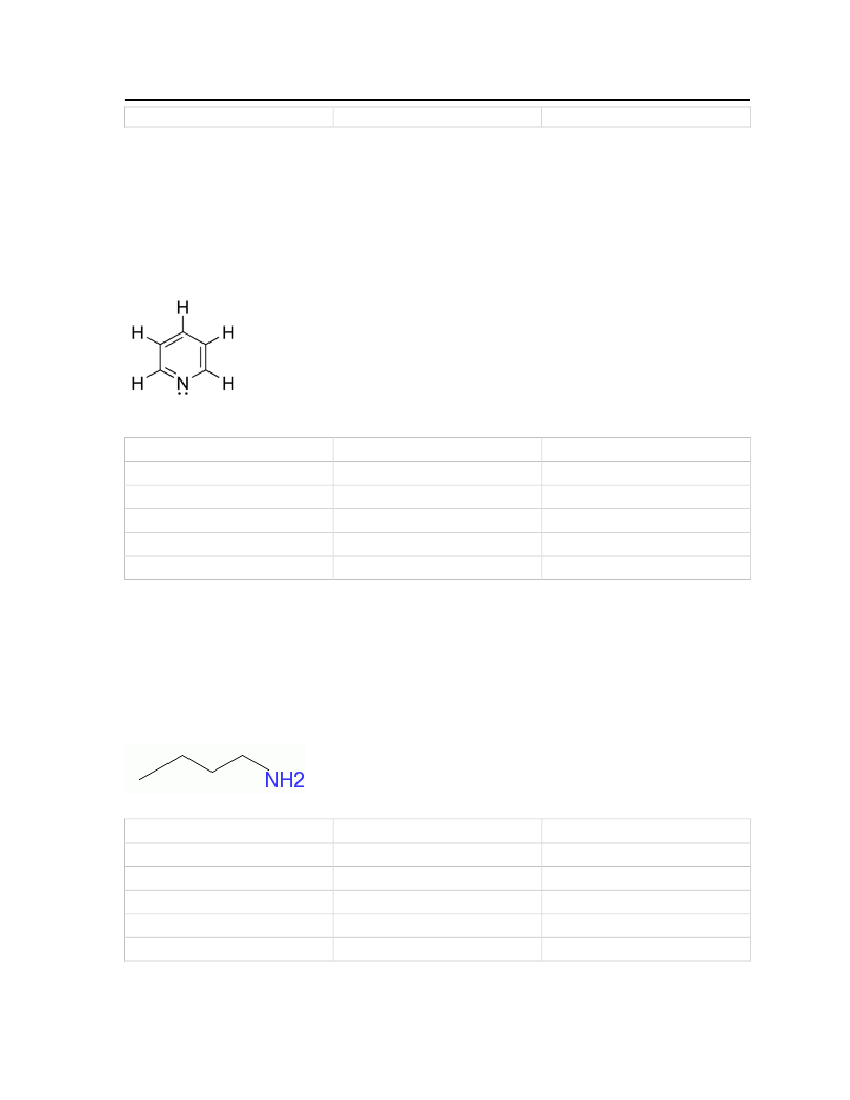
7.3.25 IndoleIndole is colorless and has an unpleasant odor. It occurs naturally in human feces and has anintense fecal odor. The physical and chemical properties are shown in Table 28.Molecular Structure:
Table 29: Properties of Indole
Indole
OdorMolecular WeightCritical TemperatureCritical PressureCritical VolumeMelting Point
Unpleasant (strong)117,14788 kg/kmol790 K43 bar0,431 m�/kmol326,15 K
34
Normal Boiling Point7.3.26 Pyridine
526,15 K
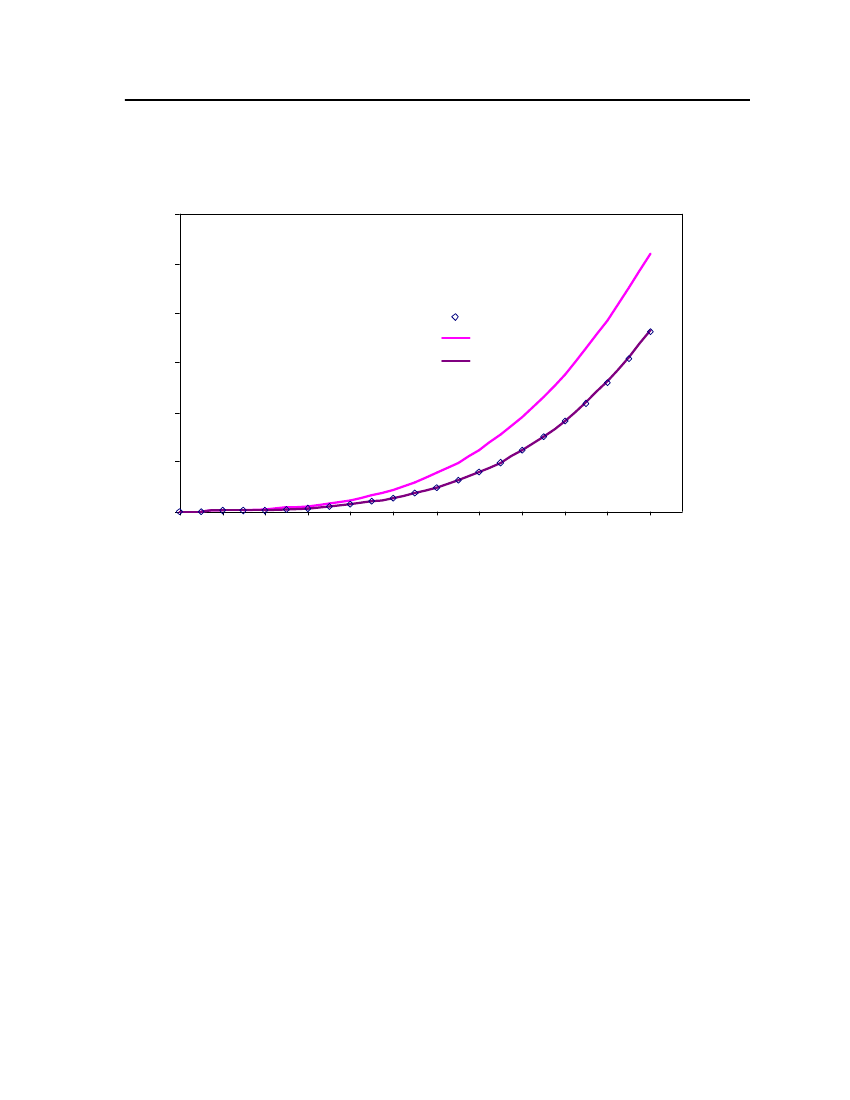
Pyridine is a liquid with a fish-like odor. It is used as intermediate in making dyes, foodflavorings, pharmaceuticals, rubber chemicals and adhesives. The physical and chemicalproperties are shown in Table 30.Molecular Structure:
Table 30: Properties of Pyridine
Pyridine
OdorMolecular WeightCritical TemperatureCritical PressureMelting PointNormal Boiling Point
Characteristic fish like smell79.0999 kg/kmol619.95 K56.3 bar231.53 K388.41 K
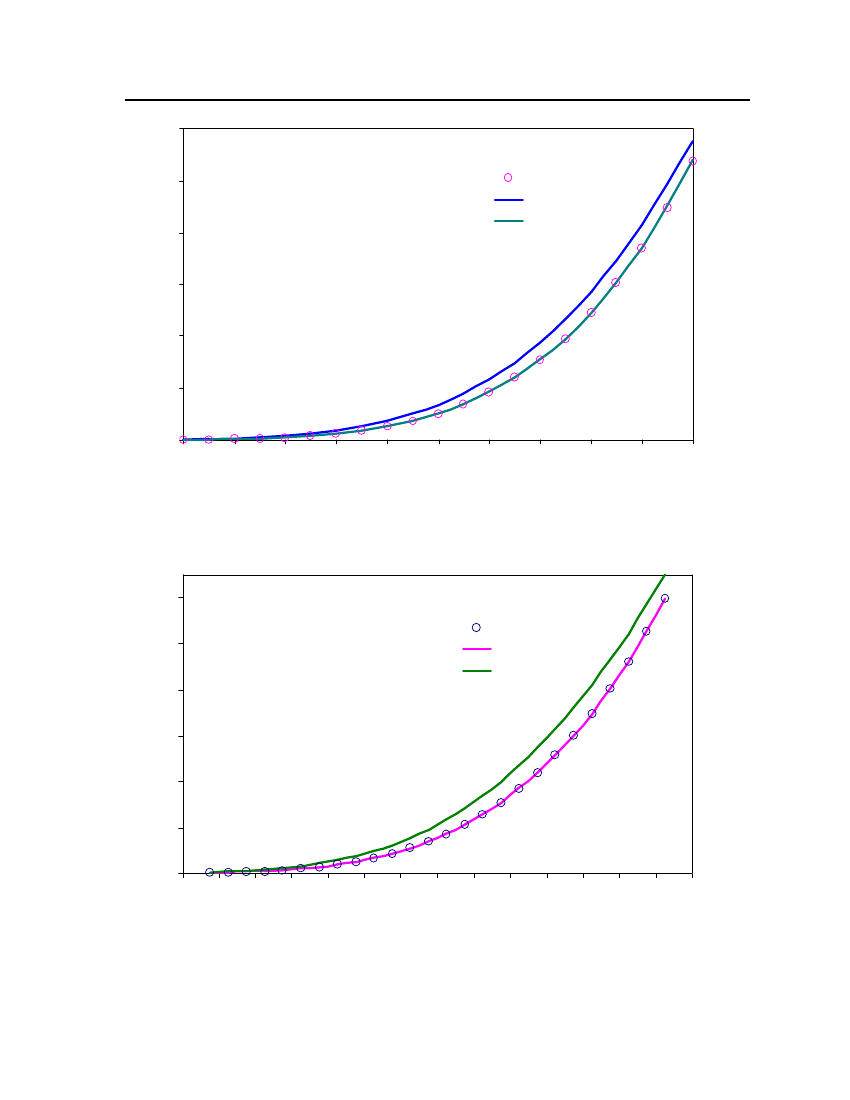
7.3.27n-ButylamineButylamine is a liquid having a fishy, ammonia-like odor common to amines. It is used as aningredient in the manufacture of pesticides, pharmaceuticals, and emulsifiers. The physicaland chemical properties are shown in Table 31.Molecular Structure:
Table 31: Properties of butylamine
Butylamine
OdorMolecular WeightCritical TemperatureCritical PressureMelting PointNormal Boiling Point
Characteristic fish like smell73.13684 kg/kmol531.9 K42 bar224.05 K350.55 K
35
7.4
Estimation of pure compound parameters (CPA equation of state)
The CPA equation of state has up to five adjustable pure compound parameters. The fiveparameters for pure associating compounds are, three for the physical part,a0,C1andb; andtwo for the association part - association energy (εAB) and association volume(βAB).These parameters are determined by regression of saturated vapor pressures and liquiddensity data over a wide temperature range, usually ranging from (close to) the triple point to(close to) critical point. The vapor pressure and liquid density of pure compounds are takenfrom the DIPPR database (which is a collection of experimental data). However, only 17 outof 27 malodorants are available in the DIPPR database. CPA parameters for these 17compounds are shown in table 32. Of these, 9 are considered to be associating. Mostassociating compounds are considered to have two association sites (known as the 2Bscheme) but some, such as water are considered to have 4 associating sites. Of the substancesconsidered in this study, only propylene glycol has 4 associating sitesTable 32: CPA Parameters for the compounds involved in this studyCPA ParametersRMSPEABABCompounda0bc1εβ*1000 ERR. P ERR. D Association6-23-13-1[bar cm mol ] [cm mol ][bar cm mol ]SchemeTriethylamineButylaminePyridineIsobutyraldehydeEthylmercaptan195025311683228118845285168903669330709115.9584.0971.5876.9759.11139.0658.9968.4141.4197.2977.976.7767.6787.7498.38101.8265.420.78212 131495.60.75803 117612.30.77061 133372.10.91279 109697.90.58262 112655.50.87691 -0.70002 -0.75793 -0.76412 -0.92138 215043.20.58312 1223420.88853 -0.74271 197598.10.86376 -0.8447 -0.9411 -0.87733 110119.177.2426 0.0018 0.0059 2B33.8039 0.0014 0.0049 2B0.69330 0.0012 0.0059 2B0.509004 0.0028 0.0069 2B97.924----0.0013 0.0042B
2,2,4 Trimethylpentane32142567DimethylsulfideSulfurylchlorideCyanogenchloride1-PentanolTetrahydrothiophene127184421597221584380402317912118801411
0.0052 0.0111 -0.0088 0.0131 -0.020.06--
0.0236 0.009
2.64607 0.0008 0.0081 2B46.51-11.953---2.0480.0005 0.0042 2B0.0076 0.0078 -0.0261 0.0186 4C0.0059 0.0059 -0.0167 0.021-
Bis(chloromethyl)ether19260947Propyleneglycol2-MethylpyridineNitrobenzeneIndoles-Trioxane1379820623246503326054403561413716960394
0.0108 0.0094 -0.0031 0.0059 2B
36
n-ButanePropaneIsobutane
13447507915469512935743
74.6458.6975.1
0.72748 -0.66653 -0.71322 -
---
0.0027 0.0111 -0.003 0.0131 -0.0083 0.0173 -
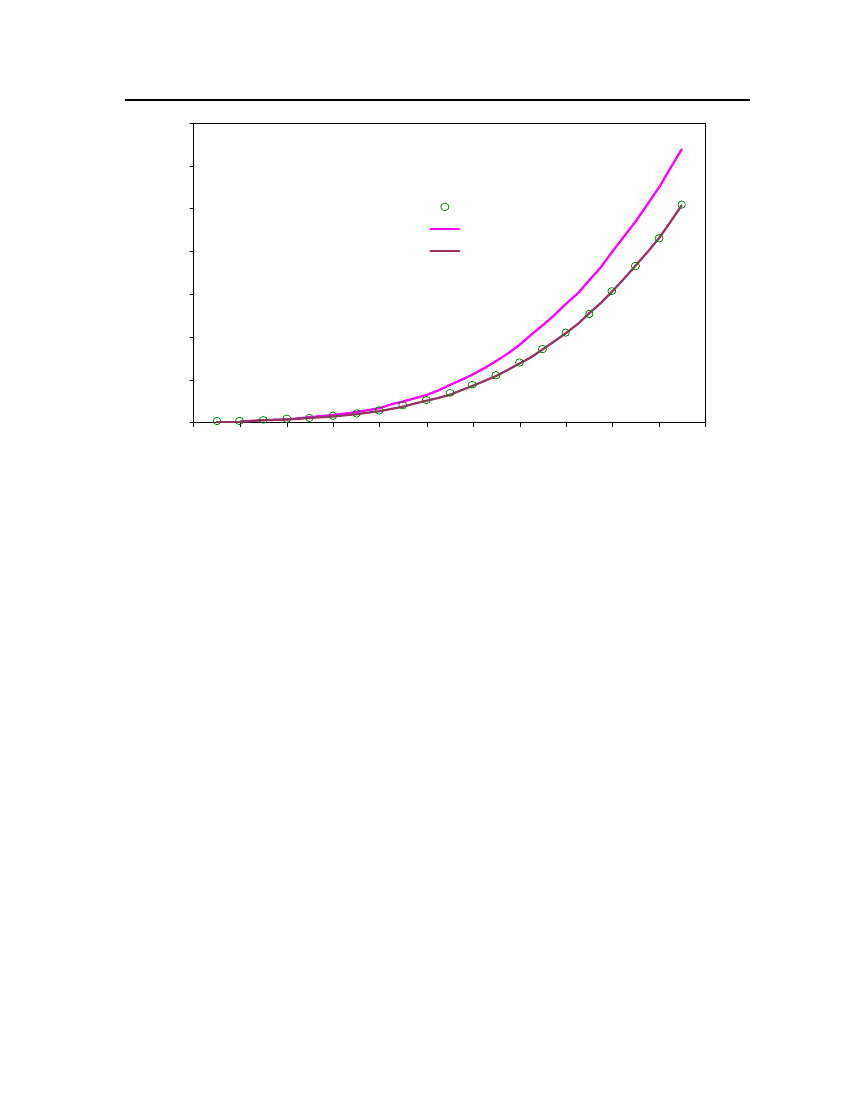
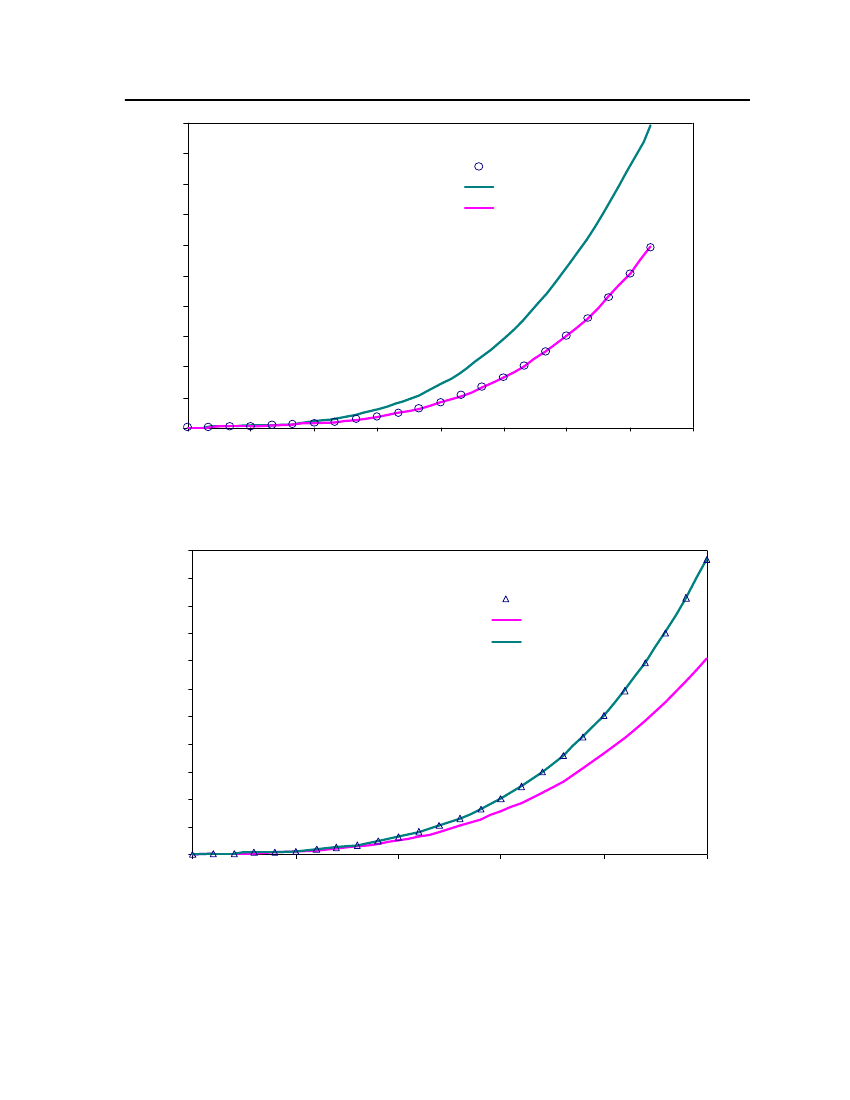
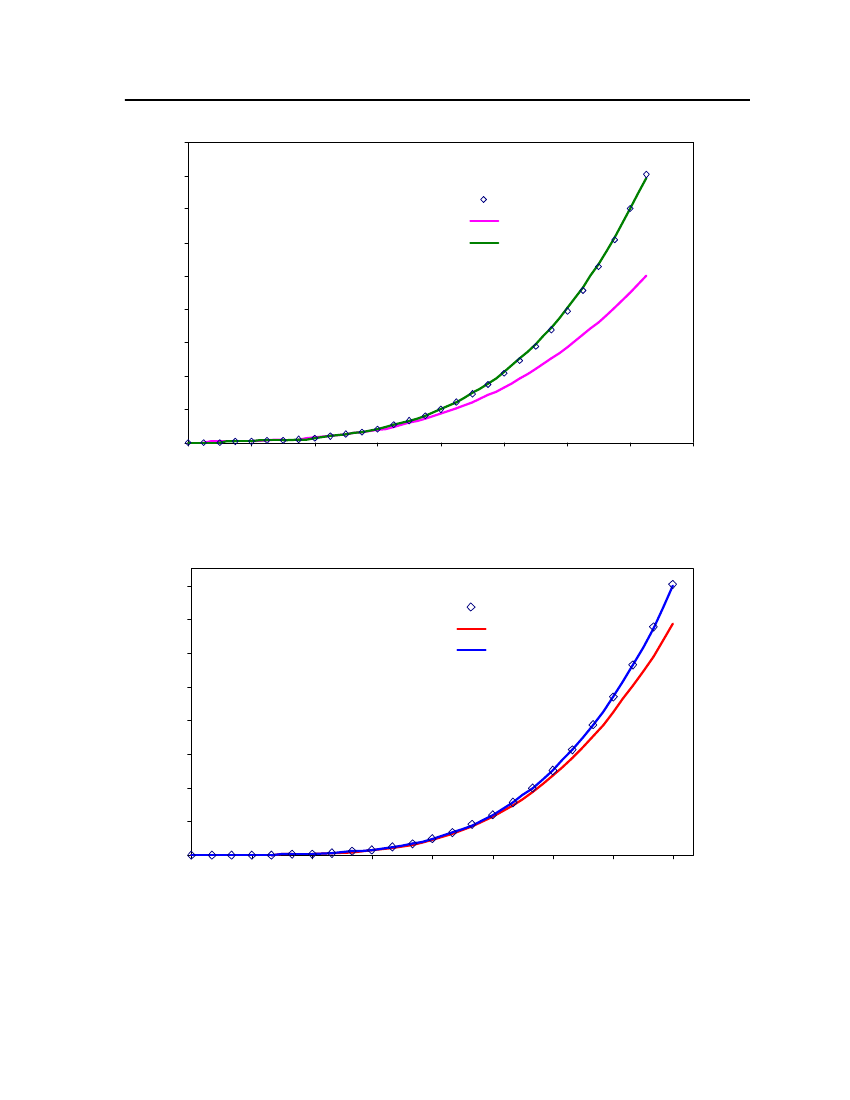
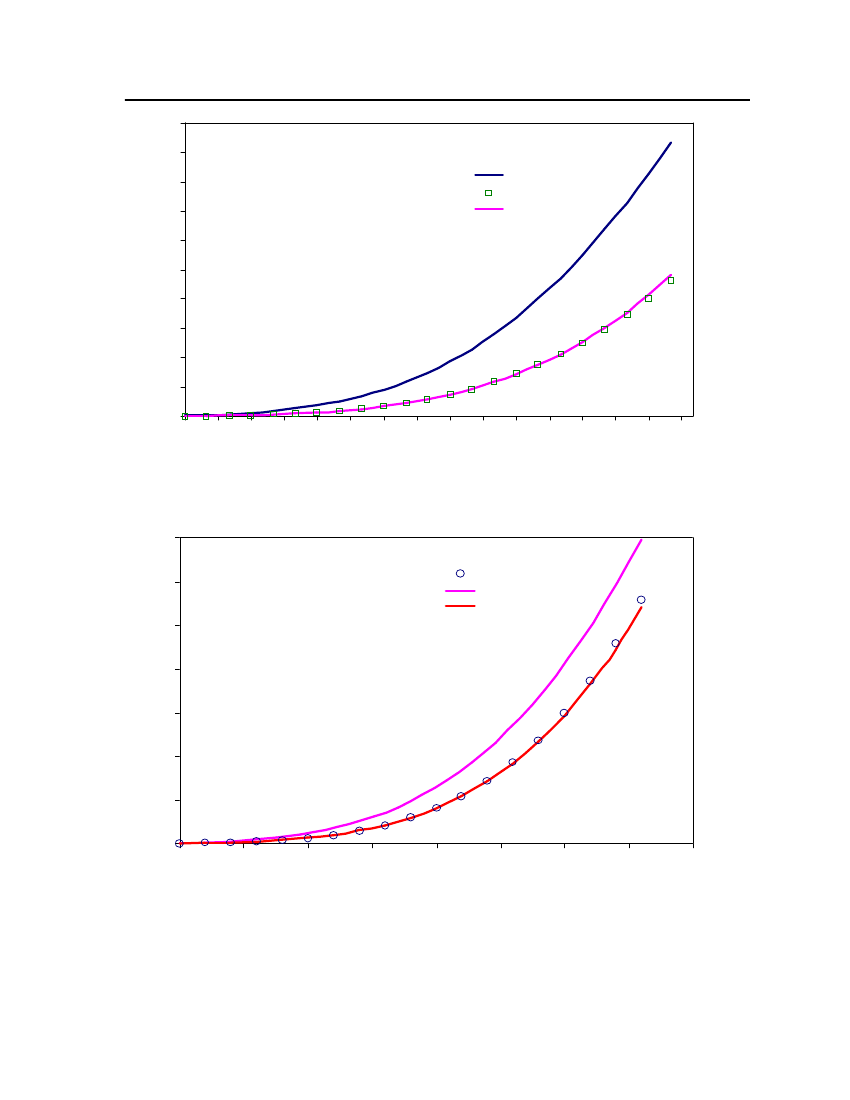
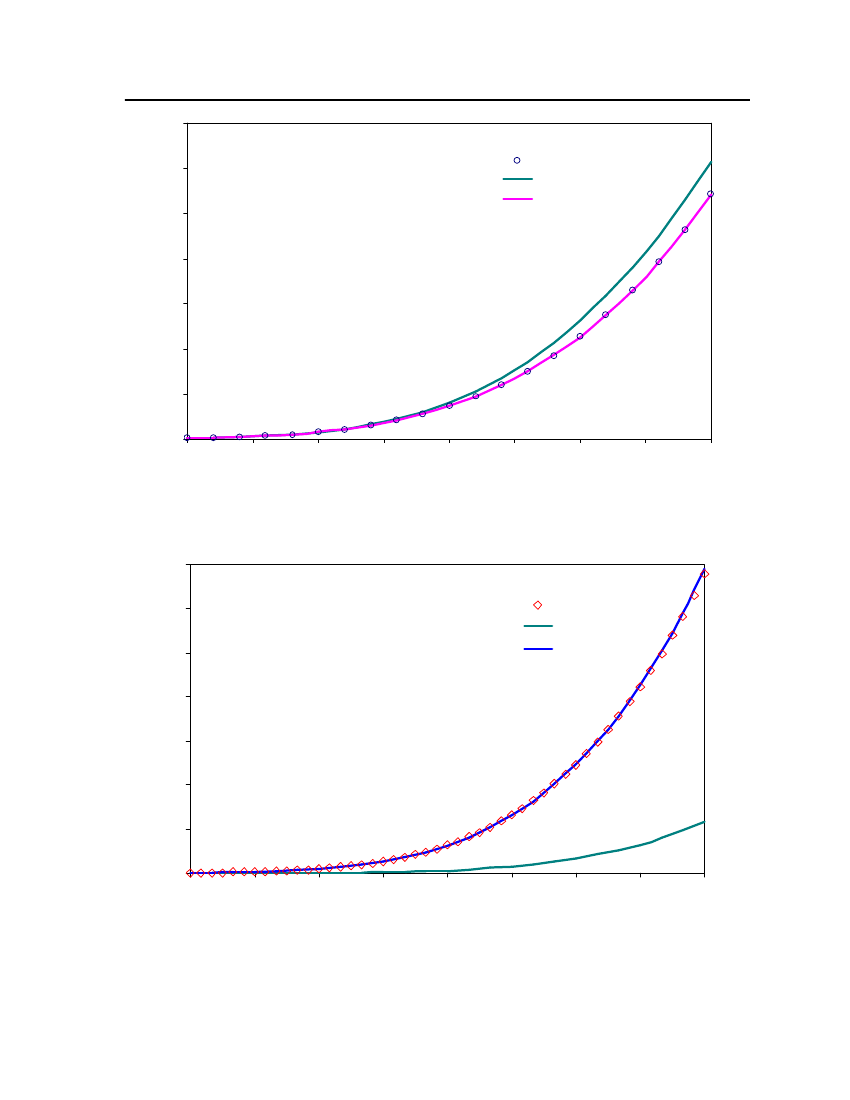
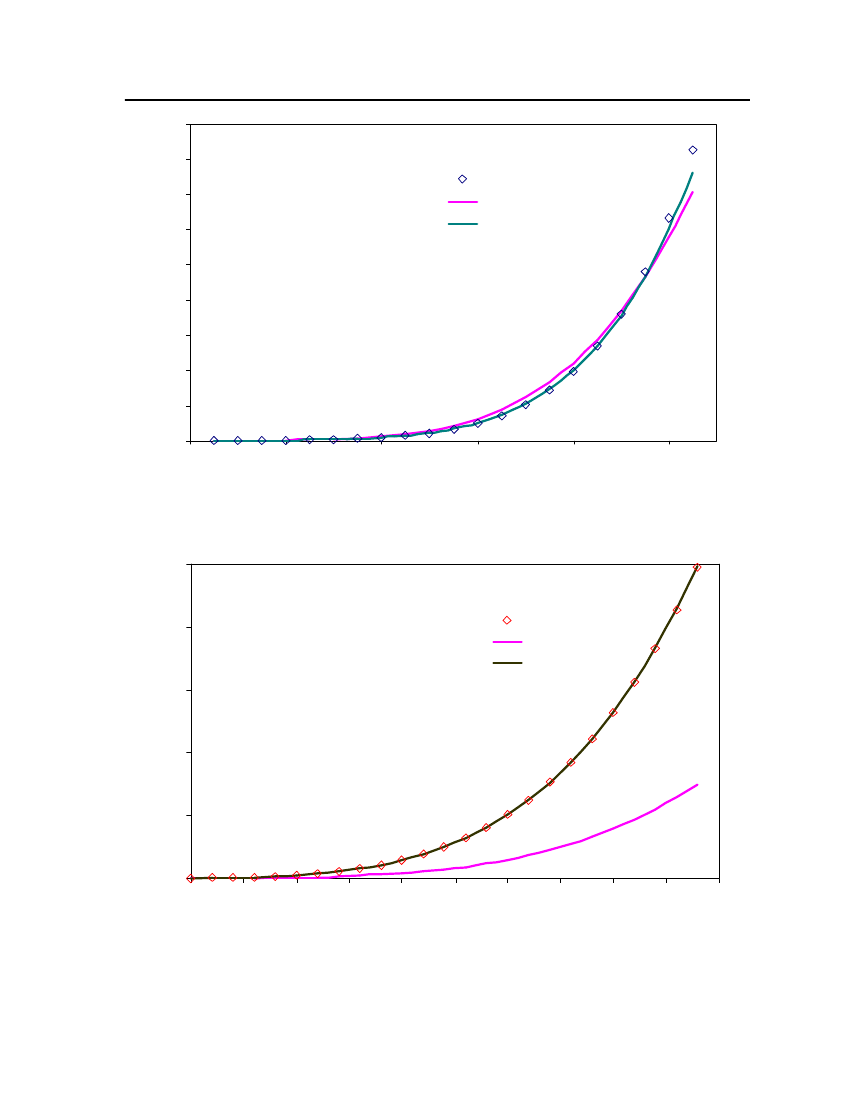
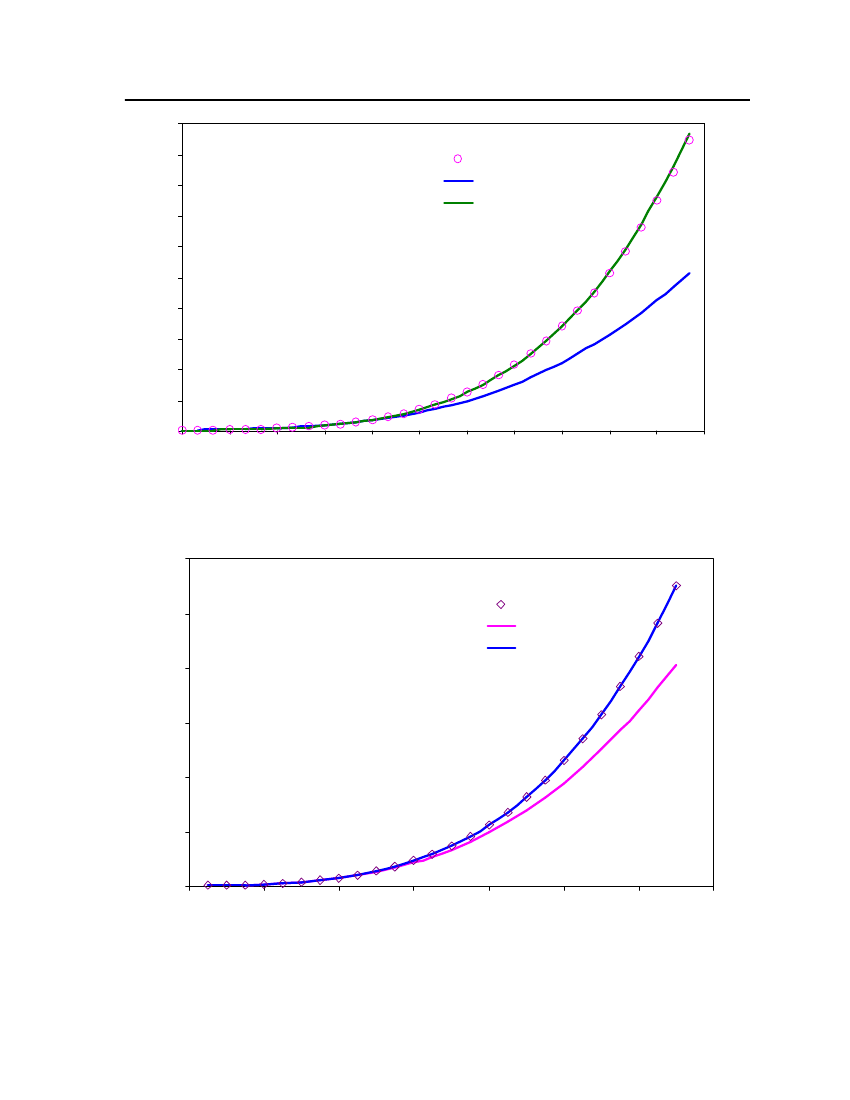
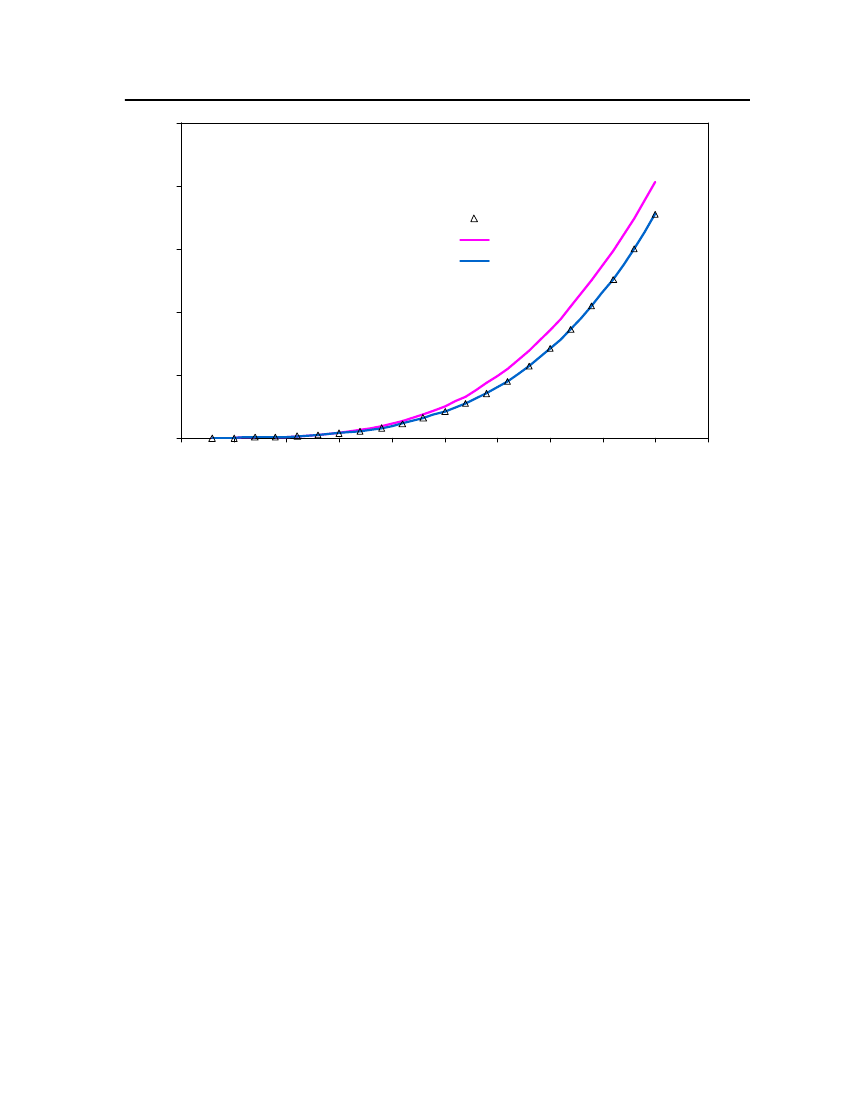
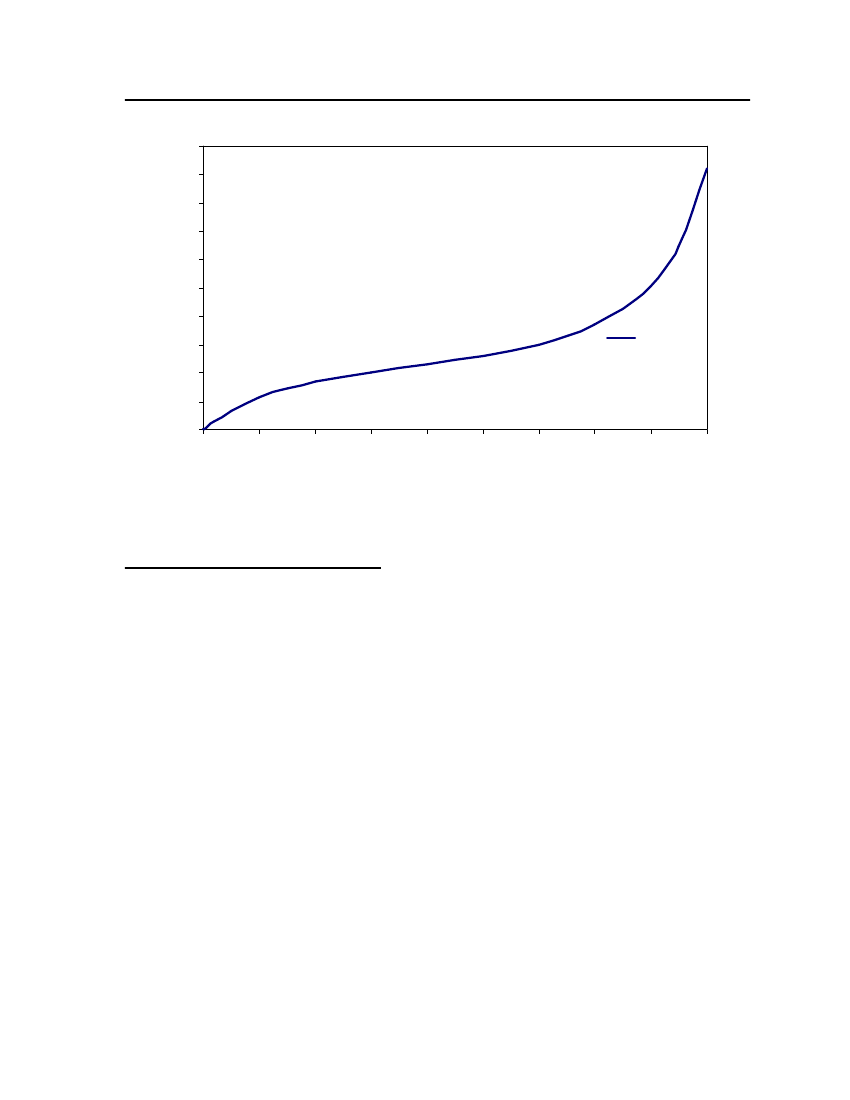
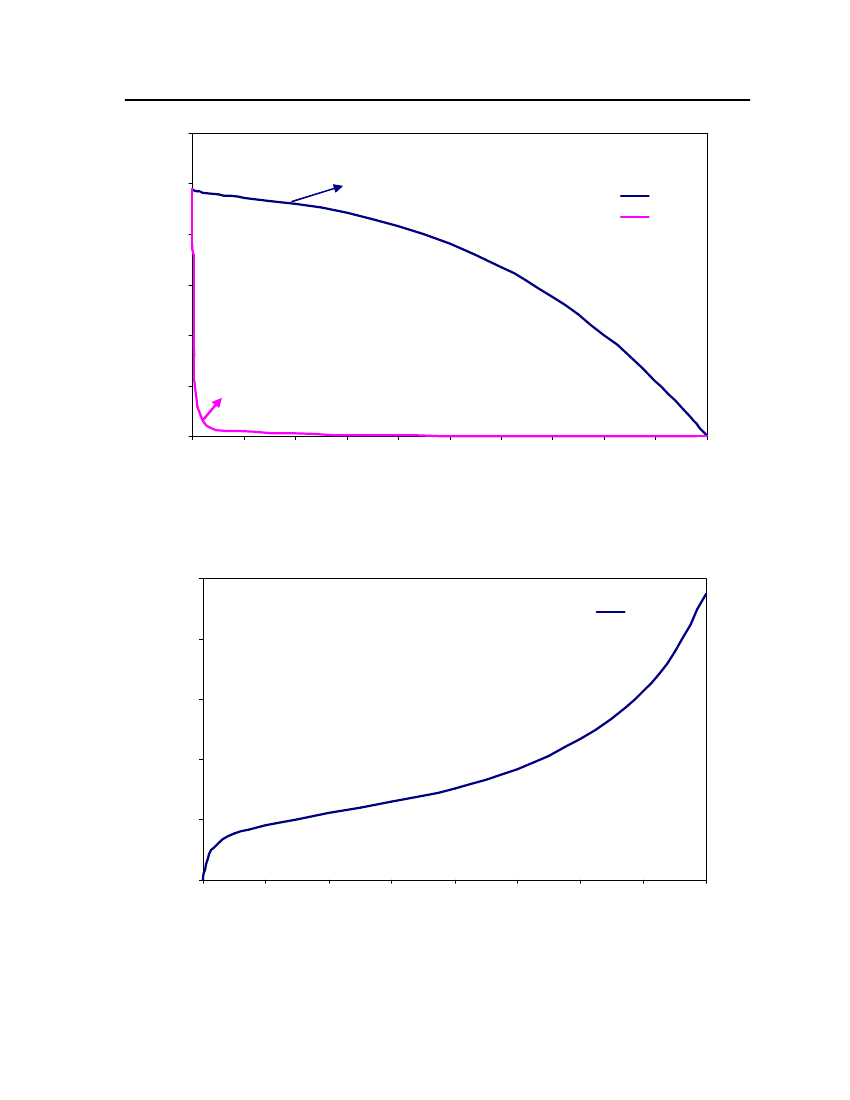
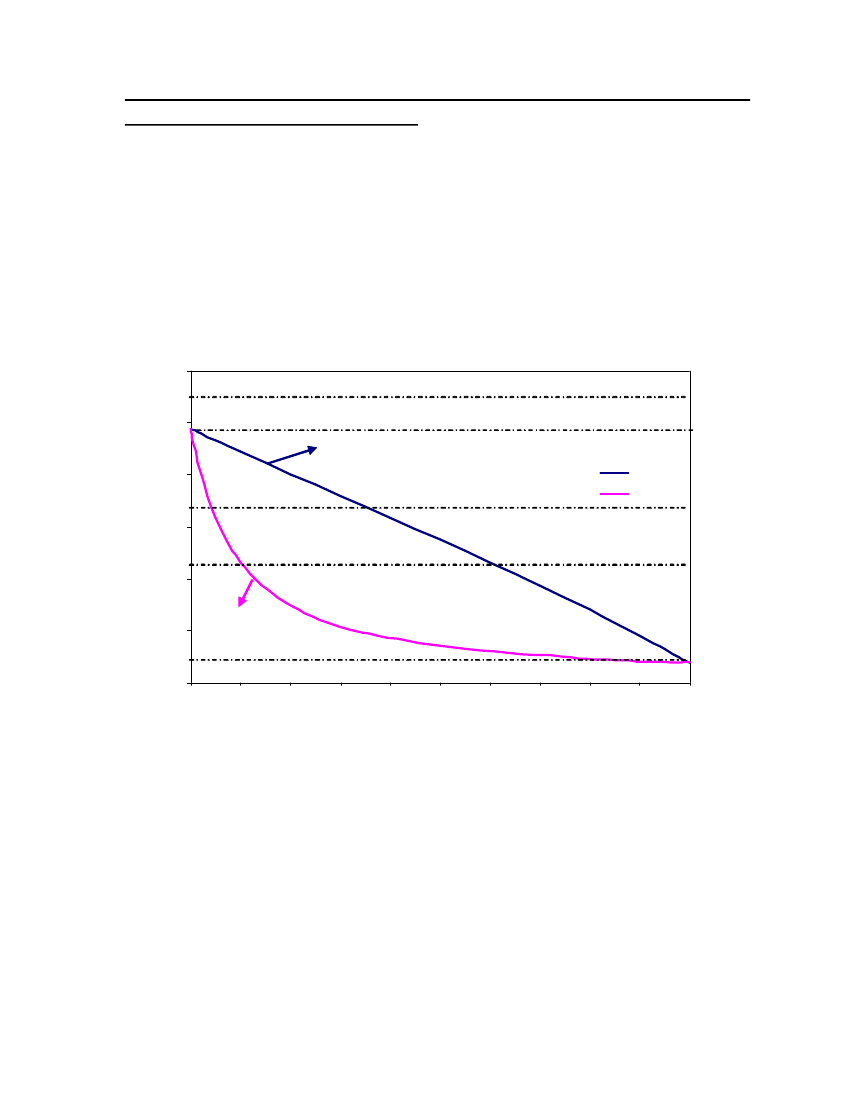
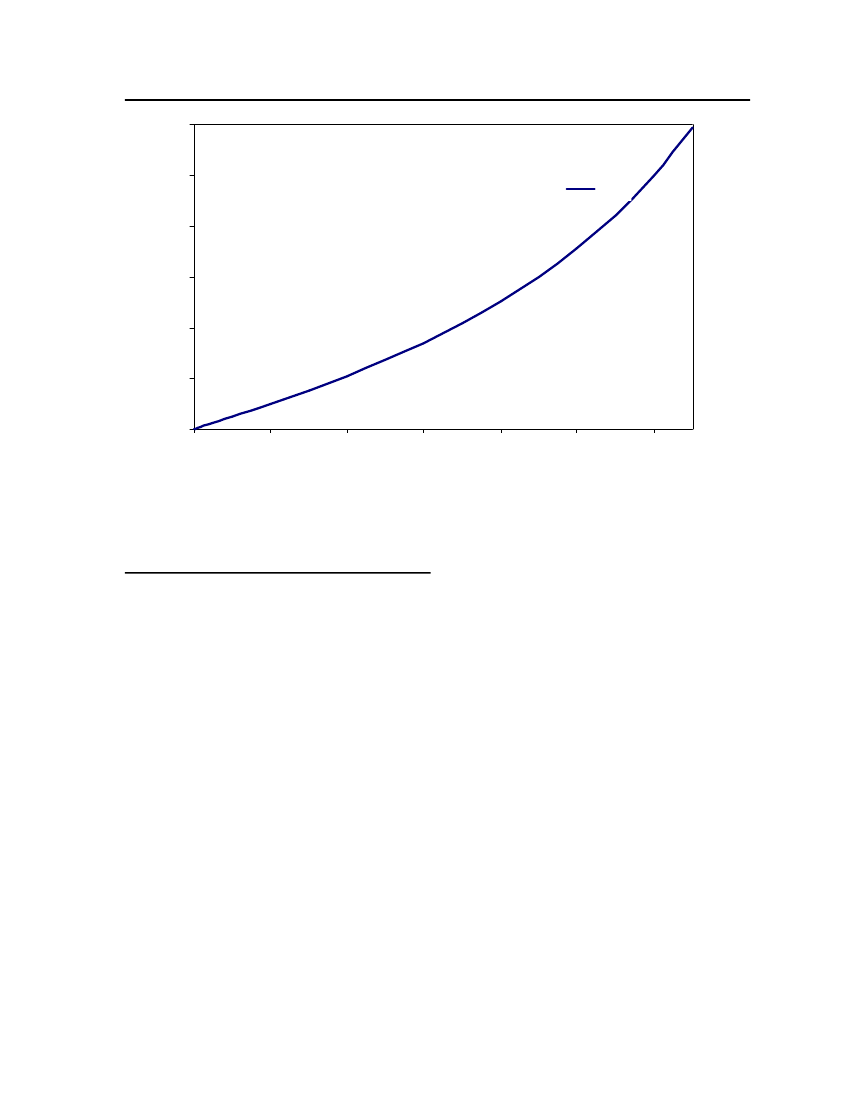
Comparison of the CPA and COSMOtherm performance with Experimental data:The malodorants’ pure-component parameters for the CPA model are found by fitting tovapor pressure and liquid density data. The parameters are shown in the table 32. Theproperty that is of interest to us is vapor pressure, so we compare the performance of themodels on this property. Figures 3-19 show the vapor pressure as a function of temperaturefor the 17 compounds where we have experimental data. In all cases, the vapor pressure fromCPA is in excellent agreement with experiment. This is to be expected, since the parameterswere obtained in order toensuregood agreement for this property. However, in the absenceof experimental data, CPA cannot be used. From the comparisons with COSMOtherm, wecan see that in most cases, the prediction (based only on the chemical structure of thecompound) is acceptable. This gives us some confidence that the pure-component vaporpressures for the ten compounds for which no experimental data exists, should besatisfactorily predicted by COSMOtherm.Figure 3 shows the vapor pressure of triethylamine at different temperatures for CPA(with 2B association scheme for triethylamine) and COSMOtherm. These results arecompared with the DIPPR correlations (based on experiment). As expected, the CPAequation of state is able to represent correctly the pure triethylamine vapor pressure fortriethylamine. COSMOtherm tends to overpredict the vapor pressure at higher temperatures.However at the temperature of relevance (around a room temperature of 293 K) theprediction is satisfactory. The vapor pressures of the remaining 16 malodorants for which wehave experimental data are shown in Figure 4 to Figure 19. Predictions from COSMOthermare generally very good, especially at around room temperature. Compounds for whichCOSMOtherm performs less well are 2,2,4-trimethyl pentane (figure 7), sulfuryl chloride(figure 11), bis(chloromethyl)ether (figure 14), s-trioxane (figure 16) and indole (figure 17).The vapor pressure of bis(chloromethyl)ether (figure 14) is particularly poorly represented.The reason for this is not clear. However, in general COSMOtherm does a good job ofrepresenting the vapor pressure of the pure substances, which leads us to believe that we can37
accept the vapor pressure predicted for the other ten compounds where we have noexperimental data.
24
20Vapor Pressure (bar)
16
Exp (DIPPR)COSMOthermCPA
12
8
4
0265285305325345365385405425445465485Temperature (K)
Figure 3: Comparison of Triethylamine Vapor pressure between CPA, COSMOtherm and DIPPR
38
18
15Vapor Pressure (bar)
Exp (DIPPR)COSMOthermCPA
12
9
6
3
0250270290310330350370390410430450Temperature (K)
Figure 4: Comparison of Isobutyraldehyde Vapor pressure between CPA, COSMOtherm and DIPPR
24Exp. (DIPPR)20Vapor pressure (bar)CPACOSMOtherm16128
4
0300
320
340
360
380
400
420
440
460
480
500
520
540
560
580
Temperature (K)
Figure 5: Comparison of Tetrahydrothiophene Vapor pressure between CPA, COSMOtherm and DIPPR
39
35302520151050240260280300320340360Temperature (K)380400420440460Exp (DIPPR)COSMOthermCPA
Figure 6: Comparison of DimethylsulfideVapor pressure between CPA, COSMOtherm and DIPPR
Vapor Pressure (bar)
40
201816Vapor pressure (bar)14121086420270300330360390420Temperature (K)450480510DIPPRCOSM OthermCPA
Figure 7: Comparison of 2,2,4 Trimethylpentane Vapor pressure between CPA, COSMOtherm andDIPPR22201816Vapor Presure (bar)14121086420310360410460510560Temperature (K)Exp (DIPPR)COSMOthermCPA
Figure 8 Comparison of 2-MethylpyridineVapor pressure between CPA, COSMOtherm and DIPPR
41
18,016,014,0Vapor Pressure (bar)12,010,08,06,04,02,00,0355395435475515555Temperature (K)595635675Exp (DIPPR)COSMOthermCPA
Figure 9: Comparison of NitrobenzeneVapor pressure between CPA, COSMOtherm and DIPPR
16,014,0Vapor Pressure (bar)12,010,08,06,04,02,00,0290320350380410440Temperature (K)470500530
Exp (DIPPR)COSMOthermCPA
Figure 10: Comparison of 1-Pentanol Vapor pressure between CPA, COSMOtherm and DIPPR
42
504540Vapor pressure (bar)35302520151050270285300315330345360 375 390 405Temperature (K)420435450465480495
COSMOthermExp (DIPPR)CPA
Figure 11: Comparison of Sulfurylchloride Vapor pressure between CPA, COSMOtherm and DIPPR
35302520151050225250275300325350Temperature (K)375400425Exp(DIPPR)COSMOthermCPA
Figure 12: Comparison of CyanogenchlorideVapor pressure between CPA, COSMOtherm and DIPPR
Vapour Pressure (bar)
43
35Exp (DIPPR)COSM OthermCPA25Vapor Pressure (bar)
30
20
15
10
5
0250275300325350375Temperature (K)400425450
Figure 13: Comparison of Ethylmercaptan Vapor pressure between CPA, COSMOtherm and DIPPR
211815129630280310340370400Temperature (K)430460490520Exp (DIPPR)COSMOthermCPAVapor Pressure (bar)
Figure 14: Comparison of Bis(chloromethyl)ether Vapor pressure between CPA, COSMOtherm andDIPPR
44
4,54,0
Exp (DIPPR)3,5Vapor Pressure (bar)3,02,52,01,51,00,50,0300340380420Temperature (K)460500
COSMOthermCPA
Figure 15: Comparison of Propyleneglycol vapor pressure between CPA, COSMOtherm and DIPPR
25
20Vapor Pressure (bar)
Exp (DIPPR)COSMOthermCPA
15
10
5
0300325350375400425450Temperature (K)475500525550
Figure 16: Comparison of s-Trioxane vapor pressure between CPA, COSMOtherm and DIPPR
45
201816Vapor Pressure (bar)14121086420390420450480510540570600630660690720Temperature (K)Exp (DIPPR)COSMOthermCPA
Figure 17: Comparison of Indole vapor pressure between CPA, COSMOtherm and DIPPR
30Exp. (DIPPR)COSMOthermCPAVapour Pressure (bar)20
25
15
10
5
0300340380420460500540580Temperature (K)
Figure 18: Comparison of Pyridine vapor pressure between CPA, COSMOtherm and DIPPR
46
25
20Vapor Pressure (bar)Exp (DIPPR)15COSMOthermCPA
10
5
0250275300325350375400Temperature (K)425450475500
Figure 19: Comparison of Butylamine vapor pressure between CPA, COSMOtherm and DIPPR
Ideally the models should be verified using the kind of binary data that is of interest to us.The only binary pair for which we have data is butane-ethyl mercaptan, at temperatures of 50�C and 100 �C, i.e. at temperatures higher than those of interest. Nevertheless a comparisoncan give us an idea of whether the models give us the correct behavior. Figures 20-23 showpressure composition diagrams for this binary mixture. Figures 20 and 21 show the behaviorat a temperature of 50 �C. A discussion of this type of diagram is in order here: whenx1=y1=0, we have pure butane and the vapor pressure is 5 bar (the vapor pressure of purebutane at 50 �C). For x1=y1=1, we have pure ethyl mercaptan and the vapor pressure is about1.75 bar. Both models (as expected) give the correct endpoints. At intermediate pressure (e.g.3 bar) the mixture splits into a vapor and liquid in equilibrium with compositions of aroundy1=0.45 and x1=0.8 respectively, i.e. ethyl mercaptan, being the heavier component, tends toconcentrate in the liquid phase. The top line gives the liquid composition, while the lowerline is the vapor composition. Figure 20 shows that COSMO does a good job of predictingthe phase behavior of this binary mixture. The lines for CPA are if ethyl mercaptan isconsidered to be hydrogen bonding. The prediction is not that good, but the experimentaldata can be correlated using a so-called binary interaction parameter (kij), an adjustable47
parameter which can help the agreement between the theory and the data. CPA predicts amaximum in the pressure at a concentration of about x1=0.1, which is not what the datashows. This cannot completely be corrected for with a binary parameter. Figure 21 shows theresults if ethyl mercaptan is considered to be non-associating. The agreement is better here,although the COSMOtherm predictions are still better. In this case CPA can be made to agreevery closely with the data by using a binary interaction parameter. The problem with thisbinary parameter, however, is that one must have the experimental data in advance. Figures22 and 23 make the same point, at a temperature of 100 �C. Based on the results for purecomponent and binary data (where data is available), it was proposed to continue modelingwith COSMOtherm alone, since results with CPA require at least pure-component data, andthe predictions of the behavior of binary mixtures seems to be better with COSMOtherm.
The following points are considered to use COSMOtherm program in this work instead ofCPA equation of state to calculate the physical properties.The performance of COSMOtherm is better for the single binary mixture where wehave data compared to the CPA equation of stateLack of pure component data in DIPPR database. The pure compound data (vaporpressure and liquid density) is necessary to estimate the pure compound (and mixture)properties with CPA.Some of the compounds used in this work are not available in the DIPPR database.The COSMOtherm program can be used to compute the thermodynamic properties ofpure compounds and mixtures for which no data is available.
48
5,5T = 50 C54,5Pressure (bar)43,532,521,500,10,20,30,40,5x1, y10,60,70,80,91P -x (Experiment al data)P -y (Experiment al data)P -xP -yP -xP -yP -xP -y(COSMOt herm)(COSMOt herm)(CP A, 2 B)(CP A, 2 B)(CP A,2B, Kij=-0.0 42)(CP A,2B, Kij=-0.0 42)o
Figure 20: Vapor-Liquid Equilibrium of Ethylmercaptan (1) /n-Butane(2) with CPA (Associationscheme-2B) and COSMOtherm at 50oC65,554,5Pressure (bar)43,532,521,500,10,20,30,40,5x1, y10,60,70,80,91T = 50 Co
P -x (Experiment al dat a)P -y (Experiment al dat a)P -x (COSMOt herm)P -y (COSMOt herm)P -x (CP A, wit hout associaton, Kij=0)P -y (CP A,wit hout associat on, Kij=0)P -x (CP A, wit hout association, Kij=0.0 4)P -y (CP A, wit hout association, Kij=0.0 4)
Figure 21: Vapor-Liquid Equilibrium of Ethylmercaptan (1) /n-Butane(2) with CPA (Non association)and COSMOtherm at 50oC
49
15,5
T = 100 C
o
13,5
Pressure (bar)
11,5P -x (Ex periment al dat a)
9,5
P -y (Ex periment al dat a)P -x (COSMOt herm)P -y (COSMOt herm)P -x (CP A, 2 B)
7,5
P -y (CP A, 2 B)P -x (CP A,2 B, Kij=-0.055 )P -y (CP A, 2 B, Kij=-0.055 )
5,500,10,20,30,40,5x1, y10,60,70,80,91
Figure 22: Vapor-Liquid Equilibrium of Ethylmercaptan (1) /n-Butane(2) with CPA (Associationscheme-2B) and COSMOtherm at 100oC
15,5T = 100 C13,5Pressure (bar)o
11,5
9,5
7,5
5,50
P -xP -yP -xP -yP -xP -yP -xP -y
(Exp erim ent al data)(Exp erim ent al data)(COSMOt herm)(COSMOt herm)(CP A,without associat on, Kij=0)(CP A, wit hout associat on, Kij=0)(CP A,without associat ion Kij=0.041)(CP A,without associat ion, Kij=0.041)
0,1
0,2
0,3
0,4
0,5x1, y1
0,6
0,7
0,8
0,9
1
Figure 23: Vapor-Liquid Equilibrium of Ethylmercaptan (1) /n-Butane(2) with CPA (Non Association)and COSMOtherm at 100oC
50
7.5
Sigma Profiles
The first step in a COSMOtherm calculation is to calculate the sigma profiles and surfacesfor the selected compounds. The majority of these were already in the existing database anddid not require computation. This program needs COSMO files to generate sigma profiles forthe compounds which are selected as malodorants. The charge distribution is represented asprobability distribution of a molecular surface segment having a specific charge density. Thisprobability distribution is called sigma profile (pi(σ) ). The surface charge density oflighter gas components (butane, isobutane and propane) and the resultingσ-profile of eachcomponent are shown in Figure 24 .
20Butane16IsobutanePropanesigma profile, p(s )Butane12
8PropaneIs obutane4
0-3-2,5-2-1,5-1-0,5020,5s (e/nm )11,522,53
Figure 24: Sigma profiles for the lighter gas components (butane, isobutane and propane).
These three compounds are alkanes and do not have significant electrostatic moments.Consequently theσ-profiles are rather narrow. Two peaks are detected from the abovediagram, resulting from the hydrogen on the negative side and from the carbon on thepositive side. The correspondingσ-profiles of the butane, isobutane and propane range from-0.6 to +0.6e/nm2. The area under the curve represents the total surface area of the
51
compound. Theσ-profiles of other alkanes look very similar and mainly differ in heightaccording to the differences in the total surface area.The polarization charge densities andσ-profiles of some other compounds areshown in Figure 25. Theσ-profiles of 1,8 cineole and 1-pentanol range from -0.6 to+0.6e/nm2. On the surface of 1-pentanol (bottom left in Figure 25), the deep blue areaidentifies the polar hydrogen atom and deep red region represents the lone pair oxygen. Thered region on the surface of the 1,8 cineole (top left Figure 25) identifies the polar oxygen.301,8 cineole251-Pentanol2-methylpyridinesigma profile, p(s )201,8 cineole15
10
51-pentanol0-3,5-2,5-1,5-0,5s (e/nm2)0,5
2-methylpyridine
1,5
2,5
3,5
Figure 25: Sigma profiles of 1,8 cineole, 1-pentanol and 2-methylpyridine
Theσ-profile of 2-methyl pyridine shows a highly polarized charge density – typicalof hydrogen-bonding compounds. The sigma surface andσ-profile of cyanogenchloride,dimethylsulfide and butylamine are shown in Figure 26. The sigma surface ofcyanogenchloride mainly appears green but the chlorine atom shows some blue region andyellow with red showing the nitrogen. The sigma profile and sigma surface ofsulfurylchloride and triethylamine are shown in Figure 27. The surface of triethylamineshows a very strong lone-pair on the nitrogen. The polarization charge density ranges from -0.8 to +0.8 e/nm2. The butylamine sigma profile is similar to butane, except that it is broaderand the polarization of the amine group is visible as a red and blue region on the surface.
52
20Cyanogen chloride181614Cyanogenchloride12p(s )1086Butylamine4Dimethylsulfide20-3,5-2,5-1,5-0,5s (e/nm )2
DimethylsulfideButylamine
0,5
1,5
2,5
3,5
Figure 26: Sigma profiles of cyanogen chloride and dimethylsulfide
The sigma surface of sulfurylchloride (left side in Figure 27) mainly appears greenwith the chlorine atoms show blue region and oxygen atom shows yellow region.
53
20181614sigma profile, p(s )12108sulfurylchloride6420-3,5-2,5-1,5-0,5s (e/nm )2
SulfurylchlorideTriethylamine
Triethylamine
0,5
1,5
2,5
3,5
Figure 27: Sigma profiles for the sulfurylchloride and triethylamine
The sigma profile and sigma surface of ethyl mercaptan, isobutanal and pyridine areshown in Figure 28. The deep red region on the surface of isobutanal represents the lone pairoxygen and the light blue color identifies the polar hydrogen. The sigma profile of nitrogen–containing compounds like pyridine, nitrobenzene (Figure 29) show a strong lone pair on thenitrogen. The polarization charge density ranges from +1.1 to 2.5 e/nm2.The sulfur lone pairs are much weaker in ethyl mercaptan. The red region on thesurface identifies the sulfur and the blue region represents the hydrogen. Ethyl mercaptanthus has a weak hydrogen bond.The sigma profile and sigma surface of nitrobenzene and tetrahydrothiophene areshown in Figure 29. The blue area in the surface of nitrobenzene identifies the nitrogen andtwo yellow regions represent the lone pair oxygen. The red region on tetrahydrothiophenesurface shows the sulfur atom.
54
16
EthanethiolIs obutanal12
Pyridine
Ethanethiolsigma profile, p(s )
8
4
Pyridine
Isobutanal
0-3,5-2,5-1,5-0,5s (e/nm )2
0,5
1,5
2,5
3,5
Figure 28: sigma profile for the ethyl mercaptan, Isobutanal and pyridine20181614sigma profile, p(s )1210Nitrobenzene86420-3,5-2,5-1,5-0,50,5s (e/nm2)1,52,53,5TetrahydrothiopheneNitrobenzeneTetrahydrothiophene
Figure 29: sigma profile for the nitrobenzene and tetrahydrothiophene
55
The sigma profile and sigma surface of bitrex anion and cation are shown in Figure 30. Bothare high molecular weight compounds and their sigma profiles and sigma surfaces were notin the database but were generated using a quantum chemistry program. In particular the highnegative charge represented by the anion is visible as a large red region.35Bitrex anion30Bitrex cation
25Sigma profile, P(s )
20
15
10
5
0-3-2-102s (e/nm )123
Figure 30: sigma profile for the Bitrex anion and Bitrex cation
56
7.6
Vapor-liquid Equilibria
Phase equilibrium calculations are done using COSMOtherm as described above. Phasediagrams are calculated for a fixed temperature (isothermal, room temperature, assumed to be25 �C). What the program calculates is the pure component vapor pressure and activitycoefficient as a function of the liquid compositions. The total pressure is then calculatedusing the equation:p(tot)=∑pi0xiγii
(7.13)
Thepi0are pure compounds vapor pressures for compoundsi(which are known),xiare themole fractions of the compounds in the liquid phase andγiare the activity coefficients of thecompounds as predicted by COSMOtherm. Vapor mole fractions are then obtained by theratio of partial and total vapor pressures.yi=pi0xiγip(tot)
(7.14)
The liquid-liquid equilibrium properties can be calculated by using an analogous relationXiΙγiΙ=XiΙΙγiΙΙ
(7.15)
where subscriptsΙandΙΙdenote the two liquid phases. This calculation is required in thecase where two liquid phases form. Our phase diagrams are calculated at a fixed temperature.There are two common ways to plot the phase equilibrium for binary systems. One way is toplot mole fraction vs. temperature at constant pressure and another is to plot mole fraction vs.pressure at constant temperature. These plots are referred to asP-xyandT-xyplots. Sincenormal use of lighter gas occurs at a constant temperature, we have chosen to represent thephase behavior asP-xydiagrams.
57
Triethylamine – n-Butane binary systemThe compounds triethylamine (1) andn-butane (2) are selected from database inCOSMOtherm and the vapor-liquid phase diagram is then calculated at a fixed temperature(25oC) in COSMOtherm. Figure shows the vapor liquid equilibrium data for triethylamine(1) /n-butane (2) at 25oC. In this Figure, if the pressure were increased toPeverything1would be liquid and the pressure to drop belowP5the mixture is gas at any composition. Ifthe pressure is reduced fromP, the first vapor molecule forms at a pressure ofP2This is the1.boiling point pressure of triethylamine at 25 �C. For the equilibrium pressure lineP4theliquid mole fraction of triethylamine is given by the blue line while the lower curve (pinkline) is the vapor mole fraction of triethylamine.3000
P12500
P2Bubble-pointcurveLiquid zoneP3Liquid+VaporP4P-x1P-y1
Pressure (mbar)
2000
1500
T=25 C
o
1000
500
Dew -point curveVapor zoneP500,10,20,30,40,50,60,70,80,91
0
molefraction of TriethylamineFigure 31: Vapor-Liquid equilibrium for Triethylamine (1) /n-Butane (2) at 25oC. The solid curve showsthe COSMOtherm predictions
For example if the liquid contained about 32% triethylamine, the pressure would be about1700 mbar (the blue line atP3). At this pressure the vapour composition would be about 3%(whereP3intersects the pink line). Figure shows the mole fraction of triethylamine in thevapor phase as a function of its concentration in the liquid phase. This diagram is created
58
from Figure and contains no more information – it is just convenient to see directly how thevapor composition depends on the liquid composition. Thus we can more easily see that for aliquid composition of, say, 5%, the vapor composition is 0.2%. In this study, we are lookingfor substances which can be added in small amounts, so the region of the phase diagram thatis of most interest is near the origin (close to pure butane). We are also looking forcompounds which have a similar volatility to butane (so the vapor and liquid phasecompositions are comparable).0,014
0,012mole fraction of Triethy lamine in Vapor
0,01
0,008
0,006
T=25 Cx1-y 1
o
0,004
0,002
000,050,10,150,20,25mole fraction of Triethylamine in Liquid
Figure 32: The X-Y diagram for Triethylamine (1) /n-Butane (2) at 25oC. The solid curve shows theCOSMOtherm predictions
The malodorant concentration needs to be low because the addition of these compoundsshould not affect the normal use of the lighter gas. They-xphase diagrams are thus shown atlow concentrations.
59
Isobutyraldehyde – n-Butane binary systemThe Figure shows the vapor liquid equilibrium data for isobutyraldehyde (1)/n-butane (2) atfixed temperature 25oC. Figure shows the mole fraction of triethylamine in both phases anda point on the equilibrium curve separated into the mole fraction of the vapor that isisobutyraldehyde on the y-axis and the mole fraction of liquid that is isobutyraldehyde on thex-axis. The remaining mole fraction in both cases isn-Butane.
3000
2500
P1P2
2000Pressure (mbar)
Bubble-point curveLiquid zone
P-x1P-y1P3
1500
Liquid+Vapor
P41000Dew-point curve500Vapour zone
T=25 C
o
P5000,10,20,30,40,50,60,70,80,91mole fraction of Isobutyraldehyde
Figure 33: Vapor-Liquid equilibrium for Isobutyraldehyde (1) /n-Butane (2) at 25oC. The solid curveshows the COSMOtherm predictions
60
0,12mole fraction of Isobutyraldehyde in Vapor
0,1
0,08T=25 C0,06x1-y10,04o
0,02
000,050,10,150,20,250,30,350,40,45mole fraction of Isobutyraldehyde in Liquid0,50,550,6
Figure 34: The X-Y diagram for Isobutyraldehyde (1) /n-Butane (2) at 25oC. The solid curve shows theCOSMOtherm predictions
Tetrahydrothiophene – n-Butane binary systemThe Figure shows the vapor liquid equilibrium data for tetrahydrothiophene (1)/n-butane (2)at fixed temperature 25oC. Figure shows the mole fraction of tetrahydrothiophene in vaporand liquid phases. A point on the equilibrium curve separated into the mole percentage of thevapor that is substance tetra hydrothiophene on the y-axis and the mole percentage of liquidthat is tetrahydrothiophene on the x-axis. The remaining mole percentage in both cases isn-butane.
61
3000P12500P2P-x1P-y1P3T=25 Co
Bubble-point curve
Pressure (mbar)
2000
Liquid zone1500
Liquid+Vapor1000P4
500
Dew-point curveP5
Vapour zone000,10,20,30,40,50,60,7mole fractiion of Tetrahydrothiophene0,80,91
Figure 35: Vapor-Liquid equilibrium for Tetrahydrothiophene (1) /n-Butane (2) / at 25oC. The solidcurve shows the COSMOtherm predictions0,014mo le fra ctio n of tetrahydro thiophene in Vapo r
0,012x1-y 10,01
T=25 C
o
0,008
0,006
0,004
0,002
000,050,10,150,20,250,30,350,40,450,50,550,6mole fraction of tetrahydrothiophene in Liquid
Figure 36: The X-Y diagram for Tetrahydrothiophene (1) /n-Butane (2) at 25oC. The solid curve showsthe COSMOtherm predictions
62
Dimethylsulfide – n-Butane binary systemThe Figure shows the vapor liquid equilibrium data for dimethylsulfide (1)/n-butane (2) atfixed temperature 25oC and the vapor-liquid phase diagram is calculated by usingCOSMOtherm. Figure shows the amount of dimethylsulfide in vapor and liquid phases. Apoint on this curve shows the variations of dimethylsulfide in liquid that is in equilibriumwith dimethylsulfide in vapor at different pressures. The remaining mole percentage in bothcases isn-Butane.
3000
P12500
Bubble-point curvePressure (mbar)2000
P2
T=25 CP-x1P-y1
o
Liquid zone1500
Liquid+Vapor
P3
1000
Dew-point curveVapour zone
P4P5
500
000,20,40,60,81
mole fraction of DimethylsulfideFigure 37: Vapor-Liquid equilibrium for Dimethylsulfide (1) /n-Butane (2) at 25oC. The solid curveshows the COSMOtherm predictions
63
0,24mole fraction of Dimethylsulfide in Vapor
0,2
0,16x1-y10,12T=25 C0,08o
0,04
000,050,10,150,20,250,30,350,40,450,5mole fraction of Dimethylsulfide in Liquid
Figure 38: The X-Y diagram for Dimethylsulfide (1) /n-Butane (2) at 25oC. The solid curve shows theCOSMOtherm predictions
2.2.4-Trimethyl pentane – n-Butane binary systemThe Figure 39 shows the vapor liquid equilibrium data for 2,2,4-triethylpentane (1) /n-butane (2) at fixed temperature 25oC. The Figure shows the amount of 2,2,4 trimethylpentane in vapor phase equilibrium with amount of 2,2,4 trimethyl pentane liquid phase.Here any point on this curve shows the variations of dimethylsulfide in liquid that is inequilibrium with dimethylsulfide in vapor at different pressures. The remaining molepercentage in both cases isn-Butane.
64
3000P12500P2
Pressure (mbar)
2000
Bubble-point curve
P3P-x1P-y1T=25 Co
1500Liquid+Vapor
Liquid zone
1000Dew-point curveVapour zone
P4
500
000,10,20,30,40,50,60,7mole fraction of 2,2,4 Trimethylpentane
P50,80,91
Figure 39: Vapor-Liquid equilibrium for 2, 2, 4Trimethyl-2-pentane (1) /n-Butane (2) at 25oC. The solidcurve shows the COSMOtherm predictions
0,02mole fraction of 2,2,4 Trimethylpentane in Vapor
0,016
T=25 Cx1-y1
o
0,012
0,008
0,004
000,050,10,150,20,250,30,350,40,450,5mole fraction of 2,2,4 Trimethylpentane in Liquid
Figure 40: The X-Y diagram for 2, 2, 4 Trimethyl-2-pentane (1) /n-Butane (2) at 25oC. The solid curveshows the COSMOtherm predictions
65
Picoline – n-Butane binary systemThe Figure shows the vapor liquid equilibrium data for 2-methyl pyridine (1)/n-butane (2) atfixed temperature 25oC and the vapor-liquid phase diagram is calculated by usingCOSMOtherm. The Figure shows the amount of 2-methyl pyridine in vapor and liquidphases. A point on this curve shows the variations of 2-methyl pyridine in liquid that is inequilibrium with 2-methyl pyridine in vapor at different pressures. The remaining molepercentage in both cases isn-Butane. In Figure , most of the 2-methyl pyridine is in liquid atroom temperature because the boiling point of this compound is very high.2500
T=25 CBubble-point curve2000
o
P-x1P-y1Liquid zone
Pressure (mbar)
1500
Liquid + Vapor1000
500
Dew-point curve
000,10,20,30,40,50,60,70,80,91
mole fractio of 2-methyl pyridine
Figure 41: Vapor-Liquid equilibrium for 2-methylpyridine (1) /n-Butane (2) at 25oC. The solid curveshows the COSMOtherm predictions
66
0,006mole fraction of 2-methylpyridine in Vapor
0,005T=25 C0,004o
x1-y1
0,003
0,002
0,001
000,050,10,150,20,250,30,350,40,450,5mole fraction of 2-methylpyridine in Liquid
Figure 42: The X-Y diagram for 2-methylpyridine (1) /n-Butane (2) at 25oC. The solid curve shows theCOSMOtherm predictions
1.8- Cineole – n-Butane binary systemFigure shows the vapor liquid equilibrium data for 1,8- Cineole (1)/n-butane (2) at fixedtemperature 25oC. The mole fraction of 1,8 cineole in vapor and liquid phases are shown inFigure , In this binary system, a point on the equilibrium curve separated into the molepercentage of the vapor that is substance 1,8- Cineole on the y-axis and the mole percentageof liquid that is 1,8- Cineole on the x-axis. The remaining mole percentage in both cases isn-Butane.
67
250 0
P-x1200 0
Bubble-point curvePressure (mbar)Liquid zone150 0
P-y1T=25oC
100 0
Liquid+Vapor50 0
Dew-point curve000 ,10,20,30,40,50,60 ,70 ,80,91
mole fraction of 1,8 Cineole
Figure 43: Vapor-Liquid equilibrium for 1, 8 Cineole (1) /n-Butane (2) at 25oC. The solid curve showsthe COSMOtherm predictions
0,0024mole fraction of 1,8 Cineole in Vapor
x1-y10,0020,00160,00120,00080,0004000,10,20,30,40,50,60,7mole fraction of 1,8 Cineole in LiquidT=25 Co
Figure 44: The X-Y diagram for 1, 8 Cineole (1) /n-Butane (2) at 25oC. The solid curve shows theCOSMOtherm predictions
68
Nitrobenzene– n-Butane binary systemFigure shows the vapor liquid equilibrium data for nitrobenzene (1) /n-butane (2) at fixedtemperature 25oC. In this diagram, the large amount of nitrobenzene is appearing in mixturezone and liquid zone. The boiling point of nitrobenzene is very high, so small amount ofnitrobenzene occur in vapor phase. Figure shows the amount of nitrobenzene in vapor andliquid phases at different pressures.3000o
T=25 C2500Bubble-point curvePressure (mbar)2000Liquid zone1500P-x1P-y1
1000
Liquid+Vapor
500Dew-point curve000,10,20,30,40,50,6mole fraction of Nitrobenzene0,70,80,91
Figure 45: Vapor-Liquid equilibrium for Nitrobenzene (1) /n-Butane (2) at 25oC. The solid curve showsthe COSMOtherm predictions
69
5,0E-044,5E-04mole fraction Nitrobenzene in Vapor
4,0E-043,5E-043,0E-042,5E-042,0E-041,5E-041,0E-045,0E-050,0E+0000,10,20,30,40,50,6mole fraction Nitrobenzene in Liquid0,70,80,9x1-y1T=25 Co
Figure 46: The X-Y diagram for Nitrobenzene (1) /n-Butane (2) at 25oC. The solid curve shows theCOSMOtherm predictions
1-Pentanol – n-Butane binary systemFigure shows the vapor liquid equilibrium data for 1-pentanol (1) /n-butane (2) at 25oC.Figure shows the variation of amount of 1-pentanol in vapor phase and the amount of 1-pentanol in liquid phase at different pressures. The remaining mole fraction in both cases isn-butane.
70
3000T=25 Co
2500
Bubble-point curveLiquid zone
P-x1P-y1
Pressure (mbar)
2000
1500
Liquid + Vapor
1000
500
Dew-point curve
000,10,20,30,40,50,60,70,80,91mole fraction of 1-Pentanol
Figure 47: Vapor-Liquid equilibrium for 1-Pentanol (1) /n-Butane (2) at 25oC. The solid curve shows theCOSMOtherm predictions0,0025
x1-y1mole fraction of 1-Pentanol in Vapor
0,002
T=25 C
o
0,0015
0,001
0,0005
000,10,20,30,40,50,60,70,8mole fraction of 1-Pentanol in Liquid
Figure 48: The X-Y diagram for 1-Pentanol (1) /n-Butane (2) at 25oC. The solid curve shows theCOSMOtherm predictions
71
Sulfurylchloride – n-Butane binary systemFigure shows the vapor liquid equilibrium data for sulfurylchloride (1)/n-butane (2) at 25oCand the vapor-liquid phase diagram is calculated by setting isothermal option at a fixedtemperature (25oC) in COSMOtherm. The x-y diagram (Figure ) shows the vapor-liquidequilibrium data of this binary system, a point on the equilibrium curve separated into themole percentage of the vapor that is sulfurylchloride on the y-axis and the mole percentage ofliquid that is sulfurylchloride on the x-axis. The remaining mole percentage in both cases isn-Butane.3 000
P12 500
P2
Bubble-point curvePressure (mbar)2 000
T=25 CP-x1
o
Liquid zoneP31 500
P-y1
P41 000
Liquid+VaporDew-point curve
500
Vapour zone000,10 ,20,30 ,40,50,6
P50,70,80,91
mole fraction of Sulfuryl chloride
Figure 49: Vapor-Liquid equilibrium for Sulfuryl chloride (1) /n-Butane (2) at 25oC. The solid curveshows the COSMOtherm predictions
72
0,12
mole fraction of sulfurylchlorid ein Vapor
0,1
T=25 Cx1-y1
o
0,08
0,06
0,04
0,02
000,10,20,30,40,50,6
mole fraction of s ulfurylchloride in Liquid
Figure 50: The X-Y diagram for Sulfuryl chloride (1) /n-Butane (2) at 25oC. The solid curve shows theCOSMOtherm predictions
Cyanogenchloride – n-Butane binary systemFigure 51 shows the vapor liquid equilibrium data for cyanogenchloride (1)/n-butane (2) at25oC. The vapor-liquid phase diagram is calculated by using COSMOtherm at fixedtemperature 25oC. In Figure 52, the point A is called an azeotropic point. At this point, themixture behaves as a pure substance and these azeotropic mixtures cannot separated byordinary distillation.Since we are concerned with very low concentrations, this unusual behavior is not relevanthere. Figure shows the vapor-liquid equilibrium data, in this binary system, a point on theequilibrium curve separated into the mole percentage of the vapor that is cyanogen chlorideon the y-axis and the mole percentage of liquid that is cyanogen chloride on the x-axis. Theremaining mole percentage in both cases isn-Butane.
73
4000
Liquid zone37503500Pressure (mbar)32503000
AAzeotropic pointLiquid+Vapor
Liquid+Vapor
Vapour zone275025002250200000,10,20,30,40,50,60,70,8
T=25 CP-x1P-y1
o
0,9
1
mole fraction of Cyanogenchloride
Figure 51: Vapor-Liquid equilibrium for Cyanogen chloride (1) /n-Butane (2) at 25oC. The solid curveshows the COSMOtherm predictions0,3mole fraction of cyanogenchloride in Vapor
0,24
T=25 Cx1-y10,18
o
0,12
0,06
000,020,040,060,080,1
mole fraction of cyanogenchloride in Liquid
Figure 52: The X-Y diagram for Cyanogen chloride (1) /n-Butane (2) at 25oC. The solid curve shows theCOSMOtherm predictions
74
Based on its phase behaviour properties withn-butane, cyanogen chloride is considered acandidate additive, for example the concentrations in each phase are similar (e.g. at a molfraction of 0.02 in the liquid, the vapor phase concentration is 0.09).Bis-(2-chloroethyl) sulfide – n-Butane binary systemThe phase behavior of this system is shown in figures 53 and 54. It is not considered a goodcandidate.3000
2500Bubble-point curvePressure (mbar)2000Liquid zone1500
P-x1P-y1T=25 Co
1000
Liquid+Vapor
500Dew-point curve000,10,20,30,40,50,60,70,80,91mole fraction of Bis(2-chloroethyl)sulfide
Figure 31: Vapor-Liquid equilibrium for Bis(2-chloroethyl)sulfide (1) /n-Butane (2) at 25oC. The solidcurve shows the COSMOtherm predictions
75
mole fraction of Bis(2-chloroethyl)sulfide in Vapor
0,006o
0,005
T=25 C
x1-y10,004
0,003
0,002
0,001
000,10,20,30,40,50,60,70,80,91mole fraction of Bis(2-chloroethyl)s ulfide in Liquid
Figure 54: The X-Y diagram for Bis(2-chloroethyl)sulfide (1) /n-Butane (2) at 25oC. The solid curveshows the COSMOtherm predictions
76
Bis-(2-chloroethyl) ethylamine– n-Butane binary systemThe phase behavior of this system is shown in figures 55 and 56. It is not considered agood candidate.3000P-x1Bubble-point curveP-y1T=25 Co
2500
Pressure (mbar)
2000
Liquid zone
1500Liquid + Vapor
1000
500
Dew-point curve
000,10,20,30,40,50,60,7mole fraction of Bis(2-chloroethyl)ethylamine0,80,91
Figure 55: Vapor-Liquid equilibrium for Bis(2-chloroethyl)ethylamine (1) /n-Butane (2) at 25oC.The solid curve shows the COSMOtherm predictions
77
mole fraction of Bis(2-chloroethyl)ethylamine inVapor
3,0E-04
2,5E-04
T=25 Cx1-y1
o
2,0E-04
1,5E-04
1,0E-04
5,0E-05
0,0E+0000,10,20,30,40,50,60,70,80,91
mole fraction of Bis (2-chloroethyl)ethylamine in Liquid
Figure 56: Vapor-Liquid equilibrium for Bis(2-chloroethyl)ethylamine (1) /n-Butane (2) at 25oC.The solid curve shows the COSMOtherm predictions
78
Dichloroethylarsine – n-Butane binary systemFigure shows the vapor liquid equilibrium data for dichloroethylarsine (1)/n-butane (2) at25oC. Figure shows the variation of mole fraction of dichloroethylarsine in vapor and liquidphases at different pressure. In this binary system, a point on the equilibrium curve representsthe mole fraction of the vapor that is dichloroethylarsine on the y-axis and the mole fractionof liquid that is dichloroethylarsine on the x-axis.
3000
2500
T=25 CBubble-point curveP-x1P-y1Liquid zone
o
2000Pressure (bar)
1500
1000
Liquid + Vapor
500
Dew-point curveVapour zone00,10,20,30,40,50,60,7mole fraction of Dichloroethylarsine0,80,91
0
Figure 57: Vapor-Liquid equilibrium for Dichloroethylarsine (1) /n-Butane (2) at 25oC. The solid curveshows the COSMOtherm predictions
79
0,005mole fraction of Dichloroethylarsine in Vapor
0,00450,0040,00350,0030,0025x1-y10,0020,00150,0010,0005000,10,20,30,40,50,6
T=25 C
o
mole fraction of Dichloroethylarsine in Liquid
Figure 58: The X-Y diagram for Dichloroethylarsine (1) /n-Butane (2) at 25oC. The solid curve showsthe COSMOtherm predictions
Bromobenzylcyanide – n-Butane binary systemFigure shows the vapor liquid equilibrium data for bromobenzylcyanide (1)/n-butane (2) at25oC. Figure shows the variation of mole fraction of bromobenzylcyanide in vapor andliquid phases at different pressure. In this binary system, a point on the equilibrium curverepresents the mole fraction of the vapor that is bromobenzylcyanide on the y-axis and themole fraction of liquid that is bromobenzylcyanide on the x-axis. However it is consideredthat this very large molecule with a high boiling point would not be a suitable deterrentadditive to butane.
80
30000P-x1
25000Bubble-point curveLiquid zone
P-y1T=25 Co
Pressure (mbar)
20000
15000
10000
Liquid + Vapor
5000
Dew-point curve
000,10,20,30,40,50,60,7mole fraction of bromobenzylcyanide0,80,91
Figure 59: Vapor-Liquid equilibrium for Bromobenzylcyanide (1) /n-Butane (2) at 25oC. The solid curveshows the COSMOtherm predictions
0,005mo le fraction of bro mo benzylcy anide in Vapo r
0,004
x1-y1T=25 Co
0,003
0,002
0,001
000,10,20,30,40,50,60,70,80,91mole fraction of bromobenzylcyanide in Liquid
Figure 60: The X-Y diagram for Bromobenzylcyanide (1) /n-Butane (2) at 25oC. The solid curve showsthe COSMOtherm predictions
Chloropicrin– n-Butane binary system81
Figure shows the vapor liquid equilibrium data for chloropicrin (1)/n-butane (2) at 25oC.Figure shows the variation of mole fraction of chloropicrin in vapor and liquid phases atdifferent pressure. In this binary system, a point on the equilibrium curve represents the molefraction of the vapor that is chloropicrin on the y-axis and the mole fraction of liquid that ischloropicrin on the x-axis. However it is considered that this very large molecule with a highboiling point would not be a suitable deterrent additive to butane.3000o
2500
T=25 CP-x1
Bubble-point curvePressure (mbar)2000
P-y1
Liquid zone1500
1000
Liquid+Vapor
500
Dew-point curveVapor zone
000,10,20,30,40,50,60,70,80,91
mole fraction of chloropicrin
Figure 61: Vapor-Liquid equilibrium for Chloropicrin (1) /n-Butane (2) at 25oC. The solid curve showsthe COSMOtherm predictions
82
0,2mole fraction of chloropicrin in Vapor
T=25 C
o
x1-y10,16
0,12
0,08
0,04
000,10,20,30,40,50,60,7mole fraction of chloropicrin in Liquid0,80,91
Figure 62: The X-Y diagram for Chloropicrin (1) /n-Butane (2) at 25oC. The solid curve shows theCOSMOtherm predictions
Diphenylcyanoarsine– n-Butane binary systemFigure shows the vapor liquid equilibrium data for Diphenylcyanoarsine (1)/n-butane (2) at25oC. It is considered that this very large molecule with a high boiling point would not be asuitable deterrent additive to butane.
83
3000
2500T=25 CPressure (mbar)2000P-x11500P-y1o
1000
500
000,10,20,30,40,50,60,70,80,91mole fraction of Diphenylcyanoarsine
Figure 63: Vapor-Liquid equilibrium for Chloropicrin (1) /n-Butane (2) at 25oC. The solid curve showsthe COSMOtherm predictions
Ethylmercaptan – n-Butane binary systemThe Figure shows the phase behavior of ethylmercaptan (1)/n-butane (2) binary system at 25o
C. The Figure shows the mole fraction of ethylmercaptan in vapor phase and liquid phases
at different pressure.
84
3000P12500Bubble-point curvePressure (mbar)2000Liquid + Vapor1500Dew-point curve1000Vapour zoneP5500P3Liquid zoneP4T=25 CP2P-x1P-y1o
000,10,20,30,40,50,60,7mole fraction of ethylmercaptan0,80,91
Figure 64: Vapor-Liquid equilibrium for Ethylmercaptan (1) /n-Butane (2) at 25oC. The solid curveshows the COSMOtherm predictions0,10,09mole fraction of ethylmercaptan in Vapor
0,080,070,060,050,040,030,020,01000,020,040,060,080,10,120,140,160,180,2mole fraction of ethylmercaptan in Liquid
x1-y1T=25 Co
Figure 65: The X-Y diagram for Ethylmercaptan (1) /n-Butane (2) at 25oC. The solid curve shows theCOSMOtherm predictions
85
This compound may be a good candidate, but will not be considered further, as the focus ofthis work is substances other than mercaptans.Bis(chloromethyl)ether – n-Butane binary systemThe Figure shows the vapor liquid equilibrium data for bis(chloromethyl)ether (1) /n-butane(2) at 25oC. The LLE point found at pressure of 0.2225mbar and the pressure above this,mixture behaves as liquid. So this compound is not suitable to add to butane.3000Liquid zoneBubble-point curveP-x1P-y1T=25 CPressure (mbar)2000o
2500
1500Liquid + Vapor
1000
500Dew-point curve000,10,20,30,40,50,60,7mole fraction of Bis (chloromethyl)ether0,80,91
Figure 66: Vapor-Liquid equilibrium for Bis(chloromethyl)ether (1) /n-Butane (2) at 25oC. The solidcurve shows the COSMOtherm predictions
2- Aminophenol – n-Butane binary systemThe Figure shows the vapor liquid equilibrium data for 2-aminophenol (1) andn-butane (2)at 25oC. The LLE point found at pressure of 0,2423E+04mbar (composition of components(1) and (2) in liquid phase 1 and phase 2 at this pressure x'(1)=0,009119, x'(2)=0,990881,x''(1)=0,85277751, x''(2)=0,14722249 ) and the pressure above this, mixture behaves asliquid. So this compound is not suitable to add to butane.
86
3000Liquid zone2500Bubble-point curveP-x1P-y1T=25 CPressure (mbar)2000o
1500Liquid + Vapor1000
500Dew-point curve000,10,20,30,40,50,60,70,80,91mole fraction of 2-aminophenol
Figure 67: Vapor-Liquid equilibrium for 2-Amino phenol (1) /n-Butane (2) at 25oC. The solid curveshows the COSMOtherm predictions
Propylene glycol – n-Butane binary systemThe Figure shows the vapor liquid equilibrium data for propylene glycol (1) andn-butane(2) at 25oC. The LLE point found at pressure of 0,2435E+04mbar (composition ofcomponents (1) and (2) in liquid phase 1 and phase 2 at this pressure x'(1)=0,0037,x'(2)=0,9963, x''(1)=0,774, x''(2)=0,226) and the pressure above this, mixture behaves asliquid. So this compound is not suitable to add to butane
87
3000
Bubble-point curve2500
Liquid zone
P-x1P-y1T=25 Co
Pressure (mbar)
2000
1500
Liquid + Vapor
1000
500
Dew-point curve
000,10,20,30,40,50,60,7mole fraction of propyleneglycol0,80,91
Figure 68: Vapor-Liquid equilibrium for Propylene glycol (1)/n-Butane (2) at 25oC. The solid curveshows the COSMOtherm predictions
s-Trioxane – n-Butane binary systemThe Figure shows the vapor liquid equilibrium data for s-trioxane (1) andn-butane (2) at 25o
C. The LLE point found at pressure of 0,2304E+04mbar (composition of components (1)
and (2) in liquid phase 1 and phase 2 at this pressure x'(1)=0,0785, x'(2)=0,9215,x''(1)=0,8327, x''(2)=0,1673) and the pressure above this, mixture behaves as liquid.
Chloroacetophenone– n-Butane binary systemThe Figure shows the vapor liquid equilibrium data for chloroacetophenone (1) andn-butane(2) at 25oC. The LLE point found at pressure of 0.2267E+04mbar (composition ofcomponents (1) and (2) in liquid phase 1 and phase 2 at this pressure x'(1)=0.0175,x'(2)=0.825, x''(1)=0.38, x''(2)=0.62) and the pressure above this, mixture behaves as liquid.
88
3000P-x12500Bubble-point curveLiquid zoneP-y1T=25 CPressure (mbar)2000o
1500Liquid + Vapor1000
500
Dew-point curve
000,10,20,30,40,50,60,7mole fraction of 1,3,5 trioxane0,80,91
Figure 69: Vapor-Liquid equilibrium for 1, 3, 5 Trioxane (1) /n-Butane (2) at 25oC. The solid curveshows the COSMOtherm predictions
3000P-x12500Bubble-point curveLiquid zoneP-y1T=25 CPressure (mbar)2000o
1500Liquid + Vapor1000
500Dew-point curve000,10,20,30,40,50,60,7mole fraction of 2-chloroacetophenone0,80,91
Figure 70: Vapor-Liquid equilibrium for Chloroacetophenone (1) /n-Butane (2) at 25oC. The solid curveshows the COSMOtherm predictions
89
Indole – n-Butane binary systemThe Figure shows the vapor liquid equilibrium data for Indole (1) andn-butane (2) at 25oC.The LLE point found at pressure of 0.2276E+04mbar (composition of components (1) and(2) in liquid phase 1 and phase 2 at this pressure x'(1)=0.155, x'(2)=0.845, x''(1)=0.505,x''(2)=0.495) and the pressure above this, mixture behaves as liquid.3000P-x125002000Bubble-point curveLiquid zoneP-y1T=25 CPressure (mbar)o
1500Liquid + Vapor1000
500000,1
Dew-point curve
0,2
0,3
0,40,50,6mole fraction of indole
0,7
0,8
0,9
1
Figure 71: Vapor-Liquid equilibrium for Indole (1) /n-Butane (2) at 25oC. The solid curve shows theCOSMOtherm predictions
Pyridine – n-Butane binary systemThe Figure shows the vapor liquid equilibrium data for pyridine (1)/n-butane (2) at fixedtemperature 25oC and the vapor-liquid phase diagram is calculated by using COSMOtherm.The Figure 32 shows the amount of pyridine in vapor and liquid phases. A point on this curveshows the variations of pyridine in liquid that is in equilibrium with pyridine in vapor atdifferent pressures. The remaining mole percentage in both cases is n-butane.
90
3000P-x1P-y1
2500
Bubble-point curvePressure (mbar)2000
Liquid zone
T=25 C
o
1500
Liquid + Vapor1000
500
Dew-point curveVapor zone
000,10,20,30,40,50,60,70,80,91mole fraction of pyridine
Figure 72: Vapor-Liquid equilibrium for Pyridine (1) /n-Butane (2) at 25oC. The solid curve shows theCOSMOtherm predictions0,006
0,005mole fraction of pyridine in Va por
0,004
x1-y1T=25 Co
0,003
0,002
0,001
000,010,020,030,040,050,060,070,080,090,1mole fraction of Pyridine in liquid
Figure 32: The X-Y diagram for Pyridine (1) /n-Butane (2) at 25oC. The solid curve shows theCOSMOtherm predictions
91
Butyl amine – n-Butane binary systemThe Figure shows the vapor liquid equilibrium data for butylamine (1)/n-butane (2) at fixedtemperature 25oC and the vapor-liquid phase diagram is calculated by using COSMOtherm.The Figure shows the amount of butylamine in vapor and liquid phases. A point on thiscurve shows the variations of butylamine in liquid that is in equilibrium with butylamine invapor at different pressures. The remaining mole percentage in both cases isn-butane.
3000P-x12500
Bubble-point curve
P-y1T=25 Co
Pressure (mbar)
2000
Liquid zone
1500
Liquid+Vapor1000
500
Dew-point curveVapour zone000,10,20,30,40,50,60,70,80,91mole fraction of butylamine
Figure 74: Vapor-Liquid equilibrium for Butylamine (1) /n-Butane (2) at 25oC. The solid curve showsthe COSMOtherm predictions
92
0,2mole fraction of butylamine in Vapor
x1-y10,16T=25 Co
0,12
0,08
0,04
000,150,30,450,60,750,9mole fraction of butylamine in Liquid
Figure 75: The X-Y diagram for Butylamine (1) /n-Butane (2) at 25oC. The solid curve shows theCOSMOtherm predictions
Figure 33 shows the mole fraction of nine compounds which could be possible additives inthe vapor phase as a function of its concentration in the liquid phase. This diagram is createdfrom the phase equilibrium calculations of possible candidates made in the preceding section.A point on the equilibrium curve is the mole percentage of additive in the vapor as a functionof the mole percentage additive in the liquid, in binary mixtures of the additive and butane.
93
0,220,2mole fraction of component in Vapor0,180,160,140,120,10,080,060,040,02000,10,20,30,40,50,60,70,80,91mol e fraction of component in Liqui d
T=25 C
o
IsobutanalCyanogen chlorideButylamine
Dimethyls ulfideEthylmercaptanTrimethylpentane
SulfurylchloridePyridineTriethylamine
Figure 33: The X-Y diagram for 9 possible additives (1) /n-Butane (2) at 25oC. The solid curve shows theCOSMOtherm predictions
94
8 ConclusionA list of 27 possible compounds was compiled, selected preliminarily on the basis ofdeterrent effect and solubility in organic solvents. Phase equilibrium calculations wereperformed using COSMOtherm, after this software tool had been validated against theavailable experimental data. From these calculations 9 compounds (triethylamine,isobutyraldehyde, pyridine, dimethylsulfide, sulfurylchloride, cyanogenchloride, 2,2,4trimethylpentane, ethyl mercaptan and butylamine) were considered as possible additives toprevent inhalation. Some of the remaining compounds: bis(chloromethyl)ether, 2-aminophenol, propyleneglycol, s-trioxane, 2-chloro acetophenone and indole exhibit liquid-liquid equilibrium with butane, others have a vapor pressure which is probably too low to beof interest. These compounds are not considered suitable to add to butane at roomtemperature.We conclude that compounds with a similar volatility to butane will be best, since theywill not concentrate in the liquid over time (for heavier components), nor will they be largelyremoved in a short time (for much more volatile components). The amines, cyanogenchloride, and sulfuryl chloride are considered to be the most promising compounds to add tobutane. For these substances much more work needs to be done to establish that the effect issufficient, that the additive is non-toxic in the amount added, that the lighter gas can still beused in a normal way. Again, it must be emphasized that this report represents a technicalchemical study as part of a larger study that must consider other aspects – the most importantbeing the health aspects of the proposed additives.
95
9 References[1]The final report of the national inhalant abuse task force.National directions oninhalant abuse. was endorsed by the ministerial council strategy on 15 May 2006
[2]
Hideaki Sugie. Chizuko Sasaki. Chikako Hashimoto. Hiroshi Takeshita. TomonoriNagai. Shigeki Nakamura. Masataka Furukawa. Tomonori Nagai. Takashi Nishikawa.Katsuyoshi Kurihara“Three cases of sudden death due to butane or propane gasinhalation: analysis of tissue for gas components”Forensic Science International 143
(2004) 211-214.[3]Chiaki Fuke. Tetsuji Miyazaki. Tomonori Arao. Yasumasa Morinaga. Hajime Takaesu.Taichi Takeda. Teruo Iwamasa“A fatal case considered to be due to cardiacarrhythmia associated with butane inhalation”Legal Medicine 4 (2002) 134-138.
[4]
H.Pfeiffer. M.Al Khaddam. B. Brinkmann. H.Kohler and J. Beike“Sudden death afterisobutane sniffing: a report of two forensic cases”Int J Legal Med (2006) 120: 168-
173.[5]Suk-Joon Oh. Sang-Eun Lee. Jin-Sik Burm. Chul-Hoon Chung. Jong-Wook Lee.Young-Chul Chang. Dong-Chul Kim“Explosive burns during abusive inhalation ofbutane gas”Burns 25 (1999) 341-344.
[6]
A Esmail. L Meyer. A Pottier. S Wright“Deaths from volatile substance abuse in thoseunder 18 years: results from a national epidemiological study”Archives of disease in
childhood (1993) 69: 356-360.[7]Tracey L. Kurtzman. B.A.. Kimberly N. Otsuka. M.D.. and Richard A. Wahl. M.D.“Inhalant abuse by adolescents”Journal of adolescent health (2001). 28: 170-180.
[8]
Raquel A. Crider. Beatrice A. Rouse“Epidemiology of inhalant abuse: An update”Division of Epidemiology and statistical analysis. National Institute on Drug AbuseResearch Monograph 85. 1988.
[9]
A report and recommendations on“Western Australian Task force on Butane Misuse”October 2006.
[10] Peter d’Abbs and Sarah McLean“Volatile Substance misuse: A Review ofinterventions”Department of Health and Ageing. 2008
96
[11] Roger Nicholas“The policing implications of volatile substance misuse”AustralianCenter for Policing Research. December 2004[12] Mihoko Ago. Kazutoshi Ago and Mamoru Ogata“A fatal case of n-butane poisoningafter inhaling anti-perspiration aerosol deodorant”Legal Medicine 4 (2002) 113-118.
[13] Isabel Burk“Inhalant Prevention Resource Guide”Verginia Department of Education.Division of Instructional Support Services. January 2001.[14] Andreas Klamt and Frank Eckert“COSMO-RS: a novel and efficient method for thepriori prediction of thermophysical data of liquids”Fluid Phase Equilibria 172 (2000).
43-72.[15] Chieh-Ming Hsieh and Shiang-Tai Lin“Determination of cubic equation of stateparameters for pure fluids from first principle solvation calculations”AICHE J. 54
(August 2008.) 2174-2181.[16] Tiancheng Mu. Jurgen Rarey. and Jurgen Gmehling“Performance of COSMO-RS withsigma profiles from different model chemistries”Ind. Eng. Chem. Res. (2007). 46.
6612-6629.[17] Shiang-Tai Lin and Stanley I. Sandler“A prori phase equilibrium prediction from asegment contribution solvation model”Ind. Eng. Chem. Res. (2002). 41. 899-913.
[18] Eric Mullins. Richard Oldland. Y.A.Liu. Shu Wang. Stanley I. Sandler. Chau-ChyunChen. Michael Zwolak. and Kevin C. Seavey“Sigma-profile database for usingCOSMO-based thermodynamic methods”Ind. Eng. Chem. Res. (2006). 45. 4389-
4415.[19] Eric Mullins. Y.A.Liu. Adel Ghaderi. and Stephen D. Fast“Sigma-profile database forpredicting solid solubility in pure and mixed solvent mixtures for organicpharmacological compounds with COSMO-based thermodynamic methods”Ind. Eng.
Chem. Res. (2008). 47. 1707-1725.[20] Kontogeorgis, G. M.; Voutsas, E. C.; Yakoumis, I. V.; Tassios, D. P. Ind. Eng.Chem.Res.1996, 35, 4310-4318.[21] L. Ruffine, P. Mougin, and A. Barreau“How to represent Hydrogen sulfide within theCPA Equation of state”Ind. Eng.Chem. Res.2006, 45, 7688-7699.
97
[22] Neil F Giles, and Grant M. Wilson ''Phase Equilibria on seven Binary Mixtures'' J.Chem. Eng. Data, 2000, 45 (2), 146-153.
98
