Socialudvalget 2011-12
SOU Alm.del Bilag 318
Offentligt
UNICEFInnocenti Research CentreReport Card 10
Measuringchild povertyNew league tables of child povertyin the world’s rich countries
Innocenti Report Card 10was written by Peter Adamson.Two background papers from the UNICEFInnocenti Research Centresupport this Report:1.Bradshaw, J., Y. Chzhen, C. de Neubourg, G. Main, B. Martoranoand L. Menchini (2012), ‘Relative Income Poverty among Children inRich Countries’,Innocenti Working Paper2012-01, UNICEF InnocentiResearch Centre, Florence.www.unicef-irc.org/publications/pdf/iwp_2012_01.pdfde Neubourg, C., J. Bradshaw, Y. Chzhen, G. Main, B. Martoranoand L. Menchini (2012), ‘Child Deprivation, MultidimensionalPoverty and Monetary Poverty in Europe’,Innocenti Working Paper2012-02, UNICEF Innocenti Research Centre, Florence.www.unicef-irc.org/publications/pdf/iwp_2012_02.pdf
2.
The UNICEF Innocenti Research Centre would like to acknowledge thegenerous support forReport Card 10provided by the Andorran,Belgian, Swiss and United Kingdom National Committees for UNICEF.Any part of thisInnocenti Report Cardmay be freely reproduced usingthe following reference:UNICEF Innocenti Research Centre (2012), ‘Measuring Child Poverty:New league tables of child poverty in the world’s rich countries’,Innocenti Report Card 10,UNICEF Innocenti Research Centre, Florence.
Which countriesare included?
TheReport Cardseries is designed to monitor and compare theperformance of economically advanced countries in securing the rightsof their children.The Innocenti Research Centre (IRC) was established in Florence, Italyin 1988 to strengthen the research capability of the United NationsChildren’s Fund (UNICEF) and to support its advocacy for childrenworldwide. IRC is the dedicated research hub of the UNICEF Office ofResearch (OOR), which provides global leadership for the organization’sstrategic research agenda around children. The Office aims to set out acomprehensive framework for research and knowledge within theorganization, in support of its global programmes and policies. Throughstrengthening research partnerships with leading academic institutionsand development networks in both the North and South, the Officeseeks to leverage additional resources and influence in support ofefforts towards policy reform in favour of children.The Centre's publications are contributions to a global debate on childrights and help facilitate full implementation of the Convention on theRights of the Child in low-, middle- and high-income countries. Theviews expressed are those of the authors and researchers and do notnecessarily reflect the policies or views of UNICEF.
Data on child deprivation ratesare drawn from the 2009 roundof theEuropean Union Statisticson Income and Living Conditionsand are therefore available for 29countries, i.e. all 27 countries ofthe European Union plus Norwayand Iceland. Most of these (23out of 29) are also members ofthe Organisation for EconomicCo-operation and Development(OECD). The exceptions areBulgaria, Cyprus, Latvia,Lithuania, Malta and Romania,which are EU member states,but not members of the OECD.Data on relative child povertyrates are also available for sixadditional OECD countries(Australia, Canada, Japan,New Zealand, Switzerland, andthe United States). The analysisof relative child poverty thereforeincludes the following 35countries:Australia, Austria, Belgium,Bulgaria, Canada, Cyprus,Czech Republic, Denmark,Estonia, Finland, France,Germany, Greece, Hungary,Iceland, Ireland, Italy, Japan,Latvia, Lithuania, Luxembourg,Malta, the Netherlands,New Zealand, Norway, Poland,Portugal, Romania, Slovakia,Slovenia, Spain, Sweden,Switzerland, United Kingdom,United States.
� United Nations Children’s Fund (UNICEF), May 2012ISBN: 978-88-8912-965-4ISSN: 1605-7317UNICEF Innocenti Research CentrePiazza SS. Annunziata, 1250122 Florence, ItalyTel: (+39) 055 2033 0Fax: (+39) 055 2033 220[email protected]www.unicef-irc.org
I n n o c e n t I
R e p o R t
c a R d
1 0
1
UNICEFInnocenti Research Centre
This report sets out the latest internationally comparable data onchild deprivation and relative child poverty. Taken together, thesetwo different measures offer the best currently available pictureof child poverty across the world’s wealthiest nations.Previous reports in this series have shown that failure toprotect children from poverty is one of the most costly mistakesa society can make. The heaviest cost of all is borne by thechildren themselves. But their nations must also pay a verysignificant price – in reduced skills and productivity, in lowerlevels of health and educational achievement, in increasedlikelihood of unemployment and welfare dependence, in thehigher costs of judicial and social protection systems, and inthe loss of social cohesion.The economic argument, in anything but the shortest term, istherefore heavily on the side of protecting children from poverty.Even more important is the argument in principle. Becausechildren have only one opportunity to develop normally in mindand body, the commitment to protection from poverty must beupheld in good times and in bad. A society that fails to maintainthat commitment, even in difficult economic times, is a societythat is failing its most vulnerable citizens and storing upintractable social and economic problems for the yearsimmediately ahead.It is for these reasons that this comparative snapshot of childpoverty in the industrialized nations is presented for theattention of political leaders, press and public.
2
I n n o c e n t I
R e p o R t
c a R d
1 0
T W O
VI E W S
OF
CHILD
POV ER TY
New league tables of child povertyin the world’s rich countries
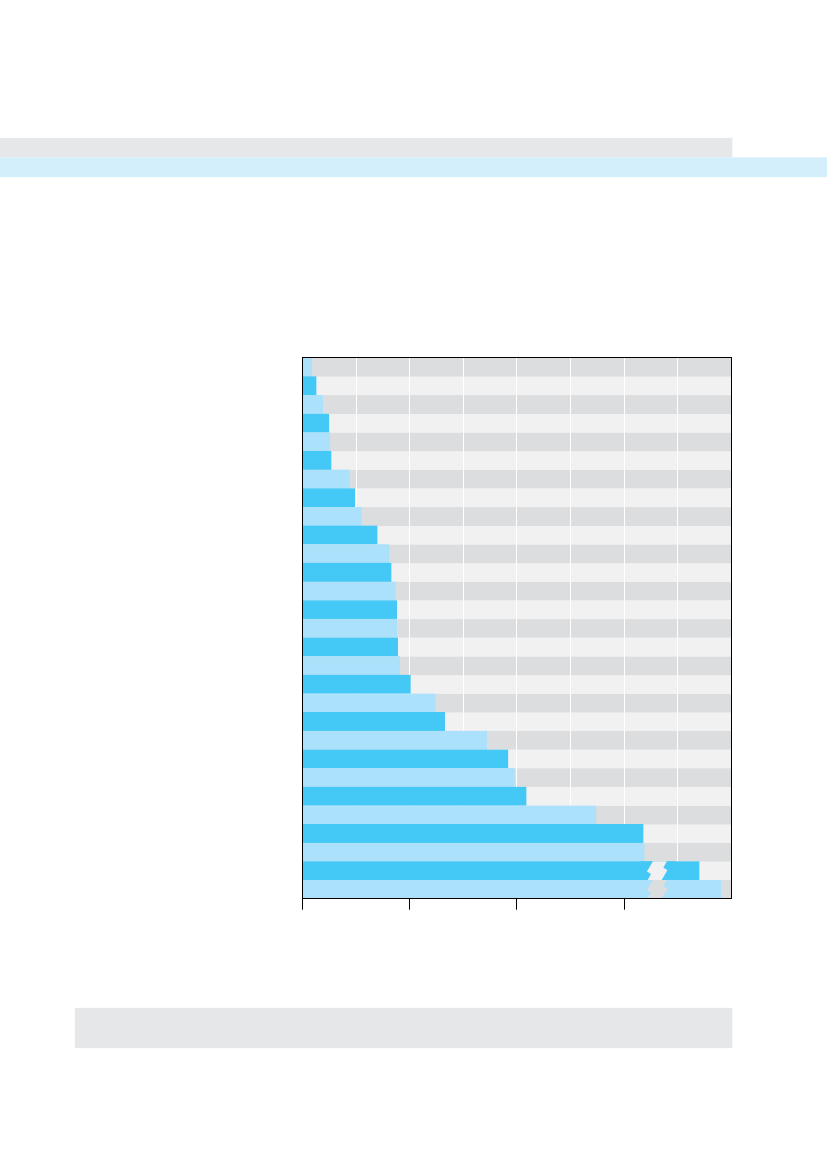
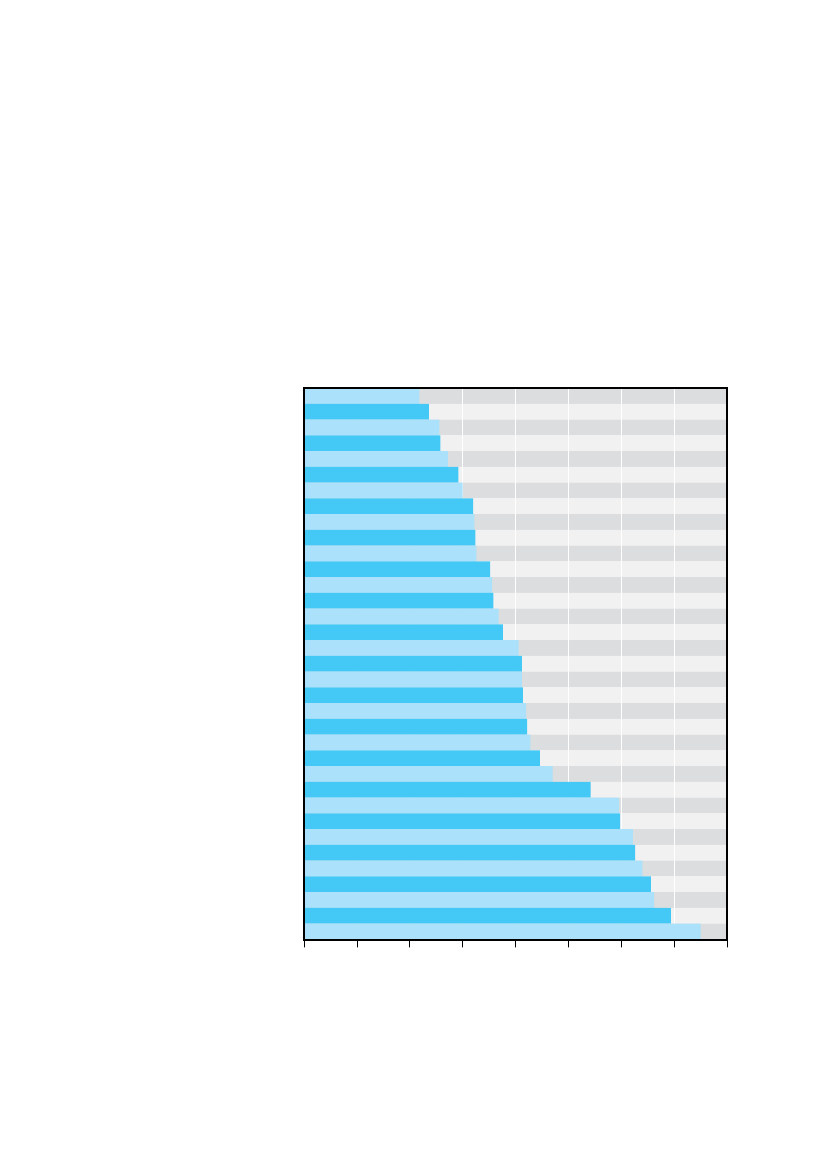
Fig. 1aA league table of childdeprivation, 29 economicallyadvanced countriesFigure 1a shows the percentage of children(aged 1 to 16) who lack two or moreof the following 14 items because thehouseholds in which they live cannotafford to provide them.1.2.Three meals a dayAt least one meal a day with meat,chicken or fish (or a vegetarianequivalent)Fresh fruit and vegetables every dayBooks suitable for the child’s age andknowledge level (not includingschoolbooks)Outdoor leisure equipment (bicycle,roller-skates, etc.)Regular leisure activities (swimming,playing an instrument, participating inyouth organizations etc.)Indoor games (at least one per child,including educational baby toys,building blocks, board games,computer games etc.)Money to participate in school tripsand eventsA quiet place with enough roomand light to do homework
0.91.31.92.52.62.74.44.95.57.08.18.38.78.88.88.99.110.112.413.317.219.219.820.927.431.831.956.672.601020Child deprivation(% of children lacking two or more items)Note:Data refer to children aged 1 to 16.Source:Calculations based on EU-SILC 2009.
IcelandSwedenNorwayFinlandDenmarkNetherlandsLuxembourgIrelandUnited KingdomCyprusSpainSloveniaAustriaCzech RepublicGermanyMaltaBelgiumFranceEstoniaItalyGreeceSlovakiaLithuaniaPolandPortugalLatviaHungaryBulgariaRomania30
3.4.
5.6.
7.
8.9.
10.An Internet connection11.Some new clothes (i.e. not allsecond-hand)12.Two pairs of properly fitting shoes(including at least one pair ofall-weather shoes)13.The opportunity, from time to time, toinvite friends home to play and eat14.The opportunity to celebrate specialoccasions such as birthdays, namedays, religious events, etc.
The data are drawn from the 2009 round of theEuropean Union Statistics on Income and Living Conditions(EU-SILC)and are not available for non-European countries of the Organisation for Economic Co-operation and Development (OECD).
I n n o c e n t I
R e p o R t
c a R d
1 0
3
IntroductionThe league tables on these pagespresent the latest available data on childpoverty across the world’s rich nations.Figure 1a, made available here for thefirst time, shows the proportion of
children in each country who aredeprived – i.e. ‘lacking two or more’of 14 items considered normal andnecessary for a child in aneconomically advanced country(see opposite for the full list).
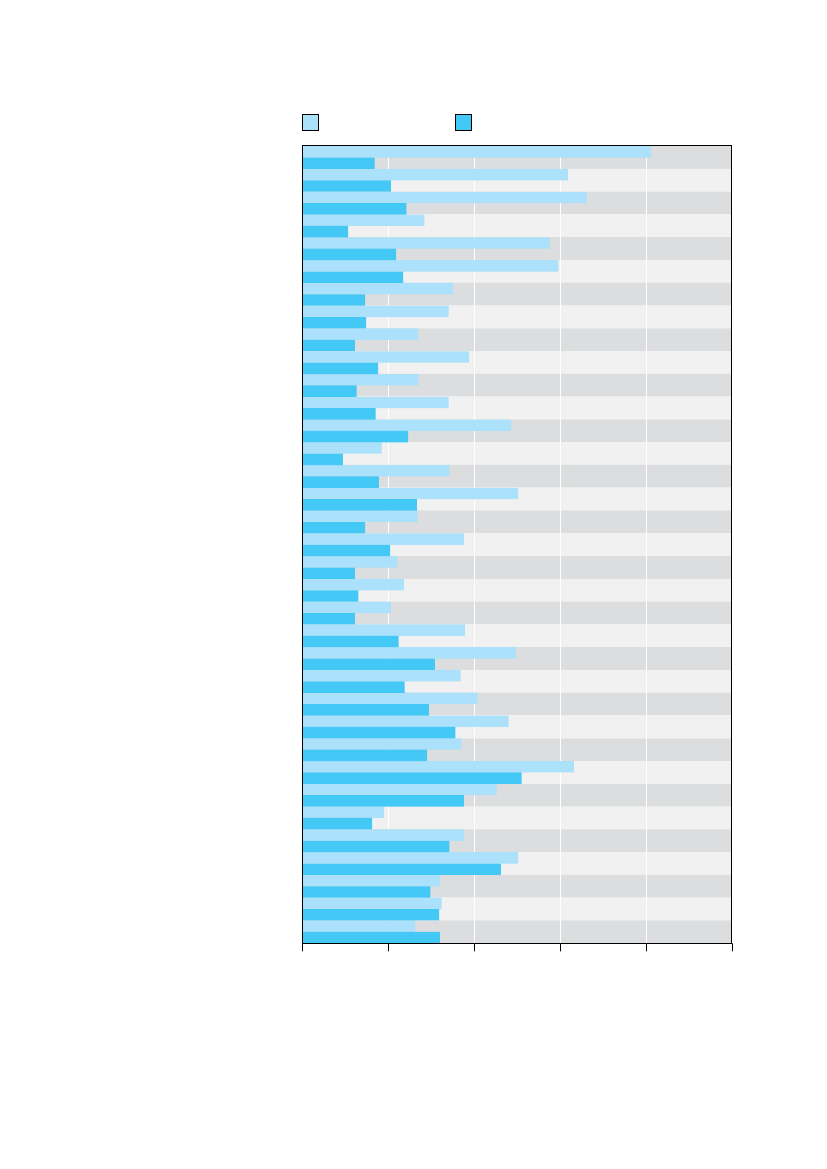
Figure 1b shows the percentage ofchildren living in relative poverty,defined as living in a household whoseincome, when adjusted for family sizeand composition, is less than 50% ofthe median income for the country inwhich they live.
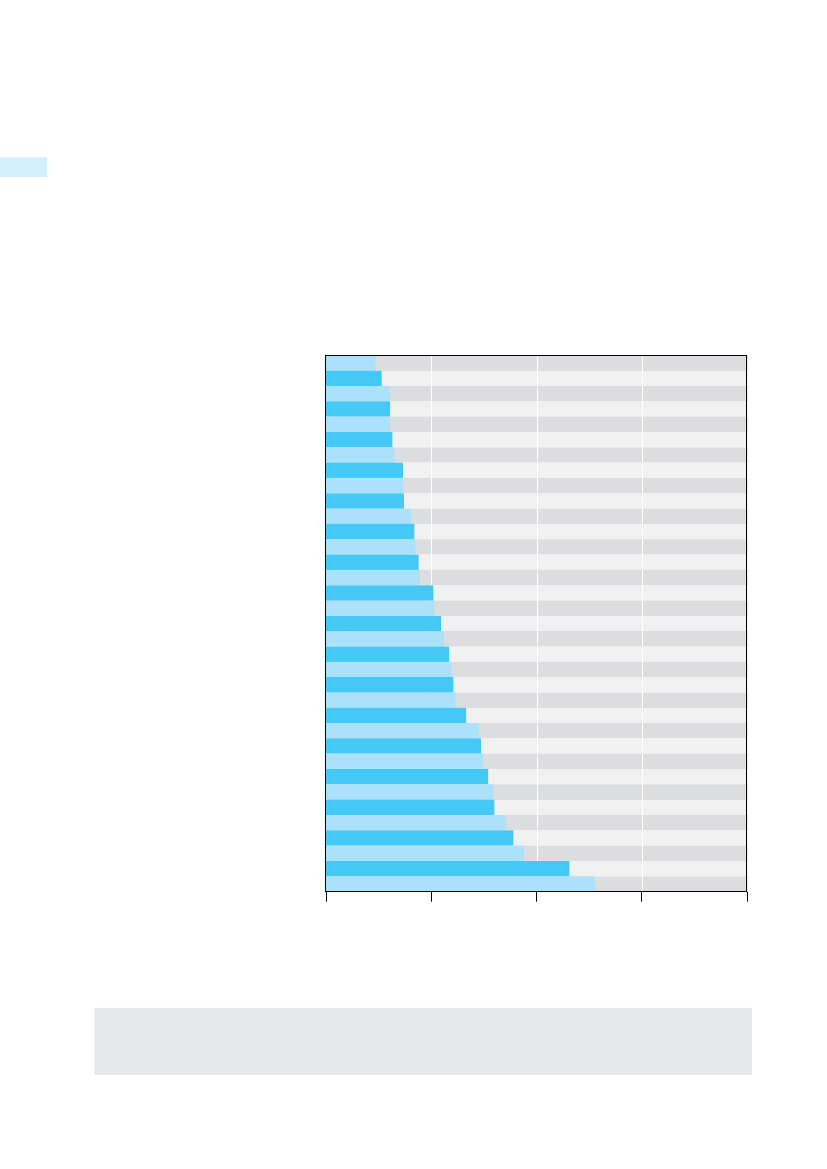
Fig. 1bA league table of relative childpoverty, 35 economically advancedcountriesFigure 1b shows the percentage of children(aged 0 to 17) who are living in relativepoverty, defined as living in a household inwhich disposable income, when adjustedfor family size and composition, is lessthan 50% of the national median income.
4.75.36.16.16.16.36.57.37.37.48.18.48.58.88.910.210.310.911.211.711.912.112.313.314.514.714.915.415.916.017.117.818.823.125.5010
IcelandFinlandCyprusNetherlandsNorwaySloveniaDenmarkSwedenAustriaCzech RepublicSwitzerlandIrelandGermanyFranceMaltaBelgiumHungaryAustraliaSlovakiaNew ZealandEstoniaUnited KingdomLuxembourgCanadaPolandPortugalJapanLithuaniaItalyGreeceSpainBulgariaLatviaUSARomania40
2030Child poverty rate(% of children living in households with equivalent income lower than 50% of national median)
Note:Data refer to children aged 0 to 17.Sources:Calculations based on EU-SILC 2009, HILDA 2009, SLID 2009, SHP 2009, PSID 2007. Results for New Zealand are from Perry(2011). Results for Japan are from Cabinet Office, Gender Equality Bureau (2011).
Some OECD countries – Australia, Canada, Japan, New Zealand, Switzerland and the United States – are included in the league tableof relative child poverty (Figure 1b) but could not be included in the league table of child deprivation (Figure 1a) because relevantdata are not available. Child deprivation data are drawn from theEuropean Union Statistics on Income and Living Conditionsand aretherefore only available for the 27 EU countries plus Iceland and Norway.
4
I n n o c e n t I
R e p o R t
c a R d
1 0
As may be seen at a glance, the twoleague tables project two very differentpictures of child poverty in the world’srich nations. What these differentpictures mean – the relationshipbetween them and the controversiessurrounding them – is the subject ofthisReport Card.
the child poverty rate is one of themost important of all indicators of asociety’s health and well-being. For thehere and now, it is a measure of whatis happening to some of society’s mostvulnerable members. For the years tocome, it is a pointer to the well-beingand cohesion of society as a whole.Previous reports in this series havepresented the evidence for the closeassociation between child povertyand a long list of individual and socialrisks – from impaired cognitivedevelopment to increased behaviouraldifficulties, from poorer physical healthto underachievement in school, fromlowered skills and aspirations to higherrisks of welfare dependency, from the
Slipping down the agendaIn the wake of statistics following thepost-2008 economic crises, the childpoverty rate has rarely surfaced.“In a downturn,”says Sharon Goldfeld,National Director of the AustralianEarly Development Index,“the firstthing that happens is that children drop offthe policy agenda.”Yet it is arguable that
greater likelihood of teenagepregnancy to the increased probabilityof drug and alcohol abuse. That thereare many exceptions – many childrenwho grow up in economically poorfamilies who do not fall into any ofthese categories – does not alter thefact that poverty in childhood isclosely and consistently associated withmeasurable disadvantage both forindividuals and for the societies inwhich they live.iA commitment to protecting childrenfrom poverty is therefore more thana slogan or a routine inclusion in apolitical manifesto; it is the hallmarkof a civilized society.
Box 1Children and recession
There are almost no internationally comparable data onwhat is happening to child poverty as a result of theeconomic downturn of the last three years.It is nonetheless evident that front-line services forfamilies are everywhere under strain as austeritymeasures increase the numbers in need while depletingthe services available. It is also clear that the worst isyet to come. Many families, even those on low incomes,have some form of ‘cushion’ – whether in the form ofsavings, assets, or help from other family members – bywhich to maintain spending during difficult times. Thereis therefore almost always a time lag between the onsetof an economic crisis and the full extent of its impact.CommitmentIn Ireland, a leader in both the theory and practice ofmonitoring child poverty, some data are available toestimate the effects on children and families of asevere contraction in the national economy. Between2009 and 2010, for example, Ireland’s own childdeprivation index showed a rise of almost 7 percentagepoints, from 23.5% to 30.2%.1Over the same period,falling median incomes meant that relative child povertyrose by less than one percentage point – again showingthe value of using the two different measuresdiscussed in this report.
The possible impact of the economic downturn onefforts to reduce child poverty rates has also recentlybeen estimated for the United Kingdom, where theChild Poverty Actof 2010 has set legally binding targetsfor reducing child poverty. By 2020, the relative childpoverty rate is to be halved to no more than 10%.(‘Absolute income poverty‘ – defined as living onan income below 60% of the median income forthe benchmark year 2010 and updated only for inflation– is to be cut from 20% to 5%.)But as the Act came into force, the economic crisiswas already beginning to threaten social protectionprogrammes. Child benefits, for example, have beenfrozen for three years – meaning that in real termsthey will fall in value. Child tax credits and otherprogrammes designed to protect the poorest childrenhave been cut back.What difference are such changes likely to maketo the UK’s long-term efforts to bring down childpoverty rates?ReversalAccording to an October 2011 report from the Institutefor Fiscal Studies (IFS),2the likeliest prospect is that theprogress of recent years will be thrown into reverse.Although currently thought to be stable, the childpoverty rate is predicted to begin rising again in 2013.
I n n o c e n t I
R e p o R t
c a R d
1 0
5
A crisis of monitoringIn practice, making good on thiscommitment is impossible withoutclose monitoring of what is happeningto children’s lives. It is monitoring thatmakes possible evidence-based policy,political accountability, informedadvocacy and the cost-effective use oflimited public resources. Theavailability of timely data is thereforein itself an indicator of whether thecommitment to protecting children isbeing taken seriously or not.The two league tables, Figures 1a and1b, therefore reveal more than thepercentages of children living indifferent kinds of poverty. They also
reveal a crisis of monitoring. In bothcases the data they present, althoughthe latest available, are mostly drawnfrom surveys conducted in 2009. Theyare therefore at least two to three yearsold.*This would be bad enough at thebest of times. But these are not the bestof times. And it is a significant failing,on behalf of many governments ofOECD countries, that the available dataon children’s lives do not yet reflect theimpact of the economic downturn(see Box 1: Children and recession).Underlying weak monitoring is thelack of any robust public or politicalconsensus on how child povertyshould be defined and measured.
“The discourse on poverty is very confusing,”says Jonathan Bradshaw, Professor ofSocial Policy at the University of Yorkand one of the authors of the statisticalanalysis on which this report draws:ii“Wetend to mix up concepts and measuresand use different words to describe the samething and the same words to describedifferent things.”iiiMany of the questions and confusionsabout the measurement of childpoverty are encompassed by the twoleague tables with which this reportbegins. It may therefore be helpful tosummarize the principal differencesbetween them.
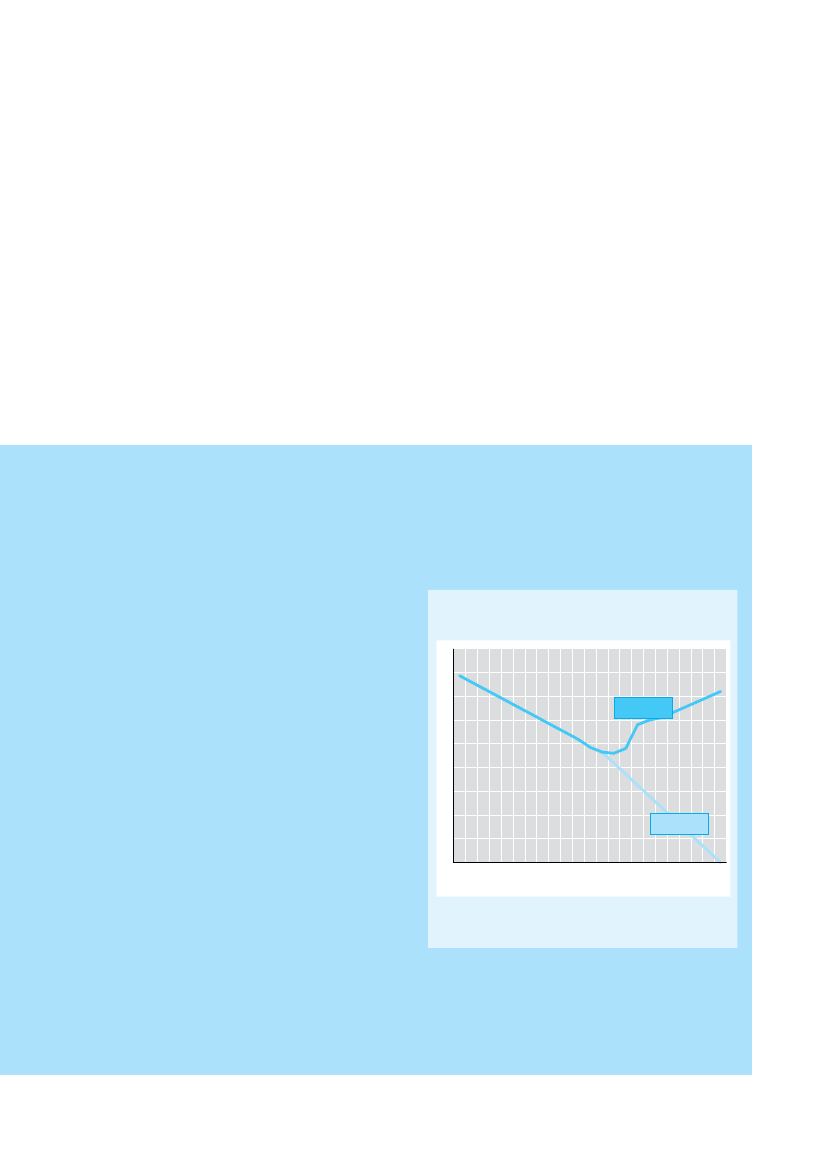
Looking further ahead, levels of ‘relative’ and ‘absolute’child poverty are expected to reach 24% and 23%respectively by 2020/21 – compared to the target figuresof 10% and 5%. This would mean a return to the relativechild poverty levels of two decades ago.Such forecasts, says the IFS, are“always highlyuncertain.”In particular, they cannot accurately predictthe impact of, and responses to, the tax and benefitchanges currently in the pipeline. They are nonethelessthe best available independent estimate of“what mighthappen to poverty under current government policies.”Since these forecasts were made, the commitment toincrease child credits by more than the rate of inflation in2012 and 2013 has been abandoned. According to IFScalculations, this decision alone is likely to mean thatanother 100,000 children will fall below the relativepoverty line.
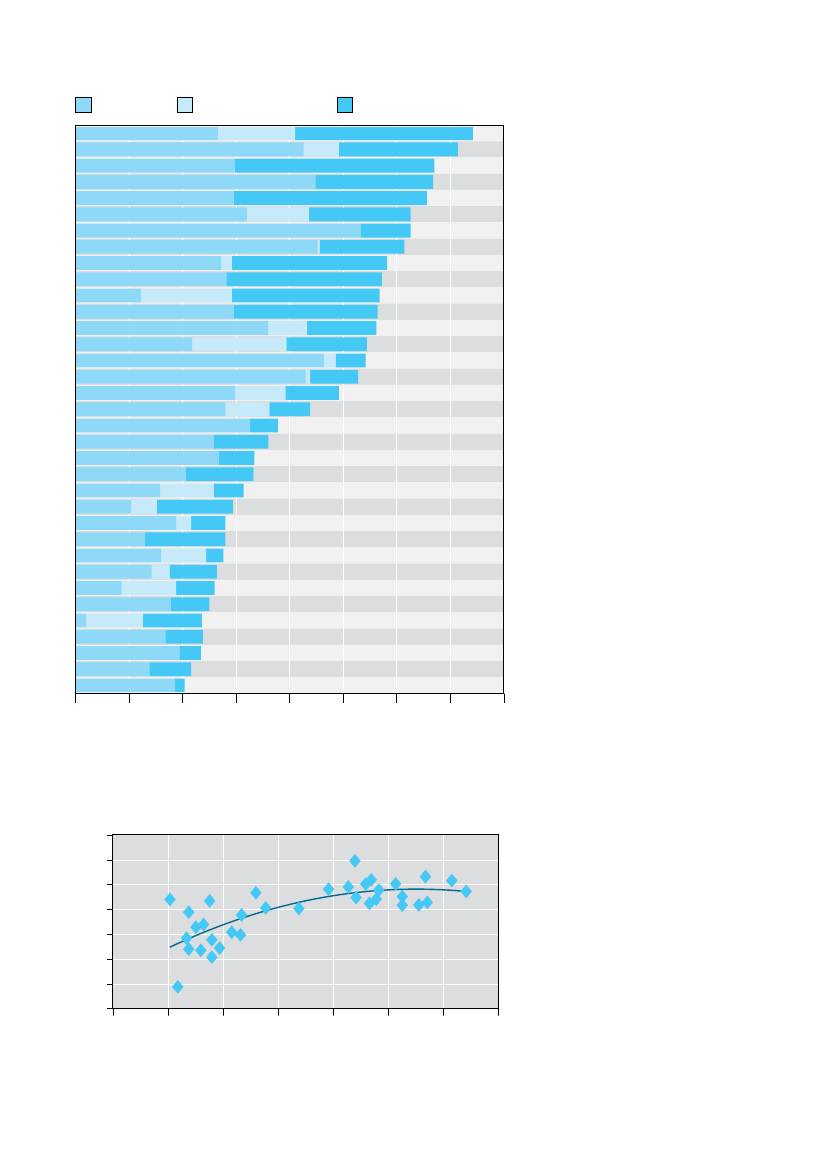
Relative child poverty rate,United Kingdom, 1998–202028262422201816141210199820002002200420062008201020122014201620182020Target
Predicted
Source:Data from the Institute for Fiscal Studies, London, October 2011. The graph showsthe percentage of children living in households below 60% of equivalized median incomebefore housing costs. For illustrative purposes, the 'Target' line assumes linear progresstowards the 2020 goal.
1Central Statistics Office Ireland, Government of Ireland, 2011.2Brewer, M., J. Browne and R. Joyce (2011).Child and Working-age
Poverty from 2010 to 2020,Institute for Fiscal Studies, London.
*EU-SILC 2009: data on income refers to 2008, other data to 2009. Poverty data was released in early 2010.
6
I n n o c e n t I
R e p o R t
c a R d
1 0
A deprivation indexFigure 1a, a League Table of ChildDeprivation, represents a significantnew development in the internationalmonitoring of child poverty. For thefirst time, theEuropean Union Statisticson Income and Living Conditions,sampling more than 125,000households in 29 European countries,has included a section on the lives ofchildren aged 1 to 16. Using this data,the UNICEF Innocenti ResearchCentre has constructed the 14-itemChild Deprivation Indexon whichLeague Table 1a is based.The 14 items in the indexencompass the ability ofhouseholds to afford:1.2.
5.6.
Outdoor leisure equipment(bicycle, roller-skates, etc.)Regular leisure activities(swimming, playing aninstrument, participating in youthorganizations etc.)Indoor games (at least one perchild, including educational babytoys, building blocks, boardgames, computer games etc.)Money to participate in schooltrips and eventsA quiet place with enough roomand light to do homework
Overall, the league table shows thatapproximately 85% of the almost85 million children (aged 1 to 16) in29 European countries have at least 13of the 14 items in the deprivationindex and are therefore ‘not deprived’.The second most obvious feature ofthe table is that the highest rates ofdeprivation are to be found in someof the newest and poorest membercountries of the European Union.Over 30% are seen to be deprived inHungary and Latvia, over 50% inBulgaria and over 70% in Romania.For Central and Eastern Europeancountries, therefore, the league table ofchild deprivation makes grim reading.Among the richest 15 countries, allexcept France and Italy have childdeprivation rates below 10%. Butclearing a bar that is set so low doesnot warrant any great applause. Inthe world’s wealthiest nations theproportion of children lacking twoor more of these basic items shouldbe at or close to zero. Yet in practiceonly Denmark, Finland, Iceland, theNetherlands, Norway and Sweden have
7.
8.9.
10.An Internet connection11.Some new clothes (i.e. not all
second-hand)12.Two pairs of properly fitting
Three meals a dayAt least one meal a day withmeat, chicken or fish (or avegetarian equivalent)Fresh fruit and vegetablesevery dayBooks suitable for the child’sage and knowledge level(not including schoolbooks)
shoes (including at least one pairof all-weather shoes)13.The opportunity, from time to
3.4.
time, to invite friends home toplay and eat14.The opportunity to celebrate
special occasions such as birthdays,name days, religious events etc.
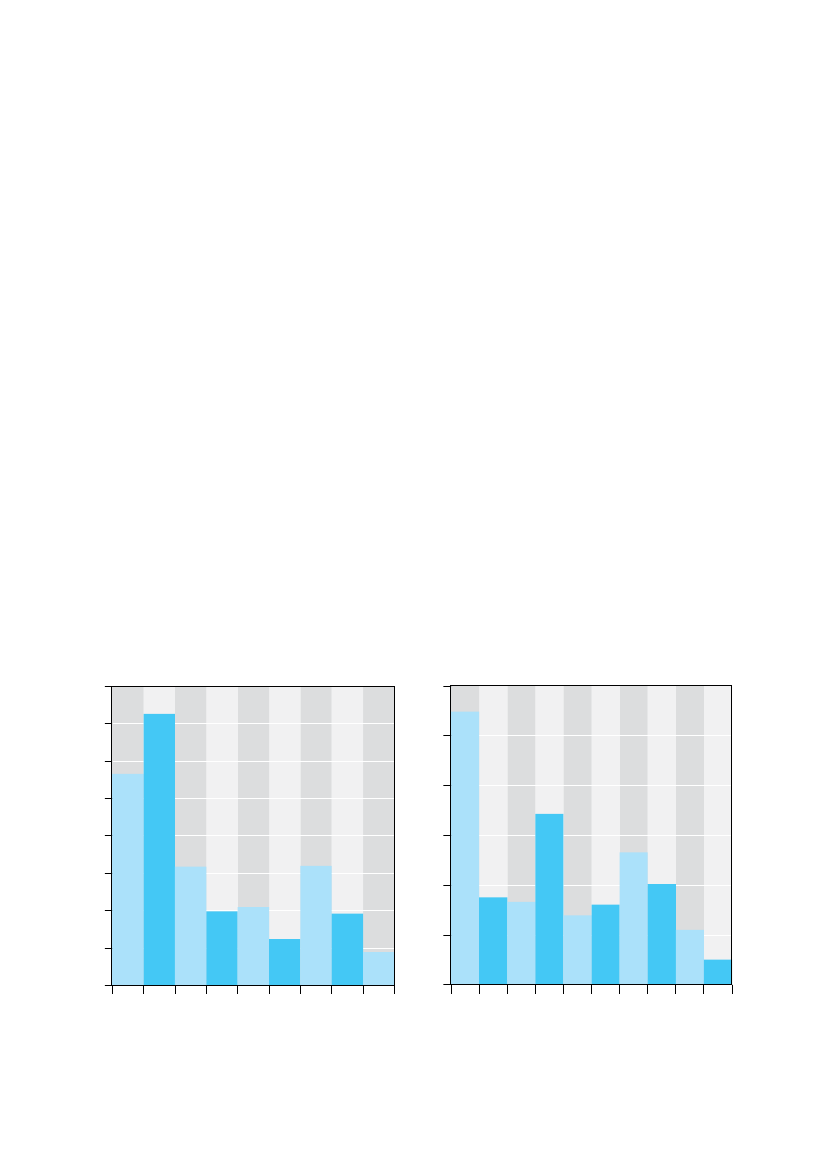
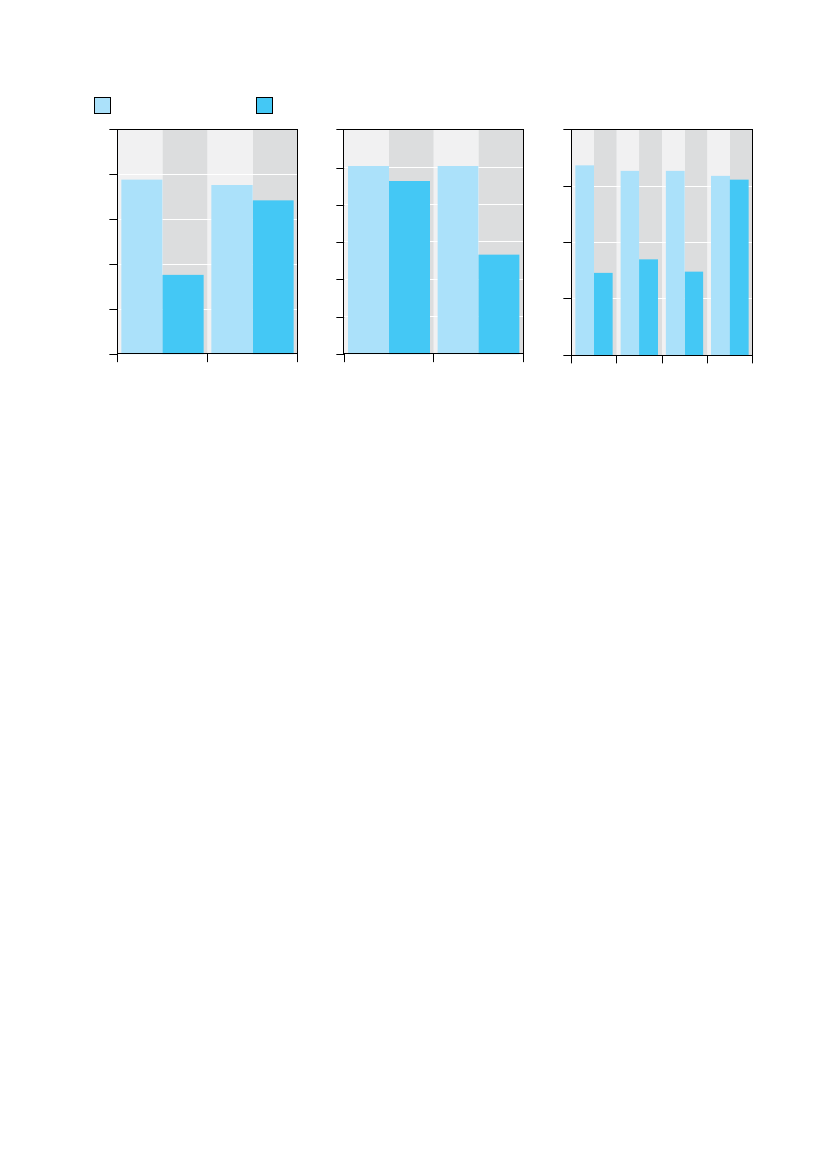
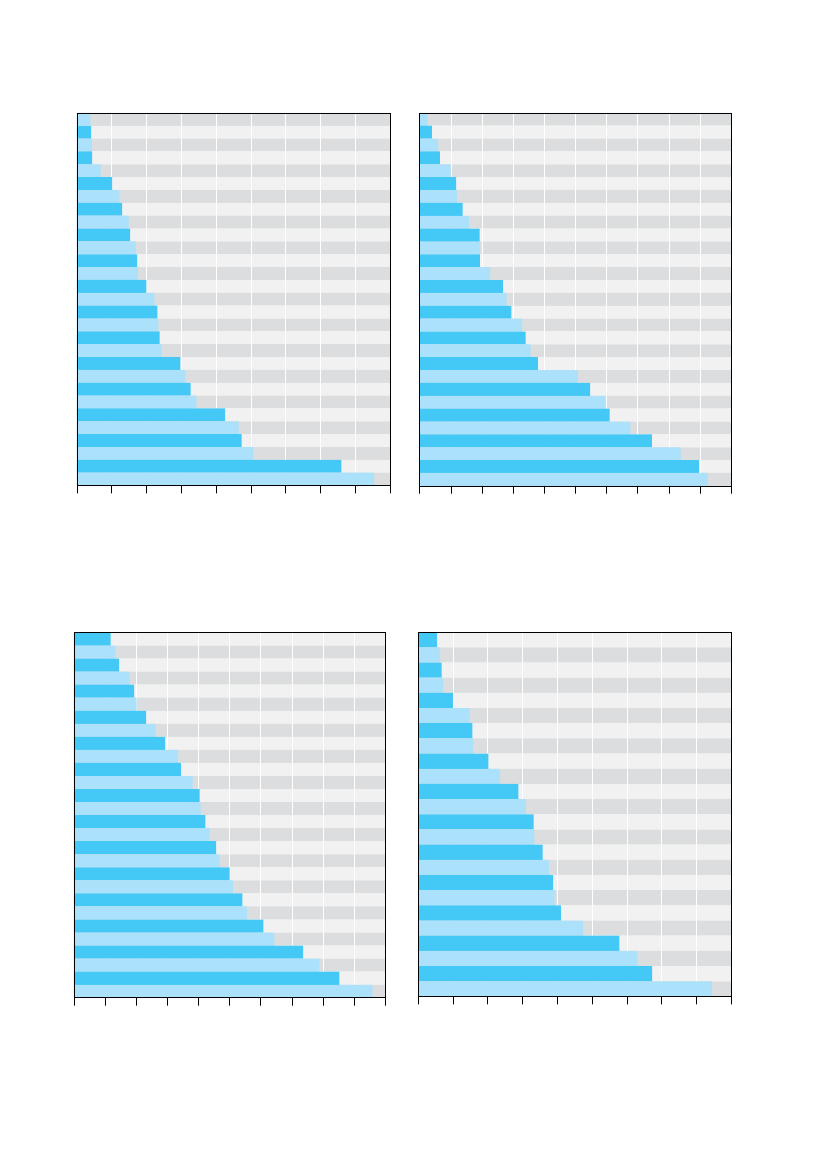
Fig. 2aPercentage of children deprived in countries withGDP per capita between $13,000 – $25,000 (PPP)8072.67060504031.83020100Lithuania($17,059)($18,925)
Fig. 2bPercentage of children deprived in countries withGDP per capita between $25,000 – $36,000 (PPP)3027.425
56.620% Children deprived
% Children deprived
17.215
13.310.18.88.37.08.15.5
31.9
1019.820.912.48.919.25
2.50United KingdomGreece($25,058)($27,556)
Slovenia
($29,303)
($30,728)
($32,262)
($32,413)
($25,572)
($33,349)
Czech Republic
($19,690)
($22,875)
($13,764)
($14,216)
($16,166)
Romania
($20,275)
($24,804)
(per capita GDP in parentheses)
(per capita GDP in parentheses)
($35,145)
($35,254)
Portugal
Slovakia
Bulgaria
Estonia
Hungary
Finland
Cyprus
Spain
Italy
Poland
France
Latvia
Malta
I n n o c e n t I
R e p o R t
c a R d
1 0
7
child deprivation rates below 3%. ForAustria, Belgium and Germany, the rateclimbs to 8% or more. In France andItaly the rate rises above the 10% mark.
Relative poverty leagueThe second of the two league tables(Figure 1b) paints a very differentpicture of child poverty in the world’sadvanced economies.It includes six OECD countries thatdo not participate in EU-SILC(Australia, Canada, Japan,New Zealand, Switzerland and theUnited States), and is based on thedefinition of relative poverty used bythe OECD. Under this definition, achild is deemed to be living in relativepoverty if he or she is growing up in ahousehold where disposable income,when adjusted for family size andcomposition, is less than 50% of themedian disposable household incomefor the country concerned.*By thisstandard, more than 15% of the 200million children in the 35 countrieslisted in Figure 1b are seen to be livingin relative poverty.The top five positions in the leaguetable are occupied by Iceland, Finland,Cyprus, the Netherlands and Norway(with Slovenia and Denmark close
More with lessLooked at as a whole, the childdeprivation table may therefore seemto present little more than a blurredreflection of each country’s level of percapita income. But a closer look revealsthat some countries are in factachieving much more – and somemuch less – than their income levelswould predict. Estonia, Hungary andPoland, for example, have roughlyequivalent per capita incomes butwidely varying rates of childdeprivation (see Figure 2a). Portugaland the Czech Republic both have percapita incomes of about PPP $25,000,but Portugal’s child deprivation level isthree times higher (see Figure 2b).Belgium and Germany have similarper capita incomes to Denmark andSweden – but child deprivation ratesthat are about three and seven timeshigher (see Figure 2c).
behind). All of these countries haverelative child poverty rates below 7%.Another eight countries including twoof the largest – Germany and France –have rates between 7% and 10%. A thirdgroup, including Australia, Canada,New Zealand and the United Kingdom,post rates of between 10% and 15%.A further six, including populous Italyand Spain, show rates of between 15%and 20%. In only two countries aremore than 20% of children living inrelative poverty – Romania and theUnited States.Overall, the divide between thewealthy and not-so-wealthy nations ismuch less clear-cut. Hungary, Slovakiaand Estonia, for example, are seen tohave a smaller proportion of childrenliving in relative poverty than theUnited Kingdom, Italy, Spain, or theUnited States. Clearly, this is notbecause a smaller proportion of theirchildren are poor in an absolute sense;it is because the incomes of most poorhouseholds in these former centrally-planned economies do not fall as farbehind the median level of income forthe nation as a whole.Finally, it is worth noting that – despitethe very different measures of child povertyemployed in these two league tables – sevencountries are ranked in the top 10 in both– Cyprus, Denmark, Finland, Iceland,the Netherlands, Norway and Sweden.
Fig. 2cPercentage of children deprived in countries withGDP per capita between $36,000 – $85,000 (PPP)10987% Children deprived
9.1
8.8
8.7
ControversyWhat are we to make of these twovery different pictures of child povertyin the world’s richest nations?First, it is important to resist thetemptation to see the two differentviews presented in Figures 1a and 1bas contradictory or mutually exclusive.Both are valid. Both can inform policy.And both make it clear that somecountries are doing a much better jobthan others at protecting their childrenfrom poverty.Note:Data refer tochildren aged 1 to 16.Sources:Calculationsbased on EU-SILC 2009for child deprivation andon World DevelopmentIndicators (2011) for GDPper capita, PPP (currentinternational $).
6543210($36,279)
4.94.4
2.61.30.9
2.71.9
Belgium
Germany
($36,320)
($36,733)
Iceland
Sweden
Denmark
($39,643)
Austria
Ireland
Netherlands
($37,157)
($37,672)
($38,804)
($55,717)
($40,796)
Luxembourg
($84,766)
Norway
*Most European Union countries draw the relative
(per capita GDP in parentheses)
poverty line at 60% of national median income. Forpurposes of international comparison, the OECD (andthisReport Cardseries) uses a relative poverty linedrawn at 50% of median income.
8
I n n o c e n t I
R e p o R t
c a R d
1 0
The two measures are, however,profoundly different in concept.The most important difference betweenthem is that the child deprivation tableuses a fixed measure for all 29 countriessurveyed; the criterion applied (lackingtwo or more from the same list of 14items) is exactly the same for Swedenor the United States as it is for Bulgariaor Romania. Inevitably, therefore, itputs the emphasis on the differencesbetween richer and poorer countries.The criterion used to measure relativechild poverty, by contrast, changes withthe median income of each country; ittherefore transfers the emphasis to thegap between the bottom and themiddle in the living standards ofchildren within each country.It is because of this difference that thepoorer countries in Figure 1a tend tohave significantly higher rates of childdeprivation but may or may not havehigher rates of relative income poverty.For the same reason, the two differentmeasures tend to respond to economicand policy changes in very differentways.ivIn periods of sustainedeconomic growth, for example, theproportion of a nation’s childrendefined as ‘deprived’ will almostcertainly fall as overall incomes rise.The proportion living inrelativeincomepoverty, on the other hand, may eitherrise or fall depending upon whethertheir household incomes grow by moreor less than the median income for thenation concerned. To take a famousexample, a decade of sustainedeconomic growth in the Ireland of the1990s more than doubled the nation’smedian income, but the proportion ofchildren living in relative poverty alsorose because the incomes of householdsbelow the poverty line rose moreslowly than the median income for thecountry as a whole.Such examples bring us to the heartof one of the principal controversiessurrounding the measurement ofchild poverty.
‘Real’ povertyIt is often argued that relative povertyisn’t ‘real poverty’. Real poverty, it issaid, means lacking basics - enoughfood to eat, adequate clothing, a dryhome, an indoor toilet, hot water, anda bed to sleep in. Once you leave suchbasics behind and start drawingpoverty lines based on statisticalnotions like median income, it isargued, you end up with results thatfail to make intuitive sense and sofail to convince either politicians orpublic. Can the child poverty ratereally be said to be rising, for example,at a time when the incomes of thepoor are also rising? And can therereally be more children in povertyin the United Kingdom or theUnited States than in Hungary orLithuania (as shown in Figure 1b)?Or are these findings just statisticalartefacts produced by a definition ofchild poverty that is in effect basedon a concern not with poverty butwith inequality?Such are the arguments that pushmany to reject the relative incomemeasure and to embrace instead thedirect measurement of deprivation.Does the child have three meals a day?A few books in the home? And a roofthat doesn’t leak? Isn’t this a muchmore intuitive measure, and one thatis more capable of winning publicunderstanding and support?Direct measures of outcomes likedeprivation do have advantages overindirect or ‘input’ measures such ashousehold income (see Box 2: Theproblem with incomes). But the troublewith the argument that deprivationmeasures ‘real poverty’, whereas relativeincome does not, is that the intuitivelyappealing idea on which it rests is thatpoverty should be measured in anabsolute rather than a relative sense.And from here it is but a short step tothe belief that the deprivation indexpresented in Figure 1a is an absolutemeasure whereas the median incomemethod used for Figure 1b is ‘only’ arelative measure.
This is a mistake. Both are relativemeasures.The deprivation index is based on thekind of possessions, services andopportunities that most people wouldconsider normal for a child growingup in a wealthy country today. Inother words, it is relative to both timeand place. Twenty years ago, forexample, such a list would not haveincluded an Internet connection. Goback a little further in time and‘having at least one meal a day withmeat, chicken or fish’ would not havebeen regarded as normal. In fact thelonger the historical view the moreobvious it becomes that poverty is anessentially relative concept. Anypoverty line intended to represent aminimum acceptable standard of livingin the industrialized world todayimplies higher standards of food,clothing, housing, water supply,sanitation, health care, education,transport and entertainment than wereavailable to even the wealthiesthouseholds of previous eras.The whole idea of defining childpoverty in an absolute sense thereforerests on shaky ground. Unless we wishto argue that the threshold should beset at the minimum income necessaryfor sheer physical survival then therecan in fact be no such thing as anabsolute poverty line.The real debate, therefore, is notwhether poverty lines should beabsolute or relative, but how and howoften they should be updated to reflectchanges in the living standards ofsociety as a whole. If the decision istaken, for example, to draw an‘absolute’ poverty line at some fixedpoint and to update it only forinflation, then this means that a relativepoverty line is being anchored to anarbitrary point in time. As the yearspass and incomes rise, such a povertyline is likely to fall further and furtherbehind the norm for the society andto become less and less useful. This isessentially what has happened over the
I n n o c e n t I
R e p o R t
c a R d
1 0
9
Box 2The problem with incomes
Relative child poverty rates are usually estimated byassuming that household income is a reasonable guideto the material resources available to the child. But thisassumption is beset by problems.1Among the concerns:σσ
σσ
Income measures cannot reflect the fluctuations inincome experienced by many households (for exampleas a result of overtime, bonuses, working shorterhours, becoming unemployed, or taking retirement).Calculating a poverty rate from household incomedata requires that some method be used to converthousehold income into equivalent individual incomes(see Box 3: Do children have incomes?). To achievethis, an ‘equivalence scale’ must be used. But suchscales are not based on any scientific understandingof the different patterns of need in households ofdifferent size.Household income measures cannot reflect the factthat some families may be much more competentthan others in managing income or in prioritizingspending (for example by putting children’s needsfirst). The child of a high-income household, forexample, will not be counted as poor even if most ofthe income is spent on drugs, gambling or alcohol;conversely a child in a low-income household will becounted as poor even if the parents make enormoussacrifices to ensure that the child has the sameadvantages and opportunities as his or her peers.
σσ
Data on incomes may not be reliable, especially ifderived from surveys, or if a significant proportion ofthe working population is self-employed or employedin informal work. Under-reporting of earnings variesfrom country to country, and tends to be greatertowards the bottom end of the income scale.Most countries measure household incomesbeforehousing costs. In practice, a family’s capacity tomeet children’s needs is more likely to be dependenton incomeafterhousing costs (which can varysignificantly within as well as between countries).Income does not always reflect the real level ofresources available. A family’s economic capacity, itssecurity and spending power, are based not only onhousehold income at a single point in time but alsoon savings and debts, on home ownership and housevalues, on previous earnings and future expectations,on the help that may be available from other familymembers, and perhaps on the value of home-produced goods such as food and clothes.When used to compare child poverty in differentcountries, income measures cannot take into accountthe fact that services such as health care and childcare may be subsidised or free in some countries butnot in others. This may make a substantial differenceto real ‘disposable household income’.Similarly, whether or not education, and particularlypre-school education, is free or subsidised may makea substantial difference to disposable incomes. Inmost advanced economies, primary and secondaryeducation is usually available free of charge. But earlychildhood education is subsidised to differentdegrees in different countries. The same is true oftertiary or college education, which may mean thatparents in some countries must try to put asidesignificant sums even when their children are stillyoung. Both of these factors affect real disposableincomes to different degrees in different countries.σσ
σσ
σσ
σσ
σσ
Some or all of these problems combine to introducedoubts about household incomes as a measure of thereal resources available to the child. And they help toexplain why surveys have sometimes found thatmeasures of household spending do not correspond tomeasures of household incomes. At any given level ofhousehold income, for example, material livingstandards tend to vary substantially according towhether they are assessed by incomes or byexpenditures.2In most advanced economies, householdincomes are easier to monitor than expenditures. Butexpenditure measures would in most cases provide amore reliable guide to the real level of resourcesavailable to the household.
1See for example, Fusco, A., A-C. Guio and E. Marlier (2010).
’Income Poverty and Deprivation in European Countries’,EurostatMethodologies and Working Papers,European Commission, Luxembourg.2Bradshaw, J. and N. Finch (2003). ‘Overlaps in Dimensions of Poverty’.
Journal of Social Policy,32 (4): 513-525.
1 0
I n n o c e n t I
R e p o R t
c a R d
1 0
last half century in the United States(see Box 10: The United States:redrawing the line).The obvious alternative is to updatenational poverty lines in such a way asto track the norms and living standardsof the society. But how often, and bywhat method? Should the line beupdated irregularly in an ad hoc way,subject to political pressures and thecompeting influences of differentinterest groups? Or should it beupdated in a regular and systematic wayin order to preserve its relationship withcontemporary living standards? Inwhich case, setting the poverty line at apercentage of each nation’s medianincome and updating it every yearmight, after all, be a strong contender.This is why theInnocenti Report Cardseries, in common with both theEuropean Union and the OECD,continues to use a child poverty linebased on a percentage of medianhousehold income.
Why, then, is it necessary tocomplicate the picture by adding asecond measure? Why introduce theChild Deprivation Index?
Relative weaknessThe answer is that, for all its strengths,the relative income measure has twoprincipal weaknesses.First, even those who support theprinciple of measuring child povertyin a relative way would concede thathousehold income may not always bea reliable proxy for the real resourcesavailable to the child (see Box 2: Theproblem with incomes). It is, at best,an indirect measure, leaving open thepossibility that children may bedeprived in households that are notincome-poor and not deprived inhouseholds that are income-poor.Second, when comparing relativechild poverty rates in differentcountries, a poverty line drawn at a
percentage of median income onlyworks well if the countries beingcompared have broadly similar levelsof income and living costs. Otherwise‘relative poverty’ comes to mean verydifferent living standards in differentcountries: a household with 50% ofmedian income in Bulgaria has anactual income of11,400a year; ahousehold with 50% of medianincome in Norway has an incomeof117,000a year.One may argue that this doesn’t reallymake any difference – that relativepoverty means ‘relative to one’s ownparticular society’ and not to thenorms of some other country. But thisargument is only fully convincing forthe wealthier countries of the OECDwhere living on an income below50% of the median is a plausiblemeasure of what it is intended tomeasure – the sense of falling so farbehind the norms of one’s society asto be at risk of social exclusion
Fig. 3Poverty lines and median incomes, European countries140,000
135,000
130,000
125,000
120,000
115,000
110,000
15,000
Czech Republic
Slovakia
Estonia
Malta
Greece
Slovenia
Spain
Italy
Cyprus
Germany
Belgium
France
Austria
Netherlands
Finland
Sweden
Iceland
Ireland
Denmark
United Kingdom
Luxembourg
Portugal
Lithuania
Romania
Bulgaria
Hungary
Note:Income figures for non Euro-zone countries are converted using purchasing power parity (PPP) exchange rates.Sources:Elaboration of 2009European Union Statistics on Income and Living Conditionsdata and Eurostat.
Norway
Poland
Latvia
0
I n n o c e n t I
R e p o R t
c a R d
1 0
1 1
(see Box 8: The public view). Life at50% of median income in poorercountries like Bulgaria and Romaniamay not signify the same level ofdifference, or imply the same degreeof social exclusion, as it does inDenmark or Norway. That said, itshould also be noted that at very lowlevels of income even small differencescan make a significant difference toopportunities and living standards.Since the enlargement of theEuropean Union to 25 countries in2004 and then to 27 countries in2007, this problem of ‘the meaning ofthe median’ has become more pressing.Cross-national comparisons in theEuropean Union must now span agroup of countries whose annual percapita incomes range from less than
$14,000 to around $85,000. A relativeincome poverty line based on 50% ofmedian incomes will inevitablystruggle to reflect this new diversity.Figure 3 illustrates the problem. Thisshows, for example, that the 10 richestcountries havepoverty linesthat arehigher than themedian incomesof the10 poorest countries. This means thatchildren who are below the relativepoverty line in France or Germanymay be significantly better off in actualliving standards than children who areliving at the median income level inPoland or Portugal.vOr to takeanother example, a child living at therelative poverty line in the Netherlandshas double the income of a childliving at the median income level in acountry like Hungary (Figure 3).
Finally there is the worry thatcomparing relative child poverty rateson the basis of household incomescannot take into account significantdifferences between countries in thecost of living and especially in thecosts of essential goods and servicessuch as health and child care. Anincome of $30,000 in country A,where such services are free or heavilysubsidized, may imply a very differentstandard of living from the sameincome in country B where suchitems must be paid for at market rates.In sum, a relative poverty line drawn at50% of median income is an attempt todefine a concept of poverty on whichthere is widespread agreement inprinciple – a concept which says thatthe poor are those who do not haveaccess to the possessions, amenities,activities and opportunities that areconsidered normal by most people inthe society in which they live (seeBoxes 6, 8 and 9). But when using thisyardstick to make comparisons betweencountries, it is probably better to restrictthe comparison to those generallywealthier countries where living onincomes below 50% of median impliesa similar level of risk of social exclusion.Figure 4, for example, restricts thecomparison of relative child povertyrates to the 20 OECD countries withannual per capita incomes of morethan $31,000.
Fig. 4A league table of relative child poverty, selected OECD countries4.75.36.16.16.57.37.38.18.48.58.810.210.912.112.313.314.915.917.123.105101520Child poverty rate (% of children living in households with equivalent incomelower than 50% of the national median)IcelandFinlandNetherlandsNorwayDenmarkSwedenAustriaSwitzerlandIrelandGermanyFranceBelgiumAustraliaUnited KingdomLuxembourgCanadaJapanItalySpainUSA25
Deprivation doubtsThese concerns and problems have ledto increasing pressure for the relativeincome measure to be supplemented bya more direct measure of child poverty.Within individual economicallyadvanced countries, direct measures ofchild deprivation are sometimesavailable. They have been deployed, forexample, in Finland, Germany, Greece,Ireland, the Netherlands, Sweden, andthe United Kingdom.viInternationally,theChild Deprivation Indexpresented inFigure 1a is the first attempt to meetthis need. As already noted, it is made
Note:Data refer to children aged 0 to 17.Sources:Calculations based on EU-SILC 2009, HILDA 2009, SLID 2009, SHP 2009, PSID 2007. Results for Japanare from Cabinet Office, Gender Equality Bureau (2011).
1 2
I n n o c e n t I
R e p o R t
c a R d
1 0
possible by the decision of theEuropean Union to include a specialsection about children’s lives in theEU-SILC survey (see Box 7: TheEuropean Union: 2020 vision).At first glance, this alternative soundsquite straightforward: draw up a list ofitems that most people think of asnecessary for a child and conduct asurvey to find out what proportion ofthe child population of each countrylacks each of the items.In practice, this too has its problems.First, deprivation statistics gleanedfrom surveys may also be unreliable.What people consider to be necessaryfor their children, for example, mayvary with income and aspiration.Presented with a list of items whichcorresponds to one’s own familypossessions, it is likely that most itemswill be judged as ‘necessary’. A list thatincludes items that are not affordable,on the other hand, may attract fewerticks in the ‘necessary’ box. Thetendency for what is considerednormal to increase with incomes, andto decrease with persistent poverty, hasoften been observed. And it is notdifficult to see how this might affectthe results of surveys about childdeprivation. Parents in poorhouseholds may decide that certainitems are unnecessary because they areembarrassed or ashamed to admit thatthey are unable to provide them.viiThe published survey results may havethe appearance of objective data, butbehind every statistic of childdeprivation is an individual parentanswering a survey question aboutwhether or not they can afford toallow their child ‘to participate inschool trips and events’, or ‘to invitefriends home to play and eat’, or ‘tohave a quiet place with enough roomand light to do homework’.Then there is the problem of whatitems should be included in adeprivation index and whatimportance should be attached to each.How do we know that the list reflectsa minimum acceptable standard of
living for a given group of countries ata given time? And who should decide?Should the items be chosen byexperts? Or by opinion polls to findout which items are regarded asnecessary by the population at large?Or should they be selected (andweighted) by investigating whatpercentage of the population alreadypossesses the items? Giving no‘weighting’ to the individual items isnot a neutral approach – it is ajudgement that all the items on thelist are of equal importance and thatthis is true for all of the countriesbeing compared.
Further, there is the problem of thedifferent needs of different agegroups. A personal computer, forexample, was originally included in alist of necessities proposed by theEuropean Union but subsequentlydropped when it was shown that only30% of the population considered acomputer to be ‘absolutely necessary’or ‘necessary’.viiiIf the poll had beenconducted among young people, asopposed to the population as a whole,it is reasonable to suppose that amuch higher proportion would havecategorized a computer as a necessity.
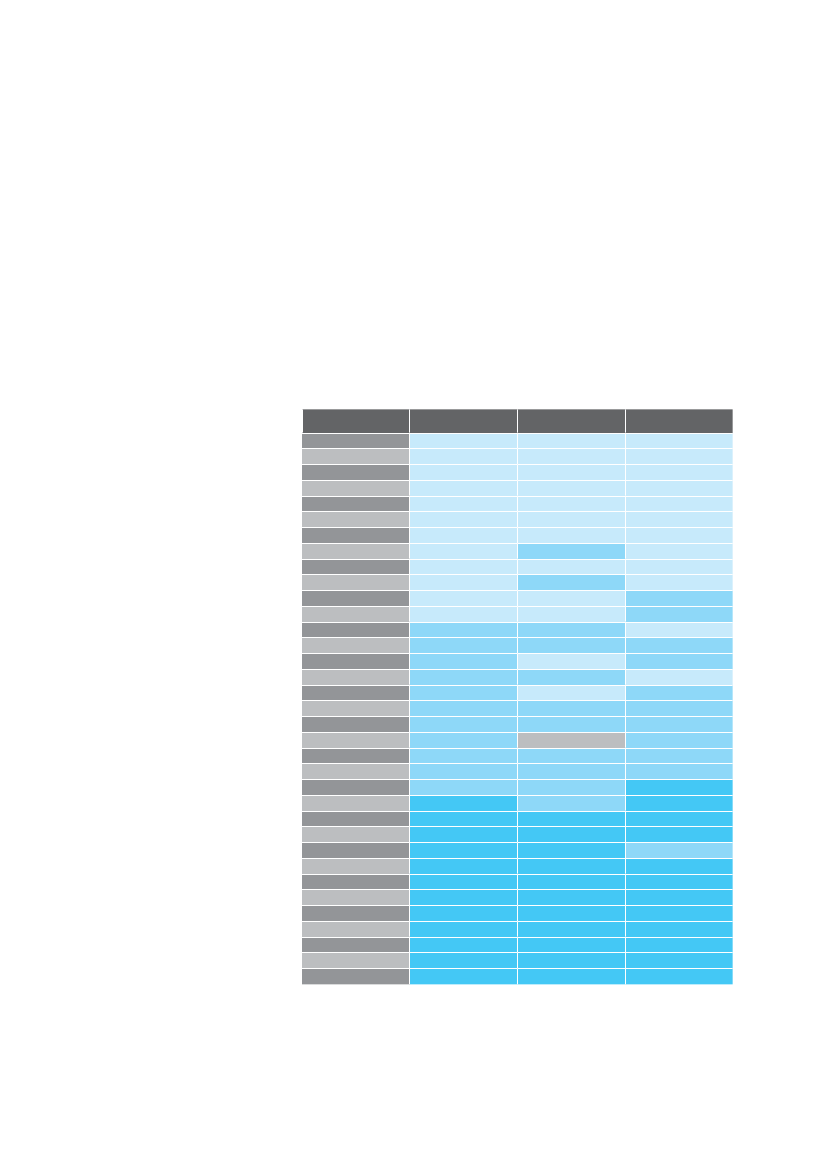
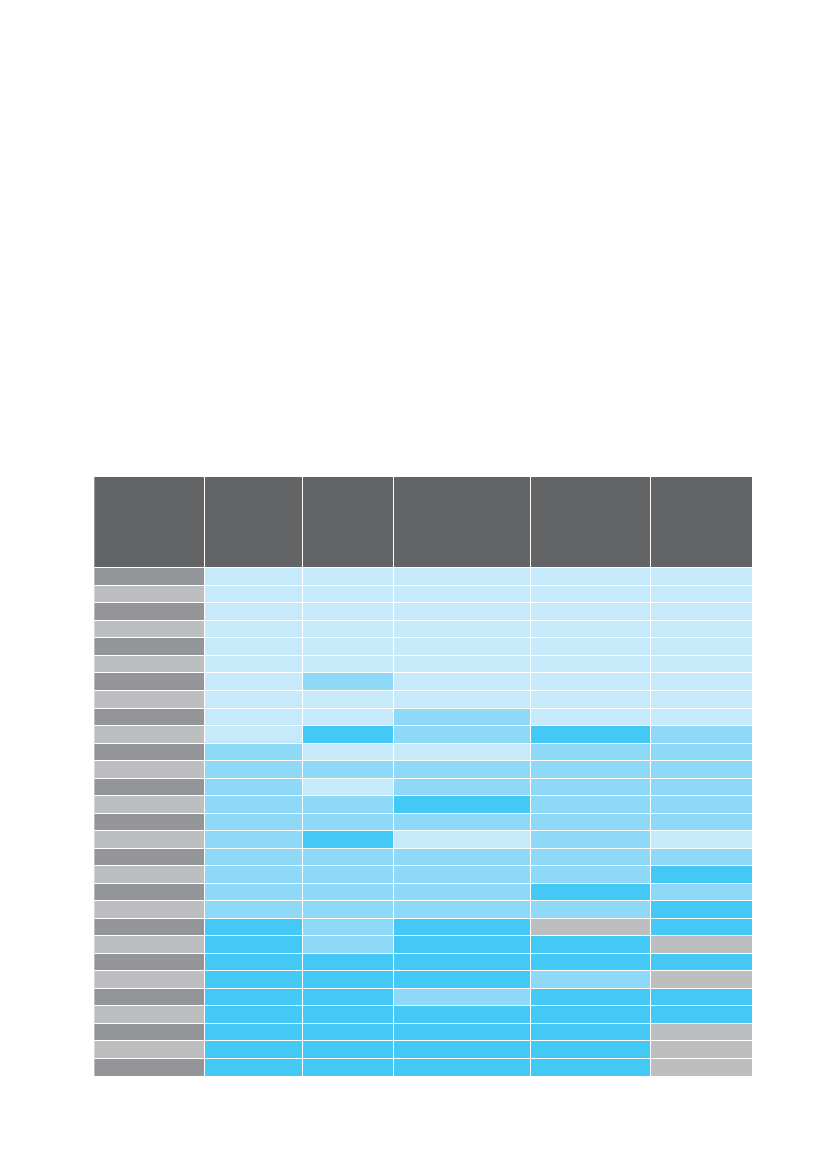
Fig. 5Child poverty rates by different relative poverty linesCountryIcelandFinlandCyprusNetherlandsNorwaySloveniaDenmarkSwedenAustriaCzech RepublicSwitzerlandIrelandGermanyFranceMaltaBelgiumHungaryAustraliaSlovakiaNew ZealandEstoniaUnited KingdomLuxembourgCanadaPolandPortugalJapanLithuaniaItalyGreeceSpainBulgariaLatviaUSARomaniapoverty line at 50%4.75.36.16.16.16.36.57.37.37.48.18.48.58.88.910.210.310.911.211.711.912.112.313.314.514.714.915.415.916.017.117.818.823.125.56.15.64.27.37.59.69.68.89.78.111.512.212.816.617.8poverty line at 40%1.91.51.82.93.12.93.63.73.23.83.23.54.63.72.94.13.04.36.6poverty line at 60%10.111.912.115.411.311.111.412.713.613.017.918.914.916.820.316.620.617.617.019.420.620.822.421.922.922.720.524.324.223.523.624.425.031.132.3
Note:The shading in the last three columns indicates whether a country ranks in the top third (light blue), middle third(mid-blue), or bottom third (dark blue) of the relevant league table.Sources:Calculations based on EU-SILC 2009, HILDA 2009, SLID 2009, SHP 2009, PSID 2007. Results for New Zealandare from Perry (2011) and refer to 2010. Results for Japan are from Cabinet Office, Gender Equality Bureau (2011).
I n n o c e n t I
R e p o R t
c a R d
1 0
1 3
Choosing a thresholdFinally, in this summary of the strengthsand weaknesses of the differentmeasures used in the two league tablesof child poverty, it should be noted thatthere are problems common to both.First, both the child deprivationmeasure and the relative incomemeasure must confront the questionof where and how the thresholdshould be drawn.In the case of relative income poverty,for example, should the line be drawnat 60% of median household income
(as in the European Union) or at 50%(as used by the OECD for purposes ofinternational comparison)? By way ofreassurance, Figure 5 shows that thereis little change to the relative childpoverty rankings when the line isdrawn at different percentages ofmedian income. (It should also beborne in mind that in practice theremay be little difference between lifejust below and just above whicheverpoverty threshold is chosen.)In the case of the deprivationmeasure, should the threshold beset at ‘lacking two or more’ of the
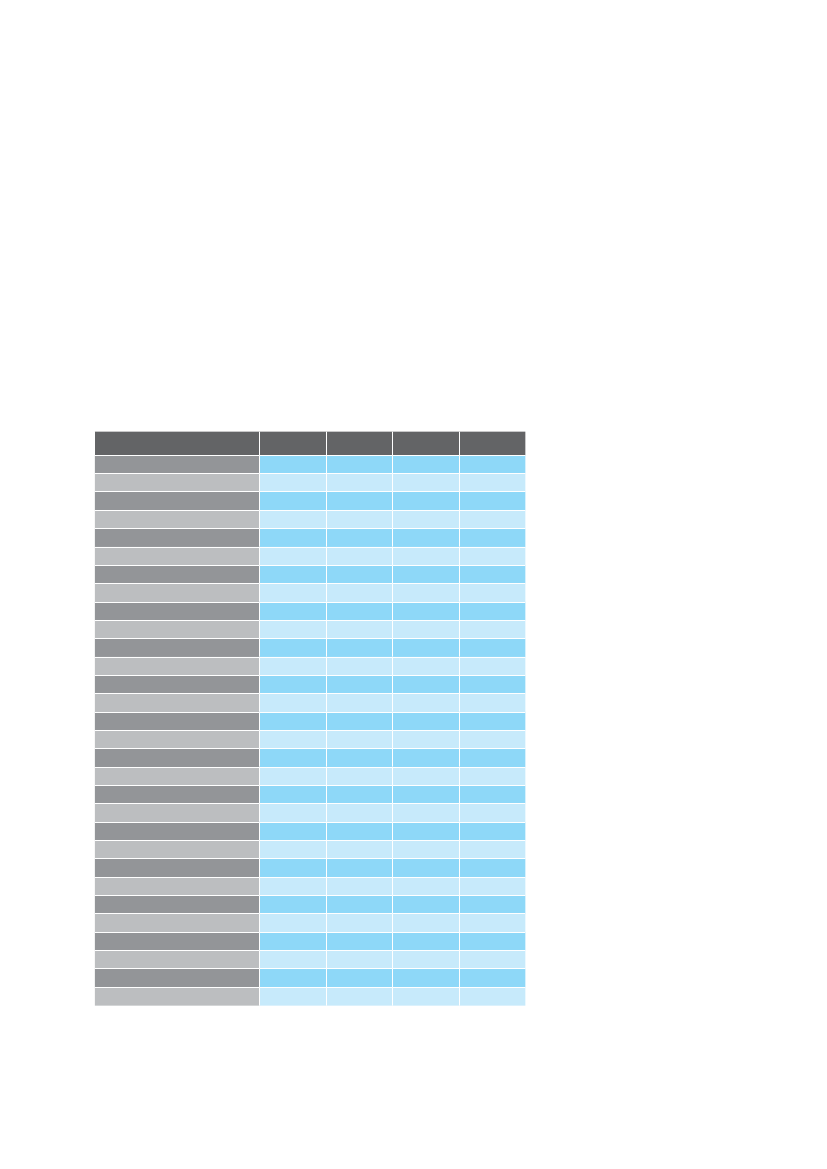
14 items in the deprivation index?Or at ‘three or more’ or ‘four ormore’? For the league table of childdeprivation in this report (Figure 1a),the line is drawn at ‘lacking two ormore’. But this decision is essentiallyopportunistic: drawing the line at‘lacking one or more’ would havegiven arbitrary emphasis to just oneitem on the list. It would also haveproduced extremely high childdeprivation rates for the poorest EUcountries. Setting the line at ‘lackingthree or more’, on the other hand,would have produced extremelylow deprivation rates for thewealthier countries.Secondly, both the deprivationmeasure and the relative incomeleague table tell us what proportion ofeach nation’s children fall below theselected thresholds, but they tell usnothing abouthow far below.In the case of the deprivation measure,the question of ‘how far below’ can inpart be answered by setting a lowerthreshold for the Child DeprivationIndex. Figure 6, for example, showsthe proportion of children in eachcountry who lack 2, 3, 4 and 5 ormore of the 14 items.In the case of the relative child povertymeasure, the question ‘howfararethose below the poverty line allowedto fall?’ finds an approximate answer inFigure 7 which compares 35 countriesby the depth of their poverty gaps –the difference between the medianincome of households below thepoverty line and the poverty line itself.The findings of this table will beconsidered under the headingAssessinggovernment performance(p.19).
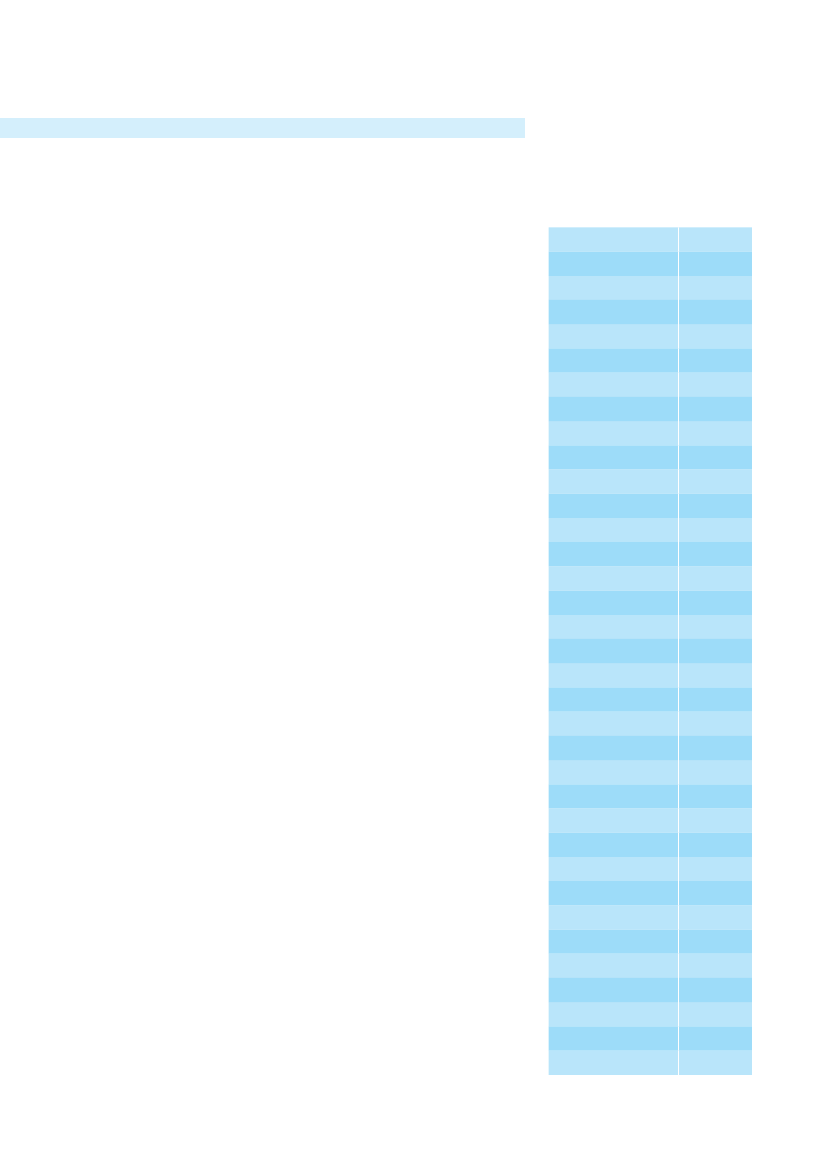
Fig. 6Proportion of children in each country lacking 2, 3, 4 and 5 items or moreon the deprivation indexCountry29 European countriesAustriaBelgiumBulgariaCyprusCzech RepublicDenmarkEstoniaFinlandFranceGermanyGreeceHungaryIcelandIrelandItalyLatviaLithuaniaLuxembourgMaltaNetherlandsNorwayPolandPortugalRomaniaSlovakiaSloveniaSpainSwedenUnited KingdomNote:Data refer to children aged 1 to 16.Source:Calculations based on EU-SILC 2009.
2+13.38.79.156.67.08.82.612.42.510.18.817.231.90.94.913.331.819.84.48.92.71.920.927.472.619.28.38.11.35.5
3+9.85.36.649.25.06.11.57.70.66.56.211.725.10.32.510.325.213.83.15.41.20.715.323.062.015.24.45.30.72.8
4+7.43.74.741.13.84.71.24.50.23.93.98.420.60.01.48.320.711.61.73.50.60.310.817.853.812.12.63.20.41.7
5+5.82.43.136.32.13.10.73.30.02.62.86.116.70.00.66.215.910.41.32.50.40.18.513.846.810.31.52.10.01.3
OverlapsGiven the strengths and weaknesses ofthese two very different ways ofmeasuring and comparing childpoverty, there is an obvioustemptation to combine them in someway in order to construct a singleoverarching measure which wouldhave the strengths of both and the
1 4
I n n o c e n t I
R e p o R t
c a R d
1 0
weaknesses of neither. It has beensuggested, for example, that a singlemeasure of child poverty might beconstructed by counting as poor onlythose children who are poor underboth definitions – i.e. those who lacktwo or more of the items on thedeprivation index and who live inhouseholds where incomes are lessthan 50% of the national median. Butthis would be to ignore theunderlying incompatibility – the factthat the deprivation measure is basedon a definition which does not varyacross countries, whereas the relativeincome poverty measure is based on adefinition which changes from nationto nation. To make the two measuresconceptually compatible, it would benecessary to adjust the deprivationindex so that both the list of items itcontains and the threshold chosenwould reflect a standard of living thatis considered normal or necessaryineach individual country.This could bedone, either by surveys to establishwhat proportion of the populationconsiders which items to be‘necessary’ (consensus weighting) orby weighting each item according towhat proportion of households ineach country already own or haveaccess to each item (prevalenceweighting). But this procedure wouldraise more problems than it solveswhile at the same time jettisoning thesimplicity and the intuitive appeal ofthe deprivation index.When used for internationalcomparison the two measures aretherefore separate in concept andshould remain so in practice. Both thechild deprivation rate and the relativechild poverty rate are useful topolicymakers, to social scientists, to themedia, and to advocates for child well-being. Combining them into acommon measure would be likecombining oil and water, in that thewhole would be less useful than thesum of the parts.Withinindividual countries, on theother hand, it may be useful tocombine the two measures by
focusing on the overlap between them– asking what percentage of a nation’schildren are both deprivedandlivingin relative income poverty. Thisapproach, currently used for examplein Austria, Ireland and the UnitedKingdom, helps to ease some of theworries surrounding the measurementof poverty by means of householdincomes. As Professors Brian Nolanand Christopher Whelan, contributorsto the development of Ireland’s officialpoverty measure, have written:
“Given two relevant pieces of informationabout the household–income anddeprivation–each with limitations fromboth conceptual and measurementperspectives, incorporating both into themeasurement process is one way to seek toimprove reliability in identifying the poor.”ixIn practice, household income remainsa principal determinant of whether ornot the needs of children areadequately met. But it is not the onlydeterminant. Public spending can also
Fig. 7The poverty gap10.911.812.812.913.614.615.016.016.116.216.317.617.817.918.418.820.320.620.620.721.021.121.422.323.527.129.829.931.131.332.032.833.134.737.505101520253035
FinlandHungaryIcelandIrelandAustraliaLuxembourgFranceNew ZealandAustriaSwitzerlandMaltaSloveniaBelgiumCyprusNetherlandsUnited KingdomEstoniaCzech RepublicPolandGreeceNorwaySwedenCanadaGermanyLithuaniaSlovakiaItalyPortugalJapanLatviaBulgariaDenmarkSpainRomaniaUSA40
Child poverty gap(gap between the poverty line and the median income of those below the poverty line)Notes:The poverty gap is the distance between the poverty line and the median income of those below thepoverty line (expressed as a percentage of the poverty line). Calculations are based on a poverty line set at50% of the national median income. Countries are ranked by increasing levels of the child poverty gap.Sources:Calculations based on EU-SILC 2009, HILDA 2009, SLID 2009, SHP 2009, PSID 2007. Results forNew Zealand are from Perry (2011) and refer to 2010. Results for Japan are from Cabinet Office, GenderEquality Bureau (2011).
I n n o c e n t I
R e p o R t
c a R d
1 0
1 5
help parents to meet children’s needs.And for this reason it is not axiomaticthat falling household income mustalways mean rising levels of childdeprivation. The governments that aremost successful in protecting childrenfrom poverty are likely to be thosethat strive to reduce the number oflow-income householdsandhelp toprovide essential goods, services andopportunities for children growing upin such households. This strategymakes it possible to offer a significantdegree of protection to children evenin times of economic crisis. And it alsoillustrates the usefulness of deployingboth a relative income measure and adirect measurement of deprivation inthe struggle to monitor and mitigatethe impact of economic forces on thelives of children.
The argument that the use of thisrelative poverty measure may misleadthe public because it inevitably carrieswith it a suggestion of ‘absolutepoverty’ is a genuine concern. But thisis a problem not so much in theconcept as in its communication. Itcan and should be addressed bysticking strictly to the term ‘relativechild poverty’ when that is what ismeant. To say that ‘child poverty levels’are higher in the United States than inthe Czech Republic is to invite public
misunderstanding and rejection. To saythat ‘relative child poverty levels’ arehigher risks no such misunderstanding;there is nothing either misleading ormeaningless about the statement that agreater proportion of children areallowed to fall significantly below thenorms of their societies in the UnitedStates than in the Czech Republic.When presented for what it is – anapproximate measure not of absolutepoverty but of falling so far behind the
Box 3Do children have incomes?
How should it be done?How, then, is child poverty bestmeasured, monitored, and compared?In previousReport Cards,some basicprinciples for the cross-nationalmonitoring of child poverty have beenproposed. They are summarized andupdated here.1. Continue to monitor relativechild poverty based on nationalmedian incomesMost poverty lines are based on household incomes. But to calculatehow many individuals live below the poverty line, household incomesmust be converted to equivalent individual incomes (including‘incomes’ for children).This cannot be done by simply dividing household income by thenumber of people in the household. It may not be true that ‘two canlive as cheaply as one’, but the amount required to maintain a givenstandard of living does not rise in direct proportion to the number ofpeople in the home. The cost of heating, or a television or an Internetconnection, for example, does not double if there are four peoplerather than two. Many such economies of scale – including being ableto buy food or cleaning materials in bigger quantities – are available tolarger households.Unfortunately there is no scientific way of converting household incomeinto individual incomes. Rough and ready methods must therefore beused, of which the most common is the ‘modifiedOECD equivalencescale’by which the first adult in each household is counted as 1.0, thesecond adult as 0.5, and each child under the age of 14 as 0.3. The totalthen becomes the number of ‘equivalent individuals’ by which householdincome must be divided. For example, a household with an income of$46,000 for two adults, one 15-year-old, and one pre-school child wouldbe counted as having the equivalent of 2.3 individuals and their‘equivalized’ individual incomes would be $20,000. It is this figure that isused to establish the median income for the nation as a whole (the pointat which exactly half have more and half have less – see Box 4: Themedian is the message). The relative poverty line is then drawn at acertain percentage of that median. In the European Union, the line isdrawn at 60% ofequivalizedmedian income.The number of children estimated to be living in poverty is thencalculated as the number of individual children living in households inwhich the equivalized income is below this line.
Median income is“a strong indicator ofwhat is considered normal in contemporarysociety.”xIt should therefore continueto be used as a basis for identifyingthose at risk of social exclusion (seeBoxes 4 and 6).Most countries have data on incomes,and these data can be used both tocompare countries and to monitorchanges over time. Tracking theincomes of those at the bottom endof the distribution in relation to theincomes of those at the median showshow the benefits of economicprogress or the pain of economicrecession are being distributed. It isnot a measure of overall inequality inthe society; it is a measure of how thepoorest are faring in relation to thosein the middle.
1 6
I n n o c e n t I
R e p o R t
c a R d
1 0
normal standard of living in the societyas to be excluded from the advantagesand opportunities that the majoritytake for granted – the idea of relativechild povertydoesmake intuitive sense.2. Measure deprivation directly
to define and defend the simultaneoususe of the relative child poverty rate.xiThe special module on childdeprivation, included as a one-offexperiment in the latest round ofEU-SILC, should therefore bedeveloped into a regular andpermanent feature of future surveys.3. Measure depth and duration
advanced economies in the form ofa ‘poverty gap’ league table.Ideally, the monitoring of childpoverty would include its timing andduration as well as its breadth anddepth. The earlier the privation andthe longer its duration, the greater thepotential impact on the child. This istrue both because of the inherentvulnerability of the earliest years oflife and because the longer a familystays poor the harder it may becometo maintain essential expenditures(as savings and assets run down, forexample, or as borrowing and othersources of help reach their limits).In other words, child poverty should
Child poverty also needs to bemonitored by direct measurement ofdeprivation. The proportion of childrenwho lack an adequate diet, or a quietplace to do homework, or suitablebooks and an Internet connection, isthe kind of measure that allows actualliving standards to be compared acrossnations. It makes immediate sense to awide public and contributes towards amore rounded understanding of childpoverty. And in so doing, it also helps
As already noted, it is also importantto measurehow farbelow the povertyline the poor are being allowed to fall.For this purpose, the median incomeof those below the poverty line, as apercentage of the poverty line itself, isa useful measure. Figure 7 haspresented this calculation for 35
Box 4The median is the message
The words 'average' and 'median' can still causeconfusion in public discourse and even in policy-making.The difference between the two is illustrated in thediagram below.Imagine a street with a single row of houses numbered1 to 15. The household with the lowest income in thestreet lives at number 1, the second poorest householdlives at number 2, and so on up to the richest householdin number 15.The average household income is calculated bydividing the total income of the street by the totalnumber of households. In the example given here, thiscomes to $60,000.
The median household income is the income of thehousehold in the middle of the income scale – the pointat which half of the households have more and half haveless. In this example, the median income is $40,000 (theincome of house No. 8).As the example shows, there can be significantdifferences between the average and the median.The two also respond to change in different ways.Imagine, for example, that the two richest people in thestreet, living in houses Nos. 14 and 15, were to moveout and be replaced by Bill Gates and Warren Buffett. Inthis event, the average household income of the streetwould rise to several billion dollars. But the median
Total income of all houses$900,000Number of houses15
Average household income$60,000
No. 1$10,000
No. 2$12,000
No. 3$14,000
No. 4$16,000
No. 5$27,000
No. 6$30,000
No. 7No. 8$35,000$40,000
No. 9$50,000
No. 10$60,000
No. 11$70,000
No. 12$80,000
No. 13No. 14No. 15$100,000 $140,000 $216,000
7 houses with lower income
Median household income$40,000
7 houses with higher income
I n n o c e n t I
R e p o R t
c a R d
1 0
1 7
be monitored in three dimensions –asking not onlyhow manychildren fallbelow national poverty lines buthowfarand forhow long.4. Maintain a close monitoringsystem
development are happeningnow.All OECD countries have the capacityto track key economic indicators –growth, inflation, unemployment, tradebalances – on a quarterly basis. It istherefore unacceptable that basicinformation on what is happening tochildren’s lives should be so out ofdate. Key data on basic aspects of childpoverty and child well-being shouldbe made available not every four yearsbut every year.5. Set time-bound targets andbuild support
Most governments of economicallyadvanced countries are committed inprinciple to the monitoring of childpoverty and social exclusion. But itmust be said that collecting and makingavailable the necessary data every fewyears is not monitoring. It cannotadequately inform policy or alertgovernments, the media, the public, thechildren’s organizations, or the academiccommunity to the problems being facedby children whose years of growth and
Report Card 6(2005) recommendedthat all OECD countries should aimto reduce relative child poverty rates to
below 10%. Countries that had alreadyachieved this were challenged toemulate the Nordic countries byreducing the rate still further – to 5%or less. Since that time, relative childpoverty rates have risen in almostevery OECD country*(an increasethat does not as yet reflect the impactof the post-2008 economic downturn).As Figure 1b shows, only Iceland nowachieves a relative child poverty rate ofless than 5%, though Finland remainsclose at 5.3%. The latest nationallyavailable data suggest that Iceland, too,has allowed its relative child povertyrate to drift above the 5% mark.This upward trend in relative childpoverty rates over recent years is in
income would stay the same: the middle house in theincome distribution would still be No. 8, and its incomewould still be $40,000.For the same reason, it is quite possible to increase theincomes of all the houses with incomes above themedian (Nos. 9 to 15) without affecting the medianincome of the street as a whole.It is sometimes said that relative poverty, defined as thepercentage of households below a certain percentage ofmedian income, can never be abolished because thetarget is always moving. As incomes rise, the povertyline also rises, and so ‘the poor will always be with us’.But this is not the case. In the above example, thoseliving in houses 1, 2, 3 and 4 are below the poverty linebecause their household incomes are below 50% of themedian for the street as a whole. But if the incomes ofthose households were to rise to $20,000 then therewould be no houses with incomes below 50% ofmedian. Relative poverty would have been abolished.And the median itself would not have changed.
Illustrating the normalThis distinction between average and median cansometimes be critical. For example, the argument overwhether pay is generally higher in the public or privatesector may well depend on whether the average or themedian is used when making the comparison. If theaverage is chosen, then pay in the private sector maywell be higher – because the average can besubstantially increased by a small number of peoplewith very high earnings (the equivalent of Gates andBuffet moving into the street). If the median is selected,on the other hand, then pay in the public sector may behigher – because the median level of pay in the privatesector is not increased by the incomes of those at thevery top of the income distribution.Many economists now argue that it is the median,rather than average, that should be used to illustratewhat is normal in a given society. Nobel prize-winningeconomist Joseph Stiglitz, for example, points out thatin the United States, “median and average behavedifferently…real median household income has actuallydipped since 2000. But G.D.P per capita has gone up.”1.
1Quoted in ‘The Rise and Fall of the G.D.P by Jon Gertner, New York Times,.’
13 May 2010.
*The relative child poverty rates published inReport Card 6are not strictly comparable with the rates given inReport Card 10(See Figure 1b andBox 3: Do children have incomes?)
1 8
I n n o c e n t I
R e p o R t
c a R d
1 0
large part the result of global economictrends. But that does not mean that it isinevitable. It is within the power ofevery government in the OECD to setrealistic targets for reducing relativechild poverty and to put in place thepolicies and the monitoring systemsrequired to meet those targets.xiiFigure1b shows that a realistic target for thecountries with relative child povertyrates below 10% would be to renewthe struggle to reduce the rate to 5% orlower. Similarly, the 12 countries withrates between 10% and 15% should aimat lowering relative child poverty below10%. The 8 countries currently withrates of 15% to 25% have the capacityto bring the rate below the 15% levelas an essential first step.Announcing such targets is of course notenough. It is now more than 20 years,for example, since the Government ofCanada announced that it would“seek toeliminate child poverty by the year 2000.”Yet Canada’s child poverty rate is highertoday than when that target was firstannounced.xiiiIn part this is becausethe commitment was not backed by acompelling political and public consensusor by any firm agreement on howchild poverty should be defined andmonitored. Targets can only be afirst step.In the past, the European Commissionhas done much to help EU countriesto develop common indicators forthe measurement of child poverty andto develop plans for its reduction (seeBox 7: The European Union: 2020vision). But since the economic crisisbegan, child poverty appears to haveslipped down the Commission’s agenda.Children barely feature, for example, inthe Europe 2020 strategy. In particular,the Commission appears reluctant topublish cross-national data on fallinggovernment expenditures for childrenand families. Later this year (2012), theCommission is due to make proposalsto member states on child well-being.Those proposals should include targetsfor specific reductions in child povertyby the end of this decade.
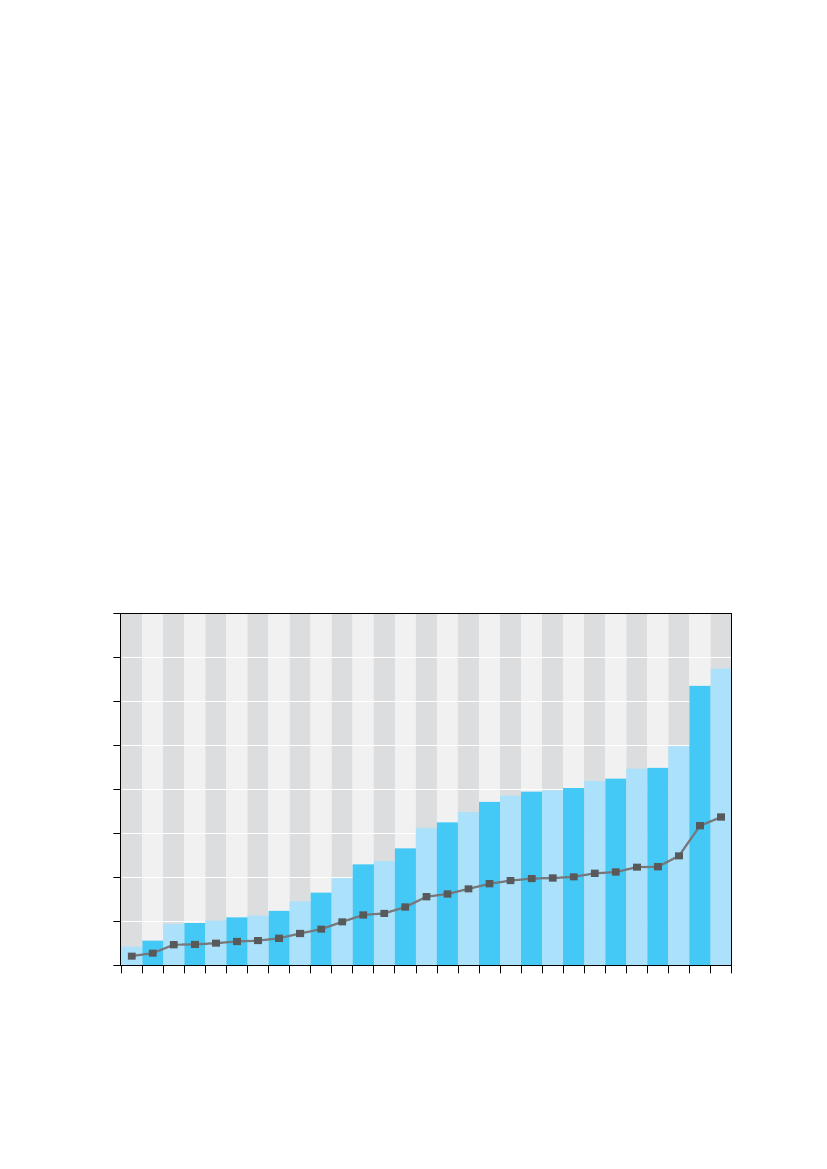
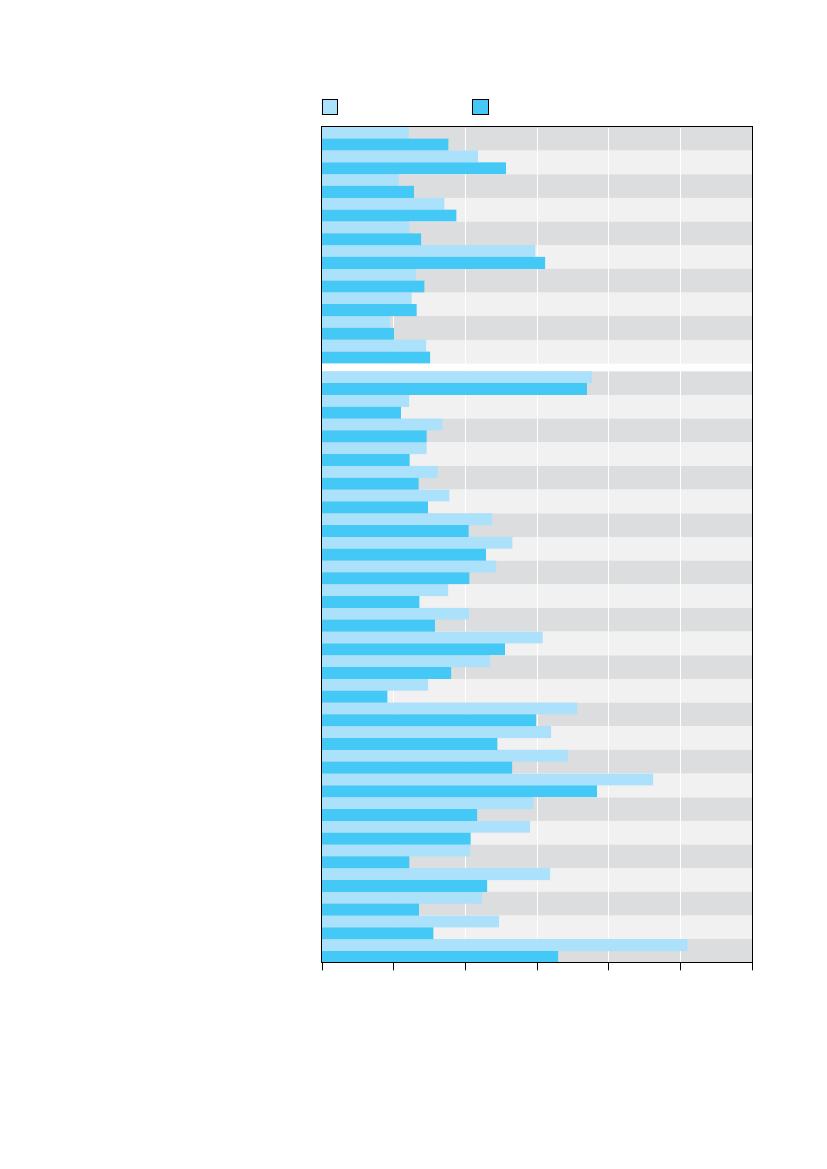
Fig. 8Relative child poverty rates before taxes and transfers (market income) and aftertaxes and transfers (disposable income)before taxes and transfersafter taxes and transfers
IrelandHungaryUnited KingdomFinlandAustraliaNew ZealandAustriaCzech RepublicNorwayFranceSloveniaGermanyLuxembourgIcelandMaltaCanadaSwedenBelgiumNetherlandsDenmarkCyprusSlovakiaLithuaniaEstoniaPortugalBulgariaPolandRomaniaLatviaSwitzerlandSpainUSAJapanItalyGreece01020304050
Child poverty rate(% of children living in households with income lower than 50% of the national median income)Notes:For each country and for both income definitions, poverty calculations are based on a poverty line set at 50% ofthe national median disposable income. Countries are ordered by decreasing percentage of poverty reduction achieved.‘Taxes and transfers’ takes into account all income taxes paid by households and all benefits that directly affect householdincomes (i.e. not including in-kind or near-cash benefits).Sources:Calculations based on EU-SILC 2009, HILDA 2009, SLID 2009, SHP 2009 and PSID 2007. Results for New Zealandare from Perry (2011) and refer to 2010. Results for Japan are from Cabinet Office, Gender Equality Bureau (2011).
I n n o c e n t I
R e p o R t
c a R d
1 0
1 9
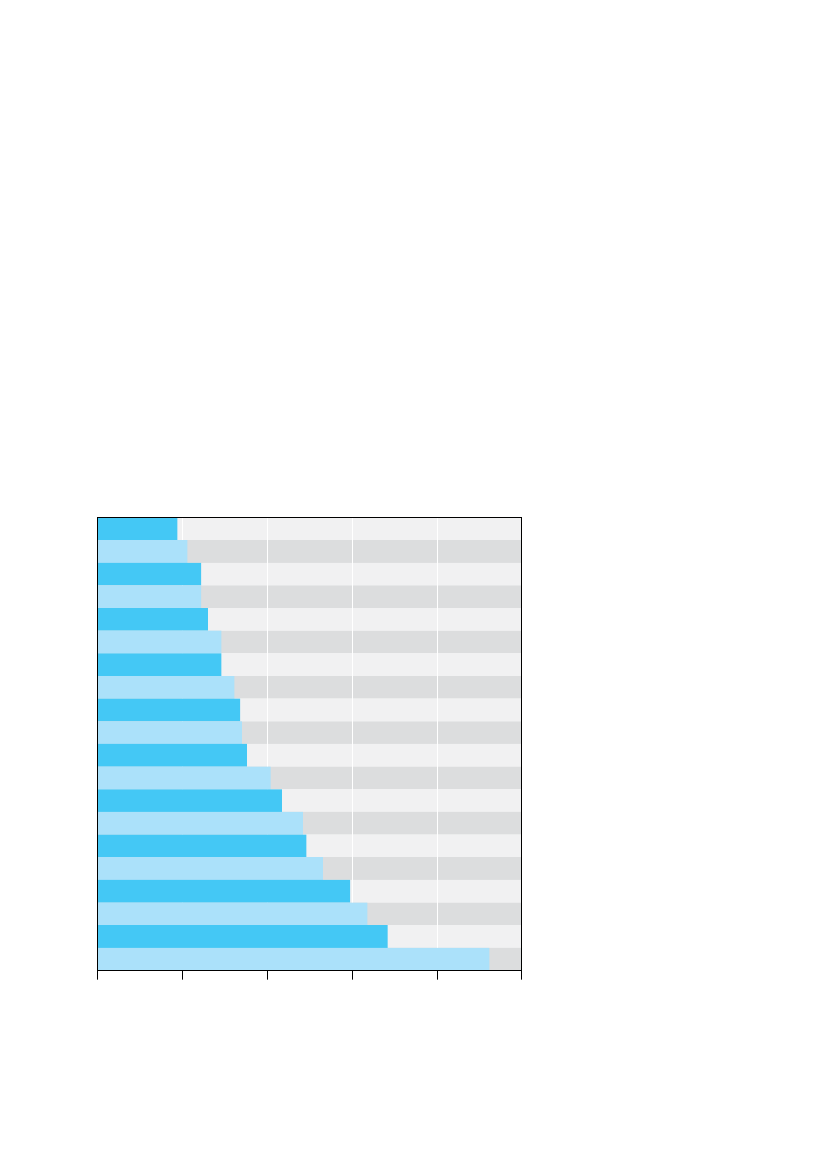
Fig. 8aChild poverty rates before taxes and transfers (market income) and after taxes and transfers, selected countriesbefore taxes and transfersafter taxes and transfers
25
3025.123.125.1
2017.515
20
19.4
2518.817.120
17.0
17.0
16.2 15.9
1515108.813.3
107.3
8.57.4
10
5
55
0FranceSpain
0USACanada
0AustriaGermanyCzechRepublicItaly
Sources:Calculations based on EU-SILC 2009, SLID 2009 and PSID 2007.
6. Avoid unnecessary complexity
The more complex the measure ofchild poverty, the less useful it is likelyto be.7. Measure well-being broadly
Child poverty is about more thanincome or the lack of items on a givenlist. Children can be poor in love andattention, in parental time and skills, inrelationships and community, in publicservices and environmental quality. It istherefore also necessary to continue todevelop ways of monitoring childwell-being in the round.It was for this reason thatReport Card 7(2007) developed an initial measure ofoverall child well-being for OECDcountries. Bringing together a total of40 indicators for which internationallycomparable data were available, thereport compared child well-being across21 OECD countries under theheadings of material well-being, healthand safety, education, peer and familyrelationships, risk behaviours, and youngpeople’s own subjective sense of well-being. This experiment will be refinedand repeated with new data in the nextissue in this series (ReportCard 11).8. Focus on disparity
There will always be children who fallbehind the average, whether in materialcircumstances or educationalachievement. The critical question is‘how far behind?’ Is there a pointbeyond which ‘falling behind’ is notunavoidable but unacceptable? This wasthe issue examined inReport Card 9(2010), which offered a practical guideby looking at the gaps – whether inmaterial well-being, or in health or ineducational achievement – between thechildren at the bottom and thechildren at the median point in eachcountry. If, for example, the gap ineducational achievement is significantlywider in country A than in country B,then this suggests that young people incountry A are falling further behindthan is necessary. Put positively, thevarying child disparity records ofcountries at similar levels of economicdevelopment offer a real-worldmeasure of the scope for improvement.
inevitable result of global economic pressuresor demographic transitions.”says JonathanBradshaw.“Governments can and do takesteps that are remarkably successful incounteracting child poverty.”xivIt would therefore also be useful tohave some measure ofhowsuccessful.The principal league tables of childpoverty with which this report beganprovide one overview of the record ofdifferent governments in helpingfamilies to protect children from thesharpest edges of poverty. But theavailable data also allow more specificcomparisons to be made.Figure 8 presents one such comparison.Drawing on data from 35 advancedeconomies, it shows what the relativechild poverty rate would be ifgovernments did not intervene withtaxes and transfers (light blue bar). Itthen compares this with the actualrelative child poverty rate after all taxesare deducted and benefits paid (bluebar). The difference may be seen as onemeasure of the efforts and effectivenessof different governments in reducingrelative child poverty.Such a presentation is of course biasedin favour of those countries with highinitial rates of relative child poverty(the higher the starting level, thegreater the scope for reduction).Nonetheless, it furnishes some striking
Assessing governmentperformanceThe extent and depth of childdeprivation and relative child povertyin different countries is the result of acomplex interaction between culturaland historical factors, demographictrends, labour market conditions, andglobal economic forces. Butgovernment policies and expendituresare also critical.“Child poverty is not an
In addition to monitoring averagelevels of child well-being, it is alsoimportant to focus specifically on thechildren left behind.
2 0
I n n o c e n t I
R e p o R t
c a R d
1 0
Box 5Invisible childrenBoth measures of child poverty used in this report arebased on household surveys or household income data.But some of the children and young people most at riskof poverty do not live in households; they live ininstitutions, in children's homes, in temporaryaccommodations, in hostels or hospitals, in prisons, inhouses for refugees or asylum seekers, in mobilehomes, or on the streets. It is also possible that some ofthe most at-risk children may be not represented inhousehold surveys because they live in remote areas orin families and communities whose presence may beillegal and unregistered.All of these ‘non-mainstream’ groups are likely to bestatistically invisible.A notable example are the 4.5 million Roma childrenwho live in the European Union.In 2005, 12 governments (6 of them members of theEU) committed to a ‘Decade of Roma Inclusion’.At the mid-point of the ‘Decade’, a report from theOpen Society Foundations concluded that, “Thelack ofdata about Roma communities remains the biggestobstacle to constructing any thorough assessment ofhow governments are meeting their Decadecommitments.”1The Czech Republic, Hungary, Slovakia and Spain, forexample, have no data to track even such basicindicators as infant mortality rates and primary schoolcompletion rates for Roma children. “Withoutcomprehensive data to evaluate government efforts andguide policies,”says the report, “thesituation…is likelyto remain dire.”2
1McDonald, M. and K. Negrin (2010). ‘No Data – No Progress: Country
findings, data collection in countries participating in the Decade of RomaInclusion 2005-2015’, Open Society Foundations, Budapest. Available at:www.soros.org/initiatives/roma2Ibid.
Box 6Relative agreementThe idea of defining poverty in a relative rather than anabsolute sense is not new.In the 18th century, Adam Smith famously argued thatpoverty is the inability to afford, “notonly thecommodities which are indispensably necessary for thesupport of life, but whatever the custom of the countryrenders it indecent for creditable people, even of thelowest order, to be without.”1A century later, and froma different ideological perspective, Karl Marx foundhimself in agreement, “Ourneeds and enjoymentsspring from society; we measure them, therefore bysociety and not by the objects of their satisfaction.Because they are of a social nature, they are of arelative nature.”2In 20th-century America, the liberal economistJ. K. Galbraith argued (1958) that, ”Peopleare poverty-stricken when their income, even if adequate forsurvival, falls markedly behind that of their community.”3In the early 1960s, the conservative Rose Friedman,also argued that the definition of poverty changes asgeneral living standards change; people living at theend of the twentieth century who are labelled poor, shewrote, “willhave a higher standard of living than manylabelled not poor today.”4Republicans at the timeendorsed the relative idea: ”Noobjective definition ofpoverty exists,”said a Republican Congressionalresponse in 1964: “Thedefinition varies from place toplace and time to time. In America as our standard ofliving rises, so does our idea of what is substandard.”5By the early 1960s, sociologists and economists likeVictor Fuchs in the United States and Peter Townsendin the United Kingdom were arguing that governmentsshould recognise the essentially relative nature ofpoverty by setting national poverty lines at a fixedpercentage of national median income (see Box 9:The poverty line: a short history).Today, the most commonly used poverty definition inthe developed world is a definition ofrelativepoverty,and most OECD countries now calculate their headlinepoverty rates by the percentage of the populationwhose incomes fall below 50% or 60% of nationalmedian income.
1Adam Smith,An Enquiry into the Nature and Causes of the Wealth of Nations,
Book 5, Chapter 2, 1776.2Karl Marx,Selected Works,Volume 1, 268-269, Lawrence and Wishart,
London, 1946.3Galbraith, J. K. (1958).The Affluent Society,Houghton Mifflin, Boston.4Friedman, R. D. (1965). ‘Poverty: Definition and Perspective’, American
Enterprise Institute for Public Policy Research, Washington, D.C.5Minority [Republican] views, p. 46 in U.S. Congress, Report of the Joint
Economic Committee on the January 1964 Economic Report of the Presidentwith Minority and Additional Views, US Government Printing Office,Washington, D.C., 1964.
I n n o c e n t I
R e p o R t
c a R d
1 0
2 1
comparisons. It shows for example, thatCanada and the United States beginwith the same level of relative childpoverty (25.1%) but that after taxes andbenefits the relative child poverty ratein Canada is almost halved whereas inthe United States it remains almostunchanged (see Figure 8a).Within Western Europe, the table alsoshows up stark contrasts. Relative childpoverty rates in France and Spain, forexample, begin at very similar levels(19.4% and 18.8%, respectively) but inFrance the rate is more than halved bygovernment intervention whereas inSpain very little difference is made (seeFigure 8a). Similarly, Austria, theCzech Republic, Germany and Italyall begin with relative child povertyrates of 16% to 18%; but after taxesand benefits the relative child povertyrate is brought down by half or morein Austria, the Czech Republic andGermany whereas in Italy there isalmost no reduction at all.
Fig. 9Child poverty rate and overall poverty ratechild povertypopulation povertyCyprusAustraliaFinlandGermanyNorwayJapanDenmarkSloveniaIcelandSwedenLatviaNetherlandsIrelandAustriaSwitzerlandMaltaEstonia
Falling how far?Figure 9 offers a different view of therelative performance of governments.Its premise is that, in a societycommitted to providing specialprotection for children, the childpoverty rate would be lower than theoverall poverty rate. But judged by arelative poverty measure, Figure 9shows that in only 10 of 35 countries– Cyprus, Australia, Finland, Germany,Norway, Japan, Denmark, Slovenia,Iceland and Sweden – is this the case.Figure 7, showing thedepthof relativechild poverty that is tolerated indifferent countries, has already offeredanother kind of overview ofgovernment performance. Asking thequestion: ‘On average, how far belowthe poverty line are the poor beingallowed to fall?’ the graph again revealssignificant differences betweencountries. In Finland the smallproportion of children (5%) in relativepoverty are living in households whoseincomes fall, on average, about 11%below the relative poverty line. In theUnited States, the much greaterproportion of children (23%) livingbelow the relative poverty line are seen
CanadaUnited KingdomFranceBelgiumLithuaniaNew ZealandCzech RepublicBulgariaGreeceSpainUnited StatesPortugalPolandHungaryItalySlovakiaLuxembourgRomania051015Poverty rateNotes:For each country, poverty calculations are based on a poverty line set at 50% of the national median income.Countries are ordered by increasing gap between child poverty and overall population poverty (the first ten countriesare those where children are not relatively disadvantaged compared to the overall population in terms of poverty; at thebottom are the countries where poverty is particularly concentrated among children).Sources:Calculations based on EU-SILC 2009, HILDA 2009, SLID 2009, SHP 2009, PSID 2007. Results for New Zealandare from Perry (2011) and refer to 2010. Results for Japan are from Cabinet Office, Gender Equality Bureau (2011).
20
25
30
2 2
I n n o c e n t I
R e p o R t
c a R d
1 0
Box 7The European Union: 2020 vision
In June 2010, the Heads of State and Government ofall 27 European Union countries called for 20 millionEU citizens to be lifted out of poverty and socialexclusion by the year 2020.How will this be measured?To be counted as living in ‘poverty or social exclusion’,an individual must be either ‘at risk of poverty’, or‘deprived’, or ‘living in a jobless household’. In 2010,an estimated 80 million people in the EU countries fellinto one or more of these three categories, definedas follows:At riskA person is considered ‘at risk of poverty’ if he or sheis living in a household with an equivalized income(see Box 3: Do children have incomes?) below 60% ofthe national median.DeprivedA person is considered ‘deprived’ if he or she is unableto meet four or more of the following nine criteria(note: both the list of essential items, and the thresholdused, are different from the child-specific deprivationmeasure used in thisReport Card):σσσσσσσσσσσσσσσσσσ
JoblessA person is considered to be living in a joblesshousehold if no adult is in paid employment or if thehours spent in paid employment amount to less than20% of the potential number of hours in a normalworking week. By this definition, approximately 40million of the EU’s 250 million people are currently livingin jobless households.Of these three measures, the ‘at risk of poverty’indicator – the percentage below 60% of mediannational income – is considered to be the headlinesocial exclusion indicator and is the most widely usedmeasure of relative poverty in the European Union.A place for childrenNone of the original range of 18 indicators selected bythe European Commission for the purpose of monitoringpoverty paid specific attention to the needs of children.1But in 2008, a start was made towards monitoring childpoverty. After consultations, a set of indicators specificto the lives of children was included as a special modulein the 2009 round of theEuropean Union Statistics onIncome and Living Conditions(EU-SILC). It is the resultsof this survey that have been drawn on in order toconstruct the 14-item child deprivation index presentedin thisReport Card(Figure 1a).‘Secondary data’ and special modules are included ineach survey on a four-yearly rotating basis; ‘primarydata’ are gathered annually. But as this report argues,the availability of timely data on child poverty anddeprivation is critical to protecting the growing mindsand bodies of children. Data that is specific to childrenshould therefore find a permanent, annual place in theEU-SILC survey – and European Union poverty reductiontargets for 2020 should be revised to include specifictargets for reductions inchildpoverty.
can afford to face unexpected expensescan afford one week holiday away from homeeach yearcan pay for arrears of mortgage or rent, utility billsor hire purchase instalmentscan afford a meal with meat, chicken or fish everysecond daycan keep the home adequately warmcan afford a washing machinecan afford a colour TVcan afford a telephonecan afford a car.
By this definition, an estimated 40 million EU citizensare currently deprived.
1Notten, G. and K. Roelen (2011). ‘Monitoring child well-being in the European
Union: Measuring cumulative deprivation’,Innocenti Working Paper2011-03,UNICEF Innocenti Research Centre, Florence.
I n n o c e n t I
R e p o R t
c a R d
1 0
2 3
to fall, on average, almost 38% belowthat line. Children below the relativepoverty line in Japan, Latvia, Bulgaria,Denmark, Spain and Romania are seento be at average income levels that arebelow the poverty line by 30% or more.Figure 7 also throws up some surprises.Sweden and Denmark are rightlyproud of their traditionally low rates ofchild poverty, but both find themselvesin the bottom half of the league tablewhen judged by thedepthof relativepoverty into which poor children areallowed to fall. The relative ‘povertygap’ for children is greater in Denmarkthan in Sweden, greater in Swedenthan in the United Kingdom, greaterin the United Kingdom than in France,and greater in France than in Finland.
Box 8The public viewThe most common measure used for estimating and comparing relativepoverty rates in the rich countries is the percentage of the populationliving in households where disposable income is below a certainpercentage of the national median. The OECD uses a poverty line setat 50% of median income.These thresholds have been criticised for being arbitrary. Why not drawthe line at 40% or at 60%, as in many individual OECD countries (seeFigure 5).But there is evidence that ‘50% of median income’ corresponds quiteclosely to what the majority of people think of as the income levelbelow which people are ‘in poverty’.The public perceptionIn one of the most famous speeches ever made about poverty, forexample, United States President Franklin Roosevelt declared, “Iseeone third of the nation ill housed, ill clad, ill nourished.”There was noexplicit mention ofrelativepoverty in this estimate. But whensociologist Donald Hernandez applied a ‘50% of median income’poverty line to contemporary census data he found that the percentageof the population living below this level was 32%.1A generation later in 1963, President Lyndon Johnson announced his'War on Poverty’ and asked economist Mollie Orshansky to develop thefirst official US poverty line (see Box 10: The United States: re-drawingthe line). Again, the idea that poverty should be defined in relative termswas not intended, and Orshansky drew the line at a fixed number ofdollars. But Census Bureau data for 1963 show that the ‘Orshansky line’of $3000 for a family or $1500 for an individual corresponded toapproximately 50% of median US income at the time.In 1974 Lee Rainwater, another leading figure in the history of povertystudies, brought together a range of public opinion surveys and familybudget studies to show that, at every point since the 1930s, the Americanpublic’s view of the income required to stay above the poverty line hasremained close to 50% of national median income. The United StatesGeneral Social Survey for 1993, for example, reported that, on average,the American public thought that a family of four would be below thepoverty line if its income fell below $17,658 (in 1993 dollars). This turnsout to be 48% of the US median household income for that year.Across the Atlantic, the United Kingdom’s Joseph Rowntree Foundationhas in recent years asked focus groups drawn from different kinds ofhouseholds to define a minimum acceptable standard of living – basedon need not wants. Advised by experts in health and nutrition, thefocus groups came up with a ‘Minimum Income Standard’ whichtranslates into approximately 60% of today’s UK median income.It is sometimes argued that the public at large thinks of poverty in anabsolute sense and that the concept of 'relative poverty' is properlyunderstood only by economists and social scientists. But it is clearfrom these examples that the popular definition of poverty is in fact arelative one.1Hernandez, D. J. (1993).America's Children: Resources from family, government, and the economy,
Comparing the risksSo far these different ‘windows’ intogovernment performance haveconcentrated on relative child povertybased on median household incomes.But the newly available data on childdeprivation also offer opportunities forcomparison. Specifically, it is possibleto look at each country’s track recordin protecting specific categories ofchildren who are known to be atgreater risk. For example:■σ
children in households with ‘lowwork intensity’ (as measured bythe employment record of adults inthe household)children whose parents have lowlevels of educationchildren living in single-parentfamilieschildren of migrant families.
■σ
■σ
■σ
Figures 10a, 10b, 10c, and 10dtherefore present league tables of adifferent kind – ranking countries bythe protection afforded to some oftheir most vulnerable children.Figure10a ranks countries by theprotection available to children wholive in single-parent households.Norway, Sweden, Iceland, Finlandand Denmark are seen to achieve thehighest levels of protection, closelyfollowed by the United Kingdom andIreland. In Belgium, the deprivation
Russell Sage Foundation, New York.
2 4
I n n o c e n t I
R e p o R t
c a R d
1 0
Fig. 10aDeprivation rate for children living insingle-parent families4.14.34.46.810.112.213.014.915.316.917.317.620.021.522.323.123.423.824.329.731.232.734.342.646.547.350.676.085.40102030405060NorwaySwedenIcelandFinlandDenmarkUnited KingdomIrelandNetherlandsSpainAustriaSloveniaItalyBelgiumFranceEstoniaSlovakiaLuxembourgGermanyGreeceCzech RepublicMaltaLithuaniaCyprusPolandPortugalHungaryLatviaBulgariaRomania708090
Fig. 10bDeprivation rate for children living in familieswith low parental education2.53.95.96.59.911.712.013.815.819.219.219.322.626.727.929.432.934.035.637.950.854.759.561.067.674.583.889.692.4010203040506070FinlandIcelandNorwaySwedenLuxemburgDenmarkIrelandNetherlandsMaltaAustriaSpainUnited KingdomCyprusBelgiumItalyEstoniaSloveniaFranceGermanyPortugalGreeceLithuaniaCzech RepublicPolandLatviaHungarySlovakiaBulgariaRomania8090100
Deprivation rate (%)Note:Data refer to children aged 1 to 16.Source:Calculations based on EU-SILC 2009.
Deprivation rate (%)Note:Data refer to children aged 1 to 16.Source:Calculations based on EU-SILC 2009.
Fig. 10cDeprivation rate for children living in joblesshouseholds (no adult in paid employment)11.813.314.617.919.420.123.226.229.333.534.338.140.440.742.243.645.646.850.051.054.155.560.864.473.678.885.295.8010203040506070SwedenUnited KingdomNorwayIcelandIrelandNetherlandsDenmarkFinlandLuxembourgSpainItalyMaltaBelgiumAustriaGermanySloveniaFrancePolandCzech RepublicLithuaniaCyprusEstoniaLatviaHungaryPortugalSlovakiaBulgariaRomania8090100
Fig. 10dDeprivation rate for children living in migrant families2.73.13.43.65.07.47.87.910.111.814.415.516.616.717.918.819.419.620.523.728.931.533.642.205101520253035SwedenIrelandNorwayIcelandLuxembourgUnited KingdomNetherlandsDenmarkMaltaFinlandCyprusSloveniaEstoniaGermanyAustriaCzech RepublicSpainBelgiumFranceItalyLatviaLithuaniaPortugalGreece4045
Deprivation rate (%)Notes:Data refer to children aged 1 to 16. Greece has been omittedfrom this table because of the small sample size for the relevant population.Source:Calculations based on EU-SILC 2009.
Deprivation rate (%)Notes:‘Migrant families’ means that at least one parent is foreign-born. Estimatesare based on the 2009 EU-SILC and may differ from estimates drawn from nationalcensus data or other surveys. Data refer to children aged 1 to 16. Bulgaria, Hungary,Poland, Romania and Slovakia have been omitted from this table because of thesmall sample size for the relevant population.Source:Calculations based on EU-SILC 2009.
I n n o c e n t I
R e p o R t
c a R d
1 0
2 5
level among children in single-parentfamilies is approximately double thatof Denmark. Levels in Luxembourg,Germany and Greece are almostdouble that of the United Kingdom.Figure 10b shows the deprivation ratefor children whose parents have a lowlevel of education. Again, Finland,Iceland, Norway and Sweden have thebest protection record, though in adifferent rank order. And again, largedifferences emerge. For example, abouta third of French children who areliving in families with low parentaleducation are deprived, as opposed toconsiderably fewer than 10% in mostNordic countries.
Figure 10c lists countries by thedeprivation level for children who livein households with no employed adult.Unsurprisingly, unemploymentincreases the risk of child deprivationin all countries; but again the variationbetween countries is considerable.Sweden, the United Kingdom andNorway top the table with deprivationrates of under 15% for children in‘jobless households’ – as opposed torates around the 40% mark for suchwealthy countries as Belgium, Austria,Germany and France.Figure 10d compares deprivationlevels for a fourth vulnerable group –children living in migrant families.
Because children of migrant familiesmay be undocumented and thereforestatistically invisible, and because theproportion, composition andbackground of migrant families varyfrom nation to nation, this analysismust be treated with care. But thetable again shows the same group ofcountries (with the addition ofIreland) holding positions at or nearthe top of the protection league. InSweden, Ireland, Norway and Iceland,fewer than 5% of children in migrantfamilies are deprived. In France andItaly the proportion is more than 20%(and in a further four countries morethan 25%).
Fig. 10eChild deprivation rates in at-risk groupsCountryDeprivation ratefor childrenlacking 2 or moreitemsDeprivation ratefor childrenliving in singleparent familiesDeprivation rate forchildren living in familieswith low parentaleducation (none, primaryand lower secondary)3.96.55.92.511.713.89.912.019.322.619.232.919.259.535.615.826.734.029.427.950.883.854.761.037.967.674.589.692.478.851.046.873.660.864.485.295.833.628.931.5Deprivation rate forchildren living injobless households(no adult in paidemployment)17.911.814.626.223.220.129.319.413.354.133.543.640.750.042.238.140.445.655.534.3Deprivation ratefor children livingin migrant families
IcelandSwedenNorwayFinlandDenmarkNetherlandsLuxembourgIrelandUnited KingdomCyprusSpainSloveniaAustriaCzech RepublicGermanyMaltaBelgiumFranceEstoniaItalyGreeceSlovakiaLithuaniaPolandPortugalLatviaHungaryBulgariaRomania
0.91.31.92.52.62.74.44.95.57.08.18.38.78.88.88.99.110.112.413.317.219.219.820.927.431.831.956.672.6
4.44.34.16.810.114.923.413.012.234.315.317.316.929.723.831.220.021.522.317.624.323.132.742.646.550.647.376.085.4
3.62.73.411.87.97.85.03.17.414.419.415.517.918.816.710.119.620.516.623.742.2
Notes:Data refer to children aged 1 to 16. The shading indicates whether a country ranks in the top third (light blue),middle third (mid-blue), or bottom third (dark blue) for each of the four risk categories.Source:Calculations based on EU-SILC 2009.
2 6
I n n o c e n t I
R e p o R t
c a R d
1 0
Fig. 11Spending on families and childrencash transferstax breaks towards familiesservices
FranceUnited KingdomSwedenHungaryDenmarkBelgiumLuxembourgNew ZealandNorwayIcelandNetherlandsFinlandAustraliaGermanyIrelandAustriaCzech RepublicSlovakiaCyprusSloveniaEstoniaRomaniaPolandSpainSwitzerlandItalyCanadaPortugalJapanBulgariaUnited StatesLithuaniaLatviaGreeceMalta0.00.51.01.52.02.53.03.54.0
Figure 10e brings these fourdeprivation tables together to providean overview of the protection recordof different nations. It presents aremarkably consistent picture inwhich the same seven countries –Iceland, Sweden, Norway, Finland,Denmark, the Netherlands andIreland – feature in the top third ofthe table no matter which at-riskcategory is chosen. Luxembourg andthe United Kingdom feature in thetop third of the table for three of thefour risk categories.In addition to what this overview hasto say about the protection offered byindividual countries to particulargroups of at-risk children, the tablealso makes a strong overall statementthat being the child of a single parent,or of a migrant family, or of parentswho are unemployed or of loweducational level, does not have tomean deprivation. The level of riskincurred is not a function of chance ornecessity but of policy and priority.
The level you pay forFinally, it is possible to examine thecommitment of governments to theprotection of children by looking atthe overall level of resources theyare prepared to devote to the task.Figure 11 presents this information inthe form of a league table ranking 35countries by the percentage of GDPthat each country spends on cashtransfers, tax breaks and services forchildren and families. France, theUnited Kingdom and Sweden headthe table, followed by Hungary,Denmark and Belgium. Each of thesespends twice as a much – as aproportion of GDP – as countriessuch as Spain, Switzerland, Italy,Canada, Portugal, Japan and Bulgaria.At the bottom of the table are fivecountries spending little more than1% of GDP on cash benefits, taxbreaks and services for children andfamilies – the United States, Lithuania,Latvia, Greece and Malta.Figure 11a compares this level ofspending with the reductions in
Public spending on families in cash transfers, tax breaks and services (as % GDP)Source:Data for public spending are from the OECD Family Database, around 2007.
Fig. 11aGovernment spending on families and children compared to reductionsachieved in relative child poverty due to taxes and transfersReductions achieved in relative child poverty rates100806040200-20-400.51.01.52.02.53.03.54.0Government spending on families (as % GDP)Note:For country abbreviations see page 35.Source:See Figures 11 and 8.GRMTLTBGPTLVCHESUS JPITCAEEPL ROCZCYSKIEFIAUNZLUBEHUUKFRDK SE
SI
AT
NODEISNL
I n n o c e n t I
R e p o R t
c a R d
1 0
2 7
relative child poverty that differentgovernments manage to achieve (seealso Figure 8). How the money isspent can be as important as howmuch is spent, but the chartnonetheless shows a strong relationshipbetween resources expended andresults achieved. In particular, spendingon children and families is running atwell below the OECD average inGreece, Italy, Japan, Latvia, Spain,Switzerland, and the United States.And in all of these countries the lackof priority for children in nationalbudgets shows through in thecorrespondingly small reductions inrelative child poverty that eachachieves.
physical growth are placed at risk. Butsocieties also pay a heavy price – inlower returns on educationalinvestments, in reduced skills andproductivity, in the increasedlikelihood of unemployment andwelfare dependence, in the highercosts of social protection and judicialsystems, and in the loss of socialcohesion. In the medium term, thesecosts must be met in the hard currencyof the billions of extra dollars spent inattempting to cope with the widerange of problems associated with highlevels of child poverty. The economicargument, in anything but the shortestterm, is therefore heavily on the sideof preventing children from fallinginto poverty in the first place.Even more important is the argumentin principle. Childhood by its nature,and by its very vulnerability, demandsof a civilized society that childrenshould be the first to be protectedrather than the last to be considered.This principle of ‘first call’ for childrenholds good for governments andnations as well as for the families whobear the primary responsibility forprotection. And because children haveonly one opportunity to grow and todevelop normally, the commitment toprotection must be upheld in goodtimes and in bad. It must be absolute,not contingent.Nor can this principle of first call beside-stepped by the argument that theprotection of children is an individualrather than a social responsibility. Noone can seriously claim that it is thechild’s fault if economies turn down orif parents are unemployed or low-paid.That is why the league tables showingthe different degrees of protectionprovided to at-risk groups should beweighed by politicians, press andpublic. A society that fails to supportparents in the task of protecting theyears of childhood is a society that isfailing its most vulnerable. It is also asociety that is storing up intractablesocial and economic problems for theyears immediately ahead.
ConclusionThis report has set out the latestinternationally comparable data onchild poverty as measured by rates ofchild deprivation and relative childincome poverty.The two measures are profoundlydifferent in concept. Both havestrengths and weaknesses. Takentogether, they offer two different butcomplementary measures and offer thebest currently available comparativepicture of child poverty in the world’swealthiest nations.Both measures are also behind thetimes, and the seriousness of this failinghas been exposed by the post-2008economic downturn. At this criticalmoment for low-income families in somany countries, very few have detailedinformation on the impact the crisis ishaving on children’s lives. It may ofcourse be argued that in times of crisisgovernments have more to worryabout than producing statistics. Butwithout up-to-date information thereis little possibility of putting in placepolicies that use limited resources incost-effective ways to protect childrenfrom the effects of poverty.Failure to offer this protection bringsheavy costs. The biggest price is paidby individual children whosesusceptible years of mental and
2 8
I n n o c e n t I
R e p o R t
c a R d
1 0
Box 9The poverty line: a short history
The earliest known attempts to draw an official povertyline date from 19th-century Britain and were driven bythe need to ensure that children from the poorestfamilies were not deprived of schooling.1The United Kingdom’s Elementary Education Act of 1870sought to put all children aged 5 to 13 in school. But asparents were required to pay a small fee, the Act alsoempowered the members of local School Boards towaive payment “inthe case of any child when they are ofthe opinion that the parents of such a child is unable frompoverty to pay the same.”2The Act specifically stated thatthis power was to be ”mostcautiously and sparinglyused,”but it still left School Boards with a problem:”Nomachinery that you could possibly invent,”said thechairman of the London School Board in 1887, ”wouldenable you to say what each parent is able to pay.”3Nonetheless, local School Boards made theirjudgements as best they could and established whatwas in effect a ‘poverty line’ below which school feesneed not be paid. Where that line was drawn variedfrom city to city and was usually kept secret ”forfearthat the Board would be cheated.”4Other problems faced by 19th-century School Boardsstill face social scientists today: should income bemeasured before or after housing costs? What shouldbe done about irregular or undeclared earnings? Whatadjustments needed to be made for larger families?(see Boxes 2 and 3).Booth and BarnettThe School Boards’ struggles were the background to thework of the man generally credited with the invention ofthe poverty line – the Victorian philanthropist and glove-manufacturer Charles Booth. In his 1877 speech to theRoyal Statistical Society, Booth presented the findings ofa survey on the incomes of London's poor and suggestedthat a 'line of poverty’, set at 18 to 21 shillings a week,would divide the people of London into those who live ‘incomfort’ and those who live ‘in poverty’.At about the same time, the social reformer HenriettaBarnett was attempting to calculate a minimum cost ofliving using 'dietetic science’. Her clergyman husbandSamuel Barnett drew on her calculations to propose a
weekly minimum income for a family of two adults andsix children. This sum, it was stressed, was only forsubsistence and allowed nothing for the ”cheeringluxuries which gladden life.”5At the turn of the 19th century the systematic study ofpoverty took a major stride forward with the work ofSeebohm Rowntree, scion of the famous Quaker familyof chocolate manufacturers. Published in 1901,Rowntree's ‘poverty line’ (he was the first to use thephrase) claimed to be ”thefirst attempt to fix a povertyline on scientific lines.”Surveying living conditionsamong 10,000 working class families in the city of York,he proposed a minimum income level to ensure“adequatenutrition and other essentials.”6Rowntree proceeded to divide those judged ‘poor’(about 25%) into two groups. The first group he definedas living in ‘primary poverty’ because they simply didnot have enough income to meet their basic needs.Those in ‘secondary poverty’, on the other hand, werefailing to meet their needs not because their incomeswere too low but because they spent money on non-essential items (beer and tobacco being judgedparticularly non-essential).Such a distinction would not be sustainable today, butat the time the concept of ‘primary poverty’ representeda significant shift away from the 19th-century conceptof poverty as a moral failing associated with ‘laziness’,‘fecklessness’, ‘shiftlessness’ and ‘drunkenness’. AfterRowntree, poverty came to be seen more and moreas the result of impersonal economic forces such aslow pay and unemployment in an increasinglyindustrialized society.In his later work, Seebohm Rowntree moved closer toa relative concept of poverty. In his 1936 survey, forexample, a 'sufficient income' encompassed the abilityto buy some items not absolutely necessary for survival,including newspapers, books, a radio, tobacco, beer,and a holiday. By the time of Rowntree’s last survey in1951, it was widely believed that poverty in theUnited Kingdom was close to being defeated by thepost-war advance of the welfare state. But as absolutepoverty began to recede into history, the idea ofmeasuring relative poverty was struggling to be born.
I n n o c e n t I
R e p o R t
c a R d
1 0
2 9
Tomorrow's necessitiesThe idea that poverty is essentially a relative conceptand should be measured as such began to gain groundin the 1960s.In America, the health economist, Victor Fuchs,proposed that the poverty line be set at one half of themedian income. “Today'scomforts and conveniences,”he argued, “areyesterday's luxuries and tomorrow'snecessities.”7This proposal has yet to find fullacceptance in the United States (see Box 10: The UnitedStates: redrawing the line).In the United Kingdom, the case for a relative povertyline was already being advanced in the late 1950s byPeter Townsend, Professor of Sociology at the LondonSchool of Economics and a co-founder of the ChildPoverty Action Group. In his 1200-page study 'Poverty inthe United Kingdom' (1979), Townsend abandoned thefixed poverty standards of his predecessors in favour ofa relative definition that has been central to povertystudies and poverty measurement ever since:“Individuals,families and groups in the population canbe said to be in poverty when they lack the resources toobtain the types of diet, participate in the activities, andhave the living conditions and amenities which arecustomary, or are at least widely encouraged andapproved, in the societies in which they belong.”8The influence of Townsend’s formulation was enormous,and is manifest for example in the definition of povertyadopted by the European Economic Community in 1984which states that the poor are:“persons,families and groups of persons whoseresources (material, cultural, and social) are so limitedas to exclude them from the minimum acceptable wayof life in the Member State in which they live.”9Townsend also pioneered the use of non-monetaryindicators to measure poverty and deprivation. Drawingup a list of items and opportunities that ‘no one shouldbe without’, he conducted surveys to find out whatproportion of the population lacked such items.The Townsend scale has been developed and refinedever since. For the United Kingdoms’sBreadline
Studiesof 1983 and 1990, for example, researchersStewart Lansley and Joanna Mack introduced the ideaof “sociallyperceived necessities”– arguing that at leasthalf the population should agree that an item was sonecessary that ”noone should be without”.10Morerecently still, the United Kingdom’s 1999Poverty andSocial Exclusion Surveyattempted to reflect socialnorms by weighting each item on the ‘deprivation list’according to the proportion of the population alreadyowning the item.In the present century, the European Union has playeda leading role in developing the concepts and statisticaltools for measuring poverty and social exclusion. Threeprincipal measures – relative poverty, deprivation, andjoblessness – have been chosen to lead the way inmonitoring social exclusion across the 27 EU countriesplus Iceland and Norway (see Box 7: The EuropeanUnion: 2020 vision).
1
Gillie, A. (1996). ‘The Origin of the Poverty Line’,Economic History Review,XLIX, 4: 715-730.Ibid.Ibid.Ibid.Ibid.Rowntree, B. S. (2000, Centennial, ed.).Poverty: A Study in Town Life,ThePolicy Press, Bristol.Fuchs, V. R. (1967). ‘Redefining Poverty and Redistributing Income’,The PublicInterest 8:88–95. See also: Hernandez, D. J., N. A. Denton and S. E.Macartney (2007). ‘Child Poverty in the US: A new family budget approachwith comparison to European countries’, in Wintersberger, H., L. Alanen, T. Olkand J. Qvortrup (eds). ‘Childhood, Generational Order and the Welfare State:Exploring Children's Social and Economic Welfare’, Volume 1,COST A19:Children's Welfare,University Press of Southern Denmark.Townsend, P (1979).Poverty in the United Kingdom: A survey of household.resources and standards of living,Penguin Books, Harmondsworth.Council of the European Communities (1984). 85/8/EEC: Council Decision of19 December 1984 on specific Community action to combat poverty.See also: Lansley, S. and J. Mack (2011). Review of Kristian Niemietz,A NewUnderstanding of Poverty,Institute of Economic Affairs.
23456
7
8
9
10Mack, J and S. Lansley (1985).Poor Britain,George Allen & Unwin, London.
3 0
I n n o c e n t I
R e p o R t
c a R d
1 0
Box 10The United States: re-drawing the lineThe United States is one of the few OECD countries withan official poverty line – in fact 48 different poverty linesfor different sizes and kinds of households.Developed as part of President Lyndon Johnson’s ’Waron Poverty’ in the early 1960s, the original US povertyline was arrived at by assessing the income required toafford the cheapest of four ‘nutritionally adequate’ foodplans1and multiplying the result by three (followingresearch in the mid-1950s which showed that the typicalAmerican household spent about one third of its incomeon food). This worked out at $3000 a year for familiesand $1500 for individuals.Updated only for inflation, this is the measure that hasofficially defined poverty in America for the last 50years. But because it has been increased only withprices, not incomes, the material standard that itrepresents has fallen further and further behind theliving standards of most Americans. In the 1960s, forexample, the poverty line was the equivalent of 50% ofnational median income; by the end of the century ithad fallen to about 30% of median income.2The currentofficial US poverty line therefore reflects what wasconsidered to be a minimally acceptable living standardover half a century ago.New needsFor more than two decades, social scientists in theUnited States have been urging that the official povertyline should be re-drawn. Most compellingly, revision isneeded to bring the poverty line closer to the realities ofpresent day America where the average proportion offamily income spent on food is now approximately oneeighth rather than one third.3A new poverty line, it is argued, should also take intoaccount not just new needs but also new benefits thatgovernments have made available to those on lowincomes. At present, the process of assessing householdincomes takes only cash benefits into account, ignoringthe more than $200 billion a year disbursed bygovernment to poorer households in the form of foodstamps, tax credits and other in-kind benefits. In sum,says Professor Jane Waldfogel of Columbia University,“Theofficial measure no longer corresponds to reality. Itdoesn’t get either side of the equation right – how muchthe poor have or how much they need.”4Ideally, a revised national poverty line would also reflectregional differences in the cost of living, especiallyhousing and health care. According to some estimates,for example, the poverty threshold would have to beraised by $3500 a year just to allow for the higher cost ofurban living in a wealthy State like Connecticut.5New proposalsIn 1995, the United States Congress invited the NationalAcademy of Sciences (NAS) to address these problems.The overall conclusion of the NAS panel was that,”thecurrent measure needs to be revised: it no longerprovides an accurate picture of the differences in theextent of economic poverty among population groupsor geographic areas of the country, nor an accuratepicture of trends over time.”6In making its proposals, the Academy stopped short ofembracing a European-style relative poverty line basedon a percentage of median national income. Instead, itproposed basing the new poverty line on a budget forfood, clothing, shelter, utilities, and ”asmall additionalamount to allow for other needs”.The new measure wasto be relative in the sense that the budget was to bebased on observed spending in the society at large (andupdated every three years), but it tracked only spendingon necessities rather than spending of all kinds. The newproposals therefore left the door open for those belowthe poverty line to fall further and further behind thenormal standard of living in the United States.ExperimentsWhen NAS-style budgets were drawn up and calculated,the dollar value of the resulting poverty line was seen tocorrespond to about 20% less than half of US medianincome (in 1992). But this was not the whole story.A radical change was also proposed in the way thathousehold incomes were calculated. First, all non-cashbenefits – such as food stamps, school lunches, andhousing and energy subsidies – were to be included.Second, ‘non-discretionary expenses’ were also to besubtracted – including an allowance for child care andsome medical costs and health insurance premiums.Such changes, said the NAS panel, would provide a morerealistic assessment of 'disposable household income'.Taken together, they moved the proposed new povertyline closer to 50% of median income (the exact figurewould depend on how the proposals were implemented).Following the NAS report, the United States CensusBureau began tentative experiments with a new povertymeasure that incorporated some of the recommendations(though not the allowance for regional variations in thecost of living).Slow progressMeanwhile, the official US poverty line remains unchanged.In part, this can be put down to the fact that a revisionalong the lines of the NAS proposals would substantiallyalter both the number and composition of those deemed
I n n o c e n t I
R e p o R t
c a R d
1 0
3 1
to be below the poverty line.7This in turn would affectthe disbursement of billions of dollars in federal funds,re-write the eligibility rules for particular benefitprogrammes, alter the pattern, level and funding forfederal and state programmes, and impact on differentdemographic groups in different ways. Add to this thefact that the official poverty line is the responsibility of theExecutive Office of the President and it is evident that anyre-drawing of the line is going to be a high-profile issuesubject to intense institutional and political pressures.While the debate continues, the United States CensusBureau has tentatively introduced aSupplementalPoverty Measure8to be deployed, as an experiment,alongside the official poverty line.Running old and new poverty lines side by side mighthelp to loosen the ideological knot at the heart of thedebate. One of the objections to the NAS proposals isthat they are to some extent based on observedspending in the society as a whole; they are thereforeseen by some as a step towards a European-style relativepoverty line. To conservatives in the United States, aselsewhere, the concept of ‘relative poverty’ is a Trojanhorse which, once admitted within the walls, would pourforth the warriors of more progressive taxation.In the meantime, individual States and programmeshave begun to move forward on their own.9New YorkCity's Office of Economic Opportunity, for example, hasalready begun to use NAS-style poverty measures.Comparisons with EuropeIn comparing child poverty rates with other developedcountries, even the newSupplemental Poverty Measurewould almost certainly underestimate the level of relativechild poverty in the United States. This is because amajority of OECD countries provide free or subsidizedearly childhood care and education, free or subsidizedhealth care (or health insurance), and significantsubsidies for parental leave. In the United States, suchservices must usually be paid for from ‘disposablehousehold income’. Like is not therefore beingcompared with like.In 2007, Professor Donald Hernandez, with colleaguesNancy Denton and Suzanne Macartney, made a proposalthat would allow a more accurate comparison to bemade between child poverty rates in the US and otherdeveloped countries. Using the NAS recommendationsas a guideline, and drawing on research by Washington’sEconomic Policy Institute, the new proposals firstcalculate the income needed for ‘Basic Budget Poverty’.More radically, the proposal then calculates realdisposable household incomes by subtractingnon-discretionary costs such as transport to work, health
insurance, and good quality early childhood educationand care.The result of this experiment, when applied to CensusBureau data for the end of the 1990s, was a US childpoverty rate of approximately 34%. This compares withthe UNICEF estimate for the same period of 21.9%(for relative child poverty based on the percentageof children in households with below 50% of medianincome).This approach may overstate the availability of free orsubsidized ‘good quality’ early childhood education andcare in many OECD countries. But the authors believetheir approach can be justified and that it carries theimportant message that child poverty in the UnitedStates is even more out of line with the rest of thedeveloped world than was previously thought:“Apoverty measure going beyond the UNICEF approachto incorporate these costs shows much larger differencesthan indicated by the UNICEF measure. The UNICEFpoverty rates for six countries with near universalmaternal/parental leave, preschool and national healthinsurance, range from 2.4% in Denmark to 10.2% inGermany. The UNICEF measure for the US is at leastdouble these rates at 21.9%, and the Basic BudgetPoverty Rate taking into account childcare/early educationand health care is three times greater…”10
1
Orshansky, M. (1969). ‘How Poverty is Measured’,Monthly Labour Review,Vol. 92 (2): 37-41.Notten, G. and C. de Neubourg (2011). ‘Monitoring Absolute and RelativePoverty: “Not Enough” is not the same as “Much Less”’,Review of Incomeand Wealth,Series 57 (2).Couch, K. A. and M. A. Pirog (2010). ‘Poverty Measurement in the U.S.,Europe, and Developing Countries’,Journal of Policy Analysis andManagement,Vol. 29 (2): 217.‘Bleak Portrait of Poverty is Off the Mark, Experts Say’, New York Times,3 Nov, 2011.Couch and Pirog (2010), op. cit. p. 219.Citro, C. F. and Robert T. Michael (eds.) (1995).Measuring Poverty:A new approach.National Academies Press, Washington DC.Available at www.nap.edu/html/poverty/summary.htmlCouch and Pirog (2010). op. cit. p. 219.The Research Supplemental Poverty Measure, United States Census Bureau,November 2011. Available at: www.census.gov/hhes/povmeas/methodology/supplemental/research/Short_ResearchSPM2010.pdfSmeeding, T. M. and J. Waldfogel (2010). ‘Fighting Poverty: Attentive policycan make a huge difference’,Journal of Policy Analysis and Management,Vol. 29 (2): 405.in the US: A new family budget approach with comparison to Europeancountries’, in Wintersberger, H., L. Alanen, T. Olk and J. Qvortrup (eds).‘Childhood, Generational Order and the Welfare State: Exploring Children'sSocial and Economic Welfare’, Volume 1,COST A19: Children's Welfare,University Press of Southern Denmark.
2
3
4
56
78
9
10Hernandez, D. J., N. A. Denton and S. E. Macartney (2007). ‘Child Poverty
3 2
I n n o c e n t I
R e p o R t
c a R d
1 0
Data forReport Card 10:the surveys
The statistical work forInnocenti Report Card 10is basedon the direct elaboration of household survey microdatafor 33 economically advanced countries. For twocountries, Japan and New Zealand, the statistical resultshave been derived from national studies shared by theirrespective authors with the UNICEF research team.Most of the surveys elaborated for this study wereconducted in 2009.European UnionEuropean Union Statistics on Income and LivingConditions (EU-SILC)The 2009 round of EU-SILC is the main source of dataused forReport Card 10,providing data on deprivationand relative poverty among children for the 29 countriesincluded in this study (all 27 European Union countries,plus Iceland and Norway).EU-SILC surveys are conducted annually and collectcomparable data on income, poverty, social exclusion andliving conditions from representative samples of privatehouseholds and their current members living in theterritory of the countries at the time of the data collection.EU-SILC is the main source of data to monitor theindicators by which the European Union has agreed tomeasure its progress toward reducing social exclusion.The surveys are administrated nationally, with someflexibility in the implementation (the national surveys arebased on a common framework which defines targetvariables, and on common guidelines and concepts tomaximize international comparability).The survey is made up of a core component (samecontent every year) and special modules (which changeannually). The 2009 EU-SILC survey included the specialmodule on ’Material Deprivation’, including 36 variables.Many of these new variables were about ‘child materialdeprivation’ and covered ‘basic needs’, ‘educational orleisure needs’ and ‘medical needs’. Many of thevariables included in the 2009 special module have beenused for the analysis of child material deprivation in thisReport Card.The EU-SILC data on child material deprivation refer tothe year 2009, while those on child poverty refer to 2008(except for the United Kingdom, which refer to 2009).More information can be found at:epp.eurostat.ec.europa.eu/portal/page/portal/microdata/eu_silc
A comprehensive review of EU-SILC can be found in:Atkinson, Anthony B. and Eric Marlier (eds) (2010),Income and Living Conditions in Europe,Eurostat,European Commission, Publications Office of theEuropean Union, Luxembourg.Data on child income poverty have been elaboratedfrom the following national representative surveys:AustraliaHousehold Income and Living Dynamics in Australia(HILDA),2008 –2009.HILDA is a household panel study which collectsinformation on income, employment, family life andhousehold composition on an annual basis.This survey is conducted annually by the MelbourneInstitute of Applied Economic and Social Research(University of Melbourne) and is funded by the AustralianGovernment through the Department of Families,Housing, Community Services and Indigenous Affairs.The income data extracted from this survey refer to thefiscal year July 2008–June 2009.More information can be found at:www.melbourneinstitute.com/hilda/CanadaSurvey on Labour and Income Dynamics (SLID),2009.SLID is a panel survey run by Statistics Canada. It is thecountry’s primary source for income data, and includesinformation on family situation, education anddemographic background. The survey is representativeof all individuals living in Canada, excluding residents ofthe Yukon, the Northwest Territories and Nunavut, aswell as residents of institutions and persons living onIndian reserves. Overall, these exclusions amount to lessthan 3% of Canada’s population.Report Card 10uses data from the 2009 round of theSLID, with income poverty data referring to the year 2008.More information can be found at:www.statcan.gc.ca
I n n o c e n t I
R e p o R t
c a R d
1 0
3 3
SwitzerlandSwiss Household Panel (SHP),2009.SHP is a yearly panel study, run by FORS, the SwissFoundation for Research in Social Sciences, based at theUniversity of Lausanne.The study follows a random sample of households inSwitzerland over time with the aim of observing socialchange, focusing in particular on changing livingconditions.Report Card 10uses data from the 2009 round of theSHP with income poverty data referring to the year 2008.,More information can be found at:www.swisspanel.chUnited StatesPanel Study on Income Dynamics (PSID),2007.PSID is a national representative panel study on socio-economic status and health across generations in theUnited States. The PSID, started in 1968, is directed bythe Institute of Social Research at the University ofMichigan and collects data on income, wealth,expenditure, demographics, education, childdevelopment and other topics.The PSID data used forReport Card 10are those fromthe 2007 survey, with income poverty data referring tothe year 2006.More information can be found at:psidonline.isr.umich.edu/For the four surveys described above, HILDA, SLID, SHPand PSID, harmonized household income data havebeen obtained from the Cross National Equivalent File(CNEF), a project managed by Cornell University. Thesedata complemented those extracted directly from theoriginal survey.More information can be found at:www.human.cornell.edu/pam/research/centers-programs/german-panel/cnef.cfm
Additional sources of information on income povertyJapan,2010.The statistics on child income poverty for Japan havebeen taken from:Cabinet Office, Gender Equality Bureau, Japan (2011),‘The State of Poverty and Gender Gap’, paper presentedat the Working Group on “Women and the Economy”,Specialist Committee on Basic Issues and Gender ImpactAssessment and Evaluation under the Council for GenderEquality, Tokyo 20 December 2011.The data presented in this paper have been elaboratedfrom the 2010Comprehensive Survey of LivingConditionsof the Ministry of Health, Labor and Welfare.The data on income refer to the year 2010.More information can be found at:www.mhlw.go.jp/english/database/db-hss/cslc-index.htmlNew Zealand,2009–2010.The statistics on child income poverty for New Zealandhave been taken from:Perry, Bryan (2011),‘Household Incomes in New Zealand:Trends in indicators of inequality and hardship 1982 to2010’, Ministry of Social Development, Wellington,July 2011.This paper elaborates microdata from the 2009-2010Household Economic Surveyof Statistics New Zealand.Income data from this survey refer to 2010.More information can be found at:www.stats.govt.nz/surveys_and_methods/our-surveys/hes-resource.aspx
I n n o c e n t I
R e p o R t
c a R d
1 0
I n n o c e n t I
R e p o R t
c a R d
1 0
3 5
R E F E R E N C E S
Country abbreviationsUNICEF Innocenti Research Centre(2010). ‘The Children Left Behind:A league table of inequality in childwell-being in the world’s rich countries’,Innocenti Report Card 9,UNICEF IRC,Florence.www.unicef-irc.org/publications/619Bradshaw, J., Y. Chzhen, C. deNeubourg, G. Main, B. Martorano, andL. Menchini (2012). ‘Relative IncomePoverty among Children in RichCountries’,Innocenti Working Paper2012-01,UNICEF Innocenti ResearchCentre, Florence.www.unicef-irc.org/publications/pdf/iwp_2012_01.pdfiiiiii
Guio, A-C. (2010). ’What Can BeLearned from Deprivation Indicators inEurope’,Eurostat Methodologies andWorking Papers,European Commission,Luxembourg.epp.eurostat.ec.europa.eu/cache/ITY_OFFPUB/KS-RA-09-007/EN/KS-RA-09-007-EN.PDFNolan and Whelan (2010) op. cit, pp.319-321.Lansley, S. and J. Mack (2011).Review of Kristian Niemietz, ’A NewUnderstanding of Poverty’, Institute ofEconomic Affairs.www.poverty.ac.uk/sites/default/files/Review%20Nimietz%2020%20May%20sl&jm-final.pdfxixiixix
viii
AustraliaAustriaBelgiumBulgariaCanadaCzech RepublicCyprusDenmarkEstoniaFinlandFranceGermanyGreeceHungaryIcelandIrelandItalyJapanLatviaLithuaniaLuxembourgMaltaNetherlandsNew ZealandNorwayPolandPortugalRomaniaSlovakiaSloveniaSpainSwedenSwitzerlandUnited KingdomUnited States
AUATBEBGCACZCYDKEEFIFRDEGRHUISIEITJPLVLTLUMTNLNZNOPLPTROSKSIESSECHUKUS
Bradshaw, J. and E. Mayhew (2010).’Understanding Extreme Poverty in theEuropean Union’,European Journal ofHomelessness,Vol.4: 174.Notten, G. and C. de Neubourg (2011).’Monitoring Absolute and RelativePoverty: “Not Enough” is not the sameas “Much Less”’,Review of Income andWealth,Series 57 (2): 260-265.Bradshaw et al. (2012). op. cit.
Bradshaw et al. (2012). op. cit.
iv
Smeeding, T. M. and J. Waldfogel(2010). ’Fighting poverty: Attentive policycan make a huge difference’,Journalof Policy Analysis and Management,vol. 29 (2): 401-407.
vvi
Nolan, B. and C. T. Whelan (2010).’Using Non-Monetary DeprivationIndicators to Analyse Poverty and SocialExclusion: Lessons from Europe?’Journal of Policy Analysis andManagement,vol. 29 (2): 305-325.
Pasma, C. (2010). ’Bearing the Brunt:How the 2008-2009 Recession CreatedPoverty for Canadian Families’, Citizensfor Public Justice, Ottawa.www.cpj.ca/en/content/bearing-bruntBradshaw, J. (2000). ’Poor Childrenin Rich Countries’, Address to Hawke’sBay Medical Research Foundation,New Zealand.xiv
xiii
Fusco, A., A-C. Guio and E. Marlier(2010). ‘Income Poverty and Deprivationin European Countries’,EurostatMethodologies and Working Papers,European Commission, Luxembourg.epp.eurostat.ec.europa.eu/cache/ITY_OFFPUB/KS-RA-10-030/EN/KS-RA-10-030-EN.PDF
vii
3 6
I n n o c e n t I
R e p o R t
c a R d
1 0
A C K N O W L E D G E M E N T S
TheReport Card 10project wascoordinated by the UNICEF Office ofResearch Innocenti, and assisted bya panel of advisors and reviewers.Research was completed at the endof December 2011.The full text and the background papers tothis report can be downloaded from theUNICEF Innocenti Research Centrewebsite at www.unicef-irc.org.Research and data analysisPeter Adamson(independent consultantto UNICEF Office of Research Innocenti)Jonathan Bradshaw(University of York)Yekaterina Chzhen(University of Oxford)Gill Main(University of York)Bruno Martorano(UNICEF Office ofResearch Innocenti)Leonardo Menchini(Chief, Social Policy,Monitoring and Evaluation, UNICEF Egypt,formerly UNICEF Office of ResearchInnocenti)Chris de Neubourg(Chief, Social andEconomic Policy Unit, UNICEF Office ofResearch Innocenti)Support in background researchBethelhem Ketsela Moulat, Ilze PlavgoandJan Oliver Suer(UNICEF Office ofResearch Innocenti)Support on individual country datasources and statisticsAya Abe(National Institute of Populationand Social Security Research, Japan),who kindly provided a paper with thestatistical results on child income povertyfor Japan.Bryan Perry(Ministry of SocialDevelopment, New Zealand), who kindlyprovided a paper with the statisticalresults on child income poverty forNew Zealand.UNICEF National Committees forAustralia, Canada and New Zealandsupported the UNICEF Office of ResearchInnocenti in gaining access to the relevantdata sources for their respectivecountries.
UNICEF advisorsGordon Alexander(Director, UNICEFOffice of Research Innocenti)James Elder(Chief, Communication Unit,UNICEF Office of Research Innocenti)External advisorsFerran Casas(University of Girona)Kenneth Couch(University of Connecticut)Donald Hernandez(City University ofNew York)Gareth Jones(Consultant, UNICEF Officeof Research Innocenti)Robert Joyce(Institute for Fiscal Studies,London)Geranda Notten(University of Ottawa)Dominic Richardson(Organisation forEconomic Co-operation andDevelopment)Keetie Roelen(Institute of DevelopmentStudies, Brighton)Kitty Stewart(The London School ofEconomics and Political Science)
Administrative support at the UNICEFOffice of Research Innocenti was providedbyCinzia Iusco Bruschi and Laura Meucci.
Previous issues in this series:Innocenti Report Card 1A league table of child poverty in rich nationsInnocenti Report Card 2A league table of child deaths by injury in rich nationsInnocenti Report Card 3A league table of teenage births in rich nationsInnocenti Report Card 4A league table of educational disadvantage in rich nationsInnocenti Report Card 5A league table of child maltreatment deaths in rich nationsInnocenti Report Card 6Child poverty in rich countries 2005Innocenti Report Card 7Child poverty in perspective: An overview of childwell-being in rich countriesInnocenti Report Card 8The child care transition: A league table of early childhoodeducation and care in economically advanced countriesInnocenti Report Card 9The children left behind: A league table of inequality inchild well-being in the world’s rich countries
Graphics: MCC Design, UK (mccdesign.com)Printed by: ABC Tipografia, Sesto Fiorentino, Florence, Italy
Innocenti Report Card 10,2012Measuring Child PovertyNew league tables of child povertyin the world’s rich countries
UNICEF Innocenti Research CentrePiazza SS. Annunziata, 1250122 Florence, ItalyTel: (+39) 055 20 330Fax: (+39) 055 2033 220[email protected]www.unicef-irc.orgISSN 1605-7317� The United Nations Children’s Fund (UNICEF)May 2012
ISBN: 978-88-8912-965-4
Sales No. E.11.XX.2USD 20.00IRC stock number 654U