Skatteudvalget 2011-12
SAU Alm.del Bilag 177
Offentligt
Energy Taxation andGreen Growth:Current OECD WorkDanish Parliamentary TaxCommittee30 January 2012
Outline••••The challenge – Environmental OutlookThe framework – Green Growth StrategyFossil fuel support (including tax expenditures)Environmental taxation– Principles– Trends– Mapping energy use and taxation
• Some upcoming projects
2
Environmental Outlook to 2050: IntroductionApproach and the modelling methodology
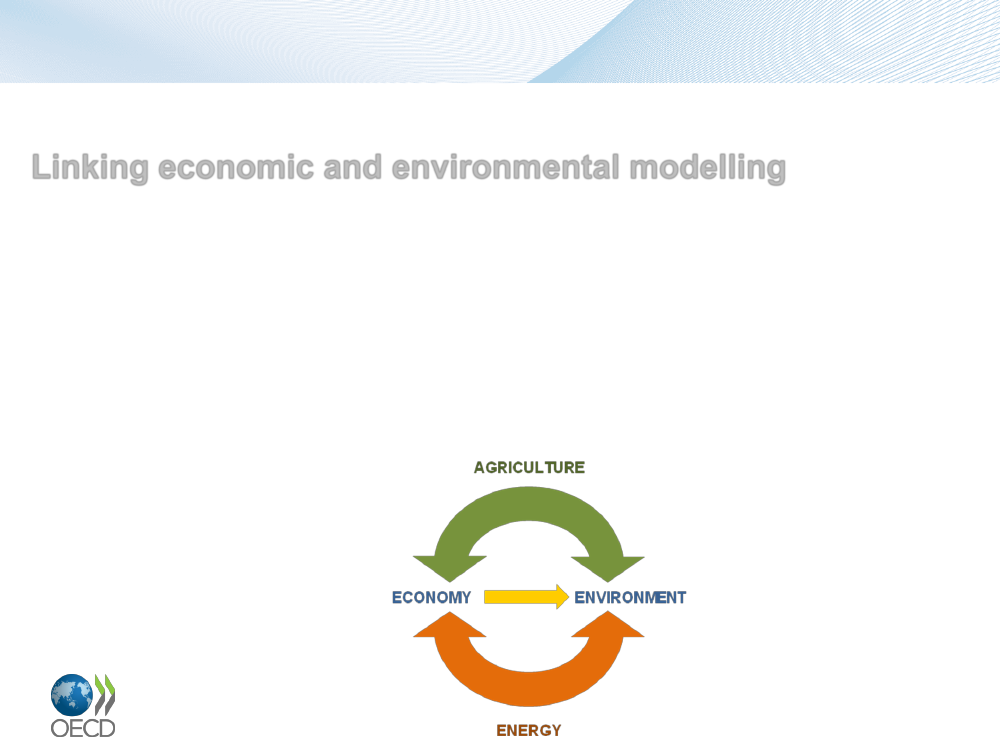
Linking economic and environmental modelling• a general equilibrium economic modelling framework (ENV-LINKAGES at the OECD/ENV)• a comprehensive environmental modelling framework(IMAGE suite of models at the Netherlands EnvironmentalAssessment Agency)Figure 1. Modelling principle for the EnvironmentalOutlook
3
Environmental Outlook to 2050: IntroductionStructure of the Report
••••••••
Executive Summary1. Introduction2. Socioeconomic Developments3. Climate Change4. Biodiversity5. Freshwater6. Health and EnvironmentAnnex on the Modelling Framework4
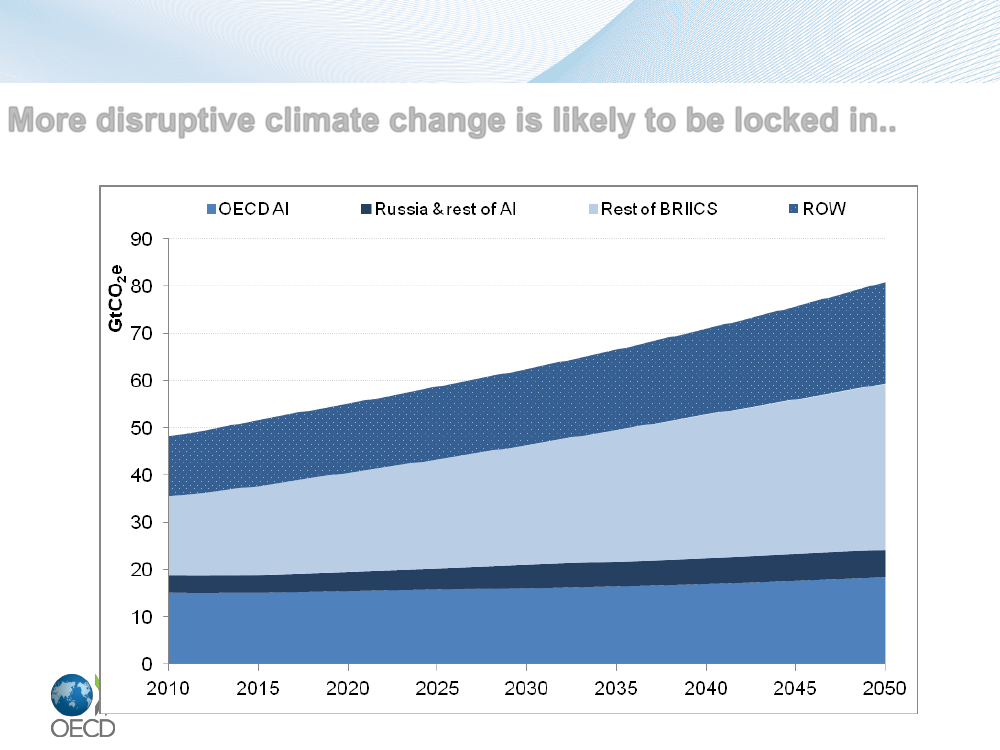
Environmental Outlook to 2050More disruptive climate change is likely to be locked in..Figure 1. GHG emissions by region:Baselinescenario
5Source:OECD Environmental Outlook Baseline; output from ENV-Linkages
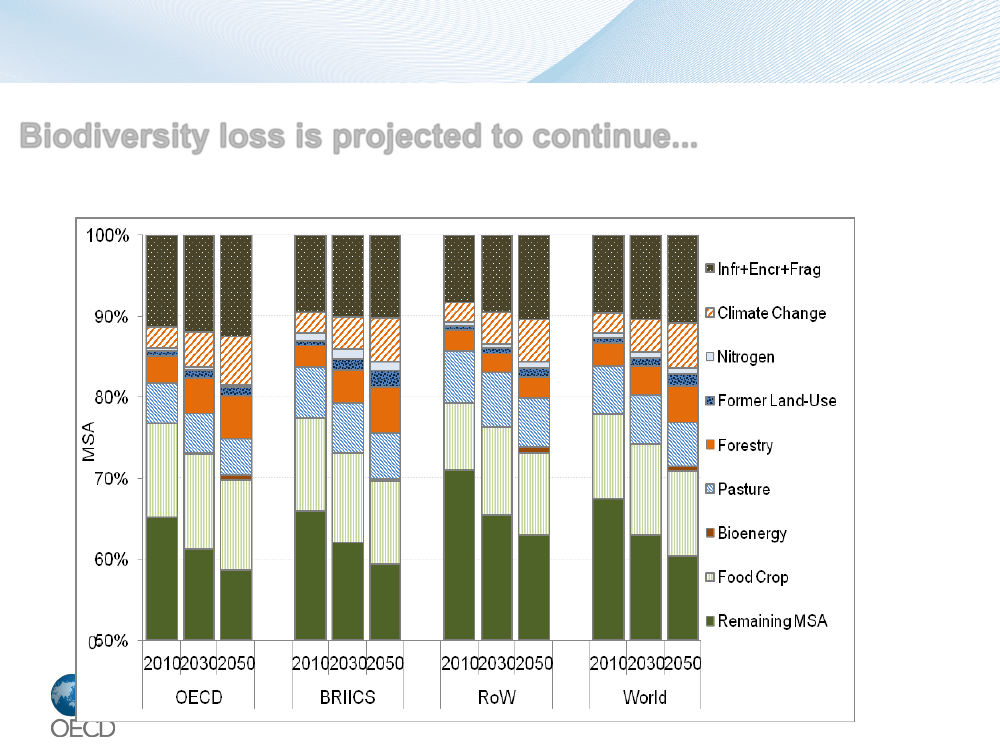
Environmental Outlook to 2050Biodiversity loss is projected to continue...Figure 2. Pressures on terrestrial Mean Species Abundance (MSA); Baseline scenario
6Source:OECD Environmental Outlook Baseline; output IMAGE suite of models
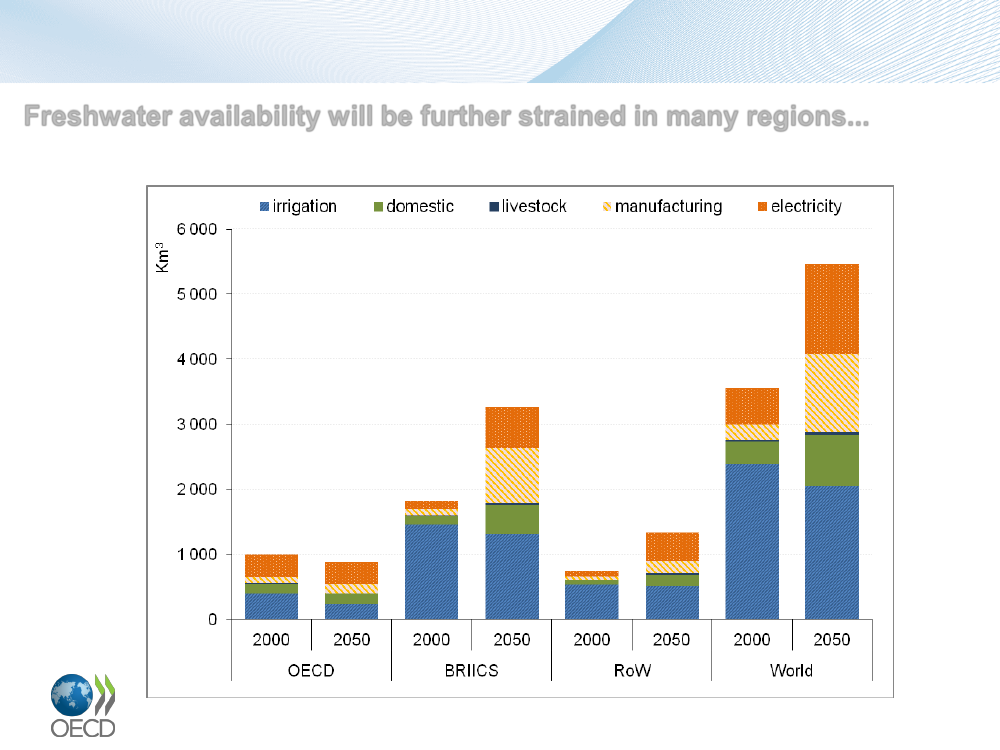
Environmental Outlook to 2050Freshwater availability will be further strained in many regions...Figure 3. Global water demand in 2050:Baselinescenario
7Source:OECD Environmental Outlook Baseline; output IMAGE suite of models
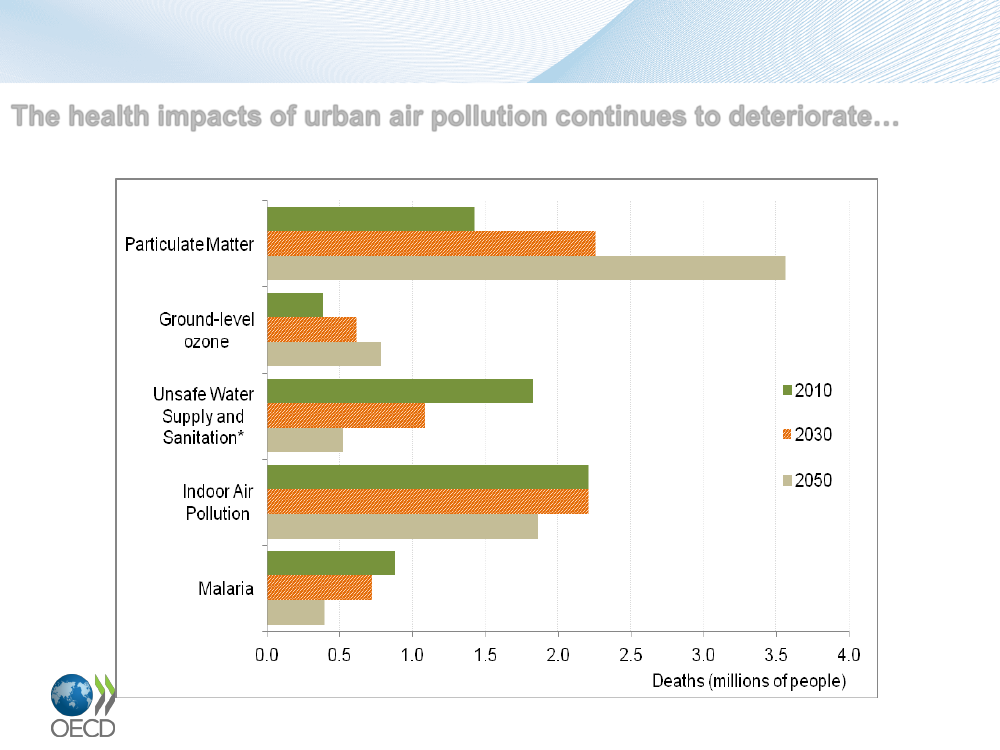
Environmental Outlook to 2050:Executive SummaryThe health impacts of urban air pollution continues to deteriorate…Figure 4. Global premature deaths from selected environmental risks, 2010-2050;Baseline
Source:OECD Environmental Outlook Baseline; output IMAGE suite of models
8
Policy steps to build a low-carbon economy
1. Set clear, long-term, more stringent and economy-wide GHG mitigation targets2. Put a price on carbon, preferably through market-based instruments3. Reform fossil fuel support policies4. Foster innovation and support new clean technologiesin a « technology-neutral » way5. Complement carbon pricing with well-designedregulations
9
The Framework – Green Growth Strategy• The Green Growth Strategy was launched atthe OECD’s May 2011 Ministerial CouncilMeeting• Practical framework for governments to boosteconomic growth and protect the environment• Help countries foster economic growth whilepreserving the environmental assets on whichour well-being relies• Strategy includes two cost-effective policyavenues of special relevance when fiscalresources are stretched:– Reform of environmentally harmful subsidies– Use of environmentally related taxes to incorporatethe cost of environmental damage into market prices10www.oecd.org/greengrowth
Environmentally harmful subsidies• Addressing environmental challenges involves not only newpolicies, but also reform of existing policies that move us in thewrong direction• In September 2009 G20 leaders committed to “rationaliseandphase out over the medium term inefficient fossil fuel subsidies thatencourage wasteful consumption”• Reform offers opportunity for three “wins”:– improve environmental outcomes– increase economic efficiency– improve fiscal balance• IEA has estimated value of consumer price supports for fossil fuelsin developing countries - USD 409 billion in 2010
11
OECD inventory of fossil fuel support• Until recently, no consolidated source forfossil fuel support measures in OECDcountries• Support in developed countries often inmore subtle forms such as taxconcessions• OECDInventory of Estimated BudgetarySupport and Tax Expenditures for FossilFuelsreleased October 2011• 250 reported tax expenditures andbudgetary transfers that supportconsumption and production of fossil fuelsin 24 OECD countries• Extension to remaining 10 members(including Denmark) underway
www.oecd.org/g20/fossilfuelsubsidieswww.oecd.org/iea-oecd-ffss12
Market-based instruments• From an economic point of view, pollution and environmentaldamage is a pricing problem: markets do not take pollutioninto account because it is not factored into prices• Market-based instruments (environmentally related taxes andtradable emission permits) can be used to incorporate thecost of environmental damage into market prices• These are among the most cost-effective policy approachesfor integrating economic and environment policy objectives– Cost-effectiveness is critical when environmental challenges arelarge, government budgets are strained and economic growth isweak
13
Environmental tax work• OECD has produced a considerable body of work onenvironmentally related taxes• Key books:–Taxation, Innovation and the Environment(2010)–The Political Economy of Environmentally Related Taxes(2006)–Environmentally Related Taxes in OECD Countries(2001)
• Recent policy briefs:–Environmental Taxation – A Guide for Policy Makers (Sep 2011)–Taxation, Innovation and the Environment – A Policy Brief (Sep2011)
• For more information:–www.oecd.org/tax14
Environmental taxes - benefits• Taxes directly address the market failure by “pricing in”environmental costs• Taxes leave consumers and businesses with flexibility todetermine the least-cost way to reduce environmentaldamage– Ongoing incentive to abate– Strong incentive to innovate– Improves competitiveness of low-emission alternatives
• Transparency• Cost certainty vs. environmental certainty• Environmental tax revenues can assist fiscal consolidation orhelp to reduce other taxes
15
Environmental taxes - design• Environmental tax bases should be targeted to thepollutant or polluting behaviour• The scope of an environmental tax should ideally be asbroad as the scope of the environmental damage• Environmental taxes should apply uniformly with few (ifany) exceptions• The tax rate should be commensurate with the damage- reflecting environmental and non-environmentalexternalities, and revenue raising considerations• The tax must be credible and its rate predictable in orderto motivate environmental improvements
16
Environmental taxes - challenges• Distributional impacts should be carefully examined– Distributional concerns can and generally should be addressed throughpolicies outside the tax system, potentially using tax revenuesgenerated
• Competitiveness concerns need to be carefully assessed– International coordination and transitional relief can be effectiveresponses; be careful with recycling revenues back to industry and ratereductions or exemptions
• Clear communication is critical to public acceptance ofenvironmental taxation• Environmental taxes may need to be combined with otherpolicy instruments to address certain issues– Information failures, principal-agent problems, fundamental innovation
17
Database of environmental policy instruments• OECD/European Environment Agency (EEA) databaseof instruments for environmental policy:www.oecd.org/env/policies/database• Important public tool for comparative policy analysis• Good coverage of environmental taxes
18
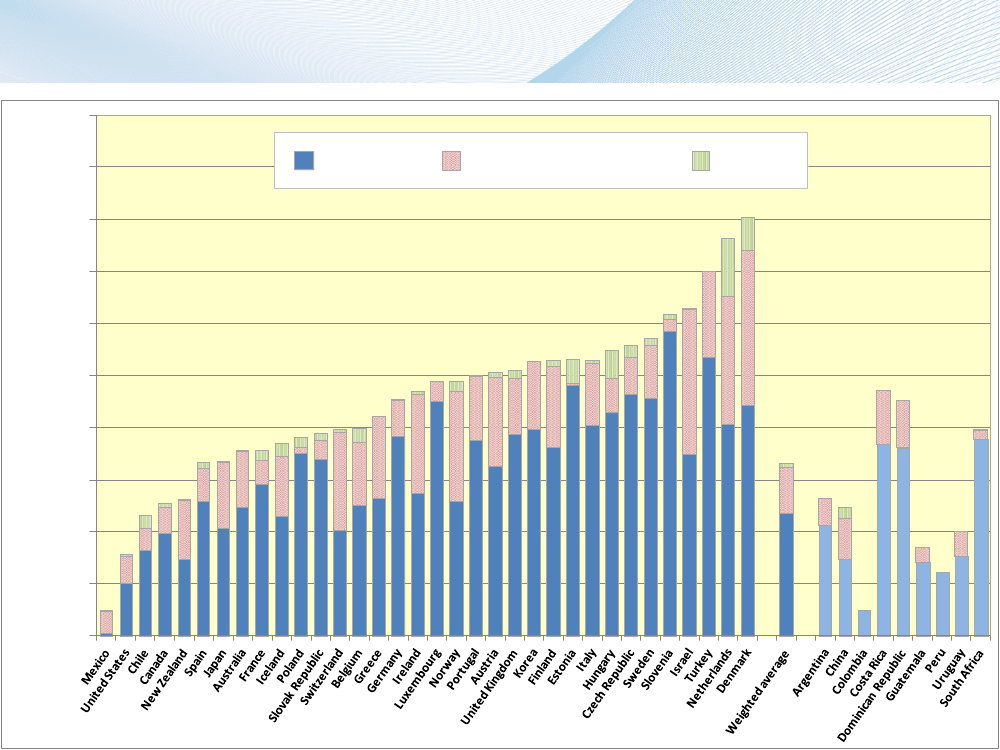
Revenues from environmental taxesIn per cent of GDP, 20095.0
4.54.03.5
Energy
Motor vehicles
Other
Per cent of GDP
3.02.52.01.51.0
0.50.019
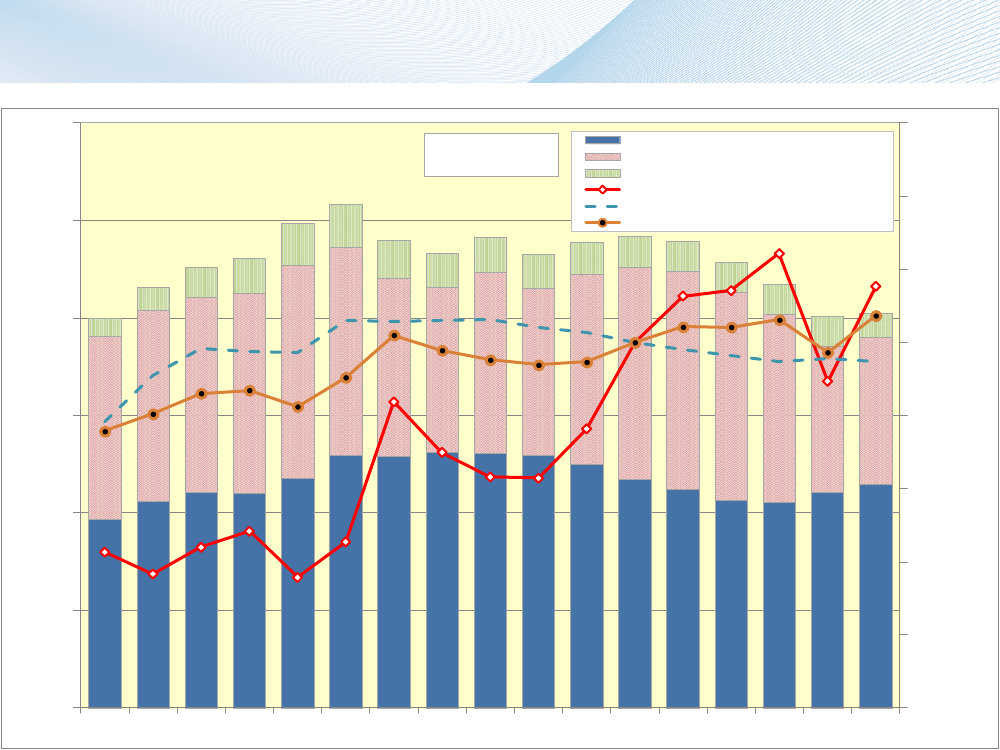
Drivers of revenues from energy taxesIn per cent of GDP, 1994-20106
Denmark5
Energy productsMotor vehicles and transportOtherRotterdam spot price, real, Index, 2005=100Real household petrol excise, Index, 2005=100Real household petrol price, Index, 2005=100
160
140120
4100
Index, 2005=100
Per cent of GDP
3
8060
2
4012001994 1995 1996 1997 1998 1999 2000 2001 2002 2003 2004 2005 2006 2007 2008 2009 2010
200
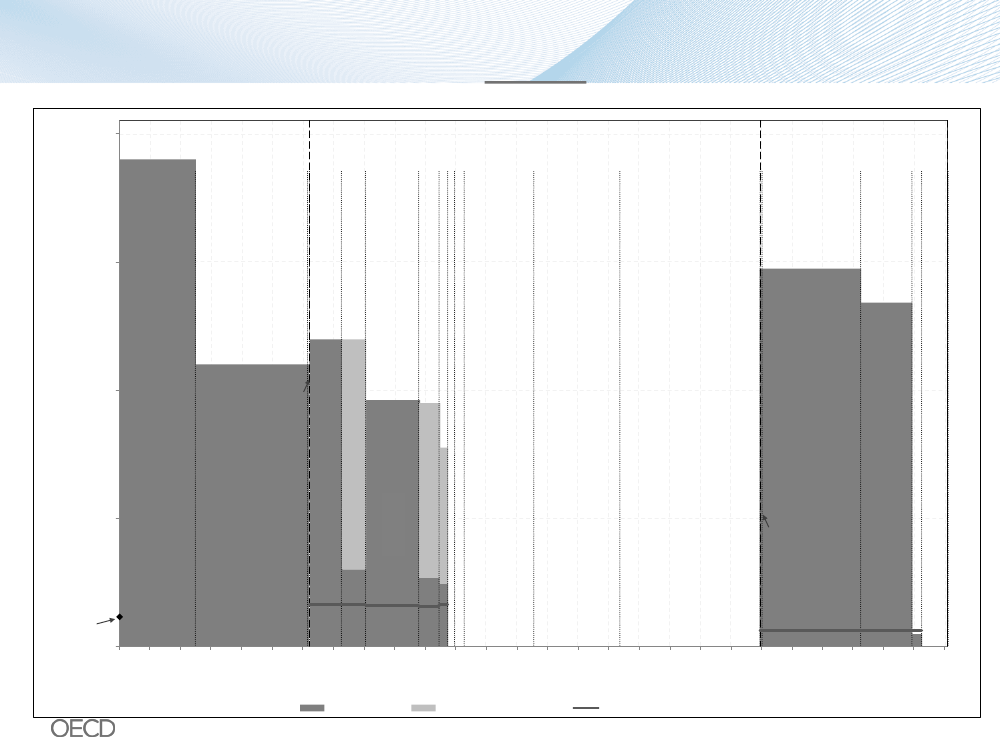
“Mapping” energy use and taxation• The largest group of environmentally related taxes is taxes on energy• Work underway to develop “maps” that provide a common framework forexamining the use and taxation of energy, including fossil fuels, withineach country• The maps are a powerful analytic tool:– To understand the composition of energy use and related CO2emissions– To illustrate the structure of energy taxation (coverage, implicit tax rates on differentfuels and users, tax expenditures)– To establish a foundation for discussion of the rationale for tax settings on differenttypes, users and uses of energy
• The maps show (in terms of CO2or energy content):– The tax base (energy use in various sectors, based on IEA stats) on the horizontalaxis– The effective tax rates applied to that energy use on the vertical axis21
Tax rate expressed as carbon content (DKK per tonne of CO2)1 0001 5002 000500
Average EU ETSallowance spotprice for 2010and 2011(DKK114)0
0Motor Gasoline
TRANSPORT
Diesel oil
10 000
Domestic aviation & combustibles [ETS-P]Natural gas f or heatingIndustrial gas use [ETS-P]
DRAFT FOR CONSULTATION
Example: Preliminary map of energy use and taxation inDenmark by carbon content
Tax base (energy use) expressed in terms of carbon content (thousand tonnes CO2)Tax
Oil f or heating [ETS-P]20 000
Industrial oil use [ETS-P]Coal [ETS-P]Industrial combustible use
Tax rebate
Diesel used in f ishing
Other gas, combustibles and renewables f orheating
HEATING & PROCESS USE
30 00040 00050 000
Fuel used f or transf ormation [ETS-A]
Fuels used to generate heat [ETS-A]
Transport [ETS-A]Industry and commercial [ETS-A]
ELECTRICITY
Residential [ETS-A]
CO2 taxes shown below; energy content & other taxes above
22
Information in these maps is in draft form and is currently the subject of consultation with SkatteministerietAgriculture [ETS-A]Transf ormation sector [ETS-A]
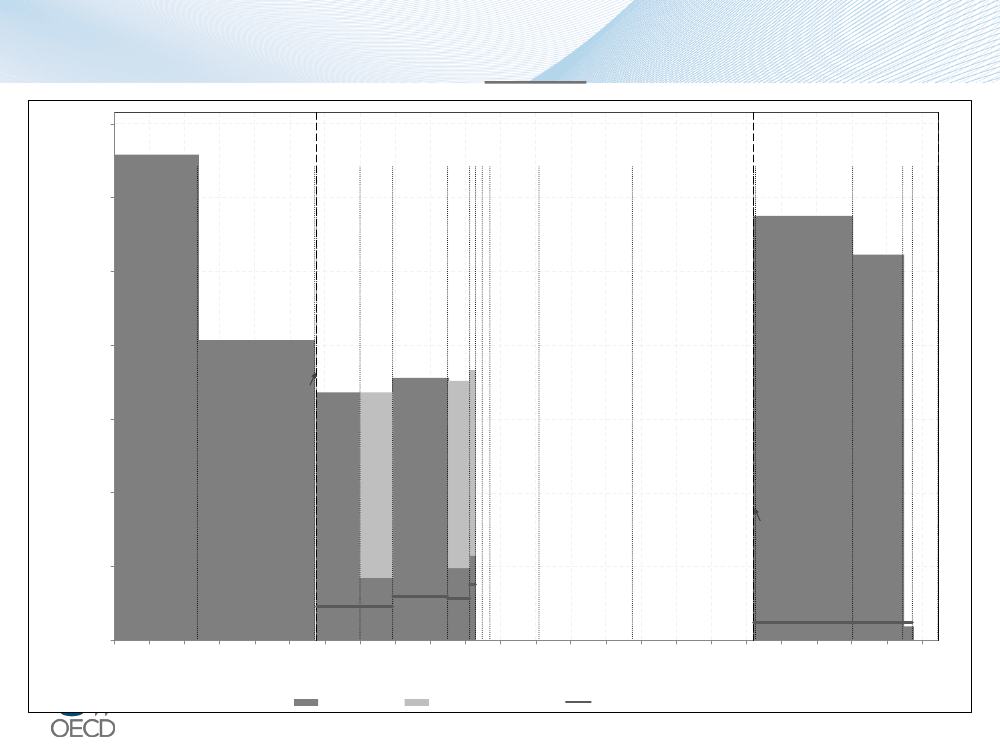
Tax rate expressed as energy content (DKK per GJ)60100
120
140
20
40
80
0
0Motor Gasoline
TRANSPORT
Diesel oil
150 000Domestic aviation & combustibles [ETS-P]
DRAFT FOR CONSULTATION
Example: Preliminary maps of energy use and taxation inDenmark by energy content
Tax base (energy use) expressed in terms of energy content (TJ)Natural gas f or heatingIndustrial gas use [ETS-P]Oil f or heating [ETS-P]Industrial oil use [ETS-P]Diesel used in f ishing
Tax
300 000
Tax rebate
Coal [ETS-P]Industrial combustible use
Gas, combustibles & renewables f or heating
HEATING & PROCESS USE
Fuel used f or transf ormation [ETS-A]
450 000Fuels used to generate heat [ETS-A]Transport [ETS-A]
600 000
Industry and commercial [ETS-A]
ELECTRICITY
Residential [ETS-A]Agriculture [ETS-A]Transf ormation sector [ETS-A]
23CO2 taxes shown below; energy content & other taxes above
Information in these maps is in draft form and is currently the subject of consultation with Skatteministeriet
Cross-country observations•
Draft maps have been prepared for 16 countriesGeneral observations:Observation
Generally taxed more heavily than heating and process fuel use.
•
Transport
Motor gasoline and diesel taxed in all countries examined;diesel generally taxed at a lower rate than gasoline both on a carbon andenergy content basis.In a few countries, heating and process fuels are not taxed.
Heating andprocess
No general trend that heating use is taxed at a lower rate than processuse or vice versa.Level of taxation is often higher for petroleum products than other energyproducts.Of the countries considered, 10 of 16 tax electricity consumption.
Electricity
Fuels used to generate electricity are generally not taxed except in threeof the countries considered.24
Development and use of the maps• Work underway on refinement of methodology andextension to other member countries• Going forward, the maps will facilitate analysis andpolicy discussion on issues including:– overall levels of taxation on fuel consumption– the impact of taxation in addressing different types ofexternalities– relative taxation of gasoline and diesel– low or non-taxation of fuel used for heating, agriculture andindustrial use in some countries
25
Some upcoming projects• Taxation of company cars and commutingexpenses– Surveying countries and determining extent to whichcurrent tax settings may be encouraging greater caruse or otherwise favouring more environmentallycostly forms of transportation
• Environmentally motivated tax preferences– What works and what doesn’t
26
Energy Taxation andGreen Growth:Current OECD WorkDanish Parliamentary TaxCommittee30 January 2012For further information:[email protected](Centre for Tax Policy andAdministration)[email protected](Environment Directorate)