Skatteudvalget 2011-12
SAU Alm.del Bilag 177
Offentligt
Tax trends in OECD countries:The Slowdown in Economic Growth, HighUnemployment and Large Budget Deficits:How have Tax Policymakers Reacted?Bert BrysCentre for Tax Policy andAdministration
Structure of presentationI.II.How does the Danish tax system compare
Challenges for tax policy and backgroundeconomic information
to the tax system in other OECD countries?Trends in tax policies and tax revenues
III. Recent (2011-2012) developmentsIV. Tax policy issues for discussion
I. Challenges for tax policySlowdown in economic activityLarge budget deficits and rising debt ratiosHigh unemploymentGlobalisation and tax competition –capital mobility, emerging economies, etc.• Growing income inequality in manycountries• Population ageing• Climate change and the environment••••
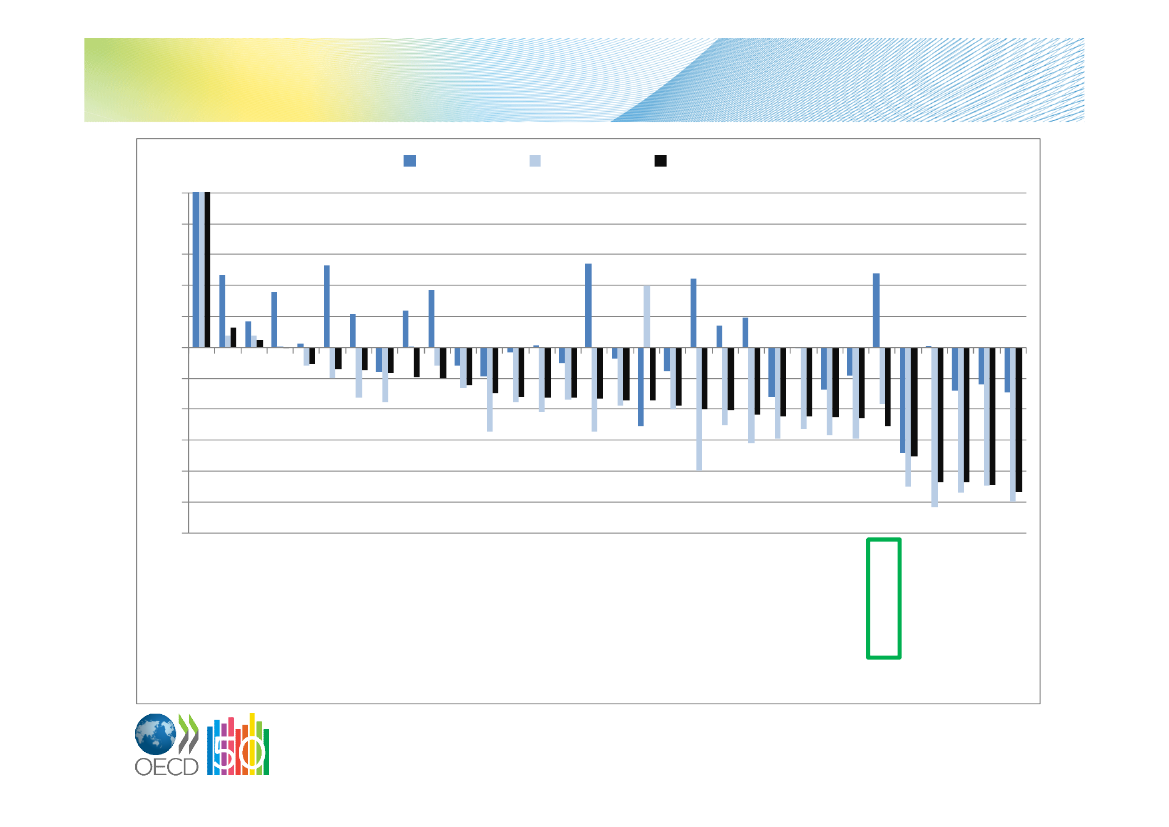
I. Large budget deficits in some countries20071086420-2-4-6-8-10-12Government net lending in 2007, 2011 and projection for 2012as a % of GDP (Economic Outlook December 2011)20112012 projection
Projection for Denmark: 5% deficit in 2012and 3% deficit in 2013NorwayKoreaSwitzerlandSwedenGermanyFinlandAustraliaItalyEstoniaLuxembourgTurkeyPolandBelgiumNetherlandsAustriaIcelandCzech RepublicHungaryIsraelNew ZealandCanadaSpainPortugalSloveniaFranceSlovak RepublicDenmarkGreeceIrelandUnited KingdomJapanUnited States
Sorted in data for 2012 projection; figures for Norway: +17.5% (2007), +12.5% (2011) and +11,5% (2012 projection)
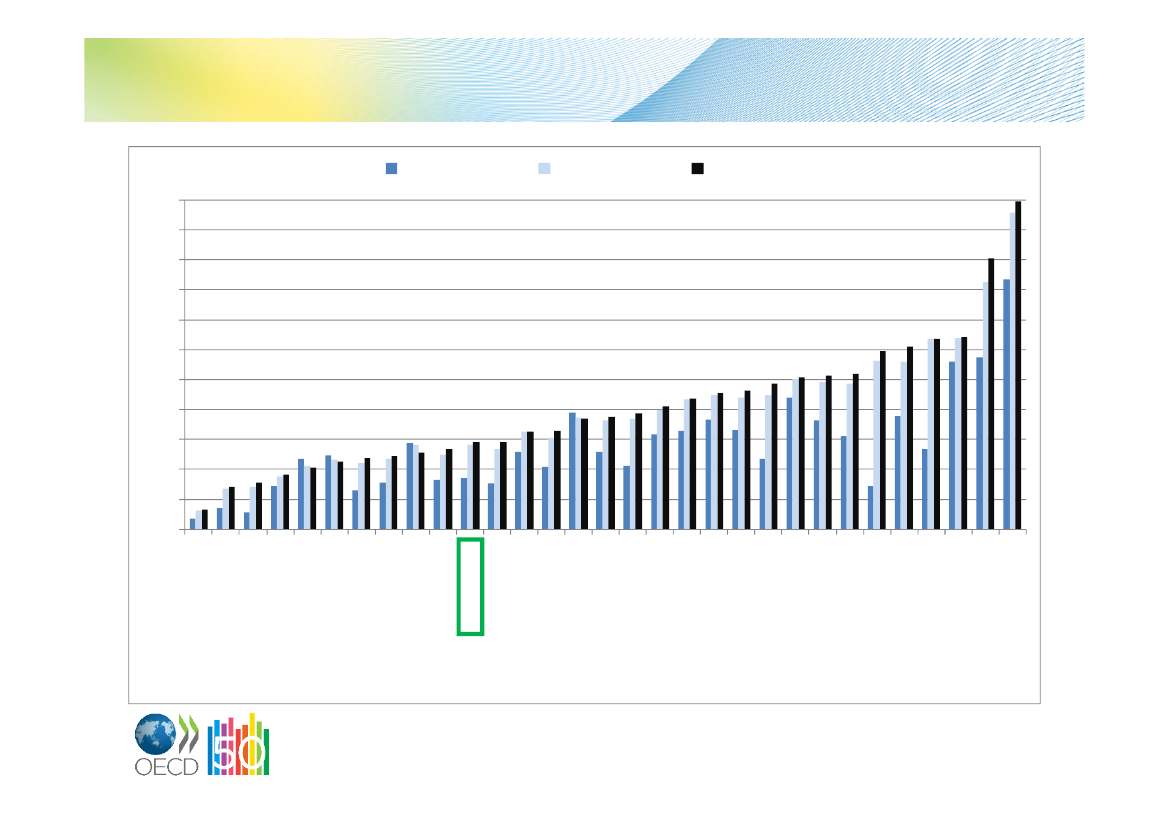
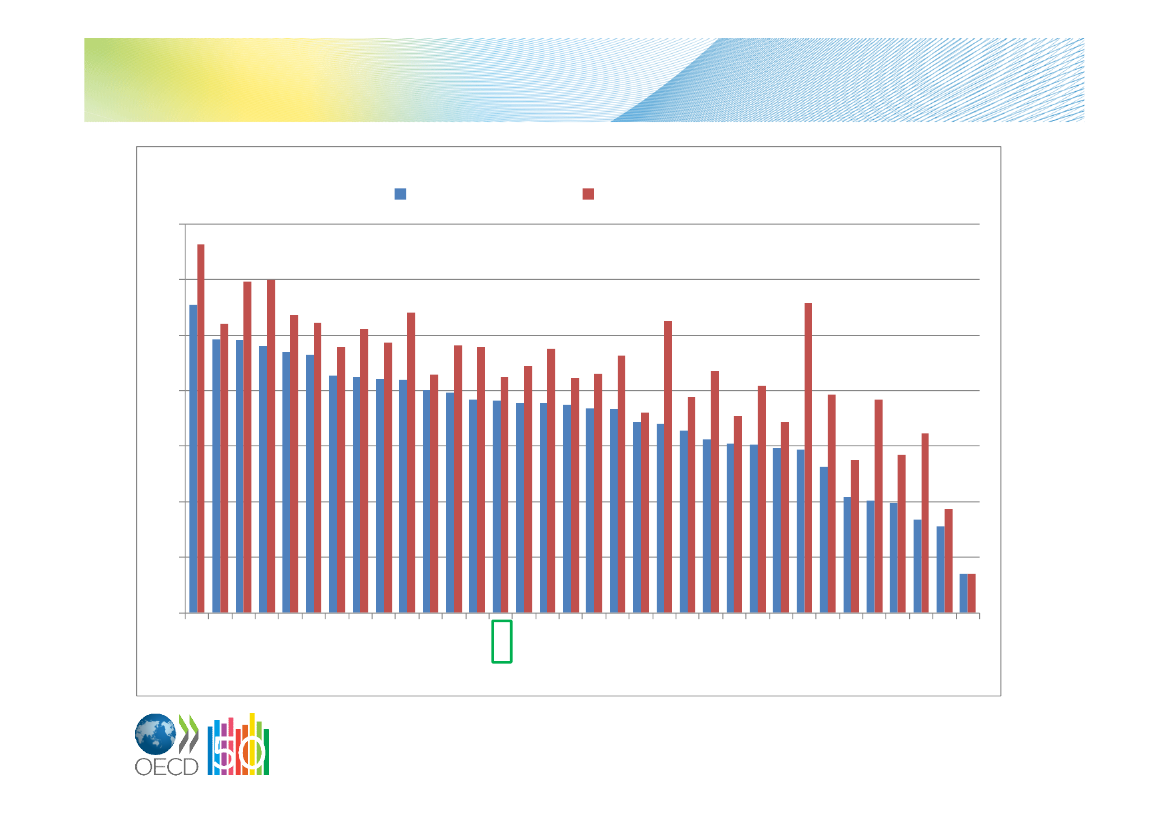
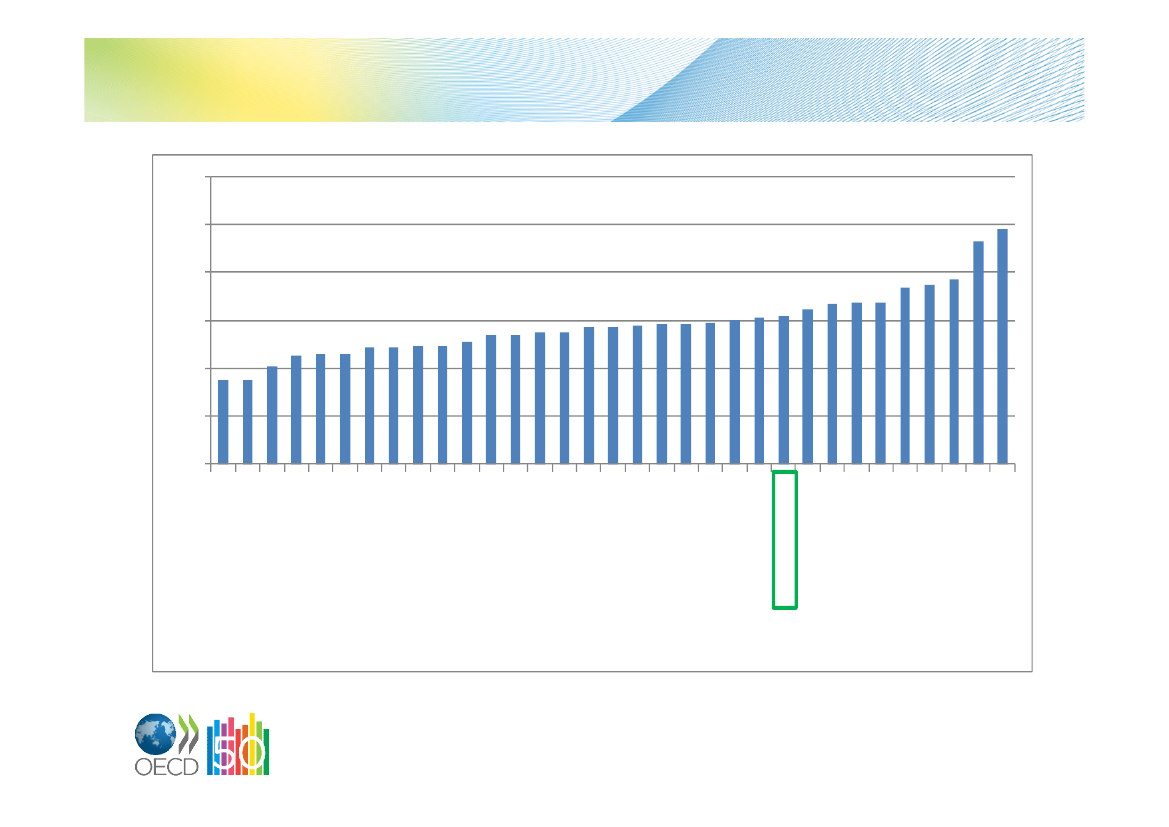
I. Strong increase in public debt2007220200180160140120100806040200EstoniaAustraliaLuxembourgKoreaSwitzerlandSwedenNew ZealandCzech RepublicNorwaySlovak RepublicDenmarkSloveniaPolandFinlandIsraelNetherlandsSpainAustriaGermanyHungaryCanadaUnited KingdomBelgiumFranceUnited StatesIrelandPortugalIcelandItalyGreeceJapan
2011
2012 projection
General government gross financial liabilities (as a % of GDP)(Economic Outlook December 2011)
Strongly increased but still low debtlevel in Denmark:�58%
Sorted in data for 2012 projection
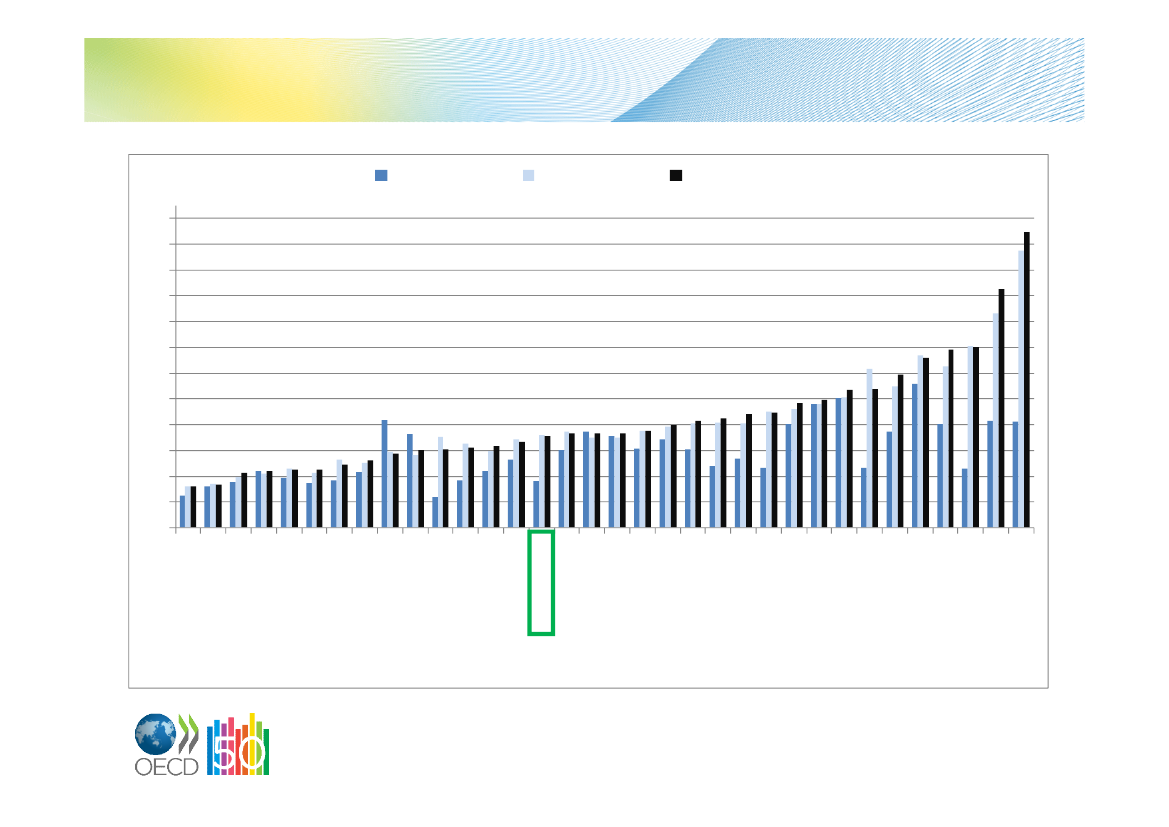
242220181614121086420
Denmark:�7%
2007
Sorted in data for 2012 projection20112012 projectionUnemployment rate; OECD average unemployment rate 5.7% in 2007,8% in 2011 and 8.1% projection in 2012(Economic Outlook December 2011)
I. Increasing rates of unemployment
NorwayKoreaSwitzerlandAustriaJapanNetherlandsMexicoAustraliaGermanyIsraelIcelandNew ZealandLuxembourgCzech RepublicDenmarkCanadaBelgiumChileSwedenFinlandItalySloveniaUnited KingdomUnited StatesFrancePolandTurkeyEstoniaHungarySlovak RepublicPortugalIrelandGreeceSpain
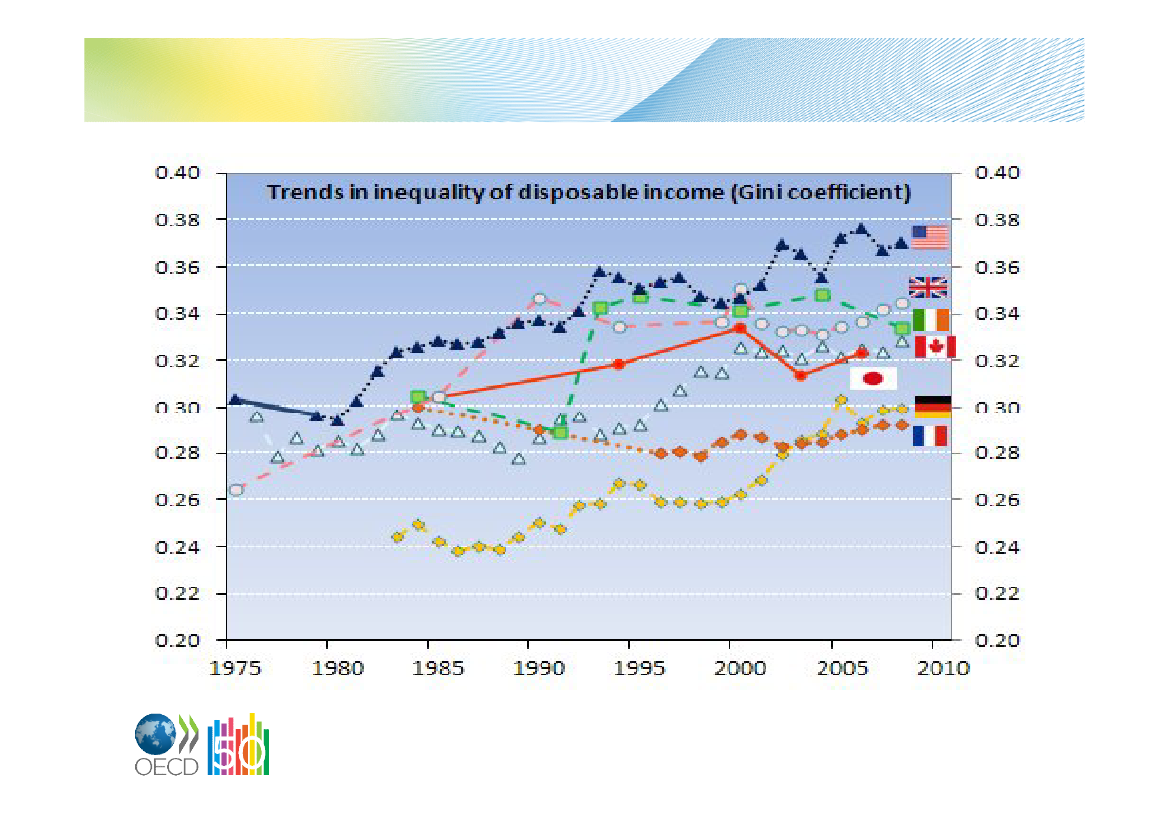
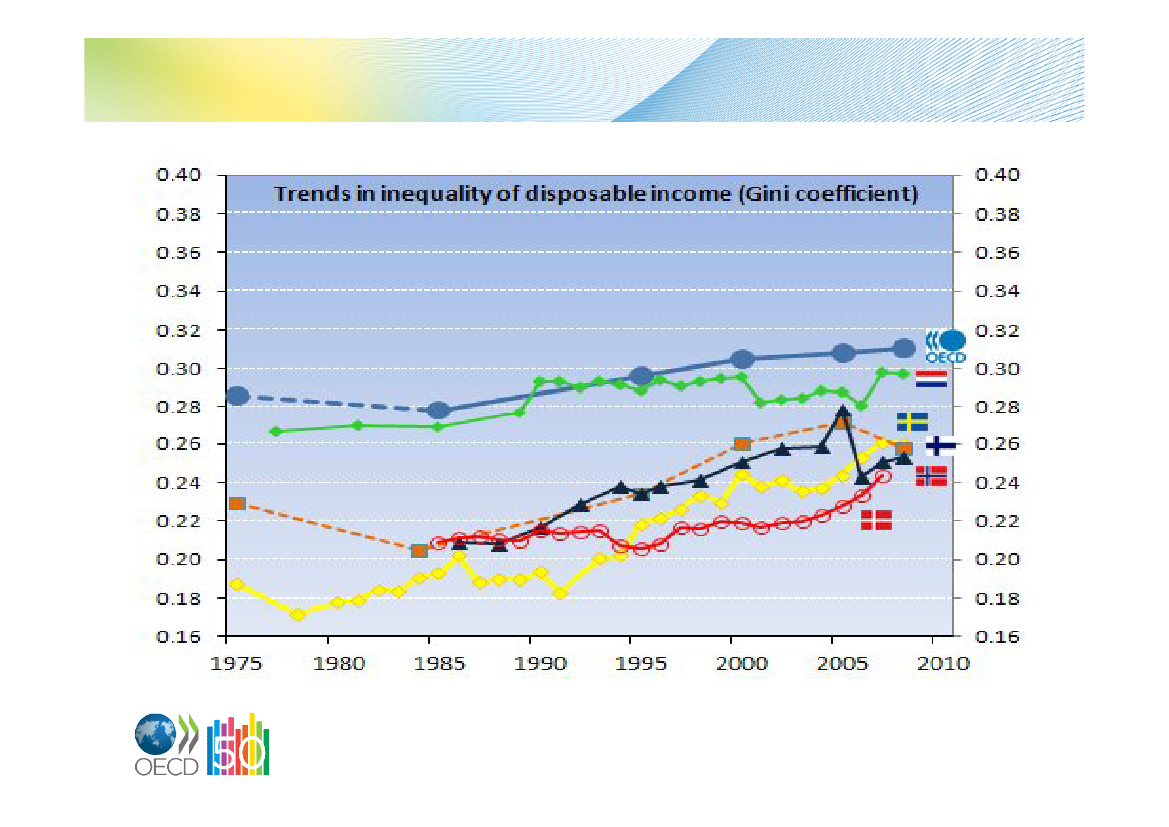
I. Income inequality increased in most OECD countries ...
Source: OECD 2011,Divided we Stand.
… and it increased in many low-inequality countries too
Source: OECD 2011,Divided we Stand.
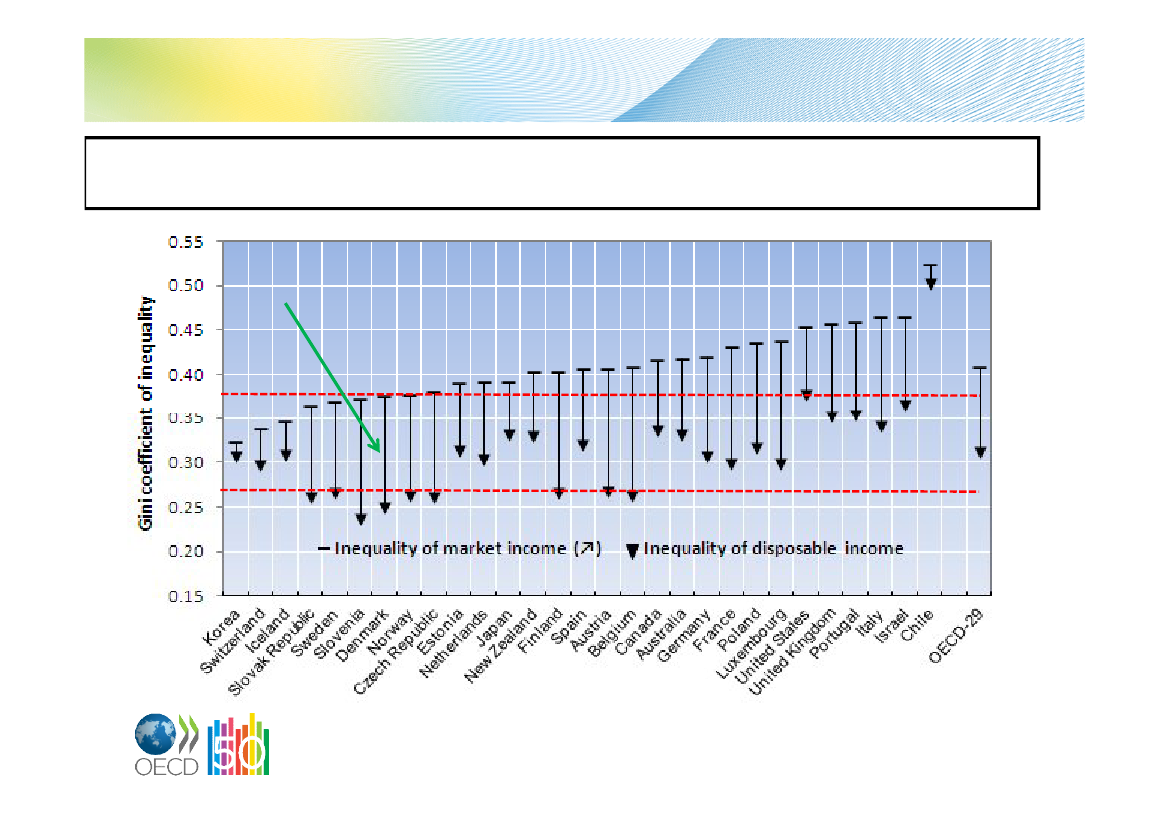
Redistribution through taxes and benefits plays an important roleMarket incomes are distributed more unequally than household net incomes: taxes andbenefits reduce inequality by a quarter
Source: OECD 2011,Divided we Stand.
II.How does the tax system inDenmark compare to the taxsystem in other OECDcountries?+Trends over time
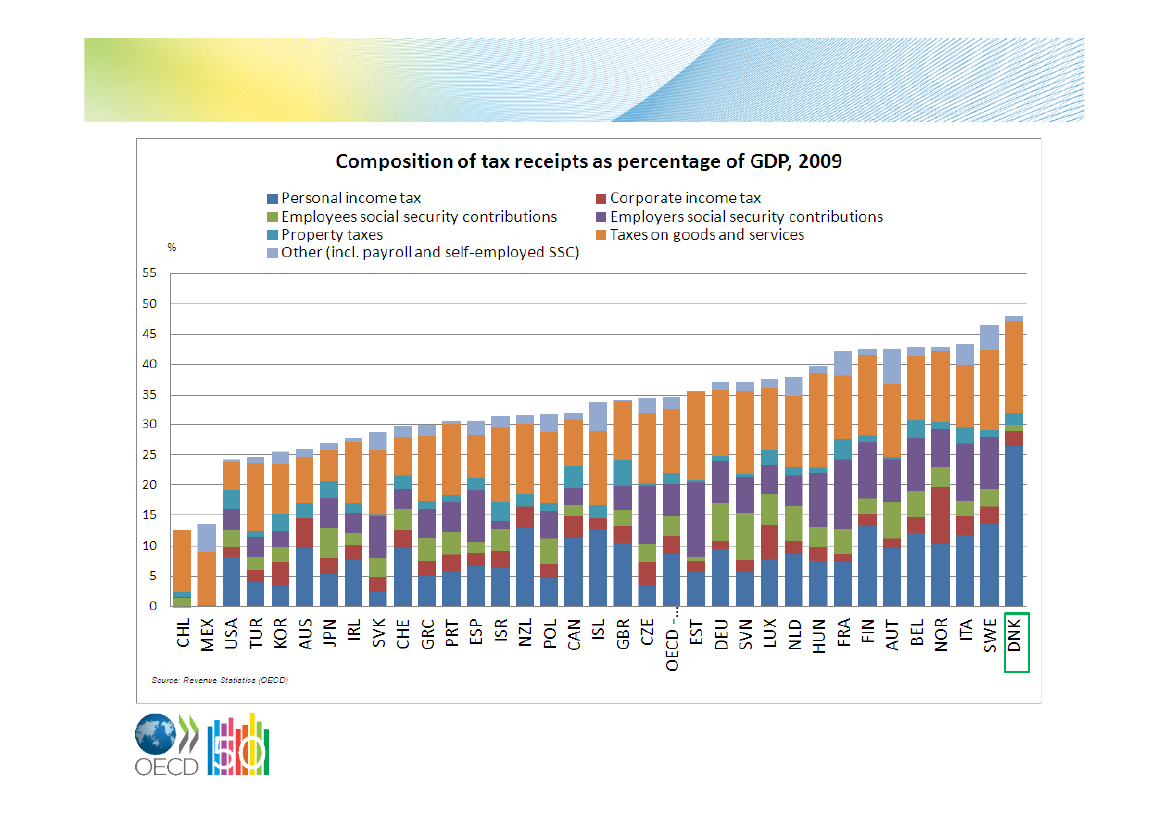
Tax-to-GDP ratio
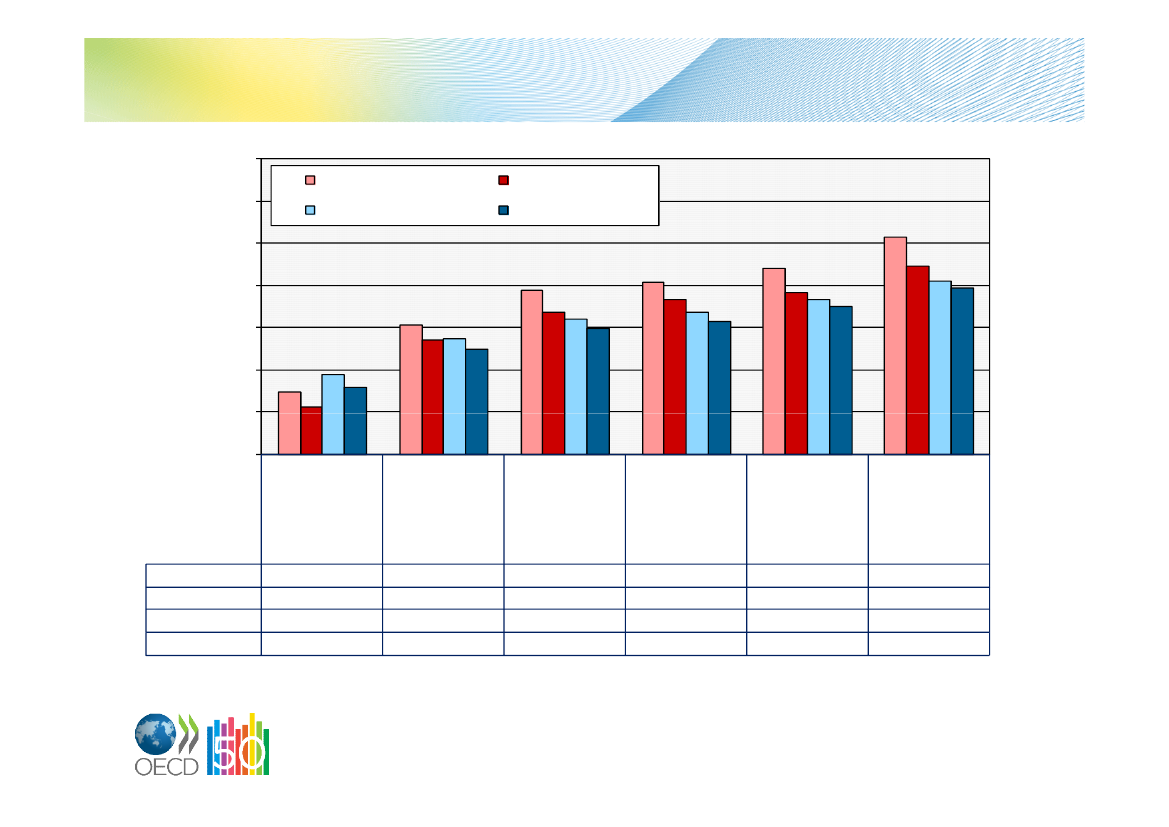
Average tax burden on labour income in Denmark compared tothe OECD on average (2000 and 2010)70%
Denmark 200060%50%40%30%20%10%0%Lone parent2 children67% ofaveragewageDenmark 2000Denmark 2010OECD 2000OECD 201014.7%11.0%18.8%15.8%One-earnercouple2 childrenaveragewage30.7%27.1%27.4%24.8%
Denmark 2010OECD 2010
OECD 2000
Two-earnercouple2 children100% + 67%of averagewage38.7%33.7%32.0%29.8%
Single67% ofaveragewage40.8%36.7%33.5%31.3%
Singleaveragewage44.1%38.3%36.7%34.9%
Single167% ofaveragewage51.4%44.5%41.1%39.4%
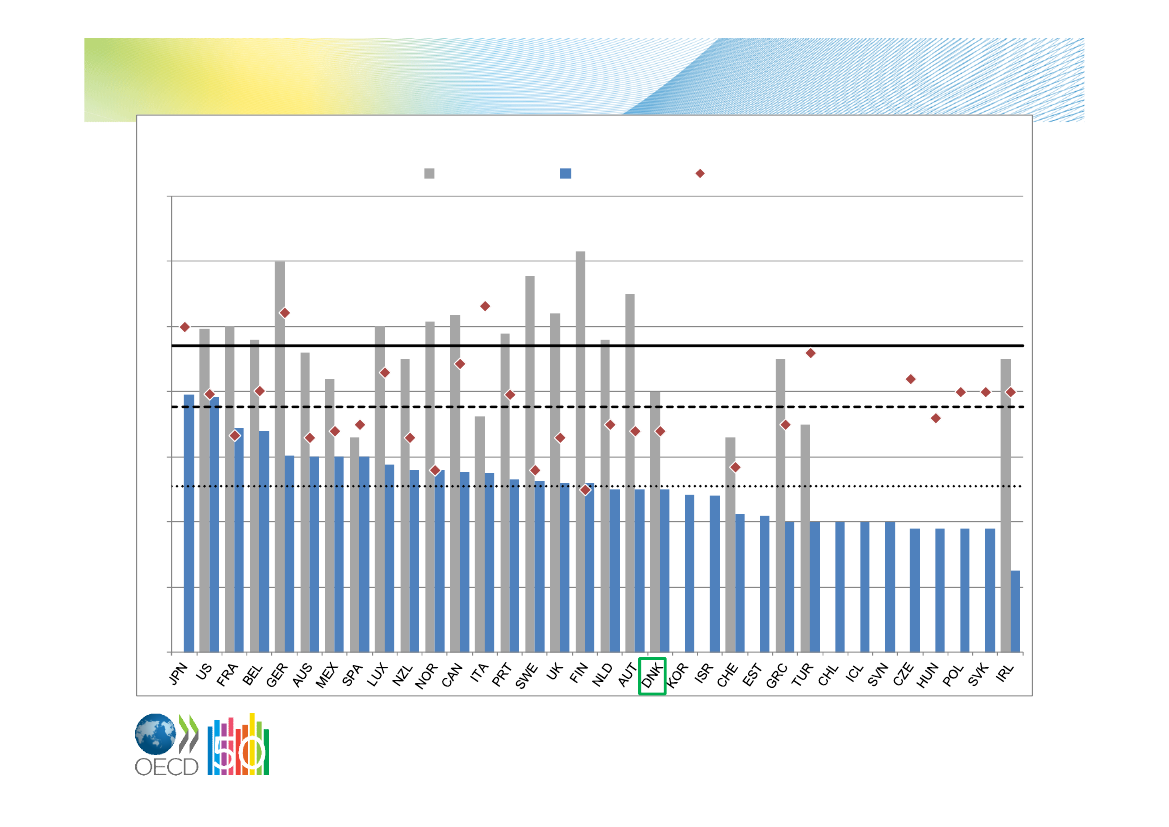
Average and marginal tax wedges for single workers ataverage earnings (2010)Average and marginal tax wedges for a single worker earning the average wage, 2010%
Average tax wedge
Marginal tax wedge
706050403020100BELFRADEUAUTITAHUNSWESVNCZEFINESTESPNLDDNKSVKPRTTURNORGRCPOLLUXGBRISLJPNCANUSAIRLAUSCHEISRKORNZLMEXCHLSource:OECD (2011), Taxing Wages 2010. The tax wedge is calculated as follows: (income tax + employee SSC + employer SSC)/(gross wage earn ings + employer SSC);where SSC = social security contributions.
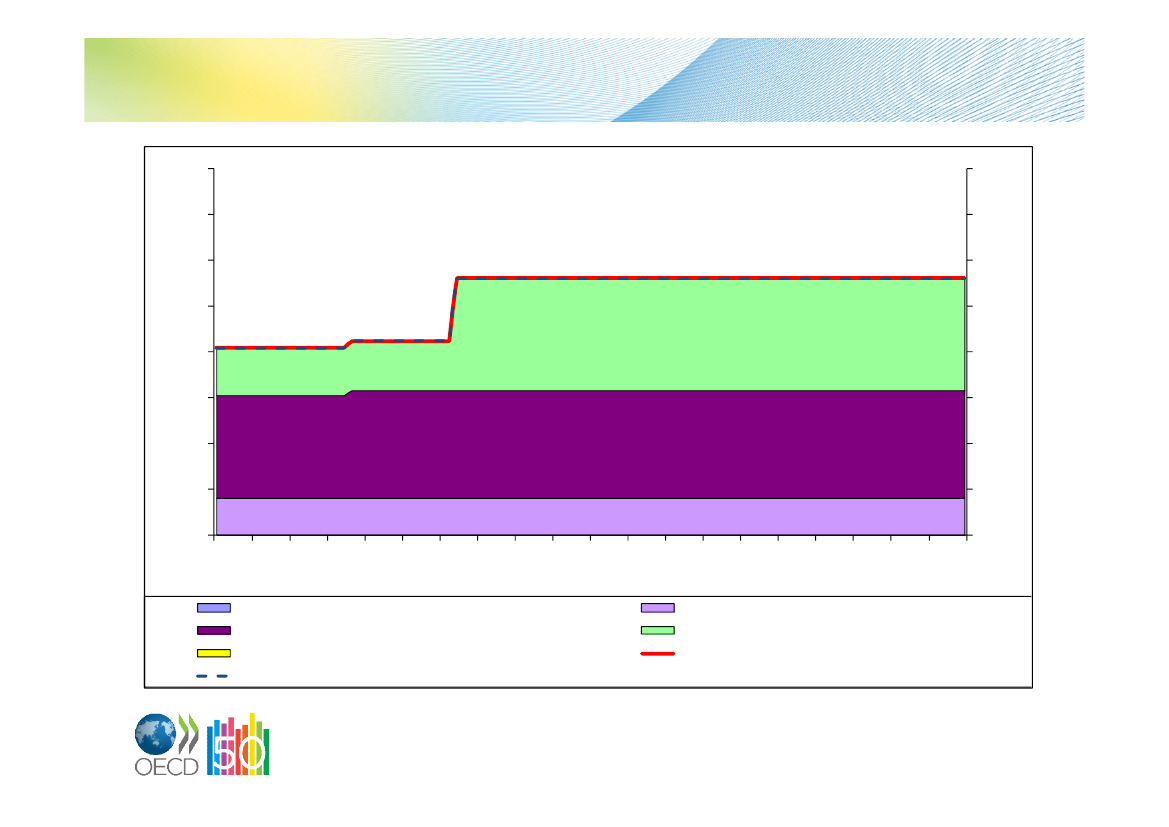
Marginal tax wedges for single workers at differentearnings levels (2010)80%70%60%50%40%30%20%10%0%5060708090100120130140150160170180190200210220230240110
80%70%60%50%40%30%20%10%0%
marginal employer SSCmarginal local income taxmarginal family benefitsnet personal marginal tax rate
marginal employee SSCmarginal central income taxmarginal tax wedge (sum of the components)
Corporate income tax ratesCorporate income tax rates198170
2011
1994
60
50
OECD AVG 1981 - 47.1
40
OECD AVG 1994 - 37.7
30OECD AVG 2011 - 25.5
20
10
0
CIT rates by size of countryStatutory corporate income tax rate2000Larger OECD economiesUS-JPN-GER-UK-FRA-ITA
200436.0
200735.9
201132.8
39.5
Medium-sized OECD economiesCAN-ESP-KOR-MEX-AUS-NLD
35.4
32.8
29.6
27.8
Smaller OECD economiesAUT-BEL-CHE-CHL-CZE-DNK-EST-FIN-GRC-HUN-ISL-IRL-ISR-LUX-NOR-NZL-POL-PRT-SVK-SVN-SWE-TUR
29.9
26.4
23.9
22.8
OECD Average
32.6
29.2
27.0
25.5
Top tax burden on dividends (2000, 2011)Overall top tax rate on dividend income 2000Overall top tax rate on dividend income 2011
80
70
OECD average in 2000 (49.1%) and 2011 (41%)
60
50
40
30
20
10
0DNKNORGRCBELCHLCANPOLAUTPRTNZLSWECZEFRASPAMEXGERKORHUNAUSSVNTURSVKNLDJPNSWIFINESTUKUSIRLLUXISRICLITA
0.00
0.20
0.40
0.60
0.80
1.00
1.20
VAT revenue ratio (2010)
TUR KEYM EXIC OITALYGR EEC EUNITED KINGD O MSPAINB ELGIUMFR ANC EAUSTR ALIAPO LANDPO R TUGALIC ELANDSLO VAK R EPUB LICGER M ANYIR ELANDNO R WAYHUNGAR YFINLANDSW ED ENUnweig hted avera g eC Z EC H R EPUB LICNETH ER LAND SAUSTR IAD ENM AR KKO R EAJAPANISR AEL*SLO VENIAC ANAD AC H ILESW ITZ ER LANDLUXEM B O UR GNEW Z EALAND
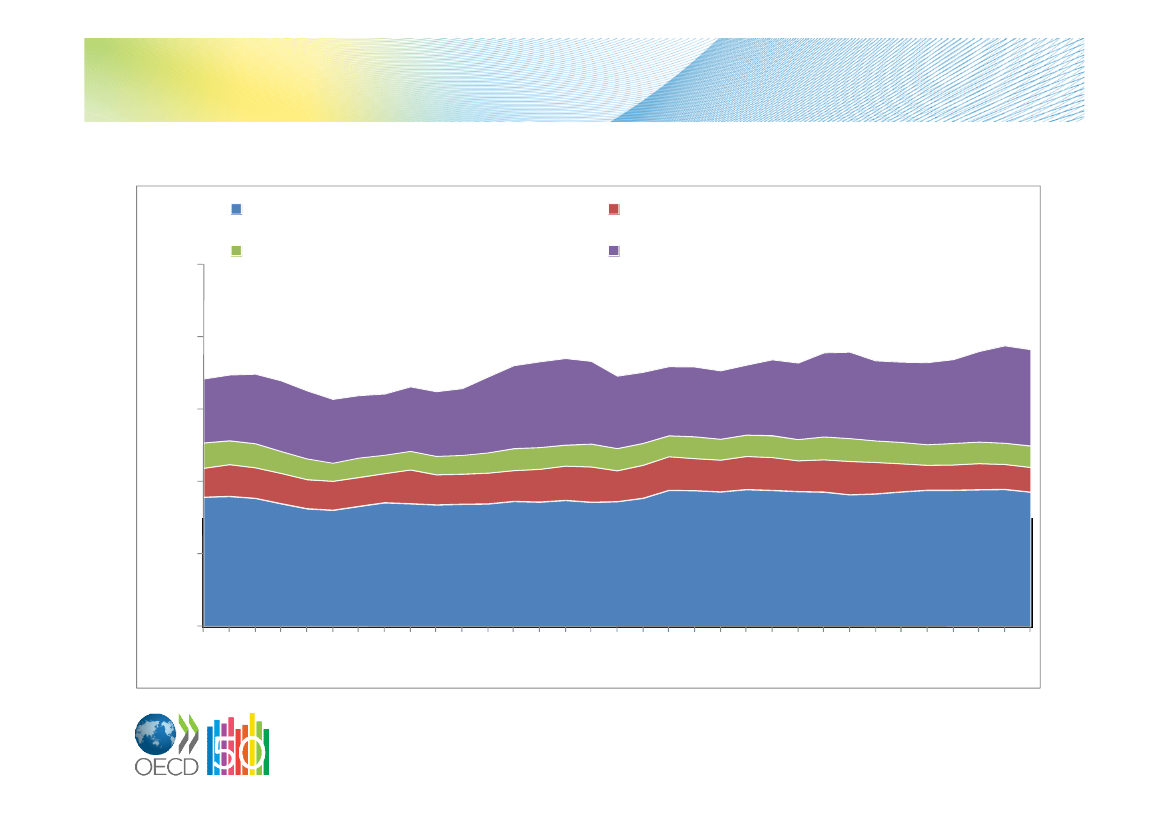
Property taxes (as a percentage of GDP) overtime in the OECD on averagerecurrent taxes on immovable property2.5%estate, inheritance and gift taxesrecurrent taxes on net wealthtaxes on financial and capital transactions
2.0%
1.5%
1.0%
0.5%
0.0%197519761977197819791980198119821983198419851986198719881989199019911992199319941995199619971998199920002001200220032004200520062007
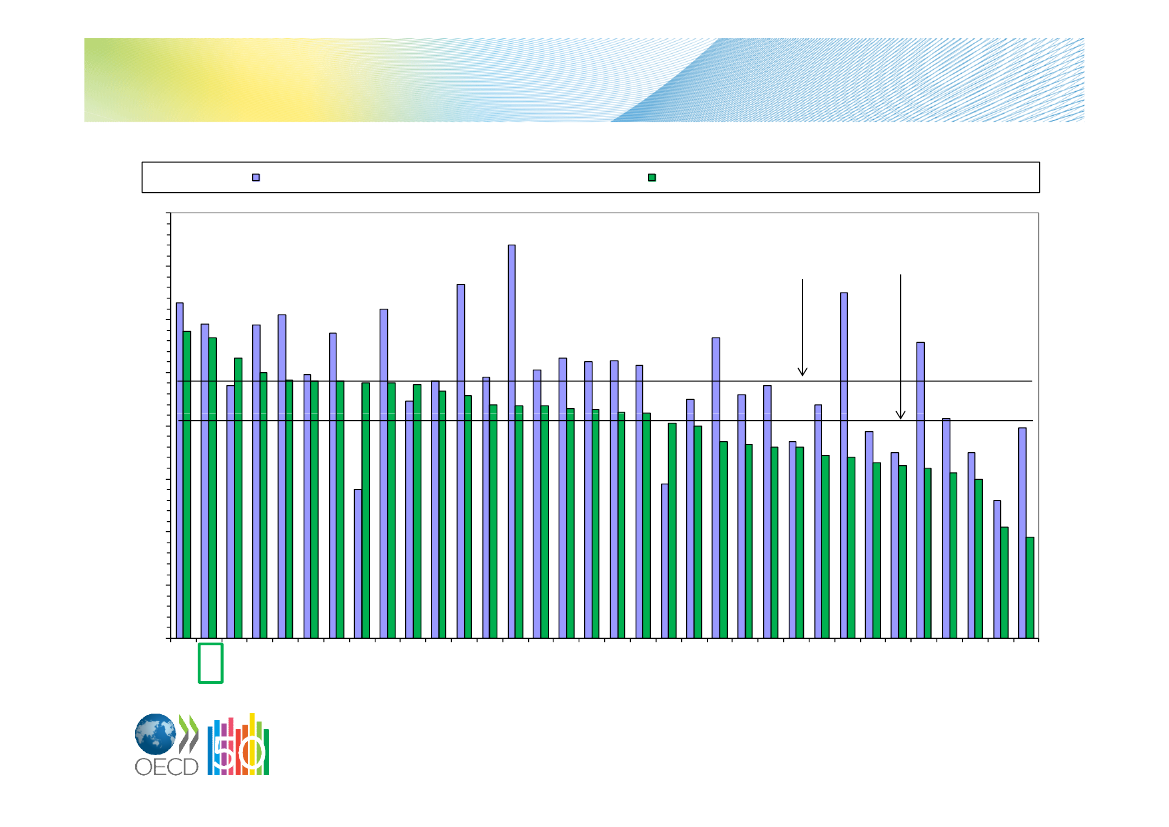
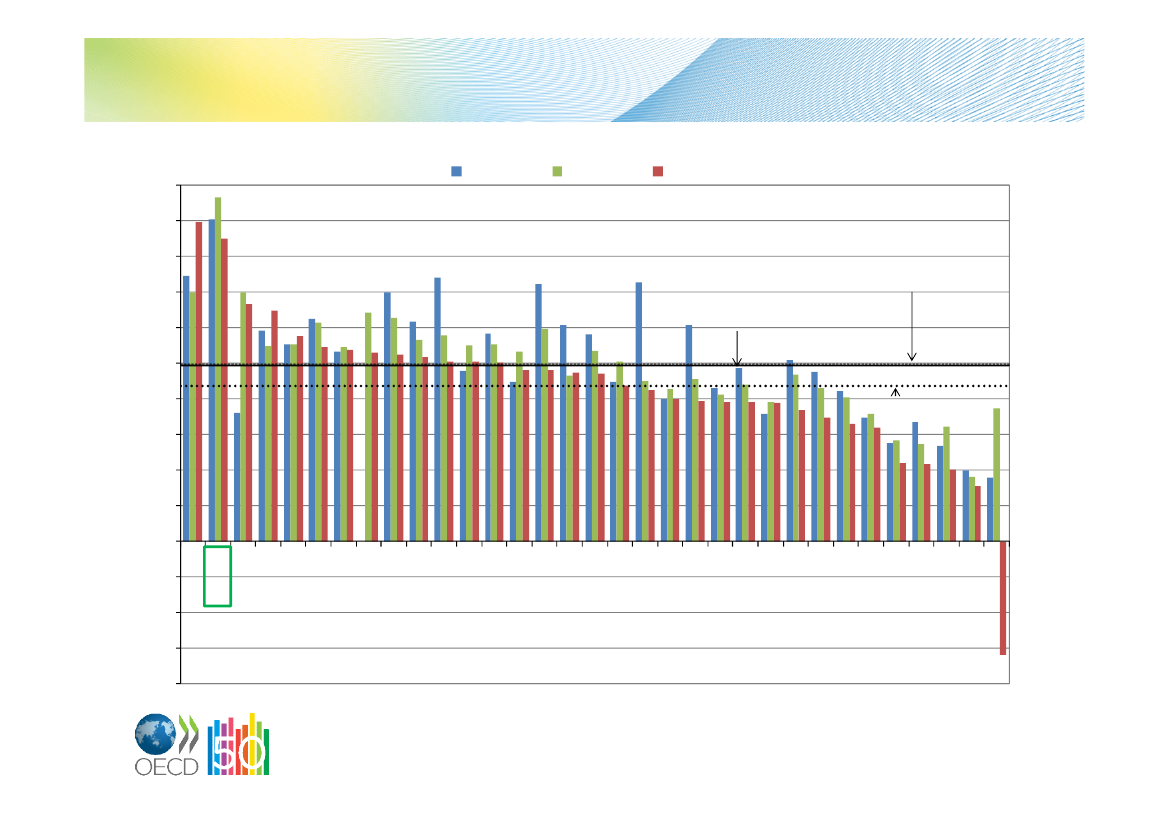
Environmentally related taxesRevenues from Environmentally Related Taxation as Percentage of GDP5.0 %4.5 %4.0 %3.5 %3.0 %2.5 %2.0 %1.5 %1.0 %0.5 %0.0 %-0.5 %-1.0 %-1.5 %-2.0 %
1996
2002
2008
OECD AVG 2002 - 2.49%OECD AVG 1996 - 2.47%
OECD AVG 2008 - 2.18%
NLDDNKTURISRHUNFINCZESVNPRTSWEITAKORLUXAUTNORIRLGBRDEUGRCCHEISLSVKBELPOLAUSFRAESPJPNNZLCANCHLUSAMEX
Summary tableTAX / GDPRATIO% OF TOTAL TAX REVENUESPersonal CorporateIncome TaxTax20092009SocialSecurityContrib.2009TopTopStatutory CorporateTop rate onStandardConsumption Personal Income Tax Tax Wedge dividends VAT RateIncome Tax Rate on 1on 1 JanuaryTaxesRate(2)January200920102011201020112011
2010(Provisional)
2009
BelgiumCanadaDenmarkFinlandFranceGermanyItalyJapanNetherlandsNorwaySwedenUnited KingdomUnited StatesOECD averageG7 average
43.831.048.242.142.936.343.0n.a.n.a.42.845.835.024.8n.a.n.a.
43.232.048.142.642.437.343.426.938.242.946.734.324.133.834.4
283655311725272023242931342527
611553471052268787
33162303939324136232420272730
252432312530241931282929193324
53.746.452.248.945.847.544.950.052.040.056.050.041.941.746.6
34.027.625.026.034.430.227.539.525.528.026.326.039.225.432.1
55.430.338.342.049.349.146.930.538.436.842.732.729.734.938.3
43.948.056.540.557.848.636.645.643.848.248.452.752.141.148.8
21.05.025.023.019.619.020.05.019.025.025.020.0-18.514.8
III.RECENT (2011-2012) tax policydevelopments
Recent (2011/12) developments• Budget deficits fell in 2011, helped by economicrecovery and reversal of earlier tax cuts anddiscretionary fiscal consolidation in some countries• Emphasis on fiscal consolidation increasing in 2012,notably in the Euro area•Wide variationin how countries are raisingadditional revenues• Fundamental reformsthe exception rather thanthe rule,but many are seeking to make structuralimprovements• Importance offairness
Recent (2011/12) developments• Consumption taxes– 14 countries have increased their standard rate of VAT since2010– Most of these countries also increased reduced rates–But rare to move goods and services from reduced tostandard rate
• PIT and SSCs–Some rate risesbut exception not rule– Some reductions in tax expenditures, butmortgage interestrelief remains a ‘no go’ area– Personal tax rates on capital income have slightly increased(fairness concerns) butfundamental reform of savingstaxation seems not on the agenda
Recent (2011/12) developments• CIT–Reductions in statutory rates in a few countries,despite budgetary pressures; ACE in Italy– Many measures to protect revenues, e.g.restrictions onthe use of losses– Changes intax depreciation allowanceshave tendedto be more generous forSMEs
• Other taxes–Few changes to property taxes.– High crude oil prices have discouraged governments fromincreasing road fuel duties or other fossil fuel/ energytaxes– Some countries have introducednew bank levies orstability fee schemes
IV Some issues for discussion•Denmark knows how to make tax reform
happen!
•Further reduce the tax burden on labour
income (especially low earnings)?
•Focus on skills formation and upgrading
•Broadening the VAT base would be pro-
growth and strengthen equity
•Tax immovable property as other saving
vehicles
•“Fat tax” implementation issues