Skatteudvalget 2011-12
SAU Alm.del Bilag 177
Offentligt
Visit of the Danish Parliament’sTax Committee30 January 2012Jørgen Elmeskov, OECD
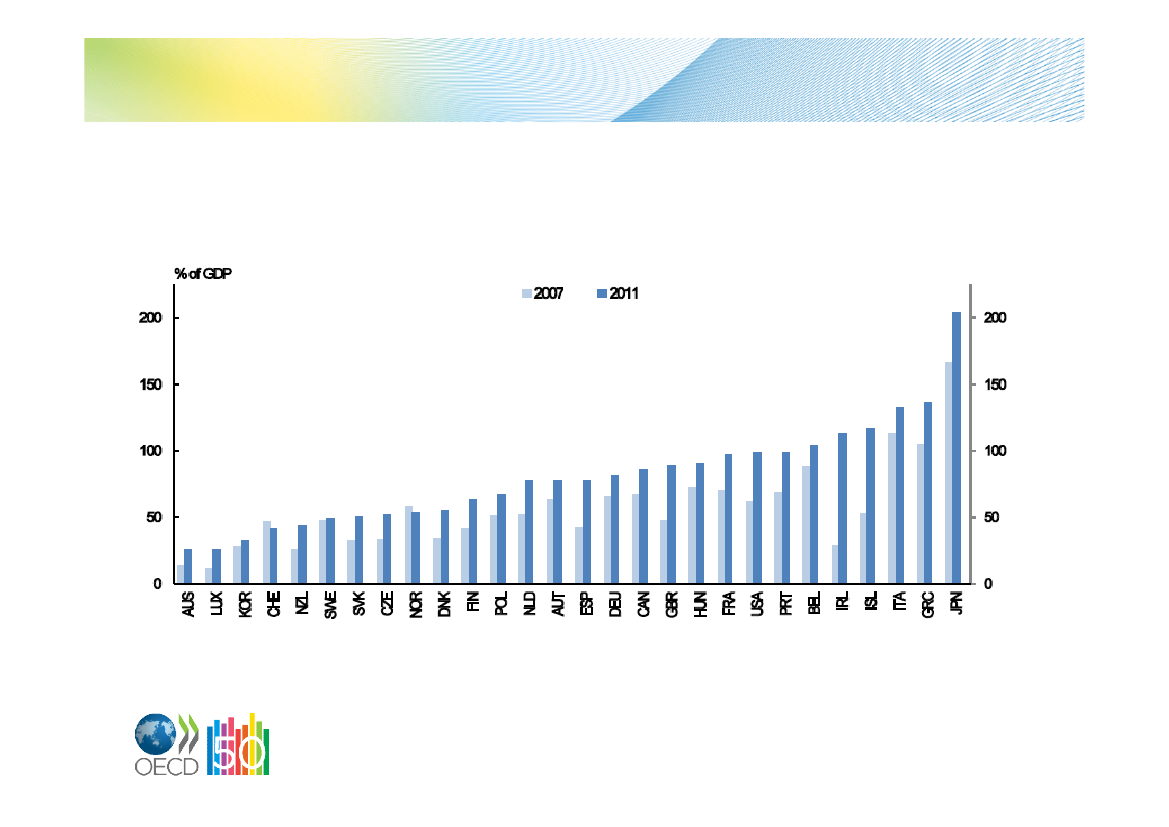
Gross debt has risen to high levels in OECDcountries
Source: OECD Economic Outlook 89 Database.
2
Consolidation needs are large to reachprudent debt levels
Note:“Low” health assumes policy action curbs health spending growth. “High” health is the additionalcost pressure in the absence of these policy actions.
3
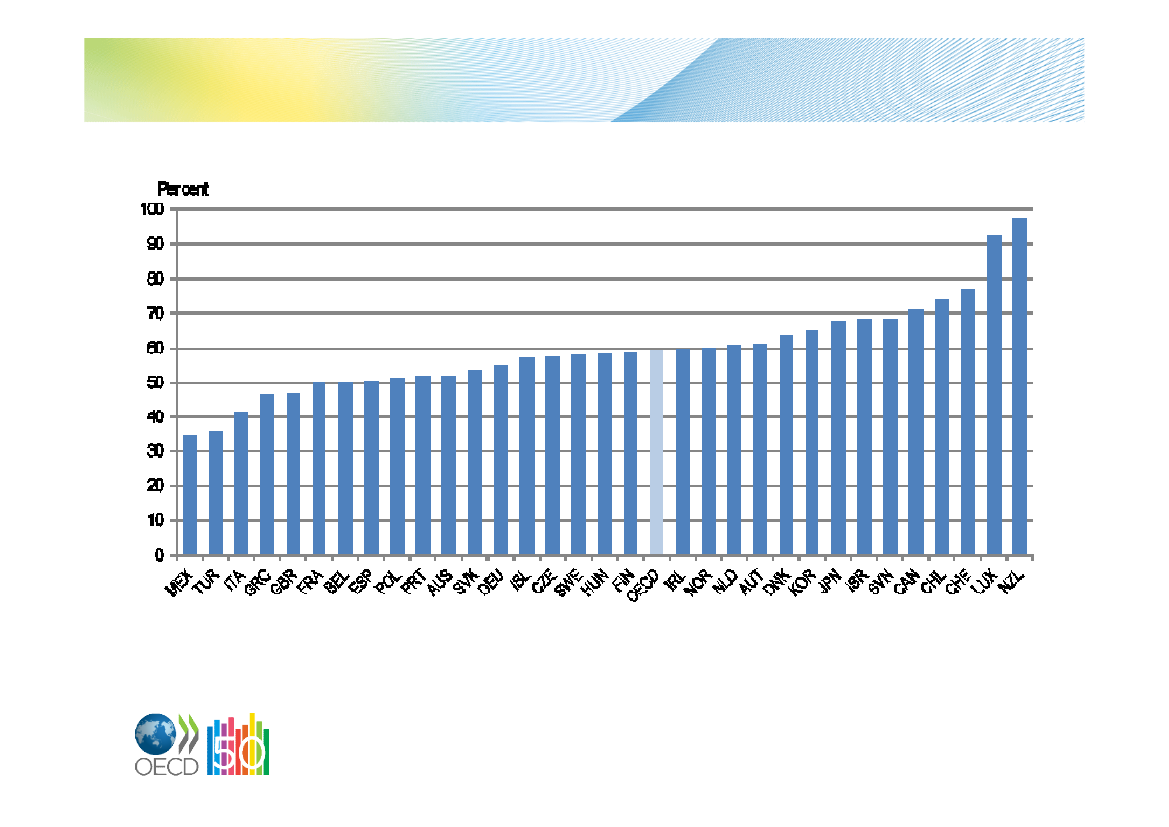
Denmark
Sweden
Belgium
Italy
France
Norway
Finland
Austria
Netherlands*
Slovenia
Hungary
Luxembourg
Germany
Iceland
United Kingdom
Czech Republic
Estonia
Israel
Poland*
Spain
New Zealand
Portugal
Canada
Greece
Switzerland
Slovak Republic
Ireland
Japan*
Turkey
Australia*
Korea
United States
Chile
Mexico
0
10
20
30
40
50
60
Total tax revenue as % of GDP, 2010
Note:* indicates 2009 data.Source: OECD Revenue Statistics.
4
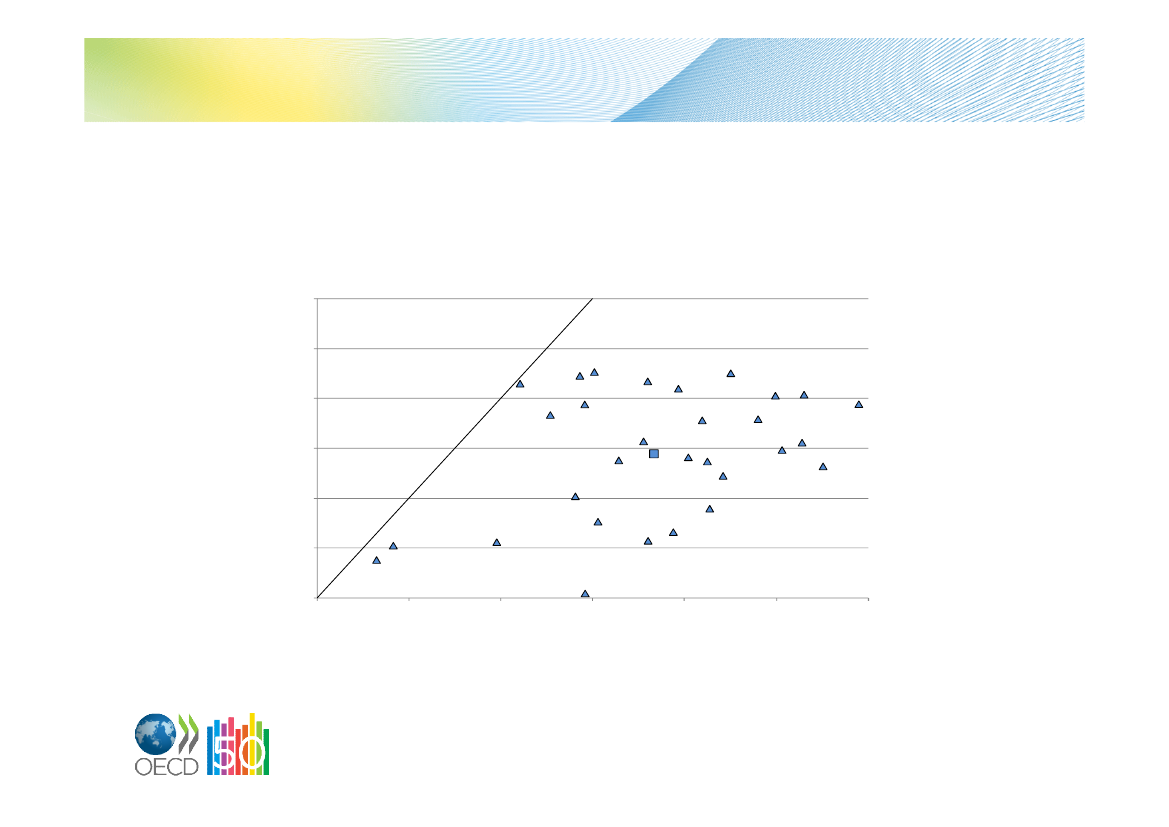
Gross publicversusnet mandated socialspending4035302520151050% of 2005 GDP at factor costsGross public social expendit ureNet publically-mandated social expenditure3530252015105040
5
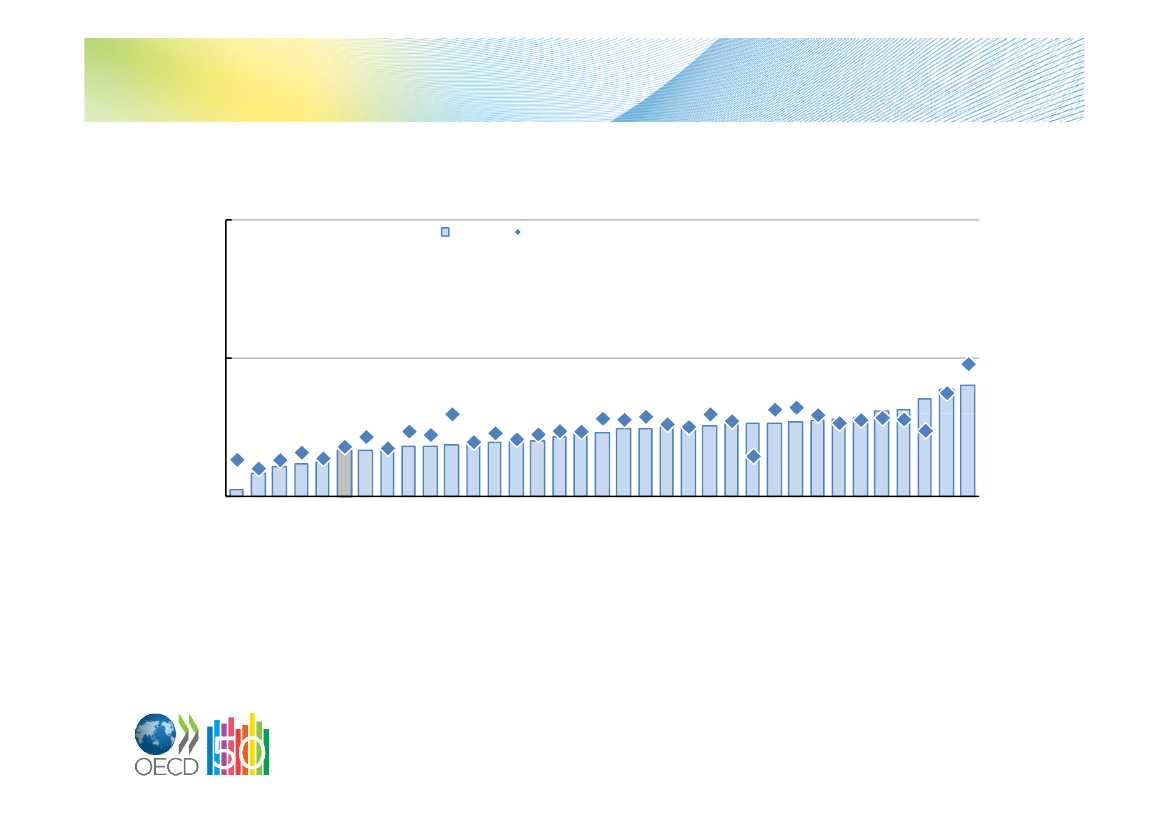
Cash transfers reduce income dispersionmore than taxesPoint reduction in the concentration coefficients, in the late 2000sRedistributive im pact of household taxes0.06
0.05ITASVNUSA0.04PRTNLDLUXOECD-30ISRCANNORAUTNZLEST0.02FRASVKESPPOL0.01CHLKORISLJPNBELSWEGBRCZEAUSDEUDNKIRLFIN
0.03
0.000.00
CHE10.020.040.060.080.100.12Redistributive impact of public cash transfers
1.The redistributive impact of household taxes for Switzerland is slightly negative (-0.006), but has been set to zero.Note:The redistributive impact of public cash transfers is measured as the difference between the concentration coefficient of marketincome and that of income after transfers. The redistributive impact of household taxes is measured as the difference betweenthe concentration coefficient of post-transfer income and that of disposable income (i.e. post-tax and transfers). Data for Franceand Ireland refer to mid-2000s.
Source: OECD Income Distribution and Poverty Database.
6
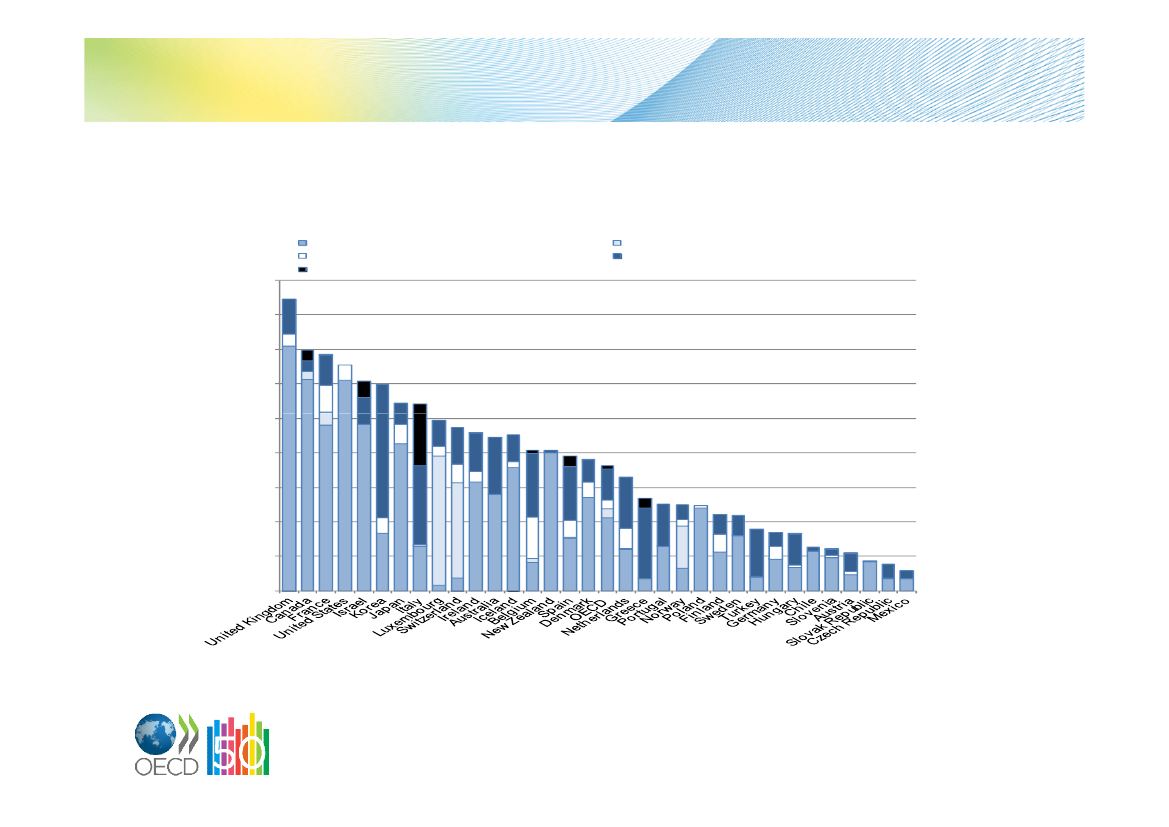
Ranking of taxes in terms of their negativeeffect on long-term growthMore distortive
Corporate taxPersonal income taxConsumption tax(and other property tax)
Less distortive
Tax on immovable propertyPiguvian taxes
7
Share of green taxes in GDPRevenues from environment-related taxes, OECD countries, 2000 and2009 in percentage of GDP10%20092000
5%
Note:The OECD weighted average includes all 34 OECD countries. In Mexico, fluctuations of consumer pricesonmotor vehicle fuels are smoothed out. Environmentally related taxes include taxes on energy products (fortransport and stationary purposes including electricity, petrol, diesel and fossil fuels), motor vehicles and transport(one-off import or sales taxes, recurrent taxes on registration or road use, other transport taxes), wastemanagement (final disposal, packaging, other waste-related product taxes), ozone-depleting substances and otherenvironmentally related taxes.Source:OECD/EEA database on instruments used for environmental policy and natural resource management.
MEXUSANZLCHLCANOECDESPJPNAUSFRAISLPOLSVKCHEBELGRCDEUIRLLUXNORPORAUTGBRKORESTFINITLHUNCZESWESVNISRTURNLDDNK
0%
8
VAT is an example of tax expenditurevarying across countriesAverage 2007-08
Note:The VAT revenue ratio measures the difference between the VAT revenue actually collected and what wouldtheoretically be raised if VAT was applied at the standard rate to the entire potential tax base in a “pure” VAT regime andall revenue was collected: The VAT revenue ratio equals VAT Revenue/(Consumption * Standard VAT rate)*100.Source:OECD (2011),Consumption Tax Trends 2010: VAT/GST and Excise Rates, Trends and Administration Issues.
9
The property tax take varies significantlyacross OECD countries2009, per cent of GDPRecurren t taxes o n immovable p ropertyEstate, i n h eritance an d g ift taxesOth erNet wealth taxesTaxes o n financial an d capital transactions
% GDP4.5
4.0
3.5
3.0
2.5
2.0
1.5
1.0
0.5
0.0
Source:OECD (2010c),Revenue Statistics 2010.
10
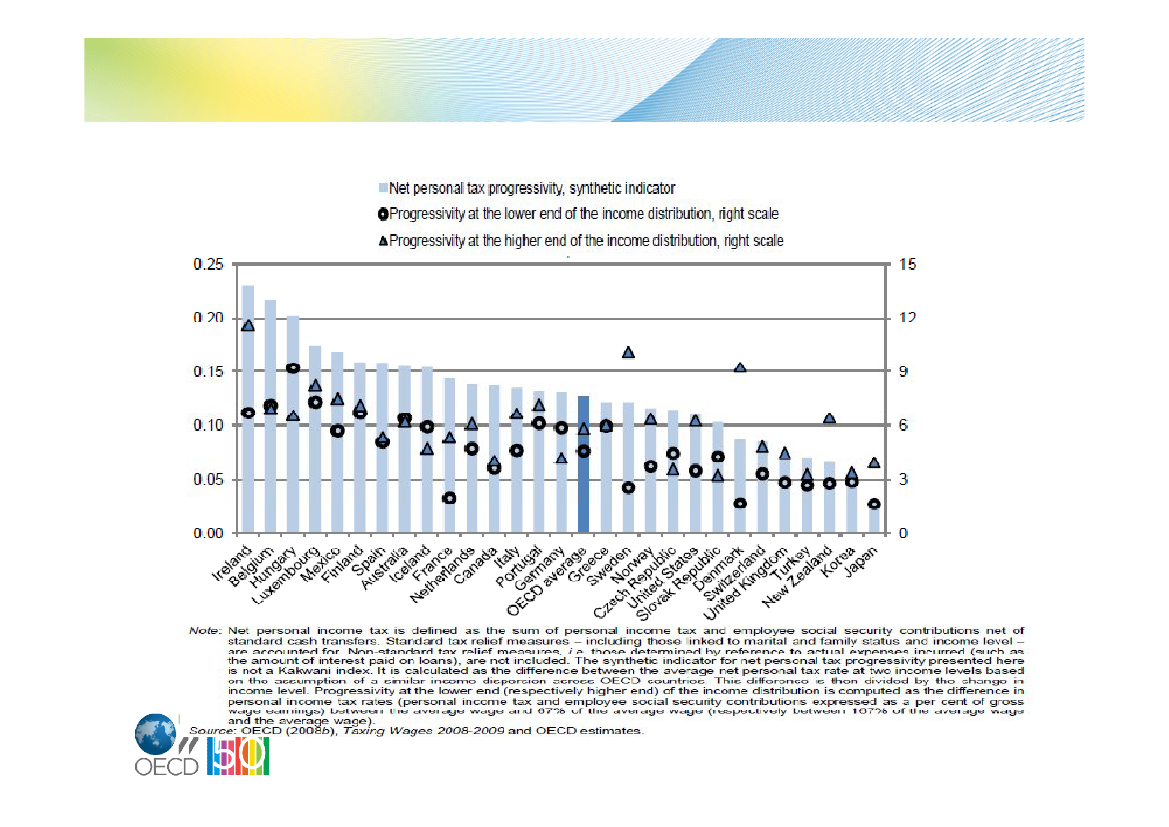
Progressivity of statutory personal income tax andemployee social security contribution schedulesBased on statutory tax schedules for single taxpayers without children – Level 2009
11
Top personal income tax rates andthresholdsTop statutory income tax rate (%)2000AustraliaAustriaBelgiumCanadaCzech RepublicDenmarkFinlandFranceGermanyGreeceHungaryIcelandIrelandItalyJapanKoreaLuxembourgMexico3NetherlandsNew ZealandNorwayPolandPortugalSlovak RepublicSpainSwedenSwitzerlandTurkeyUnited KingdomUnited StatesOECD averageStandard deviation1.2.3.1
Threshold (multiple of the average wage)20001.22.31.21.72.41.02.12.91.73.80.91.51.03.94.55.52.149.31.61.72.63.33.43.24.41.54.08.11.48.92.92.020092.82.11.12.90.41.01.82.86.23.60.80.30.93.24.63.21.04.71.21.51.62.84.30.52.41.53.63.01.39.62.52.0
2
200946.550.053.746.415.051.649.147.847.540.036.037.241.044.950.038.538.928.052.038.040.032.042.019.043.056.541.735.640.041.941.59.3
Change2000 to 2009-2.00.0-10.20.0-17.0-8.1-6.1-10.5-6.3-5.0-4.0-8.2-3.0-1.50.0-5.5-8.3-12.0-8.0-1.0-7.5-8.02.0-16.0-5.01.1-1.60.00.0-4.8-5.21.5
Change2000 to 20091.6-0.2-0.11.2-2.00.0-0.3-0.14.5-0.2-0.1-1.2-0.1-0.70.1-2.3-1.1-44.6-0.4-0.2-1.0-0.50.9-2.7-2.00.0-0.4-5.1-0.10.7-0.40.0
48.550.063.946.432.059.755.258.353.845.040.045.444.046.450.044.047.240.060.039.047.540.040.035.048.055.443.235.640.046.746.77.9
These are the top statutory tax rates (combined central and sub-central) that apply from the threshold levels reported in thefourth and fifth columns.These columns report the level of gross wage earnings (expressed as a multiple of the average wage) at which the top personalincome tax rate starts to apply. The average and dispersion exclude Mexico.The threshold figure for Mexico in 2000 reflects a tax schedule with two supplementary brackets designed to tax very highearners more heavily. These supplementary brackets were removed in 2002, resulting in the threshold of the upper bracketcoming down sharply as a proportion of average earnings.
Source:OECD (2009),OECD Tax Database.
12