Grønlandsudvalget 2011-12, Forsvarsudvalget 2011-12
GRU Alm.del Bilag 23, FOU Alm.del Bilag 171
Offentligt
Thule-2007 - Investigation of radioactivepollution on land
Sven Poul Nielsen and Per RoosRisø-R-1781(EN)October 2011
Risø-R-ReportAaaaaaaaaAaaAaaAaaAaaAaa
Author:Sven Poul Nielsen and Per RoosTitle:Thule-2007 - Investigation of radioactiveDivision:Radiation Research
pollution on land
Risø-R-1781(EN)October 2011
Abstract (max. 2000 char.):
A survey of radioactive pollution on land in the Thule areafrom an airplane accident in 1968 was carried out during2007 and 2008. The results show levels of plutonium in soilat Narsaarsuk ranging from background values around 39 Bqm-2up to levels of 1.7 MBq m-2. Local sub-areas of sizesranging from a few hundred to a few thousands of square me-tres show elevated levels above 10 kBq m-2of plutonium.Based on geostatistical analysis, the total amount of pluto-nium in soil at Narsaarsuk is estimated at 270 GBq (100 g).Investigations were carried out at Narsaarsuk to determine theoccurrence of radioactive particles in air. This involved col-lection of airborne particles with an air sampler, collection ofairborne particles on sticky foils, collection of rain samplesand collection of particles that could be resuspended by windfrom the soil surface to the air. Small amounts of plutoniumwere found in air and rain samples, but the derived concentra-tions in air were very low corresponding to typical back-ground levels in Europe in the range 1-10 nBq m-3. A fewsmall particles were found on the soil surface with activitiesup to 1000 Bq plutonium but the air and rain samples showedno sign of resuspension of such particles from the soil.Local areas with elevated levels of radioactive pollution insoil were found at Kap Atholl and Grønnedal 15-20 km southof Narsaarsuk. Here the levels were lower than those in theNarsaarsuk area but clearly above background.It was not possible within this project to carry out a system-atic survey of the entire region. Hence, it cannot be excludedthat there may be more local sub-areas than those identifiedwith elevated levels of radioactive pollution in soil.Screening surveys were carried out at Thule Air Base, Mo-riusaq, Saunders Island and Wolstenholme Island. The re-sults showed background levels in soil at these locationswhich means that no sign of radioactive pollution from theaccident was found at these locations.
ISSN 0106-2840ISBN 978-87-550-3913-1
Contract no.:MST-112-00183
Group's own reg. no.:PSP 1400102-02
Sponsorship:Environmental Protection Agency
Cover :View of Narsaarsuk at Thule, North-West GreenlandPhoto by Svend K. Olsen, 6 July2008
Pages: 47Tables: 9References: 51Information Service DepartmentRisø National Laboratory for Sus-tainable EnergyTechnical University of DenmarkP.O.Box 49DK-4000 RoskildeDenmarkTelephone +45 46774005[email protected]Fax +45 46774013www.risoe.dtu.dk
Contents1233.13.23.33.44IntroductionScope of InvestigationSamplingField campaignsAir and precipitationSoilSoil particlesAnalytical methods5566710131414141515151619191919202223242830323437373838394044
4.1 Sample preparation4.2 Autoradiography4.3 Radiochemistry4.4 Gamma spectrometry4.4.1 Laboratory measurements4.4.2 Field measurements4.5 Analytical quality5Results
5.1 Air5.1.1 Air filters5.1.2 Sticky foils5.2 Precipitation5.3 Soil5.3.1 Soil samples5.3.2 Soil depth profiles5.3.3 Field measurements5.3.4 Vacuum bags5.3.5 Geostatistical analysis5.4 Meteorological data6789DiscussionConclusionsRecommendationsAcknowledgements
10 ReferencesAppendix A, Meteorological data
Risø-R-1781(EN)
3
4
Risø-R-1781(EN)
1 IntroductionOn 21 January 1968, a US B52 bomber carrying nuclear weapons crashed on the seaice approx. 15 km west of the Thule Air Base in North West Greenland. The aircraftcaught fire on impact and the chemical explosives of the weapons detonated causingradioactive substances to be dispersed by burning jet fuel. Flames reached heights ofabout 850 m and smoke even higher. Based on eyewitness information and meteoro-logical and radar observations from the Air Base, it was concluded that smoke fromthe fire presumably drifted towards south and south east. It was estimated that smallparticles could be carried far away by the wind and later deposited on ground at lowconcentrations. Measurable amounts of pollution were expected to be found towardsthe small settlement Narsaarsuk about 8 km south of the crash site. Redistribution ofradioactive material might be expected from the heavily polluted crash site duringstorms on 24 and 29 January 1968 carrying the pollution towards west to SaundersIsland (U.S. Air Force, 1970).During the weeks after the accident, the dispersion of plutonium was investigated bycollecting and analyzing snow samples. Pollution was identified in two zones, onein a southerly direction from the crash site due to direct fallout from the smokeplume and one towards west from resuspension of pollution from the area near thecrash site. Plutonium contamination along the southern coastline of Bylot Soundshowed maximum concentrations near Narsaarsuk with levels of up to about 9 kBqm-2.Since 1968, further dispersion of the radioactive pollution on land is expected tohave occurred due to influence of weather conditions. Redistribution of pollution isexpected to be local and due mainly to snow melt and subsequent leaching andtransport of particles.In 2003 soil samples were collected from 8 locations along the coast near Narsaarsukin connection with a previous project on environmental plutonium at Thule (Nielsenand Roos, 2006). The top soil layers showed accident plutonium at all locations andat varying concentrations. Plutonium in the soil samples was distributed very inho-mogeneously and associated with particles. The uneven distribution of plutonium insoil from Narsaarsuk was further confirmed from a preliminary investigation involv-ing limited sampling of soil in 2006. Narsaarsuk was abandoned as a settlementyears ago and the wooden shacks are now used occasionally as hunting cabins andtemporary shelter for tourists.The purpose of the present project is to evaluate possible health risks to humans atThule and particularly at Narsaarsuk from inhalation of radioactive particles if suchparticles are remobilized from the ground. Resuspension of particles could occur byinfluence of the wind and/or dust forming activities. Inhalation of particles contain-ing plutonium may give rise to a health risk. The risk evaluation is described in aseparate report by the Danish National Institute of Radiation Protection (NIRP,2011).
2 Scope of InvestigationThe project has covered the following items•A systematic survey of radioactive pollution on land in the Narsaarsuk area•A detailed mapping of locations with particularly high levels of radioactivepollution south and east of the hunting cabins at Narsaarsuk
Risø-R-1781(EN)
5
••
•
Investigation of the occurrence of radioactive particles in air at NarsaarsukScreening for radioactive pollution on land at Grønnedal (Green Valley)hunting area, Kap Atholl recreation area, Saunders Island, Wolstenholme Is-land, Moriusaq settlement and Thule Air BaseProviding basis for evaluating radiological risks to man from inhaling radio-active particles and going about in the area
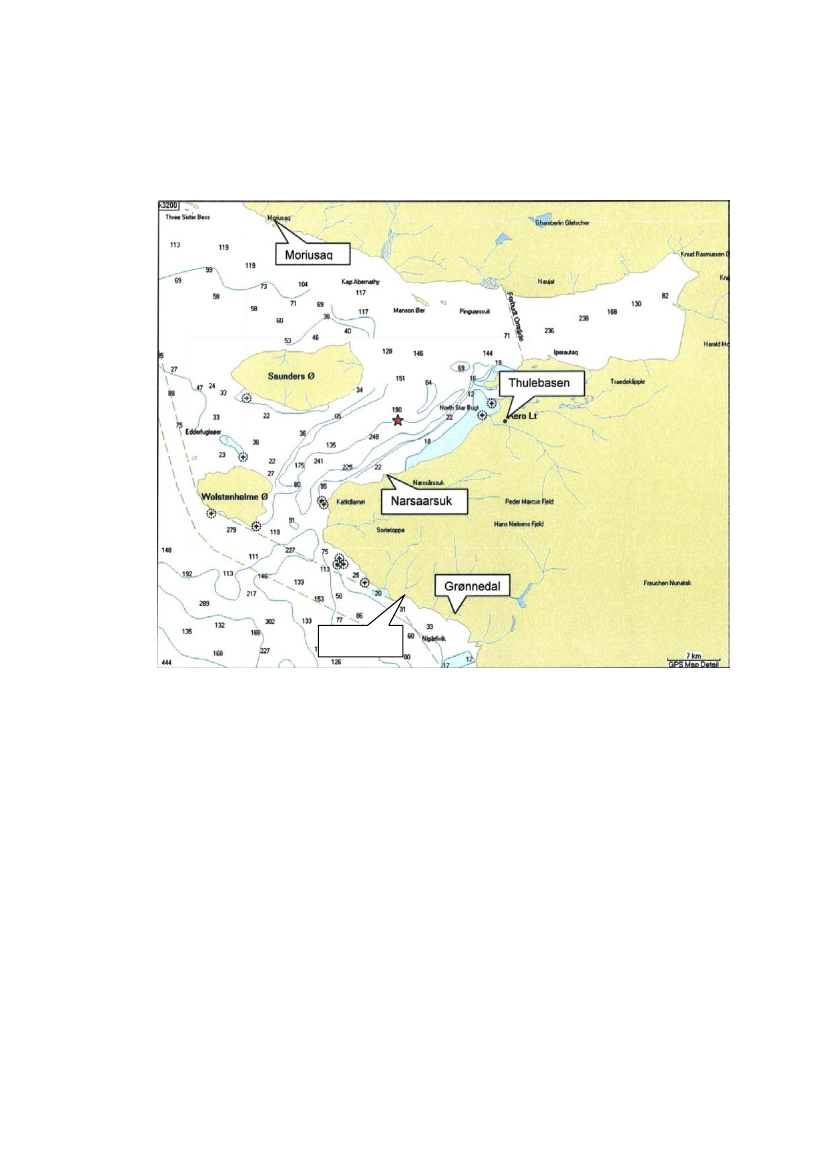
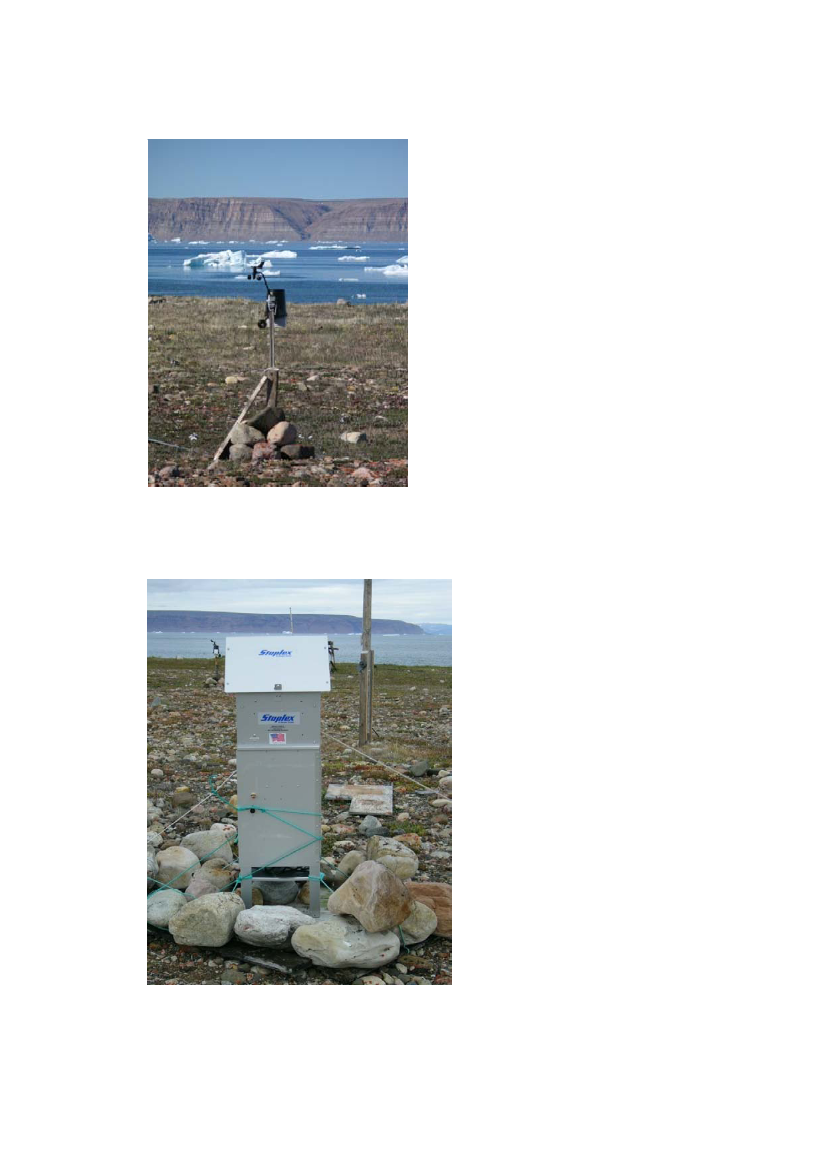
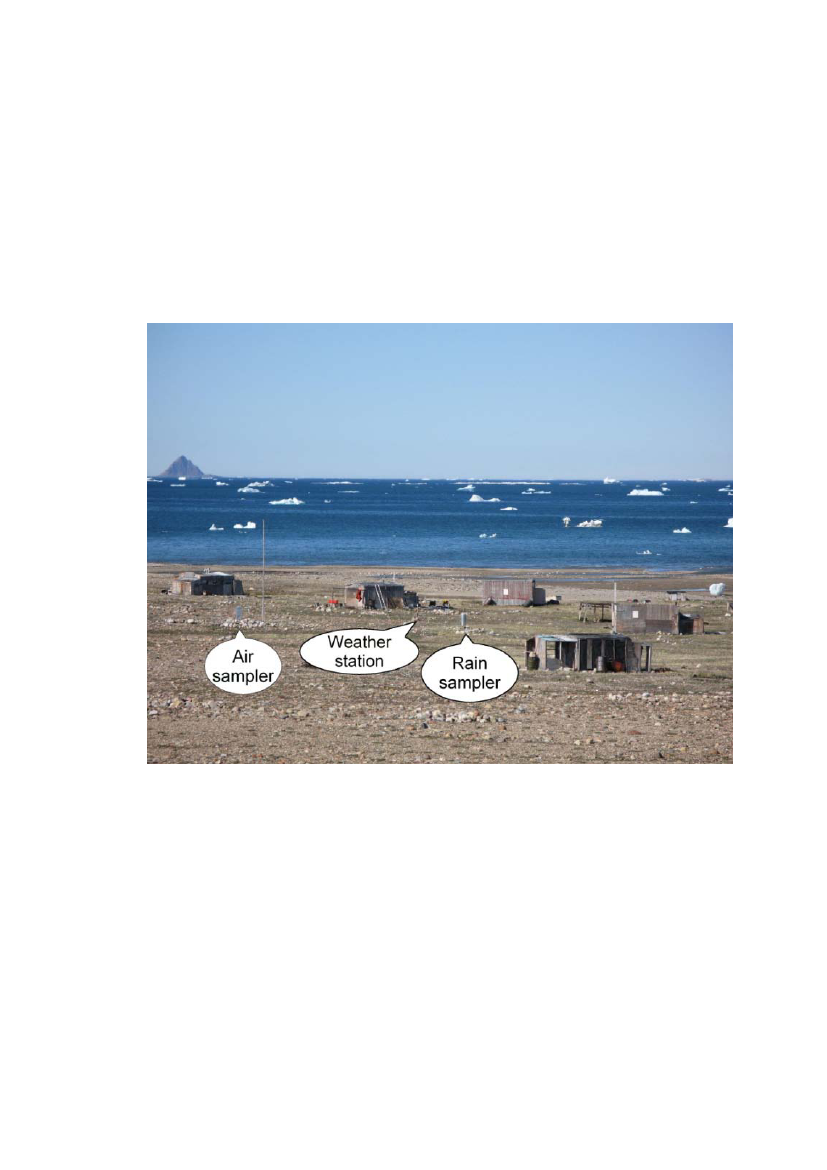
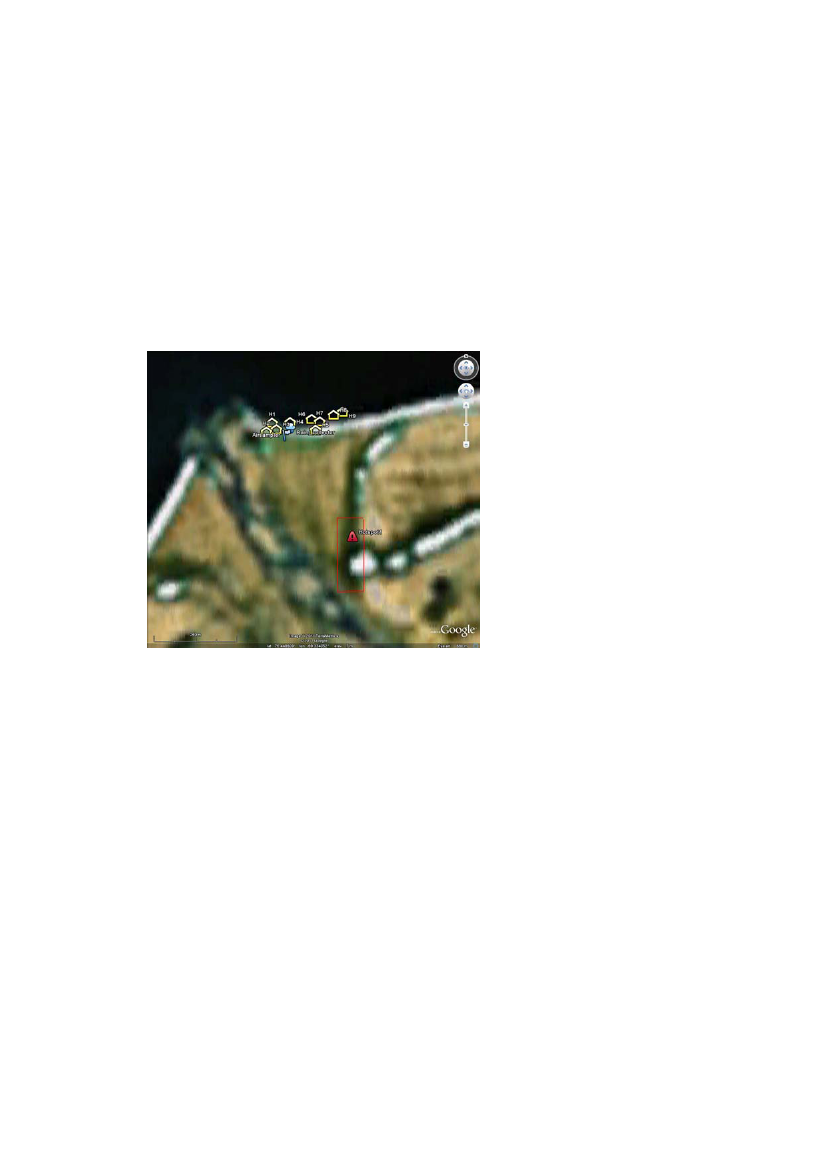
3 Sampling3.1Field campaignsDuring summer in 2007 and 2008 an investigation including on-site gamma spec-trometric screening, sampling of soil, air and precipitation was carried out in theNarsaarsuk area (Fig.1), about 15 km west of the Thule Air Base (TAB), Greenland.Apart from minor equipment used for soil sampling which was transported by planethe majority of materials and sampling equipment were sent to Thule by ship inspring 2007. However, arrival at Thule became severely delayed due to ship colli-sion with an iceberg in Baffin Bay and subsequent repair. Furthermore, one of theboat drivers contracted for the transportation in the local area was at hospital leavingus with one boat only thus making it more difficult to split up work in teams at sev-eral locations. The initial plans of conducting the complete sampling campaign dur-ing the summer of 2007 could therefore not be carried out which made it necessaryto use the following summer, 2008, for complementary sampling. Equipment andlaboratory was housed at TAB while some of the basic sampling equipment for soilwas stored in the shacks at Narsaarsuk.Transportation between TAB and Narsaarsuk took place in a small boat. After arrivalof the sampling equipment in 2007, transportation on land could be made using threeAll Terrain Vehicles (ATV’s) which also permitted sampling at more distant loca-tions; prior to this transportation was by foot. Due to the lack of a majority of thesampling gear, the initial three weeks following arrival in 2007 was spent collectingsoil samples in the Narsaarsuk area as well as on the Saunders and WolstenholmeIslands which was planned sampling locations. Similarly the Inuit settlement Mo-riusaq was visited for soil sampling. Complementary material needed for soil sam-pling was obtained from the local shop and friendly staff at TAB (Greenland Con-tractors, GC) who granted supply to the TAB technical supply store. GC-staff alsomade possible soil sampling at the more far away location Grønnedal since two boatswere required for safety reasons. Consequently an extra boat was placed at our dis-posal for this purpose. The Kap Atholl site, a former navigational station and now arecreational site for tourists and TAB staff, located at the end of a road from TABwas reached by ATV. Following delivery at Thule of the equipment container, airsampler, passive particle collectors and the rain sampler were mounted at Narsaar-suk. Initial problems with fuel supply to the generator for electricity used for the airsampler delayed start of air sampling with a few days. It was discovered that directsunlight on the fuel tubing feeding the generator created gas bubbles which pre-vented flow.Meteorological conditions at Narsaarsuk were recorded by a weather station, Wea-therLink 5.7a (2006) Davies Instruments Corporation, CA, USA, (Fig. 2). The sta-tion logged temperature, wind speed, wind direction and precipitation every fiveminutes to a battery-powered data logger. The sampling campaign in summer 2008included mounting of the air sampler, passive collectors and rain collector at thesame positions as in 2007. Additional passive collectors were mounted on locations
6
Risø-R-1781(EN)
eastwards of Narsaarsuk. The main part of the time in 2008 was spent on localizingareas with elevated levels of radioactivity using the portable gamma spectrometers.Frozen soil samples were transported back to Risø laboratories by air in 2007. Re-maining samples from 2007 and 2008 (except soil which was transported by air)were transported back with the equipment container by ship in 2008.
Kap Atholl
Figure 1. Overview of the Thule area. The site of the airplane crash is marked with a redstar.
3.2
Air and precipitation
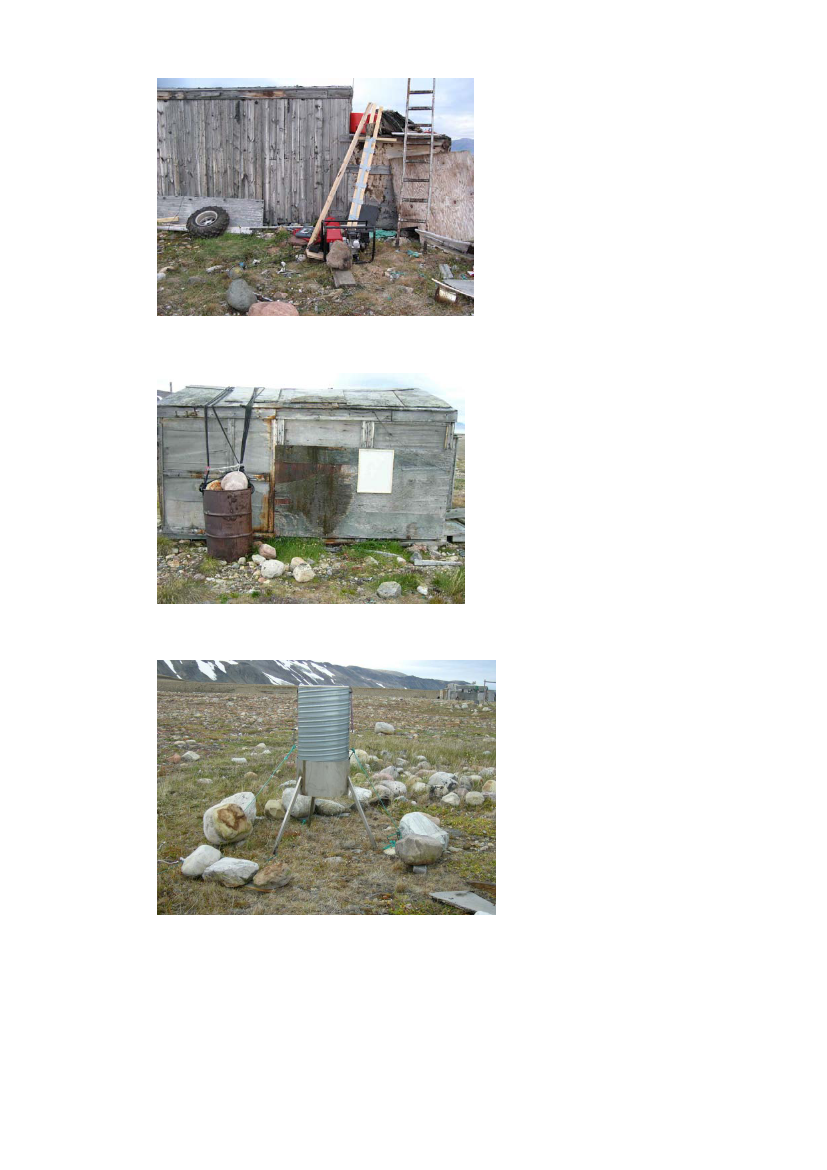
Aerosols were sampled at Narsaarsuk using a Staplex�Model TFIA-2F high volumeair sampler with built-in flow adjuster. The sampler was mounted with an 8”x10”filter holder, flow-meter and constant flow controller in an outdoor aluminium hous-ing (Fig. 3). The air-sampler was calibrated using Staplex�calibration kit for 8”x10”holders and was set to a flow rate of about 1.5 m3min-1before shipping. Samplingwas done using glass fibre filters (Staplex�TFAGF810) with reported retention of0.3 �m particles better than 99.97%. The sampler was positioned and secured to theground at the centre of Narsaarsuk. The sampler was powered by a petrol drivengenerator (Fig. 4). In 2007, air sampling was carried out during 1 – 13 August butnot continuously, as there were frequent stops over the first days due to formation ofgas in the fuel tubing supplying the generator, causing it to stop. The total volume ofair sampled in 2007 was 28575 m3. The air sampler pump was replaced in 2008 dueto break down. Two air samples were collected, 3-14 July 2008 (22440 m3) and 14July – 13 August 2008 (51265 m3). Mounting and removing of the filters were doneusing disposable gloves and showing care not to contaminate filters with any soil
Risø-R-1781(EN)
7
present on equipment or hands. Filters were stored in double plastic bags until labo-ratory analysis.
Figure 2. Weather-station sensors at Narsaarsuk recording wind speed, wind direction,temperature and precipitation.
Figure 3. Air sampler at Narsaarsuk
8
Risø-R-1781(EN)
Figure 4. Generator used for the air sampler. Tubing from fuel tank on roof to generatorprotected from direct sunlight to avoid gas formation.
Figure 5. Passive aerosol collector placed on one of the shacks at Narsaarsuk.
Figure 6. Rain collector at Narsaarsuk.
Passive aerosol collectors made of double-sided adhesive tape (sticky vinyl, size43x54 cm) were attached to wooden frames and placed at 1-2m height above groundon the wooden shacks in Narsaarsuk (Fig. 5). In 2007 nine collectors were placed onthe shacks and three on a wooden frame placed at the location with elevated levelsclose to Narsaarsuk. During transportation back and from Thule the adhesive surface
Risø-R-1781(EN)
9
was protected from aerosols by a wooden plate. Exposure time for the passive col-lectors in 2007 was about two weeks, and in 2008 about 50 days.Precipitation was collected through a 0.14 m2funnel placed over a 50 L polyethyleneflask positioned at 1 m above ground on a tripod some 10 m away from the air sam-pler (Fig. 6). The flask and funnel were protected against wind by a metal cylinderconnected to the tripod and secured to ground by wires. In 2007 sampling was car-ried out during 1–13 August and a total amount of 2.3 L rain was collected while in2008 three individual samples were collected during 3–14 July (1 L), 14 July – 13August (8.3 L) and 13–24 August (5.4 L). Following transportation back to Risølaboratories the samples were acidified to pH 1 using hydrochloric acid and storedfor further treatment. Fig. 7 shows the set-up of the air sampler, weather station andrain sampler in Narsaarsuk.
Figure 7. View of hunting cabins at Narsaarsuk showing locations of air sampler,weather station and rain sampler.
3.3
Soil
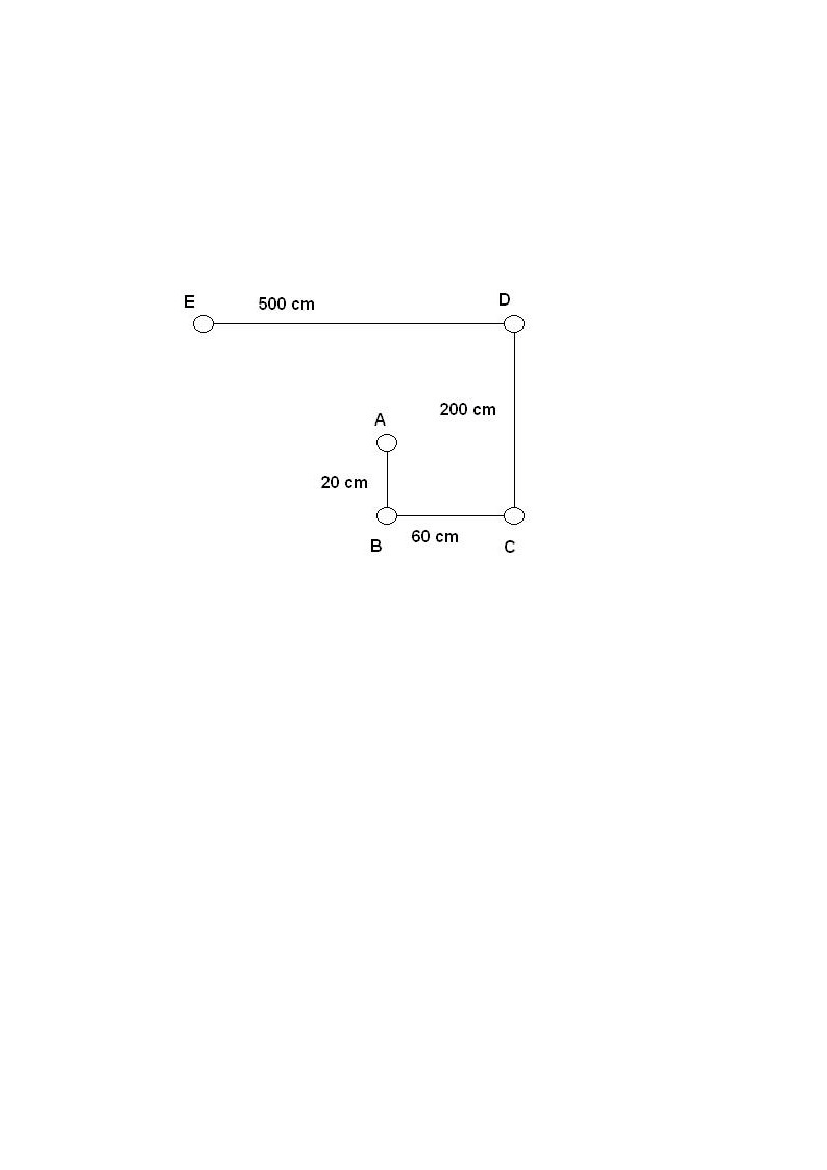
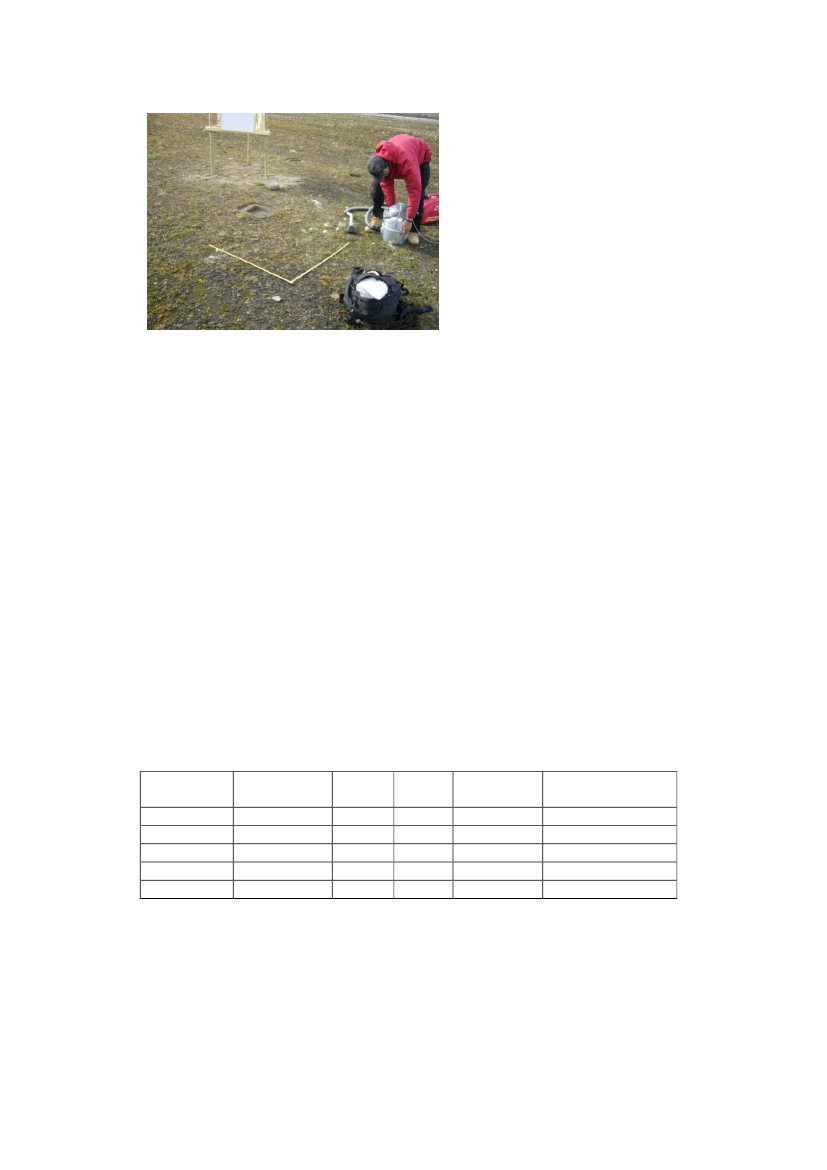
Soil sampling was performed using an ordinary garden spoon and a 10 cm diameterby 30 cm long plastic-tube drilled at the edge to form a sharp saw-tooth profile. Onmost locations 5 individual samples (A-E) were taken in a pre-defined spiral-pattern(Fig. 7) with individual distances of 20, 60, 200 and 500 cm. This procedure wasfollowed in order to assess spatial variability on each location. Sampling depths werelargely determined by soil properties and stones but were in general between 4 and10 cm. Photographs were taken at each soil sample hole in order to evaluate terraintype. Overview pictures were similarly taken to evaluate overall terrain. In order tobetter cover the entire area of Narsaarsuk a number of single soil samples were alsotaken. This was also done on a location known from the 2006 Narsaarsuk survey
10
Risø-R-1781(EN)
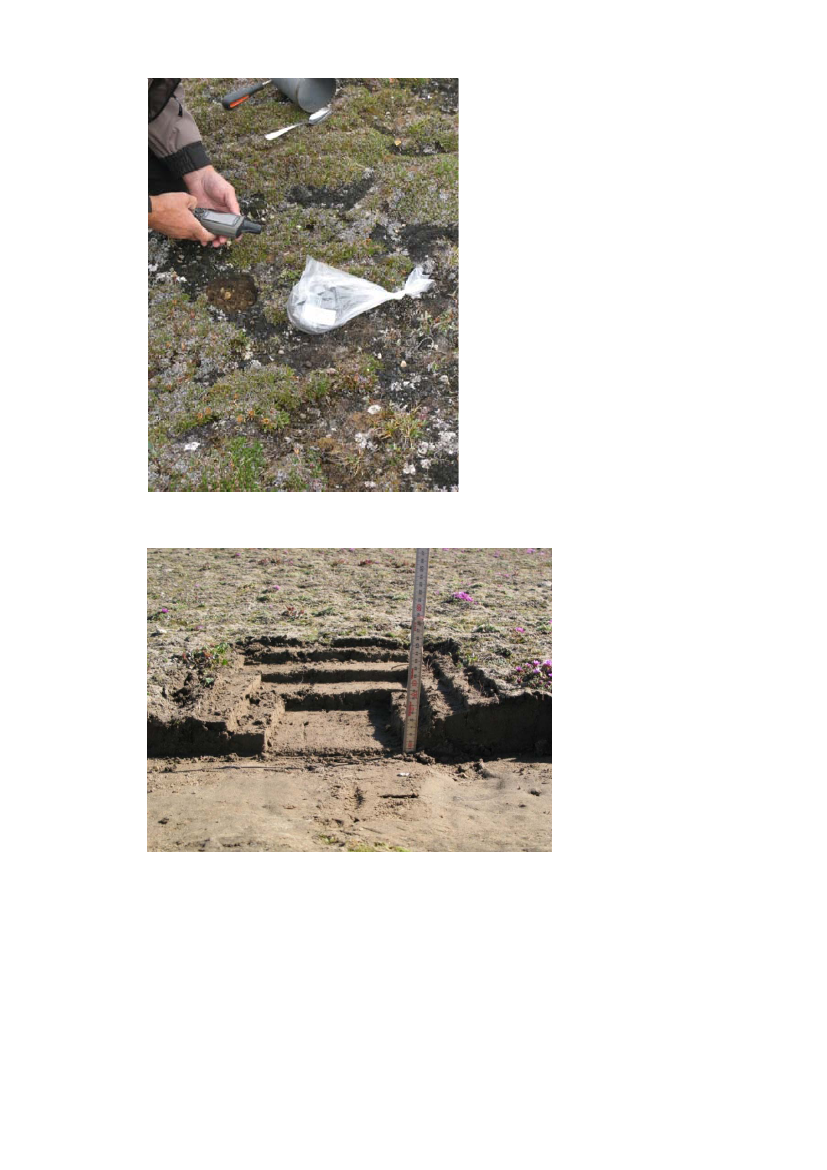
sampling to hold significant plutonium levels. On some few locations bulk sampleswere collected by adding together soil collected from 5 smaller tubes (4 cm diame-ter). Collected soil samples were stored frozen at TAB awaiting transport back toRisø laboratories. During 2007 and 2008 a total of 534 + 84 soil samples were col-lected. Together with the soil samples collected during the survey in 2006 (56 sam-ples) and during the expedition in 2003 (24 samples) a total of 698 soil samples havebeen collected. Each sampling site was marked with a unique number and the posi-tion taken using a GPS (Fig. 9). At a number of locations soil samples were collectedby depth to provide information on depth distribution of the radioactive pollution(Figs. 10 and 11).
Figure 8. Schematic view of the geometry used for sampling of soil. Each location wasgiven a unique number followed by labels A through E for the 5 samples taken.
Risø-R-1781(EN)
11
Figure 9. Sampling of soil and recording of GPS coordinates.
Figure 10. Sampling of soil for depth distribution 0-13 cm, sample no. 2008-4031/39,11-Jul-2008.
12
Risø-R-1781(EN)
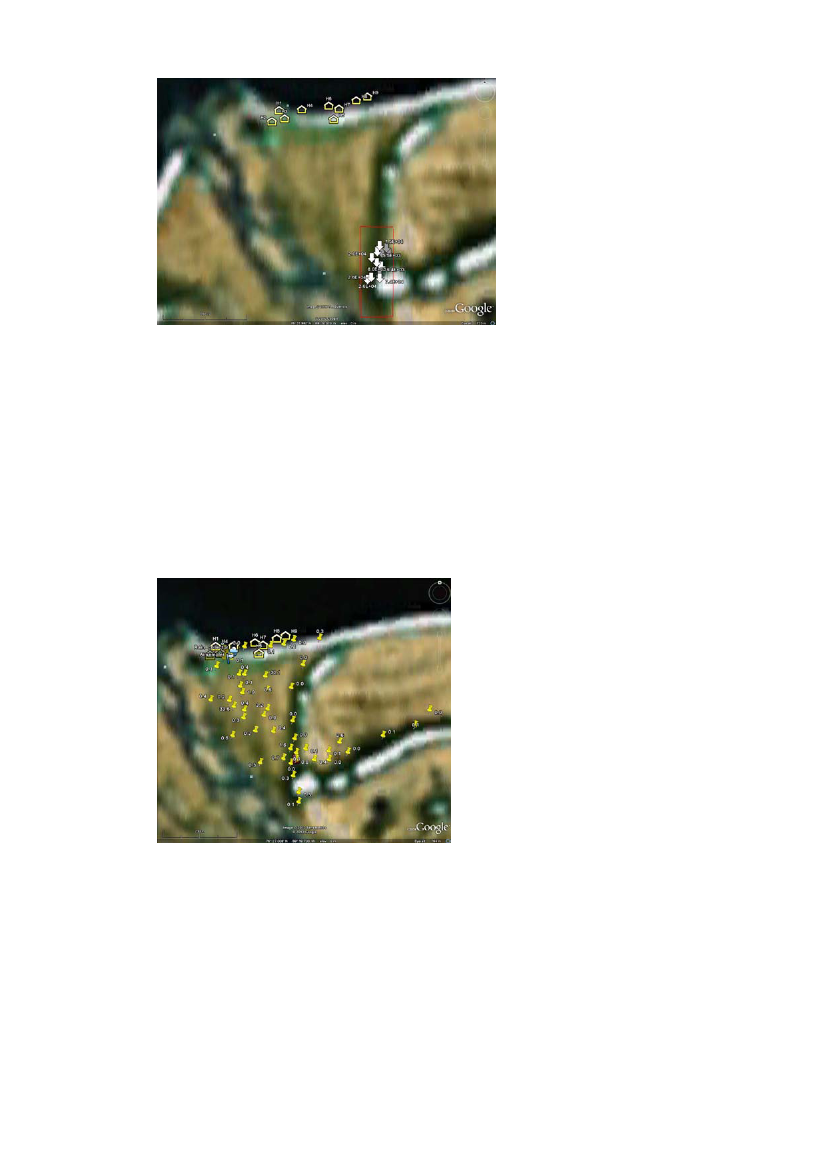
Figure 11. Sites for soil samples collected in 2007 and 2008 () for depth distributionsof Pu/Am at Narsaarsuk. Red rectangle indicates area with elevated levels on ground.Locations of hunting cabins near the coast are indicated.
3.4
Soil particles
In order to get information on radioactivity in small particles on the ground whichmight potentially be available for resuspension, a number of locations were selectedin the Narsaarsuk area where an area of one square metre was vacuumed thoroughly.Fig. 12 shows a map of the Narsaarsuk area indicating the locations of the huntingcabins and the sites where vacuuming was carried out. Fig. 13 illustrates the sam-pling procedure.
Figure 12. Locations at Narsaarsuk for vacuuming of surface soil.
Risø-R-1781(EN)
13
Figure 13. Sampling of particles from a square metre of surface soil using a vacuumcleaner. Sticky-foil frames and collection of soil depth profile in background.
4 Analytical methods4.1Sample preparationSample preparation was carried out to reduce volume and mass of samples prior toradiochemical and radiometric analysis. Standard pre-treatment techniques wereapplied including freeze drying and ashing at 450oC. Samples were sieved to re-move stones larger than 1.5 mm. Methods used for different sample types are sum-marised in Table 1.During evaporation of the precipitation samples care was taken not to lose particu-late material on beaker walls or other surfaces. Evaporation was done in progres-sively smaller beakers and finally in 200 mL containers calibrated for gamma spec-trometry.
Table 1. Methods used for preparation of samples prior to analysis.
Sample typePrecipitationSticky foilAir filterVacuum bagSoil
Freeze dry-ing
Sieving Ashing EvaporationXXXXXX
Chemical treat-mentXXX(X)
X
4.2
Autoradiography
An Amersham Bioscience Storm 820 imaging system was used for autoradiographyof passive aerosol collectors. Wooden plates protecting the passive collectors wereremoved shortly before initiating the autoradiographic measurements and 6 �m My-lar foils were placed on the sticky surfaces to allow for the phosphorus screen to beplaced on the foil without adhering to it. A mounted storage Phosphor screen (Gen-
14
Risø-R-1781(EN)
eral Purpose screens, 35x43 cm) was placed directly on the Mylar foil and thewooden protective plate put back on place to prevent light and dust from reachingthe collector/screen. Collector and phosphorus screen were then inserted in a blackplastic bag during the exposure time which lasted 3 – 14 days. Following exposurethe screen was removed and placed in the read-out unit and the image visualized andstored using associated image software.
4.3
Radiochemistry
Following gamma spectrometric analysis of evaporated precipitation, the sampleswere transferred to glass beakers using water and acid and then evaporated to dry-ness. Following addition of known amounts of242Pu and243Am tracers, the sampleswere digested on a hot plate using aqua regia under watch glass over night. Pluto-nium was separated out using ion exchange chromatography (Chen et al., 2001) andelectroplated onto stainless steel disks. The disks were analysed for Pu isotopes us-ing solid state alpha spectrometry. Counting times were 5-10 days. The Am-fractionof each sample was set aside for future analysis.Glass fibre air filters were folded and pressed into 200 mL containers for gammaspectrometry and later dissolved using HF/HNO3in the presence of known amountsof242Pu and243Am tracers. After removing excess HF by repeated evaporation andaddition of boric acid, samples were treated as the precipitation samples above.Passive aerosol collectors were dry ashed at 500 �C overnight and the ash leached inaqua regia in the presence of known amounts of242Pu and243Am tracers and lateranalysed following the same procedure as precipitation samples above.
4.4
Gamma spectrometry
4.4.1 Laboratory measurementsGamma spectrometric analyses were applied to samples to detect gamma-emittingradionuclides including241Am. The occurrence of small amounts of241Pu (14.3 yhalf life) in the weapons plutonium from the accident has caused build up over timeof the radioactive decay product241Am (433 y half life). Build up of241Am from241Pu occurs slowly over 73 y to a maximum at 3% of the initial241Pu activity levels.Therefore,241Am in samples from Thule is used as an indicator of accident pluto-nium. Americium-241 is detectable by gamma spectrometry due to emission of 60keV gamma rays while plutonium isotopes are not easily detected by gamma spec-trometry and generally require radiochemical preparation and detection by alpha ormass spectrometry. Previous investigations during 2001-2003 of241Am and pluto-nium isotopes in sediment and soil samples from Thule have shown activity ratios of241Am/239+240Pu of 0.16-0.4 (Nielsen and Roos, 2006). Therefore, the activity of239+240Pu in soil is 3-6 times higher than the241Am activity found.
Soil and vacuum-bag samples were analysed by gamma spectrometry after freezedrying (soil only), ashing at 450oC and removal of stones larger than 1.5 mm. Sam-ples were mixed and subdivided into aliquots which were all analysed to ensure thatall gamma-emitting radionuclides above detection limit would be registered. Ex-perience has shown that accident plutonium (and241Am) in soil samples from Thuleare associated with particles and therefore distributed inhomogeneously across allsample sizes. So in order to minimise the risk of not detecting a high-activity parti-cle in a sample, all sample material was analysed. This differs with standard proce-dures according to which a single aliquot after homogenisation is assumed to repre-sent the entire sample. Gamma spectrometric analysis of soil thus proved to be a
Risø-R-1781(EN)
15
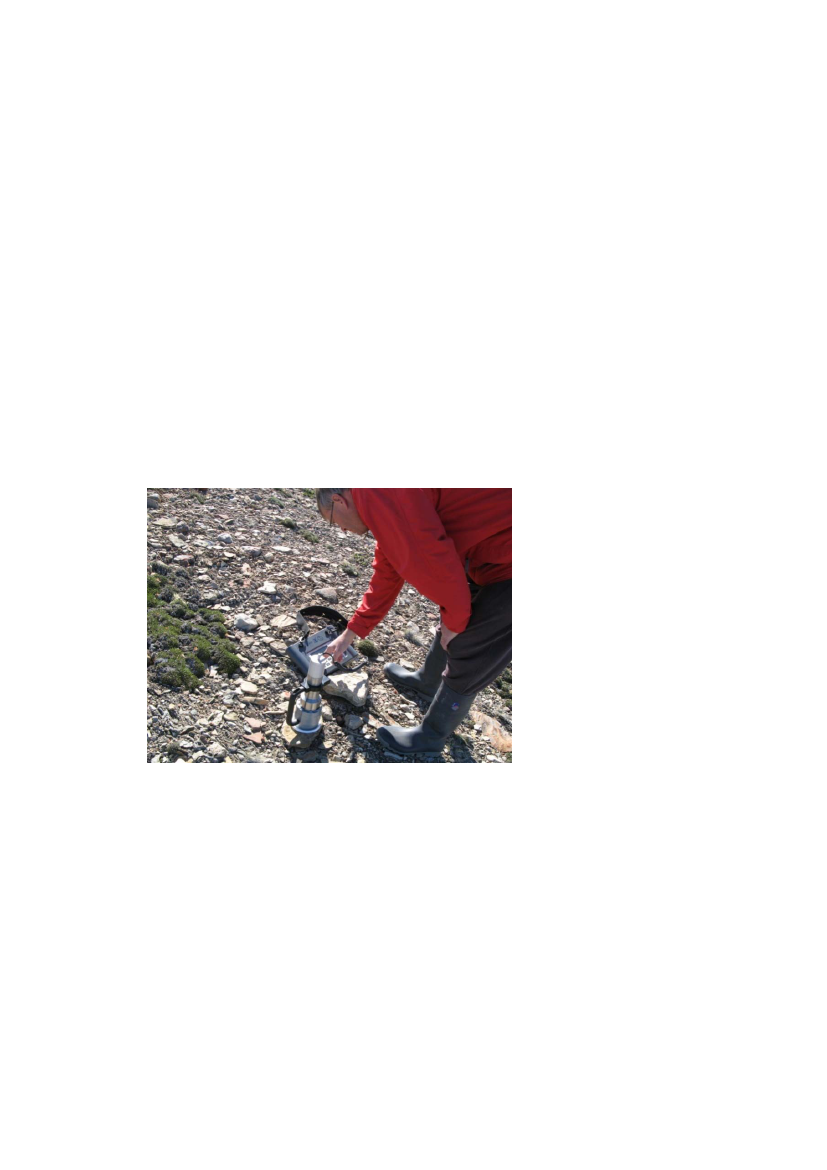
rather comprehensive task of the present project involving about 600 samples col-lected in 2007 and 2008 and analyses of more than 3000 aliquots.The gamma-spectrometric analyses were carried out with high-purity Ge detectorsplaced in 10-cm lead shields. The detectors were calibrated with mixed nuclidegamma-ray standard solutions (including241Am) purchased from Amersham plc.Sample geometries varied from vials with volumes of a few millilitres measured inwell detectors to cylindrical containers with volumes of up to a hundred millilitresmeasured with coaxial detectors. Aliquots in cylindrical geometries had a maximumthickness of 10 mm in order to reduce effects of self absorption. The amounts of241Am in aliquots determined by gamma spectrometry are assumed to be correctwithin a factor of 2 as determined from previous investigations of soil inhomogenei-ties due to high-activity particles (Nielsen and Roos, 2006).4.4.2 Field measurementsField measurements of241Am on the ground were carried out with two sets of port-able equipment using 3”x3” NaI detectors (SAM-935, Berkeley Nucleonics Corpora-tions). The equipment accumulates and stores gamma spectra from which the pres-ence of241Am is assessed by a spectrum peak at 60 keV. Measurements were carriedout by placing detectors vertically either directly on ground or by holding them at 1m above ground, Figs. 14 and 15. In order to reduce influence on detectors ofgamma radiation from horizontal directions, the detectors were supplied with circu-lar shielding made of 2 mm copper and 6 mm lead.
Figure 14. Portable gamma spectrometer for field measurement ofplaced on ground.
241
Am with detector
16
Risø-R-1781(EN)
Figure 15. Portable gamma spectrometer for field measurement ofat 1 m above ground.
241
Am with detector
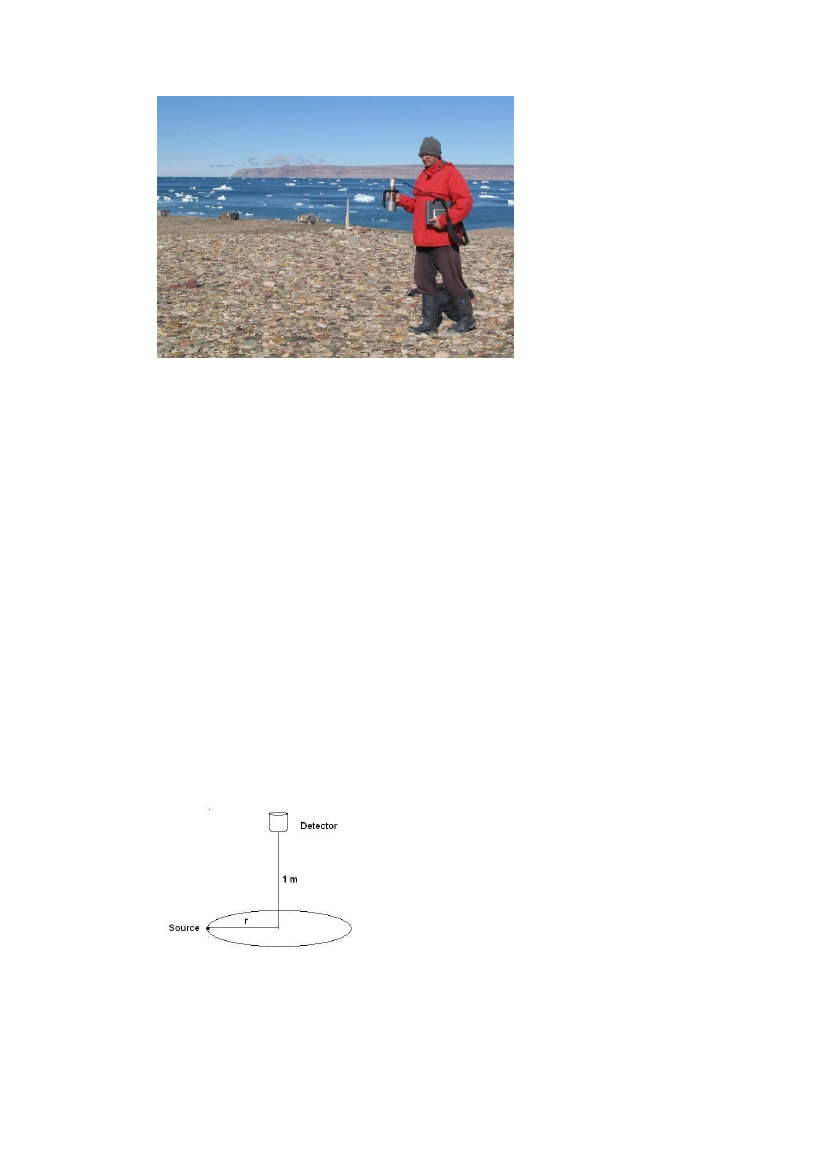
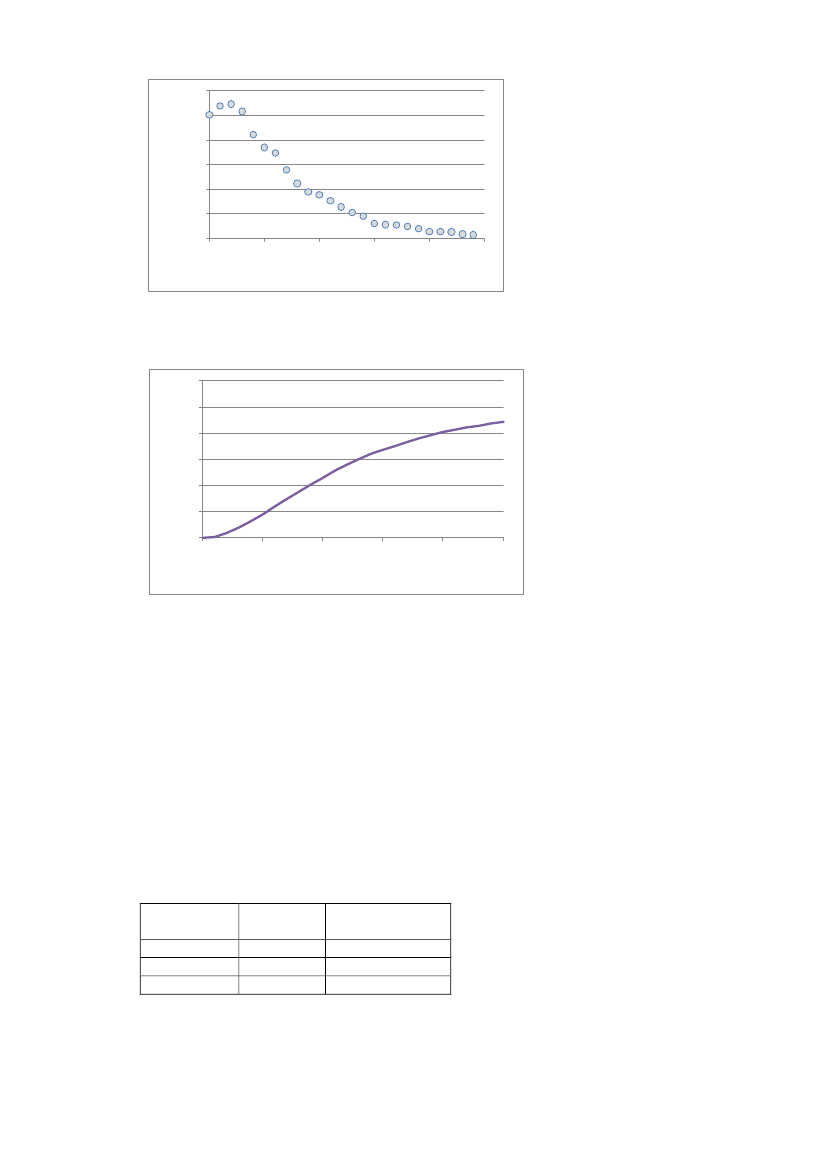
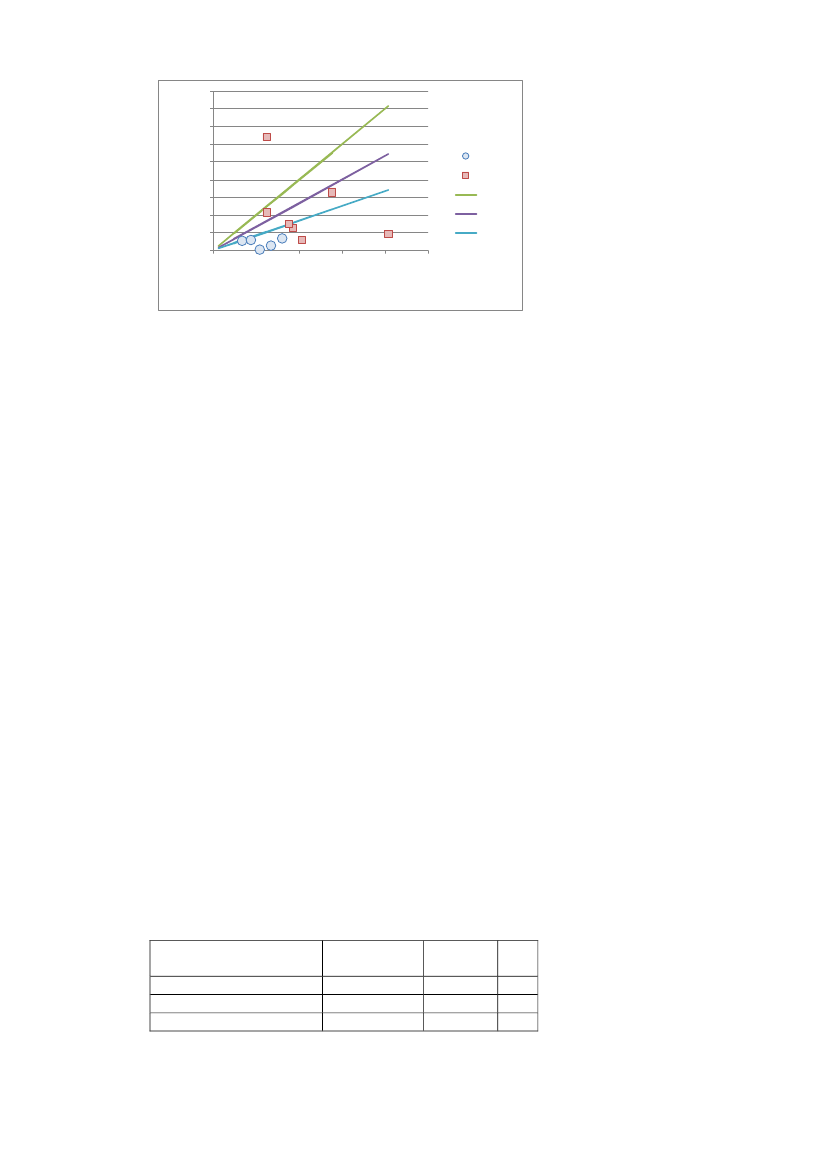
The detectors were calibrated by relating count rate when carried 1 m above groundto concentration of241Am by surface area. This was accomplished with a certified241Am point source (400 kBq) from which the 60-keV count rate was registeredalong a line at 1 m distance from the detector perpendicular to the detector axis, Figs.16 and 17. The detector response was folded with corresponding surface areas yield-ing calibration factor as a function of area considered, Table 2 and Fig 18. The cali-bration factor corresponds to an ideal case of exposing the detector to a smooth ho-mogeneous plane source of241Am which does not correspond to the field situation atThule with uneven terrain and inhomogeneous distribution of241Am on ground.However, the detector integrates and averages radiation in the field from a surfacearea on the ground of several square metres. Therefore, estimates of surface areaconcentrations based on field measurements give important data supplementing thatderived from laboratory analyses of soil samples representing surface areas of 0.01m2only. Due to the strong attenuation of241Am gamma rays in just a few centime-tres of soil, field gamma spectrometric measurements of241Am have limited sensitiv-ity and do not so efficiently detect the presence of very low levels of241Am whenpresent. This is the case when the source material is partly buried in soil and causesan underestimation of the area deposition of241Am (and therefore Pu).
Figure 16. Calibration setup for NaI detector with point source placed at axis off-setdistance r.
Risø-R-1781(EN)
17
30002500
cpm (60 keV)
2000150010005000050100150200250
Axis off set (cm)
Figure 17. Response of NaI detector to 60 keV gamma rays fromplaced perpendicular to the detector axis on a line at 1 m distance.3025
241
Am point source
cpm per kBq/m�
20151050050100150200250
Source radius (cm)
Figure 18. Calibration factor as a function of source area at 1 m distance.
Data was selected from a number of locations where soil samples were taken andfield measurements made within distances less than approx. 10 m. Soil concentra-tions versus detector count rate (with detector on ground and at 1 m) are given inFig. 19, which also shows values of the calibration factor of 10, 15 and 24 cpm perkBq/m2corresponding to different source areas considered. The low correlation be-tween concentration and count rate is due to terrain roughness and non-uniform soilconcentrations. Data from locations with the detector on ground is close to themaximum theoretical value of the calibration factor (24 cpm per kBq/m2). A calibra-tion factor value of 15 cpm per kBq/m2was chosen for converting detector count ratein the field at 1 m to surface concentration on ground of241Am.Table 2. Calibration factors for portable NaI detector to a smooth plane241Am source at1 m distance as a function of source area.
Source radius Source area Calibration factor(m)(m2)(cpm per kBq/m2)0.92.5101.351545024
18
Risø-R-1781(EN)
9080
Concentration (kBq/m�)
70605040302010002004006008001000Ground1mCal10Cal15Cal24
Count rate (cpm)
Figure 19. Concentration of241Am on ground (kBq m-2) versus detector count rate (cpm)for different calibration factors compared with results from laboratory analyses of soilsamples collected near sites where observations were made with detector on ground(Ground) and at 1 m above ground (1 m).
4.5
Analytical quality
Reliability of Risø’s analytical results on plutonium isotopes,241Am and other ra-dionuclides is tested regularly by participation in international intercomparison exer-cises on laboratory analyses of radionuclides in environmental samples. For the last10 years Risø has participated in about 2 international intercomparisons per yearmany of which have included plutonium and americium in environmental samples.The intercomparisons demonstrate good quality of Risø’s analytical results (Fogh2000; Fogh et al. 2002; IAEA 1999, 2000a, 2000b, 2001, 2004, 2005, 2007a, 2007b,2009a, 2009b, 2009c, 2010a, 2010b; Nielsen, 1996, 2004; NPL, 2006, 2008; Outolaet al., 2008).
5 Results5.1Air
5.1.1 Air filtersData on plutonium from the active aerosol sampler is shown in Table 3. Plutoniumwas detected in filters from all three collection periods although at very low levels.The low Pu concentrations measured in the current set of air filters did not allow fordetection of the low-abundance238Pu isotope thus preventing the use of the isotoperatio238Pu/239+240Pu to tell about the origin of the plutonium. The visual appearanceof the filters following collection showed very low mass loading indicating very lowconcentrations of resuspended material during the collection periods.Table 3. Air concentrations of239+240Pu obtained from the active aerosol sampler at Nar-saarsuk.
Volume of air239+240Pu 1 sd(m3)(nBq m-3) (%)1-13 August 2007285751.4403-14 July 2008224404.62414 July – 13 August 2008512654.313Collection period
Risø-R-1781(EN)
19
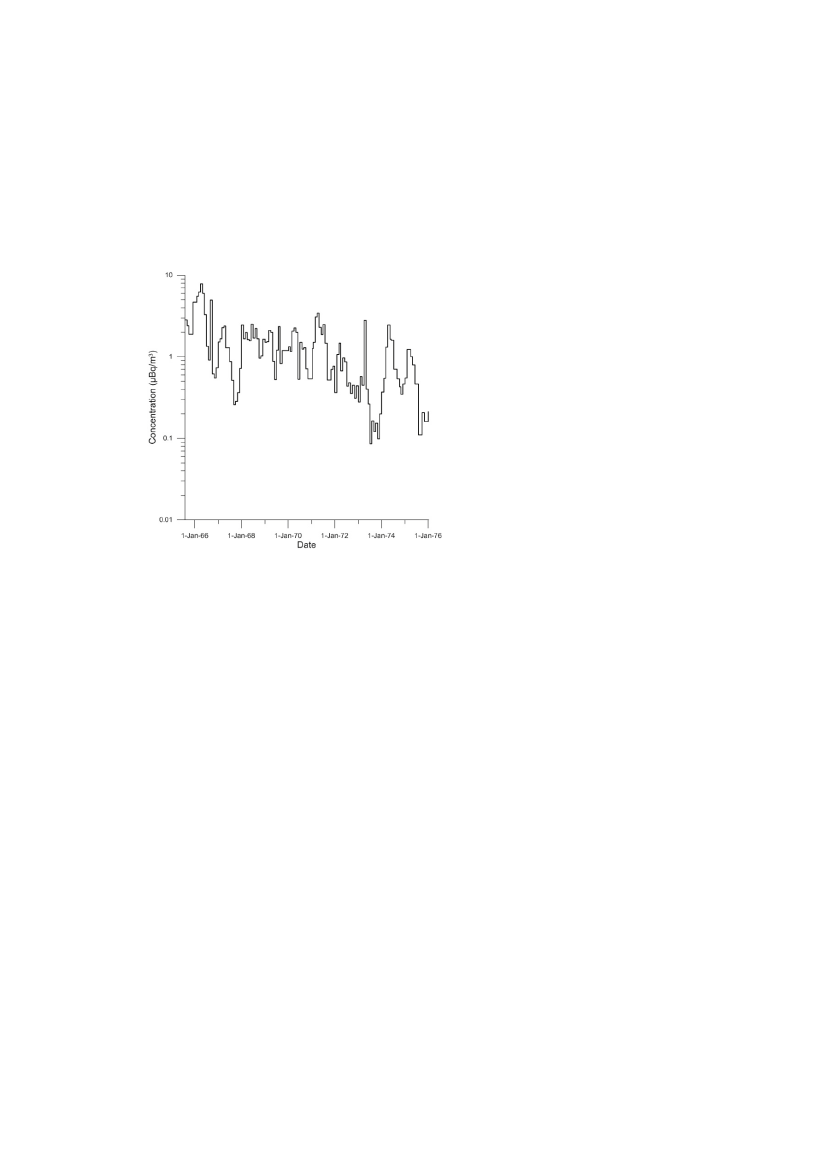
These concentrations may be compared with levels recorded from routine monitor-ing of plutonium in air performed by the US Environmental Measurements Labora-tory at the Thule Air Base during the years 1966-1976 (NUSTL, 2011). In thoseyears Pu-concentrations were about three orders of magnitude higher than today, inthe range 0.1-10μBq m-3(Fig. 20), due to atmospheric nuclear weapons testing.During 1990-1998 average concentrations of239+240Pu in samples of ground-level aircollected quarterly in Northern Germany were observed in the range 0.4-4 nBq m-3(Wershofen and Arnold, 1999). Concentrations of239+240Pu in surface air in Pragueduring 1997-2006 were found in the range 0.5-5 nBq m-3(Hölgye, 2008).
Figure 20. Plutonium-239,240 levels in air at Thule recorded by US EnvironmentalMeasurements Laboratory during 1966-1976 (NUSTL, 2011).
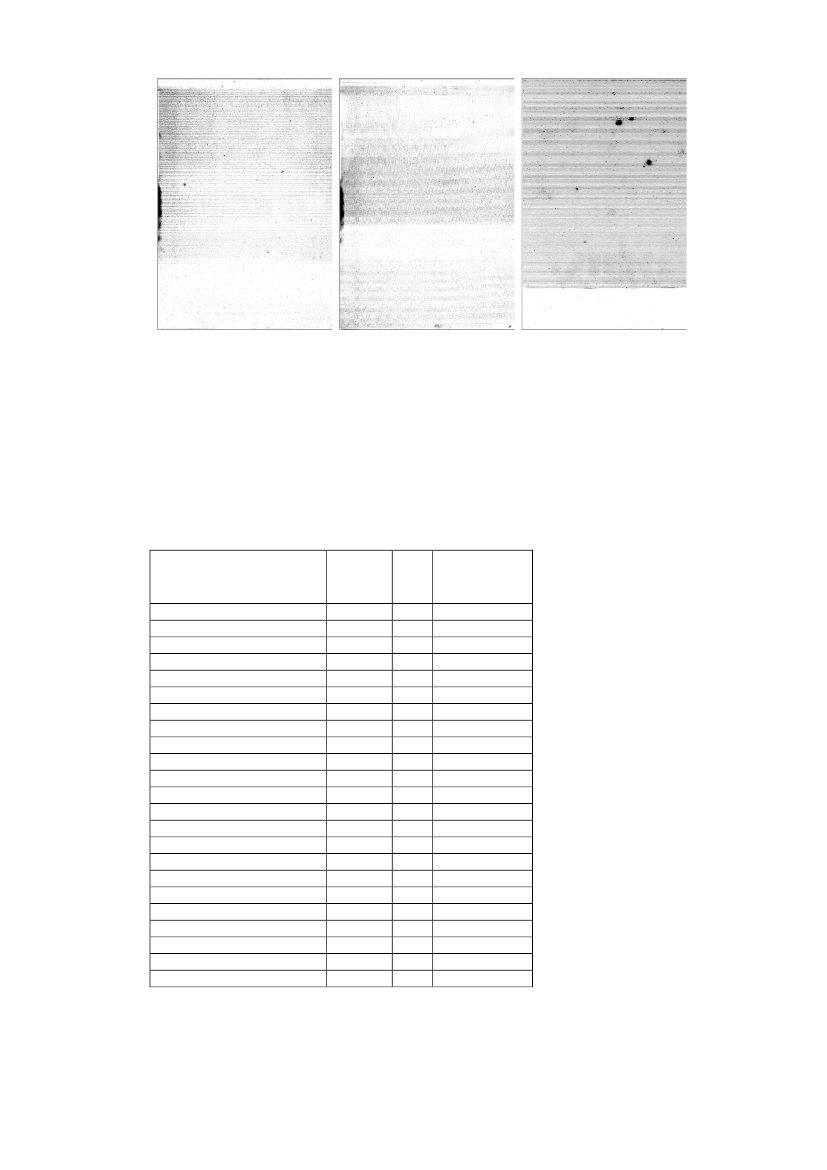
5.1.2 Sticky foilsNone of the 24 autoradiographic images of the passive aerosol collectors showed anysign of high-activity particles or excess radioactivity. Variable background condi-tions, position on the screen, instrument scanning properties, exposure time of thephosphorus screen and integration area of the exposed screen all influence the detec-tion limit in this method. Assuming all activity appearing as discrete particles, anapproximate detection limit of 50 mBq of alpha radioactivity can be assigned to anexposure time of one day.
20
Risø-R-1781(EN)
Figure 21. Autoradiographyimage A.
Figure 22. Autoradiographyimage B.
Figure 23. Autoradiogra-phy image C.
Table 4. Data on239+240Pu found on passive aerosol collectors showing collector posi-tion, Pu activity found on collector, analytical uncertainty, and derived air concentra-tion. DL in third column (1 sd) indicates that plutonium is below the detection limit thevalue of which is given in the second column. The fourth column shows calculated val-ues of air concentrations assuming average wind speed of 1 m/s, constant air concentra-tions and that the passive collectors trap all plutonium bearing particles present in airduring the exposure period (14 days in 2007 and 50 days in 2008).
Collector position,direction and yearHouse 1 West 2007House 2 South 2007House 4 West 2007House 8 South 2007House 7 West 2007House 5 South 2007House 3 East 2007House 6 East 2007House 9 East 2007House 2 South 2008House 3 West 2008House 4 South 2008House 5 South 2008House 2 East 2008House 2 West 2008House 2 South 2008House 1 West 2008Hotspot-1 2007 SouthHotspot-1 2007 NorthwestHotspot-1 2007 EastHotspot-1 2008 SouthHotspot-1 2008 NorthwestHotspot-1 2008 Northeast
239+240
Pu 1 sd Calculated air(mBq) (%) concentration(nBq m-3)0.120.020.080.030.010.040.110.080.160.030.070.040.060.080.470.050.220.560.060.530.370.741.0411503850DL28152012DLDL302035145020620121611120.440.060.300.110.050.150.380.290.580.030.080.050.070.100.550.050.250.650.070.620.430.861.20
Two autoradiography images of passive aerosol collectors and one autoradiographyimage of a Thule soil sample with two high-activity particles present are shown in
Risø-R-1781(EN)
21
Figs. 21-23 where images A and B are from passive collectors and image C from thesoil sample. Exposure times for images A and B were 4 and 6 days respectively,while image C had an exposure time of 12 h only.Dissolution of the passive aerosol collectors followed by chemical separation andsolid state alpha spectrometry showed the presence of low levels of plutonium. Thehighest amount of plutonium on a passive collector was 1 mBq (Table 4).Interpretation of plutonium found on the passive collectors in terms of air concentra-tions is not straight forward. The intention was originally to use data on ambient sta-ble elements like Al, Ti or Zr from both passive and active aerosol collectors in orderto calculate the equivalent volume of air to which the passive collectors were ex-posed. The concentrations of stable elements in the passive collectors were, how-ever, entirely made up of small amounts of blank material in the collectors them-selves. The amount of resuspended material on the collectors was visibly observed tobe very low or even not detectable.Rough estimates of the air concentrations from the passive collector data were madeassuming average wind speed of 1 m/s and constant air concentrations and that thepassive collectors trap all plutonium bearing particles present in air during the expo-sure period. The activity concentrations obtained in this way are given in Table 4. Agraphical summary of air concentration data from the active aerosol sampler and cal-culated from passive collectors are given in Fig. 24.
Pu-concentration in air at Thule10Active air samplerPassive collector at hot areas
1[nBq m-3]
0.1
0.0105101520253035
Air sampler or passive collector
Figure 24. Summary of Pu-concentrations in air obtained from the active air samplerand concentrations calculated from passive collectors using data in Table 4.
5.2
Precipitation
Results of analyses of239+240Pu in samples of precipitation are shown in Table 5.Data on concentrations of Pu in air and rain from samples collected simultaneouslyare rare. However, data is available on fallout radionuclides and on7Be and210Pbwhich shows that so-called washout or scavenging ratios of volume concentrations inrain to those in air are in the order of 106(Aarkrog, 1979; McNeary and Baskaran,
22
Risø-R-1781(EN)
2003). In the current data set we may use the7Be data from the collected precipita-tion and air samples, this show a wash-out ratio of about 2 106. Application of thisratio to the precipitation data of plutonium yields corresponding air concentrations inthe sub μBq m-3range which is 2-3 orders of magnitude higher than actually meas-ured (see Fig. 24). This probably reflects a combination of the stochastic nature ofcollecting resuspended plutonium particles and that washout ratios for radioisotopeswhich are well mixed in the lower atmosphere do not apply to locally resuspendedradioisotopes.
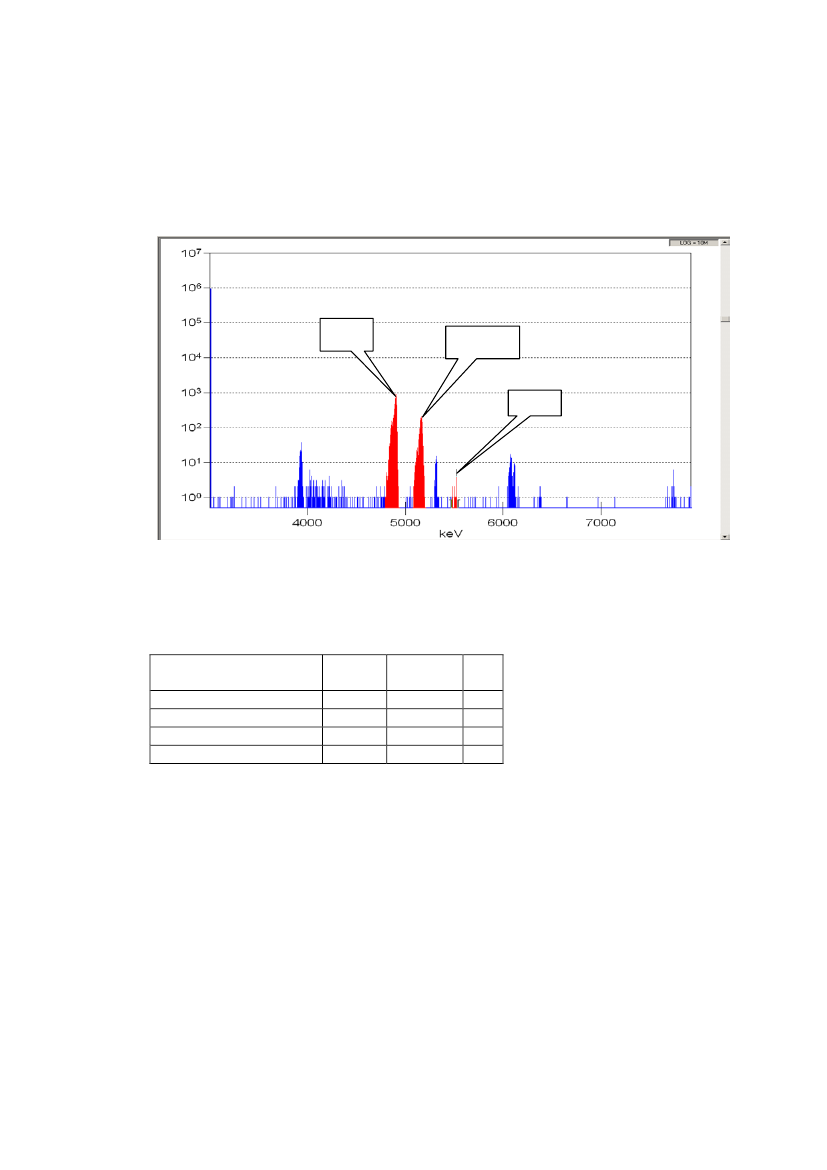
242
Pu
239+240
Pu
238
Pu
Figure 25. Plutonium alpha spectrum from rain sample collected at Narsaarsuk during14 July – 13 August 2008.
Table 5. Concentrations of239+240Pu in precipitation collected at Narsaarsuk.
Collection period1-13 August 20073-14 July 200814 July – 13 August 200813-24 August 2008
Volume239+240Pu 1 sd(L)(mBq L-1) (%)2.31.98.35.40.010.510.800.42408611
The plutonium alpha spectrum from the rain sample collected during 14 July – 13August 2008 is shown in Fig. 25. The concentration of239+240Pu in the sample was0.8 mBq L-1(total 6.6 mBq). The relatively high concentration and the low238Pu/239+240Pu ratio of 0.015 indicate plutonium originating from the accident in1968. A comparison between volumes of precipitation collected by the rain sampler(RS) and values recorded by the weather station (WS) indicates a systematic differ-ence of 30% (VWS/VRS= 0.7).
5.3
Soil
Results on241Am in soil were obtained from field measurements and from laboratoryanalyses of soil samples covering surface samples and depth profiles.
Risø-R-1781(EN)
23
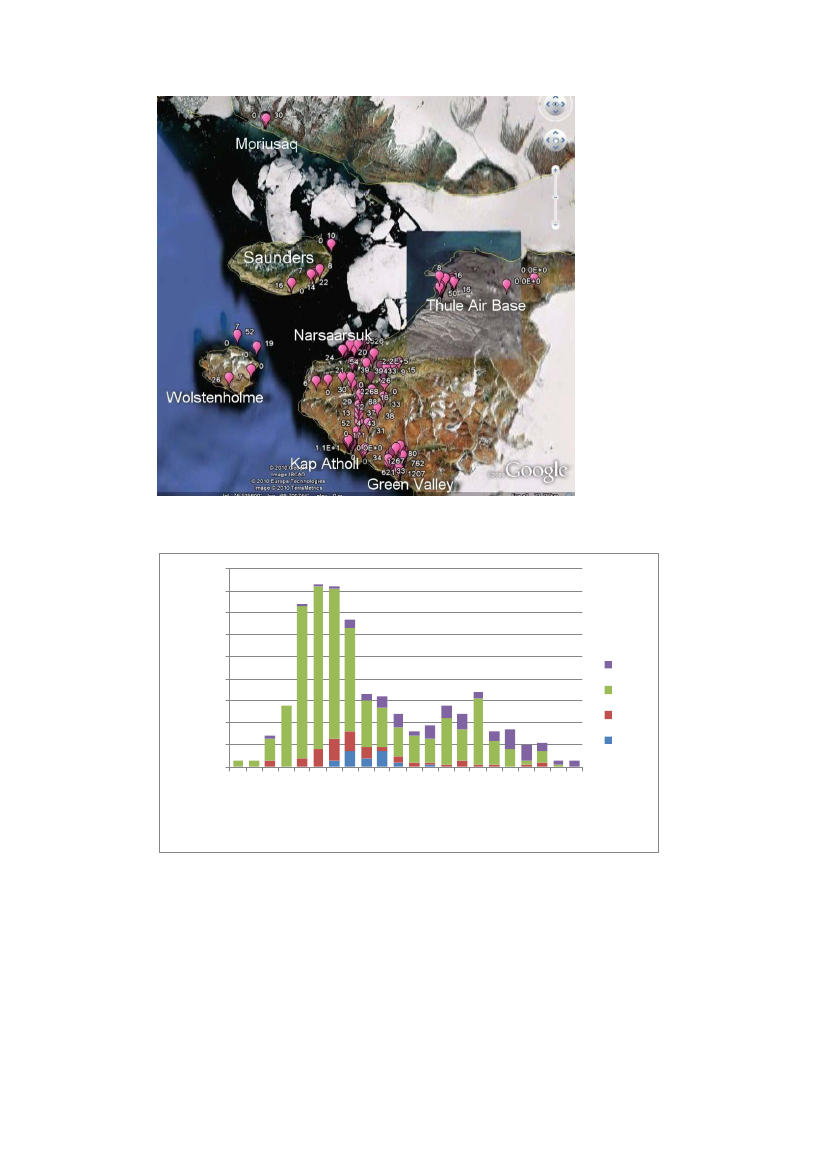
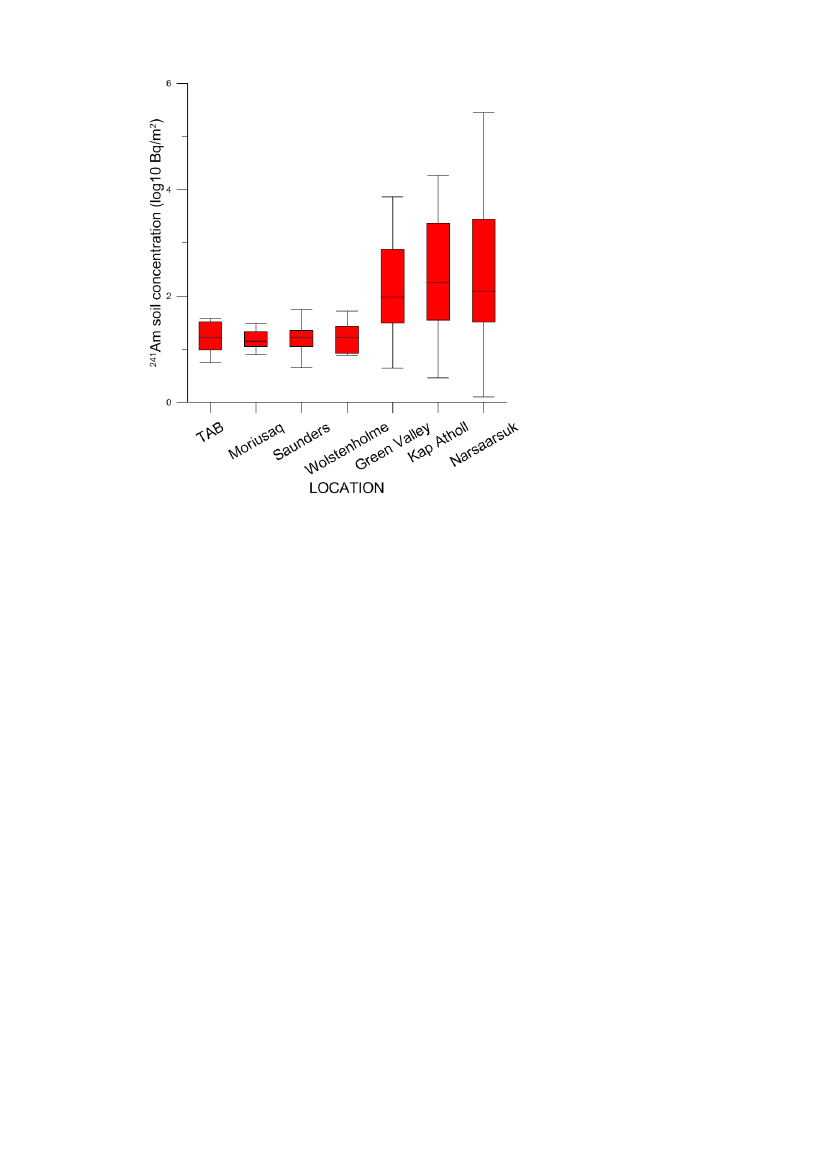
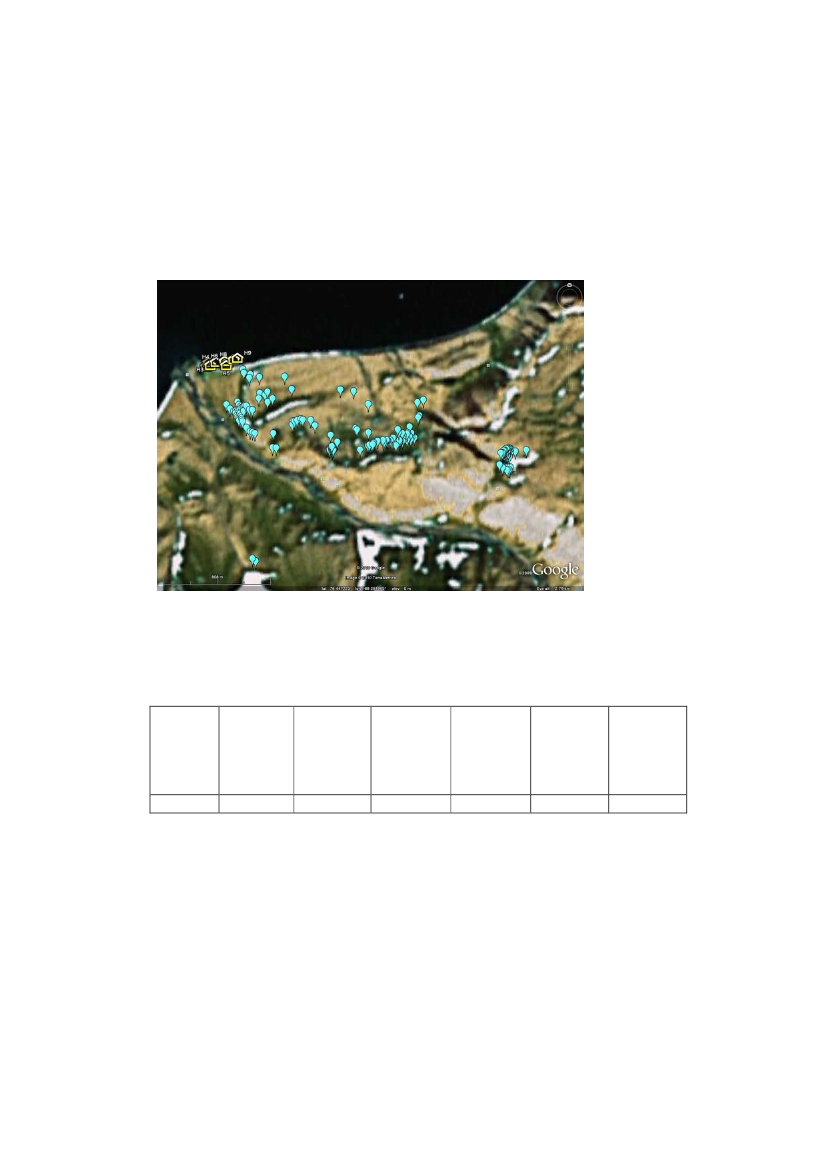
5.3.1 Soil samplesSampling of soil during 2003-2008 comprised 24 soil cores collected in 2003, 56 in2006, 534 in 2007 and 84 in 2008. Soil sampling in 2007 was particularly compre-hensive and covered Green Valley, Kap Atholl, Wolstenholme Island, Saunders Is-land, Moriusaq and Thule Air Base in addition to the Narsaarsuk area. Soil samplingin 2008 focused on areas with elevated levels. Locations for soil samples collectedduring 2003-2008 are shown in Fig. 26. Graphical overviews of the data on241Amare given in Fig. 27 showing a histogram of the results above detection limit by yearof collection and in Fig. 28 showing the data by location in Box-Whisker plots. Thelatter show minimum, maximum, median, lower quartile and upper quartile valuesfor the data.
The histogram distribution of the results is bimodal with lower levels of241Am in therange 0.002-1 kBq m-2peaking at about 0.04 kBq m-2, and higher levels in the range1-300 kBq m-2peaking at about 10 kBq m-2. Summaries of241Am results by area aregiven in Table 6 showing number of samples, minimum and maximum values,arithmetic means and standard deviations, and geometric means and geometric stan-dard deviations.Table 6. Summary of241Am concentrations in soil by location (kBq m-2).
Area
Num-ber ofsam-ples
Mini-mum(kBqm-2)
Maxi-mum(kBq m-2)
Arith-meticmean(kBq m-2)
Thule AirBaseMoriusaqSaundersIslandWolsten-holme Is-landGreen Val-leyKap AthollNarsaarsuk
2981716
< 0.002< 0.002< 0.002< 0.002
0.0380.0310.0560.053
0.0200.0170.0190.022
Arith-meticstandarddevia-tion(kBq m-2)0.0110.0080.0130.017
Geo-metricmean(kBq m-2)
Geo-metricstan-darddevia-tion1.81.61.92.1
0.0170.0150.0160.017
2840428
0.004< 0.002< 0.002
7.419280
0.871.66.6
1.83.421
0.160.270.28
7.39.315
24
Risø-R-1781(EN)
Figure 26. Locations for soil samples collected during 2003-2008.
90807060
Number
504030201002.E+03.E+06.E+01.E+12.E+13.E+16.E+11.E+22.E+23.E+26.E+21.E+32.E+33.E+36.E+31.E+42.E+43.E+46.E+41.E+52.E+53.E+5
2008200720062003
241Am (Bq/m2)
Figure 27. Histogram of241Am in soil (Bq m-2) determined from laboratory analyses ofsoil samples collected during 2003-2008.
Risø-R-1781(EN)
25
Figure 28. Box-Whisker plots of241Am soil concentrations (log10 Bq m-2) by location.
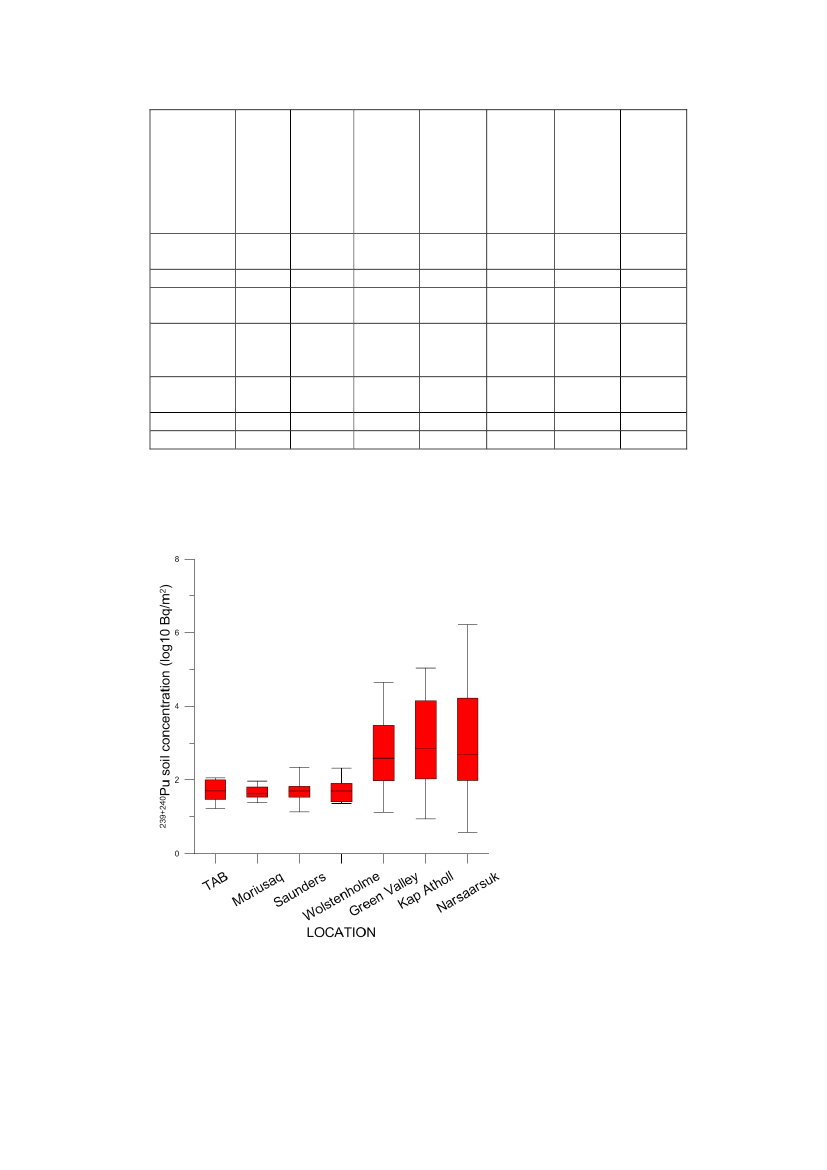
Concentrations in soil of241Am at Thule Air Base, Moriusaq, Saunders Island andWolstenholme Island are low and at background levels. Concentrations at KapAtholl, Green Valley and at Narsaarsuk, however, are higher and clearly influencedby radioactive pollution from the accident in 1968. Highest concentrations are foundat Narsaarsuk which also shows the highest variability. A number of sampling loca-tions in the different areas showed non detectable area deposition of241Am. Theselocations are in principle those having very little or no vegetation (eg. sandy and/orstony areas).Concentrations of plutonium in soil are estimated from those of241Am by taking intoaccount variation of241Am/239+240Pu ratios from 0.16 which is characteristic for plu-tonium from the Thule accident (Nielsen and Roos, 2006) to 0.4 which is character-istic for background levels of global fallout (Michel et al., 2002). Radiochemicalanalyses of soil samples collected at Narsaarsuk in 2003 with241Am concentrationsin the range 0.05-1 kBq m-2showed an average Am/Pu ratio of 0.27. Therefore, for241Am concentrations in soil below 0.05 kBq m-2we use a Pu/Am ratio of 3, for241Am concentrations in the range 0.05-1 kBq m-2we use a Pu/Am ratio of 4 and for241Am concentrations above 1 kBq m-2we use a Pu/Am ratio of 6.The estimated concentrations of plutonium in soil are summarized by location in Ta-ble 7 and shown in Box-Whisker plots in Fig. 29. Concentrations are low and atbackground levels at Thule Air Base, Moriusaq, Saunders Island and WolstenholmeIsland whereas concentrations at Kap Atholl, Green Valley and Narsaarsuk are sig-nificantly higher and show large variability. The integrated deposition density of239+240Pu on the northern hemisphere due to global fallout from nuclear weapons test-ing is 39 Bq m-2(UNSCEAR, 1982).
26
Risø-R-1781(EN)
Table 7. Summary of239+240Pu concentrations in soil by location (kBq m-2).
Area
Num-ber ofsam-ples
Mini-mum(kBqm-2)
Maxi-mum(kBqm-2)
Arith-meticmean(kBqm-2)
Thule AirBaseMoriusaqSaundersIslandWolsten-holme Is-landGreen Val-leyKap AthollNarsaarsuk
2981716
< 0.006< 0.006< 0.006< 0.006
0.110.0920.220.21
0.0590.0500.0620.074
Arith-meticstandarddevia-tion(kBqm-2)0.0320.0250.0530.071
Geo-metricmean(kBqm-2)
Geo-metricstan-darddevia-tion1.81.62.02.3
0.0500.0450.0490.054
2840428
0.013< 0.006< 0.006
441101700
5.09.539
1121130
0.621.21.1
9.21219
Figure 29. Box-Whisker plots of239+240Pu soil concentrations (log10 Bq m-2) by location.
Risø-R-1781(EN)
27
5.3.2 Soil depth profilesIn 2003 soil cores were collected at 8 locations in the Narsaarsuk area to investigatedepth distributions of plutonium. Results showed that accident plutonium was foundin all samples and very inhomogeneously distributed with maximum concentrationsin upper soil layers and239+240Pu levels in the range 0.01-7 kBq m-2(Nielsen andRoos, 2006).
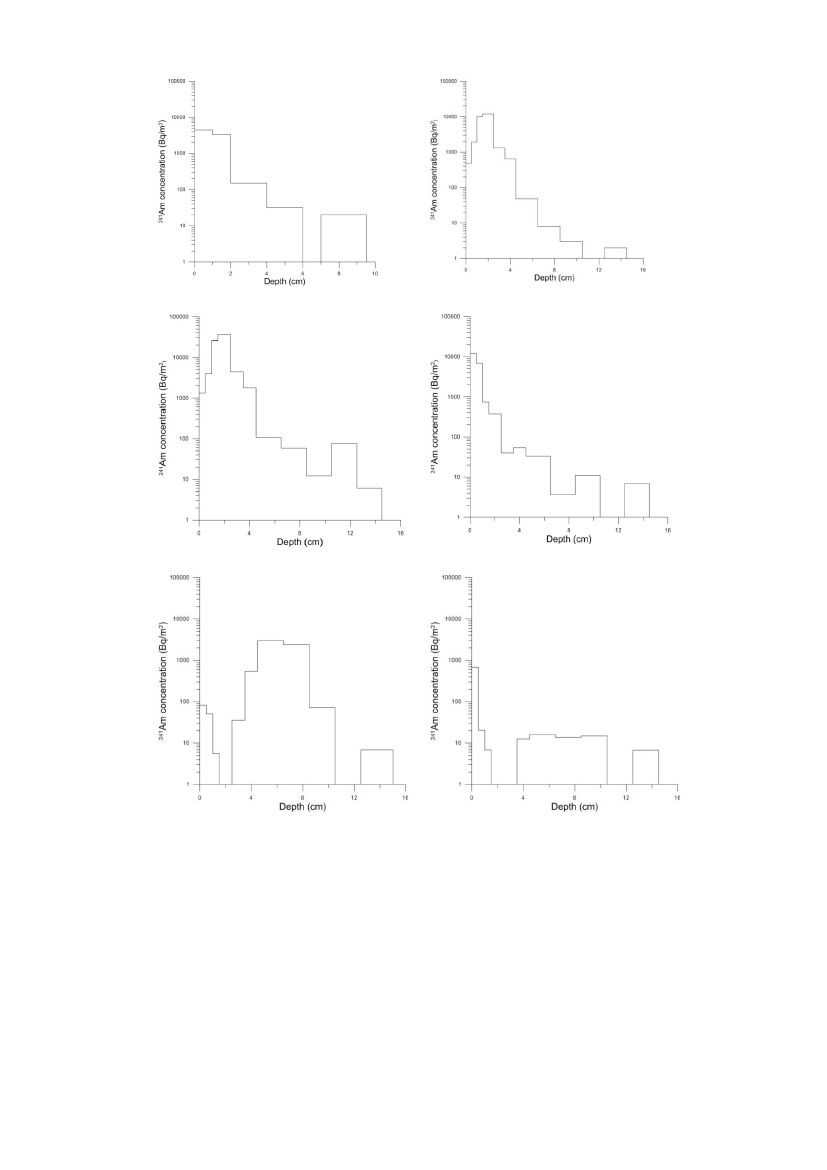
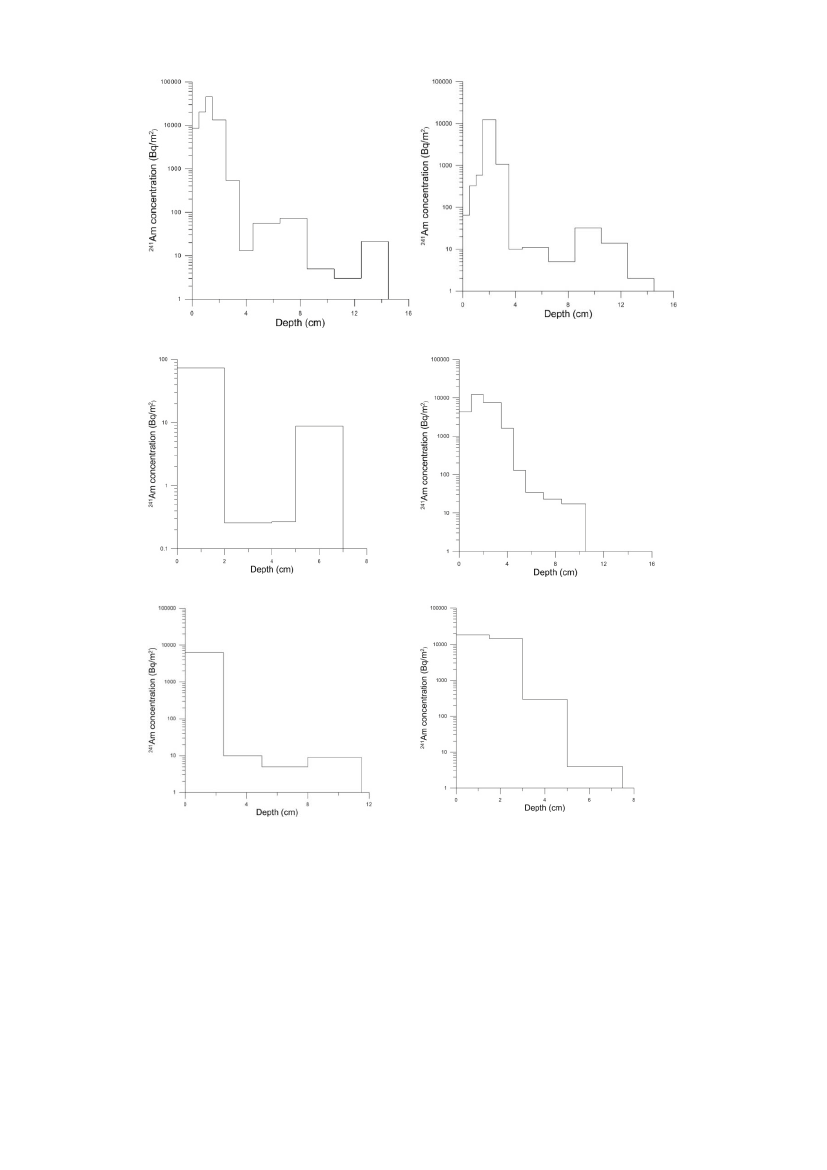
In 2007 and 2008 this was further investigated by collecting samples from one of theareas at Narsaarsuk with elevated levels of accident plutonium (Hot Spot 1 about 400m south of the hunting cabins, Fig. 30). Soil profiles were obtained from 12 siteswithin 90 m from each other and with soil concentrations of241Am in the range 6-86kBq m-2corresponding to239+240Pu concentrations in the range 40-500 kBq m-2.Maximum concentrations were generally found in the upper soil layers, 0-2 cm, con-taining up to 90% of the whole area inventory (Figs. 31-42).
Figure 30. Hot Spot 1 (red rectangle) about 400 south of the hunting cabins at Narsaar-suk.
28
Risø-R-1781(EN)
Figure 31. Soil depth profile, sample 2007-4762.Total241Am concentration 8.0 kBq m-2.
Figure 32. Soil depth profile, sample 2007-4763.Total241Am concentration 26 kBq m-2.
Figure 33. Soil depth profile, sample 2007-4764.Total241Am concentration 74 kBq m-2.
Figure 34. Soil depth profile, sample 2007-4765.Total241Am concentration 20 kBq m-2.
Figure 35. Soil depth profile, sample 2007-4766.Total241Am concentration 6.2 kBq m-2.
Figure 36. Soil depth profile, sample 2007-4767.Total241Am concentration 0.8 kBq m-2.
Risø-R-1781(EN)
29
Figure 37. Soil depth profile, sample 2007-4768.Total241Am concentration 86 kBq m-2.
Figure 38. Soil depth profile, sample 2007-4769.Total241Am concentration 15 kBq m-2.
Figure 39. Soil depth profile, sample 2007-7308.Total241Am concentration 5.5 kBq m-2.
Figure 40. Soil depth profile, sample 2008-4031/39. Total241Am concentration 26 kBq m-2.
Figure 41 Soil depth profile, sample 2008-4040/43.Total241Am concentration 6.4 kBq m-2.
Figure 42 Soil depth profile, sample 2008-4044/47. Total241Am concentration 33 kBq m-2.
5.3.3 Field measurementsA large number of field measurements were carried out with portable equipment as ascreening procedure to identify areas with elevated levels of241Am on ground. Fig.43 shows locations for field measurements made with detector at 1 m above ground.
The results are summarised in Table 8 showing number of samples, minimum andmaximum values, arithmetic mean and standard deviation, geometric mean and
30
Risø-R-1781(EN)
geometric standard deviation. The histogram distribution of the results is shown inFig. 44. The variability of the results is lower than that from analyses of soil sam-ples. The results of field measurements of241Am on ground range between 2 and 50kBq m-2.An overview of241Am levels on ground based on analyses of soil samples and fieldmeasurements is shown in the histogram in Fig. 45. The data here shows a distribu-tion where the bimodal structure is more pronounced than from the soil data alone(Fig. 27). The reason is that the field measurements focused on areas with elevatedlevels of contamination.
Figure 43. Map of Narsaarsuk area showing hunting cabins and locations for field mea-surements of241Am on ground.
Table 8. Summary of concentrations of241Am in soil from field measurements.
Numberof loca-tions
Mini-mum(kBq m-2)
Maxi-mum(kBq m-2)
Arithme-tic mean(kBq m-2)
180
1.5
48
13
Arithme-tic stan-dard de-viation(kBq m-2)8
Geomet-ric mean(kBq m-2)
Geomet-ric stan-darddeviation2.0
10
Risø-R-1781(EN)
31
50454035302520151050
Number
1.0E+3
1.5E+3
1.5E+4
2.2E+4
3.2E+4
2.2E+3
3.2E+3
4.6E+3
6.8E+3
241Am (Bq/m2)
1.0E+4
Figure 44. Histogram of data from field measurements ofground (Bq m-2).
241
Am made at 1 m above
90807060
Number
504030201002.E+03.E+06.E+01.E+12.E+13.E+16.E+11.E+22.E+23.E+26.E+21.E+32.E+33.E+36.E+31.E+42.E+43.E+46.E+41.E+52.E+53.E+5
4.6E+4FIELDLABRisø-R-1781(EN)
241Am (Bq/m2)
Figure 45. Histogram of data on241Am in soil (Bq m-2) determined from laboratoryanalyses of soil samples and field measurements.
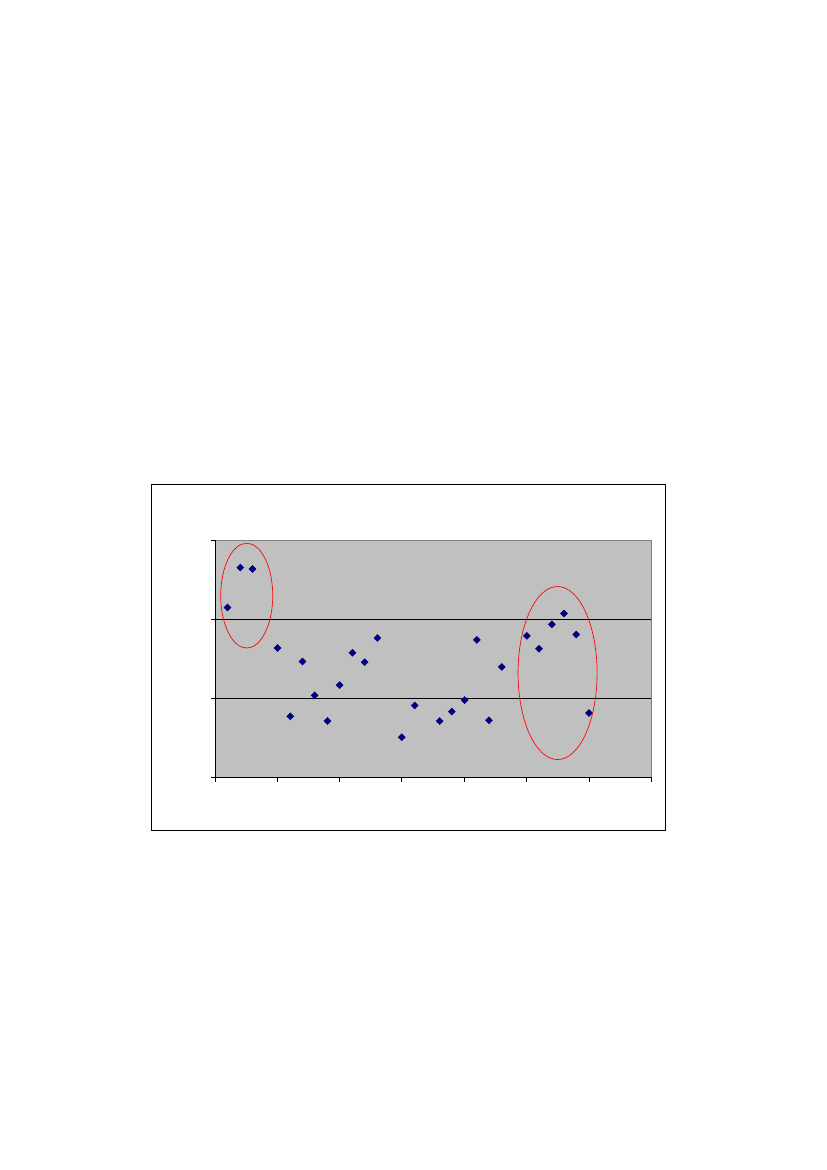
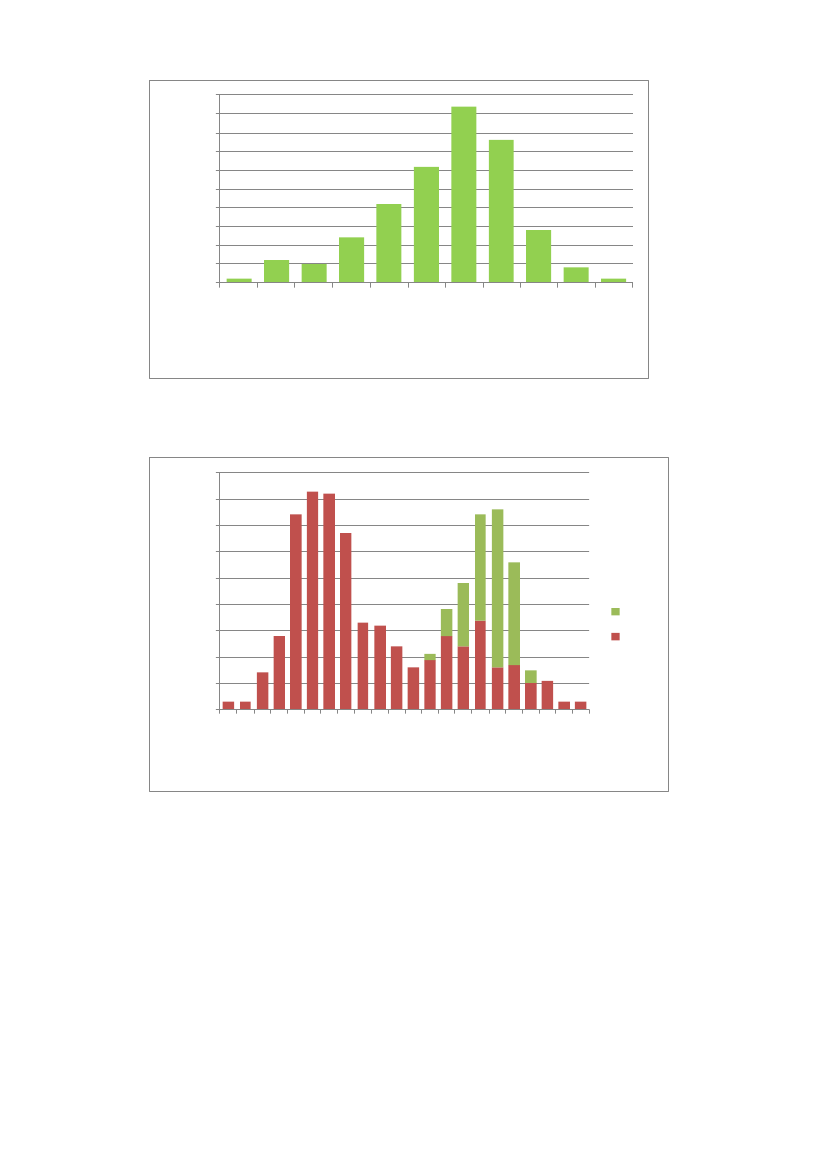
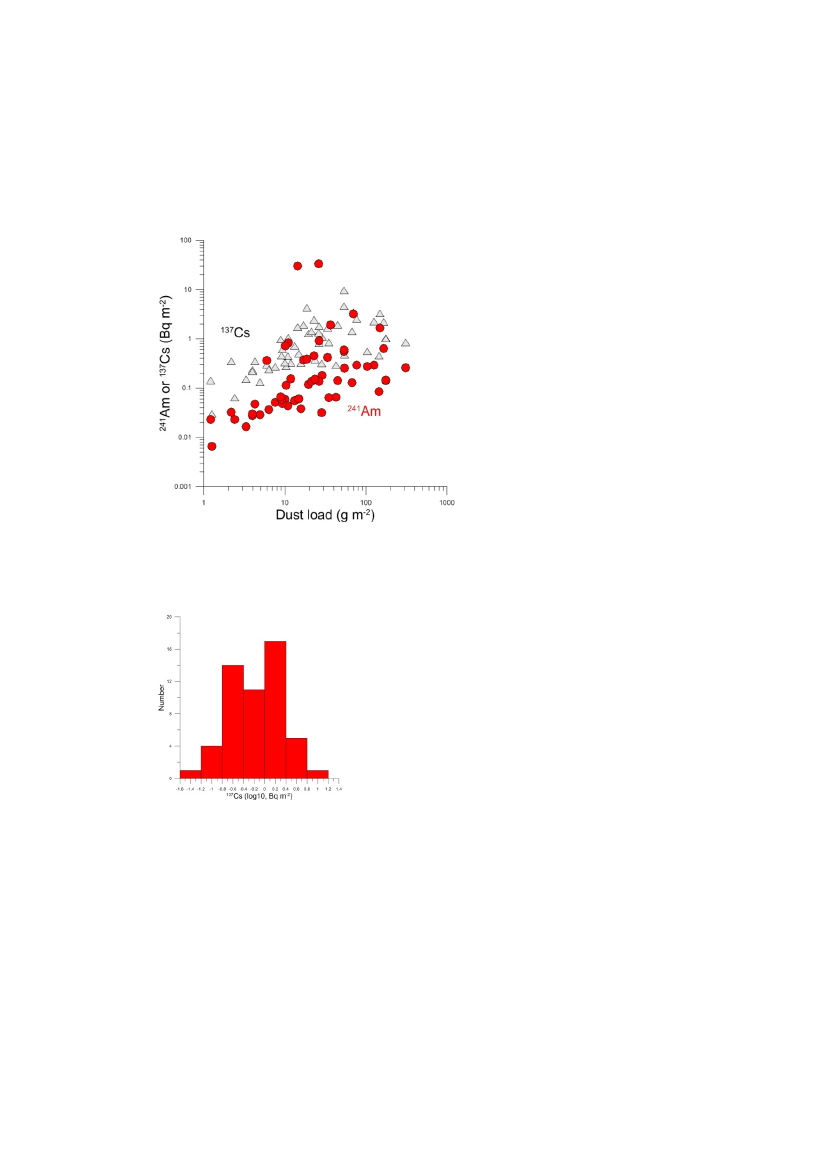
5.3.4 Vacuum bagsGamma spectrometric analyses of dust collected in vacuum bags showed presence of137Cs and241Am, but below detection limit for241Am at five locations. No radio-chemical plutonium analyses were carried out for these samples. A scatter plot (Fig.46) shows the results of241Am and137Cs versus mass of dust collected by vacuumingone square metre of soil surface. The data indicate that the levels of the two ra-dionuclides are somewhat correlated with the mass of dust collected which meansthat the two radionuclides to some degree are associated with the same dust particles.
32
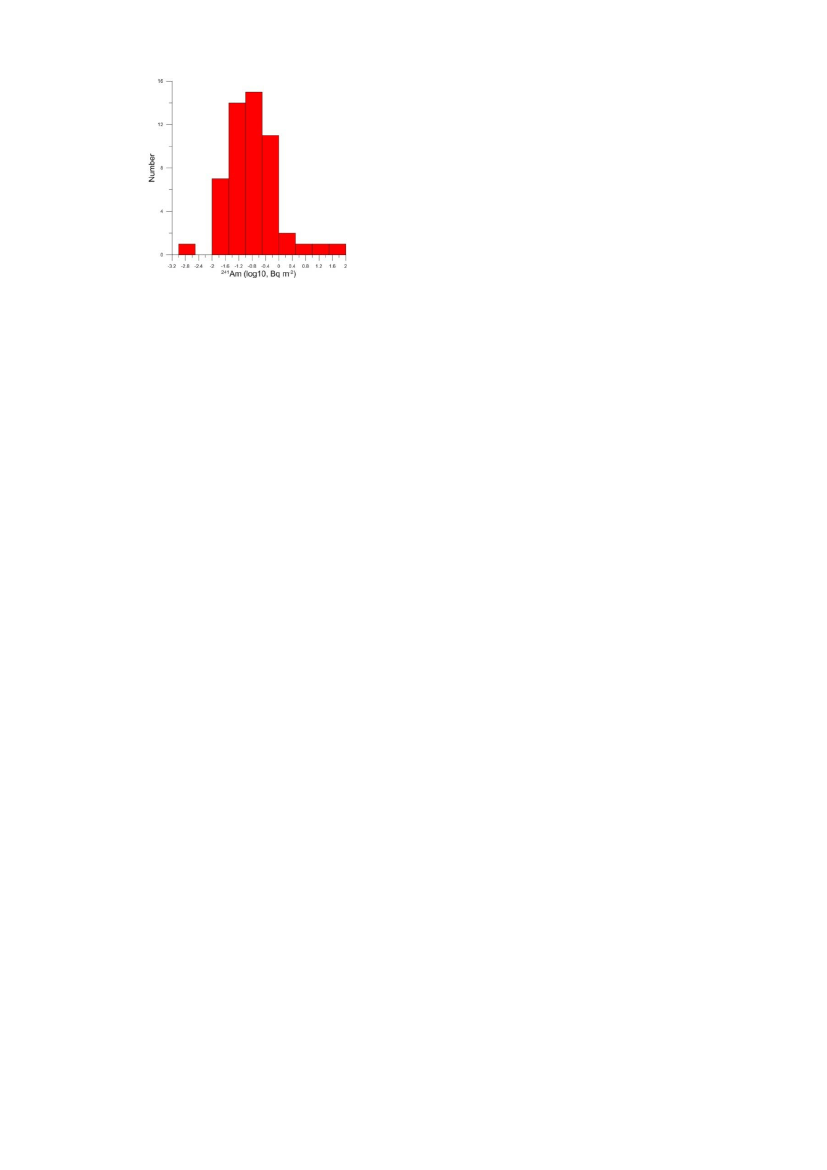
The correlations indicate that similar focusing processes are acting on the two ra-dionuclides which have very different origin. Caesium-137 is due to fallout fromatmospheric nuclear weapons tests while241Am is due to local pollution from theaccident in 1968. The results show two outliers where significantly more241Am wasfound. These samples were collected a few hundred metres south of the hunting cab-ins and the results are due to particles with elevated levels of radioactivity.Histogram distributions of the two radionuclides are shown in Figs. 47 and 48 withgeometric mean values of 0.7 and 0.2 Bq m-2for137Cs and241Am, respectively.
Figure 46. Scatter plot of241Am (red circles, Bq m-2) and137Cs (grey triangles, Bq m-2)vs. dust (g m-2) collected by vacuuming surface soil at Narsaarsuk.
Figure 47. Histogram of137Cs in samples (Bq m-2) collected by vacuuming surface soil atNarsaarsuk (geometric mean 0.7 Bq m-2, geometric standard deviation 3).
Risø-R-1781(EN)
33
Figure 48. Histogram of241Am in samples (Bq m-2) collected by vacuuming surface soilat Narsaarsuk (geometric mean 0.2 Bq m-2, geometric standard deviation 6).
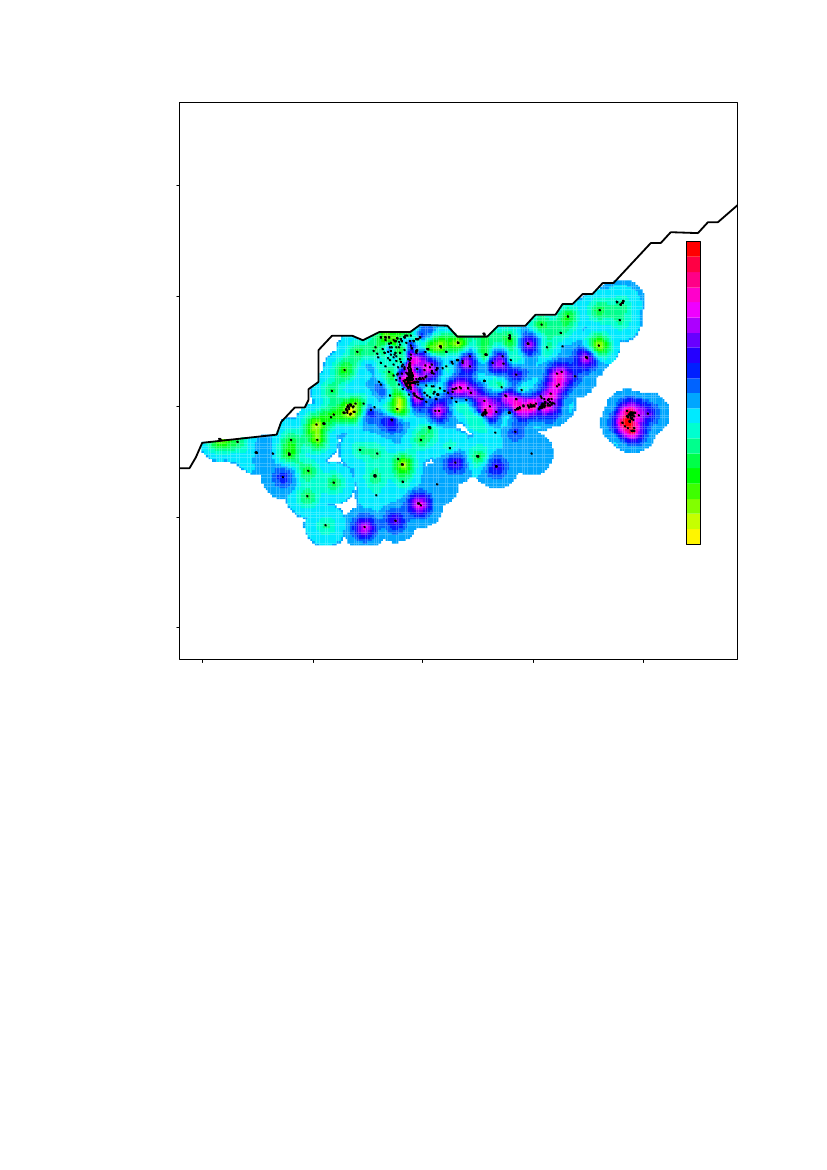
5.3.5 Geostatistical analysisThe data on241Am in soil (Bq m-2) was analysed by JSA-EnviroStat (2011) usinggeostatistical methods which give detailed information on spatial trends and permitassessment of the total inventory of the pollution. The analysis was based on thecombined data from laboratory analyses of soil samples and from field measure-ments. The data analysis was carried out on the log10-transformed data.
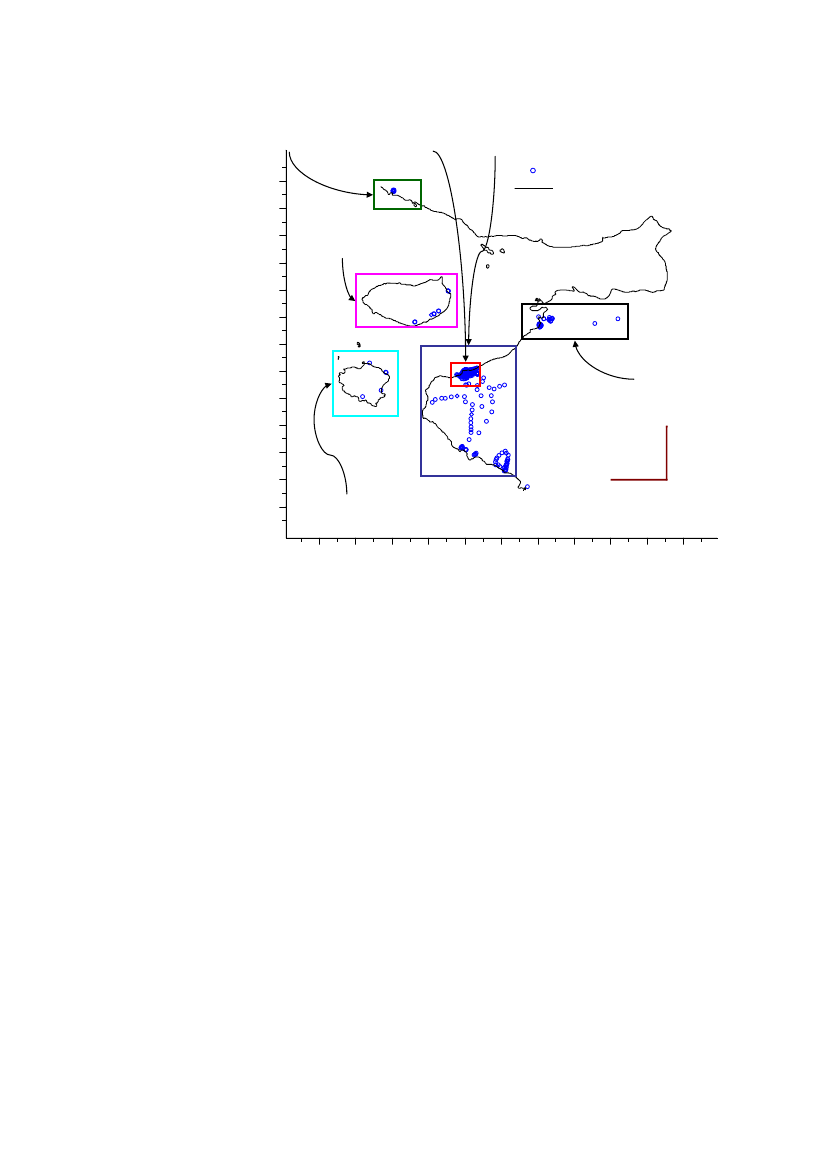
The data was split in geographical regions as shown in Fig. 49. Region 1 covered theNarsaarsuk area and southwards including Grønnedal. Region 2 was a subset of re-gion 1 and covered the Narsaarsuk area. Region 3 covered Moriusaq, region 4 cov-ered Saunders Island, region 5 covered Wolstenholme Island and region 6 coveredThule Air Base.
34
Risø-R-1781(EN)
Region 38.521.2008.516.1008.511.0008.505.900
Region 1Region 2Measurement locationsCoastline
Region 4
UTM North zone 19
8.500.8008.495.7008.490.6008.485.5008.480.4008.475.3008.470.2008.465.1008.460.00010 km
Region 6
Region 5465.000478.000491.000504.000517.000530.000471.500484.500497.500510.500523.500UTM East zone 19
Figure 49. Subdivision of the Thule area in six regions. Measurement locations aremarked with circles.
The number of observations in regions 3, 4, 5 and 6 were too small for geostatisticalanalysis. The analysis of data in region 1 showed a clear spatial correlation. How-ever, due to the size of region 1 and the sampling performed, large areas are far fromthe nearest observations which means that estimates of levels in these areas shouldnot be based on the observations. Further sampling would be needed to concludeanything in these areas. In addition, region 1 is sampled so sparsely that it makes nosense trying to predict the overall amounts of241Am and239,240Pu.
Risø-R-1781(EN)
35
Latitude (m)20003000
4000
4
3
2
1000
1
00
1000
2000
3000Longitude (m)
4000
36
Risø-R-1781(EN)
5.4
Meteorological data
The weather station was set up at Narsaarsuk during the field campaigns recordingtemperature, wind speed and direction, barometric pressure and precipitation. Thedata is shown in graphs in Appendix A.
6 DiscussionThe distribution of radioactive pollution on land in the Thule area shows features notknown previously. Levels of239,240Pu and241Am in soil range from low backgroundlevels to high levels caused by the accident in 1968. Background levels are due tofallout from atmospheric nuclear weapons testing. The levels at Narsaarsuk areclearly above those at Kap Atholl and Grønnedal and are relatively high in about 10small sub-areas. These sub-areas are generally moist and wet locations facing north,indicating that the high levels are probably due to redistribution of contaminatedsnow during the first weeks or months after the accident followed by snow melt inthe summer of 1968. Distribution of pollution on land at Narsaarsuk is very inhomo-geneous and not consistent with a simple pattern of fallout from a radioactive plumeextending from the accident site.The elevated levels of radioactivity on land found at Kap Atholl and Grønnedal indi-cate that significant atmospheric transport of radioactive material occurred to dis-tances of more than 20 km from the accident site, due to the 800-m high plume risecaused by the intense fire following the accident. Therefore, there may be more sub-areas with high levels of pollution than those identified near Narsaarsuk.The results of the investigations do not indicate that radioactive particles in the airoccur to an extent that give rise to concern. The investigation of radioactive particlesin air has focused on locations in the Narsaarsuk area with high levels of pollution,and several sampling techniques have been employed.Since wildlife in the area provides a local source for human food, it remains to beinvestigated the extent to which this food is contaminated with radioactivity. Ani-mals foraging on locations with high levels of radioactive pollution in soil are likelyto ingest amounts of radioactivity that may subsequently be transferred to man.Vegetation in the area is scarce and generally found on moist and wet locations in-cluding those with high levels of radioactivity. Investigations of radioactivity inwildlife from the Thule area were not included in the present project.A stream runs through the area and flows into Bylot Sound at Narsaarsuk. The waterflow of the stream is characterised by strong seasonal fluctuations from powerfulrunoff during snow melt in spring/summer to little or no flow during winter. Thedrainage area of the stream is more than 50 km2. Radioactive particles in the areahave probably been transported by runoff to the stream and further to the sea andover the years accumulated in the sediments at the mouth of the stream. It is thuslikely that significant amounts of radioactivity are present in these sediments. Inorder to account for all radioactive pollution in the area, and ascertain that no signifi-cant environmental impact is overlooked, it is of interest to investigate these sedi-ments. That data together with data on possible additional sub-areas with high levelsof radioactivity is relevant in relation to the amounts of plutonium from the nuclearweapons dispersed at the accident in 1968 (Christensen, 2009).
Risø-R-1781(EN)
37
7 ConclusionsA survey of radioactive pollution from the airplane accident in 1968 on land in theThule area was carried out during 2007 and 2008.The survey in the Narsaarsuk area includes observations from more than 400 sites.The survey has included a mapping of locations with particularly high levels of ra-dioactive pollution south and east of the hunting cabins at Narsaarsuk. The resultsshow levels of radioactive pollution in soil ranging from background values around13 Bq m-2of241Am and 39 Bq m-2of239+240Pu up to levels of 0.3 MBq m-2of241Amand 1.7 MBq m-2of239+240Pu. A number of local sub-areas (about ten) of sizes rang-ing from a few hundred to a few thousand square metres show elevated levels above10 kBq m-2of239+240Pu. The occurrence of sub-areas with significantly elevated lev-els of plutonium in soil is probably due to redistribution and accumulation in snowof the dispersed radioactive particles.Depth distributions of plutonium in soil were determined from one of the sub-areaswith elevated concentrations. Maximum concentrations were generally found in theupper 0-2 cm containing up to 90% of the total amount.Based on geostatistical analysis of data, the total amount of plutonium in soil at Nar-saarsuk is estimated at 270 GBq (100 g) with a 95% confidence interval of from 140to 490 GBq (54 to 190 g).At Narsaarsuk investigations were carried out to determine the occurrence of radio-active particles in air. This involved collection of airborne particles with an air sam-pler, passive collection of airborne particles on sticky foils, collection of rain sam-ples and collection of particles that could be resuspended by wind from the soil sur-face to the air. Small amounts of plutonium were found in air and rain samples, butthe derived concentrations in air were very low corresponding to typical backgroundlevels in Europe in the range 1-10 nBq m-3of239+240Pu. A few small particles werefound on the soil surface with activities up to 1000 Bq plutonium but the air and rainsamples showed no sign of resuspension of such particles from the soil.Local areas with elevated levels of radioactive pollution in soil were found at KapAtholl and Grønnedal 15-20 km south of Narsaarsuk. Here the levels were lowerthan those in the Narsaarsuk area but clearly above background.It was not possible within this project to carry out a systematic survey of the entireregion and it can thus not be excluded that there may be more local sub-areas thanthose identified with elevated levels of radioactive pollution in soil.Screening surveys were carried out at Thule Air Base, Moriusaq, Saunders Islandand Wolstenholme Island. The results showed background levels in soil at these lo-cations which means that no sign of radioactive pollution from the accident wasfound at these locations.
8 RecommendationsA relatively large number of sub-areas in the Narsaarsuk area was identified withsignificantly elevated levels of plutonium in soil. Further investigations would beneeded in order to clarify if there are other sub-areas in the region with significantly
38
Risø-R-1781(EN)
elevated levels of radioactivity from the accident. Due to the size of the region andthe nature of the terrain an airborne survey should be carried out to provide such in-formation.Wild animals living in the region might become contaminated with radioactivity par-ticularly from the sub-areas at Narsaarsuk with elevated levels. In order to deter-mine the extent to which consumption of terrestrial wild life from the area representsa radiological risk to humans, a survey of radioactivity in wild life from the regionshould be carried out. The survey should include information on wild life productsthat are used for human consumption in the area, collection of samples from suchwild life and analysis of radioactivity in the samples. Wild life of relevance mightinclude musk ox, arctic hare and birds.The sub-areas with elevated levels of radioactivity in the Narsaarsuk area indicatethat significant redistribution of pollution from the accident in 1968 has occurred. Itis likely that significant amounts of radioactive particles have been transported bywater runoff to the local stream and carried to the outflow of the stream at Narsaar-suk into the sea and accumulated at the mouth in the sediments. These sedimentsshould be investigated for content of possible high levels of radioactivity from theaccident.
9 AcknowledgementsThe authors wish to thank the staff of the Radioecology Programme in the RadiationResearch Division for their conscientious work on samples and analyses.The sampling campaigns were made possible due to considerable help and supportfrom Danish staff at the Thule Air Base and Greenland Contractors.The authors gratefully acknowledge financial support from the Ministry of Environ-ment to this investigation. The conclusions in this report do not necessarily reflectthe views of the Ministry.
Risø-R-1781(EN)
39
10 ReferencesAarkrog, A., 1971. Radioecological investigation of plutonium in an arctic marineenvironment. Health Phys., 20, 31-47.Aarkrog, A., 1977. Environmental behaviour of plutonium accidentally released atThule, Greenland. Health Phys., 32, 271-284.Aarkrog, A., 1979. Environmental Studies on Radioecological Sensitivity and Vari-ability with Special Emphasis on the Fallout Nuclides90Sr and137Cs, Risø-R-437,Risø National Laboratory, Roskilde, Denmark.Aarkrog, A., Dahlgaard, H., Holm, E., Hansen, H., Lippert, J. & Nilsson, K., 1981.Environmental Radioactivity in Greenland in 1980. Risø-R-449. Risø National Labo-ratory, Roskilde, Denmark.Aarkrog, A., Dahlgaard, H. & Nilsson, K., 1984. Further studies of plutonium andamericium at Thule, Greenland. Health Phys., 46, 29-44.Aarkrog, A., Boelskifte, S., Dahlgaard, H., Duniec, S., Holm, E. & Smith, J. N.,1987. Studies of transuranics in an Arctic marine environment. J. Radioanal. Nucl.Chem. Articles, 115, 39-50.Aarkrog, A., Buch, E., Chen, Q. J., Christensen, G. C., Dahlgaard, H., Hansen, H.,Holm, E. & Nielsen, S. P., 1988. Environmental Radioactivity in the North AtlanticRegion Including the Faroe Islands and Greenland. 1986. Risø-R-550. Risø NationalLaboratory, Roskilde, Denmark.Aarkrog, A., Chen, Q. J., Clausen, J., Christensen, G. C., Dahlgaard, H., Ellis, K.,Hansen, H., Holm, E., Joensen, H. P., Nielsen, S. P. & Strandberg, M., 1997. Envi-ronmental Radioactivity in the North Atlantic Region Including the Faroe Islandsand Greenland. 1992 and 1993. Risø-R-757. Risø National Laboratory, Roskilde,Denmark.Chen, Q.J.; Aarkrog, A.; Nielsen, S.P.; Dahlgaard, H.; Lind, B.; Kolstad, A.K.; Yu,Yixuan, 2001. Procedures for determination of239,240Pu,241Am,237Np,234,238U,228,230,232Th,99Tc and210Pb-210Po in environmental materials. Risø-R-1263(EN), RisøNational Laboratory, Roskilde, Denmark.Chen, Q.J.; Hou, X.L.; Yu, Y.X.; Dahlgaard, H.; Nielsen, S.P., 2002. Separation ofSr from Ca, Ba and Ra by means of Ca(OH)2and Ba(Ra)Cl2or Ba(Ra)SO4for thedetermination of radiostrontium. Anal. Chim. Acta466, 109-116Christensen, S.A., 2009. The Marshal’s Baton. DIIS Report 2009:19. Danish Insti-tute for International Studies, Copenhagen, Denmark.Dahlgaard, H., Chen, Q. J., Stiirup, S., Eriksson, M., Nielsen, S. P. & Aarkrog, A.,1999a. Plutonium Isotope Ratios in Environmental Samples from Thule (Greenland)and the Techa River (Russia) measured by ICPMS and a-Spectrometry.InternationalSymposium on Marine Pollution, Monaco,5-9 October 1998, IAEA-SM-3541109(pp. 254-259). Vienna, Austria: IAEA.Dahlgaard, H., Eriksson, M,, Ilus, E., Ryan, T., McMahon, C. A. & Nielsen, S. P.,1999b. Plutonium in an Arctic marine environment 29 years after the Thule accident.Nordic Society for Radiation Protection, 12th ordinary meeting,August 23-27,1999, Skagen, Denmark.
40
Risø-R-1781(EN)
EC, 2006. NUSIMEP 5: Uranium, plutonium and caesium isotopic abundance in asaline matrix, EUR 22286 EN, IRMM, European Commission, BelgiumEriksson, M., 2002. On Weapons Plutonium in the Arctic Environment (Thule,Greenland). Risø-R-1321(EN) , Risø National Laboratory, Roskilde, DenmarkFogh, C.L., 2000. NKS 1999 intercomparison of measurements of radioactivity.NKS-19. Nordic nuclear safety research, Roskilde, DenmarkFogh, C.L., Nielsen, S.P. and Keith-Roach, M., 2002. Intercomparison of Radionu-clides in Environmental Samples 2000-2001. Nordic nuclear safety research,Roskilde, DenmarkHanson, W.C., 1980. Transuranic elements in Arctic Tundra Ecosystems. In W.C.Hanson (Ed.), Transuranic Elements in the Environment, DOE/TIC-22800. Spring-field, VA: National Technical Information Service.Hölgye, Z., 2008. Plutonium isotopes in surface air of Prague in 1986-2006. J. Env.Rad. 99(10):1653.IAEA, 1999. Report on the intercomparison run and certified reference materialIAEA-381, Radionuclides in Irish Sea Water. IAEA/AL/118; IAEA/MEL/66. Inter-national Atomic Energy Agency, Vienna, AustriaIAEA, 2000a. Summary report of the Proficiency Test for239Pu,241Pu and241AmMeasurement in a Mineral Matrix (PT002). International Atomic Energy AgencyAQCS, Seibersdorf, AustriaIAEA, 2000b. IAEA-384, Radionuclides in Fangataufa lagoon sediment.IAEA/AL/126; IAEA/MEL/68. International Atomic Energy Agency, Vienna, Aus-triaIAEA, 2001. Report on the intercomparison run for the determination of radionu-clides in soils, IAEA-326 and IAEA-327. IAEA/AL/100. International Atomic En-ergy Agency, Vienna, AustriaIAEA, 2004. Report on the worldwide intercomparison IAEA-414, Radionuclides inMixed Fish from Irish Sea and the North Sea. IAEA/AL/145; IAEA/MEL/73. Inter-national Atomic Energy Agency, Vienna, AustriaIAEA, 2005. Report on the Worldwide Intercomparison Exercise IAEA-385, ra-dionuclides in Irish Sea Sediment. IAEA/AL/151; IAEA/MEL/76. InternationalAtomic Energy Agency, Vienna, AustriaIAEA, 2007a. The IAEA-CU-2006-04 Proficiency Test on the Determination ofGamma Emitting Radionuclides, IAEA, Seibersdorf, AustriaIAEA, 2007b. Report on the worldwide intercomparison exercise IAEA-437. Ra-dionuclides in Mediterranean Mussels. IAEA/AL/173 IAEA/MEL/79. InternationalAtomic Energy Agency, Vienna, AustriaIAEA, 2009a. ALMERA Proficiency Test on Determination of Po-210 in Water,IAEA-CU-2007-09, IAEA, Vienna, AustriaIAEA, 2009b. Interlaboratory Comparison Radionuclides in Irish Sea Water IAEA-443, IAEA/AQ/10, IAEA, Vienna, AustriaIAEA, 2009c. ALMERA Proficiency Test on the Determination of Radionuclides inSpinach, Soil and Water, IAEA/AQ/3, IAEA, Vienna, AustriaIAEA, 2010a. ALMERA Proficiency test Determination of Naturally Occurring Ra-dionuclides in Phosphogypsum and Water, IAEA-CU-2008-04, IAEA, Vienna, Aus-tria
Risø-R-1781(EN)
41
IAEA, 2010b. HELCOM-MORS Proficiency Test Determination of Radionuclidesin Fish Flesh Sample. IAEA/AQ/13. IAEA, Vienna, AustriaJSA-EnviroStat, 2011. Spatial statistical analysis of contamination level ofand239Pu at Thule, North-West Greenland. Gilleleje, Denmark.241
Am
McMahon, C. A., Lecin Vintro, L., Mitchell, P. I. & Dahlgaard, H., 2000. Oxidation-state distribution of plutonium in surface and subsurface waters at Thule, northwestGreenland.Appl. Radiat. Isot.,52, 697-703.McNeary, D., Baskaran, M., 2003. Depositional characteristics of7Be and210Pb insoutheastern Michigan. Journal of Geophysical Research, 108(D7), 4210.Michel, H., Barci-Funel, G., Dalmasso, J., Ardisson, G., Appelby, P.G., Haworth, E.and El-Daoushy, F., 2002. Plutonium and americium inventories in atmospheric fall-out and sediment cores from Blelham tarn, Cumbria (UK). J. Environ. Radioact.59(2):127-137.Michel, H., Barci-Funel, G., Dalmasso, J., Ardisson, G., Appelby, P.G., Haworth, E.and El-Daoushy, F., 2002. Plutonium and americium inventories in atmospheric fall-out and sediment cores from Blelham tarn, Cumbria (UK). J. Environ. Radioact.59(2):127-137.Nielsen, S.P., 1996. An Intercomparison Exercise on Radionuclides in SedimentSamples. Risø-R-914(EN). Risø National Laboratory, Roskilde, Denmark.Nielsen, S.P., 2004. An Intercomparison on Radionuclides in Environmental Sam-ples. Baltic-Danish Co-operation Project on radiation Protection 2001-2003. Risø-R-1467(EN). Risø National Laboratory, Roskilde, DenmarkNielsen, S.P. and Roos, P., 2006. Thule-2003 – Investigation of Radioactive Con-tamination, Risø-R-1549(EN), Risø National Laboratory, Roskilde, Denmark.NIRP, 2011. Thule-ulykken, Vurdering af stråledoser fra radioaktiv forurening aflandjorden. National Institute of Radiation Protection, Herlev, Denmark.NPL, 2006. Environmental Radioactivity Comparison Exercise 2005. National Phys-ics Laboratory, United KingdomNPL, 2008. Environmental Radioactivity Proficiency Test Exercise 2007. NationalPhysics Laboratory, United KingdomNUSTL, 2011. EML Environmental Databases. National Urban Security TechnologyLaboratory, US Department of Homeland Security, USA.(http://www.eml.st.dhs.gov/databases/)Outola, I., Filliben, J. and Inn, K.G.W., 2008. Searching a robust reference valuefrom intercomparison exercise data: Seaweed radionuclide Standard Reference Ma-terial (SRM4359), J. Radioanal. Nucl. Chem., 276, 329-334.Perkins, R.W. and Thomas, C.W., 1980. World wide fallout. In W.C. Hanson (Ed.),Transuranic Elements in the Environment, DOE/TIC-22800. Springfield, VA: Nati-onal Technical Information Service.SIS, 2011. Thule-ulykken, Vurdering af stråledoser fra radioaktiv forurening af land-jorden. Statens Institut for Strålebeskyttelse, Sundhedsstyrelsen, Herlev (In Danish)UNSCEAR, 1982. Ionizing Radiation: Sources and Biological Effects. United Na-tions Scientific Committee on the Effects of Atomic Radiation, 1982 Report to theGeneral Assembly, United Nations, New York.UNSCEAR, 1993. Sources and Effects of Ionizing Radiation. United Nations Scien-tific Committee on the Effects of Atomic Radiation, 1993 Report to the General As-sembly, United Nations, New York.
42
Risø-R-1781(EN)
U.S. Air Force, 1970. Project Crested Ice. USAF Nuclear Safety, 65, 1-97.Vibe, C., 1950. The marine mammals and the marine fauna in the Thule district(Northwest Greenland) with observations on ice conditions in 1939-41. Meddelelserom Grønland, 150, 1-117.Wershofen, H. and Arnold, D., 1999. Radionuclides in Ground-Level Air in Braun-schweig – Report of the PTB Trace Survey Station for 1995, 1996 and 1997. PTB-Ra-41, Braunschweig.
Risø-R-1781(EN)
43
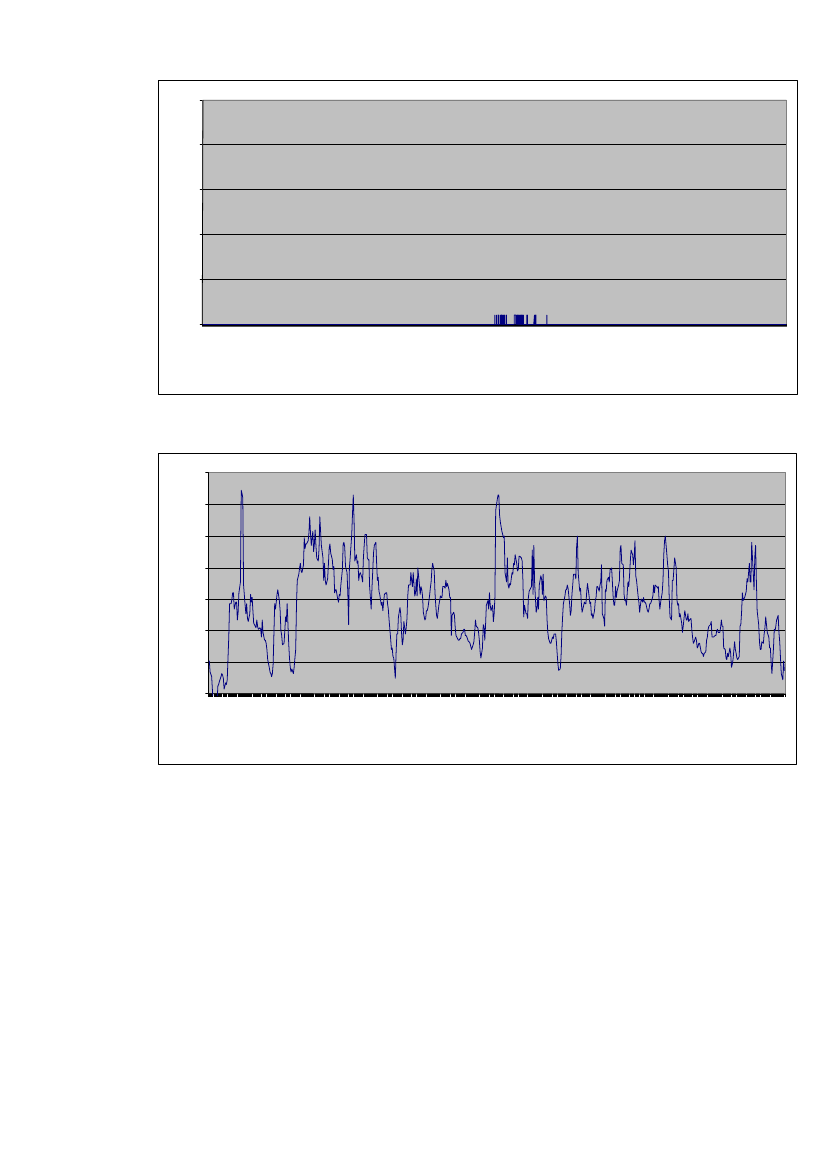
Figure 52. Wind speed during field campaign at Narsaarsuk in 2007.
44Wind Speed (m/s)Temperature (C)10121402468
0
1
2
3
4
5
6
7
20/7 0720/7 0723/7 0723/7 0724/7 0725/7 0725/7 0726/7 0726/7 0727/7 0728/7 0728/7 0729/7 0730/7 0730/7 0731/7 071/8 071/8 07Date
23/7 0723/7 0724/7 0725/7 0725/7 0726/7 0726/7 0727/7 0728/7 0728/7 0729/7 0730/7 0730/7 0731/7 071/8 071/8 072/8 073/8 073/8 074/8 075/8 075/8 076/8 077/8 077/8 078/8 079/8 079/8 0710/8 0711/8 0711/8 0712/8 0713/8 07
Appendix A, Meteorological data
Figure 51. Temperature during field campaign at Narsaarsuk in 2007.2/8 073/8 073/8 074/8 075/8 075/8 076/8 077/8 077/8 078/8 079/8 079/8 0710/8 0711/8 0711/8 0712/8 0713/8 07
Meteorological data recorded at Narsaarsuk during summer 2007 and 2008.
Date
Risø-R-1781(EN)
Temperature (C)1023
Rain (mm)45
10
12
14
0
220/7 0723/7 0723/7 0724/7 0724/7 0725/7 0726/7 0726/7 0727/7 0728/7 0728/7 0729/7 0730/7 0730/7 0731/7 071/8 071/8 07Date
4
6
8
3/7 085/7 086/7 088/7 089/7 0811/7 0813/7 0814/7 0816/7 0817/7 0819/7 0821/7 0822/7 0824/7 0825/7 0827/7 08Date
Risø-R-1781(EN)28/7 0830/7 081/8 082/8 084/8 085/8 087/8 089/8 0810/8 0812/8 0813/8 0815/8 0816/8 0818/8 0820/8 0821/8 0823/8 082/8 073/8 073/8 074/8 075/8 075/8 076/8 076/8 077/8 078/8 078/8 079/8 0710/8 0710/8 0711/8 0712/8 0712/8 0713/8 07
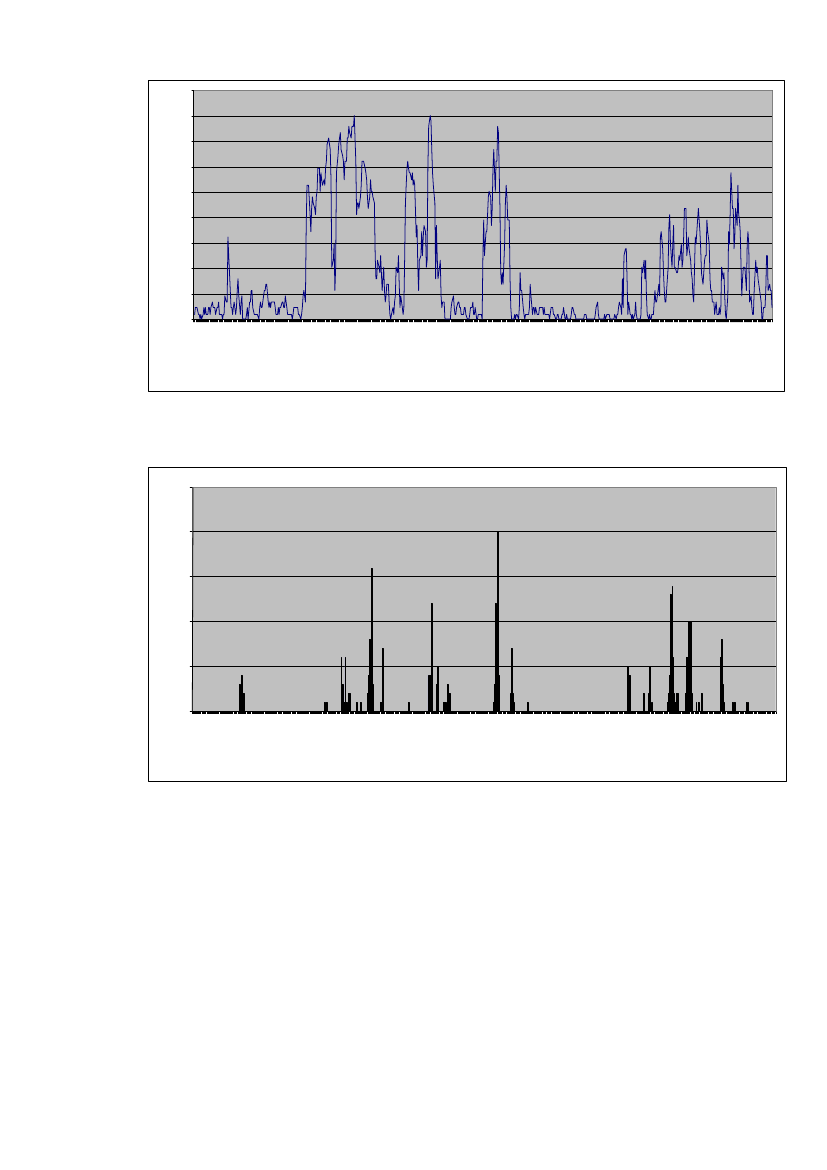
Figure 54. Temperature during field campaign at Narsaarsuk in 2008.
Figure 53. Precipitation during field campaign at Narsaarsuk in 2007.
45
46Rain (mm)Wind Speed (m/s)0123456
03/7 083/7 085/7 086/7 088/7 089/7 0811/7 0813/7 0814/7 0816/7 0817/7 0819/7 0821/7 0822/7 0824/7 0825/7 0827/7 08Date
1
2
3
4
5
7
8
9
5/7 086/7 088/7 089/7 0811/7 0813/7 0814/7 0816/7 0817/7 0819/7 0821/7 0822/7 0824/7 0825/7 0827/7 08
Figure 55 Wind speed during field campaign at Narsaarsuk in 2008.28/7 0830/7 081/8 082/8 084/8 085/8 087/8 089/8 0810/8 0812/8 0813/8 0815/8 0816/8 0818/8 0820/8 0821/8 0823/8 08
Date28/7 0830/7 081/8 082/8 084/8 085/8 087/8 089/8 0810/8 0812/8 0813/8 0815/8 0816/8 0818/8 0820/8 0821/8 0823/8 08
Figure 56. Precipitation during field campaign at Narsaarsuk in 2008.
Risø-R-1781(EN)
Risø DTU is the National Laboratory for Sustainable Energy. Our research focuses ondevelopment of energy technologies and systems with minimal effect on climate, andcontributes to innovation, education and policy. Risø DTU has large experimental facilitiesand interdisciplinary research environments, and includes the national centre for nucleartechnologies.
Risø DTUNational Laboratory for Sustainable EnergyTechnical University of DenmarkFrederiksborgvej 399PO Box 49DK-4000 RoskildeDenmarkPhone +45 4677 4677Fax +45 4677 5688www.risoe.dtu.dk