Europaudvalget 2011-12
EUU Alm.del Bilag 381
Offentligt
MEGAPESCA Lda
CONTRACTCADREFISH/2006/20SPECIFICCONVENTIONN�35:EX-POSTEVALUATION OF THECURRENTPROTOCOLTO THEFISHERIESPARTNERSHIPAGREEMENTBETWEEN THEEUROPEANUNION ANDGREENLANDFINALREPORTSeptember 2011
This report has been prepared with the financial support of the European Commission.The views expressed in this study are those of the authors and do not necessarily reflect the views of theEuropean Commission or of its services. This report does not seek to establish the Commission’s futurepolicy in this area.The content of this report may not be reproduced, or even part thereof, without explicit reference to thesource.
Oceanic Développement & MegaPesca Lda (2011).Framework Contract for performing evaluations, impact analyses and monitoring services in the context ofFPAs concluded between the European Union and non-EU member statesNo.Fish/2006/20).DOCUMENT INTERNE : DROITS DE DIFFUSION RESERVES A LA C.E.
Contact des auteurs :
OCEANIC DEVELOPPEMENTZ.I. du Moros, 29900 Concarneau, FranceTel :Fax :Email :URL :+33 2 98 50 89 99+33 2 98 50 78 98[email protected]http://www.oceanic-dev.comVersion : Final ReportRéf. rapport: FPA 35/GRL/11/NCDate de publication :September 2011
Final Report
Fisheries Partnership Agreement FPA 2006/20
FPA 35/GRE/11
ABBREVIATIONS AND ACRONYMS USEDACAPADAPIAIDCOAMAPAoILVETARVIATQCAFFCETACFPCPUEArctic Contaminants Action ProgramAssocia§ão dos Armadores da Pesca Industrial.EuropeAid Co-Operation OfficeArctic Monitoring and Assessment ProgrammeAgency of Industry, Labour Market and Vocational Education and TrainingCooperativa de Armadores de Buques de Pesca del Puerto de VigoAutonomous Tariff QuotaConservation of Arctic Flora and FaunaComprehensive Economic and Trade AgreementCommon Fisheries PolicyCatch Per Unit Effort
DAMOCLES Developing Arctic Modelling and Observing Capabilities for Long-termEnvironmental StudiesDFHADFODGDGPADKKDVFAEEAEEZEMODNETEPPREUEURFIDESFPAFTEGAGPBGDPGEPDepartment of Fisheries, Hunting and AgricultureDepartment of Fisheries and Oceans CanadaDirectorate-GeneralDirec§ão Geral das Pescas e Aquicultura.Danish KronerDanish Veterinary and Food AuthorityEuropean Economic AreaExclusive Economic ZoneEU Marine Observation and Data NetworkEmergency Prevention, Preparedness and ResponseEuropean UnionEuroFishery Information Data Exchange SystemFisheries Partnership AgreementFull-time EquivalentsEmployers AssociationBritish PoundGross Domestic ProductGreenland Education Programme
Final Report
Fisheries Partnership Agreement FPA 2006/20
FPA 35/GRE/11
GFLKGHLGHRGGINRGISGRTGRLHACCPHRGHSIAICESISKITITQIUUIWCJCKNAPKKPLTUMAPMFNMoCERCMoFFAMoHFAMoILMMOUMPAMSMSCMSYNAFO
Greenland Fishery and Licence ControlGreenland HalibutGreenland Home Rule GovernmentGreenland Institute of Natural ResourcesGeographical Information SystemsGross Registered TonnageGreenlandHazard Analysis and Critical Control PointHome Rule GovernmentHarmonised SystemInuit AtaqadigiitInternational Council for the Exploration of the SeIcelandic KronerInformation TechnologyIndividual Transferable QuotaIllegal, Unreported and UnregulatedInternational Whaling CommissionJoint CommitteeFishermen and Hunters associationA Greenland political party known by its initials “KP”LithuaniaModified Atmosphere PackagingMost Favoured NationMinistry of Culture, Education, Research and the ChurchMinistry of Finance and Foreign AffairsMarket Ministry of Health and Family AffairsMinistry of Industry and LabourMemorandum of UnderstandingMarine Protected AreaMember StatesMarie Stewardship CouncilMaximum Sustainable YieldNorthwest Atlantic Fisheries OrganizationFinal Report
Fisheries Partnership Agreement FPA 2006/20
FPA 35/GRE/11
NEAFCNGONOKNWWGOCTOSPARPDSPRGSDWGSSBSTECFTACsUKUNUNCLOSUSUSDVMEVMSWKREDS
North East Atlantic Fisheries CommissionNon Governmental OrganisationNorwegian KronerNorth Western Working GroupOverseas Countries and TerritoryConvention for the Protection of the Marine Environment of the NE AtlanticProgramming Document for the Sustainable Development of GreenlandRoyal GreenlandSustainable Development Working GroupSpawning Stock BiomassScientific Technical and Economic Committee on FisheriesTotal Allowable CatchesUnited KingdomUnited NationsUnited Nations Convention on the Law of the SeaUnited StatesUnited States DollarVulnerable Marine EcosystemsVessel Monitoring and SurveillanceWorkshop on Redfish Stock Structure
Final Report
Fisheries Partnership Agreement FPA 2006/20
FPA 35/GRE/11
CONTENTS
EXECUTIVE SUMMARY................................................................................................................. IRÉSUMÉ EXÉCUTIF.....................................................................................................................VII1INTRODUCTION.........................................................................................................................11.11.222.12.22.32.42.52.62.72.833.13.23.33.43.53.63.73.83.944.14.24.355.15.25.3675
BACKGROUND..........................................................................................................................1METHODOLOGY.......................................................................................................................1POLITICAL SITUATION.............................................................................................................2ECONOMIC SITUATION...........................................................................................................3FISHERY SECTOR....................................................................................................................3OTHER SECTORS.....................................................................................................................4INTERNATIONAL TRADE..........................................................................................................5MARITIME BOUNDARIES.........................................................................................................6MEMBERSHIP OF THEARCTICCOUNCIL..........................................................................8EUPOLICIES WITH RESPECT TOGREENLAND................................................................9FISHINGFLEET.......................................................................................................................15GREENLAND CATCHES.........................................................................................................17PROCESSING INDUSTRY......................................................................................................22HEALTH AND HYGIENE CONDITIONS.................................................................................24EMPLOYMENT IN FISHERIES...............................................................................................25INTERNATIONALTRADE INFISHERIESPRODUCTS......................................................25FISHERY SECTOR ORGANISATIONS..................................................................................31FISHERIESAGREEMENTS WITH OTHER THIRD COUNTRIES.......................................32FISHERIESMANAGEMENT INGREENLAND....................................................................36FISH STOCKS..........................................................................................................................39NON-TARGET IMPACTS OF FISHERIES ACTIVITY...........................................................56MARINEPROTECTEDAREAS.............................................................................................58THEEU-GREENLANDFISHERIESPARTNERSHIPAGREEMENT...............................60AVAILABILITY OF QUOTA AS PERPROTOCOL................................................................63UTILISATION OF FISHING OPPORTUNITIES.....................................................................65
POLITICAL AND ECONOMIC CONTEXT......................................................................2
GREENLAND’S FISHERY SECTOR..............................................................................15
GREENLAND’S FISHERY RESOURCES AND MANAGEMENT....................39
EU-GREENLAND FISHERIES PARTNERSHIP AGREEMENT........................60
FINANCIAL AND ECONOMIC IMPACTS OF THE EU- GREENLAND FPA6.16.26.36.4MARKET VALUES OF SPECIES SUBJECT TO THEFPA................................................75FINANCIAL AND ECONOMIC IMPACTS ONEU.................................................................77FINANCIAL AND ECONOMIC IMPACTS ONGREENLAND...............................................81FINANCIAL AND ECONOMIC IMPACTS ON THIRD COUNTRIES....................................84
7
IMPACTS OF THE FISHERIES SECTOR POLICY SUPPORT MEASURES84
7.1
SOURCE OF DATA ON PROGRESS AGAINST INDICATORS...........................................84
Final Report
Fisheries Partnership Agreement FPA 2006/20
FPA 35/GRE/11
7.27.37.47.57.6898.19.19.29.39.49.59.61011
OVERALL OBJECTIVES OF THE MEASURES....................................................................84AREA1: ADMINISTRATION FOR THE FISHERIES2007-2012....................................85AREA2: CONTROL AND ENFORCEMENT.........................................................................89AREA3: BIOLOGICAL ADVICE............................................................................................91SUMMARY OF PROGRESS ON IMPLEMENTATION OF THE MEASURES.....................94IMPACTS ON TARGET FISHERY RESOURCES..................................................................96RELEVANCE..........................................................................................................................100EFFECTIVENESS..................................................................................................................100EFFICIENCY...........................................................................................................................101SUSTAINABILITY AND ENVIRONMENTAL IMPACTS.......................................................101COHERENCE AND COMPLEMENTARITY.........................................................................102EUADDED VALUE................................................................................................................102CONCLUSIONS AND RECOMMENDATIONS....................................................103ANNEXES...............................................................................................................................104
RESOURCE AND ENVIRONMENTAL IMPACTS....................................................96FINDINGS OF THE EX-POST EVALUATION..........................................................100
ANNEX1: QUOTASDELIVERED UNDER THEEU-GREENLANDFISHERIESPARTNERSHIPAGREEMENT.........................................................................................................104ANNEX2: ANNUAL CATCHES AND VALUES OF CATCHES.....................................................109ANNEX3: DEPENDENCY OFEUBILATERAL EXCHANGES WITH THIRD COUNTRIES ONTHEEU GREENLANDFPA...........................................................................................................110ANNEX4: SCIENTIFIC ADVICE,ADOPTEDTACS,AND CATCHES FOR STOCKS OFRELEVANCE TO THEFPADURING THE PERIOD OF THE CURRENT PROTOCOL(2007-2011).................................................................................................................................................113
Final Report
Fisheries Partnership Agreement FPA 2006/20
FPA 35/GRE/11
TABLES
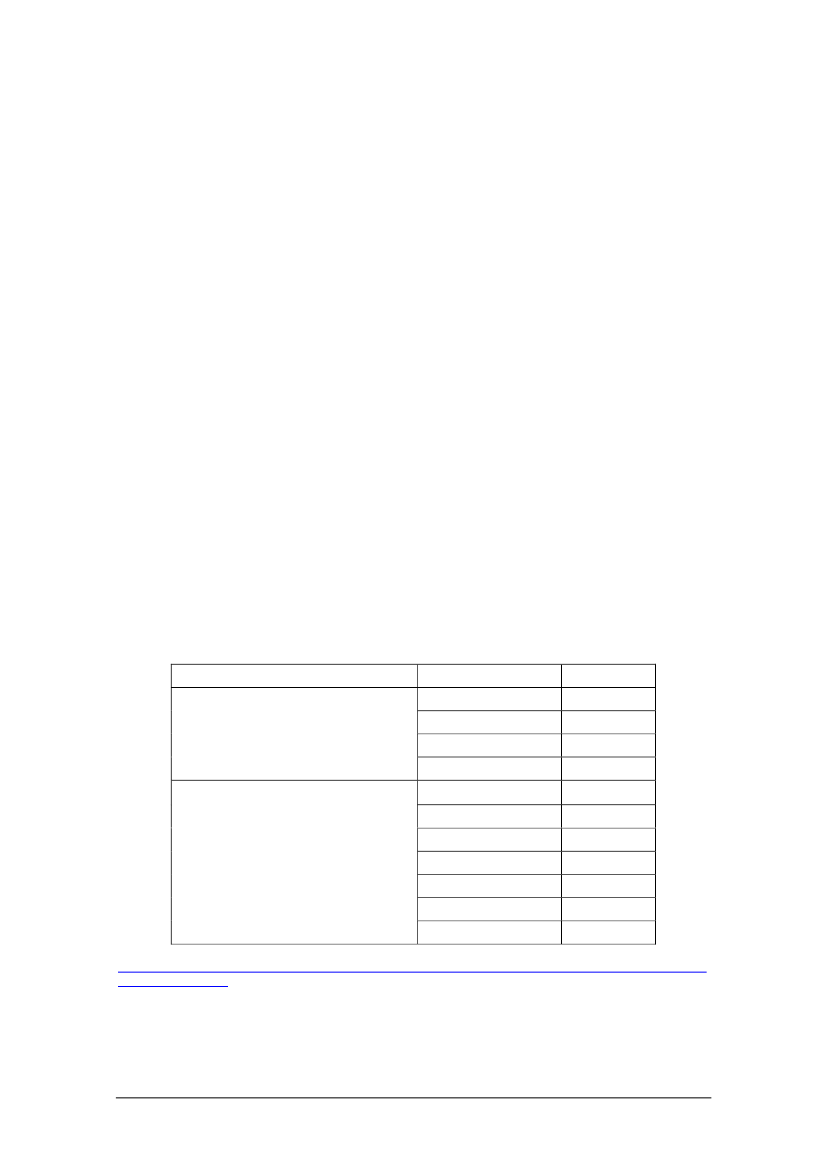
Table 1:Greenland Exports................................................................................................... 6Table 2: Summary of Greenland responsibilities to Arctic Council WorkingGroups................................................................................................................................ 9Table 3: Characteristics of and trends in dimensions of Greenland fishing fleet16Table 4: Total catches in GRL waters (including foreign vessels).......................... 18Table 5: Catches of cod in Greenland (including foreign vessels)......................... 19Table 6: Other catches taken by Greenland vessels inside and outside theGreenland EEZ............................................................................................................... 20Table 7: Catches of foreign fleets operating in Greenland waters........................ 21Table 8: Numbers of small scale fishermen in four municipalities.......................... 25Table 9: Imports of fishery products from Greenland to the EU.............................. 26Table 10: Principal EU market destinations................................................................... 27Table 11: Utilisation of EU’s erga omnes import tariff quota on cooked andpeeled shrimp................................................................................................................. 28Table 12: Zero duty tariff quotas of non-originating products exported fromGreenland to the EU..................................................................................................... 28Table 13: Utilisation by Greenland of the tariff quota for non-originating fisheryproducts............................................................................................................................ 29Table 14: Modifications to tariff regime impacting upon trade in fishery productsfrom Greenland............................................................................................................... 29Table 15: Allocation keys for capelin............................................................................... 32Table 16: Exchange of fishing opportunities under the Greenland-NorwayFisheries Agreement (2011)....................................................................................... 33Table 17: Exchange of fishing opportunities under the Greenland-RussiaFisheries Agreement (2011)....................................................................................... 34Table 18: Exchange of fishing opportunities under the Faroes-GreenlandFisheries Agreement..................................................................................................... 35Table 19: Distribution of ITQ rights in the offshore shrimp fishery of Greenland37Table 20: Sustainability of Greenland fisheries subject to the EU-GreenlandFisheries Partnership Agreement............................................................................. 52Table 21: Level of indicative fishing opportunities established by the Protocol.. 62Table 22: Quotas Delivered under the EU-Greenland Fisheries PartnershipAgreement 2007-2010................................................................................................. 64
Final Report
Fisheries Partnership Agreement FPA 2006/20
FPA 35/GRE/11
Table 23: No. and capacity of EU vessels drawing licences under the FisheriesPartnership Agreement................................................................................................ 66Table 24: Average annual utilisation of fishing opportunities and catches underthe EU-Greenland Fisheries Partnership Agreement *...................................... 67Table 25: Composition and quantity of bycatch declared by EU vessels in theGreenland EEZ (2008)................................................................................................. 72Table 26: Greenland quotas exchanged between EU Member States 2007-2010............................................................................................................................................. 74
Table 27: Latest release dates for intra-community quota swaps (shrimp andredfish).............................................................................................................................. 74Table 28: Exchange of issued fishing licences for Greenland opportunitiesbetween Member States.............................................................................................. 75Table 29: Market values of fish caught under the EU-Greenland FPA................. 77Table 30: Average annual costs and benefits to the EU and Greenland of theEU-Greenland FPA....................................................................................................... 78Table 31: Average annual value of the catches under the Fisheries PartnershipAgreement....................................................................................................................... 79Table 32: Dependency on Greenland quota of bilateral exchanges of fishingopportunities with third countries.............................................................................. 81Table 33: Licence fees paid by EU vessels operating under the EU-GreenlandFPA.................................................................................................................................... 82Table 34: Greenland budget allocations specified in the context of FPA fisherysector support................................................................................................................. 83Table 35: Structural adjustment projects supported in 2007 / 2008....................... 88Table 36: Training courses undertaken by Greenland Fisheries Officials 2008-2009................................................................................................................................... 89Table 37: Expenditure on Control and enforcement functions................................ 90Table 38: Production of management advice for commercially important fishstocks................................................................................................................................ 93Table 39: Overview of impacts on stocks of relevance to the EU GreenlandFisheries Partnership Agreement during the period of the current protocol(2007-2011)..................................................................................................................... 97
Final Report
Fisheries Partnership Agreement FPA 2006/20
FPA 35/GRE/11
FIGURES
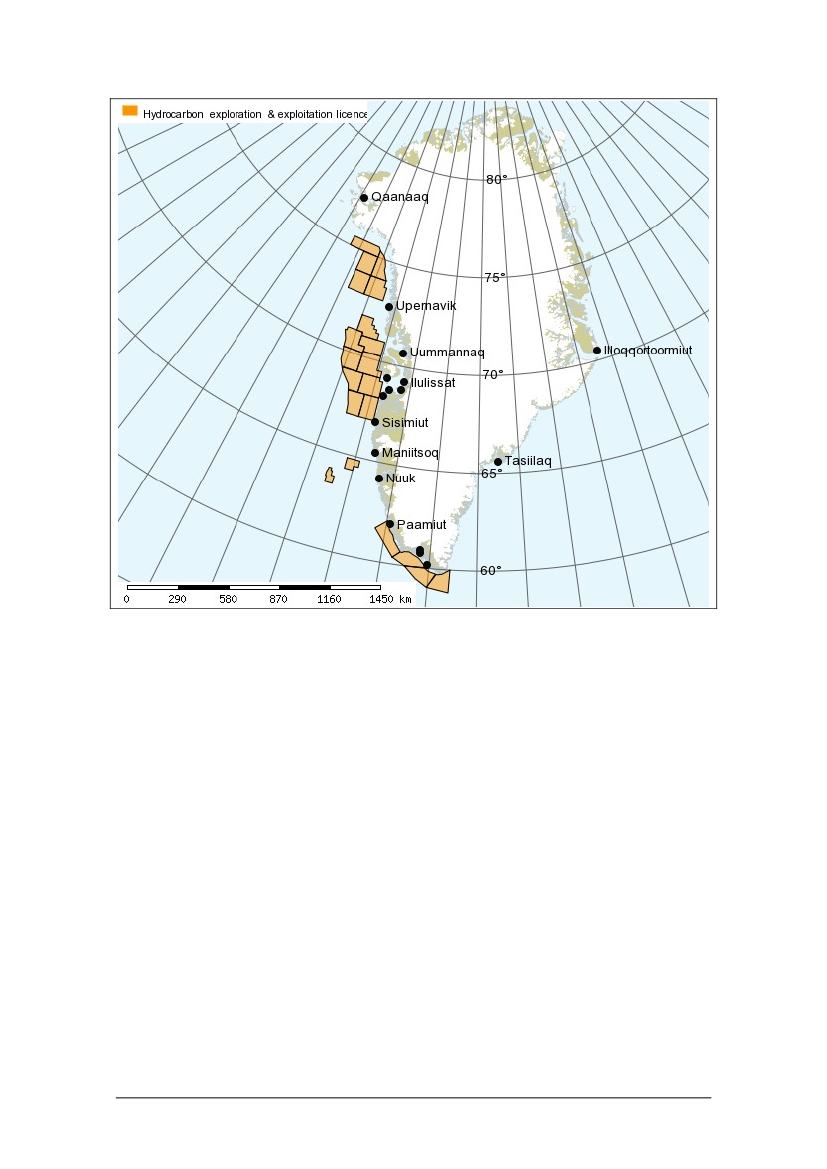
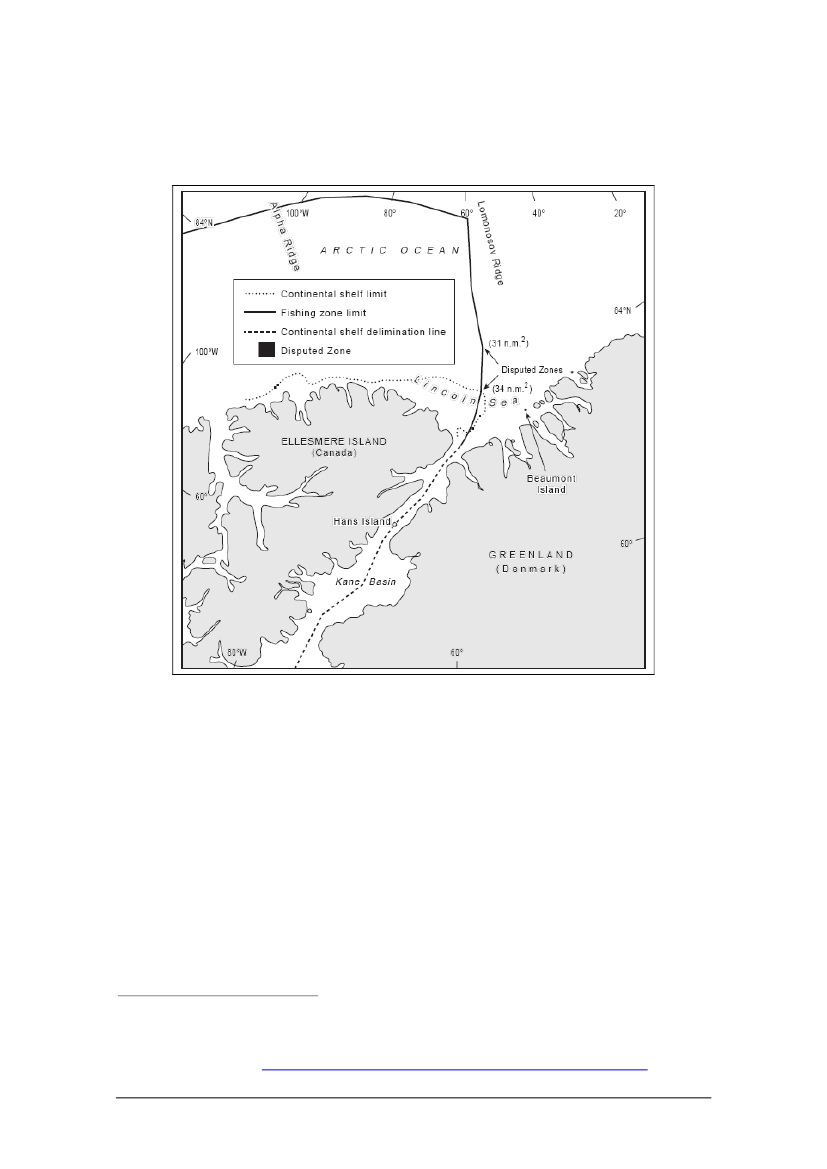
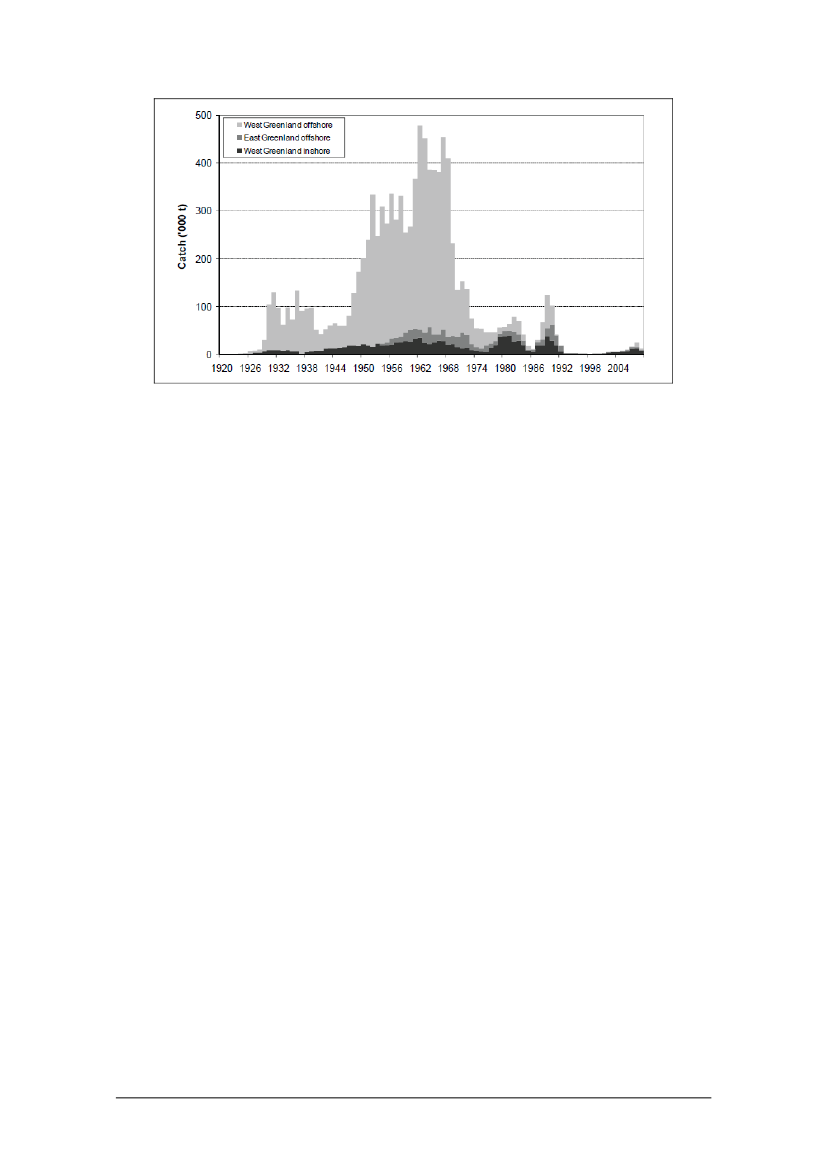
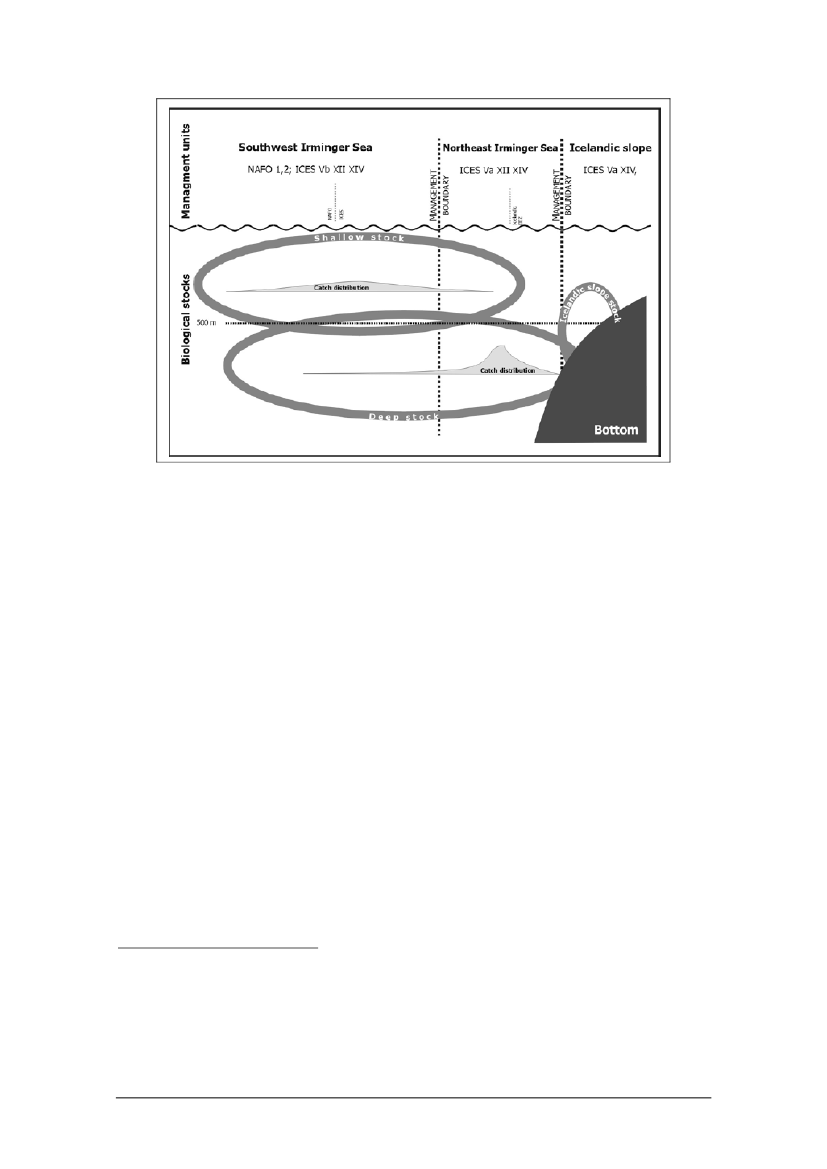
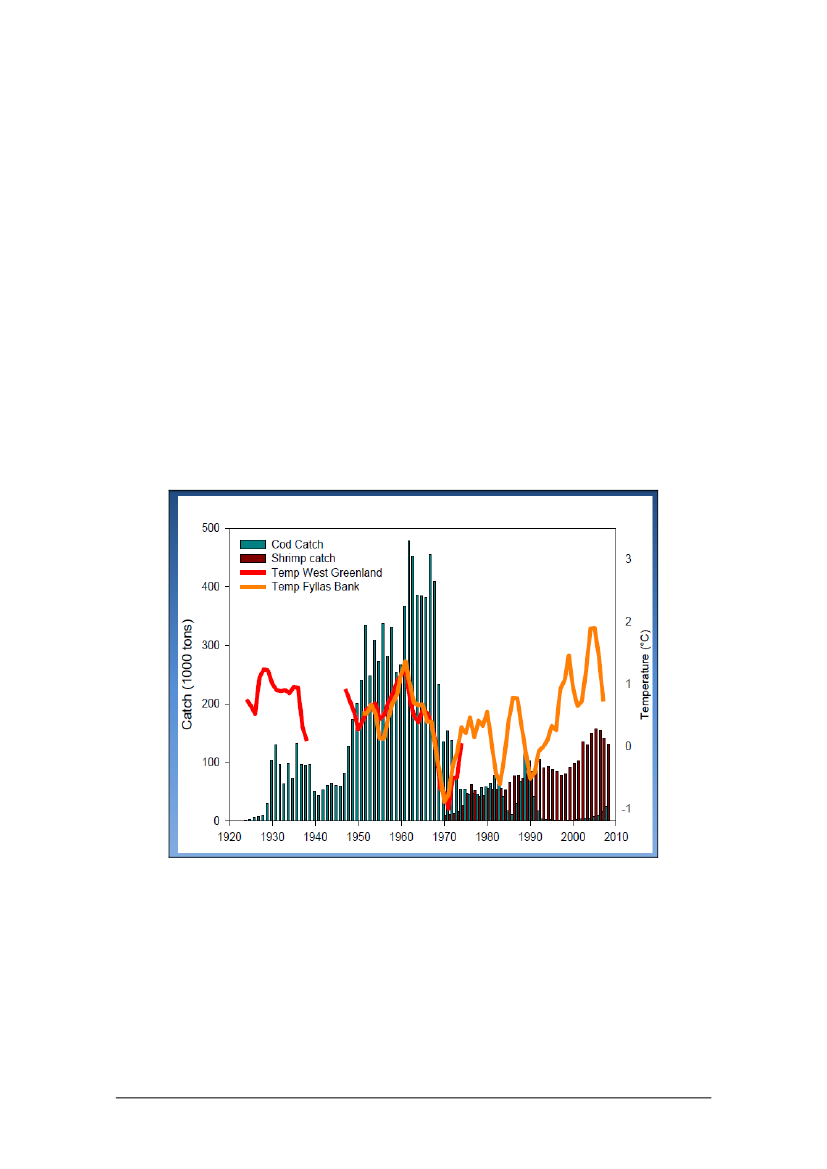
Figure 1: Oil and gas exploration concessions in Greenland..................................... 5Figure 2: Greenland- Canada maritime boundary disputes in the Nares Straitand Lincoln Sea................................................................................................................ 7Figure 3: Catches of cod in East and West Greenland since the 1920s.............. 40Figure 4: Schematic representation of biological stocks and adoptedmanagement units of S. mentella in the Irminger Sea and adjacent waters.............................................................................................................................................. 43
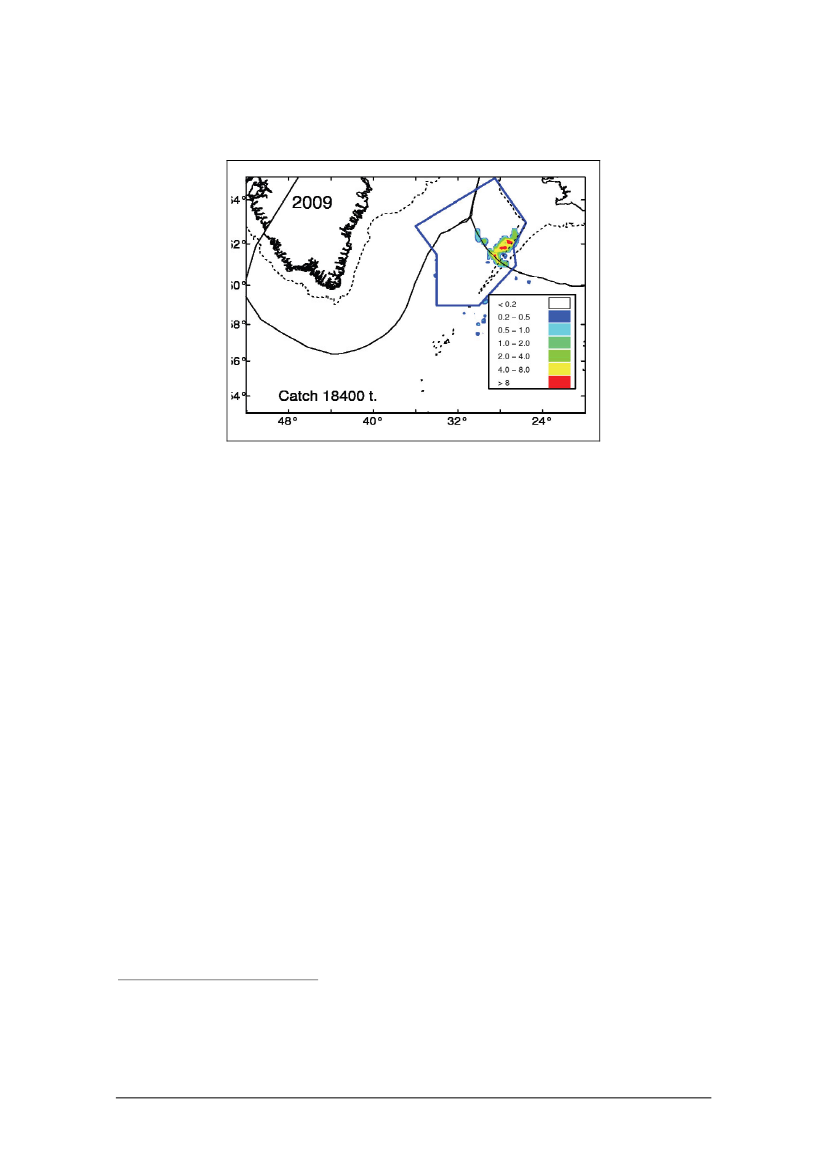
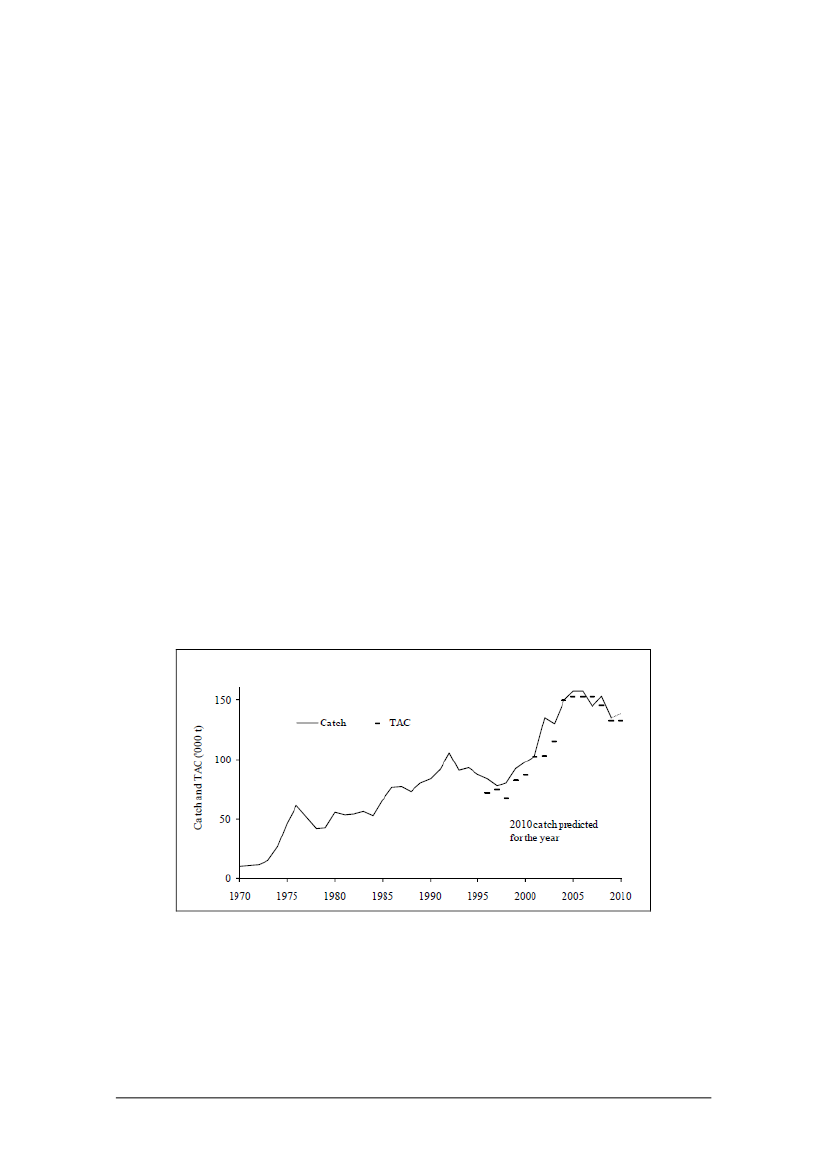
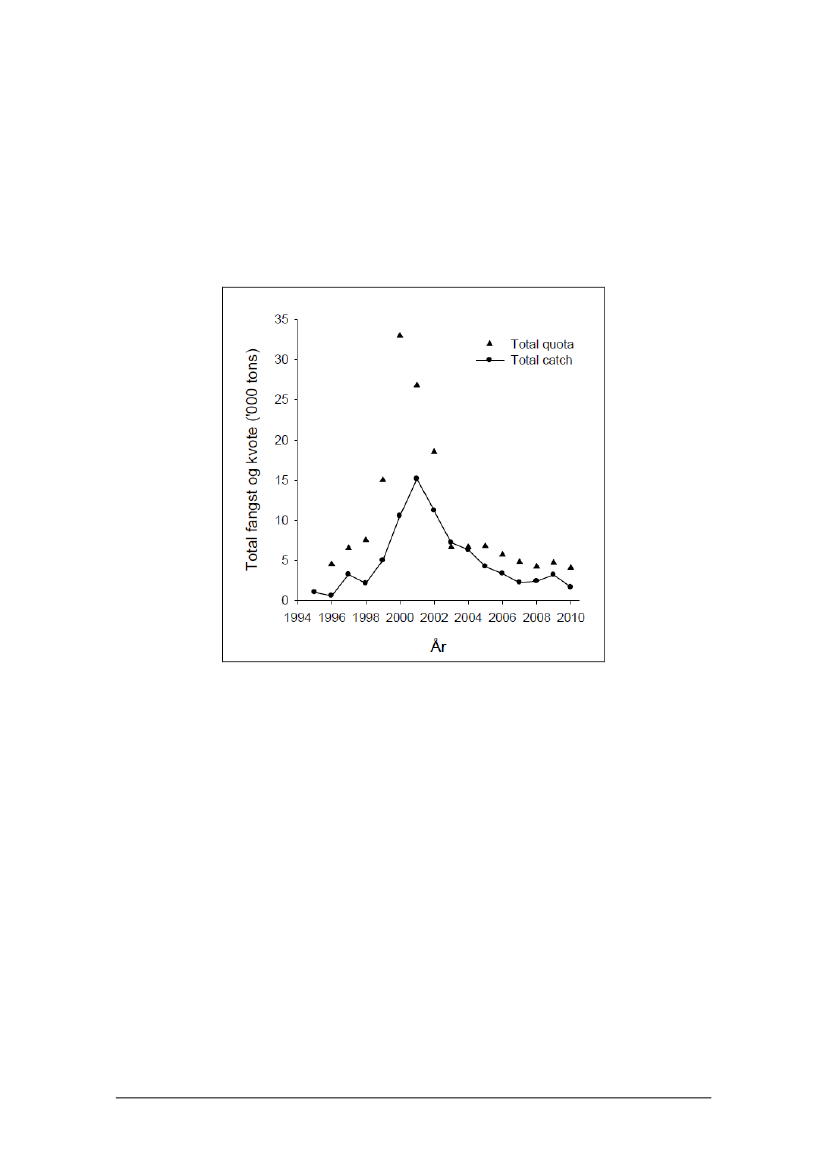
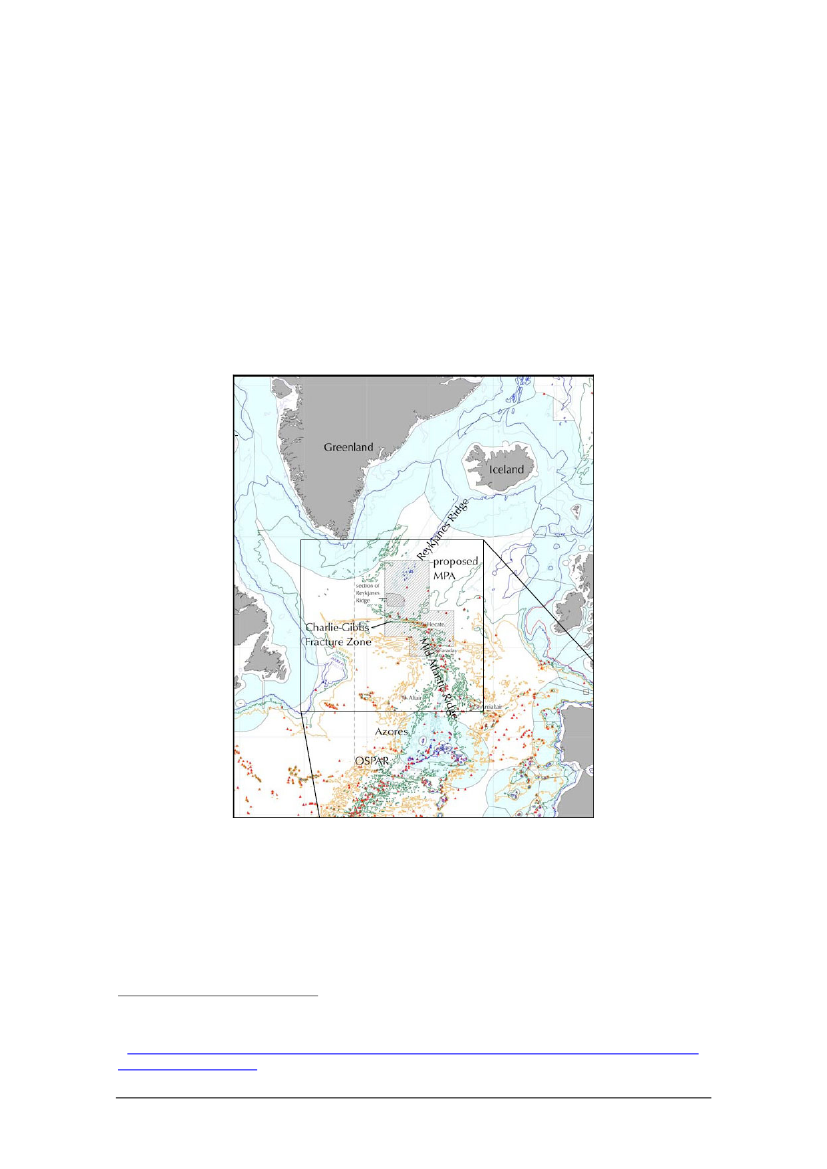
Figure 5: Fishing areas and total catch of pelagic S.mentella from therecommended northeast management unit in the Irminger Sea and adjacentwaters in 2009................................................................................................................ 44Figure 6: Catches and TACs of the shrimp fishery in NAFO SA 0+1, off WestGreenland. Source: NAFO.......................................................................................... 47Figure 7: Catches (fangst) and quota (kvote) in the Greenland offshore andinshore fisheries for snow crab from 1994 to 2010 (year: aar)........................ 49Figure 8: Historical catches of cod and shrimp off West Greenland. Bycatchesand discards.................................................................................................................... 56Figure 9: Location of the proposed MPA in the Charlie Gibbs Fracture Zone.... 59
Final Report
Fisheries Partnership Agreement FPA 2006/20
FPA 35/GRE/11
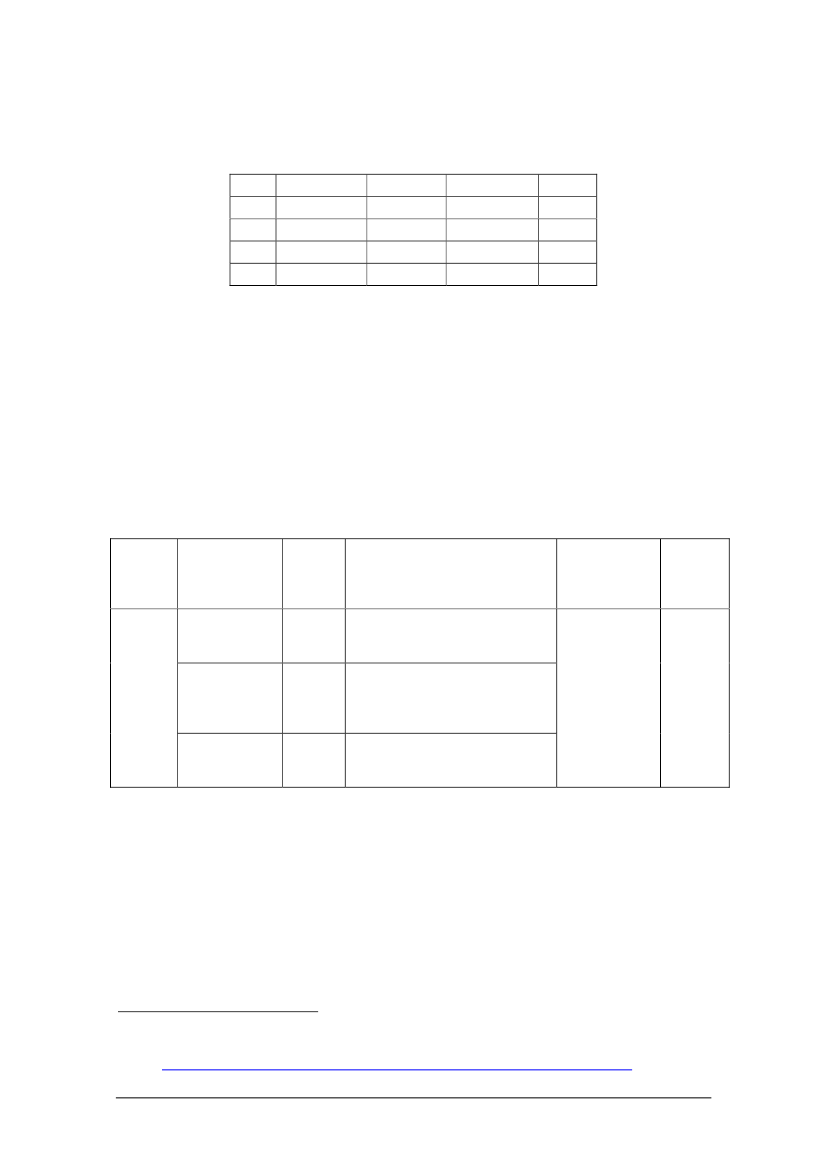
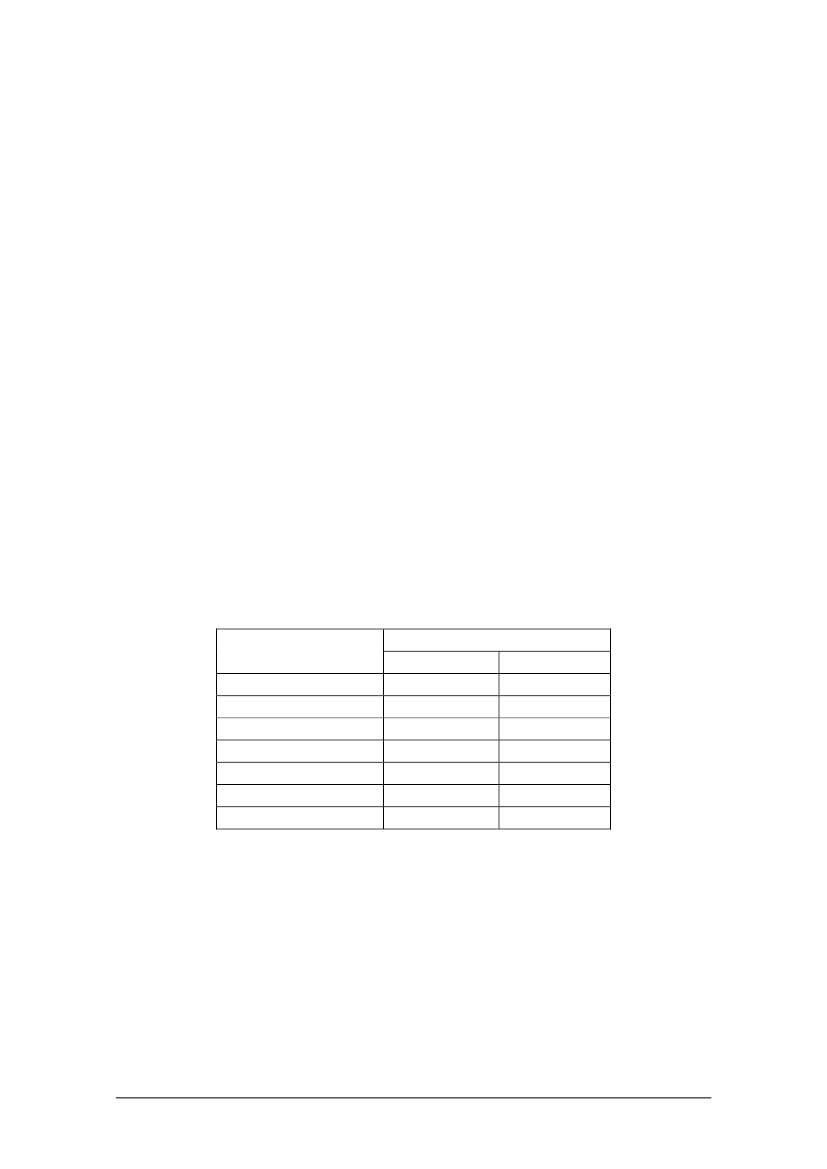
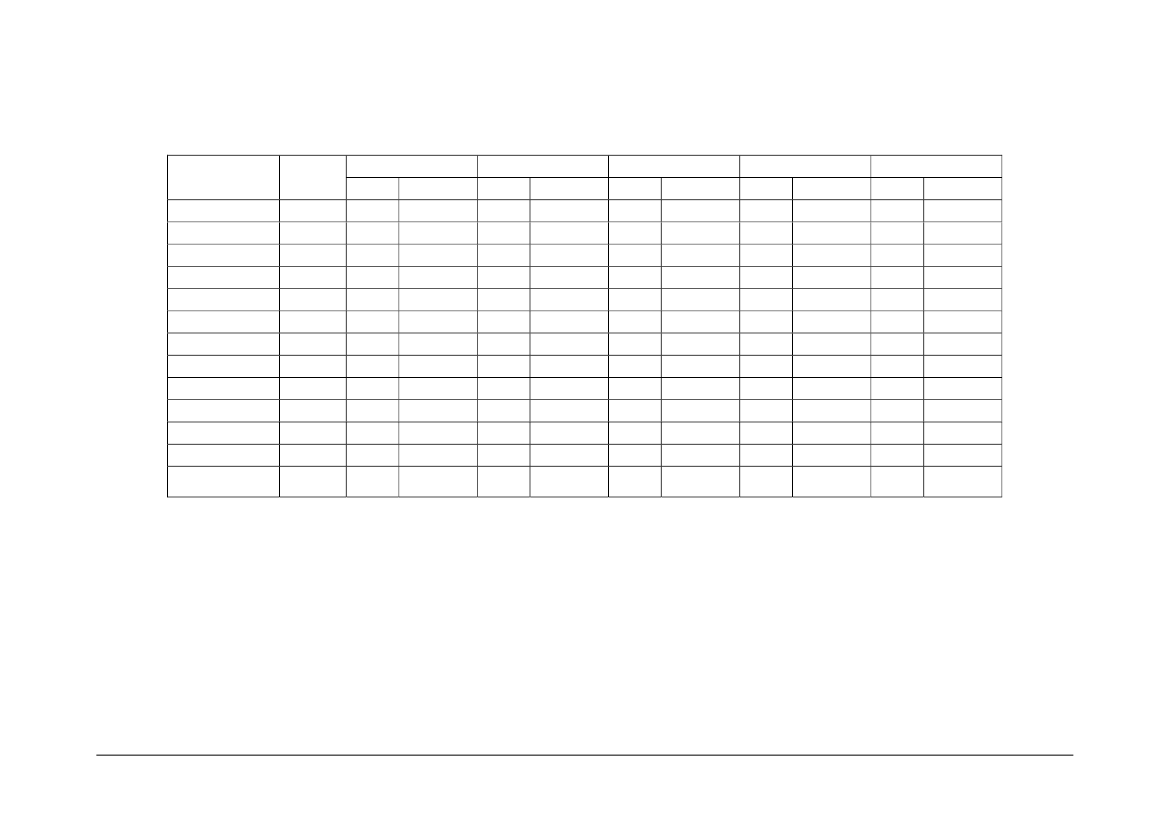
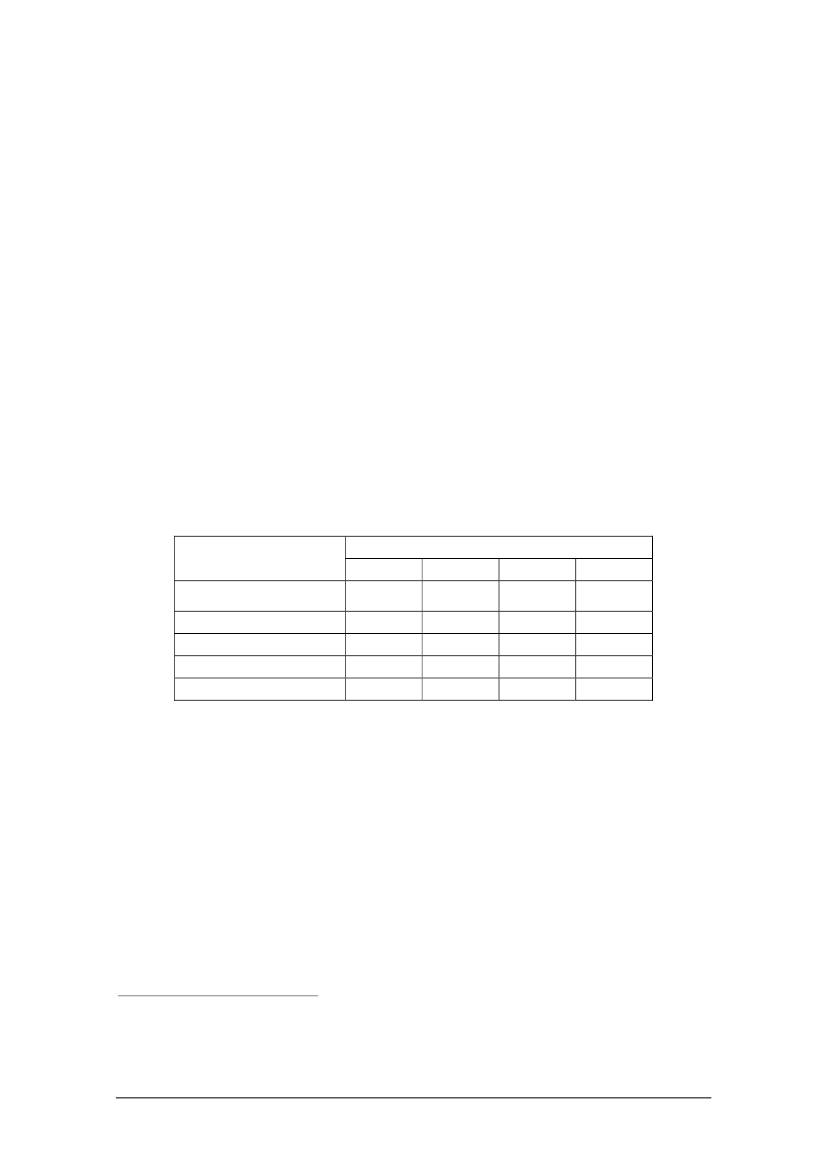
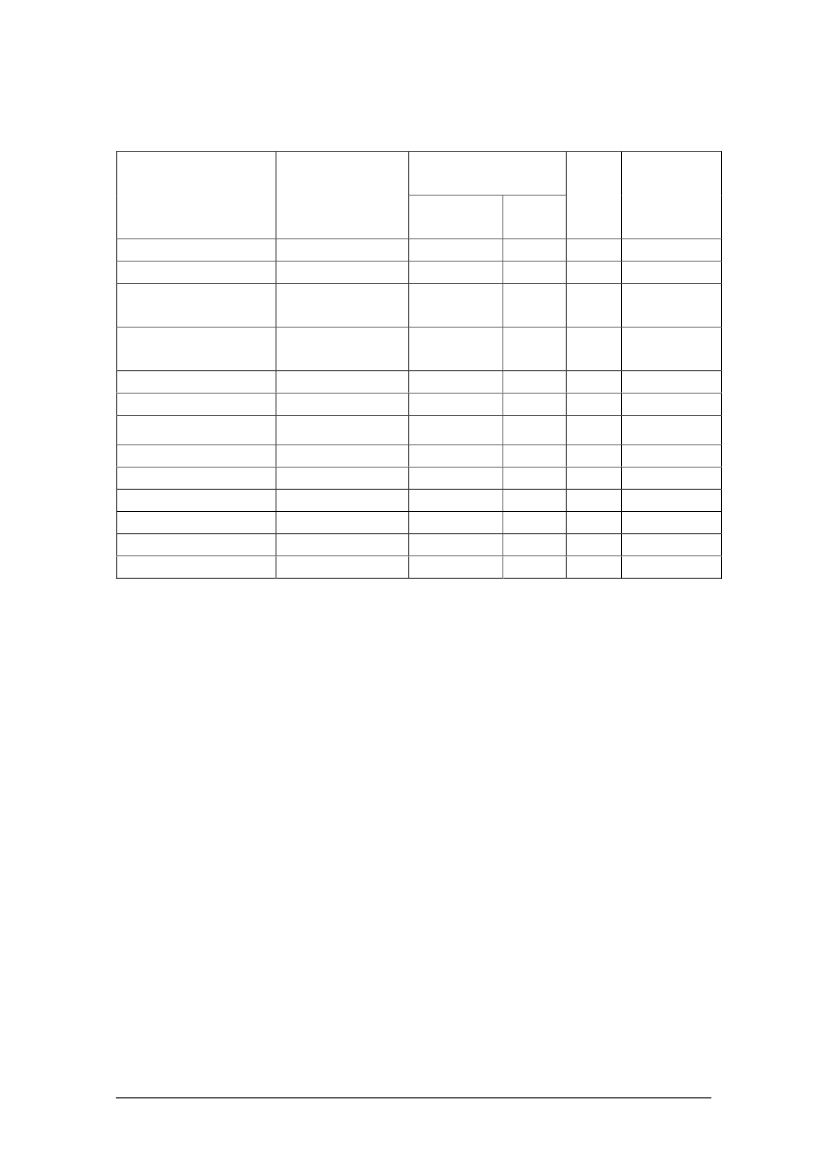
EXCHANGE RATESYear2007200820092010Euro1111USD1.371.481.391.33DKK7.457.467.457.447NOK8.0598.128.828.04ISK87.43145.14172.73164.103GBP0.68190.780.90.86
Source: InforEURO Exchange Rates, European Commission
Final Report
Fisheries Partnership Agreement FPA 2006/20
FPA 35/GRE/11
EXECUTIVE SUMMARY1. This report provides the findings of a study comprising an ex-post evaluation of theFisheries Partnership Agreement between the European Union and Greenland. The studywas commissioned by the Directorate General for Maritime Affairs and Fisheries of theEuropean Commission under a framework contract “for performing evaluations, impactanalyses and monitoring services in the context of Fisheries Partnership Agreements(FPAs) concluded between the European Union and non-EU member states (No.FISH/2006/20)” operated by a consortium comprising Oceanic Développement (France) andMegapesca Lda (Portugal). The study commenced on January 14th2011 and wascompleted on 13thMay 2011.2. The Fisheries Partnership Agreement between the parties was initialled in June 2006, andentered provisionally into force on 1stJanuary 2007 for a period of six years (until 31stDecember 2012). At the time of the study the Fisheries Partnership Agreement hastherefore been operational for just over four years, and the period of evaluation covers theyears 2007 to 2010 inclusive. The methodology involved review of documentation, analysisof quota, licence and catch data from different sources, and interviews/contacts with keystakeholders, including Greenland Government and industry, EU fleet interests, EuropeanCommission, European Member State and Norwegian and Faroe Island Governments(since they receive exchanged quota from the EU, supplied under the Fisheries PartnershipAgreement).3. Greenland is the World’s largest island; the northernmost point lies just 740 km from theNorth Pole. From north to south, Greenland extends 2,670 kilometres. In 1979 Denmarkgranted “Home Rule” to Greenland, which provided for autonomy over most policy areas,with the exception of foreign policy, defence and a number of other functions which wereperformed by Denmark, as the sovereign state. Following a referendum in 2008 a new lawon Self-Government took effect on 21 June 2009, furthering devolution of powers to thenewly entitled Naalakkersuisit (Government of Greenland). Denmark retains functions ofdefence, fishery inspection outside the territorial waters, constitutional affairs, currency andmonetary policy.4. The population of Greenland is 56,452. This includes around 6,300 resident Danes. Thepopulation is stable. The labour force in 2010 was 28,510, with an unemployment rate of7.1%. Greenland’s has low inflation (1.4% in 2009) but suffers from a high structuralunemployment rate, along with an aging population. Gross National Income was EUR29,286/capita in 2006 but has not risen in real terms in recent years. The Government is thelargest employer, accounting for 44% of all jobs. The country relies heavily on the annualblock grant provided by Denmark, accounting for an estimated 32% of GDP.5. The domestic fishery sector is the economy’s most significant earner accounting for 13% ofdirect Gross Value Added and 17% (5,500) of employment (including processing and otherlinked activities). The fishery sector accounts for 88% of tangible exports, almost all ofwhich are to the EU (87% via Denmark). The fishery sector has witnessed a reduction intrade prices for its main export industry (frozen shrimp) as well as decline in other exportssuch as snow crab. The cod fishery, a major resource up to the early 1980s, has failed torecover, despite promising signs. Minerals and tourism remain only marginal contributors toincomes and employment, although there are significant hopes attached to extractiveindustries, offshore oil, hydro-electric schemes and aluminium smelting operations. Severalmajor investment proposals are being considered by Government.6. Climate change and impacts on the Greenland ice sheets bring the possibility of mineralexploitation and new maritime routes with associated costs and benefits. Greenland’s Arcticlocation makes it a strategically important country within the Kingdom of Denmark, and forthe EU. It is an active member of the Arctic Council (currently under the chair of Denmark)and has territorial claims in the Arctic. Greenland and Canada have two unresolvedterritorial disputes, over Hans Island and the maritime boundary in the Arctic Ocean.
Final Report - pagei
Fisheries Partnership Agreement FPA 2006/20
FPA 35/GRE/11
7. In 1953 Greenland ceased to be a Danish colony and became an integral part of Denmark,thus joining the then European Community with Denmark in 1973. Greenland subsequentlyseceded from the EU in 1985. The Fisheries Agreement was established then as an integralpart of Greenland’s negotiations for withdrawal from the EU. The result was that the EU’straditional fishing rights were sustained, and in return, Greenland was able to continuereceiving financial support from the EU.8. Greenland’s status as one of the Member States’ Overseas Countries and Territories (OCT)is guaranteed by the Greenland Treaty negotiated on secession from the EU. This confersthe benefit of tariff free access for its fishery products exported to the EU (sincesupplemented by tariff quotas for non-originating fishery products ). The OverseasAssociation Decision governing the EU’s relations with the OCTs has been extended andexpires at the end of 2013.9. Until 31 December 2006, all EU financial assistance to Greenland (EUR 42.8 million peryear) was channelled through the Fisheries Agreement between the EU and Greenland. Anew approach was adopted with the introduction of the Fisheries Partnership Agreementsfrom 1stJanuary 2007, which focus on fisheries only. An alternative instrument was requiredto facilitate Greenland’s development, and from 1stJanuary 2007 the EU and Greenlandtherefore also entered into a Partnership Agreement for the sustainable development ofGreenland. This Partnership Agreement will expire at the end of 2013. The PartnershipAgreement has delivered budgetary support to Greenland valued at EUR 25 million/year,programmed via a “Programming Document for the Sustainable Development ofGreenland”, which focuses support on the Greenland Education Programme. A mid-termreview of the programme found that it had acceptable levels of efficiency, effectiveness andsustainability, and recommended extending the areas of cooperation, to includeenvironment, climate and indigenous peoples, thus establishing clearer links to the EU’sCommunication on the European Union and the Arctic Region.10. Greenland’s marine EEZ is 2,184,254 km2and can be divided into two zones: EastGreenland and West Greenland. Both have rich fishery resources and fall within the remit ofICES and NAFO respectively. Around 220,000 tonnes of fish have been caught annually inthe Greenland fishery in the years 2007-2010, of which 65% were shrimp, emphasising theimportance of this resource to the Greenland economy. The other principal fisheries areGreenland halibut, cod, redfish, snow crab and capelin. The EU and other third countryfishers (Norway, Russia, Faroes and Iceland) fish predominantly in East Greenland. SomeGreenland quotas for straddling and migratory stocks (redfish and capelin) are taken ininternational or Icelandic waters.11. The Greenland fishing fleet comprised some 757 vessels in 2007. Most vessels are small.There are an estimated additional 3,000 to 5,000 dinghies and sledges which are used forfishing and hunting at different times of year. The industrial fleet comprises 47 vesselsoperating in the EEZ and in international, Faroese and Norwegian waters.12. The fish processing industry comprises some 56 processing establishments and 4 coldstores. The sector is dominated by two large multi-national processing and exportingcompanies, Royal Greenland and Polar Seafoods, which operate the industrial shrimp fleetand the 5 main shrimp processing establishments. They specialise in processing, includingvalue added processing, of shrimp, Greenland Halibut and cod and have significantprocessing interests in the EU and global sales and marketing operations. The 100% state-owned company, Royal Greenland, made a loss of EUR 5.8 million in 2009/2010, andcarries EUR 265 million of debt. In 2009, the company had to raise an additional capitalinjection of EUR 66 million, from the Government of Greenland. The Company is reported tohave returned to profit in 2010. Government policy is to stabilise the company, reduce itsdebt and consider privatisation.13. The fish catching sector provided employment for about 2,000 full-time equivalents (FTE) in2004 while the processing industry provided 3,500 FTE. The fishery sector providesemployment for 17% of the workforce, about half of the jobs provided by the fishing industryin the 1970s. The rate of decline in fisheries employment in the inshore fishery is about 6%due to lack of profitability and retirement.
Final Report - pageii
Fisheries Partnership Agreement FPA 2006/20
FPA 35/GRE/11
14. Exports of fishery product to the EU over the period 2007-2009 have averaged around EUR290 million per year. Greenland is the largest global producer of coldwater shrimp(Pandalusborealis).Frozen shrimps account for about 62% of the export value of fisheryproducts, and Greenland halibut, accounts for about 27%. Cod accounted for only 4% oftotal export value. Greenland enjoys full access to the EU market for fishery products as aresult of its status as an OCT country. The EU duty applied to whole frozen Northern shrimpfrom other sources is 12% (20% for cooked and peeled shrimp). The Greenland preferenceis supplemented by the provision of a tariff quota of 10,000 tonnes of non-originatinghalibut, Greenland halibut and frozen shrimp (hardly utilised by Greenland), and anadditional tariff quota of 2,100 of prepared and preserved shrimp (fully utilised) to allowcontinuity of activity of the Greenlandic processing sector. However, these preferenceshave been eroded to a degree by the granting by the EU of anerga omnestariff quota forfrozen shrimp (currently 20,000 tonnes per year).15. The key elements of the Fisheries Partnership Agreement are that Greenland grants accessto EU vessels to fish in its EEZ in return for a financial contribution. Fishing opportunities inthe form of indicative quotas for different species are set out in the Protocol. From 2008onwards these comprised 55,000 tonnes of capelin and 36,700 tonnes of other speciesincluding cod, shrimp, Greenland halibut, redfish, Atlantic halibut and snow crab. Provisionis made that the EU may employ the fishing opportunities in exchanges between the EUand other third countries, specifically Norway, Iceland and Faroe Islands. EU and thirdcountry vessels may only fish in the Greenland EEZ when they hold a valid licence, forwhich fees (for EU vessels only) are set in the Protocol at 5% of a specified reference price.The EU undertakes to pay Greenland EUR 85,852,464 over a six year period, payable inannual tranches of EUR 14,307,244. Each year Greenland commits to applying EUR3,261,449 of this (slightly less in 2007) in favour of implementing a sectoral fisheries policywith a view to securing continued responsible fishing, to be managed in the light ofobjectives identified by mutual agreement within the frame of the joint committee.16. Because of resource limitations, on nine occasions over the four year period from 2007 to2010 inclusive Greenland has not been able to deliver all of the fish quotas set out in theProtocol. Deficits were in quotas for capelin in all years, halibut (both East and WestGreenland) in 2009 and 2010, and cod in 2010. The average annual deficit was 35,530tonnes, which corresponds to 39% of the annual quantity. A compensation mechanism (toallow Greenland to offer alternative opportunities) has worked well for small fluctuations inavailability of quota, but has not been able to cope with the “debt” for larger quantities ofcapelin (a resource with a known high degree of natural variation). In 2010 the partiesagreed that the debt (valued at EUR 2.6 million) should be resolved by i) reduction of the2011 compensation payment by EUR 1.6 million and ii) expansion of the sectoral policymatrix by Greenland, to include purchase of research vessel valued at EUR 1.1 million.17. During the period a total of 37 EU flagged vessels have benefited from the FisheriesPartnership Agreement, including 5 from Germany, 13 from Spain, 4 from UK, 6 fromPortugal, 1 from Denmark, 3 from Lithuania and 2 each from Poland and Estonia(accounting for 3% of the EU fleet tonnage). A concession by Greenland to allow groups ofvessels from a single Member state to purchase blocks of licence for subsequentdistribution between them has significantly facilitated uptake of licences. As a result overalluptake of opportunities has been good, averaging 75% during the period. If quotastransferred by the EU in bilateral exchanges with other third countries (Norway, FaroeIslands and Iceland) are included, then overall utilisation, in terms of licences drawn, isabout 90% of the available quota.18. Quotas for EU vessels are allocated according to relative stability keys, which do not fullymeet the pattern of current demand. A system of intra-community quota exchangesbetween Member States is well used, and has helped to maintain the level of utilisation ofthe Fisheries Partnership Agreement. In the first two years, some fleet segmentscomplained about quota being released too late in the year to allow effective planning, but asystem of regular and earlier swaps has evolved.
Final Report - pageiii
Fisheries Partnership Agreement FPA 2006/20
FPA 35/GRE/11
19. There are significant differences in utilisation depending on the quota. Fishing opportunitiesfor shrimp in W.Greenland, Greenland halibut and cod are in high demand. Theintroduction of management measures has limited the utilisation of cod opportunities to 91%overall. Only 45% of the annual quota of 7,000 tonnes of shrimp quota in East Greenland isused, and only 46% of redfish quotas. The snow crab fishing opportunities under the FPAhave never been utilised by Spain. Atlantic halibut quota allocated to Portugal has proven tobe virtually unfishable to EU vessels, and of limited interest to Norwegian ones. Bycatchesunder the Fisheries Partnership Agreement have been minimal.20. Overall, in an average year, the Protocol has delivered catches of 48,502 tonnes/year, ofwhich 16,472 tonnes were caught by EU vessels, and 32,030 tonnes by third countryvessels (these averages exclude years in which no capelin were caught). The annualcatches taken in the Greenland zone by EU vessels are estimated to correspond to about0.3% of total EU catches. On average EU vessels caught 63% of the quotas available tothem, and third country vessels 88%.21. Based on fish prices published in Iceland, the average revenues derived from the FisheriesPartnership Agreement were EUR 45.6 million/year, of which EU vessels derived EUR 31.9million (70%) and third country vessels EUR 13.7 million (30%). In fact since EU vesselsobtain access to fishing opportunities in a balanced exchange of Greenland quota withNorway, Faroe Islands and Iceland, the EU benefits of the Fisheries Partnership Agreementmay be considered to include these latter revenues (assuming that the balanced exchangeis cost/benefit neutral). The EU Member states which benefit the most are Germany (42% ofthe revenues under the Fisheries Partnership Agreement), Denmark (11%), Poland (7%)and UK (4%).22. Quota obtained from Greenland has contributed respectively 89%, 37% and 100% of thequota supplied in the EU’s annual balanced exchange with Norway, Faroe Islands andIceland (the balance being from EU stocks). Overall Greenland contributed 70% of thesesexchanges in cod equivalent terms. Access of EU vessels to important resources,particularly in Norway and Iceland (in the context of the EEA Agreement) has thereforebeen highly dependent on the EU’s agreement with Greenland (although EU and Icelandwere not able to agree on the terms of the exchange in 2009 and 2010). Without theseopportunities it is unlikely that many vessels in the distant water fleets of UK, Spain,Portugal and Germany could continue to operate.23. For the EU, the Fisheries Partnership Agreement has delivered net value added benefitsestimated at EUR 20.3 million/year, for an outlay of EUR 15.8 million, suggesting a costbenefit ratio of 1.3 (i.e. returning EUR 1.30 for every EUR 1.00 invested). This is a positivereturn, and equivalent to that of the Fisheries Partnership Agreements with Mauritania(which is also a “mixed” agreement). It has accounted for approximately 330 full time jobs atsea, suggesting around a total of around 500 EU jobs are dependent on fishing inGreenland under the Fisheries Partnership Agreement (but considerably more taking intoaccount the supported activities in other third countries).24. Therefore whilst the Fisheries Partnership Agreement has been effective in promoting EUfishing in Greenland and other third country waters, it has only been a marginally efficientmeans of achieving these ends, and its viability remains sensitive to externalities. Thesystem of licence allocation is inefficient, with rigid annual limits requiring that EU vesselspurchase more quota than is required (on averaging catching 16,472 tonnes out of 19,783tonnes of quota taken, with17% of purchased quota remaining unused at the end of theyear). Third country vessels suffer no penalty by over-drawing quota.25. Overall, including the sector support, the EU has contributed a relatively high EUR286/tonne of fishery products produced (30% of the sales value). Moreover the EU financialcontribution and licence fees represent almost 70% of the budgetary income generated bythe Greenlandic fishing sector, while accounting for only 12% of the total value of thecatches in the EEZ. Of the overall access costs to the resource (compensation plus licencefees, estimated at EUR 259/tonne) the EU has contributed 85% and the fleet operators15%, which is more or less the same level of public contribution applied by EU policy in theEU’s other mixed Fishery Partnership Agreements (for example 87% in Mauritania) butFinal Report - pageiv
Fisheries Partnership Agreement FPA 2006/20
FPA 35/GRE/11
considerable more that the EU’s “tuna agreements” where the targeted split is typically65/35.26. For Greenland, the Fisheries Partnership Agreement has been an effective measure togenerate income from several fishery resources which it may not otherwise have been ableto exploit. In 2011 the amount of compensation was adjusted downward to partly accountfor the cancellation of the capelin debt accrued during the period 2007 to 2010(corresponding to EUR 0.4 million/year). Therefore the Fisheries Partnership Agreementgenerated on average EUR 15.8 million per year in financial contributions, comprising EUR13.9 million in adjusted contribution and EUR 1.9 million in licence fees. This incomeaccounted for 1.3% of the state budget in 2010. The resource rent achieved isapproximately EUR 326/tonne (35% of vessel revenue, which is high by internationalstandards).27. The Fisheries Partnership Agreement has not been effective in delivering any significantadditional economic benefits to Greenland (such as joint ventures, employment on board, orlandings into processing). A programme of sector support measures valued at around EUR4.0 million/year has been implemented by the Ministry of Fisheries Hunting and Agriculture,in line with Article 4 of the Protocol. The FPA-linked financial contribution accounts for some70% of the state budget contribution to the fisheries sector. About half of the money hasbeen spent on fisheries research. The programme was found to have relevant objectives,and has achieved positive results on measures related to fisheries research, training ofstaff, and fisheries control, thus contributing to the improved sustainability of the Greenlandfisheries sector. However, it has failed with regard to structural adjustment of coastalfisheries, and it is not always clear that the budgetary support has been used forinvestment, rather than current, expenditure.28. There are concerns regarding sustainability of the three of the ten fishing opportunitiesspecified in the Fisheries Partnership Agreement. There is clear evidence that cod,Greenland halibut in E.Greenland and redfish (deep pelagic stocks) are subject toexcessive and unsustainable levels of exploitation, and that the Fisheries PartnershipAgreement has contributed respectively 11%, 30% and 8% of the overall exploitation duringthe period of the evaluation. For cod, some management measures have been introducedin line with a cod management plan developed by Greenland, but this plan needs furthermodification if it is to deliver long term sustainability. For redfish, an Agreement signed inMarch 2011 by Greenland, the EU and other states regarding management of this speciesin the Irminger Sea will progressively reduce TACs and should bring sustainability in future.For Greenland halibut (East), another straddling stock, there is no Agreement between thecoastal states (Greenland, Iceland and Faroe Islands); each sets autonomous TACs andcatches exceed scientific advice by a factor of 5. Although there are also concernsregarding the sustainability of the levels of exploitation of shrimp in W.Greenland(considered to be at risk), here the Fisheries Partnership Agreement has contributed lessthan 3% of the exploitation, and an effective management plan was introduced in 2010.There is also a risk that exploitation of the Atlantic halibut has not been sustainable,although there is insufficient evidence for a definitive analysis. Other quotas (shrimp inE.Greenland, Greenland halibut in W.Greenland, capelin and snow crab) are all consideredto be subject to sustainable management. All fisheries are known to have low rates ofbycatch. All demersal trawl fisheries are subject to sorting grids, and discarding isprohibited. There are no known negative non-target or ecosystem impacts.29. In general the Fisheries Partnership Agreement is coherent with EU development, trade andpolicies, which together deliver a range of benefits to the Government of Greenland andGreenlandic stakeholders. Except for the lack of sustainability of three key stocks, it isbroadly coherent with the Common Fisheries Policy. The Fisheries Partnership Agreementis potentially coherent with the EU’s emerging policy framework with regard to the Arcticregion. In respect of EU trade measures in relation to seal products, which has had anegative impact on livelihoods of small scale fishers/hunters, the policy framework haslacked coherence. Overcapacity in inshore fisheries and lack of alternative employmentopportunities are critical structural problems in the Greenland fishery sector, which remainto be properly addressed in future through a strengthened structural adjustment programme
Final Report - pagev
Fisheries Partnership Agreement FPA 2006/20
FPA 35/GRE/11
under the sectoral policy support measures supported by the Fisheries PartnershipAgreement.30. Overall, the study concludes that the Fisheries Partnership Agreement has been ofimmense mutual benefit to the parties, and therefore recommends that the parties enternegotiations for the renewal of the protocol. It is recommended that a new protocol be for aperiod of just three years, to allow for a subsequent protocol to be adjusted to ensure fullcoherence with any renewal of the Overseas Association Decision and the GreenlandPartnership Agreement. This will also allow for new measures within the reformed CommonFisheries Policy to be reflected in the design of a new Fisheries Partnership Agreement andProtocol, which are coherent with other EU policy areas, including the EU’s Arctic Policy inrelation to maritime and environmental matters.
Final Report - pagevi
Fisheries Partnership Agreement FPA 2006/20
FPA 35/GRE/11
RÉSUMÉ EXÉCUTIF1. Ce rapport présente les résultats d’une étude d’évaluation ex-post de l’accord departenariat dans le domaine de la pêche entre l’Union Européenne et le Groenland.L’étude a été lancée par la Direction Générale de la Pêche et des Affaires Maritimes dela Commission européenne sous un contrat cadre « pour la réalisation d’évaluations,d’études d’impact et des services de suivi dans le contexte des accords de partenariatdans le domaine de la pêche conclu entre l’Union Européenne et Pays non-membresde l’UE ref. FISH/2006/20 » dont le titulaire est le consortium composé d’OceanicDéveloppement (France) et Megapesca Lda (Portugal). L’étude a débuté le 14 janvier2011 et s’est terminée le 13 mai 2011.2. L’accord de partenariat dans le domaine de la pêche entre les deux parties a étéparaphé en juin 2006 et est entré provisoirement en vigueur le 1erjanvier 2007 pour unepériode de six années (jusqu’au 31 décembre 2012). Au moment de cette étude,l’accord a donc été opérationnel pendant un peu plus de quatre années, et l’évaluationcouvre la période 2007-2010 inclus. La méthodologie mise en œuvre comprend unerevue de la documentation disponible, une analyse des données sur les quota, leslicences et les captures issues de différentes sources, and des contacts / interviewsavec des parties prenantes clés dont les autorités du Groenland et son industrie de lapêche, les intérêts de l’UE dans l’armement de navires, la Commission européenne, lesEtats membres de l’UE ainsi que les autorités de Norvège et des Faeroe dans lamesures où ces entités re§oivent des quota de l’UE qui les obtient sous cet accord).3. Le Groenland constitue la plus grande île du monde. Son point le plus septentrional està 740 m du Pôle Nord. Du Nord au Sud, le Groenland s’étend sur 2 670 km. En 1979, leDanemark a accordé au Groenland une part d’autonomie sur la plupart des domaines,à l’exception de la politique étrangère, de la défense et de quelques autres fonctionsrégaliennes. A la suite d’un référendum tenu en 2008, l’autonomie a été élargie par uneloi qui a pris effet le 21 juin 2009 et qui donne au nouvellement nommé Naalakkersuisit(Gouvernement du Groenland) davantage de pouvoir. Le Danemark continue d’assurerla défense, l’inspection de produits de la pêche en dehors des eaux territoriales, lesaffaires constitutionnelles et la politique monétaire.4. La population du Groenland est de 56 452 habitants, incluant environ 6 300 résidentsdanois. La population est stable. Le nombre de personnes en âge de travailler était de28 510 en 2010 avec un taux de chômage de 7,1%. Le taux d’inflation au Groenland estbas (1,4% en 2009) mais souffre d’un taux de chômage structurellement élevé ainsi qued’une population vieillissante. Le Produit Intérieur Brut était de 29 286 € par personneen 2006 mais n’a pas marqué de croissance en termes réels sur ces dernières années.Le Gouvernement est le plus grand employeur, absorbant 44% des emplois. Le paysest très dépendant de la subvention annuelle accordée par le Danemark qui représente32% du PIB.5. Le secteur de la pêche national est le premier secteur économique représentant 13%de la valeur ajoutée directe et 17% (5 500) de l’emploi (incluant la transformation et lesautres activités connexes). Le secteur de la pêche est à l’origine de 88% desexportations avec une destination pratiquement exclusivement vers l’UE (87% vers leDanemark). Le secteur de la pêche a subi les effet d’une baisse de prix à l’exportation(crevettes congelées), ainsi que sur d’autres produits comme le crabe des neiges. Lapêcherie de cabillaud, une ressource majeure jusqu’au début des années 80, ne s’estpas restaurée en dépit de signes prometteurs. Le minerai et le tourisme restent dessecteurs faiblement contributeurs à l’emploi et aux revenus. Toutefois, il existe desperspectives pour les secteurs des mines, du pétrole offshore, de l’énergiehydroélectrique et de la fusion d’aluminium. Plusieurs projets d’investissements sontexaminés par le Gouvernement.6. Le changement climatique et son impact sur la couverture glacière du Groenland faitapparaître des possibilités pour l’exploitation du minerai et la création de nouvellesroutes maritimes avec des coûts et des bénéfices associés. La localisation arctique duFinal Report - pagevii
Fisheries Partnership Agreement FPA 2006/20
FPA 35/GRE/11
Groenland lui donne un avantage stratégique à l’intérieur du Royaume du Danemark etpour l’UE. Le territoire est un acteur majeur du Conseil de l’Arctique (présidé en cemoment par le Danemark). Il existe des revendications territoriales dans l’Arctique. LeGroenland et le Canada ont deux cas non résolus, l’un sur l’île de Hans et l’autre sur leslimites maritimes dans l’océan arctique.7. En 1953, le Groenland a cessé d’être une colonie du Danemark et a été intégré aupays, rejoignant ainsi l’UE avec le Danemark en 1973. Le Groenland s’est séparé del’UE en 1985. L’accord de pêche a fait partie intégrante des négociations vers le retraitde l’UE. Le résultat a été que les droits de pêche traditionnels de l’UE ont étéconservés, et en retour, le Groenland a pu continuer à recevoir un soutien financier del’UE.8. Le statut du Groenland en tant que Pays et Territoires d’Outre-Mer (PTOM) est garantidans le Traité négocié lors de la séparation de l’UE. Ce statut confère au Groenland lebénéfice d’un accès à tarif nul au marché de l’UE pour les produits de la pêche(complété depuis par des quotas tarifaires pour les produits non-originaires). Le Traitéencadrant les relations entre l’UE et les PTOM a été prorogé et doit expirer à la fin de2013.9. Jusqu’au 31 décembre 2006, toute l’assistance financière de l’UE au Groenland (42,8M€ par an) a été délivrée sous l’accord de pêche. Une nouvelle approche a ensuite étéadoptée avec l’introduction d’un accord de partenariat dans le domaine de la pêche envigueur depuis le 1erjanvier 2007 qui ne concerne que ce secteur. Un nouvelinstrument était nécessaire pour soutenir le développement du Groenland et depuis le1erjanvier 2007, l’UE et le Groenland ont conclu un accord de partenariat pour ledéveloppement durable du Groenland. Cet accord expirera fin 2013. L’accord departenariat apporte un soutien budgétaire de 25 M€ par an mis en œuvre par ledocument de programmation pour le développement durable du Groenland. Leprogramme se concentre sur le secteur de l’éduction. Une revue à mi-parcours amontré que ce programme est raisonnablement efficient, efficace et durable, et arecommandé l’élargissement du partenariat vers les secteurs de l’environnement, duclimat et des populations indigènes ,créant ainsi un lien clair avec la Communication del’UE sur la région arctique.10. La superficie de la ZEE du Groenland est de 2 814 254 km� et peut être divisée en deuxzones Est et Ouest. Les deux zones disposent de ressources naturelles et sont dansles zones couvertes par le CIEM et la NAFO respectivement. Environ 220 000 tonnespar an de poissons ont été capturées par les pêcheries groenlandaises entre 2007 et2010, dont 65% de crevettes, ce qui souligne l’importance de cette ressource pourl’économie du pays. Les autres principales pêcheries sont celles de flétans, cabillauds,sébastes, crabe des neiges et capelan. L’UE et les autres flottes étrangères (Norvège,Russie, Faeroe) exploitent principalement la zone Est-Groenland. Quelques quotas duGroenland pour des espèces migratoires et chevauchantes (sébastes, capelan) sontpêchés dans les eaux internationales ou sous juridiction de l’Islande.11. La flotte de pêche du Groenland comptait quelques 757 navires en 2007, dont la plupartsont de petite taille. On estime qu’il y a en plus entre 3 000 et 5 000 canoes utiliséspour la chasse et la pêche à différentes périodes de l’année. Le segment industriel estcomposé de 47 navires travaillant dans la ZEE, ainsi que dans les eaux internationalesou celles sous juridiction des Faeroe et de la Norvège.12. Le secteur de la transformation des produits de la pêche compte quelques 56 unités et4 entrepôts frigorifiques. Ce secteur est dominé par deux grandes multinationales,Royal Greenland et Polar Seafoods qui arment la flotte de pêche crevettière etcontrôlent les 5 plus grands établissements de transformation. Ces sociétéstransforment de crevettes, du flétan et du cabillaud et ont des intérêts dans dessociétés sur le territoire de l’UE faisant de la transformation et du négoce. La sociétéRoyal Greenland contrôlée à 100% par l’Etat a affiché une perte de 5,8 M€ en2009/2010, et accumule 265 M€ de dettes. En 2009, la société a du injecter 66 M€dans son capital, apportés parle Gouvernement. La société serait redevenue profitable
Final Report - pageviii
Fisheries Partnership Agreement FPA 2006/20
FPA 35/GRE/11
en 2010. La politique du Gouvernement est de stabiliser la société, réduire ses dette etd’examiner la possibilité d’une privatisation.13. Le secteur de la capture donnait de l’emploi à environ 2 000 personnes équivalenttemps plein (ETP) en 2004, plus 3 500 ETP dans le secteur de la transformation. Lesecteur emploie 17% de la force de travail, soit environ la moitié des emplois dans lesecteur au cours des années 70. Le taux de décroissance de l’emploi dans le secteurde la pêche côtière est d’environ 6% du fait d’un manque de rentabilité et de retraites.14. Les exportations de produits de la pêche vers l’UE se sont monté à environ 290 M€ paran en moyenne sur la période 2007-2009. Le Groenland est le premier producteurmondial de crevettes nordiques (Pandalusborealis).Les crevettes congeléesreprésentent environ 62% de la valeur des exportations, devant le flétan avec 27%. Lecabillaud ne représente plus que 4% des exportations. Le Groenland a un accès àdroits nuls au marché de l’UE pour les produits de la pêche du fait de son statut dePTOM. Le droit appliqué à la crevette nordique congelée de pays tiers est de 12% (20%pour les crevettes cuites et pelées). La préférence tarifaire accordée au Groenland estcomplétée par un quota tarifaire de 10 000 tonnes pour du flétan et de la crevettenordique non-originaire (peu utilisé par le Groenland), ainsi qu’un quota tarifaireadditionnel de 2 100 tonnes pour des crevettes préparées et en conserves (totalementutilisé). L’intérêt de ces préférences a été érodé par la décision de l’UE d’accorder unquota tarifaireerga omnespour la crevette congelée (actuellement 20 000 tonnes paran).15. Le principal élément de l’accord de partenariat dans le domaine de la pêche est que leGroenland autorise l’accès à des navires de l’UE pour pêcher dans sa ZEE en échanged’une contribution financière. Les possibilités de pêche sous la forme de quotasindicatifs sont définies dans le protocole d’accord. Depuis 2008, elles sont constituéesde 55 000 tonnes de capelan et 36 700 tonnes d’autres espèces dont du cabillaud, dela crevette, du flétan, de la sébaste, du flétan noir et du crabe des neiges. Le protocoleprévoit que l’UE puisse utiliser certaines possibilités de pêche négociées sous cetaccord dans ses échanges de quotas avec d’autres pays tiers, et plus précisement laNorvège, l’Islande et les Faeroe. Les navires de l’UE et ceux d’autres pays tiers nepeuvent exercer dans la ZEE que si ils détiennent une licence de pêche dont le coûtpour les armateurs de l’UE est fixé dans le protocole à 5% d’un prix de référencespécifique. Sous le protocole, l’UE s’engage à payer au Groenland un montant de85 852 464 € sur une période de six années, payable par tranche annuelle de14 307 244 €. Chaque année, le Groenland s’engage à utiliser 3 261 449 € (un peumoins en 2007) au financement de la mise en œuvre de sa politique sectorielle visant àassurer la durabilité de l’exploitation, en ciblant des objectifs qui dont définis de manièreconjointe dans le cadre de la Commission Mixte de l’accord.16. Du fait de limites sur la disponibilité des ressources, le Groenland n’a pas été enmesure d’octroyer les quotas prévus sous l’accord pour 9 espèces entre 2007 et 2010inclus. Les déficits concernent les quotas de capelan (chaque année), le flétan (à l’Estet à l’Ouest du Groenland) en 2009 et 2010, et le cabillaud en 2010. Le déficit annuelmoyen est de 35 530 tonnes, ce qui correspond à 39% des quantités annuelles. Unmécanisme de compensation qui permet au Groenland de proposer des possibilités depêche alternatives a bien fonctionné pour de petites fluctuations annuelles dans ladisponibilité des quotas, mais n’a pas pu être utilisé pour résoudre le problème de la« dette » pour de plus grandes quantités de capelan (une ressource dont l’abondanceest connue pour varier naturellement de manière importante d’une année à l’autre). En2010, les parties se sont accordées sur le fait que la dette (évaluée à 2,6 M€) pourraitêtre apurée i) par une réduction de la compensation financière de l’accord de 1,6 M€ etii) l’inscription par le Groenland de l’achat d’un navire de recherche évaluée à 1,1 M€dans la matrice des mesures sectorielles.17. Pendant la période, 37 navires de l’UE ont bénéficié des possibilités de pêche, dont 5navires de l’Allemagne, 13 de l’Espagne, 4 du Royaume Uni, 6 du Portugal, 1 duDanemark, 3 de Lituanie, et 2 du Portugal et de l’Estonie. Ces navires représentent 3%
Final Report - pageix
Fisheries Partnership Agreement FPA 2006/20
FPA 35/GRE/11
de la capacité en jauge de la flotte de l’UE. Une concession du Groenland pourautoriser des groupes de navires d’un même Etat membre d’acheter en bloc deslicences pour les redistribuer ensuite entre eux a grandement facilité la procédure dedélivrance des licences. Le taux d’utilisation des possibilités de pêche négociée a étébon, de 75% en moyenne sur la période. Si l’on inclut les quotas transférés par l’UEdans le cadre de ses échanges avec d’autres pays tiers (Norvège, Islande, Faeroe),l’utilisation globale mesurée en nombres de licences utilisés se monte à 90% dunombre disponible.18. Les quotas pour les navires de l’UE ont été distribués suivant les clés de la stabilitérelative qui ne correspond pas totalement avec la demande constatée. Un systèmed’échanges intra-communautaire de quotas entre les Etat membres est utilisé demanière satisfaisant et a contribué à maintenir le taux d’utilisation de l’accord. Pendantles deux premières années, quelques segments de flotte ont évoqué des disponibilitéstardives de quotas qui ont gêné la planification des activités, mais le système a évoluédepuis pour permettre des échanges plus tôt.19. Il existe des différences significatives dans l’utilisation suivant les quotas. Lespossibilités de pêche pour la crevette dans l’Ouest du Groenland, du flétan duGroenland et du cabillaud sont très demandées. L’introduction de mesures de gestion alimité l’utilisation globale des possibilités de pêche sur le cabillaud à 91%. Seulement45% du quota annuel de 7 000 tonnes de crevettes dans l’Est du Groenland est utiliséainsi que seulement 46% du quota de sébastes. Les possibilités de pêche pour le crabedes neiges sous l’accord n’ont jamais été utilisées par l’Espagne. Le quota de flétanatlantique alloué au Portugal est pratiquement impossible à pêcher et se révèle d’unintérêt limité pour la Norvège. Les prises accessoires sous l’accord sont minimales.20. Au total, sur une année moyenne, le protocole d’accord a permis de capturer 48 502tonnes par an, dont 16 472 tonnes sont capturées par des navires de l’UE et 32 030tonnes par des navires de pays tiers (ces moyennes excluent les années pendantlesquelles aucun capelan n’a été capturé). Les captures annuelles prélevées par lesnavires de l’UE sont estimées équivalentes à 0,3% des captures totales de l’UE. Enmoyenne, les navires de l’UE ont capturé 63% des quotas disponibles, et les navires depays tiers 88%.21. Sue la base des prix des poissons publiés en Islande, le chiffre d’affaires annuel moyenréalisé sous l’accord a été de 45,6 M€ par an, dont 31,9 M€ (70%) par les navires del’UE et 13,7 M€ (30%) par les navires de pays tiers. Depuis que les navires de l’UEobtiennent des possibilités de pêche dans le cadre d’un échange équilibré des quotadans la zone Groenland avec la Norvège, l’Islande et les Faeroe, les bénéfices del’accord pour l’UE doivent intégrer ces éléments (en faisant l’hypothèse que l’échangeéquilibré est neutre d’un point de vue coût-bénéfice). Les Etats membres qui bénéficientle plus sont l’Allemagne (42% du chiffre d’affaires sous l’accord), le Danemark (11%), laPologne (7%) et le Royaume-Uni (4%).22. Les quotas obtenus sous l’accord avec le CRL ont contribué à respectivement 89%,37% et 100% des quotas mis à disposition avec la Norvège, les Faeroe et l’Islandedans le cadre des échanges (le solde étant des quotas sur des stocks dans les eux del’UE). Au total, le Groenland contribue à 70% de ces échanges en termes d’équivalentcabillaud. L’accès de navires de l’UE à des ressources importantes en Norvège et enIslande (dans le cadre de l’Accord EEE) est par conséquent très dépendant de l’accordentre l’UE et le Groenland (bien que l’UE et l’Islande n’aient pu s’entendre sur leséchanges en 2009 et 2010). Sans ces possibilités de pêche, il est improbable que lesnavires de pêche lointaine du Royaume-Uni, de l’Espagne, du Portugal et del’Allemagne puisse continuer à travailler.23. Pour l’UE, l’accord a apporté une valeur ajoutée nette de 20,3 M€ par an pour uninvestissement annuel de 15,8 M€, suggérant un rapport coût-bénéfice de 1,3 (i.e.chaque 1 € investi rapporte 1,3 €). Le rapport est positif et est comparable avec celuiobtenu sous l’accord avec la Mauritanie (qui est aussi un accord mixte). L’accordpermet de soutenir 330 postes de travail embarqués, avec environ 500 emplois dansFinal Report - pagex
Fisheries Partnership Agreement FPA 2006/20
FPA 35/GRE/11
l’UE directement dépendants de l’activité de pêche sous l’accord avec le Groenland(mais probablement sensiblement plus en tenant compte des activités liées dans lesautres pays tiers).24. En conséquence, si l’accord a été efficace pour soutenir la pêche par des navires del’UE dans les eaux du Groenland et d’autres pays tiers, il n’a été que marginalementefficient pour atteindre cet objectif, et sa viabilité reste dépendante d’externalités. Lesystème de distribution des licences n’est pas efficace avec des limites annuellesrigides qui exigent que les navires de l’UE achètent plus de quota que nécessaire (enmoyenne, pêcher 16 472 tonnes sur un quota total de 19 783 tonnes, avec 17% duquota acheté qui reste inutilisé à la fin de l’année). Les navires de pays tiers ne sontpas pénalisés par des achats de quota en excédent.25. Globalement, en intégrant les montants en soutien à la politique sectorielle, l’UE acontribué à la hauteur élevée de 286 € par tonne de produits capturés (30% de lavaleur commerciale). De plus, la contribution de l’UE et les paiements des armateursreprésentent pratiquement 70% des recettes budgétaires générées par le secteur despêches groenlandais alors que les captures ne représentent que 12% en valeur du totaldes captures dans la ZEE. Sur le coût total de l’accès à la ressource (compensation etredevances pour licences estimés à 259 € par tonne), la contribution de l’UE représente85% et celle des armateurs 15%, ce qui est similaire à la répartition mesurée sousd’autres accords mixtes (par exemple 87% en Mauritanie) mais supérieure à larépartition sous les accords thoniers de l’UE sous lesquels la répartition recherchée estde 65/35.26. Pour le Groenland, l’accord a été efficace pour générer des recettes à partir deplusieurs pêcheries qui n’auraient pas pu être valorisée autrement. En 2011, le montantde la compensation a été ajusté à la baisse de manière à annuler une partie de la dettesur le capelan accumulée entre 2007 et 2010 (correspondant à 0,4 M€ par an). Enconséquence, l’accord a généré en moyenne 15,8 M€ par an comprenant 13,9 M€ encompensation ajustée et 1,9 M€ en redevances licences. Ces recettes représentent1,3% des recettes de l’Etat en 2010. La rente obtenue est d’environ 326 € par tonne(35% du chiffre d’affaires des navires, ce qui est haut par rapport aux standardsinternationaux).27. L’accord n’a pas été efficace sous son objectif de générer des bénéfices économiquesadditionnels pour le Groenland (comme des sociétés mixtes, de l’emploi embarqué oudes débarquements locaux à des fins de transformation). Un programme de soutien àdes mesures sectorielles d’environ 4 M€ par an a été mis en œuvre par le Ministère dela Pêche, de la Chasse et de l’Agriculture suivant l’article 4 du protocole. La contributionde l’accord représente 70% des dépenses du budget de l’Etat au bénéfice du secteurde la pêche. Environ la moitié des montants ont été investis dans la recherche. Leprogramme est estimé correspondre à des objectifs pertinents et a donné des résultatspositifs pour les mesures concernant la recherche, la formation des cadres et lecontrôle des pêcheries, contribuant ainsi à l’amélioration de la durabilité du secteur dela pêche. Cependant, les mesures concernant l’ajustement structurel de la flotte côtière,et il n’est pas toujours clair de distinguer si le soutien budgétaire a été utilisé pourl’investissement ou le fonctionnement courant.28. Il existe des inquiétudes sur la durabilité de trois des dix possibilités de pêchespécifiées dans l’accord. On dispose d’éléments clairs indiquant que les stocks decabillaud, de flétan du Groenland dans l’Est de l’île et de sébaste (poisson pélagiqueprofond) sont sujets à des niveaux de pêche excessifs non soutenables, avec l’accordqui contribue à respectivement 11%, 30% et 8% du niveau global d’exploitation pendantla période couverte par l’évaluation. Pour le cabillaud, des mesures de gestion on étéintroduites dans le cadre d’un plan de gestion du cabillaud mis en œuvre par leGroenland, mais ce plan devrait être modifié pour réussir à garantir la durabilité dans lelong terme. Pour la sébaste, un accord signé en mars 2011 par le Groenland, l’UE etd’autres pays concernant la gestion de l’espèce dans la Mer d’Irminger diminueraprogressivement les TACs et devrait aboutir à la durabilité dans le futur. Pour le flétandu Groenland (stock Est) qui est un autre stock chevauchant, il n’existe pas d’accordFinal Report - pagexi
Fisheries Partnership Agreement FPA 2006/20
FPA 35/GRE/11
entre les Etats côtiers (Groenland, Islande et Faeroe). Chaque partie fixe des TACsautonomes et les captures dépassent les recommandations scientifiques d’un facteur 5.Bien qu’il existe des inquiétudes sur la soutenabilité des niveaux d’exploitation de lacrevette dans l’Ouest du Groenland (considéré comme à risques), l’accord n’a concernéque 3% des captures, et un plan de gestion efficace a été introduit en 2010. Le risqueque l’exploitation du flétan atlantique n’ait pas été soutenable existe, mais les donnéesmanquent pour s’en assurer. Les autres quotas (crevettes dans l’Est du, flétan duGroenland dans l’Ouest, capelan et crabe des neiges) sont tous considérés commeétant sujet à une gestion durable. Toutes les pêcheries sont connues pour avoir destaux élevés de prises accessoires. Toutes les pêcheries démersales au chalut doiventêtre équipées de grilles de tri et les rejets sont interdits. Il n’y a pas d’impacts négatifsconnus sur les espèces non-ciblées ou sur les écosystèmes.29. En général, l’accord de partenariat dans le domaine de la pêche est cohérent avec lespolitiques de l’UE concernant le développement et le commerce qui ensembleapportent des bénéfices au Gouvernement du Groenland et aux parties prenantesnationale. A l’exception de l’absence de durabilité dans l’exploitation de trois stocksclés, l’accord est globalement cohérent avec la politique commune de la pêche.L’accord est potentiellement cohérent avec la politique en développement de l’UE pourla région arctique. Concernant les mesures prises par l’UE pour les produits à base dephoques, le cadre politique manque de cohérence. La surcapacité dans les pêcheriescôtières et l’absence de possibilités d’emplois alternatifs sont l’un des problèmesstructures critiques du secteur de la pêche du Groenland, qui doit être traité dans lecadre d’un programme renforcé d’ajustement structurel à introduire dans le programmedes mesures de soutien sectoriel considérés par l’accord de partenariat dans ledomaine de la pêche.30. L’étude conclut que globalement, l’accord a été très bénéficiaire pour les deux parties,et recommande par conséquent que les deux parties négocient un renouvellement duprotocole. Le futur protocole devrait avoir une durée de 3 années de manière à garantirune parfaite cohérence avec tout renouvellement de la décision relative à l’associationdes PTOM et de l’accord de partenariat avec le Groenland. Cette durée permettraégalement de prendre en considération dans un prochain accord de nouvelles mesuresprises sous une politique de la pêche réformée, en cohérence avec d’autres initiativescommunautaires incluant la politique pour l’arctique sous ses aspects maritimes etenvironnementaux.
Final Report - pagexii
Fisheries Partnership Agreement FPA 2006/20
FPA 35/GRE/11
1 INTRODUCTION1.1 BackgroundThis report provides the findings of a study comprising an ex-post evaluation of the FisheriesPartnership Agreement between the European Union and Greenland. The study wascommissioned by the Directorate General for Maritime Affairs and Fisheries of the EuropeanCommission under a framework contract “for performing evaluations, impact analyses andmonitoring services in the context of Fisheries Partnership Agreements (FPAs) concludedbetween the European Union and non-EU member states (No. FISH/2006/20)” operated by aconsortium comprising Oceanic Développement (France) and Megapesca Lda (Portugal).The Fisheries Partnership Agreement between the parties was initialled in June 2006, andentered provisionally into force on 1stJanuary 2007 for a period of six years (until 31stDecember 2012). It was adopted into EU law by Council Regulation (EC) No 753/2007 of 28June 2007. At the time of the study the Fisheries Partnership Agreement has therefore beenoperational for just over four years, and the period of evaluation covers the years 2007 to 2010inclusive.The main objective of this report is to provide the parties to the Fisheries Partnership Agreementwith an analysis to help understand the associated costs and benefits, consider the progressmade so far in meeting its objectives and suggest ways in which the Fisheries PartnershipAgreement could better serve their mutual needs, whilst meeting policy objectives forsustainable fisheries. This information will assist the parties the negotiation of any new protocolwhich they may decide to enter into.This report is broadly divided into four sections. In the first section it presents a brief descriptionof the general political and economic context of the EU – Greenland Fisheries PartnershipAgreement, which includes a detailed review of the relationship between the EU and Greenland,as well as general background of relevance, including maritime boundary issues. The secondsection describes Greenland’s fisheries resources and its sector. The third section describes theimplementation of the EU-Greenland Fisheries Partnership Agreement (FPA), and assesses itsimpacts on the EU fleet, the European Union and Greenland (including the implementation ofGreenland’s fishery sector policy supported by the Fisheries Partnership Agreement. The finalsection presents the overall conclusions and recommendations for the parties.
1.2 MethodologyThe methodology adopted by the consultants included the following activities:••••Review of documentation provided by the Commission (catch data, quota swaps, AgreedRecords and legal basis for the Fisheries Partnership Agreement).Literature review regarding Development Policy, Maritime Policy and the Arctic DimensionReview of work programmes of the working groups of the Arctic Council, and analysis ofGreenland obligations in this respectMeetings and phone discussions with EU fishery sector stakeholders and EU Member Statefishery administrations (in Estonia and Denmark, UK, Germany, Poland, Spain andPortugal)Field mission to Greenland and consultation with Greenland stakeholders (fisheriesadministration, fisheries control, fisheries and environmental research, fishing andprocessing industry interests, NGOs);Collection and review of data on implementation of sectoral policy measures implementedunder the FPA;
•
•
Final Report - page1
Fisheries Partnership Agreement FPA 2006/20
FPA 35/GRE/11
•
Contact with Norwegian and Faroese stakeholders regarding utilisation of fishingopportunities and implementation of the access arrangements for opportunities received asa result of the EU-Greenland Fisheries Partnership AgreementMeetings and discussions with European Commission Services, including DG MaritimeAffairs and Fisheries, DG DevelopmentAnalysis of licence and catch data relating to EU, Norwegian, Icelandic and Faroe Islandfishing vessels, and calculation of values of catches made.Assessment of impacts on Greenlandic and EU fishing sectors, and economies
•••
The methodology has drawn on relevant elements of the “Specific Methodological Guidelines forEvaluation of Fisheries Partnership Agreements” prepared by the Consultants in February 2008,and reflects the approaches set out in “EvaluationStandards and Good Practice (C/2002/5267,23.12.2002)”and “EvaluatingEU activities: A practical guide for Commission services (July2004)”.The findings are considered in the context of the objectives of the Fisheries PartnershipAgreements as set out in COM(2002) 637 Final, “Communication from the Commission on anIntegrated Framework for Fisheries Partnership Agreements with Third Countries”.
2 POLITICAL AND ECONOMIC CONTEXT2.1Political situationGreenland became a Danish colony in 1814 and became a part of the Kingdom of Denmark in1953, with the passage of the new Danish constitution. In 1979 Denmark granted “Home Rule”to Greenland, which provided for autonomy over most policy areas, with the exception of foreignpolicy, defence and a number of other functions which were performed by Denmark, as thesovereign state. The devolution established a Home Rule Government with an electedparliament of thirty-one members. The head of government is the Prime Minister. As part of therealm of the Kingdom of Denmark, Greenlanders also elect two representatives who sit in theParliament of Denmark.A Joint Greenlandic-Danish Commission considered devolution of powers during the period2004 to 2008, and proposed a new Law on Greenland Self-Governance1in May 2008.Following a referendum on 25 November 2008 the new law took effect on 21 June 2009. Thisprovides for Greenland to have the option of taking over responsibility for 32 functions currentlyperformed by Denmark, including police, justice and border control. Under the Law, Denmarkretains functions of defence, fishery inspection outside the territorial waters, constitutionalaffairs, currency and monetary policy. The first areas (administration of mineral resources andimmigration) were taken over in 2010. Danish Ministry of finance has estimate that the cost ofthese functions is more than EUR 40million/year. In the meanwhile, Denmark has undertaken tocontinue supporting the Greenland budget with an annual block grant of EUR 469 million in2010.Also with the passing of the new Law on Greenland Self Government on 21 June 2009, the title“Greenland Home Rule Government (GHRG/Groenlands Landsstyre) was amended to becomethe Naalakkersuisit (Government of Greenland).In the meanwhile following a General Election in June 2009, the centre-left Inuit Ataqadigiit (IA)party won the election and formed a coalition. The current Naalakkersuisut therefore consists of
Lov Nr. 473 af 12. Juni 2009 om Gronlands Selvstyre (Act No 473 of 12 June 2009 onGreenland Self Government. Lovtidende 13.06.2009)
1
Final Report - page2
Fisheries Partnership Agreement FPA 2006/20
FPA 35/GRE/11
nine Members. Six are the from Inuit Ataqatigiit party, two from the Democrats, and one fromKattusseqatigiit Partiaat. The Coalition Agreement 2007-2013 was signed on 10 June 2009.Under the theme of Fisheries and Hunting the Coalition Agreement of 10 June 2009 indicatedthat, “a politically independent organ will be established for the allocation of fish and shellfishquota”. Until now this has not been established. One notable aspect is that the FPA is notmentioned in the Coalition Agreement, although it is stated that Greenland will continue tocooperate with the EU in the context of the Partnership Agreement and Greenland’s OCTstatus.
2.2
Economic situation
The population of Greenland is 56,452 (20102). This includes around 6,300 resident Danes. Thepopulation is stable. The labour force in 2010 was 28,510, with an unemployment rate of 7.1%.Greenland’s has low inflation (1.4% in 2009) but suffers from a high structural unemploymentrate, along with an aging population. Its Gross National Income was EUR 29,286/capita in 2006.However, GDP has not risen in real terms in recent years.The Government is the largest employer, accounting for 44% of all jobs. There are 18communes, the largest concentration of the population being in the South and Western region ofGreenland. All transport between settlements is by air or sea. This all leads to high transportcosts and an inflexible and immobile labour market. The system of production is characterisedby significant public intervention, with an underdeveloped private sector and reliance ontransfers from Denmark.The country relies heavily on the annual block grant provided by Denmark, accounting for anestimated 32% of GDP. Substantive difficulties facing the country include a) high dependencyon fisheries b) direct and indirect subsidies to government owned enterprises c) high wagelevels d) ageing population d) lack of skilled manpower e) marginalisation of the indigenouspopulation f) slow private sector development. Significant opportunities for economicdevelopment are emerging, with oil and minerals, transport services (in relation to a potentialfuture opening of the north west passage to the Pacific), aluminium smelting and energy. Thecountry faces significant challenges in managing environmental and social impacts of economicdevelopment.
2.3
Fishery sector
Greenland is the World’s largest island; the northernmost point lies just 740 km from the NorthPole. From north to south, Greenland extends 2,670 kilometres. The marine EEZ is 2,184,254km2and can be divided into two zones: East Greenland and West Greenland. Only about 15%of Greenland’s land area is free of ice; the rest is covered by the world’s second largest ice cap.The coastline is approximately 40,000 km long and has a countless number of large and smallislands and fjords. It is principally a cliff coast with numerous rocky outcrops, islands, and anetwork of deep fjords. The seabed has a complex topography.The domestic fishery sector is the economy’s most significant earner accounting for 13% ofdirect Gross Value Added and 17% (4,454) of employment (including processing and other up-and downstream services). However, this sector has witnessed a reduction in trade prices for itsmain export industry (frozen shrimp) as well as decline in other exports such as snow crab. Thecod fishery, a major resource up to the early 1980s, has failed to recover to its full capacity.The financial crisis in Europe, Greenland’s main market, has further impacted negatively ondemand and prices, although these have recovered in the second part of 2010 and 2011. Fleetand processing plant rationalisation has led to some improvements productivity within thedomestic fishery sector. This includes investment by the largest company (Royal Greenland,which is wholly owned by the Government of Greenland) in processing facilities within the EU
2
Greenland in Figures, 2010, Statistics Greenland, Greenland Home Rule GovernmentFinal Report - page3
Fisheries Partnership Agreement FPA 2006/20
FPA 35/GRE/11
(in Denmark, Poland and Germany). Whilst there are clear signs that the offshore shrimp fisheryis in good financial condition, the profitability of the inshore fleet and onshore processing inGreenland remains low, with a number of structural disadvantages (low efficiency, remoteness,too many vessels for profitable and sustainable exploitation, and a lack of alternativeemployment possibilities).A more detailed description of Greenland’s fisheries sector is provided in Section 3 and 4.
2.4
Other sectors
Other economic sectors such as minerals and tourism presently remain only marginalcontributors to incomes and employment, although there are significant hopes attached topotential future investment in extractive industries and a hydro-electric scheme and aluminiumsmelting operation. To this end in May 2007, the Greenland Home Rule Cabinet entered into aMemorandum of Understanding with Alcoa to cooperate on a feasibility study for constructing analuminium smelter with a 340,000 metric-ton-per-year capacity in Greenland. A feasibility studyis presently being considered by the Government.Another sector which offers potential for substantial development is the offshore oil industry.The US Geological Survey estimates that the seabed between Greenland and Canada holds atotal of 17 billion barrels of oil. There may be further riches off the Eastern coast. In June 2010Cairn Energy, a British petrochemicals company announced a significant find within the EEZ, inBaffin Bay in W.Greenland. The Government Bureau of Minerals and Petroleum is aiming todevelop offshore oil wells3and in December 2010 signed seven new licences for explorationand exploitation for gas and oil in Baffin Bay. Figure 1 shows the current concessions. TheDanish Navy has since clashed with environmental campaigners who oppose the development.
3
Source: the Economist 26thAugust 2010Final Report - page4
Fisheries Partnership Agreement FPA 2006/20
FPA 35/GRE/11
Source: Bureau of Minerals and Petroleum, Government of Greenland
Figure 1: Oil and gas exploration concessions in Greenland
2.5
International trade
In 2009, Greenland’s exports were DKK 1,923 million (EUR 258.2 million) and imports wereDKK 3,669 million (EUR 492.4 million). A breakdown of the exports is shown in Table 1, whichdemonstrates the importance of fishery products to the overall picture, accounting for about88% of all tangible exports in 2009. About 87% of the exports are to Denmark, reflecting thetransportation linkages. About 4% are to Canada.
Final Report - page5
Fisheries Partnership Agreement FPA 2006/20
FPA 35/GRE/11
Table 1:Greenland Exports2007tonnesAll fishery productsPrawnsCodGreenland HalibutScallopsCrabLumpsucker eggsOther fishOther fish productsSeal, whale, sharkSheepOther livestockPrecious metal (gold)Pebbles, gravel and crushed stoneOthersTOTAL125,86969,0047,95520,3513531,16296225,494588148730150,6370537,822814,459EURO(million)*2008tonnesEURO(million)*2009tonnesEURO(million)227.00140.1317.4553.421.076.042.955.370.400.540.000.0010.074.7016.11258.26
255.44 117,819151.8124.1659.333.624.973.367.920.270.670.130.9471,32113,26322,4501491,3207767,78076020913
281.00 104,902168.3737.1361.131.215.503.623.890.540.800.130.2720.2464,2568,99820,8311211,3807767,7807601521850,393
31.14 122,6730 343,23324.563,860
9.92 160,43619.71269
313,02 587,627
332.44 316,035
*Provisional FiguresSource: Greenland in Figures 2010, Statistics Greenland
2.6
Maritime boundaries2.6.1 Canada - Greenland
Canada and Greenland signed a Treaty in December 1973, which delimits the continental Shelfbetween them in the Baffin Bay. It came into force in March 1974 and was amended in March1994. It defines a boundary of length about 1,450 nautical miles, but left mute the issue of HansIsland, a small, uninhabited barren knoll (1.3 km2) located in the centre of Nares Strait whichseparates Ellesmere Island from northern Greenland and which straddles the equidistant pointbetween the countries. Both countries claim Hans Island and engage in periodic demonstrationsof claim. In 2006 the Canadian Minister of defence visited and erected a Canadian flag,prompting Denmark to send a warship to plant a Danish flag on the Island.The Canada Greenland Treaty of 1973 also did not address delimitation of the EEZ andExtended Continental Shelf north of the end point. On 1 June 1980, Denmark establishedstraight baselines around the coast of Greenland and declared limits of its EEZ in accordancewith the UN Convention on the Law of the Sea, including its maritime boundary with Canada inBaffin Bay and the straits between Ellesmere Island and Greenland, based on a line equidistantfrom the baselines of each. Apart from disputing Greenland’s claimed sovereignty over Hans
Final Report - page6
Fisheries Partnership Agreement FPA 2006/20
FPA 35/GRE/11
Island, Canada also has disputed the methodology by which Denmark set the baselines (inparticular to the use of straight baselines. This provides Denmark with two additional areas ofmaritime zone. Canada formally objected to the Danish promulgation of straight baselines in theArctic on 3 September 1980. The two sides met in March 1982 with neither side moving fromtheir respective positions.
Figure 2: Greenland- Canada maritime boundary disputes in the Nares Strait and LincolnSea4
2.6.2 Maritime boundaries in the ArcticNo country or group of countries currently has sovereignty over the North Pole or significantareas of the Arctic Ocean around it. There is no specific treaty regime for the Arctic, but the1982 UNCLOS is not excluded from application to the Arctic and it may therefore provide arelevant international legal framework for the management of maritime boundary claims. Theshrinkage of the polar ice cap may provide access to previously unexploitable fishery andseabed resources and along with the threats posed by climate change there is now a renewedstrategic interest in the Arctic region, which is giving rise to new claims regarding maritimeboundaries.There are several maritime borders where Arctic coastal states have not agreed upon thedelimitation of Exclusive Economic Zones. Five bilateral delimitations have been negotiated but
David H.Gray, Canada’s Unresolved Maritime Boundries, IBRU Boundary and SecurityBulletin, Autumn 1997.www.dur.ac.uk/resources/ibru/publications/full/bsb5-3_gray.pdfFinal Report - page7
4
Fisheries Partnership Agreement FPA 2006/20
FPA 35/GRE/11
there are a number of unresolved issues. Submissions to the UN Commission on the Limits ofthe Continental Shelf may result in overlapping claims. The issues are:•Russia versus Norway in the Barents Sea, US versus Russia in the Bering Strait and USversus Canada in the Beaufort Sea. Canada and Denmark (on behalf of Greenland) have adispute over Hans Island (as noted above). In addition, Norway and several countries,including EU Member States, interpret the applicability of the Svalbard Treaty in the 200 nmarea around this archipelago differently.In 2001 Russia submitted a claim for a large portion of the Arctic, including the North Pole.Norway has also submitted a claim; Denmark and Canada intend to establish claims.Moreover, there are different interpretations of the conditions for passage of ships in someArctic waters. The dispute involves both the delimitation of Canada’s internal waters wherethey can fully regulate trespassing, and the right of Canada to adopt and enforce laws toprevent pollution from vessels in ice-covered waters.
••
UNCLOS provides a potential frame in international law for the settlement of these disputesincluding delimitation and rules for the use of living and non-living resources, and the protectionof the environment. However, the US is not a party at present since it has not ratified theconvention. Its ten year deadline for submission of claims will not commence until ratification,and this will potentially delay the submission of claims until after 2019 at the very earliest, butmost probably later. Canada has until 2013 to submit claims, and Denmark until 2014. There isa lack of detailed mapping data, since the region is still largely covered with ice and survey workis ongoing.
2.7 Membership of the Arctic CouncilGreenland is a member of the Arctic Council (with Faroe Islands, under the umbrella of theKingdom of Denmark) and this plays an important part in Greenland’s environmentalconsiderations. The programme of the Arctic Council has had a clear focus on the Peoples ofthe Arctic and Greenland has a substantial programme of activities to implement within theframe of the six working groups of the Arctic Council (see Table 2).In addition Greenland has taken on the chairmanship of the Sustainable Development WorkingGroup (SDWG), which is in line with the country’s specific interests in promoting the livelihoodsof Arctic Peoples and sustainable economic development.Greenland has only limited financial and staff resources to apply to these commitments andwhilst Arctic Council member states undertake obligations to participate in Arctic Councilactivities, there is no associated additional funding, therefore Greenland is required to providethese resources from its own national budget. With regard to the funding of the activities of theSDWG, Denmark has provided a grant of EUR 134,228 and Greenland is in the process ofidentifying other possible sources of funds to come up to a comparable amount, however onlyEUR 40,268 has been identified so far5. There is no specific funding allocated to meet thecommitments under the other working groups and up until now there appears to a lack ofbudgetary allocation to enable Greenlandic institutions to meet there commitments
5
Source: personal communication; Kai H. Andersen – Greenland Dept. of Foreign Affairs
Final Report - page8
Fisheries Partnership Agreement FPA 2006/20
FPA 35/GRE/11
Table 2: Summary of Greenland responsibilities to Arctic Council Working GroupsWorking groupArctic Contaminants ActionProgram (ACAP)Greenland responsibilities 2009-2011Possible study in relation to the proposed Alcoa investment inaluminium smelting.Participation in a study of contaminants such as PCBs and dioxinsand the impact on human health through the food chain.Arctic Monitoring andAssessment ProgrammeWorking Group AMAPEmergency Prevention,Preparedness andResponse Working GroupEPPRProtection of the ArcticMarine EnvironmentWorking Group (PAME)Conservation of ArcticFlora and Fauna (CAFF)Presentation of a report on the Greenland Ice Sheet.Ongoing monitoring programme regarding trends in environmentalparameters, human health and biological effects andcontaminants (Sustaining Arctic Observer Networks).Limited specific responsibilities.
Information outreach, exchange, and in particular building of newcapacity for engagement of indigenous communities.Contribution to the 2010 Biodiversity Highlights Report to ArcticBiodiversity Assessment Scientific Report (due 2013).Joint lead for the Report on Birds of Arctic Conservation Concern(2009-2011).Lead in the Arctic Tern project (2009-2011). Contribution to launchof expert groups concerned with biodiversity of the main Arcticbiomass, including marine and coastal fauna.
Sustainable DevelopmentWorking Group (SDWG)
Chair and lead in programmes for participation in circumpolarsurveillance, prevention and control of infectious diseases, Arctichuman health initiative and advancing alcohol and drug abusetreatment.To Initiate and lead research and action plan for human health riskreduction in the Arctic.To Identify, plan and implement follow up activities andnewprojects and activities that relate to the ecosystem approach andimplementation of integrated management concepts,adaptation toclimate change, Arctic energy and Arctic social indicators.
Source: Reports of the Senior Arctic Officers to the meeting of the Ministers of Arctic Council Members,Tromso, April 2009.
2.82.8.1
EU policies with respect to GreenlandBackground of EU Greenland relations
In 1953 Greenland ceased to be a Danish colony and became an integral part of Denmark.Denmark joined the then European Community in 1973. Autonomous Home Rule (except forforeign relations, defence, justice affairs, mineral resources) was introduced in Greenland in1979. Greenland subsequently seceded from the European Union in 1985. A FisheriesAgreement between Greenland and the EU was established as an integral part of Greenland’snegotiations for withdrawal from the Community. The result was that the EU’s traditional fishingrights were sustained and in return Greenland received financial compensation.Greenland’s status as an Overseas Countries and Territory (OCT) is guaranteed by theGreenland Treaty negotiated on secession from the EU. This confers the benefit of tariff andquota free access for a majority of its products, including its fishery products exported to theFinal Report - page9
Fisheries Partnership Agreement FPA 2006/20
FPA 35/GRE/11
EU6. The political agreement between the parties was that the EU be granted satisfactorypossibilities for access to Greenland fisheries resources under a fisheries agreement withGreenland. At the time of secession, it was agreed that Greenland should continue to receivethe same level of financial assistance as that received when it was part of the EU, and thatthese funds should be made available to Greenland by way of the bilateral FisheriesAgreement. Greenland’s trade relationship with the EU is therefore governed by the OverseasAssociation Decision (2001/822/EC)7which sets outinter aliathe terms of trade between theparties. The Overseas Association Decision has been extended and expires at the end of 2013.Until 31 December 2006, all EU financial assistance to Greenland (EUR 42.8 Million per year)was channelled through the Fisheries Agreement between the EU and Greenland. However in2001, the EU’s Court of Auditors was critical of the policy, stating that8:“severalof the fisheries agreements are intended both to play a commercial role and to assist indevelopment aims. This intertwining of different purposes means that it is difficult to evaluate theagreements and makes it even harder to distinguish between the responsibilities that lie with theCommunity and those which belong to the third countries.”As a result, the EU introduced a new approach to its fisheries access agreements withdeveloping countries. This resulted in the signature of a Fisheries Partnership Agreement withGreenland (from 1 January 2007). However, under this approach, the Fisheries PartnershipAgreement was to focus on fisheries only. As a result an alternative instrument was required tofacilitate Greenland’s development.Furthermore in 2002, recognising the uniqueness of the Greenland situation, the Commissionhad published a communication in which it addressed the desirability of a free-standingpartnership agreement with Greenland going beyond its OCT status. In addition, the Council ofthe European Union in its conclusions of 24 February 2003 on the Mid-term Review of theFourth Fisheries protocol between the European Union, the Government of Denmark and theHome Rule Government of Greenland, agreed that there was a need to broaden and strengthenfuture relations between the EU and Greenland taking into account the importance of fisheriesand the structural development problems in Greenland.As a result, negotiations led ultimately to a separate political agreement which stressed theclose historical links between the EU and Greenland and the need to strengthen and updatethem within a long-term perspective, taking into account Greenland’s status as an OCT, whileensuring that Greenland continued to receive the same level of funds as in previous years.From 1stJanuary 2007 the EU and Greenland therefore entered into a Partnership Agreementfor the sustainable development of Greenland.
2.8.2
The EU-Greenland Partnership Agreement
The Partnership Agreement between the parties was ratified in June 2006 and entered intoforce January 1, 2007. The Agreement was ratified by the European Council by CouncilDecision 2006/526/EC of 17 July 2006 on relations between the European Community on theone hand, and Greenland and the Kingdom of Denmark on the other. The Agreement will expireat the end of 2013.Without prejudice to the Overseas Association Decision, the Partnership Agreement betweenthe EU and Greenland aims to broaden and strengthen the relationship between the EU andGreenland, and to contribute to the sustainable development of Greenland. However, the
67
Since supplemented by tariff quotas for non-originating fishery products
Council Decision 2001/822/EC of 27 November 2001 on the association of the overseascountries and territories with the European CommunitySpecial report N� 3/2001 by the Court of Auditors concerning the Commission's managementof the international fisheries agreementsFinal Report - page108
Fisheries Partnership Agreement FPA 2006/20
FPA 35/GRE/11
Partnership Agreement remains explicitly linked to the existence of the access arrangements forEU vessels within the framework of the Fisheries Partnership Agreement.The objectives of the partnership are: (a) to provide a framework for dialogue; (b) to achievecommon goals by consulting on issues of common interest to ensure that the cooperation effortshave maximum effect in accordance with the priorities of both partners; (c) to provide a basis foreconomic, financial, scientific, educational and cultural cooperation founded on the principles ofmutual responsibility and mutual support; (d) to contribute to the development of Greenland.The Agreement provides for the EU to grant development assistance to Greenland in the formof budgetary support. Cooperation shall support sector policies and strategies that facilitateaccess to productive activities and resources, in particular: (a) education and training; (b)mineral resources; (c) energy; (d) tourism and culture; (e) research; (f) food safety.Greenland and the EU in this respect developed a “Programming Document for the SustainableDevelopment of Greenland” (PDSD) setting up overall and specific objectives and indicators toreach within the period 2007-2013, and defining a budgetary support programme valued at EUR25 million/year. One of the eligibility criteria for EU sector budget support was theimplementation of the Greenland Education Programme (GEP). This was formulated followingGreenland's Structural Reform action Plan 2000-2015 and consequent education and labourmarket analysis in 2004. The GEP was adopted by the Home Rule Parliament in March 2006,and comprises two phases, Phase 1 running until 2012 and Phase 2 until 2020. In its first phase(2006-2012) the GEP focuses on lower secondary school leavers who drop out of theeducational system after graduation and on unskilled workers under 50 who are unemployed, inthreatened trades and/or breadwinners for a family. In the second phase (2013-2020) the focuswill be on higher education. Expenditure on GEP was EUR 9.0 million in 2006, EUR 26.4 millionin 2007 and EUR 38,8 million in 2008 and was estimated to be EUR 51,5 million in 2009.The (annual) Financing Agreements state a number of reporting obligations, wherebyGreenland is committed to submit annual work plans to the EU on activities under the GEPplanned during the year, and to set annual targets on a number of indicators agreed betweenGreenland and the EU. Greenland is committed to submit annual implementation reports to theEU setting out the results obtained compared to the targets set in the annual work plan and theobjectives set in the education sector strategy.In Greenland, since November 2008, the secretariat responsible for the implementation of thePartnership Agreement is placed in the Ministry of Culture, Education, Research and the Church(MoCERC). The Ministry of Finance and Foreign Affairs (MoFFA), Ministry of Industry andLabour Market (MoILM), Ministry of Health and Family Affairs (MoHFA) also participate in theimplementation of the programme. There are two Steering Committees related to the EducationProgramme. Both of them have representation from the Ministry/Agency of Fisheries, Huntingand Agriculture.In 2009, the Cooperation Strategy was subject to a mid-term review by consultants9. This foundthat in general the implementation of the strategy had satisfactory levels of efficiency,effectiveness and sustainability. It found that the EU support contributed some 17% of theeducation budget. Although educational objectives were clearly defined, the study found thatthat there were no up-stream policy research nor down-stream data models available tocontinuously monitor that this targets were actually being achieved. The review recommendedthat whilst the decisions to support the education programme was still valid, it is important toconsider extending the areas of cooperation to include environment, climate change andindigenous peoples, thus establishing clearer links to the Communication to the EuropeanParliament and the Council on The European Union and the Arctic Region, with associatedreprogramming and/or additional financial resources to be considered by the parties.
Mid-term review assessment of the EU Greenland Cooperation Strategy and its Programming,Final Report, Project No. 2009/219559 - Version 1, HTSPE Limited, 2009Final Report - page11
9
Fisheries Partnership Agreement FPA 2006/20
FPA 35/GRE/11
2.8.3
EU Greenland Fisheries Relations
Since Greenland’s secession from the EU until the end of 2006 the fisheries relations betweenthe EU and Greenland were governed by a Fisheries Agreement that entered into force at thesame time as the Greenland Treaty, on 1st February 1985. Since that date there were fourProtocols to the previous agreement. The first three protocols had financial compensation levelsset at EUR 26.5 million, EUR 34.25 million and EUR 37.7 million per year respectively. Thefourth Protocol covered the period 1st January 2001 to 31st December 2006 with a financialcompensation of EUR 42.82 million per year. However, during this period, in 2003, the review ofthe agreement was necessary in order to ensure consistency between all the FisheriesPartnership Agreements which included financial contributions to third countries and to respondto strong criticisms issued in the Court of Auditors Special Report of 200110. This highlighted thelack of real justification of the financial value paid by the EU, since most of the fishingopportunities were non-existent, not available or not utilised by the EU. As a result, on 24February 2003, the EU Council adopted a modified 4thProtocol11which covered the period from1 January 2004 – 31 December 2006.The Fisheries Agreement was replaced by the Fisheries Partnership Agreement, which wasinitialled in June 2006, and entered provisionally into force on 1 January 2007. The first Protocolentered into force on the same date for a period of six years (1stJanuary 2007 – 31stDecember2012). The Council Regulation adopting the Fisheries Partnership Agreement was finallyadopted in June 200712, after long debates with Member States regarding the mechanism forreallocation of unutilised opportunities. The protocol foresees fishing opportunities for cod,redfish, Greenland halibut, Atlantic halibut, shrimp, capelin and snow-crab. A more detaileddescription of the Fisheries Partnership Agreement is provided in Section 6.
2.8.4
The European Union and the Arctic Region
EU interests in the ArcticTheEuropeanUnionislinkedtotheArcticregion(seehttp://ec.europa.eu/maritimeaffairs/arctic_overview_en.html)by a combination of history,geography, economy and social features. Three Member States — Denmark (through itssovereignty over Greenland), Finland and Sweden — have territories in the Arctic (althoughnone of the current EU Member States are coastal States with respect to the Arctic marinearea). Two other Arctic states — Iceland and Norway — are members of the EuropeanEconomic Area. Several countries are strategic partners of the EU (Canada, Russia and theUnited States). Beyond areas of national jurisdiction, the Arctic Ocean contains parts pertainingto the high seas and the seabed managed by the International Seabed Authority, which are ofstrategic interest to the EU in relation to access to natural resources and maritime transport.Furthermore, in view of the role of climate change as a "threats multiplier", the Commission andthe High Representative for the Common Foreign and Security Policy have pointed out thatenvironmental changes are altering the geo-strategic dynamics of the Arctic with potentialconsequences for international stability and European security interests, thus calling for thedevelopment of an EU Arctic policy.
Communication from the Commission on the Arctic Region
The Court of Auditors also made a number of additional observations, including that the costsof each agreement should be more balanced between the Community and ship owners. TheEuropean Parliament also criticised the agreement for similar reasons (European Parliament,2003).11Council Regulation (EC) No 1245/2004 of 28.06.2004 (OJ L 237 of 08.07.2004)12Council Regulation (EC) No 753/2007 of 28 June 2007 on the conclusion of the FisheriesPartnership Agreement between the European Community on the one hand, and theGovernment of Denmark and the Home Rule Government of Greenland, on the other hand
10
Final Report - page12
Fisheries Partnership Agreement FPA 2006/20
FPA 35/GRE/11
The EU Communication (COM(2008) 763 final) “The European Union and the Arctic Region”was adopted in November 2008 and sets out EU interests in the Arctic, and proposes action forEU Member States and institutions around three main policy objectives:•••Protecting and preserving the Arctic in unison with its populationPromoting sustainable use of resourcesContributing to enhanced Arctic governance through implementation of relevantagreements, frameworks and arrangements, and their further development
This Communication builds on the Blue Book and Action on EU Maritime Policy. The followingissues expressed in the Communication are of particular interest, and reflect concerns related tothe EU’s maritime and fisheries policy:a) Considering the region’s sensitivity to pollution and climate change, there is a clear need tofocus policy on the Arctic environmental challenges, climate change mitigation, disasterresponse, strategic environmental assessments considered of particular importance,ascertain environmental impacts before any decisions, monitoring of pollutants andchemicals, and noise effects on marine mammals.b) Hunting of marine mammals is recognised as crucial for subsistence of Arctic populations(indigenous people), but animal welfare should also be taken into account. The EU commitsto continue efforts to ensure effective protection of whales through the International WhalingCommission (IWC) including in the Arctic context. The EU has since implementedrestrictions on the placing seal products on the EU market (along with their import, transitand export)13 except for those products from hunting “traditionally conducted by Inuit andother indigenous communities and (which) contribute to their subsistence”. The Regulationprovides a derogation for personal use and by-products from hunting regulated by nationallaw, and conducted for the sole purpose of the sustainable management of marineresources.c) On research, monitoring and assessments, it is stated that the European Union shouldmaintain the Arctic as a priority area for research. A number of initiatives and institutions arenamed as providing the institutional framework for future support for research andmonitoring activities. These include enhanced EU participation in initiatives supported bythe Arctic Council (in which the EU is seeking permanent observer status), and EUsupported research under the FP7 programme.d) The Arctic contains large untapped hydrocarbon reserves, some of which appear to belocated outside the current Exclusive Economic Zone of Arctic states. Arctic resourcescould contribute to enhancing the EU’s security of supply concerning energy and rawmaterials in general, as well as contributing to economic development of the region. Supportfor the exploitation of Arctic hydrocarbon resources should be provided in full respect ofstrict environmental standards taking into account the particular vulnerability of the Arctic(further research and development in offshore technology and infrastructures is a statedobjective). Cooperation with Norway and Russia are emphasized.e) On fisheries, the Communication points out that climate change may bring increasedproductivity in some fish stocks and changes in spatial distributions of others. New areasmay become attractive for fishing with increased access due to reduced sea ice coverage.Some of the Arctic high seas waters fall outside the mandate of the current internationalconservation and management regimes. The EU considers that a regulatory framework forthe part of the Arctic high seas not yet covered by an international conservation andmanagement regime should be put in place before new fishing opportunities, preferably byextending the mandate of NEAFC.
13
Regulation (EC) No 1007/2009 of the European Parliament and of the Council of 16September 2009 on trade in seal products, which came into force in August 2010.Final Report - page13
Fisheries Partnership Agreement FPA 2006/20
FPA 35/GRE/11
f)
On transport, the melting of sea ice is progressively opening opportunities to navigate onroutes through Arctic waters14. This could considerably shorten trips from Europe to thePacific, save energy, reduce emissions, promote trade and diminish pressure on the maintrans-continental navigation channels. However serious obstacles remain, including drift ice,lack of infrastructure, environmental risks and uncertainties about future trade patterns, aswell as legal concerns15. Hence, the development of Arctic commercial navigation willrequire increased international cooperation. One example is the EU’s participation in theongoing work on a new mandatory "Polar Code" for shipping, currently being developed inthe framework of the International Maritime Organisation.
Response of Greenland to the CommunicationIn October 2009 the Government of Greenland issued a formal response to the Commission’sCommunication on the Artic16, broadly welcoming the greater interest of the EU for the Arcticregion, although commenting that specific references to the principles of self-determination ofpeoples, human rights and fundamental freedoms would be welcomed. Any EU presence in theregion should be with the prior consent and acceptance of the Arctic nations and peoples.Greenland supports the EU’s application for permanent observer status in the Arctic Council.Government also notes the potential for new transport routes and access to potentialhydrocarbon developments, but would like so see improved Arctic maritime surveillance andrecognition of the potential for renewable energy resources (including hydroelectricity).In view of the EU’s commitment to "engage Arctic indigenous peoples in a regular dialogue". theEuropean Commission subsequently hosted an 'Arctic Dialogue' Workshop in March 2010, heldin Brussels, attended by representatives of Arctic peoples, including a strong representationfrom Greenland.Adoption of an EU Arctic PolicySubsequently the European Council considered EU Arctic policy17and passed a resolutionadopting the Commissions recommended objectives and setting out the strategic approach, tobe based on:•Effective implementation by the international community of adequate measures tomitigate climate change that are required to preserve the unique characteristics of theArctic region;
In summer 2009 two German owned cargo vessels, the MV Beluga Fraternity and the MVBeluga Foresight undertook a successful navigation of the Northern Sea Route (from Atlantic toPacific Oceans via the north coast of Russia). In 2010 the route was navigated by two Russianoil-tankers, a gas tanker, a Norwegian bulk-carrier, two sail vessels, a ferry and a general cargovessel (which sailed the route without icebreaker assistance).In 2010 DG MARE supported a study “Legal aspects of Arctic Shipping” which considered theimplementation of the UN Convention on Law of the Sea and various IMO instruments, as wellas national legal measures, on navigation in the Arctic region. It concludes that the framework isnot sufficiently tailored to the special nature and risks of marine shipping in the Arctic, and thatthere is disagreement on a number of substantive issues of interpretation of the internationallaw of the sea, which could impact on Arctic navigation.16Note to the European Commission from Greenland representative in Brussels” Main areas ofconcern in the Commission Communication on “EU and the Arctic” 8th October 2009: seehttp://eu.nanoq.gl/Emner/EuGl/Seminar%202009.aspx1715
14
“Conclusions on Arctic Issues of 8 December 2009”, 2985th Foreign Affairs Council meetingBrussels, 8 December 2009http://ec.europa.eu/maritimeaffairs/pdf/arctic_council_conclusions_09_en.pdf
Final Report - page14
Fisheries Partnership Agreement FPA 2006/20
FPA 35/GRE/11
•••
•
Reinforced multilateral governance through strengthening and consistentimplementation of relevant international, regional and bilateral agreements, frameworksand arrangements;The United Nations Convention on the Law of the Sea (UNCLOS) and other relevantinternational instruments;Formulating and implementing EU actions and policies that impact on the Arctic withrespect for its unique characteristics, in particular the sensitivities of ecosystems andtheir biodiversity as well as the needs and rights of Arctic residents, including theindigenous peoples;Maintaining the Arctic as an area of peace and stability and highlighting the need forresponsible, sustainable and cautious action in view of new possibilities for transport,natural resource extraction and other entrepreneurial activities linked to melting sea iceand other climate change effects.
Of particular relevance to fisheries, the Council resolution sets out the approach to theharvesting of the Arctic marine living resources, indicating that these resources should bemanaged on the basis of scientific advice within the ecosystem approach. It emphasises theneed to promote a precautionary approach to new fishing activity in Arctic high seas, as well asmeasures for protecting marine biodiversity in areas beyond national jurisdiction. The Councilexpressed readiness to put in place a regulatory framework for the part of the seas not yetcovered by an international conservation system by extending the mandate of relevant RegionalFisheries Management Organisations. Until such a framework is in place, the Council favours atemporary ban on new fisheries in those waters.The Council requested the Commission to present a report on progress made in theimplementation of the Arctic policy by the end of June 2011.
3 GREENLAND’S FISHERY SECTOR3.1 Fishing FleetThe Greenland fishing fleet comprised some 757 registered vessels in 2007 (according toStatistics Greenland18). Trends are shown in Table 3. Most vessels are small (only 118 vesselsare above 20GT. These are widely distributed throughout West Greenland (few smaller vesselsoperate on the more exposed east coast where harbour facilities are limited). The industrialfleet (over 121 GT) comprises 47 vessels, registered in Nuuk, but operating in all the EEZ and indistant waters. The fleet broadly divides into the industrial vessels which can only operateoutside the 3 mile limit (all freezer trawlers, mostly targeting shrimp, Greenland halibut and cod),smaller demersal trawls (mostly targeting Greenland halibut, but also cod and other species).Some of these vessels, which can operate within 3 mile limits, are freezer vessels, but most areopen vessels landing fresh fish on ice. The remaining vessels are small coastal vessels,supplemented by an estimated 3,000 to 5,000 dinghies and dog sleighs which are used forfishing and hunting at different times of year.Vessels are privately owned (except for those vessels owned by the state-owned RoyalGreenland). A large proportion of the coastal fleet was financed through structural funds. Theoffshore fleet was financed through banks and foreign capital but with guarantees provided bythe State Bank.
18
Seehttp://new.stat.gl/dialog/main.asp?lang=da&version=2010&link=FI&subthemecode=t6&colcode=t
Final Report - page15
Fisheries Partnership Agreement FPA 2006/20
FPA 35/GRE/11
Table 3: Characteristics of and trends in dimensions of Greenland fishing fleetNo. Vessels registeredYearDistrictsNanortalikQaqortoqNarsaqPaamiutNuukManiitsoqSisimiutKangaatsiaqAasiaatQasigianniguitIlulissatQeqertarsuaqUummannaqUpernavikQaanaaqIlloqqortormiutTasiilaqTOTAL200419261335663441181526902174702814572200532551245106655621292011922848331026788200628581344117726619422813730858241028863200729561438102575319242112924947138157570-10253772038392912121185882653810491Gross Registered tonnage(by category 2007)11-20210382514135683389400014821-50050461213053200003251-80132140501022000012281-120110171101030000011712100242223112131200347
Source: Statistics Greenland (http://new.stat.gl)
3.1.1 The shrimp fleetThe Greenland shrimp fishery is divided into coastal and offshore fleets. Most of the activity andproduction takes place in W.Greenland, which accounts for some 95% of the production. Totalcatches reached a peak of about 130,000 tonnes in the years 2005-2007 (the 2011 TAC is124,000 tonnes). The shrimp quota is divided between the offshore industrial fleet 57% of thequota in W. Greenland, plus all of the E.Greenland quota, and the coastal fleet taking the rest,almost all which is taken in West Greenland.There are two main components of the shrimp fleet. In 2011, the offshore vessels consist of 10modern factory trawlers (larger than 2,000 GRT, length 55-68m), a decrease from 21 vessels in2001. The decrease is the result of re-structuring towards more efficient and capital intensivevessels. These vessels are obliged to land at least 25% of their shrimp catch for processing onland.The coastal shrimp fleet is currently still in the process of re-structuring. In 2011 there are 33shrimp trawlers in the fleet, down from 71 in 2002, but the number is expected to decreasefurther. Most of these trawlers are relatively small (50-150 GRT, c.20 m length) but 5 vesselsare larger (400-800 GRT c.40- 50m) and 2 of these are actually large modern trawlers (>2000GRT). Technically, all vessels in this segment are required to land all of their catch (most haveno option since they do not have freezing capacity). A recent development is that 5 of theseshrimp trawlers with freezers, have been authorised to process onboard while maintaining theobligation to land some of the shrimp catches to support land-based processing facilities (2vessels have to land 30%, 3 vessels have to land 75%). The other shrimp trawlers land theFinal Report - page16
Fisheries Partnership Agreement FPA 2006/20
FPA 35/GRE/11
whole catch of shrimp. Most of the industrial vessels are represented by the GreenlandEmployers Association but the KNAPK, the Fishermen’s and Hunters organisation represents10 of the smaller shrimp vessels.
3.1.2 Other industrial vesselsThe offshore demersal fishery for other species is carried out by a fleet of 4 factory trawlersoperating offshore (approx. 1,200-1,400 GRT), which fish for Greenland halibut, cod and otherdemersal fish. Two of these vessels take advantage of the fishing opportunities for cod andhaddock in the Barents Sea (under Greenland’s agreements with Norway and Russia). Thus,fishing operations involve a) fishing for cod and haddock in the Barents Sea in the first monthsof the year (Dec-Mar), b) fishing for Greenland Halibut in East Greenland in Apr.-May, c) fishingfor cod in E/W Greenland in the summer, and d) fishing for Greenland Halibut in WestGreenland until the end of year (progressing northward as the ice retreats). In relation tooceanic/pelagic redfish, the only direct fishery is carried out one vessel (Polar Nanok owned byPolar Seafoods) operating in NEAFC, NAFO and Icelandic waters. However, recently it has alsotargeted a demersal redfish resource in East Greenland.
3.1.3 The coastal fishing fleetThe coastal fishery for Greenland Halibut is carried out by a large number of smaller vessels,including small trawl vessels, open vessels using line fishing, and dogsled and ice fishing.Smaller vessels operate a subsistence fishery. The exact number of fishermen and/or boatsinvolved in this fishery is about 2000. About 1,100 fishermen are registered as suppliers of theRoyal Greenland company. The fishery is managed by quotas. Most of the W.Greenland quotafor Greenland halibut is taken by the inshore fishery. Here licensed fishermen may take asmuch as possible until a global quota is reached (“Olympic fishery”).The coastal fishery sector is suffering from low profitability. The Ministry for Fisheries Huntingand Agriculture wishes to re-structure the coastal fishery, in order to make it more efficient.However, there has been no coherent structural plan proposed until now. Achieving politicalagreements on such a plan is likely to be difficult. The Government is considering introducingindividual transferable quotas for some of the larger inshore vessels, as a way of improving theefficiency of the fleet.
3.2 Greenland catchesFisheries in Greenland are divided into inshore (coastal) and offshore fisheries. Table 4 showsan overall summary of the catches 2007 to 2009 (including foreign vessels). Total catches inrecent years have averaged 220,000 tonnes, of which 65% were shrimp, emphasising theimportance of this resource to the Greenland economy.More detailed descriptions of the key fisheries are presented in the following. Thereafter, moredetailed information is provided on offshore fisheries in Greenland, including the activity offoreign fleets.
Final Report - page17
Fisheries Partnership Agreement FPA 2006/20
FPA 35/GRE/11
Table 4: Total catches in GRL waters (including foreign vessels)Catches (tonnes)SPECIESCod (COD)Snow crab (CRQ)Greenland halibut (GHL)Atlantic halibut (HAL)Herring (HER)Icelandic scallop (ISC)Northern shrimp (PRA)Pelagic redfish (RED)Demersal redfish (REG)Blue whiting (WHB)LumpsuckerWolfishOthersGrand Total200716,0002,18942,6771341,5521,395144,190908652008,8011,869908220,8886,4362,1721,004231,2616,5592,083429204,350666152,7491,36829512135,3191,724940200825,0002,35039,343144200913,0003,16540,53584Average18,0002,56840,8521211,552858144,0861,3333452007,2652,041780220,001
Source: Greenland Fishery and Licence Control
Northern shrimpThe fishery for northern shrimp started to develop in the late 60s and early 70s, which coincideswith the beginning of the collapse of the cod fishery off West Greenland, and has since becomeof crucial importance to Greenland economy. Total catches appear to have peaked at about157,000 tonnes in 2005-2006 and have since decreased slightly (138,500 tonnes in 2010). Thisis a shared stock exploited by both Greenland and Canada, but Canadian catches have becomealmost negligible since 2008.Allocation of quota in Greenland specifies a 57% share to the offshore fishery and 43% to theinshore fishery in the West Greenland shrimp fishery. Total Greenland catches have varied inthe range between 135,000 tonnes to 153,000 tonnes, including catches taken by foreignvessels in Greenland waters.CodThe cod fishery in Greenland has a long history and reached catch levels higher than 400,000tonnes in the early 1960s. The offshore component, which was fished by a number of distant-water fishing nations, collapsed and has been severely depleted since 1990. Small catches(below 1,000 tonnes) from the inshore (fiord) component continued to be taken by the coastalfisheries during the 1990s. Signs of a possible recovery were observed in the 2000s, wherecatches increased from below 1,000 tonnes to 25,000 tonnes in 2008, but these have sincedeclined to 9,000 tonnes in 2010 (Table 5),During the 1990s, a fixed TAC of 83,250 tonnes was set for cod, representing the maximumlevels that could be taken in case of stock recovery only. Only in 2001 did the GreenlandAdministration decide to set a variable TAC based on actual stock status. This applied to theoffshore component, but it soon became evident that the inshore fishery, accounting for a largeproportion of total catches, had to be regulated (which happened in 2009).
Final Report - page18
Fisheries Partnership Agreement FPA 2006/20
FPA 35/GRE/11
Table 5: Catches of cod in Greenland (including foreign vessels)Year2001200220032004200520062007200820092010TAC (tonnes)83,25054,25054,2505,0005,0005,0005,00015,00020,00010,000Total catches (tonnes)2,0004,0005,0005,0007,00010,00016,00025,00013,0009,000Inshore catches (tonnes)2,0004,0005,0005,0006,0007,00012,00013,0008,000% inshore1001001001008670755262
Source: International Council for the Exploration of the Seas (ICES)
Greenland halibutIt is important to distinguish between inshore and offshore fisheries for Greenland halibut, asthese concern separate stock components with specific quotas allocated. There is an inshorecomponent off West Greenland where catches have decreased somewhat from 24,400 tonnesin 2006 to 20,618 tonnes in 2009 (TAC of 20,500 tonnes in 2011). There is also an offshorefishery in West Greenland where catches have been gradually increasing from about 11,000 to13,000 tonnes a year during the period 2007-2009 (TAC of 13,500 tonnes in 2011), this stock isshared with Canada, and is fished in NAFO SA 0A &1A and in the Baffin Bay.Off East Greenland, the fishery for Greenland halibut is a pure offshore fishery where catcheshave been stable around 10,000 tonnes during 2007-2010 (9,974 tonnes in 2010). This is aseparate stock shared between Greenland, Iceland, and the Faroe islands.Other inshore fisheriesCoastal fisheries account for a further 10,000 tonnes annually, consisting primarily of snow crab(3,112 tonnes in 2009) and lumpsucker (6,559 tonnes in 2009), as well as minor catches ofother species such wolfish, polar cod, uvaq (polar cod), salmon, capelin, and redfish.Other offshore fisheriesOther catches from the offshore fishery are presented in Table 6. These include variousfisheries off East GRL, of which the catches of Greenland halibut, pelagic redfish andincreasingly demersal redfish (mostlyS. mentella)are important. Catches of small pelagics suchas herring and blue whiting are variable, sometimes taken inside or outside GRL waters, andmanaged by NEAFC in the context coastal states agreements.Off West GRL, relatively small catches are taken of snow crab and Icelandic clam. Note thatmajor fisheries off West Greenland such as for shrimp, Greenland halibut, and cod are notincluded in Table 6. Total catches taken by GRL off West Greenland amount to about 181,000tonnes in 2010 (shrimp: 138,500 tonnes; G. halibut: 24,000 tonnes; cod: 7,500 tonnes; otherspecies: 11,000 tonnes).Greenland vessels also take part in fisheries outside GRL in the context of fisheries agreements(i.e. Faroes, Iceland, Norway and Russia) as well as in international waters managed by NEAFCand NAFO. Total catches are variable, ranging between 16,000 tonnes and 32,000 tonnesduring 2007-2010, which is linked to the variability of small pelagic catches primarily (i.e.capelin, herring, blue whiting, pelagic redfish) and whether these are taken inside or outside
Final Report - page19
Fisheries Partnership Agreement FPA 2006/20
FPA 35/GRE/11
GRL waters. Note that it is primarily Norway that provides fishing possibilities of demersalstocks such cod, haddock and saithe in Norwegian waters (north of 62�N; Barents Sea).Table 6: Other catches taken by Greenland vessels inside and outside the Greenland EEZAreaGreenlandEastGreenland watersG. halibutHalibutHerringShrimpPelagic redfishDemersal redfishBlue whitingGreenlandWestTotalFaroesBycatchHerringBlue whitingOutside Greenland watersIcelandNAFO 3LNEAFCCapelinPelagic redfishShrimpHerringPelagic redfishBlue whitingNorwayBycatchCodHaddockHerringSaitheTotal* 2010 data is preliminary.Source: GFLK
SPECIES
20072,3911,5521,39033200
20081,395
20092,819
20101,801101,313
141025
1,223940
6011,0134,681
CrabClams1,3956,9613633,3459,9062,0094527374882,3022675,1891313,7868861,45127,5184,7951314,0231,0211,40116,6731,5086662,182
3395125,83364
24741310,0791012,032
4,948532820
14,1151,233534759
601145,0781,4072,9101,62417,557
4031156,5991,9773,45395732,278
Final Report - page20
Fisheries Partnership Agreement FPA 2006/20
FPA 35/GRE/11
Table 7: Catches of foreign fleets operating in Greenland watersFLAGAREASPECIES2007EUGRL E & WBYCCODREDGRL EastGRL WestNAFO 3LNAFO1F-INTNEAFCEU TotalFROGRL E & WGRL EastBYCBYCGHLPRAREDGRL WestIcelandFRO TotalNORGRL E & WGRL EastBYCCODGHLHALPRAREDREGGRL WestCODGHLHALNOR TotalRUSGRL E & WGRL EastGRL WestNAFO1-INTNEAFCRUS TotalGrand TotalSource: GFLKREDGHLREDGHLREDRED2,00823,9852,83526,7967814,14227,8911,2681,3044,119456951,4301,452174,1917647677621,0251,5741,0383991,7861471,8275,19731,7781,499593,7943224GHLRED1,5181196303551341,4191,6511387731421271,51853354488168275558746281162753101601,3542062751,5233,828871,00213225990481518981,8943932901,54065,6651,984112GHLPRAGHLPRAREDREDBYCRED56416,3401,01218,1192569576956,7658521,5364,001714YEAR20083083,5033866,6146401,5513,887218791488016,1277253022,48218,9322464757833812792009321,5164936,5829101,5524,06920102285606646,5791,6161,8493,927tonnes
Final Report - page21
Fisheries Partnership Agreement FPA 2006/20
FPA 35/GRE/11
Catches by Foreign fleets in GreenlandTable 7 presents catches by foreign fleets operating in Greenland waters. Fishing possibilitiesutilised by other countries consist primarily of Greenland halibut, northern shrimp, and cod to alesser extent (due to resource condition). Note that redfish possibilities are also utilised but thisprovide for quota flexibility where quotas may be taken in international waters of NEAFC andNAFO in the case of EU and Russian vessels.EU vessels take about 16,000-19,000 tonnes annually, where the variability is related to smallpelagic catches (including pelagic redfish). Total catches taken by foreign vessels haveincreased from 24,000 tonnes to 32,000 tonnes during the period from 2007 to 2010.
3.3 Processing industry3.3.1 OverviewThe fish processing industry comprises some 56 processing establishments and 4 cold stores.The sector is dominated by two large processing and exporting companies, Royal Greenlandand Polar Seafoods, which operate the industrial shrimp fleet and five large shrimp processingestablishments. They specialise in processing, including value added processing, of shrimp,Greenland Halibut and cod.In addition there is a large number of smaller establishments which service local fishingcommunities, and undertake primary processing (mainly heading and gutting of Greenlandhalibut and cod, bulk freezing, lumpfish roe processing etc). These are spread out in smallertowns and villages along the west coast primarily, and have a capacity of between 200 and 500tonnes per year. Some are under the direct ownership of the major companies (21establishments are owned by Royal Greenland) and the remainder are independent. Smallerprocessing establishments have great difficulty in maintaining competitiveness due to high fixedcosts and low volume. There is very little value added processing undertaken at the point ofproduction.
3.3.2 Royal Greenland SeafoodThe 100% state-owned company, Royal Greenland, is among the 10 largest fishing and processcompanies in the world with a yearly turnover of about Euro 525 million. It is highly verticallyintegrated, with fishing, processing, distribution and marketing/brokerage activities selling into allmajor global markets, including Japan, China, Europe and North America.The Royal Greenland Seafood A/S group includes more than 30 companies operating inGreenland, the EU, Japan, Norway, China and USA. Within the EU it operates companies in sixEU Member States, as follows:••••••Sweden:Royal Greenland Sweden AB, 100%UK:Royal Greenland UK Ltd., 100%France:Royal Greenland France S.A.S., 100%Italy:Royal Greenland Italy Spa., 100%Germany:Royal Greenland GmbH, 100%Denmark:Fishinsea Denmark A/S, 47,5%, associated
The company is vertically integrated with fishing, processing, marketing and distributionactivities. It had an annual turnover in 2009/2010 of DKK 4.2 billion (EUR 563 million) and morethan 1,900 employees around the world (with 1,000 full-time staff in Greenland), plus about1,500 seasonal employees, and supports some 1,100 small fishermen who supply with rawmaterial.In Greenland, the company operates four industrial vessels. The main target for three of thevessels is shrimp. One trawler targets Greenland halibut and Redfish (all in the Greenland zone)and cod in the Barents Sea (under the Fisheries Agreements between Greenland/Norway and
Final Report - page22
Fisheries Partnership Agreement FPA 2006/20
FPA 35/GRE/11
Greenland/Russia)19. The company also has some interests in coastal fishing vessels in theGRL fishery. It operates 20 factories in Greenland. These receive product from the industrialvessels (the 25% landing requirement) as well as raw material from about 1,100 vessels in thecoastal fishery. Only two factories are dedicated to shrimp, the rest process Greenland Halibutand cod.In Denmark, Royal Greenland has a re-packing plant for shrimp, which breaks bulk and repacksfor retail sale. It also has a plant for packing shrimp in brine and Modified AtmospherePackaging (MAP) which also deals extensively in warm water shrimp products sourcedinternationally. It also operates a smoking plant, with a significant processing of Greenlandhalibut, as well as salmon. All of the operations are substantially dependent on raw materialfrom Greenland.In Germany, Royal Greenland has a factory in Wilhelmshavn processing a range of retail packs(breaded products) from frozen fillet blocks, mainly (85%) Alaskan pollock. Raw material for thisoperation is purchased ex-vessel from the Russian pacific fleet, and then contract processedand packed in China. Volumes are high, about 40,000 tonnes per year. RG also has recentlyacquired a roe processing operation in Bremerhavn, which receives bulk lumpfish roes fromGreenland, and repacks for retail sale. The company has recently established a new factory inPoland, specifically to process high value fillets (Greenland halibut, other white fish fillets).RG has also invested in a shrimp processing and packing company in Canada, producingcooked a peeled shrimp. It buys in raw material as well as obtaining supplies from a charteredfishing vessel. RG also has shrimp re-packing facilities in Russia. It also operates sales anmarketing operations in 9 countries (Japan, Russia and several EU Member States).Annual turnover in 2010 was approximately EUR 600 million. The Greenland linked activities ofthe company (exports to markets from Greenland, plus the three Danish factories, and theGerman roe and Polish operations) are reported to account for about 30% of the volume and40% of the revenues of the company. The fillet block products (ex-Russia and China) accountfor some 50% of the volume of RG business.Royal Greenland being a publicly owned operation may have suffered from political interferencein management in the past, with the resulting loss of competitiveness. There is a still a need forrationalisation of the processing operations due the higher cost of non-fish inputs in Greenland.The annual report of the company also blames strong price competition from Canadianoperators supplying shrimp under the EU tariff quotas (see section 5.2.2)20. This pressure hasprovided the rationale for investment in increased added value activities in Greenland andhigher volume processing capacity within the EU. However, the company made a loss of EUR5.8 million in the financial year October 1st 2009 – September 30th 2010, and carries EUR 265million of debt. In 2009, the company had to raise an additional capital injection of EUR 66million from the Government of Greenland, half in the form of loan and the balance in sharecapital. The Company is reported to have returned to profit in 2010, and with the continuingrecovery in shrimp prices outlook for 2011 is improved.The EU market is the preferred market, which provides highest returns. The tariff preferenceprovided by Greenland’s OCT status has been a central pillar of Royal Greenland marketingstrategy. This allows Greenland to supply products free of the 20% MFN tariff rate applied toother suppliers. This preference is regarded as providing a buffer against the higher operatingcosts sustained by fishery enterprises in Greenland (especially in relation to costs of importedinputs, higher wages).
The Barents Sea activity is seen as strategically important since it allows the company toretain cod fishing capacity and skills pending the recovery of the Greenland cod fishery.20Canadian offshore shrimp fisheries is currently undergoing certification for the MSC standard,and one or two smaller Canadian inshore shrimp fisheries were due to complete certification in2011Final Report - page23
19
Fisheries Partnership Agreement FPA 2006/20
FPA 35/GRE/11
3.3.3 Polar Seafood A/SPolar Seafood owns and operates a modern fleet of nine large modern factory trawlers. Thesetrawlers fish for shrimp, as well as cod, haddock, red fish and Greenland halibut. It alsooperates two factories in Greenland, in Nuuk and Aasiaat. It also has a interest in six factories inthe Upernavik area in North Greenland, for the processing of Greenland halibut. In Denmark itoperates two processing factories (including value added such as smoking of Greenland halibutand salmon) in Esbjerg, and prawn processing and a 6,000 tonne cold storage facility in VesterHassing. It also operates a number of smaller distribution and sales facilities in Sweden, UK,Russia and Norway (the latter including a king crab processing operation).
3.4 Health and hygiene conditionsGreenland is presently listed in Annex II of Commission Decision 2006/766/EC establishing thelist of third countries and territories from which imports are permitted of fishery products forhuman consumption. Administration and responsibility regarding all aspects related to thesanitary conditions for the export of food of animal origin, remains a competence of Denmarkand continues to be administrated by the Danish Ministry of Food, Agriculture and Fisheries.The nominated Competent Authority is the Danish Veterinary and Food Authority (DVFA).DVFA has, by government order, given to its Regional Authority in Aalborg, Denmark(‘Fodevareregion Nord’) the authority to approve and inspect Greenlandic establishments andvessels. RVFA reports to DVFA four times per year on the conditions. Supervision by the centrallevel is achieved through random checks of inspection reports. Senior RVFA officials supervisethe work of inspectors in Greenland by checking in situ the performance of 50% of inspectorsduring inspection visits each year. All consignments from Greenland have border inspectionpost checks in Denmark (Aalborg). The consignments can thereafter either stay for consumptionin Denmark or be sent to other Member States. The Competent Authority has approved 14freezer vessels, 60 processing establishments (including 4 cold stores) and 4 factory vessels(March 2011). One establishment was approved for the export of bivalve molluscs ie. wildscallops (Pectinidae).The Food and Veterinary Office of DG SANCO undertook a mission to Greenland in June 2010,with the objective of evaluating the control systems in place governing the export to the EU offishery products21. The mission found that there were a number of deficiencies in HACCP plansin some establishments and that in some cases raw material temperatures were not properlyrecorded and were not in compliance with EU requirements. Certifications procedures werefound to allow officers to sign certificates for consignments which they had not inspected. Thereport concluded that despite the deficiencies noted, the system of official controls of the fisheryproducts production chain can be considered to be in line with the European Union sanitaryrequirements.There have been just four rapid alerts for Greenlandic fishery products issued by DG SANCOsince 2007. Three of these concern incorrect or insufficient labelling, and the other damage topackaging. Clearly retaining a high level of compliance with EU sanitary requirements is astrategic necessity for Greenland’s export trade. This minimal level of non-compliance suggeststhat the system is functioning well.Furthermore, in 2010 Greenland and the European Union expressed the intent to enter into anew sanitary arrangement on fish, fishery products, bivalve molluscs, tunicates andechinoderms (including live) for human consumption as well as by-products derived from thesesources, including fish meal and fish oil. The objective of such an arrangement would be to
Final Report of a mission carried out in Greenland from 07 to 16 June 2010 in order toevaluate the control systems in place governing the production of fishery products intended forexport to the European Union, DG SANCO, Directorate F - Food and Veterinary Office,DG(SANCO) 2010-8538 - MR FINAL
21
Final Report - page24
Fisheries Partnership Agreement FPA 2006/20
FPA 35/GRE/11
allow Greenland to trade these commodities with the Union on the basis of internal market rules,provided that Greenland transposes and applies within its territory, EU sanitary and, whereappropriate, animal health rules on fishery products, live bivalve molluscs and by-productsderived from these sources. The effect will be to provide a similar status to Greenland (inrelation to fisheries products) as enjoyed by Norway and Iceland under the terms of the EEATreaty.The Danish Veterinary and Food Administration (DVFA), has provided official assurances thatGreenland does comply with the rules of the relevant EU provisions, including import controls.Accordingly the European Parliament and the Council are considering in May 2011, a draftdecision of the European Parliament and Council “laying down rules for imports into theEuropean Union from Greenland of fishery products, live bivalve molluscs, echinoderms,tunicates, marine gastropods and by-products thereof”.In a speech to the European Parliament on 5th April 2011, European Commissioner forMaritime Affairs and Fisheries undertook to simplify the relevant sanitary measures andcertification procedures as soon as the Decision was passed.
3.5 Employment in fisheriesThe fish catching sector provided employment for about 2,000 full-time equivalents (FTE) in2004 while the processing industry provided 3,500 FTE. This corresponds to 15% of theworkforce, which is estimated to be about half of the jobs provided by the fishing industry in the1970s. Table 8 shows the numbers of small scale fishermen registered with the KNAPK(Fishers and Hunters Union) in 2009 and 2010, suggesting a national annualThe Table suggests that the rate of decline in fisheries employment in the inshore fishery ofabout 6%. This trend for falling employment is expected to continue and is likely to beaccelerated by the introduction of the proposed ITQ system to the inshore fishery.Table 8: Numbers of small scale fishermen in four municipalitiesNumbers of fishersCommuneQuaasuitsupKujalleqSermersooqQeqqataTotal20091,4313403383272,43620101,3423233382972,300Change-89-170-30-136% decline6.25.00.09.25.6
Source: Fishermen’s and Hunters Union (KNAPK), Nuuk
3.6 International Trade in Fisheries Products3.6.1 Exports from Greenland to the EUFisheries play an essential role in Greenland trade. Greenland’s fishery exports are highlydependent on the EU market, which provides tariff-free access in the context of OCT status (seebelow). Greenland depends for 96% of its revenue on the EU market. The balance of the tradeis with Iceland and Faroe islands (largely comprising landings into those countries byGreenlandic vessels).Trade flows in fishery products (HS 0301 to 0307, 1604 and 1605) from Greenland to the EUare shown in Table 9. The table indicates that fishery product exports to the EU over the period2007-2009 have averaged around EUR 290 million per year. Greenland is the largest globalproducer of coldwater shrimp (Pandalusborealis)which has become strategically importantsince the collapse of the cod fisheries in the early 1970s. Increased catches have compensatedFinal Report - page25
Fisheries Partnership Agreement FPA 2006/20
FPA 35/GRE/11
for falling shrimp prices, but this is no longer possible due to the stock condition. Frozen shrimpsaccount for about 62% of the export value of fishery products, evenly split between frozenshrimp (HS Code 030613) and prepared and preserved shrimp (HS Code 160520), the lattercomprising mainly peeled shrimp, either frozen or in brine. However, Table 9 also demonstratesthe importance of the Greenland halibut, which accounts for about 27% of the export value(since most of the frozen fish fillets exports are also derived from this species). Cod accountedfor only 4% of total export value. The crab fishery developed quickly in the late 1990s,accounting for more than 10% of total export value, but this has now decreased to under 2%due to overfishing and falling prices.Table 9: Imports of fishery products from Greenland to the EU2007tonnesFresh fishGreenland HalibutCodFrozen Fish FilletsOther frozen fishSmoked, driedsalted fishFrozen shrimpsOther crustaceaMolluscaPrepared/preserved fish eggsPrepared/preserved prawnsOthers10020,0005,1266,5601,3261,19856,0641,25935076721,8546value EUR213,55148,010,61710,845,93527,840,6303,614,0163,753,72587,217,8965,407,1023,028,1163,368,73189,493,89434,711tonnes8218,3698,2717,3631,4441,65451,4971,285194312008value EUR242,36744,575,08218,883,35735,397,6623,100,0047,239,27893,150,8425,602,4761,436,776195,815tonnes418,9315,7477,7488951,79647,5322,2951252524,1411,1782009value EUR14,71745,267,3268,889,94631,546,4642,760,4486,936,78078,442,1247,632,1281,068,815158,40791,965,297254tonnes022,7095,9168,8102,2921,43446,7902,233932423,949412010value EUR056,579,7078,870,61432,266,5614,659,1678,431,47385,525,5410911,650240,97690,998,3646,303,203
25,725 105,456,0505451,784
Total 114,609 282,828,924 115,968 315,331,493 110,416 274,682,706 114,291 294,787,256
Source: EUROSTAT External Trade Database22
The main EU destination markets are shown in Table 10. Overall, Denmark accounts for 96% offishery products imported by the EU from Greenland. However it should be considered thatAalborg in Denmark is the first port of entry for the regular Royal Arctic container servicebetween Greenland and the EU mainland, and Greenland exports maybe distributed to finalmarkets (EU as well as third countries such as China and Russia) by the importer (mainly RoyalGreenland and Polar Seafoods) either directly, or after processing in EU based facilities. Table10 does not therefore provide a complete picture of the pattern of demand by country.
22
See:http://epp.eurostat.ec.europa.eu/portal/page/portal/external_trade/data/databaseFinal Report - page26
Fisheries Partnership Agreement FPA 2006/20
FPA 35/GRE/11
Table 10: Principal EU market destinations2007EUROGermanyDenmarkSpainFinlandUKGreeceLithuaniaNetherlandsPolandPortugalSwedenTOTAL EU2,633,374117,80306,488,132038,4721,645,892001,142tonnes6422801,45901952100<0.52008EURO115,732006,764,15096,097161,8343,788,713219,953043,301tonnes57001,39923781,0601830132009EURO1,699,9090107,8284,587,321002,921,3400254,0421,338,009tonnes1,0460291,501001,13301621742010EURO256,641006,882,534004,364,202062,2561,573,287tonnes110002,534001,830022171
272,044,119 111,948 304,391,260 113,169 263,983,729 106,378 281,977,458 109,650
282,968,934 114,617 315,581,040 115,981 274,892,178 110,423 295,116,378 114,316
Source: EUROSTAT External Trade Database
3.6.2 Greenland access conditions to the EU marketThe Fisheries Partnership Agreement forms part of a series of measures which create mutualcosts and benefits to both the EU and Greenland. One part of this political agreement betweenthe parties is the duty free access to the EU market which is enjoyed by Greenlandic fisheryproducts as a result of the OCT status of Greenland, granted by the EU on Greenland’ssecession from the EU in 1985.Whilst all Greenlandic products benefit from the tariff preference, given the high significance ofshrimp in the profile of shrimp in the fishery products exported to the EU, it is the EU tariffregime for this product which is of particular interest. The EU MFN duty applied to whole frozenNorthern shrimp from other sources is 12%. The EU maintains a relatively high MFN duty (20%)for cooked and peeled shrimp (sub chapter 1605), because of the existence of an EU industryfor the processing of these products (mainly in Denmark). The entry of Greenlandic products atzero duty rates therefore creates a significant preference in favour of Greenland. However, theEU has modified the position on imports of shrimp to ensure supplies of raw material to the EUprocessing industry.Autonomous tariff quota for frozen northern shrimpIn 2004 the EU opened a reduced tariff rate quota of 7,000 tonnes at 6% for cooked and peeledshrimp as part of a series of autonomous tariff quotas set out in Council Regulation (EC) No379/2004. This quota was increase to 20,000 tonnes at 6% duty for the period 2007-2009(Regulation (EC) No 824/2007. This was extended to the end of 2012 by Council Regulation(EC) No 1062/200923when the duty on the tariff quota was reduced to 0%. The entire tariffquota of 20,000 tonnes is open on anerga omnesbasis. The shrimp quota is coupled with theprovision that the imported product must be destined for processing (the so-called "end-userequirement"). This measure was well utilised in 2008, 2009 and 2010 (at a rate of 81 to 100%see Table 11. The main user of the quota is reported to be Canada. Indications are that in 2011
23
Of 26 October 2009 opening and providing for the management of autonomous Communitytariff quotas for certain fishery products for the period 2010 to 2012 and repealing Regulation(EC) No 824/2007Final Report - page27
Fisheries Partnership Agreement FPA 2006/20
FPA 35/GRE/11
it will continue to be well utilised. The associated preference erosion has been a source ofconcern to the Greenland authorities.Table 11: Utilisation of EU’s erga omnes import tariff quota on cooked and peeled shrimpYearAvailable kg Used (kg) Balance (kg) % used2008200920102011*20,000,000 16,240,62120,000,000 19,391,59620,000,000 20,000,00020,000,0002,211,7573,759,379608,404017,788,243819710011
Source: European Commission, Online Customs Tariff Database (TARIC), February 201124
Derogation for non-originating products exported from GreenlandArticle 36(3)(a) of the Council Decision on the OCTs (Decision 2001/822/EC) provides that from1 February 2002 certain non-originating fisheries products in free circulation in Greenland orSaint Pierre and Miquelon may be accepted for import into the EU free of customs duties, withincertain annual limits. The annual limits were set out in Commission Regulation (EC) No660/2002 of 17 April 2002 opening and providing for the management of tariff quotas for certainfisheries products from Greenland and Saint Pierre and Miquelon, which provides for an annualtariff quota of 10,000 tonnes of products set out in Table 12.Table 12: Zero duty tariff quotas of non-originating products exported from Greenland tothe EUOrderNoCN codeTARICcodeDescription of GoodsCountry orterritory oftranshipmentGreenlandAnnualvolume(intonnes)10,000
09.0692
0303 31 10
Lesser or Greenland Halibut(Reinhardtiushippoglossoides),frozen*10Fish Fillets, frozen: of halibut(Reinhardtiushippoglossoides,Hippoglossushippoglossus,Hippoglossus stenolepis)Shrimps and prawns of thefamilyPandalidaewhether inshell or not, frozen
Ex 0304 20 95
0306 13 10
Source: Commission Regulation (EC) No 660/2002 of 17 April 2002
Even though there are no end use conditions on the import of these non-originating products,the facility is hardly use by Greenland. A maximum 80 tonnes of the quota was consumedduring the period 2008-2010 (see Table 13).
24
see:http://ec.europa.eu/taxation_customs/common/databases/taric/index_en.htmFinal Report - page28
Fisheries Partnership Agreement FPA 2006/20
FPA 35/GRE/11
Table 13: Utilisation by Greenland of the tariff quota for non-originating fishery productsYear Available (kg) Used (kg) Balance (kg % used2008200920102011*10,000,00010,000,00010,000,00010,000,0004,99079,19034,94009,995,0109,920,8109,965,06010,000,0000.050.790.350.00
Source: European Commission, Online Customs Tariff Database (TARIC), February 2011
By letter of 26 June 2009 Greenland requested a new derogation from the rules of origin set outin Article 37 of Annex III to Decision 2001/822/EC, in respect of prepared and preservedshrimps and prawns of the speciesPandalus borealis,to be exported from Greenland. Thisrequest was based on the fact that during certain periods of the year there is a shortfall insupplies of originating shrimps and prawns for local value added processing and to meet marketdemand.The Commission considered that the granting of the derogation would contribute to thedevelopment and survival of the Greenland shrimp processing industry. The derogation wastherefore granted for Commission Decision 0776/09 of 16 October 2009 “on a derogation fromCouncil Decision 2001/822/EC, as regards the rules of origin for prepared and preservedshrimps and prawns from Greenland” which provides for an annual quantity of 2,100 tonnesnon-originating cooked and peeled shrimp (whether or not for direct consumption or forprocessing), as from 1 August 2009 until the expiry of the Overseas Association Decision on 31December 2013. This measure allows Greenland to import cooked and peeled shrimp and touse it either for processing, or to re-export directly, to ensure continuity of supply to customers.The tariff quota (code 090691) is fully utilised (and for 2011 was consumed by mid-January,suggesting a high demand for this facility). It is particularly beneficial in that it permits theCanadian flagged vessels operated by Royal Greenland to land directly into Greenlandprocessing establishments.The overall current position is summarised in Table 14:Table 14: Modifications to tariff regime impacting upon trade in fishery products fromGreenlandLegal basisRegulation1062/09ApplicationErga omnesfrom 2010 to12012EffectNon preferentialtariff quota underend use restrictionfor 20,000 tonnesat 0%Derogation fromrules of origin (non-preferential tariffquota of 10,000tonnes)Derogation fromrules of origin for2,100 tonnes non-originating productsProducts16052010501605209945cooked and peeledP.borealisforprocessing0306 13 10 10P.borealiswhether inshell or not (alsoGreenland halibut andhalibut)16052010501605209945cooked and peeledP.borealis(no end userequirements)090692Not usedOrderNo.092794UtilisationFully used
Regulation660/2002
Greenland,annual until endof 2012
CommissionDecision0776/09
Greenland from1 Aug 2009 toend of 2013
090691
Fully used
Source: European Commission, Online Customs Tariff Database (TARIC), February 2011
Final Report - page29
Fisheries Partnership Agreement FPA 2006/20
FPA 35/GRE/11
Overall, the tariff preferences and derogations granted by the EU make a considerablecontribution towards the competitiveness of the Greenlandic products. The measures areconsidered by the Government of Greenland and fishery sector to substantially compensate forthe additional costs incurred due to the remoteness of Greenlandic production and processingfrom its main markets in the EU. Based on the values of shrimp trade alone, and current MFNduty rates (12% for frozen shrimp HS Code 030613 and 20% for prepared and preservedshrimp HS Code 160520), these benefits to Greenland are estimated by consultants to haveaveraged EUR 29.4 million/year during the period 2007 to 2009. However, it is claimed byGreenland that these benefits have been reduced by the erosion of the preferences as a resultof the granting of the autonomous tariff quota granted under Regulation 1062/09.
3.6.3 Potential Impact of Free Trade Agreement between the EU andCanadaAlso relevant to EU-Greenland relations is the potential for a Free Trade Agreement betweenthe EU and Canada. Since January 2007, the Government of Canada and the EU and itsmember countries have been in discussions on this matter25. At the June 2007 EU-CanadaSummit, leaders agreed to carry out a joint scoping study to lay the foundation for a future tradeagreement. The conclusions of this study, which was presented at the October 2008 EU-Canada Summit, persuaded the leaders to agree to begin negotiations on a ComprehensiveEconomic and Trade Agreement. In June 2009, the EU Trade Commissioner and CanadianMinister of International Trade released a joint statement regarding the start of negotiations for aComprehensive Economic and Trade Agreement (CETA)26. The first round of CETAnegotiations took place from 19 to 23 October 2009 in Ottawa, and was considered by bothsides to have been very productive, with progress made towards reaching a consolidatedcommon text. A second round of CETA negotiations took place in Brussels in January 2010, athird round in Ottawa from 19 to 23 April, a fourth round in Brussels from 12 to 16 July, a fifthround in Ottawa from 18 to 22 October 2010, and a sixth round in Brussels from 17 to 21January 2011.Both negotiating partners continue to aim at a very advanced agreement, exceeding in its levelof ambition any trade and economic agreement negotiated either by the EU or by Canada todate. As well as addressing tariff issues and investment, negotiations aim to address the non-tariff barriers arising from differences in regulation and to strengthen regulatory cooperation.With regard to tariffs on trade in goods, no tariff lines were excludeda priori.However, Canadaand EU are reported to remain at odds over EU restrictions on importing seal products, andCanada's recent decision to require that Czech citizens obtain a visa to travel to Canada. Theaim is to conclude the negotiations within 2 to 2½ years.
3.6.4 Trade in seal productsGreenland stakeholders continue to raise the issue of seal hunting. Although this is not directlylinked to the EU-Greenland FPA, many small scale fishers in Greenland are also engaged inseasonal seal hunting activities. Seal hunting is therefore an issue linked to structuraladjustment of the fisheries sector, since it potentially provides alternative and sustainableemployment opportunities for fishing communities.EU Regulation 1007/2009 on trade in seal products established restrictions in trade of sealproducts within and into the EU. Detailed procedures are set out in Commission Regulation737/2010 laying down detailed rules for the implementation of the Regulation 1007/2009. From20 August 2010 the regulation prohibits the import into the EU of products derived from sealshunted for commercial purposes and replaced disparate Member State rules previously in force.
2526
"Canada and Quebec Unite on EU Free Trade Accord", Paul Wells,Maclean's,July 30, 2007
"Canada, EU discuss trade". AFP. Ottawa. 2 October 2009.http://www.google.com/hostednews/afp/article/ALeqM5jLlbLcI5Gxd2bBT2ty3I2v7CZ2pg.
Final Report - page30
Fisheries Partnership Agreement FPA 2006/20
FPA 35/GRE/11
The Regulation permits trade in seal products derived from hunts traditionally conducted by Inuitand other indigenous communities, and which contribute to their subsistence (the “Inuitexemption”). On the basis of this, in theory, products of Greenlandic seal hunters are thereforeexcluded from the trade ban. It also permits trade in product which derive from huntingconducted for the sustainable management of natural resources (the “managementexemption”).The Regulation addresses animal welfare concerns regarding seal hunting. It followed aproposal presented by the Commission in July 2008, a public consultation exercise and animpact assessment by the Commission. The impact assessment considered welfare andmanagement aspects of seal hunting in different countries, including Greenland. In relation toGreenland the study found that the legal framework appears to be adequate, albeit with someroom for improvement. However there are clear problems in terms of monitoring and control inthe field to ensure animal welfare concerns are addressed.The Regulation has met with strong criticisms from Greenland and others27. Despite theexemptions which prima facie apply to the Greenland situation, operators indicate that theimpact of the Regulation has been to eliminate EU demand, resulting in loss of markets, astraders/producer replace seal fur with alternative materials and products. Furthermore, attemptsto apply the exemptions have been met with narrow interpretation of the regulations (forexample, allowing only existing products to be fabricated from seal pelts to which theexemptions apply). The Great Greenland Company (a state-run tannery and marketingoperation) now has stock of some 250,000 unsold seal pelts, whilst it continues to meetcontractual obligations with fishers to purchase offered pelts at agreed prices.As a result of this impact, the Fishermen’s and Hunters Association (see next section) isparticipating in a legal challenge to the Regulation in the General Court of the European Unionby 16 plaintiffs (including Canadian and Norwegian interests). The basis of the claim is errors inlaw in applying the European Treaty provisions regarding functioning of the internal market asthe basis for the regulation and breach of the UN Convention on Human rights in failing to weighthe rights and interests of the applicants. The action seeks an annulment of the implementationof the Commission Regulation and declaration of the inapplicability of the Council Regulation.The claim has been submitted and the judicial process is underway.Despite these limitations there may be potential opportunities for Inuit communities in relation tothe proposed EU regulation28. A voluntary labelling system called Origin Assured (OA) wasintroduced in the seal fur industry in 2006, including participation from Canada, Norway, USAand Greenland. However, although Great Greenland Company has its own recognizable logoand labelling system, this has not been successful in overcoming the impacts of the Regulation.
3.7 Fishery sector organisations3.7.1 Fishermen and Hunters Association (KNAPK)Inshore fishermen are represented by the Fishermen and Hunters Association, which is an apexassociation of c.70 local associations of fishermen and mammal hunters, established in 1953.Its main functions are to engage in annual round of price negotiations with processors andexporters, and to represent interests of the small scale fishers in various national andinternational fora. It participates in IWC, NANNCO and NASCO.
Hunting of seals in Canada is of a much larger scale involving both traditional, small-scaleand commercial hunting.28However, as the Impact Assessment (by consultants COWI) report points out, the terms“Inuit” and “traditional hunting” are not precisely defined. This may bring about some problemsof interpretation, which could be clarified, for example, by development of a Greenland standardand associated certification system.Final Report - page31
27
Fisheries Partnership Agreement FPA 2006/20
FPA 35/GRE/11
KNAPK members hold 17.8% of the shrimp quota. KNAPK receives 1.5% of the first sale valueof seals and fish produced by its members, which represented about EUR 600,000, plus aboutEUR 100,000 from other sources (including an annual grant from the North Atlantic SalmonFund as compensation for a no-catch agreement). The Association is a very active campaigneron behalf of fishermen’s interests, and is seeking to strengthen support for fishers undergoingstructural adjustment.KNAPK is one of the applicants in a group action (along with Canadian and Norwegian parties)being launched against the European Commission in the General Court of the European Union,with regard to the Commission Regulation 737/2010 “layingdown detailed rules for theimplementation of Regulation (EC) No. 1007/2009 on trade in seal products”.
3.7.2 Employers AssociationThe Greenland Employers Association has approximately 400 member enterprises employingaround 5,500 workers. On behalf of employers it undertakes collective bargaining with labourunions, and also represents employers and business interests to Government of Greenlandthrough its seats on various permanent councils, committees and boards. It also providesjuridical and economic counselling to its member companies. It is financed by membership feesand a pay roll levy of 0.4 or 0.5% depending on size and type of organisation. The EmployersAssociation includes all the offshore fishing fleet operators, and 2 larger inshore vessels andthus represents almost 100% of the industrial fishery interests.
3.8 Fisheries Agreements with other third countriesGreenland has longstanding bilateral fisheries agreements with Norway, Russia, and FaroeIslands which provide for exchange of quota and reciprocal access, and a framework fisheriesagreement with Iceland.
3.8.1 Greenland-Iceland-Norway (Capelin)A trilateral agreement on capelin has been in place since 1980. The present tri-partite coastalstates agreement between Greenland, Iceland, and Norway on the management of capelin inthe Greenland, Iceland and Jan Mayen area was revised as of 8 July 2003, substituting theearlier agreement of 18 June 1998.The fishery is managed according to a two-step management plan which allows for a minimumspawning stock biomass of 400,000 tonnes by the end of the fishing season. The Agreementdoes not specify this minimum spawning stock biomass, but indicates instead that ICES adviceshould be followed. The first step in this plan is to set a preliminary TAC based on the results ofprospective acoustic surveys and to set a preliminary TAC for the summer/autumn period, whichshould correspond to approximately 2/3 of the total final TAC. The second step is based on theresults of another survey conducted during the fishing season for the same year classes, usedto revise the preliminary TAC.The Agreement established national quotas according to a share of TAC as follows:Table 15: Allocation keys for capelinCountryGreenlandIcelandNorway% of TAC11818
Source: Trilateral between Greenland, Iceland, and Norway on the management of capelin in theGreenland, Iceland and Jan Mayen area, 8 July 2003
Final Report - page32
Fisheries Partnership Agreement FPA 2006/20
FPA 35/GRE/11
If the total TAC is not agreed upon, then it is specified that Iceland, being the most interestedParty, shall establish a total TAC unilaterally. If Greenland and Norway do not make fullutilisation of fishing possibilities then Iceland is allowed to fish the remaining surplus. If the finalTAC established for the season is higher than expected and Greenland and Norway are notable to fish their quota in the time available, compensation is given in the following year. IfGreenland and Norway fish a higher quantity than the specified quota, then this is subtractedfrom the following seasons quota and allocated to Iceland.Concerning access to each others waters, the Agreement states that this access is to be agreedupon between the Parties. If no such bilateral agreement on access exists, then a total of 35%of allocated quota may be fished in each others waters.Such a bilateral arrangement exists between Iceland and Norway, signed in July 2003, whichspecifies various conditions of the access to capelin in each others waters. Norwegian vesselsare allowed to fish 35% of allocated quota in Icelandic waters, as well as quota transferred fromthe other Party, in the area north of 64�30´ N until February 15th in each fishing season. Whenfishing in Icelandic waters, the number of Norwegian vessels is restricted to 30 until December1. After this date, the number of Norwegian vessels is restricted to 20. Icelandic vessels areallowed to fish 35% of their allocated quota in Jan Mayen waters, as well as quota transferredfrom the other Party, until February 15 in each fishing season.
3.8.2 Greenland-NorwayThe Fisheries Agreement between Greenland and Norway has been in force since 1991, whichsets out a mutual exchange of fishing opportunities, subject to annual agreement. The latestprotocol establishes quota exchanges and conditions that apply in 2011 (Table 16). Of particularrelevance is flexibility provided to Greenland vessels fishing for cod and haddock in the BarentsSea, where quota provided in the context of the Greenland-Russia fisheries agreement may befished in Norwegian waters, if prior authorisation has been given by the Russian authorities.Norwegian vessels are also given the flexibility of fishing pelagic redfish quota provided by theAgreement in NEAFC international waters, if due authorization has been given by Greenlandicauthorities and Norway’s NEAFC quota has been used up.Table 16: Exchange of fishing opportunities under the Greenland-Norway FisheriesAgreement (2011)ExchangeSpeciesCod – Barents sea (1)Greenland vessels fishing in Norwegian watersHaddock– Barents sea (1)Saithe– Barents sea (1)Bycatch (2)Greenland halibut – WestGreenland halibut – EastPelagic redfish- EastNorwegian vessels fishing in Greenland watersHalibut – EastCod – East/WestDemersal redfishBycatchQuota (tonnes)2,1506301,000260900275300235750400150
Source: Fisheries Directorate, Norwegian Ministry of Fisheries and Coastal Affairshttp://www.fisheries.no/management_control/Norwegian_fisheries_collaboration/collaboration_other_countries_Greenland.htmNotes(1) Can also be fished in Svalbard zone. Applies as long as the tri-party agreement on capelin is valid(2) Redfish and Greenland halibut. Bycatch may not exceed 12 % i each haul and up to 7% onboard at theend of a fishing trip. Bycatch of redfish may not exceed 15% in each haul
Final Report - page33
Fisheries Partnership Agreement FPA 2006/20
FPA 35/GRE/11
3.8.3 Greenland-Russia Fisheries AgreementThe Fisheries Agreement between Greenland and Russia has been in force since 1992, andprovides the basis for a mutual exchange of fishing opportunities. The latest protocolestablishes quota exchanges and conditions that apply in 2011 (Table 17). As with thereciprocal access arrangements referred to above under the Greenland-Norway fisheriesagreement, cod and haddock quota provided by the Greenland-Russia fisheries agreement maybe fished by Greenland vessels in Norwegian waters, subject to prior authorisation by theRussian authorities. Russian vessels are also given the flexibility of fishing pelagic redfish quotaprovided by the Agreement in NEAFC international waters, if due authorization has been givenby Greenlandic authorities and their NEAFC quota has been used up.Table 17: Exchange of fishing opportunities under the Greenland-Russia FisheriesAgreement (2011)ExchangeSpeciesCod – Barents seaGreenland vessels fishing in Norwegian watersHaddock– Barents seaBycatch (1)Greenland halibut – West S 68�NGreenland halibut – West N 68�NRussian vessels fishing in Greenland watersBycatch (1)Greenland halibut – EastPelagic redfish- EastBycatch (1)Source: Government of GreenlandNotes: (1) Bycatch of other bottom fish up to 10% of total quota
Quota(tonnes)5,0001,50010%1,22565010%1,3753,35010%
3.8.4 Greenland-Faroes Fisheries AgreementThe Fisheries Agreement between Faroe Islands and Greenland has been in force since 1997.The latest protocol under the Agreement sets out the exchange of fishing opportunities asshown in Table 18. It is important to note that there is a clear distinction in the Protocol betweenexchange of quota and the possibilities provided in the form of experimental fishing. Thespecified experimental fishing opportunities are not to be considered as quota exchanges anddo not create precedence for future quota exchanges. In addition to the fishing opportunitiesspecified in Table 18, the Protocol specifies that Faroes may fish in the Greenland zone, up to50% of any capelin quota received under its agreement with Iceland. However, when reportingcatches it must indicate whether it was fishing quota under the EU agreement (it is currentlyzero), Icelandic quota or quota which is purchased independently of these agreements. Theparties also consider an exchange of fishing days in the NAFO area 3M (Flemish Cap) inrelation to shrimp.In the context of the Agreement, there is also an Agreed Record on the sharing of theautonomous shrimp quota set for NAFO area 3L (in disagreement with Canada). For 2009 thishas been set to 2,571 tonnes for the Faroes and 530 tonnes for Greenland.
Final Report - page34
Fisheries Partnership Agreement FPA 2006/20
FPA 35/GRE/11
Table 18: Exchange of fishing opportunities under the Faroes-Greenland FisheriesAgreementQuota (tonnes)Faroese Quotas in Greenlandic WatersExperimental Fishery (Greenland halibut)Experimental Fishery (cod)Experimental Fishery (shrimp)Experimental bycatch (Greenland halibut and halibut)Greenlandic Quotas in Faroese WatersAtlanto scandian herringBlue whiting(c)Experimental Fishery (demersal fish)3,000217(d)
100255(a)100(b)275
Source: Government of GreenlandNotes:(a):3 trawl/line vessels allowed; total catches of cod may not exceed 350 tonnes; bycatch of Atlantic AndGreenland. Halibut may not exceed 275 t(b):2 shrimp trawler allowed(c):gives access to fish Greenland quota in Faroese waters(d):allocation of 60 days fishing effort for one Greenland line vessel
3.8.5 Greenland-Iceland Agreement on Cooperation in FisheriesThe Agreement between Iceland and Greenland regarding mutual fishing within the EEZs ofIceland and Greenland was signed in 199829. The Agreement has no fixed term but may beterminated with 6 months notice. The Agreement is a framework agreement, which includes theprinciples for cooperation but does not set any exchanges of fishing opportunities. TheAgreement provides Greenland vessels with the possibility of fishing its redfish quota (in theNEAFC context) in Icelandic waters. This appears to be the result of negotiations linked to theTripartite Agreement on Capelin (Iceland, Norway and Greenland) where concessions made byGreenland formed the basis for this. Note that the fishery for pelagic redfish in Icelandic watersis considered to be more profitable (i.e. better catch rates and fewer parasites) than in the othermain fishing ground in the international waters of the Irminger Sea (NEAFC and NAFO areas).
3.8.6 Consultation between Greenland, Iceland and Faroe IslandsAccording to the Greenland Government website, negotiations were initiated with the Faroes in1998 on the possibility of establishing a framework for the management of shared resources ofredfish and Greenland Halibut, involving the Parties Greenland, Iceland and the Faroes.However, this was not successful and there have not been any yearly negotiations. Anotherunsuccessful attempt took place in 2001 where the three Parties met on Greenland’s initiative.Recently, renewed attempts have been made on Iceland’s initiative. Although both parties,Greenland and Iceland, adopted a cooperation agreement it has not yet served it principalpurpose due to the lack of agreement with the Faroes. According to the Greenland authorities, itis expected that an agreement on Greenland halibut will be in place in the near futureconsidering recent developments in the fishery (see sections 4.1.5 and 12.1.2 for more detail).
29
http://dk.nanoq.gl/Emner/Erhverv/Erhvervsomraader/Fiskeri/Fiskeristyrelsen/Internationale_relationer_og_aftaler/Internationale_fiskeriaftaler.aspxFinal Report - page35
Fisheries Partnership Agreement FPA 2006/20
FPA 35/GRE/11
3.8.7 Consultations between Greenland and Canada on shared stocksThere have been consultations between Greenland and Canada since 1986, at senior officiallevel, on shared stocks, primarily shrimp and Greenland Halibut in the Davis Strait and BaffinBay. However, these consultations were terminated in 2004 by Canada because of Greenland’sdecision to resume fishing for shrimp in NAFO area 3L (by setting so-called autonomousquota)30. Consultations appear however to continue, at least informally, in relation to GreenlandHalibut in the NAFO area where there is agreement of allocation between Greenland andCanada.In 28 September 2009 an agreement between Greenland and Canada was signed on VMSmonitoring of vessels in their respective EEZs. The agreement makes provision for the directexchange of VMS information between each country’s monitoring centre as well as theexchange of information on landings. The agreement was implemented in the beginning of2010.
3.9 Fisheries Management in Greenland3.9.1 Legal FrameworkThe legal framework for the management of fisheries resources is provided primarily by Act No.18 of 31 October 1996 on Fisheries (“Fisheries Act”), issued by the Landsting (amended by ActNo. 12 of 6 November 1997, Act No. 6 of 20 May 1998, Act No. 15 of 12 November 2001, ActNo. 5 of 21 May 2002 and Act No. 28 of 18 December 2003). The Act is implemented throughnumerous executive orders, issued in pursuance of the Act, which provide more detailedregulation in specific aspects of fisheries management and for specific fisheries.At the time of writing the Parliament was debating the modification of the Fisheries Act,implementing the short term recommendations of the Fisheries Commission (see below).
3.9.2 Fisheries access rightsOffshore fisheries for the commercially important fish stocks are regulated by the setting ofTACs and individual vessel quotas, e.g. for Greenland halibut, Atlantic halibut, snow crab,capelin, shrimp, redfish, cod. All vessels are required to be licensed.In the coastal fisheries, all fishing is required to be subject to license. TACs and quotas are setonly for a limited number of stocks including shrimp, cod, and Greenland halibut. Other speciessuch as salmon, lumpsucker, snow crab and scallops, are not subject to TAC.Four types of licences may be issued under Greenlandic fisheries legislation31:•licences for a limited duration combined with a maximum allowable catch, used in (1)fisheries using vessels larger than 75 GRT for Greenland Halibut, Atlantic Halibut, SnowCrab, Capelin, Redfish, roundnose grenadier and Cod; (2) scallops; and (3)Greenlandic vessels fishing in third country waters; (4) EU vessels;licences for an unlimited duration combined with a maximum allowable catch (used inthe shrimp fishery); there is a requirement that 25% of catches of industrial vessels belanded.
•
30
http://dk.nanoq.gl/Emner/Erhverv/Erhvervsomraader/Fiskeri/Fiskeristyrelsen/Internationale_relationer_og_aftaler/Internationale_fiskeriaftaler.aspxThe issuing of licences is regulated under the Fisheries Act and Executive Order No. 5 of 31January 2002 on fisheries licences.31
Final Report - page36
Fisheries Partnership Agreement FPA 2006/20
FPA 35/GRE/11
•
licences for a limited duration not combined with a maximum allowable catch used in (1)Greenlandic fisheries where there is no biological basis for a quota; (2) GreenlandHalibut and Snow Crab if the quota is a common/shared quota for the component(inshore fisheries); (3) foreign vessels where the quota is common/shared for all vesselspermitted access (i.e. non-EU vessels); and (4) experimental fishing);licences for an unlimited duration not combined with a maximum allowable catch (notcurrently being used).
•
Each licence may indicate the species which the holder is allowed to catch, the vessels whichmay be used, the areas in which the fishing may be carried out and the specific conditions forthe fishing. Individual transferable quotas are used in the shrimp fishery.The Fisheries Act limits who may hold licences to persons who have permanently resided inGreenland and declared income taxes for more than 2 years, and who also have had fishing astheir main occupation (i.e. more than half of income from fisheries) during the last 2 years. Thismeans that the majority of the shares in a vessel must be owned by a seagoing fishermen. Thiscombination of measures has limited re-investment in the fishery, and the proposedamendments to the Fisheries Act will consider a relaxation to allow non-fisheries and evenforeign investment in the Greenland fishery sector.Provision is made in the Fisheries Act for quota shares to be transferred for ownership orsecurity, subject to approval by theLandsstyreand also subject to the provision that nocompany or individual may attain a total quota share that exceeds 33.3% in the regulated areafor the off-shore fleet unit or 10% for the coastal fleet component (it is proposed to increase thisto 15% in the current amendment).Greenland has implemented a system of individual transferable quotas as the basis for itsfisheries management system for shrimp. Thus rights may be transferred, but there is amaximum limit of 33% of the rights which may be held by any one individual or entity. Table 19shows the current ITQ rights held in the offshore shrimp fishery.Table 19: Distribution of ITQ rights in the offshore shrimp fishery of GreenlandCompanyRoyal Greenland A/SPolar Seafood Trawl A/SNiisa Trawl ApSIce Trawl Greenland A/SQajak Trawl A/SSigguk Greenland A/STotal (=100%), tonnesSource: Fiskerikommissionens betænkning 2009.
Annual quota rights held (tonnes)West Greenland33.328.213.413.210.91.063,025East Greenland29.033.37.58.39.212.75,400
3.9.3 Quota FlexibilityA provision for quota flexibility in Greenland fisheries was introduced in the Fisheries Law inconnection the revision of 2001 (Landstingslov nr 15; 12 November 2001), which states thatGovernment of Greenland may define the rules to be applied. This has so far only been appliedto the implementation of ITQ in the shrimp fishery, starting in 2002. This allows for the use of thefollowing year’s quota as from November 15 and it also allows for the transfer of unused quotato the next year with the condition that this should be fished by April 30. There are in fact fourtypes of mechanisms where quota flexibility applies:
Final Report - page37
Fisheries Partnership Agreement FPA 2006/20
FPA 35/GRE/11
a) Advance of quota: in cases where available quota has been used up and the fisher hasquota for the next year. This can be done as of 15 November.b) Transfer of advanced quota which was not fished up. If the above was not fished up, it ispossible to transfer to the next year (by 31 December).c) Transfer to the next year of any unused quota. This has to be fished during the period 1January to 30 April.d) If transferred quota is not fished up by 30 April, there is a possibility of transferring this backto the previous year on this date. This is in fact lost fishing possibilities, but it is in theinterest of the fisher to transfer back the lost quota for accounting purposes.Available data for 2008, from the GFLK indicates that the flexibility offered by thesearrangements plays an important role in the operation of the Greenland shrimp fishing fleet.There is roughly a transfer of 20-25,000 tonnes of quota both forward and backward in time forboth the offshore and inshore fishery in West Greenland, where a major part of catches aretaken. In East Greenland, quota transfers are also significant at about 10,000 tonnes (transferback and forth).
3.9.4 Fisheries CouncilThe Fisheries Council was established by the Fisheries Law of 31 October 1996 (Landstingslovnr. 18) which specifies that it consists of organizations representing fisheries interests and theDirectorate for Fishing, Hunting and Agriculture. The Government may request advice from theCouncil on matters pertaining to fisheries management, such as the setting of quotas and TACs,regulation of fishing activity and licensing, conservation measures applicable to stocks, andfishing outside Greenland’s fisheries territory.The article concerning the Fisheries Council was later modified in the 2002 revision of theFisheries Law (Landstingslov nr. 5; 21 May 2002), which further specifies that the Governmentof Greenland shall set the rules concerning the composition of the Council. The presentcomposition of the Council includes GA (Employers Association), Nusuka (newer EmployersAssociation; member of Council since 2008), KNAPK (Fishermen’s and Hunters Association),Royal Greenland A/S and the Agency for Fishing, Hunting and Agriculture (under theDirectorate of the same name).According to the Government of Greenland website (www.nanok.gl), the Fisheries Council mayissue statements or recommendations on its own initiative and is thus free to take up issues thathave not yet been treated by the Government of Greenland. The Chair of the Council mayrequest specific expertise from GINR and GFLK or any other institutions or persons that haverelevant knowledge on specific subjects that are under discussion in the Council.
3.9.5 The Fisheries Commission ReportIn 2008, the Government of Greenland appointed a Fisheries Commission(Fiskerikommissionens betænkning 2009) which published a report and maderecommendations for the revision of the Fisheries Act. This report may be regarded as a whitepaper setting out the issues raised in a review of the existing fisheries legislation and proposinga specific new approach. The Report recommended that the following principles should beadopted in the approach to the revision of the Fisheries Act:••••all fish stocks should in principle be managed by the setting of TACsquotas, whether absolute or relative, should be set for several years in order to facilitatefinancial management and investment decisions, in the interest of increasing efficiencyin fisheriesfisheries management should strive to increase profitability, both in terms of capitalinvestments or salary levels for human resources.a 2-stage process is recommended for the adoption of the new Fisheries Law
The report recommended that the revision of the legislation should take place in two stages.The 1ststage (to be implemented in the short term) is to make amendments to the Fisheries Act.
Final Report - page38
Fisheries Partnership Agreement FPA 2006/20
FPA 35/GRE/11
In March 2011, at the time of writing, these were under consideration of the Parliament. Theamendments proposed were that:••••••••the maximum ownership of quotas in the coastal shrimp fishery should be raised from10% to 15%.The quota flexibility arrangement (“kvotefleksordningen”) applicable in the shrimpfishery should be maintained in the interest of maintaining/increasing efficiency in thefishery.The ITQ system is recommended for allocation of TACs in general, except in specificfisheries depending on circumstances.the maximum level of ownership of access rights should be established in lawthe distinction between offshore and coastal fisheries in ownership of access rightsshould be eliminated.the principle of “user pays” should be introduced.a formal working group should be established to formulate administrative procedures inrelation to small scale fisheriesissues concerning ownership of parastatal companies should be resolved
Revision to the Fisheries Act to implement some of the above recommendations was underconsideration by Parliament at the time of this study. Concerning the 2ndstage (medium tolonger term actions and amendments to the Fisheries Law), the Commission recommended thatthere was a need to consider:•••••formulating strategic goals in terms of structural features of the fishery sector, andspecifically to improve efficiency and reduce the number of fishermen/workers involvedin fisheriesproviding education and training for younger generations to secure competent high-skilled workers in the sector,providing opportunities for alternative employment in fisheries characterized by highnumber of fishing units and low wagesrevising obligations to land part of the catch in Greenland for the purpose of securingland-based facilities and associated work forcere-defining the balance between efficiency in fisheries and the socio-economicconcerns.
4 GREENLAND’S FISHERY RESOURCES ANDMANAGEMENTThis section summarises the scientific knowledge regarding the status and management of thevarious commercial fish stocks in the Greenland EEZ that are of relevance to the FPA,considering the work and recommendations of ICES, NAFO, Greenland Institute of NaturalResources (GINR) and the Scientific, Technical and Economic Committee for Fisheries(STECF) of the European Commission.
4.1 Fish stocks4.1.1 Cod (Gadusmorhua)in Greenland watersIt is worthwhile putting the fishery for cod in Greenland in perspective. Total catches were higherthan 400,000 tonnes in the early 1960s but a very strong decline was observed in the early1970s where catches decreased to below 100,000 tonnes thereafter. The offshore componenthas been severely depleted since 1990. Recent increases in catches to about 25,000 tonnes in2008 are therefore well below historical levels, and these have since decreased to 9,000 tonnesin 2010. Figure 3 shows these trends.
Final Report - page39
Fisheries Partnership Agreement FPA 2006/20
FPA 35/GRE/11
Source: ICES
Figure 3: Catches of cod in East and West Greenland since the 1920s.
Analytical assessment is available up to 1992, but after the stock depletion in 1992, theassessment of the stock has been based on trends in research surveys. Cod in Greenlandderives from three stock components, labelled by their spawning areas: i) an offshoreGreenland spawning stock, ii) inshore W Greenland fiord spawning populations, and iii)Icelandic spawned cod that drift to Greenland with the Irminger Current. These stockcomponents are assessed together as pertaining to one stock.During the period 2007-2011 ICES has consistently recommended each year that no fisheryshould take place to allow for rebuilding of the spawning stock in Greenland. Although largespawning cod have been found in East Greenland, their biomass levels are still low, particularlywhen compared to historical levels, and their spatial distribution is considered limited. Note thatassessment is based on abundance indicators, which prevents the implementation of the MSYapproach with the appropriate reference levels and limits. Analytical assessments wereavailable up to 1992, but the collapse of the fishery resulted also in a data-limited situation in thefishery (i.e. reliable fishery data).Greenland has not followed the available scientific advice. Instead, a TAC of 5,000 tonnes wasset in 2007 and this increased to 20,000 tonnes in 2009. Actual catches increased from 16,000tonnes in 2007 to 25,000 tonnes in 2008, far in excess of the set TACs, then falling to 13,000tonnes in 2009 and 9,000 tonnes in 2010. A high proportion of the catches are generally takenby inshore fisheries (ranging from 50% to 75%) that were largely unmanaged before 2009, thusexplaining the overshooting of TACs. In 2011, a TAC of 15,000 tonnes was set, consisting of10,000 tonnes for coastal fisheries and 5,000 tonnes for the offshore fishery, despite thescientific advice for a closure of the fishery.In the offshore fisheries the regulations in force include quota constraints, closed areas,minimum mesh size (trawl: 140mm) and minimum landing size (45 cm). To protect the spawningstock in the Greenland EEZ all fisheries for cod are prohibited north of 62�N latitude off EastGreenland and north of 61�N off West Greenland. In 2010 the closed area was extended toinclude all of West Greenland west of 44�W. Furthermore, only three EU vessels are allowed toparticipate in a trial fishery for cod in 2011, requiring 100% observer coverage, a fishing seasonfrom July to December in East GRL, and additional obligations in terms of haul numbers perarea, VMS and data reporting. The coastal fleet is managed in terms of licenses and quotas(since 2009), gears, vessel size, minimum landing size, and is mostly operating in inshore andcoastal waters.
Final Report - page40
Fisheries Partnership Agreement FPA 2006/20
FPA 35/GRE/11
One of the main objectives of the FPA in terms of sector policy support has been thedevelopment of a multi-annual management plan for cod, which should ensure a sustainablecod fishery, special funds were allocated for this purpose. The protection of spawning grounds(i.e. northern areas specified above) and bringing inshore fisheries under management is theresult of efforts in developing such a plan, but progress has been limited. A major stumblingblock is that the scientific advice has not been followed during the whole period of the presentprotocol (due to the anticipated socio-economic impact). Agreement on the adoption ofmanagement measures appears to very difficult, involving stakeholders such as the GreenlandInstitute for Natural Resources (GN), the Greenland Fishing Licence Control Authority (GFLK),the Fisheries Council and the Ministry of Fishing, Hunting and Agriculture.A draft plan has been prepared but cannot be considered a multi-annual management plan, asthere are no explicit management objectives or criteria for increasing or decreasing TACs (noharvest control rules). Because of lack of agreement on basics such as the total TAC and theallocation between inshore and offshore fisheries, this plan can be considered only an interimstep and there is for all practical purposes no management plan in force, only a series of ad hocrules adjusted annually.Considering the rules to be applied for the setting of TACs in the EU in 2011 (COM (2010) 241FINAL), the STECF has noted that the application of these rules would imply a TAC in 2011 of7,500 tonnes (representing a 25% reduction of 2010 TAC). These rules are not applicable toGreenland waters but indicate what would be a recommended approach in line with the CFPapproach when the scientific advice recommends a zero catch or closure of the fishery.
4.1.2 Greenland Halibut (Reinhardtiushippoglossoides)in East GreenlandThe stock found in East Greenland is considered to be part of a stock covering areas in Iceland,the Faroes, and Greenland (ICES areas Va, Vb, and XIVb respectively). Most of the fishery is adirected fishery with minor bycatches from other fisheries, such as the demersal redfish fisheryin Iceland and Greenland. Total catches reached a peak of about 62,000 tonnes in the late1980s and subsequently declined to a range between 20-30,000 tonnes in recent years (28,000in 2009).Previously, most of the catches were taken in Icelandic waters, but catches in Greenlandicwaters have increased substantially during the last decade and account for roughly half of totalcatches at present (and thus Greenland’s position is that it should receive 50% allocation offishing possibilities in a regional agreement). Catches in Faroese waters, as well in the newfisheries developing in ICES areas VI and XII, are relatively low (ca. 2,000 – 3,000 tonnes).Faroese vessels account however for a relatively larger share of Greenland Halibut catches byaccess agreements with Iceland and Greenland, as well as through minor quota exchanges withthe EU. Most of the catches by EU vessels in the North Atlantic are taken in Greenland waters,accounting for 27% of total catches from the stock (Annex 4).The data on the Greenland halibut stock are insufficient for an analytical stock assessment.Instead, a number of indices from surveys and commercial CPUE are available (i.e. stockindicators) are used to examine stock biomass development and to define relative referencelevels. On the basis of these assessments ICES had previously recommended an initial TAC of15,000 tonnes in 2007 and 2008, as part of an adaptive management plan to be implemented,but the advice has now been revised to 5,000 tonnes, applicable in 2009, 2010 and 2011 andendorsed by the STECF.However, as there is no agreement on allocation between the relevant countries (i.e. Iceland,Greenland, Faroes), the autonomous setting of quotas and TACs leads to excessive fishingpressure. This was particularly evident in 2009, where the scientific advice indicated a TAC of5,000 tonnes but a total catch of 28,000 tonnes were taken (Annex 4). Greenland and Icelandhave set autonomous TACs at the same level in 2010 and 2011, for example 13,000 tonneseach in 2011, while the Faroese fisheries is regulated by a fixed numbers of licenses andtechnical measures like bycatch regulations for the trawlers and depth and gear restrictions forthe gillnetters. If no agreement is reached during the course of 2011, this is expected to result inexcessive catches by a factor 6 in relation to the advice.
Final Report - page41
Fisheries Partnership Agreement FPA 2006/20
FPA 35/GRE/11
It is important to note that the scientific advice is contested by several parties as not wellfounded and overly cautious. This is particularly the case of stakeholders fishing for Greenlandhalibut in East Greenland, who contend that CPUE is stable, which is an indicator of a stablestock condition. Distribution of total fishing effort for Greenland halibut indicates however thatthe recent fishery is concentrated in a much smaller area compared to the overall fishery in theperiod 1991–2009. In 2005-2008 catch rates in GRL waters have maintained a high level abovethe average, but decreased by nearly 20% in 2009 along with a massive increase in effort(84%)32. A breakdown of the CPUE series into subdivisions, trace the 2009 CPUE decrease tothe southernmost areas where most of the catches are taken. Also the total biomass in theGreenlandic survey in 2009 was estimated at 7,589 tons which is a historic low in the timeseries.Greenland halibut fisheries are therefore considered not to be sustainable and an adaptivemanagement plan is urgently needed, which should be negotiated between the main interestedparties (Iceland, Greenland, Faroe Islands) and implemented as soon as possible. AsGreenland Halibut nursery grounds are not known and therefore not monitored, and consideringthat it is a slow-growing species that first appears in the catches at age 5, a possible recruitmentfailure will only be detected in the fishery some 5-10 years after it occurs, highlighting theimportance of applying the precautionary principle in the short-term and reaching agreement onits management.Considering the rules to be applied for the setting of TACs in the EU in 2011 (COM (2010) 241FINAL), STECF advises that Greenland Halibut TACs in Divisions V, VII, XII in 2011 should be20,400 tonnes. This figure is calculated on the basis of a 15 % reduction in the 2010 TAC, whenthere are uncertainties in the stock assessment results.
4.1.3 Redfish (Sebastesspp.)in Greenland watersThere are three species of Redfish commercially exploited in ICES areas V, VI, XII, and XIV;Sebastes marinus, Sebastes mentella,andSebastes viviparous,the latter being of minorimportance. Advice is given for these species separately, but a recent development is therevision ofS. mentellastock structure by the “ICES Workshop on Redfish Stock Structure”(WKREDS, 22-23 January 2009, Copenhagen), which resulted in the following identification ofthree biological stocks ofS. mentellain the Irminger Sea and adjacent waters (Figure 4):••A “Deep Pelagic” stock (NAFO 1-2, ICES V, XII, XIV >500m): primarily pelagic habitatsand includes demersal habitats west of the Faroe Islands;A “Shallow Pelagic” stock (NAFO 1-2, ICES V, XII, XIV <500m): extends to ICES I andII but primarily pelagic habitats and includes demersal habitats east of the FaroeIslands;An “Icelandic Slope” stock (ICES Va, XIV): primarily demersal habitats
•
Advice is now given separately for the stocks referred above. Note however that the linkages ofthe “Icelandic Slope” stock to the East Greenland continental slope (also a demersal stock)have not yet been established and agreed upon.
32
This is disputed by the German fleet stakeholders which have provided CPUE data, indicatingstable if not increasing catch rates over the period 2003-2010.Final Report - page42
Fisheries Partnership Agreement FPA 2006/20
FPA 35/GRE/11
Source: ICES North-Western Working Group 2009 (included is a schematic representation of thegeographical catch distribution in recent years)
Figure 4: Schematic representation of biological stocks and adopted management unitsof S. mentella in the Irminger Sea and adjacent waters.
Deep pelagic Redfish (S.mentella)The fishery for deep pelagic redfish started around 1991–1992 when the commercial fleet of theshallow pelagic redfish moved into deeper waters. Since 1997, the main fishing seasonoccurred from late April to August in the so-called northeast fishing area near the Greenlandand Icelandic EEZ and within the Icelandic EEZ (i.e. in the area east of 32�W and north of 61�N;Figure 5). The trawlers participating in this fishery use large pelagic trawls (Gloria type) withvertical openings of 80–150 m and operate at a depth range of 600 to 950 m. The deep pelagicfishery in the Irminger Sea only exploits the mature part of the stock. Nursery areas for the stockare found at the continental slope off East Greenland.Landings of the deep pelagic redfish stock have declined from 139,000 tonnes in 1996 to52,000 tonnes in 200933. EU vessels take on average (2007-2009) 15% of total catches fromthe stock, some of which are taken in international waters managed by NEAFC and NAFO.About 4% of EU catches of deep pelagic redfish are taken in Greenland waters. Under theflexibility scheme agreed between Greenland and the EU, redfish quotas allocated to the EUmay be taken inside or outside Greenland waters.Analytical assessments have not been possible and stock status is based mainly on theperception of stock trends derived from survey indices (available from 1991 to estimate biomassabove the deep-scattering layer thus not a complete coverage of stock area)34. ICES
It is important to point that catches of the various redfish stocks are estimated by the ICESNorthwest Working Group, as these are based on the depth and area of catches. Officialstatistics do not distinguish these stocks ofS. mentella.34Further work (and data) is needed in order to implement the MSY approach for all redfishstocks, including the definition of appropriate reference points and limits.Final Report - page43
33
Fisheries Partnership Agreement FPA 2006/20
FPA 35/GRE/11
recommended a closure of the fishery in 2007, this included both deep and shallow pelagiccomponents, however it has since advised a total catch of 20,000 tonnes, note however that thisTAC advice concerns the deep pelagic stock only (for 2010 and 2011).
Source: ICES (NB the scale given is tonnes per nm2)
Figure 5: Fishing areas and total catch of pelagic S.mentella from the recommendednortheast management unit in the Irminger Sea and adjacent waters in 2009.
As the stock is distributed in both NEAFC and NAFO waters, these two regional fisheriesmanagement organisations decided that NEAFC should adopt overall total allowable catches(TACs) for redfish, setting aside a part of them to be taken in the NAFO Regulatory Area.Some specific NEAFC management measures were implemented by some Contracting Partiesduring the period of the protocol such as the specification of a box (Figure 5) where arecommended maximum of 70% of the TAC (i.e. autonomous TACs) could be taken.Furthermore, in order to enhance the protection of the areas of larval extrusion, no more than15% of the TAC could be taken within the box during the period 1 April to 10 May. This definitionof an area under protection is a clear improvement on the previous measure (i.e. definition ofborders such as North of 59�N and East of 36�W) applied in 2008, which led to differentinterpretations by the EU and Greenland.Most importantly, until 2011 there has been a lack of agreement on allocation and managementof the stock, and the coastal states have set autonomous TACs for catches in their waters. Thishas led to catches well in excess of the scientific advice. Furthermore, due to lack of politicalagreement, even the NEAFC recommendation since 2007, of a total TAC of 46,000 tonnes (forboth deep and shallow pelagic redfish stocks), was more than double the scientific advice, andhas been largely ignored.Greenland is one of the countries which has established autonomous quotas on this stock.However, a major development in March 2011 was that the coastal states involved such as theFaroe Islands, Greenland and Iceland, as well as several non-coastal states such as the EUand Norway reached an agreement on the allocation of pelagic redfish fishing possibilities in theIrminger Sea and adjacent waters35. This agreement is based on the assumption of two pelagic
Agreed Record of Conclusions of Consultations between Coastal States (Faroe Islands,Greenland and Iceland) and other NEAFC Parties (European Union and Norway) on theManagement of Redfish in the Irminger Sea and Adjacent Waters. Reykjavik, 17 March 2011.Final Report - page44
35
Fisheries Partnership Agreement FPA 2006/20
FPA 35/GRE/11
redfish stocks (Sebastesmentella)which are distinguished in terms of depth and fishing ground:a) shallow pelagic redfish in the southwest Irminger Sea and b) deep pelagic redfish in thenortheast Irminger Sea (Figure 4).A separate Icelandic slope redfish stock has been defined (in connection with the slopes of thecontinental shelf), but the above-referred agreement does not include the management of thisstock36.Under the agreement, a TAC of 38,000 tonnes in 2011 has been agreed for deep pelagicredfish, which will be reduced gradually to 20,000 tonnes by 2014, which is in line with thecurrent scientific advice. The agreed allocation key (bearing in mind that Russia is not asignatory to this agreement) is:•••••Faroe Islands: 6.73%Greenland: 22.25%European Union: 15.45%Norway: 3.85%Russian Federation: 20.70%
The agreement states that fishing shall not commence prior to 10 May of each year in order toprotect the areas of larval extrusion and fishing shall take place only within a specific area (boxshown in Figure 5), which is stricter than the measures currently implemented in the NEAFC.The agreement further states that only vessels flying the flag of a NEAFC Contracting Party orof a Cooperating non-Contracting Party can be entitled to participate in the fisheries, providedthey have the proper authorisation from their flag States. Provisions are given in relation toreporting requirements and inspection and surveillance. Mesh sizes of less than 100mm areprohibited. Furthermore, the agreement states that the NEAFC will seek to establish a long-termmanagement plan for redfish in the Irminger Sea and adjacent waters, including appropriateharvest control rules.Although the fishery for deep pelagic redfish cannot be considered sustainable in the short term,it is expected that this agreement on allocation will be a major step in the right direction ofachieving a sustainable fishery by 2014.STECF advises that both shallow and deep pelagic stocks ofSebastes mentellain ICES areasVa, XII and XIV and NAFO Sub-areas 1-2 fall under Category 10 (COM (2010) 241 FINAL).Accordingly this implies a TAC reduction of only 25% in 2011, but as these two stocks havebeen combined in the past, this cannot be calculated separately. The agreement goes further byslashing the 2010 TAC by about 50% overall (from 72,000 tonnes to 38,000 tonnes), whenconsidering the two stocks combined (deep and shallow).Shallow pelagic redfish (S.mentella)Russian trawlers started fishing on the shallow pelagicS. mentellastock in 1982 and coveredwide areas of the Irminger Sea. Vessels from other nations soon joined this fishery. The mainfishing area in the last decade has been in the so-called southwestern area (south of 60�N andwest of about 32�W), and the area is almost entirely shallower than 500 m. Since 2000, thesouthwestern fishing ground extended also into the NAFO Convention Area, but in later years,the fishing area has been limited to the border area between NAFO and ICES south ofGreenland. Catches have in parallel with this shrinkage declined substantially. In the period1982–1992, the fishery was carried out mainly from April to August but since then the fisheryhas been conducted from July-October. Landings of the shallow pelagic redfish stock havedeclined from 100,000 tonnes in 1993 to 3,500 tonnes in 2009.
36
Most of the catches are taken in Icelandic waters.Final Report - page45
Fisheries Partnership Agreement FPA 2006/20
FPA 35/GRE/11
As mentioned in the previous section, this fishery was subject to a NEAFC TAC of 46,000tonnes since 2007, which was given for both shallow and deep stocks combined, but largelyignored. ICES started to give separate advice for the shallow pelagic stock in 2010, consistingof a closure of the fishery, which it has reiterated in 2011.In relation to shallow pelagic redfish, the Coastal States Agreement presented in the previoussection states that the fishery should take place outside the management area specific for deeppelagic redfish. It further states that in accordance with the latest advice from ICES and in theabsence of any agreed recovery plan, there shall be no fishery during 2011 in the NEAFCConvention Area. NAFO shall be informed of this prohibition (this fishery extends into the NAFOConvention Area but is managed by the NEAFC by mutual agreement). Fishing for shallowpelagic redfish during the period 2012-2014 is conditioned by the agreement on theestablishment of a recovery plan in the Irminger Sea and adjacent waters.The fishery for shallow pelagic redfish, where the Russian Federation was a major stakeholder,appears to have collapsed completely. The agreement appears to have been made too late andthe major issue is now to rebuild the stocks, if possible.Demersal Redfish (Sebastesmentella & Sebastes marinus)on the Greenland shelfEast Greenland (ICES area XIV) is an important nursery area for demersal redfish, includingtwo speciesSebastes mentellaandSebastes marinus.In relation toS. marinus,the catches taken in the areas of East Greenland, Iceland and theFaroes are considered to be from one stock, but there is no agreement on allocation. Most ofthe catches are taken in Icelandic waters, while catches in East Greenland are almost negligible(generally less than 100 tonnes annually). No specific management advice is provided for theGreenland component. It should be noted that Iceland manages the demersal redfish fishery bysetting a joint TAC for bothS. mentellaandS. marinus(40,000 tonnes in 2010/2011), anapproach which is criticised by ICES, apart from being higher than the scientific advice.In relation toS.mentella,this was formerly considered part of the complex of redfish stocks inthe Irminger Sea (see above section on pelagic redfish) but is now separated from thesefollowing the revision by ICES in 2009. More importantly, it has been separated from theIcelandic slope redfish stock and for the first time in 2011, advice is given separately forS.mentellain East Greenland. However, ICES was not able to conduct a proper stockassessment and therefore advises that the fishery should not be allowed to expand further untilproper documentation has been obtained. For 2012 the ICES advice reiterates that the fisheryshould not be allowed to expand beyond 1,000 tonnes, thus allowing for bycatches in theGreenland halibut and cod fisheries, and experimental fishing under the precautionaryapproach.Technical measures (in the form of sorting grids in the shrimp fishery) to protect juvenile redfishhave been applied by Greenland for a number of years and are considered to have reducedbycatch of juvenile redfish substantially (redfish species/stocks and cod are found in the sameareas and depths as shrimp, and historically these species have been taken in the samefisheries).In 2010 the Greenland administration set a TAC of 6,000 tonnes for demersal redfish. As aresult catches in Greenland waters are expected to have been about this level. In 2011Greenland allowed this fishery to expand further by setting a TAC of 8,500 tonnes (withexpected catches of 6,000 tonnesS. mentellaand 2,500 tonnesS. marinus).These levels ofTAC are clearly in excess of the ICES advice and can therefore be considered to beunsustainable.The justification for the opening up of a directed fishery for demersal redfish provided by theGreenland administration is that information from surveys indicates that the fishable stock ofS.mentellain Subarea XIV has increased in recent years. However it should be noted that thesurveys carried out do not target redfish (but target cod and Greenland halibut), and as a resultthe data generated on redfish biomass are not considered to be reliable by ICES.
Final Report - page46
Fisheries Partnership Agreement FPA 2006/20
FPA 35/GRE/11
4.1.4 Northern shrimp (Pandalusborealis)in East GreenlandThe fishery for Northern shrimp(Pandalus borealis)in the Denmark Strait and off EastGreenland began in 1978 and until 2005, catches in the area south of 65�N accounted for 50-60% of the total catch. Since 2006 catches in the southern area have only accounted for 25% ofthe total catch (the shrimp fishery in Iceland has virtually disappeared), which suggests adisplacement northward of the fishery as also observed in West Greenland. Average catcheshave been about 4,000 tonnes (2007-2009) of which the EU takes 23%The state of the stock is assessed on the basis of catch and effort data available from thetrawler fleets involved, thus no analytical assessment is available. On the basis of the availabledata, the NAFO Scientific Council recommends that catches of shrimp in the Denmark Straitand off East Greenland should not exceed 12,400 tons in 2011, which is the same advice thathas been given since 2004 and adopted by Greenland. This fishery can therefore be consideredsustainable.More information, on management measures in place for shrimp fisheries in Greenland, is givenin the following section. It is important to note that the relatively low uptake of shrimp fishingpossibilities appears to be due to the difficult fishing conditions in East Greenland.
4.1.5 Northern shrimp (Pandalusborealis)in West GreenlandThe fishery for shrimp (Pandalusborealis)also takes place in Greenland’s EEZ off WestGreenland in NAFO subareas 1A to 1F. Besides the Greenland fishery, the stock is also fishedby Canada in NAFO area 0A (SFA1). Seen from a scientific point of view, the shrimps off WestGreenland are considered to be one single stock.As can be seen in Figure 6, the fishery started to develop in the late 60s and early 70s, whichcoincides with the beginning of the collapse of the cod fishery off West Greenland. Total catcheshave been on the increase since then and appear to have peaked around 2005. This coincideswith the results of surveys, indicating that total biomass appears to have peaked around 2005.Since then total biomass has shown a trend for decrease by about 20-25%, but total catcheshave been maintained, varying between 135-152,000 tonnes in recent years (138,500 tonnes in2010, Annex 4).
Figure 6: Catches and TACs of the shrimp fishery in NAFO SA 0+1, off West Greenland.Source: NAFOGreenland and Canada have not agreed on allocation, which results in the autonomous settingof quota, leading to an excessive TAC in relation to the scientific advice. In 2011, NAFO hasrecommended a total TAC of 120,000 tonnes. Greenland has set a TAC of 124,000 tonnes,including 4,000 tonnes to provide the EU with fishing possibilities in West GRL. Canada on theother hand sets a TAC of 18,417 tonnes, which has been common practice since 2007. Thus,
Final Report - page47
Fisheries Partnership Agreement FPA 2006/20
FPA 35/GRE/11
the total TAC (142,500 tonnes) exceeds the scientific advice by about 22,500 tonnes, a generaltrend in recent years. It should be noted however that Canadian catches have been negligiblesince 2008, but despite this GRL catches have exceeded even the total TAC (see Table 4).The quota offered to the EU (4,000 tonnes) is almost fully utilised, accounting for a bit less than3% of total catches on average (2007-2010).One of the reasons for this quota overshoot is that setting of quota does not account fordifferences between caught and landed weights. This is because the quantity deducted from theship’s catch quota in respect of shrimp sold for processing in onshore facilities (largely the entirecatch from the inshore fishery and the statutory 25% of the offshore fishery) is based on theweight sold to the onshore facility mostly cooked and frozen and not on the weigh caught. Thisis entirely legal, but constitutes a problem in relation to the biological advice, which is based onlive catch weight37.Management measures in force for both shrimp fisheries (East & West GRL) include the flexibleuse of quota under an ITQ system. The provision for quota flexibility in Greenland fisheries wasintroduced in the Fisheries Law in connection the revision of 2001 (Landstingslov nr 15; 12November 2001), which states that HRG may define the rules to be applied. This has so far onlybeen applied to the shrimp fisheries in GRL, starting in 2002. This allows for the use of the nextyear’s quota as from November 15 and it also allows for the transfer of unused quota to the nextyear with the condition that this should be fished by April 30.The majority of vessels active in the shrimp fisheries are obliged to use a sorting grid (the so-called Nordmore Grid) with the objective of reducing discards, and a mesh size of 40mm. In theinshore fishery in West GRL, 23.21% may legally be fished without the use of a sorting grid(with a dispensation also given for smaller vessels).The Greenland Parliament Act No. 5 of 21 May 2002 specifies an allocation of 57% to theoffshore fishery and 43% to the inshore fishery in the West Greenland shrimp fishery. AGreenlandic Management Plan for the shrimp fishery in West Greenland (June 2010) is a recentdevelopment, specifying the management of fishery as presented above. It further specifiesharvest control rules under two scenarios of low and high recruitment:Based on the above analysis, there appears to have been a risk of overfishing in West GRLshrimp fishery. However, if the specified harvest control rules are applied in future, as intended,this is expected to lead to lower fishing pressure and thus a sustainable fishery.
4.1.6 Greenland Halibut(Reinhardtius hippoglossoides)in West GreenlandThe Greenland halibut stock in West Greenland (offshore component) is part of a common stockdistributed in the Davis Strait and southward to NAFO Subarea 3 (off Newfoundland) and thusshared with Canada. This fishery has developed from catches of about 2,000 tonnes in 1989 to25,000 tonnes in 2009, which is also related to the discovery of new fishing grounds, mostlyoffshore in northern areas (Subareas 0A,1A; Baffin Bay). EU vessels catch on average about1,500 tonnes which accounts for 6.8% of total catches off Greenland (including Canada).Assessments are carried out on the basis of CPUE indices from the fishery, surveys38, andlength composition of catches (i.e. not an analytical assessment). On this basis NAFOrecommends a total catch for Subareas 0 + 1 of 27,000 tonnes in 2011. This is a gradualincrease from a recommended total catch of 24,000 tonnes in 2007. Greenland has approved aTAC of 13,500 in 2011, which is the normal procedure of allocating 50% of fishing opportunitiesin conformity with scientific advice, and Canada does the same. This is a well-managed fishery,
Differences between the catch in live weight and the amounts declared against quota haveranged between 16-20% in recent years. Source: Shrimp Management Plan 201038These are surveys targeting other stocks such as shrimp and cod, which are usedopportunistically to collect data on other species such as GHL.Final Report - page48
37
Fisheries Partnership Agreement FPA 2006/20
FPA 35/GRE/11
where recommended TACs are generally followed and there is an agreement on allocationbetween Canada and Greenland.
4.1.7 Snow Crab (Chionoecetesopilio)in West GreenlandThere was a rapid expansion of the snow crab fishery along the west coast of Greenland,starting in the mid 1990s, at a time when only limited data was available and this was primarilyfrom the fishery itself (i.e. commercial catch and effort data). TACs were initially set too highwhile the fishery was developing. Figure 7 shows that total catches never reached the TAC,indicating an overly optimistic and non-precautionary approach. It is recognized now in hindsightthat this was the case.
Source: Burmeister, A.D. 2010. Assessment of snow crab in West Greenland. 2011 Teknisk Rapport nr.83. Greenland Institute of Natural Resources (GINR)
Figure 7: Catches (fangst) and quota (kvote) in the Greenland offshore and inshorefisheries for snow crab from 1994 to 2010 (year: aar)
The fishery is managed by quotas for the inshore and offshore fisheries of 6 management areasin W.Greenland (Upernavik, Uummannaq-Disko Bay, Sisimiut, Maniitsoq-Kangaamiut, Nuuk-Paamiut and Narsaq-Qaqortoq). This is a seasonal fishery, open from April to July in allmanagement areas, and designated “crab boxes”, in order to reduce discarding and associatedmortality to soft-shelled crabs and to maximize recruitment to the stock. There are no specificlong-term management objectives for the snow crab resource in West Greenland. However,since 2004 the main objective of recommendations from GINR has been to stop the decline inbiomass of the crab resource in the different management areas.The catches have been below the TAC for the period 2007-2009, suggesting a diminishedinterest in the fishery. TACs for the offshore fishery have increased from 500 tonnes in 2007 to1,930 tonnes in 2009. In 2011 GINR has recommended a TAC of 1,000 tonnes for the inshorefisheries and 1,330 tonnes for offshore fisheries. However, the Greenland fisheriesadministration has decided to close all offshore fisheries and allocate a TAC of 2,430 tonnes toinshore fisheries. EU vessels are offered a small quota which has never been utilised during theperiod of the present protocol.
Final Report - page49
Fisheries Partnership Agreement FPA 2006/20
FPA 35/GRE/11
4.1.8 Capelin (Mallotusvillosus)in the Iceland-East Greenland-Jan MayenareaCapelin is widely distributed in the waters off West Greenland, but the catches are insignificant(20 to 430 tonnes) compared to the capelin fishery in East Greenland. This latter fishery forcapelin is managed by setting preliminary catch quotas prior to each fishing season (typicallyJuly–March). The main management objective is to maintain enough spawners for thepropagation of the stock and, since 1979, the target of maintaining a spawning stock biomass(SSB) of at least 400,000 tonnes has been used in the Iceland-East Greenland Jan Mayen area.There have been large fluctuations in stock abundance, but these appear to be environmentallyinduced and not due to excessive fishing. The fishery is considered to be sustainable.Agreement on capelin TACs are made in the context of the Tripartite Agreement (Iceland,Norway, Greenland39), which has steadily decreased from 1,300,000 tonnes in 2001 to 150,000tonnes in the 2009/2010 fishing season. The EU is allocated capelin quota which is of particularimportance as it is used for quota exchange with Iceland, as a priority, as well as with Norwayand the Faroes. In the current fishing season 2010/2011, no initial TAC has been advised forthe season; i.e. no fishery can open pending the results of further surveys.Note that these TACs are respected by the Parties of the Tripartite Agreement. Greenland alsomaintains its right to withdraw from the Tripartite agreement should there be a generaldisplacement of capelin stock into Greenland waters and as a condition for a new agreement,demand a greater share of the capelin stock40.Discards are allowed in the capelin fishery when catches are beyond the carrying capacity ofthe vessel. But as methods of transferring catches from vessel to vessel have been in use for along time, discards are practically zero. Also, the fishery has recently changed from an industrialfishery towards a fishery for human consumption. A regulation calling for immediate, temporaryarea closures when high abundance of juveniles are measured in the catch (more than 20% ofthe catch composed of fish less than 13 cm) is enforced, using on-board observers.
4.1.9 Atlantic Halibut (Hippoglossushippoglossus)in Greenland watersLittle is known about this species in terms of stock structure and dynamics, but it is commonlyassumed that Atlantic halibut was fished downed to low levels in the North Atlantic as far backas the beginning of the 20thCentury. In Greenland waters, the available data show that catchesin NAFO area 1 have almost disappeared, declining from around 1,000 tonnes in 1979 to 14tonnes in 2009. In East Greenland, catches have dwindled to 59 tonnes in 2009. Many AtlanticHalibut are believed to be taken as bycatch in trawl fishing. Although sorting grids wereintroduced in the shrimp fishery in 2002, stock(s) of Atlantic Halibut had already been in adepressed state for a very long period, maintaining permanently low or dwindling catches ofAtlantic halibut. At present, there is no directed management scheme, whether in Canada orGreenland. In Greenland, only the longline gear is allowed for a direct fishery on Atlantic halibut.EU vessels are offered fishing possibilities for Atlantic halibut in both West and East Greenland,the latter being more substantial (1,200 tonnes), but there is no interest in this fishery whenpursued by longline. There is some limited exploitation by Norwegian vessels.
4.1.10 Other stocks or possibilities:There appear to be indications that wolfish (presumably a mixture of Atlantic wolfish,Anarhichaslupus,and spotted wolfish,Anarhichas minor)have increased in abundance in East Greenland.It is not clear if it is feasible for vessels to target this species, which until now has only been
The agreed allocation is 81% to Iceland, 11% to Greenland, and 8% to Norway.Report on Foreign Affairs by the Dept. of Finance and Foreign Affairs. 2008; FM 2008/41; UDJ.nr. 01.25-0140
39
Final Report - page50
Fisheries Partnership Agreement FPA 2006/20
FPA 35/GRE/11
taken in bycatches of demersal trawls for cod and Greenland halibut, and stakeholders have notso far expressed interest.
4.1.11 Summary of fishery resources and sustainabilityThe following Table summaries the sustainability of fishing on each of the stocks described inthe previous sections, along with scientific advice for management. Refer to Annex 4 for moredetail.
Final Report - page51
Fisheries Partnership Agreement FPA 2006/20
FPA 35/GRE/11
Table 20: Sustainability of Greenland fisheries subject to the EU-Greenland Fisheries Partnership AgreementSpeciesStock AreaAdviceCodNAFO 1,ICES XIVTAC(GRL)FPAquotaTotalcatchAdviceGreenland halibutICES V,VI, XII, XIVTACFPAquotaTotalcatchDeepRedfishpelagicICES V, XII,XIV, NAFO 1, 2AdviceTACFPAquotaTotalcatch200705,0001,00016,00015,00027,0007,94621,000073,0009,74959,0002008015,0003,50025,00015,00026,0007,50024,00020,00073,0008,00030,0002009020,0003,50013,0005,00025,0007,50028,00020,00072,0008,00052,00020,00072,0008,00020,00038,000?Not sustainable;overfished2010010,0002,5009,0005,00024,0007,5005,00026,0007,000Not sustainable;risk of collapseShared stock between Iceland, Greenland and theFaroes;GRL sets TAC at 50% of the total TAC (13,000 t in2011);No management agreement in place and TACs setautonomously, exceeding adviceShared stock;Following international agreement in 2011 between(Iceland, Greenland, Faroe Islands, EU andNorway), GRL allocated share of TAC is 22.35%(8,455 t), Agreed management measures will bringTAC in line with advice by 20142011015,0002,500Not sustainable;impedingrecoveryoffisheryGRL stock – TAC set by GRL authorities;TAC levels do not follow the scientific advice andappear to be too high (set according to socio-economic concerns) relative to spawning stockSustainabilityComment
Quantity (tonnes)
Final Report - page52
Fisheries Partnership Agreement FPA 2006/20
FPA 35/GRE/11
Species
Stock Area
2007
2008
2009
2010
2011
Sustainability
Comment
Quantity (tonnes)AdviceShallowpelagicRedfishICES V, XII,XIV,NAFO 1, 2TACFPAquotaTotalcatchAdviceDemersalRedfishICES XIVbTAC(GRL)FPAquotaTotalcatchAdviceShrimpICES XIVTAC(GRL)FPAquotaTotalcatchIncludedaboveIncludedaboveIncludedabove6,000n/a5,000None22612,40012,4007,0004,600IncludedaboveIncludedaboveIncludedabove2,000n/a1,000None9212,40012,4007,0002,800IncludedaboveIncludedaboveIncludedabove3,500n/a1,000None89512,40012,4007,0004,89012,40012,4007,0004,10012,40012,400Sustainable7,000n/a6,000Nonen/a8,500NoneNotknown;precautionaryadvicenotadoptedGRL stock for the newly defined GRLSebastesmentellastock by ICES – TAC set by GRLauthorities;Stock structure not known; no stock assessment soprecautionary advice is to not allow increase untilthis is clarified (maintaining catches below 1,000 t);this advice is not followed by GRL authoritiesMixed fishery ofS. mentellaandS. marinus,dominated byS. mentella.Shared stock between GRL and Iceland, butcatches in Iceland have become negligible and arenot regulated. Managed independently by GRL –TAC set by GRL authorities;Generally low uptake of available quota appears tobe due to difficult fishing conditions in the area0IncludedaboveIncludedabove000Not sustainable;collapseoffishery
Shared stock; allocation agreement signed in 2011(Iceland, Greenland, Faroes, EU and Norway)According to the agreement the fishery should beclosed (allowing for some bycatch)
Final Report - page53
Fisheries Partnership Agreement FPA 2006/20
FPA 35/GRE/11
Species
Stock AreaAdvice
2007n/an/a1,200
2008n/an/a1,200147
2009n/an/a1,2005900015,000110,000133,0004,000135,300
2010n/an/a1,075
2011n/an/a1,075
Quantity (tonnes)TAC(GRL)FPAquotaTotalcatchAdvice385,000385,00044,275377,000130,000152,4004,000144,200
Sustainability
Comment
Atlantichalibut
ICES XIV
Notknown;probablyoverfished
No stock assessment and no advice available.Direct fisheryGreenlandallowedwithlonglineonlyin
207,000207,00023,716202,000110,000145,7004,000152,700
150,000150,00011,500151,000110,000133,0004,000138,500
390,000390,00015,400391,000120,000142,5004,000Risk ofoverfishing;GRL TAC:124,000Sustainable
Capelin
ICESXIV, IIa
V,
TACFPAquotaTotalcatchAdviceTAC(GRL)FPAquotaTotalCatch
Sharedstock(Iceland,GRL,Norway).Internationally agreed allocation of 11% of total TACto GRLLow abundance appears to be linked toenvironmental conditions primarily (not overfishing)
Shrimp
NAFO 0, 1
Shared stock with Canada, but Canadian catchesare now almost negligible.TACs set independently by Greenland and Canadatherefore consistently higher than scientific advice(by about 22,500 tonnes in 2011).
Final Report - page54
Fisheries Partnership Agreement FPA 2006/20
FPA 35/GRE/11
Species
Stock AreaAdvice
200724,00024,0002,50023,0004,5804,5805002,189n/an/a200
200824,00024,0002,50022,0003,8303,8305002,350n/an/a20032
200924,00024,0002,50025,0003,8303,8305003,165n/an/a7514
201027,00027,0002,800
201127,00027,0002,650
Quantity (tonnes)TAC(GRL)FPAquotaTotalCatchAdviceTAC(GRL)FPAquotaTotalCatchAdviceTAC(GRL)
Sustainability
Comment
Greenlandhalibut
NAFO 0, 1
SustainableGRL13,500TAC:
Shared stock between GRL and Canada (offshorecomponent),where allocation has been agreed(50%-50%)Adopted TACs are consistent with the scientificadvice
2,2302,230500
2,3300499Recovering fromoverfishingGRL stock – TAC set by GRL authorities;Concerns the offshore component of the stock,which is recovering from overfishing;Offshore fisheries closed in 2011
Snow crab
NAFO 0, 1
n/an/a75
n/an/a75Notknown;probablyoverfishedNo stock assessment and no advice availableDirect fisheryGreenlandallowedwithlonglineonlyin
Atlantic halibut
NAFO 0, 1
FPAquotaTotalCatch
Final Report - page55
Fisheries Partnership Agreement FPA 2006/20
FPA 35/GRE/11
4.2 Non-target impacts of fisheries activity4.2.1 Ecosystem impactsArctic marine shelf ecosystems are normally characterized by relatively few dominant specieswith strong interactions and strong impacts from oceanographic events that have majorinfluences on fish stocks by altering recruitment, growth, and migration patterns. Excessivecatches of one species may lead to the collapse of an important predator or prey in the systemand may cause changes in the growth and survival patterns of other species in the food web. InWest Greenland, the collapse of the cod population and the subsequent increase in shrimp andGreenland halibut biomass appears to have been the result of environmental effects coupledwith fishing impacts. There is strong evidence of inter-dependence of the shrimp and codstocks, such that it appears that both cannot be maintained at high abundance at the sametime.Figure 8 illustrates how a decrease in temperature in the late 1960s is strongly correlated with astrong decrease in cod catches. Thereafter a rise in temperature in the 1990s appears to bestrongly correlated with the rise of the shrimp fishery. The near disappearance of the cod stockimplies reduced shrimp predation by this species. Moreover, bycatches in the shrimp fisherymay have been a significant factor in limiting the recovery of fish stocks such as cod and redfishin West Greenland. It is not entirely clear what the mechanisms behind these changes are, andit would not be appropriate to go into detail on related research in the present report, but sufficeto say that ecosystem interactions are clearly implied.
Source: Rysgaard, S. 2010
Figure 8: Historical catches of cod and shrimp off West Greenland. Bycatches anddiscards
4.2.2 Bycatches and discardsThe latest compilation on information concerning bycatch and discards appears to be in theShrimp Management Plan for West Greenland (2010). Problems of bycatches and discards inthe shrimp fishery led to the introduction of sorting grids. This has resulted in significantFinal Report - page56
Fisheries Partnership Agreement FPA 2006/20
FPA 35/GRE/11
reductions in bycatches, which are generally discarded in shrimp fisheries. However, there arestill small bycatches, and interviews with Greenland stakeholders indicate that:•••The most common bycatches are as follows: Redfish(Sebastes sp.),Greenland halibut(Reinhardtius hippoglossoides),and, at certain times of the year, capelin(Mallotusvillosus).In the northern areas, bycatches may also include arctic cod(Arctogadus glacialis),polar cod(Boreogadus saida)and roundnose grenadier(Coryphaenoides rupestris) –all species in very small quantities.In the southern areas, bycatches also include Atlantic cod(Gadus morrhua),Americanplaice(Hippoglossoides platessoides),Atlantic halibut(Hippoglossus hippoglossus)andeel-like fish for which the crew members have no name, but which may be northernsand lance(Ammodytes dubius).
Logbook-reported total bycatch in recent years is about 1% of shrimp catch, and shows no trendupwards or downwards in recent years. The proportion of bycatch identified as being ofcommercially fished species is about 0.2% of shrimp catch; this proportion has steadilydecreased for the last two decades; nearly all of it is redfish.The Greenland Executive Order nr. 28 (11 December 2008) specifies limits on bycatch forspecies such as cod, shrimp, GRL halibut, and Atlantic halibut, which are relevant to theoperations of EU vessels. Catches of undersized fish are classified as bycatch (e.g. minimumsizes are specified for cod - 40cm and GRL halibut - 42cm) and the rule of maximum 10%bycatch on a haul basis is applied in general, although the Government of Greenland may givedispensation in special circumstances.Knowledge on bycatches and discards for other fisheries appears to be limited. However, theavailable data, although fragmented, appears to indicate that fisheries in Greenland aregenerally clean and large bycatches are rare events. Note that discarding is prohibited inGreenland fisheries, except in shrimp fisheries, and that observer coverage is relatively high.
4.2.3 SeabirdsAs highly migratory species, seabirds forage in the same pelagic and shelf-slope habitatstargeted by commercial fisheries. Very little information is available on incidental catches ofseabirds in Greenland, but most problems are considered to be associated with longlinefisheries. The only longline fishery that operates in relation to the EU-GRL FPA are the catchesof Atlantic halibut taken by Norwegian longline vessels. These are small catches involving a fewvessels, but it is common practice in the North Atlantic to use a scaring device to preventseabirds from taking bait. This device is a line with floats attached to its end, and the line istowed during setting with the floats moving in the area where birds may take bait. Studies showthat this practice reduces seabird catches significantly.
4.2.4 Marine mammalsIncidental bycatches of marine mammals, for example in trawl fisheries, is considered to belimited. This should not be confused with hunting activities, which are considered to beimportant sustainable activities in Greenland. Cetacean bycatch in the northeast Atlantic, aselsewhere, affects mainly small cetaceans i.e. dolphins, porpoises, and the smaller toothedwhales. Many countries have initiated cetacean bycatch monitoring programmes, and theresults generally indicate little or no evidence that serious bycatch has occurred (Greenpeace inICES, 2004). Entanglement in fishing gear appears to be the most important cause of marinemammal bycatches or injuries, but other interactions undoubtedly occur. Many cetaceans andseals predate on the fish covered in this report, and may be regarded as competing with thefishery, but there is little or no data on this interaction.
4.2.5 Benthic habitatsOffshore Greenland fisheries are characterised by the use of deep-water trawls for shrimp,Greenland Halibut and Redfish. The actual impact of deep-sea trawling in Greenland waters hasreceived only limited research attention. Studies from other areas indicate that repeated trawlingdoes have an effect on benthic habitats and this is particularly so in deeper water habitats thatFinal Report - page57
Fisheries Partnership Agreement FPA 2006/20
FPA 35/GRE/11
are less subject to dynamic change through tidal or current movement, and where bioticcolonies have slower recovery rates. The actual impact of trawling upon the marine environmentand its effect upon productivity is largely unknown, including in Greenland waters, as there arefew non-impacted reference sites.Except for parts of the upper slope in mid-Norway, the continental margins of the Norwegianand Greenland Seas are not known to host large amounts of coral, as the water temperature ofthis North Atlantic basin is too low (Friewaldet al,2004).
4.3 Marine Protected AreasThe OSPAR Convention41provides a mechanism to encourage and support Contracting Partiesto establish and register a network of Marine Protected Areas, in which special protective,conservation, restorative or precautionary measures have been instituted for the purpose ofprotecting and conserving species, habitats, ecosystems or ecological processes of the marineenvironment. Contracting Parties have so far reported on the selection of 106 MPAs ascomponents of the OSPAR network of MPAs. By September 2008 (latest version of the OSPARdatabase of MPAs nominated by Contracting Parties42) there were no Marine Protected Areasites in Greenland.In 2008, a proposal by Norway using new information coming out of the MARECO project withregard to vulnerable marine ecosystems (VMEs) formed the basis of discussions and resulted ina proposal for OSPAR to establish an MPA in the Charlie Gibbs Fracture Zone on the MidAtlantic Ridge, in a location which is just outside the Greenland EEZ (see Figure 9). Thisproposal was adopted by OSPAR under Decision 2010/2 on the establishment of the Charlie-Gibbs South Marine Protected Area, which came into force on 12 April 2011.NEAFC sought the advice of the International Council for the Exploration of the Sea, (ICES)which assessed the proposal against the standards and criteria for identifying vulnerable marineecosystems (VME), developed by FAO. In April 2009, in anticipation of the MPA declarations byOSPAR, the Contracting parties to NEAFC agreed to prohibit the use of fishing gear likely tocontact the seafloor in five zones43. These included the Charlie Gibbs Fracture Zone44. Themeasure is to remain in force until 31 December 2015 (unless there is evidence to shown that itis not required). Iceland has laid claim to a large part of the area in 2009, as part of itscontinental shelf. It is therefore not clear how this will impact on implementing an MPA for theCharlie Gibbs Fracture45.
OSPAR is the mechanism by which fifteen Governments of the western coasts andcatchments of Europe, together with the European Community, cooperate to protect the marineenvironment of the North-East Atlantic. It started in 1972 with the Oslo Convention againstdumping. It was broadened to cover land-based sources and the offshore industry by the ParisConvention of 1974. These two conventions were unified, up-dated and extended by the 1992OSPAR Convention. The new annex on biodiversity and ecosystems was adopted in 1998 tocover non-polluting human activities that can adversely affect the sea. Greenland is not acontracting party, but is bound by the Convention by Denmark’s participation.4243
41
http://www.ospar.org/html_documents/ospar/html/ospar_mpa-db_2008-01-02_populated.zip
NEAFC closes large areas to bottom fisheries on the Mid-Atlantic Ridge to protect VulnerableMarine Ecosystems in the High Seas of the North East Atlantic, NEAFC Press Release, 27 April2009http://www.neafc.org/system/files/vmes_press_rel_april2009.pdf44
The prohibition also applies to the Northern MAR Area, the sub-Polar Frontal Region, theSouthern MAR Area, the Altair Seamount and Antialtair Seamount.
Report on Foreign Affairs by the Dept. of Finance and Foreign Affairs. 2010; FM 2010/14; UDJ.nr. 01.25-01Final Report - page58
45
Fisheries Partnership Agreement FPA 2006/20
FPA 35/GRE/11
Although not clear, this measure could potentially have some impacts on the exploitation oncommercial fisheries since the proposed zone coincides with the seamounts Faraday, Hekate,and some sections of the Reykjanes Ridge associated with the redfish fishery in internationalwaters. The proposal could impact on the utilisation of the Greenland quota which can be takenin international waters under the NEAFC flexibility arrangements introduced in 2008. However,at present the redfish fishery is pursued with pelagic gear, and the measures are not expectedto impact on existing commercial fisheries.At the Annual Meeting in November 2009 NEAFC also put in place a seasonal closure in anarea south of the Icelandic EEZ known as a spawning ground for blue ling. A proposal forfurther extending the closures on the Mid-Atlantic Ridge was sent to the International Council forthe Exploration of the Sea for scientific review. Following up on the FAO InternationalGuidelines for the Management of Deep-sea Fisheries in the High Seas NEAFC has adoptedadditional measures in its bottom fishing regulations. NEAFC has outlined “existing bottomfishing areas” where bottom fishing has taken place and “new bottom fishing areas” wherebottom fishing has not taken place.
Source: Proposal for a new MPA in the OSPAR Maritime Area, WWF Arctic Programme46
Figure 9: Location of the proposed MPA in the Charlie Gibbs Fracture Zone
46
http://www.ngo.grida.no/wwfneap/Publication/Submissions/OSPAR2006/WWF_MASH06_HSMPA_MAR_Annex.pdfFinal Report - page59
Fisheries Partnership Agreement FPA 2006/20
FPA 35/GRE/11
5 EU-GREENLAND FISHERIES PARTNERSHIPAGREEMENT5.1 The EU-Greenland Fisheries Partnership AgreementThe EU-Greenland Fisheries Partnership Agreement was adopted by Council Regulation (EC)No 753/2007 of 28 June 2007 on the conclusion of the Fisheries Partnership Agreementbetween the European Community on the one hand, and the Government of Denmark and theGovernment of Greenland, on the other hand.
5.1.1 Key elements of the Fisheries Partnership AgreementThe Fisheries Partnership Agreement provides for economic, scientific technical and financialcooperation in the fisheries sector, it sets the conditions governing access to the GreenlandEEZ by EU vessels, and specifies the arrangements for the ensuring compliance withconservation and management regulations, as well as providing for partnerships betweencompanies (joint ventures). The principles which govern the Fisheries Partnership Agreementare specified; non-discrimination between the different fleets operating in the Greenland EEZ,the planning and implementation by Greenland of a sectoral fisheries policy with objectives tobe agreed by the parties; cooperation on evaluation of activities undertaken under the FisheriesPartnership Agreement and principles of good economic and social governance.The key elements of the Fisheries Partnership Agreement are that Greenland will grant accessto EU vessels to fish in its EEZ for the six year period, from 1 January 2007 (extendable for afurther six years unless notice of termination is given by one of the parties), and that the specificopportunities are set out in the Protocol to the Fisheries Partnership Agreement. Specificprovision is made in the Fisheries Partnership Agreement that the EU may employ the fishingopportunities in exchanges between the EU and other named third countries, specificallyNorway, Iceland and Faroe Islands. Greenland undertakes to authorise those vessels to fish intheir EEZ. Greenland also remains responsible for monitoring compliance of those vessels withthe Greenlandic laws, and for informing the EU of any changes to the legislation. EU vesselsmay only fish in the Greenland EEZ when they hold a valid licence, for which fees are set in theProtocol to the Fisheries Partnership Agreement.The EU undertakes to grant a financial contribution in accordance with the Protocol, whichcomprises a) a financial contribution for access by EU vessels to Greenland fisheries and b) anelement for securing continued responsible fishing and sustainable exploitation of fisheriesresources in the Greenland zone. This element is to be managed by Greenland in the light ofobjectives identified jointly by the parties, and to be achieved in the context of Greenlandfisheries policy and its programmed implementation. The financial contribution may be changedin certain defined circumstances such as a) exceptional circumstances which prevent fishing inthe Greenland EEZ b) reduction of fishing opportunities agreed by the parties for the purposesof managing the stocks c) the introduction of additional fishing opportunities and d) re-assessment of EU support in the light of results of the annual and multi-annual programming orsuspension of the Fisheries Partnership Agreement as a result of serious infringement. Theparties undertake to promote economic, commercial and scientific cooperation in the fisheriessector, and to promote the conduct of experimental fisheries.A key element of the management of the Fisheries Partnership Agreement is the formation of aJoint Committee as a mechanism for monitoring the agreement and ensuring itsimplementation. The functions of the Joint Committee are specified; key ones include acting asa forum for settlement of any disputes, reviewing and negotiating, where necessary andappropriate the level of existing and new fishing opportunities and the financial contribution;evaluating the need for management and recovery plans for fish stocks; monitoring temporaryjoint ventures and experimental fisheries; agreeing on administrative matters regarding licencesand assessing the terms of EU financial support as warranted by the results of the annual andmulti-annual programmes.
Final Report - page60
Fisheries Partnership Agreement FPA 2006/20
FPA 35/GRE/11
5.1.2 Protocol to the Fisheries Partnership AgreementThe Protocol to the Fisheries Partnership Agreement sets out the technical details forimplementation. It requires the Joint Committee to set the annual fishing opportunities on thebasis of scientific advice and the needs of the fishing industry. The opportunities refer to Annex1 of the protocol which sets“indicative”quotas for seven species of fish in different fishingzones (E and West Greenland) plus bycatches. For five of these species (cod, snow crab,shrimp and redfish and Greenland halibut) minimum quantities of TAC are set, below whichGreenland is absolved of the obligation to offer the opportunities. The quotas are shown inTable 22.In the event that the quantities available are less than the indicative quantities, Greenland isrequired to offer compensatory opportunities either in the same or future years. If this is notfeasible, then the Protocol states that financial arrangements, including the financialcontribution, may be modified. Additional catch opportunities may also be offered by Greenland,with a mechanism established for the corresponding additional compensation to be paid.Greenland may issue fishing licences to EU vessels only under the terms of the FisheriesPartnership Agreement.Article 2 of the Protocol describes the financial arrangements. The EU undertakes to payGreenland EUR 85,852,464 over a six year period, payable in annual tranches of EUR14,307,244. A reserve is set aside in case additional fishing opportunities for cod and capelinbecome available. There is provision for suspension of the payments when seriouscircumstances other than natural phenomena prevent fishing. The Greenland FPA is the EU’sthird largest in terms of budgets. The budgeted cost of the Fisheries Partnership Agreement tothe EU budget is EUR 15.8 million per year, which accounts for about 10% of the EU budgetexpenditure on Fisheries Partnership Agreements (Mauritania accounts for 54% and Morocco23% of the EU expenditure47).Each year Greenland commits to applying EUR 3,261,449 (or slightly less in 2007) in favour ofimplementing a sectoral fisheries policy with a view to securing continued responsible fishing, tobe managed in the light of objectives identified by mutual agreement within the frame of the jointcommittee. From this amount EUR 500,000 and EUR 100,000 annually are to be applied to theGreenland Institute of Natural Resources and for training of fisheries officials respectively.Otherwise the parties are to agree on annual and multi-annual guidelines for the application ofthis financial element, and which take account of the priorities expressed in the Greenland’sfisheries policy. The application of this element of the financial contribution may be changed atthe request of the Commission where the evaluation of progress so warrants (Article 4.5). Thereis provision in the protocol for the resolution of disputes, suspension of the agreement, and formid-term review.The Annex to the Protocol sets the indicative fishing opportunities, rules regarding bycatch, theprocedures for the application and issue of fishing licences, the zones in which EU vessel mayoperate, arrangements for catch reporting, technical conservation measures and the observerscheme and detailed rules for the operation of satellite vessel monitoring systems, temporaryjoint ventures and experimental fishing.
See Bilateral fisheries partnership agreements between the EU and third countries;http://ec.europa.eu/fisheries/cfp/external_relations/bilateral_agreements_en.htm
47
Final Report - page61
Fisheries Partnership Agreement FPA 2006/20
FPA 35/GRE/11
Table 21: Level of indicative fishing opportunities established by the ProtocolSpeciesCod (NAFO 0/1) (1) W or EPelagic redfish (ICES XIV/V) (2) E/WGreenland Halibut (NAFO 0/1) – south of 68�Greenland Halibut (ICES XIV/V) (3) EShrimp (NAFO 0/1) WShrimp (ICES XIV/V) EAtlantic Halibut (NAFO 0/1)Atlantic Halibut (ICES XIV) (4)Capelin (ICES XIV/V)Snowcrab (NAFO 0/1)Bycatches (NAFO 0/1) (6)Source: Protocol to the EU Greenland Fisheries Partnership Agreement1
20071,00010,8382,5007,5004,0007,0002001,20055,000(5)5002,600
20083,5008,0002,5007,5004,0007,0002001,20055,000(5)5002,300
20093,5008,0002,5007,5004,0007,0002001,20055,000(5)5002,300
20103,5008,0002,5007,5004,0007,0002001,20055,000(5)5002,300
20113,5008,0002,5007,5004,0007,0002001,20055,000(5)5002,300
20123,5008,0002,5007,5004,0007,0002001,20055,000(5)5002,300
In the event of stock recovery, the EU may fish up to pm Tonnes, with a corresponding increase in the part of the financial compensation referred to in Article 2(1) of theProtocol. The quota for 2007 can only be fished as from 1 June. May be fished East or West2
May be fished East or West. To be fished by pelagic trawl.3
This figure may be revised in the light of the agreement for the allocation of catch possibilities between coastal countries. The fishery shall be managed through a limitation onthe number of vessels fishing at the same time.4
1,000 tonnes to be fished by no more than 6 EU demersal longliners catching Atlantic halibut and associated species. The conditions for the fishery of the demersal longlinersshall be agreed upon in the framework of the Joint Committee5When catchable, the EU may fish up to 7.7% of the capelin TAC for the season going from 20 June to 30 April the following year with a corresponding increase in the part ofthe financial compensation referred to in Article 2(1) of the Protocol.6
Bycatches are defined as any catches of species not covered by the vessels target species indicated on the licence. The composition of the bycatches shall be reviewedannually in the framework of the Joint Committee. May be fished East or West.
Final Report - page62
Fisheries Partnership Agreement FPA 2006/20
FPA 35/GRE/11
5.1.3 Sectoral policy support measuresIn line with the Protocol the parties have agreed on a matrix of sectoral policy supportmeasures, at their Joint Committee meeting of 2 and 4 July 2007 The matrix of measuresincluded the following axes addressing the stated objectives:Overall objective: to promote sustainable management and utilisation of the fisheries•New fisheries act
Area 1: Administration of the Department of Fisheries Hunting and Agriculture•••Cod management planFinancial support for the coastal fisheries componentTraining of fisheries officials
Area 2: Control and enforcement- Maintain and develop efficient control and enforcementregime•••••Level of administrationControl at sea (seagoing)Control at sea (coastal)International control agreementsTraining of fisheries officials
Area 3: Greenland Institute of Natural Resources: To promote sustainable fisheriesthrough best possible practices•Gathering and analysis of data and international scientific cooperation in the existingfisheries•Gathering and analysis of data and international scientific cooperation in new fisheries
Monitoring indicators were established. The structure of the matrix has been retainedthroughout the period of the Protocol, although there have been a number of modifications toscheduled targets and indicators as the matrix has been adapted to circumstances (such aspolitical delays in the passage of legislation). More details on the implementation of themeasures are provided in Section 7 where its impacts are assessed.
5.2 Availability of quota as per ProtocolTable 21 shows the provision of fishery opportunities by Greenland in the first five years of theFisheries Partnership Agreement. A detailed annual breakdown showing allocations to EU andthird countries is provided in Annex 3.. Because of resource limitations, on nine occasionsGreenland has not been able to deliver all of the fish quotas set out in the protocol. The averageannual deficit was 35,530 tonnes, which corresponds to 39% of the annual quantity. In particularthe full quotas have never been available for capelin, which accounts for 55,000 tonnes per year(about 60% of the total). The quota for redfish was not available in 2007, only part of the quotafor halibut was available in 2009 and 2010, and the quota for cod in 2010 was also halved.Article 1.2 of the Protocol sets out a compensation mechanism which provides for Greenland tooffer alternative fishing opportunities if some of the annual quotas foreseen by the Protocolcannot be allocated to the EU due to the situation of the stocks.
Final Report - page63
Fisheries Partnership Agreement FPA 2006/20
FPA 35/GRE/11
Table 22: Quotas Delivered under the EU-Greenland Fisheries Partnership Agreement 2007-20102007SpeciesCOD 2007COD 2008-2010REDGHL WGHL EPRA WPRA EHAL WHAL ECAPSNCBYCTOTALSource: European Commission, DG MARENB. 2011 quotas for redfish were not allocated at the time of writing, due to changes following the March 2011 Redfish Agreement. Note that shaded areas indicate provision ofquota less than specified in the Protocol
2008Total3,500Difference0000000031,28400Total3,5008,0002,5007,5004,0007,000751,07505002,3000
2009Difference0O000012512500Total2,5008,0002,8007,5004,0007,000751,0755002,300
2010Difference1,0000-30000012512500Total2,5005,2272,6507,0004,0007,000751,0755002,300
2011Difference1,0002,773-1505000012512539,6000043,973
Protocol1,0003,5008,0002,5007,5004,0007,0002001,2005002,300
Total1,0009,7492,5007,9464,0007,0002001,2005002,60080,970
Difference
-1,0890-446000000
8,0002,5007,5004,0007,0002001,2005002,300
55,000 44,275
10,725 23,716
55,000 11,500
43,500 15,400
9,190 60,416
31,284 36,450
55,250 47,250
44,450 47,727
Final Report - page64
Fisheries Partnership Agreement FPA 2006/20
FPA 35/GRE/11
In the case of the deficit of redfish of 1,089 tonnes in 2007, this was compensated by thetransfer of an additional 446 tonnes of Greenland halibut, under the term of Article 1.2 of theProtocol. In 2008 Greenland did offer 1,400 tonnes of Atlantic halibut (in East and WestGreenland) as per the Protocol. However, only 1,200 tonnes was accepted by the EU since thiswas the extent of demand, as Norway only required 200 tonnes of this species in the bilateralexchange with the EU (rather than the 400 tonnes previously received). The deficit for capelin in2009 was partially compensated by the transfer of additional quota for Greenland halibut(W.Greenland). However, over the course of the Fisheries Partnership Agreement, up to theend of 2010, a debt of 133,286 tonnes of capelin, and 2,000 tonnes of cod had built up, whichthe parties valued at a nominal EUR 2,782,505.At the Joint Committee meeting of 25/26 November 2010 the parties agreed that this debtshould be resolved by i) reduction of the 2011 compensation payment by EUR 1,668,503 and ii)expansion of the sectoral policy matrix by Greenland, to include purchase of research vesselvalued at EUR 1,113,002.The lack of availability of capelin quota has also impacted upon the EU Iceland FisheriesAgreement, since the Union allocates the capelin quota from Greenland as a priority to thisagreement (in which is exchanged for redfish fishing opportunities for the EU fleet).Because of limitations in the resources and lack of availability of alternative species of interestto the EU fleet, until now, the compensation mechanism has not been able to provide a solutionto the deficits which arise due to stock fluctuations. However, it should also be considered thatin the case of capelin, the nature of the stock is such that it is a highly variable resource, and itis foreseeable that even higher levels of capelin debt could be repaid in a single year whenstock abundance is high.
5.3 Utilisation of fishing opportunities5.3.1 EU vessels drawing licencesTable 23 shows the uptake of licences by EU vessels from 2007 to 2010. Note that that thisdata includes vessels under the flag of a Member State which had the potential draw oncollective licences, and not necessarily those which actually fished on Greenland quota. Duringthe period a total of 37 EU flagged vessels have therefore benefited from the FisheriesPartnership Agreement, with an average of 32 vessels each year. In 2007, the FisheriesPartnership Agreement potentially benefited 37 EU vessels, including 5 from Germany, 13 fromSpain, 4 from UK, 6 from Portugal, 1 from Denmark, 3 from Lithuania, 2 each from Poland andEstonia and 1 from Lativia. In 2008 to 2010, the number of vessels drawing licences appears tofall to 23 or 24. However from 2008, it was agreed that licences could be purchased in a blockand allocated to a Member State on behalf of a group of vessels, for subsequent division andsharing between them. This facility was utilised by Germany and the UK for Greenland halibutand cod licences, Spain for redfish and Poland for Greenland halibut. Furthermore, from 2008.although not expressly provided for in the Protocol, the Greenland Authorities have also allowedthe transfer of licences already drawn and paid for to other vessels.The actual numbers of vessels actually fishing was in some cases fewer than the numberlicensed (for example in 2007 only 3 out of 11 Spanish vessels actually fished Greenlandquota). Combined with the system of intra-community transfers of quota, the revised system isreported by stakeholders to have significantly improved flexibility to utilise the opportunities, andis undoubtedly one of the reasons for the high level of utilisation.Considering the total EU fleet of 89,129 vessels, for the period of 2004-2008, the number of EUvessels active in the Greenland FPA corresponds to about 0.04% of the total fleet48. In terms ofcapacity the fleet fishing in Greenland represents about 2.8% of total EU gross registered
Overall evaluation of the Fisheries Partnership Agreements. FISH/2006/20 SC17. OceanicDéveloppment and Megapesca Lda.Final Report - page65
48
Fisheries Partnership Agreement FPA 2006/20
FPA 35/GRE/11
tonnage. Note that approximately one third (11) of the vessels (from UK, Germany, Poland andEstonia) are under the beneficial ownership of an Icelandic organisation.Considering the EU distant water fleet involved in fishing in third country waters under the termsof Fisheries Partnership Agreements (assuming the capacity to be constant at 2007 values), theGreenland FPA has accounted for about 6% of the number of vessels (10% in 2007) and 14-16% of the tonnage capacity (as shown in Table 24).Table 23: No. and capacity of EU vessels drawing licences under the FisheriesPartnership AgreementFlag/AgreementAll FPAsGreenland FPA5Germany1Denmark13Spain2Estonia4United Kingdom3Lithuania1Latvia2Poland6Portugal37Total Greenland% attributable to Greenland 10%Number of vesselsTonnage of vessels (GT)2007 2008 2009 2010 2007200820092010374 374 374 374 275,000 275,000 275,000 275,000518041122246%618141110236%516331113246%11,3672,22315,2203,1836,4033,8864,8764,87611,48663,52023%11,3672,22310,25206,4031,9431,9434,8764,13543,14216%11,3672,22310,2521,7806,4031,9431,9431,805037,71614%11,3672,2238,6613,1836,7051,9431,9431,8055,83843,66816%
Source: European Commission DG MARE; Convention Spécifique N�17 - Overall Evaluation Study ofFisheries Partnership Agreements, Rapport Final Révisé, Avril 2009
5.3.2 Utilisation of quotaTable 24 shows the average annual allocated quotas, uptake of quota and catches for eachspecies, during the period 2007 to 2010 inclusive. The table is in three parts, showing uptakeand catches by all fishing vessels, and then separately by vessels from EU Member States andthird countries.The EU fleet drew licences for 81% of the available fishing opportunities in 2007, 71% in 2008,75% in 2009 and 75% in 2010, with an overall rate of utilisation of 75%. This is regarded as avery good rate of utilisation. Third countries draw all of the licences available (since they do notpay licence fees, there is no cost advantage in drawing less than the full amount). If quotastransferred to third countries are included, then overall utilisation, in terms of licences drawn, isabout 90%. Clearly the Fisheries Partnership Agreement provides a high degree of utility for theEU and third country fleet operators which benefit from the fishing opportunities provided. Moredetails on the utilisation by third country vessels is given in the next section.
Final Report - page66
Fisheries Partnership Agreement FPA 2006/20
FPA 35/GRE/11
Table 24: Average annual utilisation of fishing opportunities and catches under the EU-Greenland Fisheries Partnership Agreement *CountryALLSpeciesCODREDGHL NAFOGHL XIVPRA NAFOPRA XIVHAL NAFOHAL XIVCAPSNCBYCTOTALEUCODREDGHL NAFOGHL XIVPRA NAFOPRA XIVHAL NAFOHAL XIVCAPSNCBYCTOTAL EUNORCODREDGHL NAFOGHL XIVPRA XIVHAL NAFOHAL XIVBYCFROREDGHL NAFOGHL XIVPRA XIVICETOTAL 3rd.CAPAvailable quota Licenses taken % of quota Av. Annual catch % of quota(tonnes)2,8758,4372,5757,6114,0007,0001,11311326,103622,43562,3222,3755,3151,6256,7184,1312,351-1,000-5002,22626,2415002,8758008183,275113113209246150751,24326,10336,519(tonnes)2,6296,8642,5757,6114,0006,08811311326,103-20956,3022,1293,7421,6256,7184,0001,570-----19,7835002,8758008183,275113113209246150751,24326,10336,51900751001001001001001001001001001001001001001000drawn91811001001008710100100099090701001009767(tonnes)1,7273,8642,4217,2543,7673,16679626,103-9648,5021,6312,0161,5786,5213,767939----2016,472971,6776946671,412796761711506681526,10332,0309797914000-006319588781437853670100886610088caught604694959445185100047869
Source: European Commission, DG MARE* note that data are only averaged for those years in which they are available (not over the four yearsperiod)
Final Report - page67
Fisheries Partnership Agreement FPA 2006/20
FPA 35/GRE/11
5.3.3 Utilisation of quota by third countriesThe EU is allowed, under the terms of the Fisheries Partnership Agreement, to utilise the quotait receives from Greenland in exchanges with Norway, Iceland and Faroe Islands. This it doeson annual basis within the frame of the bilateral fisheries agreements between the EU and thesecountries. The exchange quotas are agreed during the annual bilateral negotiations, which alsoinclude agreements on management of shared stocks and access to each others waters to fishown- quotas of shared stocks.Table 24 and Table 28 shows the catches and quotas and values derived from the EU-Greenland FPA for fishing vessels from Norway, Faroe Islands and Iceland operating inGreenland. It should be noted that whilst EU vessels are required to pay licence fees on a pro-rata basis for fishing opportunities drawn, third country vessels which operate in Greenlandusing quota received from the EU-Greenland FPA via the exchanges, do not pay licence fees.They have no disincentive to draw less than 100% of the licences available.Quota exchanged with NorwayGreenland quota has been exchanged with Norway in each year of the period 2007 to 2010. In2007 and 2008, Norwegian vessels did not target redfish (due to the high price of fuel) andutilisation was therefore effectively nil. However in 2009 and 2010 they fished this stock again(and in 2010 the quota was fully utilised).With regard to shrimp the Norwegian sector has continued to decline with only a few vessels leftoperating. They are offered more opportunities in Greenland than they can utilise (Norway alsoreceives shrimp opportunities directly from Greenland under their bilateral agreement). Theopportunities are not very interested due to the continuing poor market outlook and weak prices,with the resulting moderate to low utilisation rate (average 43%).With regard to Greenland Halibut, the fishery in both East and West Greenland is considered tobe profitable by Norwegian vessels, and was well utilised (81% and 87% respectively). Halibutis of interest to Norwegian vessels, but is only fishable in some regions, principally inE.Greenland where utilisation rate was 85% overall. Long line fishing for this species inW.Greenland is reportedly subject to predation by sperm whales, and it is therefore notconsidered to be a viable fishery, despite the premium prices for the product.There are no current problems with access conditions. It was reported by Norwegianstakeholders in 2009 that the issue of licences by Greenland has been slow at times causingsome inconvenience to vessels, but this is now resolved.Quota exchanged with IcelandGreenland quota has been exchanged with Iceland in 2007 and 2008 (and in 2011). There wasno bilateral exchange in 2009 or 2010. Icelandic Authorities have stated in the past thatIcelandic vessels do not use any of the capelin exchanged with them under the EU-IcelandFisheries Agreement. The claim is that the quotas obtained under the trilateral capelinagreement (Greenland-Iceland-Norway) are used before any other quotas and that the EU-origin quotas have always been surplus. However Greenland has contributed 28,490 tonnes toIcelandic quotas for capelin of a TAC of 318,245 tonnes in 2006/7, and 23,716 tonnes out of aTAC 157,206 in 2007/8. Overall, during the years concerned Iceland has been about 11%dependent on the quota received via the EU-Greenland FPA.Quota exchanged with Faroe IslandsFaroes received 1,150 tonnes of East Greenland shrimp quota from the EU in each of 2007 and2008, falling to 1,335 tonnes in 2009 and 2010, through the balanced exchange of fishingopportunities under the terms of the EU Faroes Islands Fisheries Agreement. There are nowonly 3 shrimp vessels operating in the Faroese fleet (down from 10 in the years 2003 and 2004).The shrimp opportunities were not fully utilised during 2007 and 2008 because 2 of the shrimpvessels were laid up for repair. However in 2009, Faroese authorities report the opportunitieswere fully utilised, and about 50% utilised in 2010. These vessels also have fishing opportunitiesfor shrimp in Flemish cap (NAFO 3M), Svaalbard (1,300 fishing days) and in the Barents SeaFinal Report - page68
Fisheries Partnership Agreement FPA 2006/20
FPA 35/GRE/11
Russian waters (around 1,000 tonnes per year). Additional quota of 100 tonnes/year of shrimphas been available under the Greenland – Faroes Fisheries agreement. The preference is tofish in East Greenland due to the higher prices, and the opportunity of landing close by inIceland. The shrimp quota in Greenland can be regarded as being in high demand.The Redfish quota was not fully utilised in 2007 and 2008, but was reported to be so in 2009and 2010. The demand for the opportunities is closely linked to the fuel price, and the vesselsretain a high interest in this resource. The Faroe Islands vessels have used the Greenlandhalibut quota to the full extent.
5.3.4 Catches under the Fisheries Partnership AgreementCatches made by EU (and third country vessels) are also shown in Table 24, (with a summaryin Table 7).Vessel operators draw quota in advance, and are not always able to use the entire quotas.Therefore actual catches under the Fisheries Partnership Agreement are in many cases lowerthan the licences drawn. Overall, the Protocol has delivered average annual catches of 48,502tonne/year in the Greenland zone, of which 16,472 tonnes were caught by EU vessels and32,030 tonnes by third country vessels49. On average EU vessels caught 63% of the quotasavailable to them, and third country vessels 88%. Since EU vessel operators pay for quota theyseek to minimise the underutilisation of licences which they have drawn, but must over-purchase to guarantee that they can maintain operations. Overall about 17% of the quotaavailable to EU vessels is paid for, but does not deliver catches. Third country vessels suffer nopenalty by over-drawing quota.Considering the results of a recent study50, the average total catch of the EU fishery sector wasestimated to be 5,084,316 tonnes in the period 2004 to 2006. The annual catches taken inGreenland by EU vessels are estimated to correspond to about 0.3% of total EU catches.Analysis of Table 24 shows that there are significant differences in utilisation rates dependingon the species and the fleet sector using the opportunity.Greenland halibutThe Greenland halibut fishing opportunities in both East and West Greenland are in highdemand and are almost fully exploited, with very small amounts of underutilisation. The mainEU fleets utilising these resources are the demersal trawl sectors of Germany, Poland and UK.Eleven vessels have exploited these opportunities and the interest has been sustained over theperiod of the Fisheries Partnership Agreement. Greenland halibut opportunities were alsotransferred to Norway and Faroe Islands and have been fully exploited by these parties.CodThe fishing opportunities for cod, which are exploited by UK and German vessels are also inhigh demand in general have been exploited more or less fully (overall 91%). A low utilisation ofcod opportunities by UK German vessels in 2010 is due to a change in the management regimewhich meant that vessels were unable to fully utilise the opportunities. Both Greenland halibutand cod may occasionally suffer from slight under utilisation, due to vessel breakdown or otherad hoc events towards the end of the season, but these are generally only minimal.Shrimp
In calculating averages the consultants have only taken account of years in which quota wasavailable. In relation to capelin therefore, average values are calculated over the two years 2007and 2008 (not over the period 2007 to 2010).50Overall evaluation of the Fisheries Partnership Agreements. FISH/2006/20 SC17. OceanicDéveloppement and Megapesca Lda.Final Report - page69
49
Fisheries Partnership Agreement FPA 2006/20
FPA 35/GRE/11
Shrimp fishing quota in West Greenland (NAFO) has also been very well utilised, with all quotadraw and almost all quota drawn utilised by the single Danish vessel operating in this fishery)indicates that these opportunities are 100% utilised, and about 94% of the quota is actuallycaught.However shrimp quota in East Greenland is not effectively utilised. The Danish vessel, whichoperates only in Greenland, drew only 64% of available quota over the period, and only caught41%. Estonia, Lithuania and Spain have previously expressed an interest in receiving shrimpquota through a re-allocation procedure. However, in 2007 these countries did not use any ofthe shrimp quota available to them at all. In 2008 Estonia, Lithuania and Spain did not seekshrimp licences at all. Only in 2010 did Estonia actually start to utilise the opportunitieseffectively (when licences were transferred earlier in the season, thus allowing their moreeffective utilisation). Even so, Estonian vessels were only able to catch 47% of the quotaavailable. In general the reason for the low utilisation is that the opportunities are less attractivesince the resource is much less fishable in East Greenland, due to ice floes, poorer weather andthe lower density of aggregations of shrimp. The shrimp fishery in E.Greenland is more difficultto predict and returns are more volatile. Variations in interest should also be considered in thecontext of a fall in prices during the first part of the protocol (reportedly with a 25% fall between2006 and 2008) and subsequent recovery. Similarly, the Norwegian shrimp quota inE.Greenland (average 3,275 tonnes) is used only at the rate of 43%. The low utilisation of theEast Greenland shrimp quota is a major concern, since it contributes a nominal 16% of thevalue of the Fisheries Partnership Agreement (at reference prices).RedfishRedfish quotas appear to have also only been partially utilised. Germany has regularly swappedout a significant proportion of the redfish quota to Spain, Portugal, Poland, Latvia and Lithuania.However it has used only used a maximum of 5% of its retained quota (in 2010). Spain drewlicences for 87% of its redfish quotas available throughout the Protocol, but only caught 42%.Spain has only caught the Greenland redfish quota in international waters. Portugal drewlicences for 92% of the quota and actually caught 62%, although the utilisation variesconsiderably (it did not fish for this species under Greenland quota in 2009). Poland only used asmall proportion of the redfish quota (16% overall). The only country which utilised the redfishquotas to a moderately high level was Latvia, with 96% of licences drawn and 86% of availablequota caught. A significant proportion of the redfish quota swapped out by Germany was utilisedin international waters.Small amounts of redfish quota allocated to France and to UK (averaging a few tens of tonnesonly) are of no interest; utilisation of such small quantities (which must be taken by pelagictrawl) is not feasible. France and UK would be happy to transfer these quota, but there hasbeen no interest. Overall, across all fleet segments using the Fisheries Partnership Agreement(including third countries) apparent utilisation of redfish quota was 81% of licences drawn, and46% of quota taken as catchesThe fishery has suffered from declining catch rates (attributed to levels of fishing effort whichconsiderably exceed the scientific advice) and was at the mercy of significant fuel priceincreases over the course of the Protocol. Nevertheless, the introduction of the redfish flexibilityscheme from the beginning of 2008 (allowing collective licences and Greenland quota to betaken in NEAFC zones) has clearly helped to improve utilisation. This is confirmed bystakeholders.However there were also some differences in interpretation between the EU and Greenland withregard to implementation of the flexibility scheme. One of the rules of the scheme is that vesselsmust exhaust their NEAFC quota before starting to fish their Greenland quota in internationalwaters. A separate NEAFC redfish management measure put in place in 2008 included theclosure of fishing for redfish in the area which lies North of 59�N and East of 36�W after 15 July2008, to protect spawning stock. Part of this area falls within the Greenland EEZ. A Portuguesevessel which had obtained Greenland redfish opportunities for use after this date, with theintention of exploiting them in Greenland waters, found that their licence applications wererefused by Greenland, who applied with NEAFC rule. Since the vessel had not exhausted itsNEAFC quota it was therefore not able to use the licence in the NEAFC area outside the
Final Report - page70
Fisheries Partnership Agreement FPA 2006/20
FPA 35/GRE/11
restricted zone (notwithstanding reservations about the availability of resource). Icelandsupported this view. The issue was discussed at the EU-Greenland FPA Technical Meeting on29-30 July 2008 but was not resolved. However the problem has not recurred due to theintroduction of a clearer set of rules in relation to the management box described in Figure 5(Section 4.1.1). Although it did cause some underutilisation, especially by the Portugueseoperator concerned, the amounts concerned were low (100 tonnes) in relation to the total quotaavailable, and it appears that this management measure was not a primary factor leading to theoverall low utilisation of the redfish opportunities.The fall in fuel prices in late 2008 has also meant that the redfish opportunities became morefinancially viable in 2009, but recent increases may again have impacted on utilisation. Thesegment remains highly sensitive to fuel costs, and excessive levels of exploitation.Snow crabThe snow crab fishing opportunities under the FPA have never been utilised by Spain. Spainhad 1 vessel in this fishery up until 2006, the last year it had a Greenland licence, when under ajoint venture arrangement, it was authorised to fish inside the 12 mile limit. This opportunity isnot available under the FPA arrangements. Furthermore Greenland has applied managementmeasures resulting in closed areas and seasons to snow crab fishing. The closure of the fisheryfor a period during a fishing campaign (which requires fitting out for special gears) renders thefishery unprofitable for EU vessels. Whilst there is potential interest in the fishery, the presentmanagement arrangements render it commercially unviable. It is also notable that market priceshave fallen significantly since 2006. A small quota allocated to Ireland appears to generate nnointerest.Atlantic halibutSome trials on Atlantic halibut in Greenland in 2005 by 2 Portuguese longliners were notsuccessful. The fishery for this species by longline (which is the only permitted method) is notconsidered viable by Portuguese operators. Opportunities in E.Greenland are however utilisedby Norwegian vessels, although in W.Greenland these vessels only catch 7% of their quota.
5.3.5 BycatchesUp to 2,300 tonnes of bycatches are allowed under the terms of the Fisheries PartnershipAgreement. Note that retention of bycatches of species which are specified in the FisheriesPartnership Agreement must be covered by a licence. No licences are required to be drawn forother species subject to the maximum amount not being exceeded. Reported annual bycatchesaveraged 20 tonnes (EU) and 76 tonnes (Norway). Overall only 4% of this was utilised,suggesting that the fisheries are relatively clean (at least in terms of commercial species).The composition of bycatches based on the Greenlandic data is shown in Table 25. Themajority of the bycatches are haddock, Greenland shark, wolfish and other non-specified marinefish. All are taken in cod, Greenland halibut and redfish trawls. There is no retained bycatch inthe shrimp fishery (which is exempted from the general ban on discards due to processingonboard limitations). The quantity falls well within the limit allowed by the Fisheries PartnershipAgreement, and this limit could be adjusted downwards, although this would have little materialimpact.
Final Report - page71
Fisheries Partnership Agreement FPA 2006/20
FPA 35/GRE/11
Table 25: Composition and quantity of bycatch declared by EU vessels in the GreenlandEEZ (2008)Bycatch (kg)Code SpeciesAESALCAPOBLICASCATCFBGSKHADMZZREDREGAesop shrimpBaird's slickheadCardinalfishes, etc. neiBlue lingSpotted wolffishWolffishes (=Catfishes) neiBlack dogfishGreenland sharkHaddockMarine fishes neiAtlantic redfishes neiGolden redfish(2008)-1,6888001,4102,82717,6751,63062,39064,58374,97013,39916,02710,90012,17211,134600292,205%0100161212226554440
RHG Roughhead grenadierRNG Roundnose grenadierSHXSKATotalSource GFLK, 2009
Dogfish sharks, etc. neiRaja rays nei
5.3.6 Intra-community quota exchangeFishing opportunities in Greenland are allocated to EU Member States within the frame of theEU´s annual TACs and quota regulation, according to the relative stability keys. Fleet operatorsin Member States are permitted to transfer fishing quotas received under this regulation,providing certain conditions are met, with a view to ensuring efficient utilisation. Greenlandquotas for three species, redfish, shrimp and Greenland halibut have been actively exchangedduring the course of the FPA, as shown in Table 26.In total some 10,024 tonnes of quotas were exchanged in 2007, and 7,377 tonnes in 2008,9,470 tonnes in 2009 and 17,097 tonnes in 2010. These figures include the 'international swaps'of licenced quantities between Member States. The latter figure represents a rise from about30% of the quota available to EU fleet under the Fisheries Partnership Agreement to about65%. The major differences in 2010 were a significant increase in activity in redfish exchange(as fuel prices eased thus increasing interest in this resource) and the establishment of a newregular swap arrangement between Denmark and Estonia for shrimp in East Greenland. Themain patterns of exchanges were therefore:•the swapping away of redfish quota by Germany, to Spain, Portugal, Lithuania, Poland andLatvia. The redfish exchange has accounted for about half of the exchanges in volumeterms, in each year of the Fisheries Partnership Agreement. Here the notable feature is thesignificantly reduced level of exchanges to Spain and Portugal in 2008. Germany mostlyreceives quota for small pelagic fish in EU and NEAFC waters in return (mackerel, horsemackerel and blue whiting).the transfer away by France of shrimp quota in E. and W.Greenland to Denmark,accounting for 3,000 tonnes per year. Since this is utilised by a vessel which has Frenchinterests, there is no return swap. However, in 2007 Denmark (and France) alsoFinal Report - page72
•
Fisheries Partnership Agreement FPA 2006/20
FPA 35/GRE/11
subsequently swapped away some shrimp quota in E.Greenland to Spain, Estonia andLithuania (with no quota in return). Since they took place too late in the season these swapswere not repeated to any degree in 2008 and 2009, but from 2010 they were replaced by anagreement to transfer quota to Estonia earlier in the year.•the transfer between Germany and Poland of quota in Greenland halibut in E.Greenland,plus small exchanges between UK and Germany, all taking place within vessels operatingwith common beneficial ownership.
An analysis of quota swaps indicates that some swaps are undertaken at the beginning of theyear, as apart of long standing arrangements between EU Member States. These swaps arelargely planned in advance by the fishing companies concerned and their implementation doesnot impact on utilisation. These arise mostly, but not exclusively, as a result of establishedarrangements between fleet segments of different EU Member States. In some cases, this takesthe form of a consolidation of EU fishing interests since the relative stability keys weredetermined, resulting in joint ventures and co-ownership (for example co-ownership of UK,German and Polish fishing interests targeting cod and redfish in Northern waters, and FrenchDanish joint ownership of the Danish flagged shrimp vessel operating in Greenland).However, other exchanges depend on the MS and fishing companies to which quotas areallocated deciding at a certain point during the year that some of the allocation is surplus torequirements, and offering them for swaps. Since the quota period runs from 1 January to 31December, if the quota is offered for swapping late in the year it is unlikely to be taken up. Forthis reason, in Council Regulation (EC) No 753/2007 of 28 June 2007 which adopted theFisheries Partnership Agreement into EU law, the EU has set dates by which, if licences are nottaken up by the Member State to which they are allocated, they may be re-allocated to otherMember States. For the main underutilised opportunities concerned, redfish and E.Greenlandshrimp, these dates are shown in Table 24.The Regulation allows the Commission to consider applications by Member States other thanthose to which the opportunities are allocated, for quotas which are not drawn by the date limitsset. Moreover, according to the provisions of Article 10 of Council Regulation (EC)No.1006/2008 concerning authorisations for fishing activities, the Commission is empowered ingeneral to re-allocate non-utilised fishing opportunities to other Member States, wishing to makeuse of these opportunities.In practice, the Member State (and therefore the fishing enterprise allocated the quota) isrequired to notify the Commission by the date specified whether it commits to taking up theentire quota. The quota in excess of requirements is then released for offer to other MemberStates.In general, apart from complaints from the Estonian shrimp sector during the first two years ofthe Protocol, that quota was received too late to be of use. It now appears that the EU fleetinterests have established patterns of exchanges (with or without a consideration of quota inreturn) which for the most part meets the needs of the fleet segments concerned.
Final Report - page73
Fisheries Partnership Agreement FPA 2006/20
FPA 35/GRE/11
Table 26: Greenland quotas exchanged between EU Member States 2007-20102007SpeciesRED V, XIVRED V, XIVRED V, XIVRED V, XIVRED V, XIVRED V, XIVRED V, XIVRED V, XIVRED V, XIVRED V, XIVRED V, XIVPRA N0,1PRA V, XIVPRA V, XIVPRA V, XIVPRA V, XIVPRA V, XIVPRA V, XIVPRA V, XIV, NO 1GHL V, XIVGHL V, XIVGHL V, XIVGHL V, XIVCODTotalSource: European Commission DG MARE
2008 2009900100
20101,4002001,5082,7501,2001501,5501,5082,0001,2821,76400005,0469600951,055730
FromDEDEDEDEDEDENLPRTNLPOLFRFRDKDKDKFRAFRADEDEUKDE
ToESPPRTLITLATPOLNLLITLATPRTLATDKDKESTESPLTUESTLTUMSPOLUKDEMSUK
Quantity (tonnes)3,000 1,2001,08240020064000007020000000554
500 1,05000000938555 1,540
total MS
5,392 3,009 4,528 10,2662,000 2,000 2,000875 1,000 1,0821005010010010000001000000
3,325 3,000 3,1821,217 1,366 1,002163000201520606
1,380 1,368 1,154
10,097 7,377 9,470 17,097
Table 27: Latest release dates for intra-community quota swaps (shrimp and redfish)SpeciesShrimp (EastGreenland)RedfishDate beyond which the quota may be re-allocated in accordance withRegulation 753/20071 August(except if the level of utilisation based on licence applications is >65% by 1 August then the date is postponed until 1 September)1 September
Source: Council Regulation (EC) No 753/2007 of 28 June 2007
5.3.7 International exchange of licencesIn addition to the transfers of quota between fleet operators described above, there have alsobeen a limited number of transfers of issued licences. These took place in 2009 and 2010,following the agreement from the Greenlandic Authorities that this facility would be offered on a
Final Report - page74
Fisheries Partnership Agreement FPA 2006/20
FPA 35/GRE/11
limited basis. The licence transfers are set out in Table 28 below. In total, 304.5 tonnes of quotahave been exchanged after issue of licences. The stakeholders concerned report theirappreciation of the flexibility shown by the Greenlandic authorities for this facility, but seek tohave the procedures formalised in future.Table 28: Exchange of issued fishing licences for Greenland opportunities betweenMember StatesYear20092010TOTALSource: European Commission, DG MAREQuotaFromToESTDEPOLDEQuantity(tonnes)100.094.8100.09.7304.5
PRA V, XIV DKGHL V, XIV GBRGHL V, XIV DEGHL V, XIV POL
6 FINANCIAL AND ECONOMIC IMPACTS OFTHE EU- GREENLAND FPA6.1 Market values of species subject to the FPA6.1.1 Sources of price dataPrices used for the valuation of the Fisheries Partnership Agreement reflect the prices obtainedby the main fleets utilising the opportunities and the markets into which the catches under theFisheries Partnership Agreement are sold. Bearing in mind the possibility of indexing thereference prices in future, ideally, the prices would be weighted according to the MS and thirdcountry shares of quota and utilisation. However, whilst theoretically possible this would requirea reliable source of data for the outputs of all fleet segments using the Fisheries PartnershipAgreement.A brief review of the availability, reliability and validity of price data was undertaken byconsultants for the different fleet segments operating at the time of the mid-term evaluation. Themost consistent and relevant prices series data was found to be that collected by StatisticsIceland, based on landing declarations by Icelandic vessels (the exception being the price forsnow crab, from a Canadian source). This data reflects the species, product form, seasonalityand regional variations of the products from the Greenlandic fishery and is available online (inthe form of monthly quantities and values of landings from the Statistics Iceland website athttp://www.statice.is/Statistics/Fisheries-and-agriculture/Catch-and-value-of-catch.Snow crabprices were determined from DFO, Canada (200&) although for valuation purposes the unitprice is immaterial (since catches were zero).Prices for all species fluctuated both upwards and downwards. It was therefore decided toestimate a composite average price for each species over the period of the protocol, based onthe simple arithmetic mean of the annual average prices over the four years studied. Table 29shows the consultants’ abstracts of the market prices used for the assessment of value. Fulldata illustrating the method of calculation and exchange rates used is shown in Annex 2.
Final Report - page75
Fisheries Partnership Agreement FPA 2006/20
FPA 35/GRE/11
Retained bycatches are reflected in the valuation of the compensation, with a nominal valueattributed by the parties of EUR 2,204/tonne51applied by the parties. However no referenceprice is attached to them for the purpose of licence fees, since there are no licence feeschargeable to operators for bycatch. There is no data on the actual market value of bycatchesmade under the Fisheries Partnership Agreement, but a value could be assumed. It is proposedthat this is EUR 1,800/tonne, being the average price of the demersal opportunities (with theexception of Atlantic halibut).
6.1.2 Price variations over timeDuring the negotiation of the FPA it was agreed between the parties that were the referenceprices to vary by more than 5% They could be adjusted, within the framework of the JointCommittee52. However the methodology for deciding on whether prices had varied by morethan this criteria was not established, and as a result discussions regarding price changes couldnot be concluded.As Table 29 shows, several of the average prices appear to have varied from the agreedreference prices, by a factor greater than 5%. Thus the conditions for a revision of the pricesappear, to have been fulfilled in the case of in the case of redfish and capelin (undervalued bythe protocol) and shrimp, snowcrab and bycatch (overvalued by the protocol). Should theparties agree, the prices indicated in the table below could have provided the basis for adjustingthe reference prices of the opportunities in the Fisheries Partnership Agreement. However, nosuch agreement has been made and the reference prices have remained the same throughoutthe period of the Protocol.However, although these levels reflect the average historic prices better than the referenceprices, it does not necessarily mean that they will more accurately reflect current or futuremarket conditions. The sources quoted could however provide the basis for indexing ofreference prices in future, should the parties agree.
Source; DG MARE, European CommissionAgreed record on the negotiations of a fisheries partnership Agreement between the EU andGovernment of Denmark and the Home Rule Government of Greenland, Ilulissat, 29 May to 2June 2006.52
51
Final Report - page76
Fisheries Partnership Agreement FPA 2006/20
FPA 35/GRE/11
Table 29: Market values of fish caught under the EU-Greenland FPAProtocolSpeciesreferenceprice1,8001,0531,0781,6004,3485,9242,5712,5121002,4102,2041652,453922,6521713,0742222,6731632,1121,800+ 4.0+ 62.8- 12.4- 10.01233,7122,5664,9524,289- 1.411,2931,0059521,0419991,3011,1791,1061,106+ 5.1- 30.9112007200820092010Mean Marketprice(2007/2010)1,764% changeSource
EUR/tonneCodPelagicRedfishShrimpAtlanticHalibutGreenlandHalibutCapelinSnowcrabBycatch2,4371,7191,3491,552- 2.011
Sources:1. Iceland Statistics2. 2006 data from DFO, Canada3. Average of demersal prices (exc. halibut)
6.2 Financial and economic impacts on EU6.2.1 Overview of costs and benefitsTable 30 shows a summary of the financial and economic impacts of the Fisheries PartnershipAgreement on the EU (and Greenland). It is based on the catch data and estimates of unitprices described in the previous section, along with the following assumptions:••the share of revenue generated as added value is 45%53that EU benefits through the balanced exchange with third countries are equal to thebenefits derived by those third countries fisheries in Greenland under the FisheriesPartnership Agreement
Detailed discussion is provided in the following sections.
Mean value added of UK and German trawl vessels 2007 and 2008. derived from "The 2010Annual Economic Report on the European Fishing Fleet" Edited by John Anderson & JordiGuillen - Report EUR 24554 EN):Final Report - page77
53
Fisheries Partnership Agreement FPA 2006/20
FPA 35/GRE/11
Table 30: Average annual costs and benefits to the EU and Greenland of the EU-Greenland FPAPartyEUCommissionCompensationLess capelin debt adjustmentNet compensationSector supportSub-totalVessel operatorsLicence feesTOTAL EU CostBENEFITSProduction (tonnes)Revenue (EUR)Value added (45%)Employment1Average value of production (EUR/tonne)GreenlandCompensationLess capelin debt adjustmentNet CompensationSector supportLicence feesTotalBENEFITSProduction (tonnes)Revenue (EUR)Value added (=financial income)EmploymentResource rent (EUR/tonne)Rent as % of sales pricesIndicatorsAccess costs (compensation plus licence fee)Access costs (EUR/tonne)% Fleet contributionCost advantage (EUR/tonne)Cost advantage (% of sales value)Cost benefit (overall)Cost benefit (EU budget)0 tonnes15,820,683EUR15,820,683EUR0 FTE326 EUR/tonne35 %12,559,234 EUR25915 %286 EUR/tonne30 %1.31.511,045,795 EUR417,376 EUR10,628,419 EUR3,261,449 EUR1,930,814 EUR15,820,683EUR48,502 tonnes45,711,626 EUR20,341,674 %330 FTE942 EUR/tonne1,930,814 EUR15,820,683 EUR11,045,795 EUR417,376 EUR10,628,419 EUR3,261,449 EUR13,889,868 EURVariableValueUnits
Source: European Commission, DG MARE and consultants’ estimates*include benefits to third country vessels (proxy for EU benefits from balanced exchange)1estimated at an average of 10 FTE/vessel
Final Report - page78
Fisheries Partnership Agreement FPA 2006/20
FPA 35/GRE/11
6.2.2 Value of catches made by EU vesselsBased on the average market prices, Table 31 below shows the annual value of the catchesunder the agreement attributable to each EU Member State (as well as that due to thirdcountries).Overall, the Fisheries Partnership Agreement generated average annual revenues to fishingfleets of EUR 45.7 million, About 70% of the revenues are derived by the EU fleet, and 30% bythird countries. Overall, in EU vessels made annual catches averaging 16,452 tonnes, valuedat EUR 31.96 million (average value EUR 1,942/tonne). The EU Member states that benefit themost are Germany (42% of the value of catches under the Fisheries Partnership Agreement),Denmark (11%), Poland (7%) and UK (4%). All other EU Member States each account for about2% or less of the value of catches. About 54% of the revenues from the Fisheries PartnershipAgreement are obtained by Germany and Denmark, which are the main direct EU beneficiariesof the Fisheries Partnership Agreement.However, as noted, some of the quota received by the EU is exchanged with Norway, FaroeIslands and Iceland; the value of this is discussed below.Table 31: Average annual value of the catches under the Fisheries PartnershipAgreementAverage annual Average annualCountryGermanyUnited KingdomDenmarkFranceSpainIrelandPortugalLithuaniaEstoniaLatviaPolandTOTAL EUNorwayIcelandFaroe IslandsTOTAL 3rd COUNTRIESTOTALcatch (tonnes)7,6001,0254,497-684-431982107321,17616,4524,72526,1031,20232,03048,482value (EUR)19,384,7462,146,2964,972,294-756,900-477,208108,646231,642809,8683,070,68131,958,2817,801,3794,248,2911,667,67513,717,34545,675,626% of total42.44.710.90.01.70.01.00.20.51.86.769.917.19.33.630.099.9
Source: Consultants estimates based on prices in Table 29NB: Iceland catches averaged over 2 years (2007/2008); Norway catches over 3 years (2007/2008/2010)
On the basis of the assumed estimated value of bycatches of EUR1800/tonne (describedabove) the average annual bycatch of 90 tonnes was about EUR 172,800 (shared between EUand Norwegian vessels).
6.2.3 EU benefits from exchange of Greenland quota with other countriesTable 32 below shows the degree of dependency of these third country exchanges on the quotareceived by the EU from Greenland. A more detailed breakdown is shown in Annex 3. TheFinal Report - page79
Fisheries Partnership Agreement FPA 2006/20
FPA 35/GRE/11
dependency is shown in terms of actual quantities of quotas exchanged and in terms of codequivalents (since the exchange with these third countries is a balanced exchange in which theparties have chosen to take account of the agreed nominal relative values of quota in differentfish species, so as to ensure that the exchange reflects, to an agreed extent, the relativeeconomic benefits to be derived from different opportunities).In cod equivalent terms, the EU-Norway exchanges were 86 to 91% dependent on Greenlandquota (overall 89%); Faroe Island exchanges were 29 to 46% dependent (overall 37%) and theIceland exchanges (except for 2009 and 2010 when the parties were not able to conclude anAgreement) were 100% dependent (in the Agreement between Iceland and the EU species onlycapelin from Greenland and redfish quotas are exchanged). Overall the third country exchangeshave been 70% dependent on the quota from Greenland. The exchanges within the EU-FaroeIslands Agreement became more dependent on Greenland over the four years.In these cases, the dependency in cod equivalent terms is significantly higher than in actualquantity terms since the EU exchanges relatively low value quotas from its own waters (forexample sprat and blue whiting) compared to the high value quotas derived from Greenlandwaters (shrimp and Greenland halibut). Therefore the exchange of quota under the EU’sAgreements with Norway and Iceland is highly dependent on the EU Greenland FPA. Theexchanges with Norway, which accounts for 56% of all North Atlantic exchanges by the EU, isparticularly important for the EU demersal fleet segments which are able to benefit from theexchange of quota for fishing opportunities for cod and haddock in North Norway.Without the fishing opportunities from Greenland, these elements of the EU’s FisheriesAgreements could not sustained. In 2009 and 2010, the EU was unable to accept all of thequota offered by Norway since it has not been able to provide the corresponding opportunitiesfor the balanced exchange54. However, with regard to the other third countries, other factorshave impact on these agreements. In 2009, the EU and Iceland were unable to agree ontechnical conditions of access which have prevented EU vessels from taking up fishingopportunities offered, and in 2011 EU and Faroe Islands were not able to agree on thecomposition of the balanced exchange. At present therefore, it is only with regard to theAgreement with Norway in which any limitation in quota availability from Greenland will directlyimpact on the opportunities available to the EU fleet.Nevertheless, the value of these opportunities to the EU fishery sector should not beunderestimated. The consideration in the exchange with Norway has amounted to 16,593tonnes of cod equivalents per year, worth EUR 29.3 million, at a nominal cod value of EUR1,784/tonne used in this study (out of a total value of exchanges in the three agreements valuedat EUR 52 million). Out of these sums, the Greenland FPA has contributed fishing opportunitiesin terms of cod equivalents nominally valued at EUR 36.2 million, with the balance from stocksin EU waters. Thus, the economic sustainability of the so-called “EEA balance” and fleetsegments which use these fishing opportunities is highly dependent on the exchange of thequota derived under the EU Greenland FPA. Without these opportunities, the fleet segmentsconcerned would, out of necessity, be compelled to undergo a significant reduction in number ofvessels.
54
Agreement in the form of an exchange of letters between the European Economic Communityand the Kingdom of Norway relating to the Agreement on fisheries between the EuropeanEconomic Community and the Kingdom of Norway, Oporto, 2 May 1992, signed in parallel withthe signature of the EEA Treaty, under which Norway grants the EU a share of 2.9% of theoverall quota for North-East Arctic cod (including bycatches) in the Norwegian Economic Zone(allocated according to relative stability, known as “EEA cod”), and an additional quota of cod(only) corresponding to 1.24% of the TAC (allocated to EU members acceding in 1986, andknown as “cohesion cod”).
Final Report - page80
Fisheries Partnership Agreement FPA 2006/20
FPA 35/GRE/11
Table 32: Dependency on Greenland quota of bilateral exchanges of fishing opportunitieswith third countriesAverage2007NorwayFrom GreenlandStocksFrom EU StocksTotal% from GreenlandFaroe IslandsFrom GreenlandStocksFrom EU StocksTotal% from GreenlandIcelandFrom GreenlandStocksFrom EU StocksTotal% from GreenlandOverallFrom GreenlandStocksFrom EU StocksTotal% from Greenland22,38312,03434,41765%21,1659,12930,29370%19,8987,63027,52872%18,7046,92425,62873%20,5388,92929,46770%2,84902,849100%2,37202,372100%0000%1,15001,150100%1,59301,593100%3,8799,40213,28129%3,8797,59111,47034%4,3596,10010,45942%4,5205,3949,91446%4,1597,12211,28137%15,6552,63218,28786%14,9141,53816,45291%15,5391,53017,06991%13,0341,53014,56489%14,7861,80716,59389%2008200920102007-10Tonnes (cod equivalents)
Source: EU Greenland FPA; Agreed Records of negotiation between the EU and Norway, Faroe Islandsand Iceland; consultant’s estimatesNote: Cod equivalent ratio is a ratio of nominal values of fishing opportunities used by the EU and thirdcountries to compute a balanced exchange in the context of bilateral fisheries agreements
6.3 Financial and economic impacts on Greenland6.3.1 Financial contributionGreenland has benefited from the transfer of the financial contribution of EUR 14,307,244 ineach of the four years of the Fisheries Partnership Agreement so far. This comprises twoelements. The first, the financial compensation relates to the compensation for the fishingopportunities transferred. This amounted to EUR 11,083,000 in 2007 and EUR 11,045,795 insubsequent years. The second relates to an element to wards implementing a sectoral fisheriespolicy in Greenland and this amounted to EUR 3,224,244 in 2007 and EUR 3,261,449 in 2008-2010. However in 2010 the parties agreed on an adjustment to the 2011 compensation toaccount in part for the cancellation of the capelin and cod debt accrued during the period 2007to 2010. This adjustments means that average annual compensation should be reduced byEUR 417,376/year.The net annual financial contribution from the EU over the period 2007 to2010 was therefore EUR 13.9 million.
Final Report - page81
Fisheries Partnership Agreement FPA 2006/20
FPA 35/GRE/11
6.3.2 Licence feesUnder the terms of the Fisheries Partnership Agreement, Greenland may charge access fees toEU vessels. These are set at 5% of the “converted” unit prices of each species targeted (plus1% administration fee), in accordance with the Protocol. Data on licence fees from theEuropean Commission (which is summarised in Table 33) indicates that the Government ofGreenland earned a net income of about EUR 1.93 million/year from the licences drawn by EUvessels. This is only slightly less than the EUR 2 million foreseen by the Protocol (see footnoteto Article 2). About 50% of these fees were earned from German demersal trawl vessels and20% from the Danish shrimp vessel.The specification of reference prices in the Protocol which in the event differed from the averagemarket prices has impacted on the licence fees charged by Greenland. Due to this difference,Greenland has in effect under-charged for the redfish and the Greenland halibut licences, andover-charged for cod and shrimp licences. Had licence fees been based on market prices thenet overall effect would have been to reduce income to Greenland from licence fees by aboutEUR 100,000 in each year. This difference is due to the combined impact of the pricedifferences and the pattern of demand for licences. Table 33 illustrates the differences.Therefore in addition to the financial contribution Greenland has benefited from licence feespaid by EU vessels, averaging EUR1.93 million/year.Table 33: Licence fees paid by EU vessels operating under the EU-Greenland FPALicence feeFees2007200820092010AveragebasisLicence feesActual payments 1%based on protocol administrationreference pricesfeeTotalLicence feesHypotheticalpaymentsbased on marketprices1%administrationfeeTotalSource: European Commission and consultants estimates
1,962,366 1,877,862 1,902,04519,62418,77919,020
1,904,52719,0451,923,572
1,911,69719,1171,930,8141,817,64618,1761,835,823
1,981,990 1,896,641 1,921,065
6.3.3 Financial and economic impactsOverall, summing financial contribution and the licence income the Fisheries PartnershipAgreement has delivered financial benefits to the Government of Greenland of EUR 15.8million/year. This equates to a resource rent of EUR326/tonne of fish caught, corresponding to35% of the ex vessel average price. This is considered to be relatively high by internationalstandards.Based on the 2008 Gross National Income of EUR 1.6 billion, the Fisheries PartnershipAgreement has accounted for just under 1% of the national income. In terms of the nationalgovernment budget (with a value of EUR 1.2 billion in 2008) the Fisheries PartnershipAgreement accounts for some 1.3% of the budgetary income. The financial contribution was
Final Report - page82
Fisheries Partnership Agreement FPA 2006/20
FPA 35/GRE/11
received into the consolidated account of the Government of Greenland and the income isaccounted for in the national budget55.Budgetary income from the Greenlandic fishery sector is estimated at DKK49.9 million EUR 6.6million, due to license fees, and dispensation for not meeting the shrimp landing obligations.Accounting for the EU –Greenland FPA (net contribution of EUR 15.8 million) this indicates thattotal budgetary income from the fishery sector was about EUR 22.4 million in 2010. The EU andEU vessels support 70% of this, which is disproportionate to the share of catch value (12%)taken under the Fisheries Partnership Agreement.As well general budgetary support, the Fisheries Partnership Agreement requires Greenland toallocate EUR 3.26 million/year of the contribution towards improving and implementing asectoral fisheries policy in Greenland (EUR 3.22 million exceptionally in 2007). Annual amountsof EUR 500,000 and EUR 100,000 annually are to be applied to the Greenland Institute ofNatural Resources and for training of fisheries officials respectively (plus an amount in 2007 ofEUR 186,022 for the development of a cod management plan). The remaining measures to besupported by the Fisheries Partnership Agreement were discussed and agreed by the parties atthe Joint Committee meeting of 3 and 4 July 2007. The Government of Greenland provided anupdated status report on the implementation of the sectoral policy in November 2010, and this issummarised in Table 34.As shown in Table 34, the budget for sector support was EUR 3.22 million in 2007 and EUR3.26 million from 2008 onwards. These amounts include funds earmarked for specific purposessuch as training, GINR, preparation of a fisheries law and the cod management plan.Table 34: Greenland budget allocations specified in the context of FPA fishery sectorsupportBudget heading2007General sector measuresGINRTrainingCod management planTotal2,438,222500,000100,000186,0223,224,244Allocation EUR20082,661,449500,000100,00003,261,44920092,661,449500,000100,00003,261,44920102,661,449500,000100,00003,261,449
Source: Department of Fishing, Hunting and AgricultureAnalysis of the Status Reports (February 2009 and April 2009) and the State budget(Landstingsfinanslov 2008) indicate that Greenland has allocated an annual total budget ofapproximately DKK 34 million (EUR 4.55 million) for fisheries sector support and administration.This amount is the sum of the allocations by the state budget for funding of the Fish and ShrimpDepartment of GINR (about DKK 16 million - EUR 2.14 million) and GFLK (about DKK 18 million- EUR 2.41 million). This provides clear evidence that Greenland has therefore made thebudgetary allocations for the support measures in line with the Protocol to the FPA. The FPAappears to contribute about 72% of the fisheries budget.The FPA-linked financial contribution accounts for some 70% of the state budget contribution tothe fisheries sector. The fisheries administration and fisheries research in Greenland istherefore highly dependent on the FPA for its implementation budget.Furthermore the budget allocated from the sector support to the Fish and Shrimp Department ofthe Greenland Institute of Natural Resources (GINR) (EUR 2.14 million) accounts for some 40%
55
LANDSTINGSFINANSLOV 2009, Grønlands Hjemmestyre
Final Report - page83
Fisheries Partnership Agreement FPA 2006/20
FPA 35/GRE/11
of the total budget (EUR 5.6 million) of this Institute. The GINR has been highly dependent onthe Fisheries Partnership Agreement for its operations.
6.4 Financial and economic impacts on third countriesThe market values of the catches made by third countries which receive fishing opportunities inGreenland from the EU as part of the annual balanced exchange were shown in Table 28.Overall, vessels from Norway, Faroes and Iceland made average annual catches of 32,030tonnes, valued at EUR 13.7 million (EUR 428 per tonne). About 80% of the average annualvolume of transferred quota was capelin (this is calculated on the basis of the two years inwhich capelin was exchanged with Iceland). However Capelin, because of its relatively lowvalue accounted for only about 30% of the value of third country catches. Over the four yearsevaluated, the relative shares of the third country exchanges by value were 57% to Norway,31% to Iceland and 12% to Faroe Islands. Overall some 17% of the value of all catches underthe Fisheries Partnership Agreement fell to Norway, 9% to Iceland and 4% to Faroe Islands.
7 IMPACTS OF THE FISHERIESPOLICY SUPPORT MEASURES
SECTOR
7.1 Source of data on progress against indicatorsAs shown in Table 34, the budget for sector support was EUR 4,010 million in 2007 and EUR3.86 million from 2008 onwards. The consultants have reviewed the progress of implementationof the fishery sector support measures supported within the frame of the Fisheries PartnershipAgreement. These were agreed by the parties in the form of a matrix of overall objectives,results, measures (activities), indicators of achievements and monitoring sources.The sources of information regarding progress in the above measures used by the consultantswas the Sector Policy Programme Document “Sector Policy for the Fisheries in Greenland2007-2012” Agency of Fisheries Hunting and Agriculture. November 2009 (revised November20101) submitted by the Greenland authorities to the Joint Committee 25 November 2010. Thissets out progress using data from the period 2007 to 2010. The report was approved by theJoint Committee. Meetings and discussions were also held with staff in the Ministry of FisheriesHunting and Agriculture., the Nature Institute and GFLK (Greenland Fisheries Control Agency).
7.2 Overall objectives of the measuresThe overall objective of the support measures is “to promote the sustainable management andutilisation of the fisheries” This is coherent with the rationale for the financial support provided inArticle 7 of the Fisheries Partnership Agreement, ”securing responsible fishing and thesustainable exploitation of the fisheries resources in the Greenland EEZ”. It is also coherentwith the Common Fisheries Policy of the EU and Greenland fisheries policy as set out in theproposed new Fisheries Act.Three areas of support measures were selected by the parties and defined in the matrix ofmeasures (Administration for the fisheries, Control and enforcement, Biological advice).The results to be achieved in each of these areas reflect important threats and opportunitiesidentified in the evaluation of the 4thProtocol of the EU-Greenland Fisheries Agreement whichtook place in 2005. Some of the key findings of that study were:••Legal framework not fully reflecting international commitments, nor precautionaryapproach; lack of formal stakeholder involvement in management decisionsOvert, non-transparent and unstructured political interference from GreenlandLandstinget leading to sub-optimal policy decisions
Final Report - page84
Fisheries Partnership Agreement FPA 2006/20
FPA 35/GRE/11
•••••
Lack of market- orientated focus on structural adjustment of fleet (with less dependencyon subsidies)Possible recovery of cod fishery and the need for management arrangements to be inplaceNeed for training for Greenlandic indigenous personnel (external courses) leading tohigher staff retention.Elimination of logistical weaknesses and strengthening GFLK’s capacity to inspect onland to improve control efficienciesThe need for improved catch data and stock assessment as a basis for valid fisheriesmanagement decisions, particularly in relation to Greenland halibut, cod and redfish
The measures selected and included in the matrix therefore address these key findings from the2005 review, and they therefore contribute towards the improved sustainability of the fisherysector. However not all of the issues identified by the review are addressed in the matrix ofsupport measures. The following matters are not addressed:•••Restructuring of shore based facilities (improved value added)Vocational training for fishery sector/re-training for alternative employmentLack of national capacity for sanitary controls
However, the consultants recognise that it is not possible, nor desirable to seek to solve allproblems at one time. Furthermore, it was agreed by the parties that some measures would bedeferred until the passage of the new Fisheries Act, since they would be subject to the policiesdecided by Parliament. Therefore, to a significant extent, the measures selected by the partiesare therefore relevant to the current strategic needs of the sector.
7.3 Area 1: Administration for the fisheries 2007-20127.3.1 Objective: Promulgation of a Fisheries ActThe target was the adoption of a new Fisheries Act by 2007. Work started on the drafting of anew Fisheries Act in 2006. A draft Act was produced in 2007, and the European Commissionwas given an opportunity to comment on this in July 2007. Comments were made in relation toreporting requirements and preservation of anonymity of vessels, notice periods andcommunication channels for foreign fishing vessels in relation to area closures, and thepossibility of offering quota which is not utilised by Greenland quota holders to EU operators.The Government first presented the proposal for the new Act to the Greenland Parliament in theautumn of 2007. Parliament referred the proposal to the Parliamentary Commission onFisheries Hunting and Agriculture for detailed evaluation56. Seven working meetings were heldduring 2008, and the final (unanimous) report of the Commission was submitted to theParliament in mid-February 2009.The work of the Commission involved broad stakeholder participation from the fisheries sectoras well as wider economic considerations in Greenland and has been well received. The reportrecommended a phased implementation of the key measures contained in the proposal. Thefirst phase would introduce possible modifications to the ITQ system of quota management,establish new licence fee structures and set rules for concentration of quota shares (inshorefisheries). The second phase would address longer term sectoral strategy including structuraladjustment and educational programmes for fishers.
56
Fiskerikommissionens betænkning. Grønlands hjemmestyre, February 2009Final Report - page85
Fisheries Partnership Agreement FPA 2006/20
FPA 35/GRE/11
It was intended that the draft bill be debated by the Greenland Parliament in the spring 2009session, but this was postponed due to the calling of a general election in June. The re-draftingof the Act to account for the phased approach was also delayed due to the need for theincoming Government to revise policy. As a result the Act was not re-drafted until 2010. TheEuropean Commission was consulted on the draft along with other stakeholders. There we nomajor objections from the Commission (although some detailed comments were made inrelation to year to year flexibility on shrimp quotas. The draft was submitted for Parliamentaryprocess in 2010 and at the time of this study was passing through Committee stages.Therefore, whilst the new Fisheries Act has not been enacted so far, there has been asignificant amount of progress in the technical drafting and stakeholder consultations, withdelays being at the political level.It is noted that the delay in the passage of the Fisheries Act will further delay the design of therelated sectoral policy measures foreseen in the original matrix, and in particular the structuraladjustment programme. The report of Fisheries Act Commission considers structural adjustmentof the sector and makes clear recommendations concerning management approach, theconcentration of quota ownership, economic efficiency of fleets, and the need for further re-structuring particularly in the coastal fisheries. The new Act does not contain structuraladjustment measures which are deferred for future legislation. This issue is an important part ofthe policy matrix which has not yet been addressed in a coherent manner (see below) andremains to be addressed in future. It will however require further development of legislation.In particular the approach required is to undertake a detailed economic analysis of the sector,as the basis for seeking a national agreement on the structural targets in terms of the fleetdimensions and capacity which are considered to deliver environmental, economic and financialsustainability. The Greenland Government will then need to prepare an operational programmewhich sets the targets and the measures which are to be implemented. These typically includewithdrawal subsidies, grants for upgrading of quality and safety at sea, training and alternativeemployment or early retirement schemes for fishermen etc.However the first task will be to build the capacity of the Greenlandic Ministry of FisheriesHunting and Agriculture for the design and management of such a programme. EU MemberStates have a substantial experience of the design and implementation of fisheries structuraladjustment programmes under the European Fisheries Fund. During the next protocol, thesector support funds could be usefully directed to twinning and training activities with EUMember States to help develop this capacity in the Greenlandic authorities.
7.3.2 Objective: Adoption of a cod management planThe target indicator was for the adoption of a cod management plan by 2008. The GreenlandFisheries Council (charged with advising the Government of Greenland on fisheries matters)established a Working Group in 2006. External expertise was also hired to advise the Group.Four meetings were held in 2007. A first draft of the plan was submitted to the Fisheries Councilin December 2007. Subsequently the plan was revised and a revised plan was re-submitted inFebruary 2008. However, it was apparent that the Working Group and the experts were not ableto reach agreement on the final content of the Plan. The Department of Fisheries, Hunting andAgriculture therefore prepared a recommendation for the Cod Management Plan, and submittedthis for adoption by the Greenland Government, which was done in November 2008. It was alsodecided to introduce a specific licence requirement for the cod fishery and to issue an executiveorder on the regulation of the fishery. A summary of the cod management plan was submitted tothe Commission on 29 April 2009 and updated in 25 November 2010. The central points of theplan57were described in Section 4.
The source is the Status Report “Sector Policy for the Fisheries in Greenland 2007-2012,2008 Data; Agency of Fisheries, Hunting and Agriculture, April 2009.Final Report - page86
57
Fisheries Partnership Agreement FPA 2006/20
FPA 35/GRE/11
The Commission has commented on the cod management plan, in writing, following theNovember 2011 Joint Committee plan, and advised that fisheries management plan did notexpress a clear objective set in terms of target spawning stock biomass, had nor system offormal evaluation, had no links between stock biomass and establishment of TACs, and was notcoherent with the limitations to cod fishing expressed in the November 2010 Joint Committeemeeting (which set out additional conditions, in particular limiting the number of EU vessels tothree). A management plan with all of these features is considered by the consultants to be themost desirable approach.In spite of the fundamental criticisms of the plan, it is considered a second-best option from ascientific point of view. The plan provides for permanent protection of the main identifiedspawning grounds in East Greenland (north of 62�N) and it introduces control in coastal codfisheries (West Greenland) which have until 2009 not been subjected to any catch constraints.The plan can thus be considered as an interim solution only.The objective of adoption of a cod management plan has been partially achieved. However, thisplan will need further revision in the short-term to address changes in stock evolution, and theneed for reference targets and harvest control rules.
7.3.3 Objective: Financial support fund for the coastal fisheriesHere the specific objective is the structural adjustment of coastal fleet segment targetingGreenland halibut. The aim is to support the decommissioning of the least efficient vessels, andinvestment in modern and more efficient fishing technology, so as to improve the profitability ofthe fishery.The structural fund was established by law in 200658with the purpose of promotingdevelopment in the fisheries sector. Stated objectives include the renewal and/or modernisationof fleets, innovative pilot projects, experimental fisheries, and technological modernisation. Forthese various purposes, subsidies can be given on the basis of properly documentedapplications as follows:•••10% of total financing in the case of shrimp fisheries20% of total financing for other fisheries50% of total financing in the case of innovative projects
At the Autumn 2009 session of Parliament it was decided to increase the participation of thefund in the modernisation of the coastal fleet, from 20% to 40%.The Department of Fisheries, Hunting and Agriculture manages this fund, which was set up withan amount of EUR 5.57 million. According to the Status Report “Sector Policy for the Fisheriesin Greenland 2007-2012”, submitted February 2008 (2007 Data updated November 2008), EUR1.1 million was allocated for agricultural purposes. The following Table 35 gives an overview ofthe amounts used during the period 2007 and 2008 (EUR 1.2 million) as well as an indication ofpurposes. It appears that the fund is being used primarily for re-structuring the Greenlandhalibut coastal fishery in accordance with the matrix, although this is not explicitly stated in theLaw defining the objectives of the fund. Actions were implemented under this component in2007 and 2009. There was no expenditure in 2009, and no details were available for 2010.
58
Landstingslov nr.15 af 20. November 2006 om fiskerifinansieringspuljenFinal Report - page87
Fisheries Partnership Agreement FPA 2006/20
FPA 35/GRE/11
Table 35: Structural adjustment projects supported in 2007 / 2008ApplicationExperimental fisheryFor new/used Greenland halibut vesselImproved technologynot identifiedTotalNo. Projects115111Financing (EUR)8,4511,000,611176,95912,4681,198,488
Source: Sector Policy for the Fisheries in Greenland 2007-2012, Dept. of Hunting and Fisheries, February2008
The total amount available for financing through the structural fund is reported to be DKK 23.6million (EUR 3.16 million). Full consolidated accounts showing budgets and expenditure are notavailable on a year by year basis. However overall expenditure on structural adjustmentappears to have been in the region of EUR 1.4 million over the period of the Protocol to the endof 2010. This along with the fact that a 2009 budget of DKK 3,500,000 (approximatelyEUR470,000) was not spent59, suggests that overall there has been a significant under-spend inthis area of structural adjustment. It is worthwhile noting that the total number of applicationsduring the period since the establishment of this fund have been about 110 involving a financialamount of DKK 42 million (EUR 5.6 million) but only about 25% of these applications have beensuccessful. Only 2 applications were granted in 2008, and none in 2009.The number of vessels in the inshore fleet was reduced by 27 vessels, from a reported 281 in2007 to 254 in 2008. These numbers are defined as the number of active vessels in thecategory of 5-75 GRT which are licensed to fish Greenland halibut. A reclassification of coastalvessels was introduced in 2008, which redefined the number as 140, which fell to 127 in 2009.No monitoring indicators were available for 2009. It is not clear how this reduction is related, if atall, to the support measure, since there is no information provided regarding the nature of themeasures. In fact the associated documentation does not mention withdrawal ordecommissioning as an activity to be supported. The consultants observe that the Status Reportdoes not list the specific projects supported. There is an underlying economic model, developedby OS-Consulting, which is used to evaluate the performance of the Greenland halibut fishery.Although a number of vessels were also supplied with more modern fishing technology, thestatus report 2008 indicates that there was no improvement in the overall profitability in thesector. However, a 10% improvement was reported for 2009.This analysis does not mean that the measures have had no impact. It is possible that theprofitability of this sector would have declined further without them. However, there is no data tosupport the evaluation of the measure. The implementation of the measures is not transparentand the consultants are concerned that the measures may not be effective. The concern is thatthe structural adjustment programme for the fishery sector may be failing. There appears to be aremaining need for a more rapid and extensive restructuring of the sector.There is a need to set clear structural objectives (in terms of fleet capacity and productivitytargets, re-design the measures so as to improve incentives and uptake of the scheme, andsignificantly improve monitoring, reporting and transparency. The second phase of amendmentof the Fisheries Law is expected to address a more rigorous approach. The Ministry ofFisheries, Hunting and Agriculture only has limited technical capacity to design and implement astructural adjustment programme in the fishery sector, and there is a need to strengthen therelevant departments and systems. The FPA funds should be re-directed in the short term to
See Page 3, Annual Status Report 2009 Data, Agency of Fisheries Hunting and Agriculture,May 2010 (Revised November 2010).Final Report - page88
59
Fisheries Partnership Agreement FPA 2006/20
FPA 35/GRE/11
focus on building the administrative capacity for structural adjustment (to include twinning withan EU Member State), with actual support for structural funds withdrawn until a coherentoperational programme, and capacity to implement it is in place.
7.3.4 Objective: Training of fisheries officialsThis measure supports joint training activities aimed at the staff of the DFHA and the GFLKofficials. The annual allocation from the budget is DKK 750,000 (EUR 100,530). DKK 861,562(EUR 115,490) was spent in 2007, DKK 716,477 (EUR 96,042) spent in 2008 and DKK 765,324(EUR 102,043) in 2009. No data was available on the expenditure in 2010.The numbers of courses and type of training undertaken is shown in Table 36. In addition, in2007 a one-day staff seminar was held regarding communication methods, attended by 50participants.Whilst the training appears to have been well received by the participants it is difficult tounderstand the rationale, with specific courses identified and organised on the basis ofad hocneeds. This is also apparent in the lack of specific targets for the period under consideration2007-2012, which is linked to the high turnover rate of employees in Greenland. A furthercomplication is that it can be difficult to find adequately trained personnel to fill vacant positions,so the approach used is to hire personnel and then determine whether there is a specific needfor training in various subjects/tasks.Table 36: Training courses undertaken by Greenland Fisheries Officials 2008-2009CourseLanguage trainingIT/software (including GIS)Management/communicationFisheries controlIntroductory course for new staffEconomicsStatisticsPersonal development and safetyNo. participants200778223232008218122362009132928216319
Source: Sector Policy for the Fisheries in Greenland 2007-2012, Dept. of Hunting and Fisheries,November 2009
An internal evaluation of training has not been carried out, so there are no indications onwhether training is effective and if it addresses the particular needs of the fisheries authorities.Identification of training needs has been carried across the whole administrative system by theGovernment of Greenland, but this does not address the issue of effectiveness and needsassessment.Furthermore, there is a change in reporting strategy where the distinction of training ofadministrative staff and fisheries observer/inspectors has been eliminated (Status report; April2009). This was provided for 2008 (as shown in Table 36) and it is recommended that thisdistinction should be maintained (more detail provided in next section).
7.4 Area 2: Control and enforcementThe annual budget allocated to measures under Area 2 has about EUR 2.2-2.4 million, whichhas contributed more or less the total yearly budget allocation to GFLK, as defined in the Statebudget (Landstingsfinanslov). This includes fisheries control functions of offshore fisheries as
Final Report - page89
Fisheries Partnership Agreement FPA 2006/20
FPA 35/GRE/11
well as coastal fisheries (which is carried out by the fisheries/wildlife guards), see the followingTable 37.Table 37: Expenditure on Control and enforcement functionsExpenditure in EURControl functionAdminControl (seagoing)Control (coastal)TotalSource: GFLK, 2010
2007788,0541,348,993287,9192,424,966
2008717,58430,604
2009739,195308,054
1,413,154 1,455,5702,161,342 2,502,819
7.4.1 Objective: Level of administrationThis measure concerns the routine work of GFLK in terms of registering incoming dataconcerning logbooks and vessel notifications, which is a condition for the updating of the GFLKin order to provide data to national and international cooperation partners.Activities were focused on strengthening the data and information systems and establishingimproved linkages between satellite VMS and catch, landing and sale databases, and inupgrading of the system in preparation for the introduction of electronic logbooks. Greenlandplans to follow the same schedule for implementation as the EU; 1 July 2011 for vesselsexceeding 15 meters and 1 January 2012 for vessels exceeding 24 meters. It is notable that thereported budgetary expenditure does not express the significant investment expenditure inhardware and software. A more meaningful set of account headings would help clarify theexpenditure linked to the sectoral policy objectives.
7.4.2 Objective: Control at sea (seagoing)Again, this measure concerns the routine work of GFLK in relation to observer activities in theoffshore fleet. Observer coverage in the seagoing shrimp fishery was 80% in 2007, 85% in 2008and 74% in 2009, all well above the target of 50%. The consultants have no specific commentor recommendation, except to note that this is a very high level of observer coverage for anyfishery.
7.4.3 Objective: Control at sea (coastal)This measure concerns the routine work of GFLK fisheries/wildlife guards covering the coastalfisheries. In 2008 721 inspection trips were carried out which is in line with the minimumrequirement of 700 (primary target). In 2009, 765 inspections were conducted.New reporting procedures were introduced from the beginning of 2009. The most importantaspects of this procedure is that fisheries/wildlife officers now report more specifically on a widernumber of areas, and that they report to GFLK after every inspection trip. The classification ofinfringements was also amended. In 2009 there were 11 serious infringements and 416 minorones detected (compared to a total of 56 infractions in 2008)
7.4.4 Objective: International control agreementsThe specific target under this point is to maintain the current number of agreements and, ifpossible, expand fisheries relations with relevant neighbouring countries. A VMS agreementwith Canada was finally concluded in 2009 and establishes a framework for the monitoring ofCanadian fishing vessels which use Greenland ports during parts of the year.Another primary target is the establishment of a port state control corps. Initial steps have beentaken towards implementation (with four inspectors appointed to this function). However, fullFinal Report - page90
Fisheries Partnership Agreement FPA 2006/20
FPA 35/GRE/11
implementation still remains subject to the passing of the new Fisheries Act. This is because thenecessary training and mobilisation of staff will entail significant costs and it is envisaged thatthis should be funded through the introduction the “users pay” principle in the new Fisheries Actin relation to the funding of inspection and observer activities. If the new Fisheries Act is passedin 2011 as expected, implementation of the port state control is expected to commence in 2012.Bilateral meetings which include control issues have taken place with countries such as Russia,Norway and the Faroes, which is part of the normal routine of negotiating annual quotaexchanges in the context of fisheries agreements.
7.4.5 Objective: Training of fisheries officials (GFLK)This measure concerns the training of personnel in the field of fisheries control, includingfisheries observers, covering the offshore fisheries, fisheries/wildlife guards in coastal fisheries,and administrative personnel covering fisheries control support functions.Discussions with GFLK gave further information on specific training needs and activities of theagency. This includes courses in:••IT & Statistics: this concerns training in a database query language for the purpose ofmaking use of and maintenance of the GFLK database (Oracle) on fisheries controlGIS (Map info): this concerns training in geographical applications, again making use ofthe GFLK database, VMS data in particular. According to the latest data provided(Table 36), this training was not delivered to GFLK personnel but to others. Howeverthis is assumed to be an error in the reporting process.Control & enforcement (also called the observer seminar): this is usually a 5-day annualmeeting, which is used for introduction to new legislation and procedures as well as aworkshop to discuss any relevant issues concerning the day-to-day work of observersand guards.Biological sampling: observers/guards receive training at the Greenland Institute ofNatural Resources (GINR) but this is not considered in the budget as it does not entailpayments.
•
•
All of the above referred training appears to be relevant and essential for the proper functioningof the GFLK. Although specified in the Status Report (Feb. 2009), the latest Status Report(November 2010) does not make any distinction between training in fisheries control functionsor fisheries administrative functions. Thus, specific training for e.g. observers, guards, port statecontrollers is no longer specified, although these had been defined as key indicators in theagreed matrix. The consultants recommend that this distinction is maintained as previouslyagreed (following the structure of Table 36) and in order to give a clear picture of trainingefforts/needs in relation to fisheries control and other areas.It is worth noting that the new Fisheries Act is expected to introduce fees such as for access toresources as well as the payment of costs associated with observers. There is a clear intentionof formulating a longer-term training course (2 years spread over various stays in Denmark) incooperation with fisheries inspection services in Denmark in order to provide a sound training ofGreenland observer personnel including competencies in more authoritative aspects, which areneeded for port state controllers.
7.5 Area 3: Biological adviceEach year of the Protocol, approximately EUR 2.4 million has been allocated to gathering andanalysis of fisheries data by GINR. Budget is allocated by areas concerned with the differentfisheries with the following shares (based on 2009 figures): fish & shrimp in general (37%);shrimp (29%); Greenland halibut (20%); cod, herring, redfish, salmon and capelin (5%); salmon(0.3%) crab (8%) and others (1.5%). It is not clear whether, or indeed how, the fisheriesresearch allocations are linked to the management priorities of the Greenland authorities.
Final Report - page91
Fisheries Partnership Agreement FPA 2006/20
FPA 35/GRE/11
7.5.1 Objective: Gathering and analysis of data/scientific cooperation inexisting fisheriesOne of the primary targets is to produce scientific advice for management purposes in respectto 20 stocks. This activity, undertaken by GINR, has been undertaken in line with the plan;advice was provided for 22 stocks in both 2007 and 2008 and 25 in 2009. The following Table38 presents an overview of commercially important fish stocks and the production ofmanagement advice. There are 30 stocks listed but some of these stocks are not assessed dueto their limited importance and in some cases, advice is produced over 2-3 year intervals.The other primary target indicator is the production of annual review publications. This concernsthe production of scientific peer-reviewed articles in the primary literature on original research.Performance has been slightly below the target of 5 articles per year (4 articles published in2007 and 2008).Results in relation to secondary targets have been lower than expected, which was due to abreakdown in one of the research vessels (Adolf Jensen) in 2007. Inshore surveys were thuscarried out with chartered ships, but not all surveys were successful. A new vessel is in theprocess of being purchased in 2011 as a substitution for RV Adolf Jensen, and the partiesagreed that the sectoral policy matrix should be extended to cover this purchase, as part ofGreenland’s contribution to the cancellation of the “capelin debt” built up over the course of theprotocol (see section 5.2).
Final Report - page92
Fisheries Partnership Agreement FPA 2006/20
FPA 35/GRE/11
Table 38: Production of management advice for commercially important fish stocksNo.1234567891011121314151617181920212223242526272829303132Greenland sharkTroutPolar codAmerican plaiceSkateWolfishLumpsuckerScallopsUvaqAtlantic halibutPelagic redfish - IrmingerSalmonGrenadierCapelinCodCoastalSnow crabCoastalCoastalGreenland halibutStockShrimp(P. borealis)WestEastWest - Davisst.West - BaffinEast offshoreDiskobugtUummannaqUpernavikOffshoreSisimiutDiskobugtOffshore East/WestSisimiutNuukQaqotoqWestEastEastWestWestEastWestWestWestWestWestWestWestEastWest/EastWest/EastWest/EastAreaAdviceYearlyYearlyYearlyYearlyYearlyEvery 2 yrsEvery 2 yrsEvery 2 yrsYearlyYearlyYearlyYearlyYearlyYearlyYearlyNoneYearlyYearlyYearlyEvery 3 yrsNoneEvery 3 yrsEvery 3 yrsEvery 3 yrsFrom 2004From 2004NoneNoneNoneNoneNoneNoneContextNAFONAFONAFONAFOICESNAFONAFONAFOGINRGINRGINRICESICESICESICES-ICESICESICESNAFO-NAFONAFONAFOGINRGINR------Stock shared withCanadaIcelandCanadaCanadaIceland, FaroesnonenonenonenonenonenoneIcelandNone (Iceland?)None (Iceland?)None (Iceland?)n/aIceland-NorwayNorth AtlanticNorth AtlanticCanadaIcelandn/an/an/anoneNone (Iceland?)nonen/an/an/anonenone
Source: Greenland Institute of Natural Resources
Final Report - page93
Fisheries Partnership Agreement FPA 2006/20
FPA 35/GRE/11
7.5.2 Objective: Gathering and analysis of data/scientific cooperation innew fisheriesThe specific target is to obtain new knowledge on potential new fisheries through funding ofspecific projects carried out by GINR. Projects have been undertaken in relation to a) biologicalsurvey of cod in East Greenland b) spawning of cod in West Greenland c) pilot bycatch projectin Disko Bay and d) tagging of Greenland halibut and cod. The yearly allocated budget hasbeen in the region of EUR 500,000, which corresponds to funds earmarked for GINR in thecontext of the FPA.There has been an emphasis on carrying out projects that contribute data and information oncod stocks, which reflects on the perspective that cod may become an important fishery again inGreenland after a long period of collapse. The activities undertaken therefore respond to astrong interest in strengthened fisheries management in general, and of the cod stock inparticular, rather than development of new fisheries. It therefore appears that these funds havenot been used for the purpose agreed by the parties, however worthy and valuable the outputsof the research conducted.
7.5.3 Objective: Purchase of research vessel and IUU implementationThis combined measure was added to matrix of measures to be suppor6ted at the meeting ofthe Joint Committee 25/26 November 2010. The allocation was EUR 1,1 million. TheGreenland authorities report that the purchase of the vessel is well advanced and delivery isexpected in 2011. Discussions with GFLK indicate that IUU measure is fully implemented, andthat catch certificates are now being issues on a regular basis in line with EU Regulation100572008. This measure can therefore be considered to have been implemented successfully.
7.6 Summary of progress on implementation of the measuresWith regard to the implementation of the sectoral support measures:1. The budgetary support programme under the FPA has clearly contributed to advancingthe drafting of a new fisheries law and significant steps have been made. However theobjective of a new fisheries law has not yet been met due to political concerns inGreenland60.2. The budgetary support programme under the FPA has also significantly supported thedevelopment of the cod management plan. Despite several revisions and commentsfrom the Commission, the current plan remains defective and does not, in the opinion ofthe consultants, constitute a full and final plan. It should therefore be regarded as aninterim step. A scientifically comprehensive cod management plan (with defined criteria)is still required. It is recommended that the parties consider that the adoption of ascientifically sound plan by Greenland should be a pre-condition for any futureconsideration of extension of cod quotas within the frame of the Fisheries PartnershipAgreement.3. The financial support fund for the coastal fisheries has been implemented byGreenland, in accordance with the matrix time scale and 28 projects have beenimplemented. The number of vessels in the inshore sector targeting Greenland halibuthas fallen from 281 in 2007 to 254 in 2008. However, the support measures are notdefined, there are no structural targets set, there is no specific link established betweenthe measures and the outcomes, and no evidence that sectoral restructuring has beenbeneficially advanced by the support measure. No list of specific projects is publishedand there is a risk that the subsidies for new vessels and improved technology result inincreases fishing capacity in excess of withdrawals. The consultants recommend that
The adoption of a new fisheries law has been promised by the Government of Greenlandsince the revision of the 4thProtocol of the Fisheries Agreement in 2004Final Report - page94
60
Fisheries Partnership Agreement FPA 2006/20
FPA 35/GRE/11
there should be redrafting of the measure with quantifiable fleet targets, and a morerigorous monitoring by the Joint Committee of the implementation of this measure toinclude a) measurement of fleet capacity in relevant segments (tonnage and enginepower) on an annual basis and b) presentation in the status report of the list of specificprojects supported. However, before this, there is a need to significantly strengthen theadministrative capacity of the MFHA with respect to design and implementation of anstructural plan and operational programme for the fisheries sector.4. The measures have clearly helped with the delivery of beneficial training courses whichare well executed and received by participants. However the effectiveness is limited bythead hocapproach and lack of a coherent structure to the programme with clearoverall objectives. The consultants consider that the training programme would benefitfrom a formal training needs assessment, and preparation of training objectives, whichcan be incorporated into the matrix and a more structured planning of training activities(taking into account the problem of high-turnover, budgets, technical capacity fordelivery of training and language skills). The reporting approach adopted in the 2008status report (dated April 2009) should be maintained.5. With regard to Area 2 (Control and enforcement) and the implementation of theelectronic logbook systems, Greenland has proposed that this be postponed until2010/2011, in line with the implementation dates with the EU fleet. The agreed matrixdoes not set an implementation date, and the parties should agree one in the nearfuture. The Greenland proposal would seem to be reasonable, but it is desirable toestablish some interim indicators (such as specification of the system, commencementof procurement, training of staff, drafting of legal regulation etc) to ensure that therelevant budgetary and administrative preparations are undertaken in a timely manner.6. Targets in relation to control at sea activities (in terms of extent of observer coverageand coastal fishery inspection visits) have been achieved, and here the budgetarysupport provided under the FPA has been very effective in enabling GFLK to developand strengthen control services in this area. However, financial monitoring does notgive a clear picture of the investments made. Monitoring is also weak in terms of thesecondary indicators, and indicators drawn from reports submitted byobservers/inspectors should be extended. Given the high rates of compliance obtained,and the high level of observer coverage, there may also be opportunities for improvedefficiency in the utilisation of the limited control resources by introduction a risk-basedapproach to control decisions.7. The Fisheries Partnership Agreement has also contributed significantly to strengtheninginternational integration of the Greenland fishery sector, by helping progressagreements between Greenland and Canada with regard to VMS and port state controlarrangements. The VMS agreement can be regarded as an effective outcome of theFPA. Port state control arrangements will remain subject to the new fisheries law(because of the budgetary changes required), and in this respect the FPA has not yetbeen effective.8. The FPA has been very effective in supporting the ongoing programme of fisheriesresearch, and has met primary targets in terms of the stocks for which data is obtained.The efficiency of the measure has however been limited by breakdown in researchvessels, limiting the quality of biological data for scientific basis for managementrecommendations. This problem is addressed by the extension of the matrix ofmeasures supported by the FPA contribution, to partially compensate for the non-delivery of certain fish quotas. This allows Greenland, in 2011, to fund the purchase of anew research vessel which should ensure better continuity of data in future. The currentstructure of the measures (which differentiates between new and existing fisheries) isnot relevant. The measure should be amended to remove this distinction and coverresearch on fish stocks and marine ecosystems, to bring it into line with the ecosystemapproach. Allocation of research priorities should be closely linked to the informationneeds for fisheries management.
Final Report - page95
Fisheries Partnership Agreement FPA 2006/20
FPA 35/GRE/11
9. Finally, the parties may wish to consider the overall relevance of the measures in thecontext of the budgetary allocations and strategic development of Greenland’smanagement of the sector. The First Protocol has substantially provided for thestrengthening of the control system, and funded fisheries research functions. As a resultthere are good levels of compliance and clear management recommendations in place.However, the structural adjustment elements of matrix of fisheries policy measureshave not been addressed. They have been poorly defined and weakly managed, withthe result that they have been ineffective. The coastal fisheries sector therefore remainsin crisis, largely due to its structural inefficiencies. There is a need to seriously re-appraise the objectives of the policy support measures, to establish a new matrix on thebasis of the re-appraisal, with a much stronger priority focused on structuraladjustments, even if this compromises control and research functions. In the re-designof the matrix for any new Protocol the parties are advised to consider that objective ofthe partnership approach is that the budgetary support should fund fishery sectorinvestments with longer term impacts, rather than provide direct subsidies for currentexpenditure.10. Whilst the adjustment of the policy support measures to (partially) accommodate thecapelin debt provided a pragmatic contribution to the solution of the problem, the use ofthe matrix of support measures in this way provides no additional benefits to eitherparty. Greenland had already complied with the EU’s IUU catch certificationrequirements since 1 January 2010, and the new research vessel had already beencommissioned. The adjustment is an administrative convenience, rather thanmeaningful recompense to the EU budget for the overpayment of compensation.
8 RESOURCE AND ENVIRONMENTAL IMPACTS8.1 Impacts on target fishery resources8.1.1 Overall impactsTable 39 shows a summary of the sustainability of each of the stocks which are the subject ofthe Protocol to the Fisheries Partnership Agreement, and the contribution of the EU fishingconducted under the agreement to the overall level of exploitation. A more complete picture isshown in Annex 4.Overall the Fisheries Partnership Agreement has accounted for 48,405 tonnes of catches from atotal of 450,371 tonnes caught on the stocks subject to the Fisheries Partnership Agreement,accounting for just under 11% of the exploitation. The Fisheries Partnership Agreement hastherefore had a moderate overall impact on the stocks which it considers. However, within thisaverage, there are some stocks where the Fisheries Partnership Agreement contributes asignificantly higher level of the overall of exploitation. Furthermore, Section 4 has shown that atleast three of the important stocks are exploited at a level which is not sustainable (cod,Greenland halibut in East Greenland and deep pelagic redfish). More details are provided in thefollowing sections.
Final Report - page96
Fisheries Partnership Agreement FPA 2006/20
FPA 35/GRE/11
Table 39: Overview of impacts on stocks of relevance to the EU Greenland FisheriesPartnership Agreement during the period of the current protocol (2007-2011)Average Annual catchSpeciesArea(tonnes)Total fromstockCodGreenland halibutDeep pelagic RedfishShallow pelagic RedfishDemersal RedfishShrimpAtlantic halibutCapelinShrimpGreenland halibutSnow crabAtlantic halibutOverallNAFO 1, ICES XIVICES V, VI, XII, XIVICES V, XII, XIV,NAFO 1, 2ICES V, XII, XIV,NAFO 1, 2ICES XIVbICES XIVICES XIVICES V, XIV, IIaNAFO 0, 1NAFO 0, 1NAFO 0, 1NAFO 0, 115,75024,33347,0003,8334044,098103186,250142,67523,3332,56823450,371UnderFPA1,7277,2543,864003,1669626,1033,7672,4210748,40511.029.88.20.00.077.393.214.02.610.40.030.410.7NoNoNoNoNot knownYesNot knownYesAt riskYesRecoveringNot knownSustainabilityof fisheryimpact%
Sources: ICES, 2011; European Commission, DG MARE & consultants estimatesNote: Refer to section 4.1 for a full explanation of the sustainability of the fisheries. Important to bear inmind that exploitation levels depend on various fleets and the contribution of EU vessels to overallexploitation can be negligible (e.g. the case of shallow pelagic redfish)
8.1.2 Cod (Gadusmorhua)in Greenland watersDuring the period 2007-2011 ICES has consistently recommended each year that no fisheryshould take place to allow for rebuilding of the spawning stock in Greenland. Greenland hascontinued to offer cod quotas under the Fisheries Partnership Agreement, reaching 3,500tonnes in 2008 with almost full utilisation. Allocated quota decreased to 3,000 tonnes in 2009and 2,000 tonnes in 2010 with a sub-optimal utilisation below 50% due to late announcement tochanges in the quotas. Catches under the Fisheries Partnership Agreement (mainly EU, butsome from Norway) account for an average of 10% of total catches from the stock. Note thatGreenland has introduced increasingly restrictive measures in an attempt to improve stockstatus, but has not closed the fishery as advised. The Fisheries Partnership Agreement hastherefore supported about 10% of overall level of exploitation of this resource against scientificadvice and cannot therefore be considered sustainable in this respect. However, during the lastJoint Committee Meeting to establish 2011 quotas the EU did not accept an initial offer fromGreenland of opportunities which was above the scientific advice. Reduced quotas wereagreed; although more sustainable than those offered, these quotas however are still not in linewith scientific advice.Cod opportunities are in high demand by both Greenland and EU fishers. The current TAC isbelow the minimum quantity of 30,000 tonnes set out for maintaining Greenlandic fishingactivities as set out in the Protocol (Article 7). Greenland would therefore be justified inwithdrawing these quotas from the Fisheries Partnership Agreement at present if it wished to doso.Final Report - page97
Fisheries Partnership Agreement FPA 2006/20
FPA 35/GRE/11
8.1.3 Greenland Halibut (Reinhardtiushippoglossoides)in East GreenlandDespite concerns from stakeholders that the scientific advice does not reflect the true state ofthe resource, there is emerging, albeit not comprehensive, scientific evidence that the stockexploitation is not sustainable. In 2009, the scientific advice indicated a TAC of 5,000 tonnes buta total catch of 28,000 tonnes were taken (as shown in Annex 4). Greenland and Iceland haveset autonomous TACs at the same level in 2010 and 2011, for example 13,000 tonnes each in2011. There is no agreement between the coastal states in whose waters the stock is exploited(Iceland, Greenland and Faroe Islands). The Fisheries Partnership Agreement has delivered onaverage 7,611 tonnes of Greenland halibut quota per year in East Greenland, all of which hasbeen utilised, which has accounted for about 30% of the total level of exploitation on the stock.Most of the exploitation (27%) was by EU vessels. The EU-Greenland Fisheries PartnershipAgreement has supported the ongoing exploitation of this resource against scientific advice, andcannot be regarded as sustainable in this respect.
8.1.4 Redfish (Sebastesspp.)in Greenland watersThe vessels operating under the Fisheries Partnership Agreement have not exploited shallowpelagic redfish (S.mentella)nor demersal Redfish (Sebastesmentella & Sebastes marinus)inthe Greenland zone, and have therefore had no impacts on the sustainability of thesecomponents of the redfish stock. The vessels have however exploited the deep pelagic Redfish(S.mentella).During most of the protocol period, there was no agreement on the allocation of quotas for deeppelagic redfish (as well as other redfish possibilities), leading to autonomous TACs exceedingthe scientific advice by far. It should be noted however that the TACs were set according toNEAFC recommendations. This fishery is clearly not sustainable and the EU has contributed tothis by taking about 15% of the total catch, of which 8% is taken in the context of the FPA.However, an agreement has been reached in March 2011 on the allocation of pelagic redfishstocks between coastal and non-coastal States in the Irminger Sea and adjacent waters. Thisagreement is expected to lead to a strong reduction in TACs for deep pelagic redfish. A TAC of38,000 tonnes will be set in 2011 down from a total of “autonomous” TACs of 78,000 tonnes in2010. TACs are to be reduced gradually down to 20,000 tonnes in 2014, which would be in linewith the current scientific advice. This is a major step in the right direction, but it remains to beseen whether it can be implemented successfully, as not all stakeholders have signed theagreement (the Russian Federation is not a party). Whilst the prospects for the future areimproved, this does not however change the finding that the exploitation of deep pelagic redfishhas not been sustainable during the current protocol period.
8.1.5 Northern shrimp (Pandalusborealis)in East GreenlandCatches have generally been below the set TAC (12,400 tonnes since 2004) in this fishery. Inthis case, this is considered to be the result of difficult fishing conditions in East Greenland. Asignificant 77% of the catches are taken in the context of the FPA, which is also related tolimited interest amongst Greenland stakeholders. Trends and indicators continue to show arelatively stable stock, if not increasing abundance, which indicates a sustainable fishery. Theinclusion of these resources in the Protocol has therefore been sustainable.
8.1.6 Northern shrimp (Pandalusborealis)in West GreenlandThe fishery for northern shrimp off West Greenland is a substantial fishery taking an average of143,000 tonnes/year during the protocol period. There has been a consistent trend of settingTACs in excess of the advice by at least 22,500 tonnes in recent years due to the autonomoussetting of TACs (by Greenland and Canada). It also appears that the quota allocated to the EU(4,000 tonnes) by Greenland, is added to the TAC recommended by the scientific advice (i.e. itmay not be a surplus stock). Nonetheless, the main concern is that there is a substantialdifference (16-20%) between catches in live weight and the quota accounted for which is basedon landed weights. This generally leads to overshooting of the TAC. This may have carried onlylimited risks at the peak of the fishery (2005-2006), when biomass was at its highest, but thisrisk of overfishing is considered to be increasing. Harvest control rules adopted in connectionFinal Report - page98
Fisheries Partnership Agreement FPA 2006/20
FPA 35/GRE/11
with the 2010 shrimp management plan are expected to bring about improvements and strictercontrol. Whilst there are concerns regarding sustainability, EU vessels take only a limited share(2.6%) of the total catches from this stock. Inclusion of this fishery in the Protocol can thus beconsidered to have been sustainable, albeit with an indeterminate but small risk of contributionto modest level of excessive exploitation.
8.1.7 Greenland Halibut (Reinhardtiushippoglossoides)in West GreenlandThere is an agreement between Canada and Greenland on allocating 50% of the fishingopportunities to each party, which is adopted in complete conformity with the scientific advice. Itshould be noted that this concerns an offshore stock (Davis Strait and Baffin Bay) which isassessed separately from the inshore stock of Greenland halibut fished off West Greenland.The offshore stock is considered to be a well-managed and sustainable fishery, where fishingopportunities have increased in recent years (increased from 24,000 tonnes in 2009 to 27,000 in2010 and 2011). FPA related catches have accounted for about 10% of the total catches takenfrom the stock, and can be regarded as sustainable.
8.1.8 Snow Crab (Chionoecetesopilio)in West GreenlandThere was a rapid expansion of the snow crab fishery along the west coast of Greenland,starting in the mid-1990s, which resulted in overfishing. In an attempt to improve the stocksituation, and as better data became available, more restrictive measures started to be imposedstarting in the mid-2000s. Some fishing opportunities for the offshore component of the snowcrab stock are offered in the context of the EU-GRL FPA, but limitations imposed in terms offishing areas and seasons make this of little interest to EU stakeholders (nil catches during theprotocol period). TACs and catches continue to be relatively low and the fishery for the offshorecomponent has been closed in 2011. Recovery of this fishery appears to be progressing slowly.The application of the management measures, combined with the zero utilisation suggests thatthe inclusion of these opportunities in the Protocol has been sustainable.
8.1.9 Capelin (Mallotusvillosus)in the Iceland-East Greenland-Jan MayenareaQuotas for capelin are set according to the criteria of maintaining enough spawners for thepropagation of the stock and, since 1979, the target of maintaining a spawning stock biomass(SSB) of at least 400,000 tonnes has been used in the Iceland-East Greenland Jan Mayen area.Depending on the abundance identified by annual surveys, quota are then set and allocatedaccording to the Tripartite Agreement on Capelin (Iceland, Greenland and Norway). There havebeen large fluctuations in stock abundance and in recent years there has been a strong trendfor a reduction in abundance (probably connected to displacements), but this is considered tobe a result of environmental conditions. Greenland has not always been in a position to offercapelin fishing opportunities to the EU (exchanged with Iceland), because of the managementarrangement in place. On average, capelin catches under the Fisheries Partnership Agreementhave accounted for a relatively high 14% of total catches from the stock (in 2007 and 2008).This can be regarded as a sustainable fishery, albeit at lower abundance.
8.1.10 Atlantic Halibut (Hippoglossushippoglossus)in Greenland watersLittle is known about the stock structure and abundance of Atlantic halibut, both in West andEast Greenland, but it is assumed that these stocks have been fished down over the course of acentury. There is no stock assessment available for these stocks and quotas appear to be set attoo high a level, to meet demand from the sector. Nonetheless, catches taken in the context ofthe EU-GRL FPA (exchanged with Norway) take a substantial part of total catches (77% in EastGreenland and 30% in West Greenland). The sustainability of these fisheries is not known, but itis probable that these stocks are overfished and have been kept at low levels due to the lack ofregulation (and possible indirect effects of bycatches in trawl fisheries).There is a risk that theinclusion of these resources in the Protocol has not been sustainable.
Final Report - page99
Fisheries Partnership Agreement FPA 2006/20
FPA 35/GRE/11
8.1.11 Impacts on non target species and ecosystemFishing in Greenland is generally characterised by being “clean”, where catches of non-targetspecies is limited, even in trawl fisheries. Discarding is prohibited in Greenland and bycatchquotas are defined in order to allow for the retention on-board of non-target species which aregenerally commercial species. Shrimp fisheries are exempted from this discard ban (to facilitaterequirements for processing and handling) but use of sorting grids has been mandatory since2002, bringing down bycatch substantially. This is estimated to be about 1% presently,consisting of at least 20% commercial fish species. Other impacts, concerning other possibleeffects of fishing such as bycatches of seabirds and mammals, appear to be limited whenconsidering the trawl fisheries conducted in the context of the EU-GRL FPA.
9 FINDINGS OF THE EX-POST EVALUATION9.1 RelevanceA broad assessment of the implementation of the first protocol of the Fisheries PartnershipAgreement should first recognise that, since 2007, it has ensured the continuation of a highlevel of financial support to Greenland. As well as contributing to general budgetary income, thissupport has contributed towards establishing sustainable fisheries. Reciprocally, the EU hasretained strategically important fishing opportunities in the Greenland zone, and the possibility ofobtaining additional capelin and/or cod quotas if stocks become available in future. TheFisheries Partnership Agreement therefore complements and extends the formal relationship ofthe parties in terms of the EU-Greenland Partnership Agreement, and the Greenland’sparticipation in the Overseas Association Agreement. Furthermore for the EU, the FisheriesPartnership Agreement through its provision of quota for exchange, supports EU fishing in thewaters of other third countries, and (particularly in the case of access to the Norwegian zone)thus makes an important contribution to the Common Fisheries Policy objective of supportingemployment in fisheries dependent areas of the EU. The Fisheries Partnership Agreement hasbeen, and remains, a highly relevant instrument for both parties.
9.2 EffectivenessThe Fisheries Partnership Agreement has been effective in providing fishing opportunities ofinterest and utility for certain segments of the EU fishing fleet, with overall some 37 vesselsdrawing 75% of the fishing opportunities offered by Greenland. It has ensured an averageannual production of fish from Greenland waters of 48,502 tonnes valued at EUR 45.7 million, asubstantial proportion of which is delivered to the EU market, either directly (via EU catches,valued at EUR 32.0 million) or indirectly (via third country catches, valued at EUR 13.7 million).The estimated value added of the opportunities received is in the region of EUR 18.7million/year. Because the opportunities are either used directly by EU vessels, or exchangedwith other third countries for fisheries access to their waters, their full value represents thebenefits to the EU economy.However, the effectiveness of the Fisheries Partnership Agreement has been limited by the non-availability on several occasions of sufficient fishery resources (notably capelin, but also cod).Approximately 39% of the resources (in volume terms) could not be delivered (although thesemainly concern large volumes of capelin, a highly variable resource). The compensationmechanism defined in the Fisheries Partnership Agreement with a view to offering alternativefishing opportunities has only been partially effective in dealing with such a substantial deficit,and the parties have had to makead hocadjustments to compensation and support measures.For Greenland, the Fisheries Partnership Agreement has been an effective measure togenerate income from several fishery resources which it may not otherwise have been able toexploit. On average Greenland has generated net EUR 15.8 million per year in financialcontributions from the EU and licence fees, which has contributed slightly over 1% of the statebudget. The average resource rent generated is estimated at EUR 326/tonne, which is about35% of the first sale value of the products generated. Whilst Greenland had other options forexploitation of several of the stocks considered by the Protocol, by its own, or other third
Final Report - page100
Fisheries Partnership Agreement FPA 2006/20
FPA 35/GRE/11
country, vessels (particularly of shrimp, cod and Greenland halibut) it is unlikely that they wouldhave generated a similar level of financial income. The Fisheries Partnership Agreement hastherefore been an effective method for Greenland to optimise financial benefits from its surplusfisheries resources. However the Fisheries Partnership Agreement has not been effective indelivering any significant additional economic benefits (such as joint ventures, employment onboard, or landings into processing).
9.3 EfficiencyFor the EU, the Fisheries Partnership Agreement has delivered net economic benefits estimatedat EUR 18.7 million/year, for an outlay of EUR 15.8 million, suggesting a cost benefit ratio of 1.3(i.e. returning EUR 1.30 for ever EUR 1.00 invested). This is a positive return, but representsonly a small net benefit compared to some other Fisheries Partnership Agreements (forexample in the tuna sector, where cost-benefit ratios of 2 to 6 are not uncommon). The fact thatthe relatively low ratio is in parallel with a good rate of utilisation of the opportunities (75%)suggests that the Fisheries Partnership Agreement has been more or less cost neutral, butcould have easily resulted in a net cost to the EU (for example if there had been no recovery inprices after 2008/2009). Therefore whilst the Fisheries Partnership Agreement provides apositive net benefit, it has only been a marginally efficient means of achieving these ends, andits viability remains sensitive to externalities.The system of licence allocation, with rigid annual limits, requires that EU vessels, when buyingquota, make realistic estimates of the quota they expect to use. This requires vessel operatorsto make an accurate estimate of future catches, which in the event is not always possible tofulfil, due to variations in weather, catch rates etc. Since the vessels must continue to operate,operators therefore over-purchase quota, but seek to keep the excess to a minimum. In anaverage year over the course of the Protocol, they caught 16,472 tonnes out of 19,783 tonnesof quota drawn, representing 17% of purchased quota remaining unused at the end of the year.For the fleet operators, this represents an economic inefficiency in the design of the licencesystem, since they are required to buy more quota than they will use.Overall, including the sector support, the EU has contributed EUR 286/tonne of fishery productsproduced (30% of the sales value). The financial amounts paid by the EU are considered to behigh. Moreover the EU financial contribution represents almost 70% of the budgetary incomegenerated by the fishing sector, while only accounting for an estimated 12% of the total catchvolume, and an even lower percentage of the value of the catches in the EEZ. The partiesagreement to discount 40% of the capelin debt (representing an agreed value EUR 1.1 million)in return for extension of the sectoral policy support measures (to purchase a research vessel)was not found to deliver additional benefits, and has not represented an efficient use of EUfinancial resources.Of the overall access costs to the resource (compensation plus licence fees, estimated at EUR259/tonne) the EU has contributed 85% (in the form of compensation) and the fleet operators15% (in the form of licence fees)61, which is more or less the same level of public contributionapplied by EU policy in other mixed Fishery Partnership Agreements (for example Mauritania87%) but considerably less that the EUs “tuna agreements” (where the targeted split is typically65/35).
9.4 Sustainability and environmental impactsThrough the sector support measures, the Fisheries Partnership Agreement has allowed asubstantial level of budget support for fisheries research, administration and control. In all ofthese areas there have been significant sustainable developments in terms of improvedfisheries management advice, strengthened fisheries monitoring surveillance and control, andimplementation of measures against IUU fishing. In this respect, the Fisheries PartnershipAgreement has made a significant contribution to the sustainability of Greenlandic fisheries.
61
based on calculations based on data in Table 29Final Report - page101
Fisheries Partnership Agreement FPA 2006/20
FPA 35/GRE/11
However, there are concerns regarding sustainability of the Fisheries Partnership Agreement, interms of its contribution to excessive levels of exploitation of some of the stocks considered inthe Protocol. There is clear evidence that cod, Greenland halibut in E.Greenland and redfish(deep pelagic stocks) are subject to excessive and unsustainable levels of exploitation, and thatthe Fisheries Partnership Agreement has contributed respectively 11%, 30% and 8% of theoverall exploitation during the period of the evaluation. Although there are also concernsregarding the sustainability of the levels of exploitation of shrimp in W.Greenland (considered tobe at risk), here the Fisheries Partnership Agreement has contributed less than 3% of theexploitation, and it has therefore not had such a major impact on sustainability. There is a also arisk that exploitation of the Atlantic halibut has not been sustainable, although there isinsufficient evidence for a definitive analysis.There are no concerns regarding the impact on resource sustainability of other opportunitiescontained in the Protocol, since they are either sustainably exploited, or the opportunities arenot effectively utilised. There are no notable impacts of the Fisheries Partnership Agreement onnon-target resources or on the ecosystem.
9.5 Coherence and complementarityIn general, the parties to the Fisheries Partnership Agreement have sought to ensure thesustainability of fisheries activity undertaken, in line with the principles of responsible fishing, asset out in the Common Fisheries Policy. However, due to the lack of sustainability of some offishing opportunities considered in the Protocol, this has not always been achieved, and theFisheries Partnership Agreement cannot therefore be regarded as fully coherent with theCommon Fisheries Policy.There are also concerns regarding coherence with regard to the EU policy on trade in sealproducts. The EU’s restrictions on the placing seal products on the EU market (along with theirimport, transit and export)62has, according to Greenlandic stakeholders, impacted strongly ontrade in sealskins. The exemption for those products from hunting “traditionally conducted byInuit and other indigenous communities and (which) contribute to their subsistence” has largelybeen found to be unworkable and the measure has resulted in the loss of markets, thusundermining the livelihoods of small scale hunter/fishers in Greenland. It may be argued thatmeasure is not coherent with the Fisheries Partnership Agreement (which supports sustainabledevelopment of the Greenland fishery sector). On the other hand, there may be an opportunityto re-design sectoral support measures to lessen the negative impact of the seal traderestrictions, thus strengthening coherence.The EU has a complex and multi-dimensional relationship with Greenland. This is governed bythe Fisheries Partnership Agreement under the Common Fisheries Policy, the EU GreenlandPartnership Agreement (which has delivered significant financial support to the Greenlandeducation system), and the OCT Treaty (the Overseas Association Decision, which hasestablishes terms of trade between the parties). In general, there has, until now, been asubstantial level of coherence between these EU policies as they intersect in Greenland.However, all of these policies are subject to review pending renewal in the near future, andthere will be a need to ensure that any new protocol under the EU Greenland FPA remainscoherent with the new approaches, as well as with the EU Arctic policy, to be adopted by theEuropean Council, following the Commission’s Communication on the EU and the ArcticRegion.
9.6 EU added valueThe opportunities have been applied by the Commission to a balanced exchange ofopportunities in annual negotiations under Fisheries Agreements with Norway, Faroe Islands
Regulation (EC) No 1007/2009 of the European Parliament and of the Council of 16September 2009 on trade in seal products, which came into force in August 2010.Final Report - page102
62
Fisheries Partnership Agreement FPA 2006/20
FPA 35/GRE/11
and Iceland. The opportunities thus obtained, along with the direct opportunities in Greenlandare all distributed between EU Member States, according to relative stability keys. TheAgreements specifically permit opportunities for exchanges of quotas between Member Statesfleet segments, and EU legislation mandates that opportunities unused by certain dates beoffered to other potential users. Furthermore, the term of the protocol (6 years) provides for aongoing guaranteed access for EU and third country operators, thus allowing for longer termfinancial planning.The involvement of the EU in this system thus ensures an increased utilisation, stableinvestment environment and improved efficiency compared to any system in which individualMember States or private vessel operators would negotiate and purchase opportunities directlyfrom Greenland. The added benefits of EU involvement are thus clear.
10 CONCLUSIONS AND RECOMMENDATIONSDuring the period 2007 to 2010, the EU-Greenland Fisheries Partnership Agreement has clearlybeen of immense mutual benefit to the parties. It is highly relevant to the policy objectives ofboth. The Fisheries Partnership Agreement has been effective, with a good level of utilisation ofthe fishing opportunities provided with associated financial and economic benefits, and hasallowed the implementation of a much strengthened policy framework for sustainable fisheriesby Greenland (particularly in terms of research and fisheries control). The Fisheries PartnershipAgreement has not been as efficient as it could have been, due to the inclusion of some quotaswhich are not available, or not commercially viable, and due to rigidities in the licensing system,all of which have contributed to underutilisation of some fishing opportunities. The FisheriesPartnership Agreement has not been sustainable with regard to three of the 10 stocksconcerned, and it has not therefore been in line with the principles of responsible fishing.However there are positive steps underway to address this concern in relation to two of thestocks. Given the major achievements in ensuring the functioning of the Fisheries PartnershipAgreement, and the goodwill and mutual benefits this has generated, all efforts should be madeto keep it in place by renewal of the Protocol, and to ensure a more sustainable implementationof the Fisheries Partnership Agreement in future.The parties are therefore recommended to consider establishing a renewed protocol for a periodof three years from 2014. This would allow for timely introduction of a subsequent protocolwhich will be adjusted to ensure full coherence with any renewal of the Overseas AssociationDecision and the Greenland Partnership Agreement. This will also allow for new measureswithin the reformed Common Fisheries Policy to be reflected in the design of a new FisheriesPartnership Agreement and Protocol, and also allow adjustment to achieve coherence withother emerging EU policy areas, including the EU’s Arctic Policy in relation to maritime andenvironmental matters.
Final Report - page103
Fisheries Partnership Agreement FPA 2006/20
FPA 35/GRE/11
11 ANNEXESAnnex 1: Quotas Delivered under the EU-Greenland Fisheries Partnership AgreementTable 1: Quotas Delivered under the EU-Greenland Fisheries Partnership Agreement 20072007QUOTASPROTOCOLCODREDGHL WGHL EPRA WPRA EHAL WHAL ECAPSNCBYCTOTAL1,00010,8382,5007,5004,0007,0002001,20055,0005002,60092,338EU1,0006,0491,5507,0714,0002,60001,00005002,12325,893NOR03,50080080003,250200200004779,2271,57544,27544,2751,15020015075FROICETOTAL1,0009,7492,5007,9464,0007,0002001,20044,2755002,60080,970DIFFERENCE01,0890-446000010,7250011,368REFPRICE1,8001,0532,5712,5711,6001,6004,3484,3481002,4100VALUE01,146,7170-1,146,66600001,072,500001,072,551
Source: European Commission; FIDES database; consultants estimate
Final Report - page104
Fisheries Partnership Agreement FPA 2006/20
FPA 35/GRE/11
Table 2: Quotas Delivered under the EU-Greenland Fisheries Partnership Agreement 20082008QUOTAS OFFEREDPROTOCOLCODREDGHL WGHL EPRA WPRA EHAL WHAL ECAPSNCBYCTOTAL3,5008,0002,5007,5004,0007,0002001,20055,0005002,30091,700EU3,5004,3001,5506,6014,0002,60001,00005002,18026,231N0R03,50080082403,250200200001208,8941,57523,71623,7161,15020015075FROICETOTAL3,5008,0002,5007,5004,0007,0002001,20023,7165002,30060,416DIFFERENCE0000000031,2840031,284REFPRICE1,8001,0532,5712,5711,6001,6004,3484,3481002,4100VALUE000000003,128,400003,128,400
Source: European Commission; FIDES database; consultant’s estimates
Final Report - page105
Fisheries Partnership Agreement FPA 2006/20
FPA 35/GRE/11
Table 3: Quotas Delivered under the EU-Greenland Fisheries Partnership Agreement 20092009QUOTAS OFFEREDPROTOCOLCODREDGHL WGHL EPRA WPRA EHAL WHAL ECAPSNCBYCTOTAL3,5008,0002,5007,5004,0007,0002001,20055,0005002,30091,7001,00005002,30025,9161208,8941,7600EU3,0004,8001,5506,6014,0002,1653,50075751,335N0R5003,00080082420015075FROICETOTAL3,5008,0002,5007,5004,0007,000751,07505002,42036,570DIFFERENCE00000012512555,0000-12055,130REFPRICE1,8001,0532,5712,5711,6001,6004,3484,3481002,410022,401VALUE000000543,500543,5005,500,000006,587,000
Source: European Commission; FIDES database; consultant’s estimates
Final Report - page106
Fisheries Partnership Agreement FPA 2006/20
FPA 35/GRE/11
Table 4: Quotas Delivered under the EU-Greenland Fisheries Partnership Agreement 20102010QUOTAS OFFEREDPROTOCOLCODREDGHL WGHL EPRA WPRA EHAL WHAL ECAPSNCBYCTOTAL3,5008,0002,5007,5004,0007,0002001,20055,0005002,30091,7001,00005002,18026,8111206,9941,94511,500EU2,0006,1151,8506,6014,0002,5653,100757511,5001,335N0R5001,50080082438515075FROICETOTAL2,5008,0002,8007,5004,0007,000751,07511,5005002,30047,250DIFFERENCE1,0000-30000012512543,5000044,450REFPRICE1,8001,0532,5712,5711,6001,6004,3484,3481002,410022,401543,500543,5004,350,000006,465,700VALUE1,800,0000-771,30000
Source: European Commission; FIDES database; consultants estimates
Final Report - page107
Fisheries Partnership Agreement FPA 2006/20
FPA 35/GRE/11
Table 5: Quotas Delivered under the EU-Greenland Fisheries Partnership Agreement 20112011QUOTAS OFFEREDPROTOCOLCODREDGHL WGHL EPRA WPRA EHAL WHAL ECAPSNCBYCTOTAL3,5008,0002,5007,5004,0007,0002001,20055,0005002,30091,7001,0005,3265002,30032,7794,874010,074EU2,5005,2271,8506,1764,0003,9003,100757510,074800824N0RFROICETOTAL2,5005,2272,6507,0004,0007,000751,07515,4005002,30047,727DIFFERENCE1,0002,773-1505000012512539,6000043,973REFPRICE1,8001,0532,5712,5711,6001,6004,3484,3481002,410022,40108,034,319VALUE1,800,000287,469-385,6501,285,50000543,500543,5003,960,000
Source: European Commission; FIDES database; consultants estimates
Final Report - page108
Fisheries Partnership Agreement FPA 2006/20
FPA 35/GRE/11
Annex 2: Annual catches and values of catchesTable 1: Average annual prices2007CatchCodRedfishOceanic redfishHalibutGreenland halibutCapelinShrimp11
2008Average price3
2009Average price3
Values6,911,5082,484,0291,835,62135,2211,987,3424,247,190229,006
Catch28,85538,2566,7858511,121138,0892,193
Values7,197,7615,579,387921,25445,8003,960,1951,845,507303,156
Catch33,12530,18915,1406914,75013,9294,716
Values7,719,3505,429,8333,527,32530,5886,755,801412,334813,752
Catch
Values
Average price3
(tonnes) (1,000 ISK) (EUR/tonne)32,43426,34519,919689,049294,0662,026
(tonnes) (1,000 ISK) (EUR/tonne)
(tonnes) (1,000 ISK) (EUR/tonne)
(tonnes) (1,000 ISK) (EUR/tonne)130,647 33,264,59040,13914,79438010,88837,0526,5148,569,1363,478,874308,8195,493,3361,351,9531,259,785
2,4371,0781,0545,9242,5121651,293
1,7191,0059353,7122,45392952
1,3491,0411,3492,5662,652171999
1,5521,3011,4334,9523,0742221,179
Notes:Source statistics Iceland (http://www.statice.is/Statistics/Fisheries-and-agriculture ) with prices taken for landings of fish frozen at sea.12
Capelin and shrimp prices based all on landings fresh/frozenOther species based on frozen at sea only, except 2010 data preliminary only (all based on landings fresh/frozen)Exchange rates used (Exchange 1 EUR=ISK)200787.432008145.142009172.732010164.103
3
Final Report - page109
Fisheries Partnership Agreement FPA 2006/20
FPA 35/GRE/11
Annex 3: Dependency of EU bilateral exchanges with third countries on the EU Greenland FPATable 1: Dependency of EU bilateral exchanges with Norway2007SpeciesGreenland stocksCAPELINPRAGHL WGHL EREDHAL EHAL WBYCCODTOTAL Greenland StocksEU stocksLING/B.LINGB.LINGMACHERRINGHORSE MACKBLUE WHTINGHERRINGSpratGHLSANDEELOTHER BYCTotal EU StocksTOTAL% from Greenland110.30.80.10.1250.80.125 18,8120.80.10.519,16228,03232%2,631.5 10,41318,286.5 19,10786%46%1,538 10,35016,452 19,24491%46%1,530 10,35017,069 17,34491%40%1,53014,56489%7,22966,37289%350CE Ratio0.130.80.80.873.83.80.513,2508008003,50020020012008,870ActualCod equiv09,7506406403,04576076060015,65500000002,351.5 10,0632803503,2508008243,50010010012008,694Actual2008Cod equiv09,750640659.23,04538038060014,91400000001,258 10,000280350Actual03,5008008243,00075751205008,8942009Cod equiv010,5006406592,6102852856050015,5390000000280Actual03,1008008241,50075751205006,9940000000350201009,3006406591,3052852856050013,03400000001,25028059,143NorwayCod equiv 2007-10
1,250 10,000
Source: European Commission, Agreed records of bilateral fisheries negotiations, 2007 to 2010.
Final Report - page110
Fisheries Partnership Agreement FPA 2006/20
FPA 35/GRE/11
Table 2: Dependency of EU bilateral exchanges with FaroesSpeciesGreenland stocksCAPELINPRAGHL WGHL EREDHAL EHAL WBYCCODTOTAL Greenland StocksEU stocksLING/B.LINGB.LINGMACHERRINGHORSE MACKBLUE WHTINGHERRINGSpratGHLSANDEELOTHER BYCTotal EU StocksTOTAL% from Greenland110.30.80.10.80.1250.80.10.560,77562,5003%9,402 46,77513,281 48,50029%4%CE RatioCE Ratio Actual0.130.80.80.873.83.80.5115001,7252502003,9556602,5505009,16001,150150752002007Cod equiv03,45012060174007503,8792502001,1875282554001,145015001,7252502003,6056602,5505009,16001,15015075200Actual2008Cod equiv03,45012060174007503,8792502001,0825282554001,1450Actual01,3351507520000001,7602502004,7986605,0005009,16002,5001507,591 33,71811,470 35,47834%5%2009Cod equiv04,0051206017400004,3592502001,4395285001,3134001,145025075Actual01,3351507538500001,9452001504,5366602,0009,0004509,16002,5001502010Cod equiv04,0051206033500004,5202001501,3615282001,1253601,1450250755,3949,91446%28,48645,12337%16,637Faroes2007-10
0.125 43,500
5,438 29,850
3,731 10,500
6,100 28,80610,459 30,75142%6%
Source: European Commission, Agreed records of bilateral fisheries negotiations, 2007 to 2010.
Final Report - page111
Fisheries Partnership Agreement FPA 2006/20
FPA 35/GRE/11
Table 3: Dependency of EU bilateral exchanges with IcelandSpeciesGreenland stocksCAPELINPRAGHL WGHL EREDHAL EHAL WBYCCODTOTAL Greenland StocksEU stocksLING/B.LINGB.LINGMACHERRINGHORSE MACKBLUE WHTINGHERRINGSpratGHLSANDEELOTHER BYCTotal EU StocksTOTAL% from Greenland110.30.80.10.1250.80.1250.80.10.5028,490100%0100%0100%02,372100%000%00%0100%01,150100%06,371100%2,849 23,7160 11,500CE RatioCE Ratio30.80.80.873.83.80.5128,490Actual0.1 28,4902007Cod equiv000000002,849 23,7160000000000Actual2,849 23,71620082,372000000002,372000000000000000000000000000002009Actual000000000000000000 11,500000000000000000002010Cod equiv1,150000000001,1500000000006,371Iceland2007-10Cod equiv Actual Cod equiv
0 11,500
Source: European Commission, Agreed records of bilateral fisheries negotiations, 2007 to 2010.
Final Report - page112
Fisheries Partnership Agreement FPA 2006/20
FPA 35/GRE/11
Annex 4: Scientific advice, adopted TACs, and catches for stocks of relevance to the FPA during theperiod of the current protocol (2007-2011).Note that quotas offered to the EU may be used in exchanges with other third countries, so catches are given for these 3rdcountries (i.e. Norway,Iceland, Faroe Islands) and total catches taken in the context of the FPA should account for these.SpeciesStock AreaTAC & CatchAdviceTAC (GRL)Total catchCodNAFOICES XIV1,FPA quotaEU catch (GRL)OthercountriesFPA catchAdviceTACTotal catchGRL TACGreenlandhalibutICES V, VI,XII, XIVFPA quotaTotal EU catchEU catch (GRL)OthercountriesFPA catch3rd3rd200705,00016,0001,000953095315,00027,00021,00013,5007,946n/a6,6704067,0762008015,00025,0003,5003,43503,43515,00026,00024,00013,0007,500n/a6,5178987,4152009020,00013,0003,5001,52201,5225,00025,00028,00012,5007,500n/a6,448616,50912,0007,500n/a6,4498997,34813,0007,000Notsustainable;risk of collapse2010010,0009,0002,5006132909035,00024,0005,00026,000Shared stock between Iceland, Greenland and theFaroes;GRL sets TAC at 50% of the total TAC (13,000 t in2011);No management agreement in place and TACs setautonomously, exceeding advice by far2,500Notsustainable;impeding recoveryof fishery2011015,000GRL stock – TAC set by GRL authorities;TAC levels do not follow the scientific advice andappear to be too high (set according to socio-economic concerns) relative to spawning stockSustainabilityComment
Final Report - page113
Fisheries Partnership Agreement FPA 2006/20
FPA 35/GRE/11
Species
Stock Area
TAC & CatchAdviceTACTotal catch
2007073,00059,00014,8129,7499,5921,3761991,575IncludedaboveIncludedabove6,000Includedaboven/an/an/a5,000226None0
200820,00073,00030,00014,8128,0005,0131,2193,6164,835IncludedaboveIncludedabove2,000Includedaboven/an/an/a1,00092None0
200920,00072,00052,00014,8128,0007,1162,1802002,380IncludedaboveIncludedabove3,500Includedaboven/an/an/a1,000895None0
201020,00072,000
201120,00038,000
Sustainability
Comment
Shared stock;14,8128,0008,500?Notsustainable;overfishedFollowing international agreement in 2011(Iceland, Greenland, Faroe Islands, EU andNorway) GRL allocated share of TAC is 22.35%Agreed management measures will place3,2911,7004,9910Includedabove00Notsustainable;collapse of fishery0Shared stock;Allocation agreement signed in 2011(Iceland, Greenland, Faroes, EU and Norway)According to the agreement the fishery should beclosed (allowing for some bycatch)TAC in line with advice by 2014
Deep pelagicRedfish
ICES V, XII,XIV, NAFO 1,2
GRL TACFPA quotaTotal EU catchEU catch (GRL)OthercountriesFPA catchAdviceTAC3rd
ShallowpelagicRedfish
ICES V, XII,XIV, NAFO 1,2
Total catchFPA quotaTotal EU catchFPA catchAdviceTAC (GRL)
Includedabove
n/a6,000
n/a8,500Notknown;precautionaryadvice not adopted
GRL stock for the newly defined GRLSebastesmentellastock by ICES – TAC set by GRLauthorities;Stock structure not known; no stock assessment soprecautionary advice is to not allow increase whilethis is clarified (maintaining catches below 1,000 t);this advice is not followed by GRL authoritiesMixed fishery ofS.mentelladominated by the first.andS.marinus,
DemersalRedfish
ICES XIVb
Total catchFPA quotaFPA catch
None0
None
Final Report - page114
Fisheries Partnership Agreement FPA 2006/20
FPA 35/GRE/11
Species
Stock Area
TAC & CatchAdviceTAC (GRL)Total catch
200712,40012,4004,6007,0009682,3343,302n/an/a
200812,40012,4002,8007,0006032,1452,748n/an/a147
200912,40012,4004,8907,0008031,3512,154n/an/a591,2000000015,000000000
201012,40012,4004,1007,0001,3831,6653,048n/an/a
201112,40012,400
Sustainability
Comment
Shared stock between GRL and Iceland, butmanaged independently by GRL authorities withsetting of national TACSustainableCatches in Iceland have become negligible and arenot regulatedGenerally low uptake of available quota appears tobe due to difficult fishing conditions in the area
Shrimp
ICES XIV
FPA quotaEU catch (GRL)OthercountriesFPA catchAdviceTAC (GRL)Total catch3rd
n/an/aNot known;probably overfishedNo stock assessment and no advice availableDirect fishery allowedGreenlandwithlonglineonly in
Atlantichalibut
ICES XIV
FPA quotaEU catch (GRL)OthercountriesFPA catchAdviceTACTotal catchGRL TAC3rd
1,2000131131385,000385,000377,000
1,2000100100207,000207,000202,00033,880
1,07505656150,000150,000151,00016,61011,5000000
1,075
390,000390,000391,00042,90015,400SustainableShared stock (Iceland, GRL and Norway).Internationally agreed allocation of 11% of totalTAC to GRLLow/variable abundance appears to be linked toenvironmental conditions primarily, not overfishing
Capelin
ICES V, XIV,IIa
FPA quotaTotal EU catchEU catch (GRL)OthercountriesFPA catch3rd
44,2750028,49028,490
23,7160023,71623,716
Final Report - page115
Fisheries Partnership Agreement FPA 2006/20
FPA 35/GRE/11
Species
Stock Area
TAC & CatchAdviceTAC (GRL)
2007130,000152,400144,2004,0003,52024,00024,00023,0002,5001,5179502,4674,5804,5802,18950003rd
2008110,000145,700152,7004,0003,80324,00024,00022,0002,5001,5169502,4663,8303,8302,3505000
2009110,000133,000135,3004,0003,88324,00024,00025,0002,5001,5111501,6613,8303,8303,1655000
2010110,000133,000138,5004,0003,86327,00027,000
2011120,000142,500
Sustainability
CommentShared stock between GRL and Canada, but thereis no agreement on allocation;Canadian catches are now almost negligible.
Shrimp
NAFO 0, 1
Total CatchFPA quotaEU catch (GRL)AdviceTAC (GRL)Total Catch
Risk of overfishing;4,000GRL TAC: 124,000
Managed independently by GRL authorities -set TACs are consistently higher thanscientific advice (by about 22,50 tonnes), asGreenland andCanada set TACs independently
27,00027,000SustainableShared stock between GRL and Canada (offshorecomponent),where allocation has been agreed(50%-50%)Adopted TACs are consistent with the scientificadvice
Greenlandhalibut
NAFO 0, 1
FPA quotaEU catch (GRL)OthercountriesFPA catchAdviceTAC (GRL)
2,8001,7666312,3972,2302,230
2,650
GRL TAC: 13,500
2,3300GRL stock – TAC set by GRL authorities;Recovering fromoverfishingConcerns the offshore component of the stock,which is recovering from overfishing;Offshore fisheries closed in 20110
Snow crab
NAFO 0, 1
Total CatchFPA quotaEU catch (GRL)
5000
Final Report - page116
Fisheries Partnership Agreement FPA 2006/20
FPA 35/GRE/11
Species
Stock Area
TAC & CatchAdviceTAC (GRL)Total Catch
2007n/an/a
2008n/an/a32
2009n/an/a1475000
2010n/an/a
2011n/an/a
Sustainability
Comment
Atlantichalibut
NAFO 0, 1
No stock assessment and no advice available7500075Not known;probably overfishedDirect fishery allowedGreenlandwithlonglineonly in
FPA quotaEU catch (GRL)OthercountriesFPA catch3rd
200055
20001717
Sources: ICES, European Commission, DG MARE, GFLK Greenland, Greenland Statistics and consultants estimates.Note: Catches by 3rdcountries in 2009, taken in the context of the FPA, are low because of nil uptake of fishing opportunities by Norway in 2009. This is considered to be anexceptional year, so 3rdcountry average catches do not consider 2009 (when calculating impacts).
Final Report - page117