Det Energipolitiske Udvalg 2010-11 (1. samling)
L 141 Bilag 5
Offentligt
June 2010
An assessment of cumulative CO2reductions from carbon capture andstorage at coal fuelled plants in a carbon constrained worldPalle Bendsen and Kim Ejlertsen, Energy and Climate Group, NOAH Friends of the Earth Denmarkpalle @ noah.dk; kim @ noah.dk; www.noah.dkAbstract.This brief study endeavours to estimate the extent of contributions from Carbon Captureand Storage (CCS) to cuts in global CO2emissions under certain explicit assumptions as todeployment of the technology, capture efficiency, energy penalty and overall emissions from fossilfuels in the medium and long term perspective. The cumulative emissions captured and thecumulative emissions to the atmosphere in a CCS-scenario are assessed in order to identify thecumulative emissions avoided due to CCS. These estimates are finally put in perspective of theremaining global 2oCelsius budget for CO2.1The study’s focus is on coal fuelled mainly powergeneration plants. The study indicates contrary to most reports and studies that CCS cannotdeliver significant reductions in time to play a role in the effort of keeping the global temperatureincrease below 2oCelsius. The estimated cumulative avoided emissions from CCS on coal 2010-2050 will amount to 11% of the cumulative emissions from all coal fuelled plants. The cumulativeemissions to the atmosphere that will take place despite deployment of CCS will make demandson 89% of the remaining 2oCelsius CO2-budget for fossil fuels or 212% of the proportion of theremaining 2oCelsius CO2-budget that could be allotted to coal.
1. IntroductionCCS (Carbon Capture and Storage) is a controversial high cost mitigation technology designed toplay a major role in future climate policies all over the world. CCS is repeatedly referred to as animportant bridging technology. The technology ideally serves a double purpose of allowing fossilfuels, primarily coal, to continue to be a substantial part of the future global energy supply while atthe same time abating climate impacts from fossil fuel sources. Yet this immature technologyfeatures a number of large problems like cost, funding, additional energy and water consumptionand other detrimental environmental effects.2,3One extremely important aspect of CCS as a climatetool, however, has been practically neglected in the extensive literature on the subject: its actualaggregate effect on the climate system.In order to properly assess CCS as mitigation technology over the next decades all the facilities inone sector or in all sectors that reasonably could be equipped with CCS would be included. In thisstudy it is coal fuelled power generation and industries that are considered.It is important to look not only at a snapshot of “one facility” or of one year in the future (e.g. 2030,2040 or 2050) but the whole film, i.e. the whole period from now and till 2050. Viewing carboncapture and storage in relation to the available carbon budget will reveal the overall effect ofapplying the technology.
1
The budget approach“Latest research shows that there is only a realistic chance of restricting global warming to 2 �C if a limit isset on the total amount of CO2 emitted globally between now and 2050 (CO2 global budget).”4
The overall frame is the available greenhouse gas – GHG – budget, which is an expression of thecumulative amount of GHG that can be emitted to the atmosphere in the future (e.g. the rest of thecentury or as in this study before 2050) if the CO2-eq-concentration in the atmosphere is to be keptbelow a certain level. Setting 2050 as the far end of the perspective is justified in light of thewarnings from recent science, e.g. Climate Change, Global Risks, Challenges and Decisions(2009)5, Meinshausen et. al. (2009)6and Copenhagen Diagnosis (2009)7“Specifically, cumulative CO2 emissions to 2050 will largely determine the extent to which globaltemperature rise can be kept within the 2 �C guard rail. In order to achieve this with a probability of 67 %,CO2 emissions to midcentury must be capped at around 750 Gt, with only a small residual amount beingemitted post-2050. At current emissions rates, however, this CO2 budget will be exhausted within around825 years – and even sooner if emissions continue to rise.”
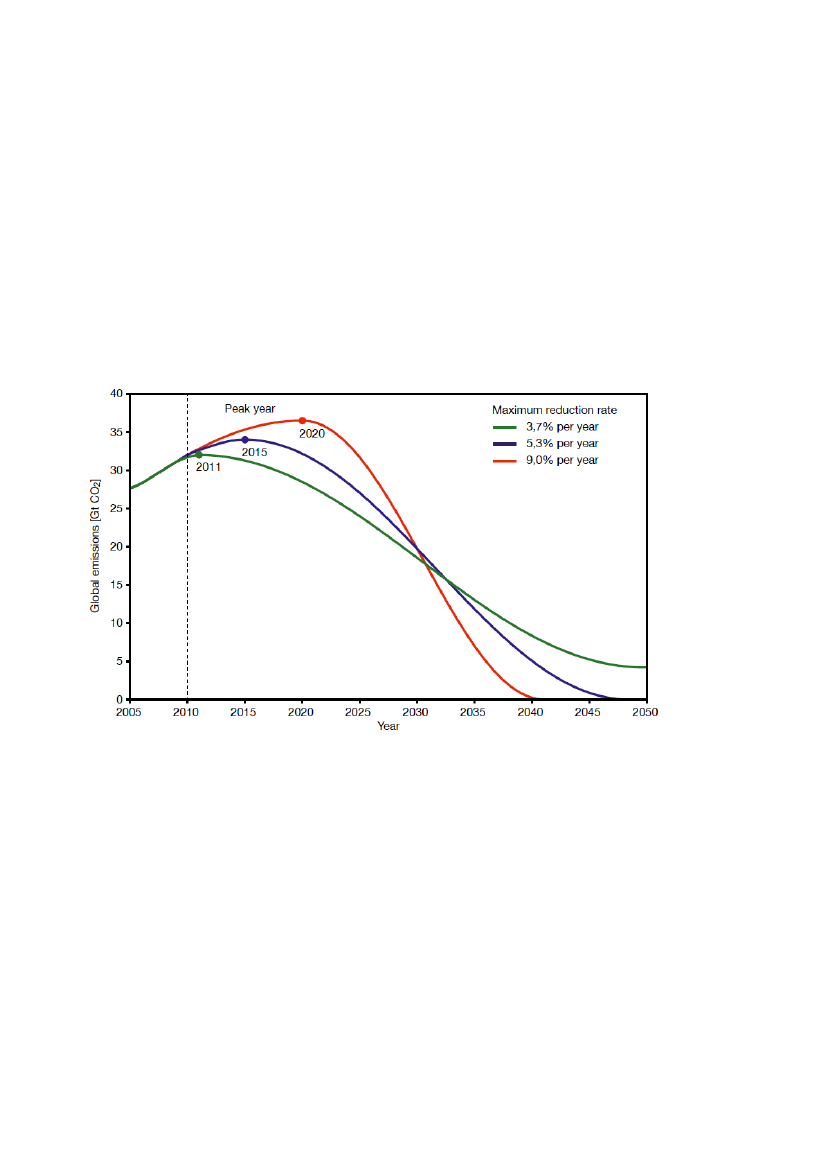
Figure 1.“Examples of global emission pathways for the period 2010–2050 with global CO2emissionscapped at 750 Gt during this period. At this level, there is a 67 % probability of achieving compliance with the2 � guard rail (…). The figure shows variants of a global emissions trend with different peak years: 2011C(green), 2015 (blue) and 2020 (red). In order to achieve compliance with these curves, annual reductionrates of 3.7 % (green), 5.3 % (blue) or 9.0 % (red) would be required in the early 2030s (relative to 2008).”Source: WBGU, p. 16, Figure 3.2-1
Figure 1 is a strong illustration of the emergency in the present situation. Climate action has to benow and it must be all-encompassing. Yet the pathways in Figure 1 reflect a 33% probability ofexceeding a 2oCelsius rail. The global budgets in the present paper refer to a 20% probability ofexceeding the 2oCelsius global warming which would make the pathways in Figure 1 even steeper.“If the acceptable exceedance probability were only 20%, this would require an emission budget of 890 GtCO2 or lower (illustrative default). Given that around 234 Gt CO2 were emitted between 2000 and 2006and assuming constant rates of 36.3 GtCO2 yr-1(ref. 3) thereafter, we would exhaust the CO2 emissionbudget by 2024, 2027 or 2039, depending on the probability accepted for exceeding 2oC (respectively 20%,25% or 50%).”9
Under these conditions the budget is calculated to be 543 Gt CO2 for all CO2 emissions or 400 GtCO2 for fossil fuel emissions alone for 2010-2049.2
The CCS reports we have studied to date have not given any assessment of the influence of largescale deployment of CCS on the remaining CO2budgets. In fact they do not include the perspectiveof having a restricted budget. The questions for this study are therefore:A. How much could a large scale deployment of CCS contribute to cut emissions of greenhousegases to the atmosphere seen in the perspective of a constrained CO2 budget?B. How large will the emissions to the atmosphere be despite large scale deployment of CCS?C. Will CCS be able to meet the urgency in a situation where emissions must peak before 2015?2. MethodologyDefinitions and boundaries
This study focuses on coal fuelled plants only and does not include other greenhouse gases thanCO2 except emissions of methane pertaining to coal mining that are considered in relation to theassessment of CO2 efficiency. Consequently emissions are calculated as CO2, not CO2-equivalent.We define avoided emissions due to CCS as the difference between 1) the cumulated emissionsfrom all sources in a system without CCS and 2) the cumulated emissions in a system with CCS.This definition goes beyond the definition used by IEA:“tCO2 avoided: the level of emissions abatement achieved by CCS-equipped facilities relative to theemissions of an equivalent facility (i.e., with the same output) without CCS.”10
IEA’s definition does not include the emissions outside the capture process of a single facility.11Itdoes not take the whole sector in consideration and it does not consider the emissions accumulatedover time. [See also our definition of CO2efficiency below under point 4.]In the calculation of cumulated avoided emissions 2010-2049 from CCS the following parametersare taken into consideration:1.2.3.The deployment of CCS as aggregate CCS-capacity on coal fuelled plants 2010-2050.The energy penalty, “the percentage of additional energy that would have to be used to generatethe same amount of electricity.”12i.e. extra energy consumption due to the capture process.The capture efficiency; expresses a single facility’s ability to separate and remove CO2fromthe flue gas.13It is the amount of CO2emissions that is actually captured in the capture part ofthe plant divided by the amount of CO2emissions that enter the capture process with the fluegas. It is often rendered as a theoretical 85%, which is also used here.The CO2efficiency; an expression of the whole sector’s ability to separate and remove CO2given that CCS is deployed on a large scale. We define it as the amount of CO2emissions thatare actually captured in the sector divided by the amount of CO2emissions generated fromextraction to underground storage. They include upstream emissions pertaining to extractionand transportation of coal, one-off emissions from building of CCS plants and building oftransport infrastructure, emissions under operation from the capture process and compressionof CO2, downstream emissions from transport and injection into the storage and finallyemissions connected with monitoring of and leakages from the storage for an extended period.The global emissions from all coal fuelled power plants and industries without CCS.The global emissions from all coal fuelled power plants and industries with CCS.
4.
5.6.
Calculations
In order to single out the importance of CCS on coal to the global 2oCelsius CO2budget we havechosen a scenario close to the WEO / Blue Map Scenario14which is the basis for IEA TechnologyRoadmap Carbon Capture and Storage (2009)15. The BLUE Map has a reduction pathway aiming at
3
50% reductions by 2050 (down to about to 14 Gt CO2) compared to 2005 but with an unabatedbaseline assuming a rise in CO2emissions from about 28 Gt in 2005 to 62 Gt in 2050.We have several reservations concerning assumptions of the primary demand for energy services orthe inclusion of nuclear in the mix of mitigation tools in the BLUE Map. We also consider 50%reductions by 2050 compared to 2005 to be insufficient in order to stay below the 2oCelsius ceiling.Still we have chosen to make our calculations on a basis that resembles the BLUE Map reductionspathway because the IEA’s perspective is one of the most authoritative in relation to CCS. Ourresults can be debated on a level ground by being put into that well-known perspective.2010 2020 2030 2040 2050I BLUE Map Baseline30.0 38.0 40.2 52.1 62.0 Gt CO2II BLUE Map excluding CCS30.0 27.5 24.9 23.3 21.6 Gt CO2III This study’s standard baseline 30.0 27.3 23.8 20.7 17.5Gt CO2IV BLUE Map Scenario30.0 27.0 22.8 18.1 13.4 Gt CO2Table 1.BLUE Map Baseline; reductions curve in BLUE Map excluding CCS; baseline of this study’sstandard scenario; BLUE Map reductions’ curve including CCS.
The numbers for emissions 2010-2050 from all fossil fuels in our baseline (Table 1, III) areestimates from readings of the emissions curves in the BLUE Map Scenario (Table 1, IV) under thesupposition that the reductions from the other mitigations tools are effectuated. Table 1, II showsthe values from BLUE Map Scenario excluding the abatement from CCS. Our baseline is set as themean value between II and IV.The point of departure of the calculation is therefore a situation where energy development and thewhole portfolio of mitigation tools are deployed as envisaged in the BLUE Map. Herein theircontributions to reductions of the expected 48 Gt CO2in the year of 2050 are: Nuclear 6%;Renewables 21%; Power generation efficiency and fuel switching 7%; End use fuel switching 11%;End use electricity efficiency 12%; End use fuel efficiency 24%. CCS industry and fuelstransformation (upstream) is expected to contribute with 9%. CCS power generation is set tocontribute with 10%. This does not distinguish between the fuels.There is a coal part in CCS industry and a gas part in CCS power generation. In order to makecalculations on CCS on emissions from coal fuelled plants we estimate that emissions from coal areroughly fifty per cent of emissions from industry and power with CCS. This estimate allows us todeal with emissions from coal fuelled plants in a scenario that reasonably well resembles thereductions pathway in BLUE Map.Standard scenarioAEmissions from all fossil fuelsBEmissions from coal fuelled plants (no CCS)CDeployment of CCSDEFGHIJ
Calculated asRe Table 142 % of AEstimateB*1.25* C/100B*(100-C)/100D+ED*0.77F-GB-H(I/B)*100
2010-2019
2020- 2030- 2040-2029 2039 2049
2010-2049
2871211111912111201
2561088119911081026
2239424287199227716
191 Gt CO280 Gt CO240%40 Gt CO24888315723Gt CO2Gt CO2Gt CO2Gt CO2Gt CO2
95740280337418623564611%
Emissions from plants with CCS, incl. 25%energy penaltyEmissions from plants without CCSEmissions total (with and without CCS)Emissions storedEmissions to the atmosphere despite CCSAvoided emissionsAvoided emissions as percentage
Table 2.The numbers for emissions from all fossil fuels (A) are estimates from readings of the emissionscurve in IEA’s BLUE Map scenario. The ratio for emissions from coal vs. all fossil fuels is from IEA’s keyWorld statistics (2009). This ratio is kept unchanged in all four decades. In WEO 2006 Reference Scenario16the same ratio between coal, oil and gas is unchanged from 2004 through 2030.
4
Variables with reference to Table 2
A: Emissions from all fossil fuels.The figure for 2007 was 29 Gt CO217. We have extrapolated thisto be 30 Gt CO2in 2010. Emissions in Table 2, row A are calculated from the figures in Table 1, III.B: Emissions from coal fuelled plants (no CCS).The part of CO2emissions from coal has beenset at 42%18as percentage of all fossil fuels emissions from 2010 through 2050. These emissionsrepresent the 100% potential for deployment of CCS on emissions from coal.C: Deployment of CCS on coal fuelled plants.The deployment has been estimated as percentagesper decade of the full potential of CCS on coal (B): 1 – 8 – 24 – 40 per cent throughout the fourdecades. In an alternative calculation the deployment is ramped up dramatically to 1 – 11 – 50 – 90per cent throughout the four decades.D: Emissions from plants with CCS, incl. 25% energy penalty.The energy penalty has been setin the low end, namely 25%.19E: Emissions from plants without CCS.Calculated as a fraction of the emissions from coalfuelled plants (no CCS) (B). The fractions are 99% – 92% – 76% – 60%. In the alternativecalculations with the speedy deployment the fractions are 99% - 89% - 50% - 10%.F: Emissions total.Sum of emissions from plants with CCS (D) and emissions from plants withoutCCS (E).G: Emissions stored.The net CO2efficiency is calculated to be 77% based on 85% captureefficiency and on upstream and downstream emissions estimated to be 8% (most likely a lowestimate20. See Viebahn et.al (2007) op.cit.Hence emissions stored are 77% of emissions fromplants with CCS (D)H: Emissions to the atmosphere.Emissions to the atmosphere are emissions total (F) minusemissions stored (G).I: Avoided emissions.Avoided emissions are the cumulated emissions from coal fuelled plants ina system without CCS (B) and the cumulated emissions to the atmosphere in a system with CCS.(H).J: Avoided emissions as percentage.Avoided emissions (I) as percentage of emissions from coalfuelled plants (no CCS) (B)
Emissions and Budgets 2010-204912001000800GtCO26004002000957
400
402168
I: All fossil fuels
II: Global CO2 budget2010-49
III: Emissions from coal
IV: Global CO2 budgetfor emissions from coal
Figure 2.Emissions 2010-2049 from all fossil fuels are calculated to be 957 Gt CO2(Table 2, row A), andthe emissions from coal fuelled plants are calculated to be 402 Gt CO2as 42% of the overall fossil fuelsemissions (Table 2, row B). The global CO2budget for all fossil fuels is calculated to be 400 Gt CO2. Thebudget for emissions from coal is 168 Gt CO2provided a constant 42% share of emissions from coal.
5
The 400 Gt CO2 for all fossil fuels is derived from Meinshausen et al.(2009), which has a budget of886 Gt CO2 for the period 2000-2049. “Given that around 234 Gt CO2 were emitted between 2000and 2006 and assuming constant rates of 36.3 GtCO2 per year” in 2007-2009, the remaining budget2010-2049 is 543 Gt CO2 from all sources with a 20% probability of exceeding 2oCelsius for sucha budget. The fossil fuels share of the total CO2-budget is 73.8% of the overall CO2-emissionsaccording to IPCC AR4 Summary for Policy Makers, Figure SPM 3.It is dramatic that even after abatement from the portfolio of mitigation tools: nuclear, renewables,efficiency etc. there is still 957 Gt CO2emitted, which is 239% of the global 2oCelsius CO2-budgetof 400 Gt CO22010-2049.
3. ResultsIn a scenario with decreasing CO2-emissions in the period 2010-2049 (Figure 3) CCS willcontribute cumulative avoided emissions of 46 Gt CO2or 11% compared to CO2-emissions (402 GtCO2) from coal fuelled plants in a scenario without CCS.The CO2emitted to the atmosphere is consequently 89% of the sector’s emissions or 356 Gt CO2despite aggressive deployment of CCS.Only 7 Gt CO2 will be avoided 2010-2029 despite deployment of CCS.CCS influence on 2� Celsius CO2-budget 2010-2049 for all fossil fuels: The CCS-on-coal relatedemissions (356 Gt CO2) account for 89% of the remaining 2� Celsius CO2-budget for 2010-2049 forall fossil fuels (400 Gt CO2).CCS influence on 2� Celsius CO2-budget 2010-2049 for emissions from coal: The emissions to theatmosphere (356 Gt CO2) add up to 212% of the total 2� Celsius CO2-budget for 2010-2049 foremissions from coal (168 Gt CO2) provided that coal’s share of the CO2-emissions continues at42%.
Avoided emissions due to CCSEmissions to the atmosphere despite CCS500400300200100040016846Global CO2Global CO2budget. All fossilbudget forfuelsemissions fromcoal (42%)Emissions from Avoided emission Emissions to thecoal. No-CCS due to CCSatmospheredespite CCS402356
Figure 3.Global CO2budgets and emissions from coal without CCS split into avoided emissions and21emissions to the atmosphere. The global CO2-budget for fossil fuels 2010-2049 is calculated as 56.6% ofthe total global CO2-budget of 886 Gt CO2 for 2000-2049 (Meinshausen et. al. 2009).
Gt CO2
6
Alternative calculations
90% deployment 2040-2050. In an alternative scenario with unchanged energy penalty andupstream and downstream emissions but a much faster deployment of 1% – 11% – 50% – 90% ofthe potential capacity for CCS throughout the four decades the results are as follows:Total emissions (row F) amount to 435 Gt CO2; emissions stored 127 Gt CO2; emissions to theatmosphere 308 Gt CO2; avoided emissions 94 Gt CO2; and avoided emissions as percentage 23%.This reflects a deployment where “power plants must rapidly adopt CCS over the next threedecades; by 2040, nearly all fossil-based power plants will use CCS”, as stated in IEA’sTechnology Roadmap CCS (p. 18).40% energy penalty. In an alternative scenario with deployment unchanged at 1% - 8% - 24% -40% but with a more severe energy penalty of 40% and upstream and downstream emissions of12% the results are as follows:Total emissions (row F) amount to 428 Gt CO2; emissions stored 66 Gt CO2; emissions to theatmosphere 362 Gt CO2; avoided emissions 40 Gt CO2; and avoided emissions as percentage 10%.
4. DiscussionIn order to evaluate the CCS mitigation potential in a world with a constrained carbon budget wehave created a projection for deployment of CCS 2010-2049 based on reports published by IEA,especially the IEA BLUE Map scenario. As coal is going to be the longest lasting fossil resourceand because big coal fired power plants and heavy industries using coal are the most obvious targetsfor CCS, we have focused on CCS on coal in both sectors. Coal also represents the largest reductionpotential among the fossil fuels.Below we discuss our main findings regarding A: The mitigation potential; B: The volume ofemissions to the atmosphere and C: The urgency of the climate crisis.A.The results presented in Table 2 show avoided emissions of 11%; with more aggressivedeployment the avoided emissions can increase to a maximum of 23%.The avoided emissions percentages are in any case far from the most frequent picture of CCS beingcapable to capture 85%-90% of emissions. This difference is explained by the difference inapproach: we have used a sectoral as well as a long term approach: all coal fuelled plants seen overa period of 40 years. The ordinary presentation has a single facility approach and is not concernedwith cumulative (avoided) emissions.It is indeed justified to take the broader view and look for cumulative effects since this is whatmatters from a climate perspective. The captured emissions are interesting, the avoided emissionsare more important but in the end it is the emissions to the atmosphere that matters.This is an issue of great importance since the fossil fuel industry and the CCS lobby organizationsare heavily lobbying policy makers and the general public by giving the impression that CCS canreduce the CO2 emissions in the flue gas with 85-90% and safely store it underground forever. Inthe light of our findings the message should be that CCS can only avoid a small fraction of theglobal emissions – optimistically about 11% and unrealistically with a 90% deployment up to 23%and with increased energy penalty to 40% and increased upstream and downstream emissions of12% the avoided emissions decrease to 10%.
7
B.The flip side of the avoided emissions is the emissions to the atmosphere. In our standardcalculation (Table 2 and Figure 3) the emissions to the atmosphere are 356 Gt CO2. Theseemissions are not only very large but more importantly they exceed the narrow 2oCelsius budget.This is also the case in the alternative with 90% deployment 2040-2049 which let 302 Gt CO2go tothe atmosphere.It is important to bear in mind that we have only focused on CCS on coal, representing 42% of theemissions from fossil fuels. When the emissions to the atmosphere in our standard calculation takeup 89% of the remaining 2oCelsius CO2-budget there is so little left for natural gas and oil fortransportation and other purposes that the budget will burst. We might then get 3oCelsius or even 4oCelsius with devastating effects on human societies and natural ecosystems.The BLUE Map Scenario shows unsurprisingly that the mitigation potential of CCS is largest forthe two last decades before 2050. But BLUE Map does not specify the emissions that the large pointsources will lead into the atmosphere throughout the four decades.This is the pivotal point of this study and the results we have found do not support the appreciationof CCS as an important mitigation tool. Rapid deployment of CCS on the large coal fuelled pointsources is capable of avoiding only a very small volume of emissions.We have made cautious assumptions with an energy penalty of 25%22and upstream anddownstream penalties estimated at 8%.23Increasing these to respectively 40% and 12 % did notchange the outcome much.The speed of deployment proves to be the most determining factor for CCS capacity to deliveravoidance of emissions. And this is already the biggest challenge for the whole concept: when willthe pilot and demonstration plants be developed and tested with sufficient success to bring CCS tothe market place?We consider the speed of deployment of CCS reaching a level of 40% in average for 2040-2049 asvery ambitious. The alternative based on the assumption that “nearly all fossil-based power plantswill use CCS” by 2040 is in our view unlikely given the state-of-play for CCS-development as oftoday, the enormity of the capture facilities, the infrastructure that is demanded and the need forstorage capacity within reach of each and all of these plants and not least public acceptance to liveon top of a CO2storage site or the CO2infrastructure in general.C.We set out to investigate if CCS would be able to meet the urgency in a situation whereemissions must peak before 2015. Our results show that we can only expect 1 Gt CO2 avoidedemissions before 2020 and another 6 Gt CO2 from 2020 to 2030. In the same two decades a CCSpathway will emit 120 Gt CO2 and 101 Gt CO2 respectively to the atmosphere from coal fuelledplants alone.The BLUE Map Scenario also renders reductions from CCS around 1 Gt CO2 before 2020. BLUEMap aims at 50% reductions in CO2-emissions by 2050 compared to 2005. This relates to a mere31% reduction compared to 1990, which is far from enough to keep the global average temperaturebelow 2oCelsius.The tools that deliver reductions between 2010 and 2030 in BLUE Map are mainly improvementsin end use of fuels and electricity, in power generation, fuels switch and renewables. If BLUE Mapshould be improved to deliver less than 2oCelsius these tools must be scaled up from the beginning.Very soon however every country must decide what direction of development it wants to follow:either they phase out fossil fuels or they continue investments in fossil fuel infrastructure by way ofCCS on new power plants or by retrofitting older ones. The nuclear option is not one werecommend for a number of reasons. But it obviously competes with CCS and renewables.CCS and nuclear have strong drawbacks in relation to a development of a flexible energy supplysystem based on renewables. CCS will be so expensive that in power generation there will be a8
pressure to keep the plants running around the clock delivering a constant base load very much likea nuclear power plant. In other words they cannot play a balancing role in a system with a large partof oscillating renewables like sun and wind24and the large base load will limit the room forrenewables.Likewise the social, health and environmental problems that are connected with the use of fossilfuels will not only continue but they will increase due to the extra energy consumption needed forCCS. Another factor that has received little attention with respect to CCS is the severe increase inwater consumption and water withdrawal that makes CCS an unsuitable option in inland China,India, Australia, South Africa, USA and Spain where water shortages are already a serious problem.The environmental, social and health damages due to extraction of coal are most often incurredupon people not benefitting from the energy services that rely on coal as fuel. The same would bethe case for the risks related to possible leakages from underground storage and CO2 transportinfrastructure.Several international organisations and industries with vested interests in fossil fuels especially coalseem resolved to pursue CCS. But embarking upon a CCS pathway is going to be very costly andimportant time risks to be lost by betting on CCS. It does not suffice to say that we should make useof all available tools if some of the tools are counterproductive. The results of this study indicatethat labelling CCS as a bridging technology is unfounded.Regional and national scenarios exist that are indicative of how global scenarios could be performedat the same time phasing out fossil fuels, nuclear, biofuels and without developing CCS. The report“Europe’s Share of the Climate Challenge“ (2009)25published by Stockholm Environment Institutein partnership with Friends of the Earth Europe makes the case for a reduction pathway in EU-27respecting the 2oCelsius guard rail including neither CCS, nuclear, biofuels nor offsetting. Thereport shows it is feasible to reach 40% reductions in greenhouse gas emissions by 2020 in the EU.Everywhere action plans are needed that are based on a mix of mitigation tools with the mainelements: energy savings in the developed countries and energy efficiency combined withrenewable energy like e.g. wind power in flexible local or regional energy systems to meet theenergy demands. However such action plans must also consider the non-energy emissions. Thismeans they should also include land-use, land-use-change, forest and agriculture.5. ConclusionsThe mitigation potential of CCS on coal is insignificant. Only 11% of the cumulativeemissions before 2050 will be avoided.Emissions of 356 Gt CO2 to the atmosphere despite a fast deployment of CCS will burstthe 2o
Celsius CO2
-budget.CCS cannot contribute to bring down the global emissions in time to avoid a 2o
Celsiusincrease in global temperature. In the next 20 years only 7 Gt CO2 will be avoided despitedeployment of CCS.CCS has no place in a sustainable energy future because it relies on continued use of fossilfuels and has a negative interaction with the elements of a renewable low energy system.
Acknowledgements.We thank Philip Vergragt, Tellus Institute, Boston, MA and Sivan Kartha,Stockholm Environment Institute, Somerville, MA for valuable discussion and comments.
9
1
Meinshausen, M; Meinshausen, N; Hare, W; Raper, S C B.; Frieler, K; Knutti, R; Frame, D J & Allen, M R; 2009.Nature, Vol 458|30 April 2009. Available at:http://www.nature.com/nature/journal/v458/n7242/full/nature08017.htmlGriffiths, M; Cobb, P & Marr-Laing, T; 2005. Carbon Capture and Storage: An arrow in the quiver or a silver bulletto combat climate change? A Canadian Primer, The Pembina Institute, (November 2005). Available athttp://www.pembina.org/pub/5843von Goerne, G & Lundberg, F; 2008. Last Gasp of the Coal Industry; AIR POLLUTION AND CLIMATE SERIES 21, by theAir Pollution & Climate Secretariat, (October 2008).Available at:http://www.airclim.org42
WBGU, 2009. Solving the climate dilemma: The budget approach. Special Report. (Berlin 2009). Available at:www.wbgu.de/wbgu_sn2009_en.html5
International Scientific Congress, Copenhagen 2009. Climate Change: Global Risks, Challenges & Decisions -Synthesis Report, (2009). Available at:http://climatecongress.ku.dk/pdf/synthesisreportMeinshausen et. al., 2009. op.cit.
67
The Copenhagen Diagnosis, 2009: Updating the World on the Latest Climate Science. UNSW Climate ChangeResearch Centre, Australia. (2009) Available atwww.copenhagendiagnosis.comWBGU, 2009. Op.cit. Figure 1.Meinshausen et al. , 2009. op.cit.
8910
IEA Technology Roadmap - Carbon capture and storage. (2009) p. 13. Available athttp://www.iea.org/Papers/2009/CCS_Roadmap.pdf11
IPCC, 2005. Carbon Dioxide Capture and Storage: Summary for Policy Makers. Geneva (2005). Fig. SPM.2.Available athttp://www.ipcc.ch/pdf/special-reports/srccs/srccs_summaryforpolicymakers.pdfhttp://www.co2captureproject.org/glossary.htmlhttp://ccs-info.org/klima.html;see: Operation of CCS facilities.http://www.iea.org/papers/2009/CCS_roadmap_targets_%28printing%29.pdfIEA (2009); op.cit.; fig. 1http://www.iea.org/speech/2007/ramsay/oxford.pdfhttp://www.iea.org/co2highlights/co2highlights.pdfp.44http://www.iea.org/textbase/nppdf/free/2009/key_stats_2009.pdfp.44
1213141516171819
Viebahn P, et al., Comparison of carbon capture and storage with renewable energy technologies regardingstructural, economic, . . ., Int. J. Greenhouse Gas Control (2007), doi:10.1016/S1750-5836(07)00024-2. Available at:http://www.dlr.de/tt/en/Portaldata/41/Resources/dokumente/institut/system/publications/JGGC_CCS_Paper_Viebahn_etal.pdf2021
http://ccs-info.org/klima.htmldevelops this perspective more;
IPCC,Summary for Policymakers of the Synthesis Report of the IPCC Fourth Assessment Report.Figure SPM.3.Available athttp://www.ipcc.ch/publications_and_data/publications_and_data_reports.htm22
IPCC, 2005. Carbon Dioxide Capture and Storage: Summary for Policy Makers. Geneva (2005); p.4 Available athttp://www.ipcc.ch/pdf/special-reports/srccs/srccs_summaryforpolicymakers.pdfViebahn P, et al., Comparison of carbon capture and storage with renewable energy technologies regardingstructural, economic, . . ., Int. J. Greenhouse Gas Control (2007), doi:10.1016/S1750-5836(07)00024-2.Available at:http://www.pik-potsdam.de/members/edenh/publications-1/Viebahn_etal.pdfMathiesen, B.V. (2009); Carbon Capture and Storage (CCS) renewable energy systems and economy. Presentationat Klimaforum09, 16 December 2009, Copenhagen.Heaps, C.; Erickson, P.; Kartha, S.; Kemp-Benedict, E., 2009. Europe’s Share of the Climate Challenge. DomesticActions and International Obligations to Protect the Planet. Stockholm Environment Institute.(2009)Available at:http://sei-international.org/publications?pid=1318252423
10