Udenrigsudvalget 2010-11 (1. samling)
URU Alm.del
Offentligt
EN
EN
EN
EUROPEAN COMMISSION
Brussels, 21.4.2010SEC(2010) 420 final
COMMISSION STAFF WORKING DOCUMENT
Financing for Development - Annual progress report 2010Getting back on track to reach the EU 2015 target on ODA spending?
accompanying the
COMMUNICATION FROM THE COMMISSION TO THE EUROPEANPARLIAMENT, THE COUNCIL, THE EUROPEAN ECONOMIC AND SOCIALCOMMITTEE AND THE COMMITTEE OF THE REGIONSA twelve-point EU action plan in support of the Millennium Development Goals
{COM(2010) 159}{SEC(2010) 418}{SEC(2010) 419}{SEC(2010) 421}{SEC(2010) 422}
EN
EN
STAFF WORKING DOCUMENTFinancing for Development - Annual progress report 2010Getting back on track to reach the EU 2015 target on ODA spending?
TABLE OF CONTENTS1.2.2.1.2.2.3.3.1.3.2.3.3.3.4.4.4.1.4.2.4.3.4.4.4.5.4.6.4.7.4.8.4.9.4.10.5.Financing for Development: a core ingredient of the global partnership .................... 4The path for growing out of aid dependency – efficient tax sytems in support ofdevelopment ................................................................................................................ 6Fighting corruption, illegal capital outflows and tax evasion ...................................... 6The way forward .......................................................................................................... 7Enhancing the impact of international private flows on development- an issue for a"whole of the Union" approach.................................................................................... 8Private capital flows - a favourable business climate required .................................... 8Corporate social and environmental responsibility – a way to contribute todevelopment objectives................................................................................................ 9Social and environmental considerations in public procurement rules...................... 10EU remittances: resilient to the global economic crisis? ........................................... 10ODA flows to developing countries - a crucial source of financing.......................... 14EU ODA decreased in 2009....................................................................................... 14Set to miss the agreed intermediate ODA targets of 2010 ......................................... 15Lessons learnt - the impact of EU ODA targets on policy decisions inEU Member States ..................................................................................................... 17Enabling factors for aid increases in Member States:................................................ 17How to demonstrate the EU's resolve to reach the 0.7% ODA/ GNItarget by 2015?........................................................................................................... 18International burden-sharing ...................................................................................... 20EU not acting in line with its promise on ODA to Africa.......................................... 22ODA to Least Developed Countries – EU target - still within reach......................... 24Reinforced reporting on ODA flows.......................................................................... 25A credible pathway for the future .............................................................................. 25Innovative sources and mechanisms of financing: a new debate............................... 26
EN
2
EN
5.1.5.2.6.6.1.6.2.7.7.1.7.2.7.3.7.4.8.8.1.8.2.8.3.
EU Member States lead most initiatives on innovative sources of finance ............... 27Broadening existing mechanisms and introducing new ones ................................... 29Debt sustainability and debt management capacity – major concerns....................... 29Implementing debt relief and preserving debt sustainability: all donors mustparticipate................................................................................................................... 30Next steps ................................................................................................................... 31International governance reforms – strengthening the voice and representation ofdeveloping countries .................................................................................................. 32Governance reform of the Bretton Woods institutions .............................................. 32Improved efficiency and instruments of the International Financial Institutions ...... 33United Nations governance reform ............................................................................ 34The way forward ........................................................................................................ 34Successive crises and climate change - the most important global challenges.......... 35Impact of the financial and economic crisis on developing countries ....................... 35Global public goods and global challenges................................................................ 35Climate Change financing - a major issue in the international negotiations.............. 36
Annex 1: UN Convention against Corruption (Merida Convention) - State of signatureand ratification by the EU ........................................................................................................ 43Annex 2: EU ODA levels 2006-2009, estimates and gaps for 2010........................................ 44Annex 3: ODA indicators – preparedness to meet the individual commitments ..................... 46Annex 4: The Commission methodology applied for analysing ODA indicators/ forecastsprovided by EU Member States: .............................................................................................. 48Annex 5: ODA trajectories of all EU Member States 1995 - 2015.......................................... 50
EN
3
EN
1.
FINANCING
FORPARTNERSHIP
DEVELOPMENT:
A
CORE
INGREDIENT
OF
THE
GLOBAL
This monitoring and progress report on financing for development forms part of theoverall 2010 spring 'development package'1, which proposes EU actions for speedingup progress towards theMillennium Development Goals(MDGs), to contribute tothe forthcomingUN MDG Review High Level Plenary Meeting(HLPM) inSeptember 20102.This is theeighth of the Commission's annual monitoring reports,which assesswhere the EU and its Member States stand in relation to their commitments onfinancing for development (FfD). Based on theCouncil's mandateto theCommission after the International Conference on Financing for Development in2002, progress reports ("Monterrey reports") have been presented to the Councilevery spring since 20033. The Council extended the monitoring mandate to cover aideffectiveness and aid for trade4, for which separate Staff Working Papers have beenprepared5. The report follows the structure of the Doha Declaration on Financing forDevelopment6and builds on the input provided by the EU Member States andCommission departments in the annual 'Monterrey questionnaire', which covers allEU commitments on FfD issues. EU action to support developing countries in copingwith the crisis is tackled as a crosscutting issue in this document.Financing for development aims to create a favourable environment for developmentby addressing the responsibilities of both the developing countries and the globalcommunity. At the UN Doha follow-up Conference on Financing for Developmentin 2008, the global community reiterated that mobilising financial resources fordevelopment and the effective use of all those resources arecentral to the globalpartnershipfor sustainable development. It was also recognised that each countryhas primary responsibility for its own development and that national policies,domestic resources and national development strategies are essential.The EU and other donors need to demonstrate that they are ready tolive up to theircommitments,to keep their part of the agreement on what is needed to achieve theMDGs. This report shows that despite the impact of the crisis on Member States'economies, in 2009EU Official Development Assistance (ODA)continued toincrease as a share of GNI, reaching 0.42%, but at the same time the total ODA
1
234
56
COM(2010) 159 'A twelve point action plan to support the Millennium Development Goals';COM(2010) xxx 'Tax and Development - Cooperating with Developing Countries on Promoting GoodGovernance in Tax Matters' and SEC(2010) xxx on the same subject; SEC(2010) 418 'Progress made onthe Millennium Development Goals and key challenges for the road ahead'; SEC(2010) 422 'AidEffectiveness Progress Report 2010"); SEC(2010) 419 "Aid for Trade Monitoring Report 2010';SEC(2010) 421 'Policy Coherence for Development Work Programme 2010-2013; all published on 21April 2010.http://www.un.org/millenniumgoals/Council Conclusions of 21 May 2003 and 24 May 2005.Council Conclusions of 15 May 2007 on the European Conduct of Division of Labour in developmentpolicy, Council Conclusions of 29 October 2007 on the EU Aid for Trade Strategy.See footnote 1.Doha Declaration, available at: http://www.un.org/esa/ffd/doha/
EN
4
EN
volume decreased to EUR49 billion7. Nonetheless the EU remains the world's mostgenerous donor both in absolute aid volumes (accounting for about 56% of DACODA) and in terms of relative effort (ODA as a share of GNI).This report also reveals that the EU is far from the collective EU target level of0.56% of GNI that was promised for 2010. With fair EU internal burden-sharing,however, the target of 0.7% of GNI by 2015 is still attainable. Other donors have yetto demonstrate similar efforts. According to OECD estimates for 20108the DACaverage ODA spending will be 0.31% of GNI, with the US and Japan expected tostand at only 0.20% and 0.18% respectively, and Canada at 0.30%. Based on theforecasts of the 27 EU Member States, the Commission estimates that the EU willprovide in 2010 collectively 0.45-46% of its income as ODA.The Monterrey Consensus and the Doha Declaration recognise the importance ofother financial flowsfor development besides ODA. To achieve sustainableprogress towards the MDGs the financing discussion should look holistically atincreasing developing countries' overall revenue base for development. The EU caneffectively support increasing partners'domestic resources for development.TheCommunication "Taxand Development - Cooperating with DevelopingCountries on Promoting Good Governance in Tax Matters"9proposes measuresfor improving domestic tax revenue and the international environment. This reportdemonstrates that innovative sources and mechanisms of financing can also be usedto raise new funds for development.Global challengesare multiplying, and the growing importance of issues such asclimate change, international peace and security and migratory flows in relation todevelopment is increasingly recognised. The report underlines that these challengesneed to be dealt with in a coherent and mutually supportive manner,taking intoaccount the development dimension.TheUNhas acentral rolein globalFfDdiscussions, and theEUhas been one of thedriving forcesbehind this. TheDoha Conferenceof late 2008 decided to strengthenthe FfD follow-up process at the UN. TheUN Conference on the World Financialand Economic Crisis and its Impact on Developmentof June 2009 thereforecreated separate follow-up processes relating to the crisis10. The July 2009UNECOSOCmeeting suggested several concrete measures to theGeneral Assembly(UNGA) to strengthen the FfD process, including greater interaction with theinternational financial and trade organisations, changing the timing of the ECOSOC(Economic and Social Council) spring meeting to better link with World Bank/ IMFspring meetings and devoting more time for FfD discussions.The changes made in the UN FfD follow-up process have not yet really been triedand tested. But there is potential for overlap with the follow-up actions to theeconomic crisis, including thead-hoc UNGA Open-Ended Working Group on thefollow-up to the outcome of the UN Conference on the economic crisis and its
The 2008 outcome was 0.40% of GNI and EUR 50 billion in current prices.OECD DAC press release 14 April 2010:http://www.oecd.org/document/0,3343,en_2649_34487_44981579_1_1_1_1,00.html.9See footnote 1.10http://www.un.org/ga/search/view_doc.asp?symbol=A/RES/63/303&Lang=E8
7
EN
5
EN
impact on development (OEWG)and the proposedUN 'ad hoc panel of expertson the world economic and financial crisis and its impact on development',bothresulting from the UN Crisis Conference and dealing partly with the same issues asthe FfD process. The EU should use its influence in the UN to seek the best addedvalue from both processes, while recognising the temporary nature of the economiccrisis follow-up in comparison to the established and continuing FfD process. It isclear that the EU's performance on the FfD agenda and commitments will comeunder increasing and more regular scrutiny at global level in the UN, notably at theUN 2010 High-Level Plenary Event on the MDGs.2.PATH FOR GROWING OUT OF AID DEPENDENCYSUPPORT OF DEVELOPMENT
THE
–
EFFICIENT TAX SYTEMS IN
It is widely recognised that the sustainable provision of public services needed toachieve and maintain the MDGs requires anincrease in stable domestic revenue inthe developing countries.Building on the EU position for the Doha Conference oflate 2008, the Doha Declaration and the G-20 London Summit conclusions, thecommunication "Taxand Development - Cooperating with Developing Countrieson Promoting Good Governance in Tax Matters"aims to enhance the linkbetween tax and development policies. It suggests how the EU could better assistdeveloping countries in building efficient, fair and sustainable tax systems andadministrations, with a view to enhancing domestic resource mobilisation. This willcontribute to further promoting EU principles of good governance in tax matters.Sound, transparent and reliable customs systems are equally important to increasingdomestic revenues, reducing customs evasion and smuggling and facilitating accessto international markets.2.1.Fighting corruption, illegal capital outflows and tax evasionThe international community has set up conventions and initiatives to effectivelyaddress the issues of corruption, tax evasion and illegal financial flows on a globalscale. According to the Member States' replies to the Monterrey questionnaire therewas little change in EU Member States support for these Conventions in 2009.The UN (Merida) Convention against Corruptionrequires signatory countries toimplement measures against corruption, notably by adapting their legislationregarding corruption prevention, criminalisation of corrupt acts, internationalcooperation and asset recovery. The European Community ratified the Convention inNovember 2008 Cyprus, Estonia and Italy followed by the beginning of 2010. Of the27 EU Member States, theCzech Republic, GermanyandIrelandlag behind andhave yet to ratify the Convention (see Annex 1).TheOECD Convention on Combating Bribery of Foreign Officials inInternational Business Transactionshas been adopted and implemented by 22Member States. So far, remainder are not members of the OECD Working Group onBribery in International Business Transactions (Cyprus,Latvia, Lithuania, Malta,andRomania).
EN
6
EN
Further progress is required in the EU Member States to implement the CouncilFramework Decision11on combating corruption in the private sector.TheStolen Assets Recovery Initiative(StAR) aims to enhance internationalcooperation on repatriating stolen assets. While the fight against corruption has oftenfocused on corruption issues in developing countries, StAR looks at the other side ofthe problem: the financial centres where the money is placed are often located indeveloped countries and bribes sometimes originate from multinational companiesbased in the industrialised world. Despite the importance of the problem, only eightmember states12have reported that they support the initiative. Moreover, severalCouncil Framework Decisions oblige the Member States to ensure a common EUapproach to confiscation and call on all Member States to designateAsset RecoveryOfficesto facilitate the tracking of proceeds of crime, including assets stolen throughcorruption. So far 18 Member States have designated such offices.TheExtractive Industries Transparency Initiative(EITI) is a coalition ofgovernments, companies, civil society, investors and international organisations thatpromotes transparency and accountability in the extractive industries,bysupportingverification and full publication of company payments andgovernment revenues from oil, gas and mining.Ten Member States and theEuropean Commission support the initiative13through the World Bank's Multi-Donor Trust Fund, the EITI International Secretariat, and through bilateral projectssupporting partner countries in the implementation of the EITI. Denmark andPortugal are considering their participation in the EITI.Several EU Member States,in reply to the Monterrey questionnaire,provided specific suggestions for a moreactive Commission role in the EITI,e.g. more active participation inboardmeetings, greater promotion of the EITI as part of the Raw Materials initiative andmainstreaming the EITI in EU delegations' policy dialogue with resource-rich partnercountries.The EU Action Plan on Forest Law Enforcement Governance and Trade(FLEGT) tackles the problems of illegal logging and trade in illegally harvestedtimber (which lead to revenue losses for developing country governments), andoffers support for wood-producing countries.2.2.The way forwardFurther to its communication "Tax and Development – Cooperating with DevelopingCountries on Promoting Good Governance in Tax Matters" the Commissionrecommends that Member States:•speed up ratification of the United Nations (Merida) Convention againstCorruption if they have not yet ratified it;•expand their support to the Stolen Assets Recovery Initiative and other relevantinitiatives to fight bribery and corruption effectively and help developingcountries to recover the proceeds of such practices;111213
Council Framework Decision 2005/568/JHAFrance, Greece, Italy, Luxembourg, the Netherlands, Spain, Sweden and the UK.Belgium, Finland, France, Germany, Greece, Italy, the Netherlands, Spain, Sweden and the UK.
EN
7
EN
•Enhance their support for the Extractive Industries Transparency Initiative andactively participate in discussions to further extend its field of application.3.ENHANCING THE IMPACT OF INTERNATIONAL PRIVATE FLOWS ON DEVELOPMENT-AN ISSUE FOR A'WHOLE OF THEUNION'APPROACHWhen endorsing the 'whole of the Union' approach in 2009, the Council emphasisedthe importance of mobilising all possible sources of financing for development,including export credits, investment guarantees and technology transfers, asinstruments to leverage assistance aimed at stimulating inclusive growth, investment,trade and job creation14. The quality of information on this type of donor financing isimportant to ensure global accountability and to better grasp the development impactof different financial sources and flows. This requires a comprehensive overview ofas many development-relevant financial flows as possible and from as many donorsas possible.Some of these non-ODA flows are, in principle, tracked under the establishedOECD/DAC reporting system, which needs to be developed further. Not all EUMember States have a reliable system in place yet to monitor such flows. Improvingdata on the different flows is, however, essential to enable better use of ODA toleverage more, and complementary, flows for development.3.1.Private capital flows - a favourable business climate requiredThe economies of developing countries suffer from a general shortage of capital,especiallyforeign direct investment (FDI)15, which is worsened in the low incomecountries by the prevalence of public capital. To increase foreign investment andprevent domestic private capital flight, many developing countries are working toprovide companies with transparent and simple regulatory and fiscal frameworks,expanded access to finance, business development services, technology andinnovation, in short creating a favourable business climate. This will help create asolid productive base for generating incomes for people and budget revenues for thestate. In their replies to the Monterrey questionnaire, the Member States concurredon the importance of private capital flows for development. The majority of MemberStates reported that they support private flows through investment guarantees,dedicated funds, preferential loans and support for joint ventures in developingcountries in sectors that have high returns in terms of development16. Some MemberStates also have special programmes to promote microfinance. Dedicated institutionsin the Member States are in charge of specific tools and projects such as nationaldevelopment agencies and development finance institutions. Several Member States14
15
16
Council Conclusions of 18 May 2009 on Supporting developing countries in coping with the crisis,point 15.World foreign direct investment flows fell moderately in 2008 following a five-year period ofuninterrupted growth, in large part as a result of the global economic and financial crisis. Whiledeveloped economies were initially affected most, the decline has now spread to developing countries,with inward investment in most countries falling in 2009 too. The decline poses challenges for manydeveloping countries, as FDI has become their largest source of external financing. In particular, FDIinflows in Africa appear to have fallen by about 10% in 2008.Austria, Belgium, Bulgaria, Denmark, Estonia, Finland, France, Germany, Hungary, Italy, Luxembourg,the Netherlands, Slovenia, and Spain.
EN
8
EN
also contribute to initiatives led by the international financial institutions that providecapital, guarantees, various forms of finance and risk management tools to theprivate sector.On average between 2005 and 2008, Member States committed around three times morethan the European Commission in terms of total ODA17for private investment: respectivelyEUR 1.62 billion and EUR 0.55 billion a year.For ACP countries, the support of the European Commission including the InvestmentFacility reached EUR 131 million p.a., whereas the Member States together provided EUR249 million p.a.
3.2.
Corporate social and environmental responsibility – a way to contribute todevelopment objectivesCorporate social responsibility(CSR18) has become an increasingly importantconcept and is part of the debate about globalisation, climate change, competitivenessand sustainability. CSR practices are not a substitute for public policy but cancontribute to a number of public policy objectives in developing countries, especiallyin relation to labour markets, labour standards, skills development, more rational useof natural resources and overall poverty reduction.In Europe, the promotion of CSR reflects the need to defend common values andincrease the sense of solidarity and cohesion. To promote awareness and the adoptionof CSR principles by companies operating in developing countries, the Commissionis supporting several projects totalling approximately EUR 50 million in the period2004 - 2010.The vast majority of Member States undertake national action to promote CSRprinciples and nine of them report19that they advocate the adoption of internationallyagreed principles and standards on corporate social and environmental responsibilityby European companies. Most of them strongly support multilateral initiatives suchas:•TheOECD Guidelines for Multinationalrecommendations for good corporate behaviour20;Enterprises,whichset
•TheUN Global Compact,a voluntary corporate citizenship initiative forcompanies committed to supporting and enacting a set of 10 core values in theareas of human rights, labour, the environment and combating corruption21;•TheInternational Labour Organisationrecommendations on labour standards22.(ILO)Conventionsand
17
18
192021
For statistical information on support for private investment, the OECD Creditor Reporting Systemdatabase uses the following codes: Banking and Financial System (24000), Business and Other Services(25000), Industry (32100), Tourism (33200).Voluntary inclusion of social and environmental concerns, beyond the minimum legal requirements, incompanies' business operations to address societal needs.Austria, Belgium Finland, Germany, Ireland, Italy, Slovenia, Sweden and the UK.http://www.oecd.org/department/0,3355,en_2649_34889_1_1_1_1_1,00.htmlhttp://www.unglobalcompact.org/
EN
9
EN
There is a variety of other activities that a fewMember States support.Theseinclude development partnerships with the private sector promoting internationalstandards such as the International Finance Corporation (IFC) "PerformanceStandards on Environment and Social Sustainability" and “Towards SustainableDevelopment – European Development Finance Institution (EDFI) Principles forResponsible Financing", public information and awareness raising, internationalinitiatives like Fair Trade, the UN Special Representative for Business and HumanRights, the Third International Finance Conference23and company initiatives.3.3.Social and environmental considerations in public procurement rulesThe EU public procurement Directives24allow contracting authorities to take intoaccount environmental and social considerations at all stages of the procurementprocedure. The prerequisite is that these considerations are linked to the subjectmatter of the contract or to the execution of the contract, if they are addressed in thecontract performance clauses, and comply with the fundamental principles of theTreaty on the Functioning of the EU (transparency, non-discrimination) and withrelevant EU law.EU Member States may introduce more specific rules in their national legislation, inorder to further promote the inclusion of social and environmental considerations inpublic procurement, provided such national rules are in line with the publicprocurement Directives and all relevant EU law. Most Member States did not reportsubstantial reforms of their rules in 2009.Germanyand theNetherlandsreportedthat they hadintroduced a social clause into their national procurement rules,whileSwedenandSpain(the latter specifically for ODA financing) are working tostrengthen social and environmental considerations in national procurement laws.3.4.EU remittances: resilient to the global economic crisis?Remittances sent by migrants to their countries of origin are essential to improvingthe livelihoods of millions of people and often more significant in volume than ODA.The economicdownturn has strongly affected remittance transfers.The impactof the economic crisis on migration employment, migrants stocks and flows andirregular migration isnot easy to assess,but it is generally recognised that migrantsare often more affected by the economic downturn either because they work insectors that are more affected by the crisis, such as tourism or construction, orbecause of their particular vulnerability25. In the Monterrey survey some MemberStates observed a slight fall in both the number of new work permit applications andthe number of new work permits awarded in 2009, but this phenomenon very muchdepends on the system in place in each Member State. Some Member States alsoobserved a small fall of the estimated number of migrants irregularly entering the EU
222324
25
http://www.ilo.org/global/What_we_do/InternationalLabourStandards/lang--en/index.htmhttp://ifc3.org.Directive 2004/17/EC of 31 March 2004 coordinating the procurement procedures of entities operatingin the water, energy, transport and postal services sectors (OJ L 134, 30.4.2004) and Directive2004/18/EC of 31 March 2004 on the coordination of procedures for the award of public workscontracts, public supply contracts and public service contracts (OJ L 134, 30.4.2004).Source – International Organisation for Migration (IOM) Policy Brief.The impact of the globalfinancial crisis on migration. JJanuary 2009
EN
10
EN
territory26. However, the economic downturn can only be considered as one of thefactors possibly influencing the number of new work permits.Remittance flows grew rapidly in 2007 (up to EUR 208 billion) and reached EUR 231 billionin 2008. Remittance flows started to decrease from the last quarter of 2008; for 2009globalremittances to developing countries are expected to have decreased to EUR 228 billion,because of a deterioration in migrant-receiving countries' economic and employmentsituation27. Countries and regionsdiffer in their exposure to the crisisthrough remittanceeffects. For example, three quarters of remittances to Sub-Saharan Africa come from theUnited States and Europe, which have been badly affected by the downturn; the long-termimpact on remittances is uncertain28. Remittance flows toNorth Africaare expected to havedeclined by 7.2 percent and toSub-Saharan Africaby 2.9 percent in 2009, and to return topositive growth in 2010 and 2011, according to the World Bank.In theEU, outflows of workers remittanceshad greatly increased from beginning of 2004reaching a peak in the last quarter of 2007. While remaining almost stable in 2008 EUoutflows are supposed to have markedly fallen in 2009 and to resume their growth in 2011.The drop in the remittances outflows was particularly severe in Spain29.
Continuing progress in meeting EU commitments on remittancesIn recent years the importance of remittances has been recognised and severalinternational initiatives propose concrete measures to make them more development-friendly.Some of the main initiatives are: guidelines for the compilation of data on remittances by the'Luxembourg Group30',the 'GeneralPrinciples for International Remittances Services'and the recentG8initiative of a'Global Remittances Working Group'coordinated by theWorld Bank. In July 2009, atthe L´Aquila summit,the G8 Heads of States endorsed the'5x5' objectiveand made a pledge 'to achieve in particular the objective of a reduction of theglobal average costs of transferring remittances from the present 10% to 5% in five yearsthrough enhanced information, transparency, competition and cooperation with partners'.
It is encouraging to see that this objective has been reaffirmed beyond the EU, andthe drivers of remittance costs are generally recognised. Regarding the three mainareas of EU commitments on remittances31the Member States' replies to theMonterrey survey can be summarised as follows:(1) Improving data on remittances
2627
28
29
30
31
Source – Frontex (http://www.frontex.europa.eu/) estimates.Ratha, D., S. Mohapatra, and A. Silwal (November 3, 2009),Migration and Remittances Trends 2009:A better-than-expected outcome so far, but significant risks ahead,Migration and Remittances Team,Development Prospects Group, World Bank, Migration and Development Brief 11.The UNDP Human Development Report 2009.Overcoming barriers: Human mobility anddevelopment.Eurostat, tables with Quarterly Balance of Payments data per country:http://epp.eurostat.ec.europa.eu/portal/page/portal/balance_of_payments/data/database.The Luxembourg Group is an informal IMF working group for collecting and compiling remittancedata: http://www.imf.org/external/np/sta/bop/2006/luxgrp/060106.htm.Council Conclusions of 11.11.2008 (EU position for Doha FfD Conference), point 27, CouncilConclusions of 18.05.2009 (Support to Developing countries in Coping with the Crisis), point 11,Council Conclusions of 18.11.2009 (PCD), points 5-13.
EN
11
EN
•Member States are increasingly adopting thedefinition of remittancesand therecommendations regarding the quality and coverage of data on remittances madeby the Luxembourg Group:– data on remittances provided in Member States' balance of payments now tends tocover flows of remittances both via banks and via Money Transfer Operators– household surveys and targeted studies are still not widely used in the MemberStates, but they are the only way to obtain better estimates of informal flows– The availability ofconsolidated data at European levelhasimproved,as inFebruary 2010 Eurostat started to publish annual data on remittance flowsbetween each EU Member State and non-EU countries. The new tables cover2004-2008 and will be updated annually. In January 2010 Eurostat began topublish quarterly data on remittances, with less geographical detail.(2) Favouring cheaper, faster and more secure remittances flowsWithin the EU, substantial progress has been achieved with the adoption of thePayment ServicesDirective(PSD)32, which lays the legal foundation for an EU-wide single market for payments andfacilitates access of migrants to formal remittance services. 'Payment institutions', i.e. money transferoperators or telecom providers for their post-paid activities, now have to make charges and otherconditions (such as the transfer time and the charge to the recipient) clear to customers. In line withthe rationale behind Special Recommendation VI of the Financial Action Task Force on MoneyLaundering, the Directive provides a mechanism whereby operators unable to meet all therequirements to become "payment institutions" are not forced into the black economy but may provideremittance services, once their identity has been registered. This, however, requires properenforcement by the Member States competent authorities. The PSD has been implemented in most ofthe Member States of the EU/EEA.The newE-Money Directive(EMD) 2009/110/EC, adopted in October 200933, authorises e-moneyinstitutions (such as issuers of pre-paid cards, on-line or telecom providers for their pre-paid activities),as from 30 April 2011, to carry out other business' activities, including payment services such asmoney remittance. This will allow cross-overs of new payment methods between them (e.g. on-linepayment accounts with mobile payments: PayPal or Google) and with traditional payment methodsused to send money (e.g. Western Union with telecom providers or with prepaid cards issuers).The PSD and the new EMD apply only to payments inside the EU/EEA and do not cover remittancesbetween the EU/EEA and non-EU countries. Extending these rules to extra-EU transfers would helplower remittance costs.
•Fourteen Member States are alreadyapplying all or part of the requirements tosome extra-EU transfers(one-leg transactions) carried out in currencies otherthan those of the Member States. It is also positive that Money Transfer Operatorswith global reach (such as Western Union or Money Gram) and telecom providers(such as Vodafone or Telefónica) are envisaging applying the principlesvoluntarily.•Toimprove financial literacy and access to financial services,Member Statesinform migrants about financial products suited to their needs and also work32
33
2007/64/EC (OJ L 319).Directive 2009/110/EC of 16 September 2009 on the taking up, pursuit and prudential supervision ofthe business of electronic money institutions (OJ L 267, 10.10.2009).
EN
12
EN
through dialogue with the private sector, for instance in theUK.Member Statescontinue topromote increased transparencyby setting up websites34comparingthe prices and conditions offered by the different money transfer providers. Inaddition, theNetherlands,for instance, evaluated its initiative's impact on thecost of remittances; the UK prepared a leaflet explaining what information has tobe given to the sender of money, what needs to be checked to make sure that themoney reaches the recipient safely and what rights the sender has if things gowrong35.As most migrants have access to financial services similar to that of the rest of thepopulation, the cost of remittances mainly depends onaccess to financial services innon-EU countries.So some Member States and the Commission run programmes inpartner countries aimed at developing the financial sector (e.g. microfinance, andtechnical assistance with financial sector regulation and supervision) and improvingfinancial literacy, to familiarise households receiving remittances with bankingservices36. If some of the remittances are saved, banks can build up their role asintermediaries, turning savings into productive investment with a positive impact ondevelopment.(3) Enhancing the development impact of remittances from the EUA number of targeted initiatives have been set up to support developing countries inestablishing a policy framework more conducive to remittances, such as theCommission's support for theAfrican Remittances Institute37and the contributionsof a number of Member States and the Commission to the multi-donor FinancialFacility for Remittances of the International Fund for Agricultural Development(IFAD), which providesgrants for innovative projectsthat contribute to expandingrural access to finance. In a different vein, recent measures by some Member Statessuch as the decree in Italy requiring money transfer organisations to inform localpolice within 12 hours if the person wishing to transfer funds is unable to present aresidence permit, could be counter-productive from a development perspective,because such restrictions will increase the use of informal channels to transferremittances.Further actions required to facilitate remittance transfersThe current, substantial initiatives focus on implementing current commitments andwill continue to do so. Special consideration should be given to further facilitatingremittance transfers:•through reinforced support to new technology-based transfers (cell phones,Internet) via targeted projects;
34
353637
Examples of such websites are: www.sendmoneyhome.org (UK), www.geldtransfair.de (Germany),www.envoidargent.fr (France), and www.geldnaarhuis.nl (Netherlands). Sweden is working on asimilar initiative.www.moneymadeclear.fsa.gov.uk.For instance France, Germany, Luxembourg, the Netherlands, Spain and the United Kingdom.Under preparation under the leadership of the African Union and in collaboration with the World Bank.
EN
13
EN
•by extending the requirements of the Payment Services Directive to extra-EUtransfers when the Directive is revised in 2011;•by better coordinating work on specific remittance 'corridors' in which flows fromseveral Member States are of particular importance;•by ensuring proper enforcement of the Payment Services Directive in all EUMember States, bringing all operators providing remittance services within theambit of its minimum legal and regulatory requirements;•by ensuring that identification requirements under EU Member States 'nationalsecurity or immigration laws do not hamper the globally agreed objective ofreducing remittance costs.4.ODAFLOWS TO DEVELOPING COUNTRIES-A CRUCIAL SOURCE OF FINANCINGIn 2002, the EU Member States adopted their initial joint commitments on ODAincreases. These commitments were further developed and broadened, and endorsedby the European Council in 2005 ahead of the UN World Summit that undertook thefirst review of progress on the Millennium Declaration and the MDGs. The EU andits Member States agreed to achieve a collective ODA level of 0.7% of GNI by 2015and an interim target of 0.56% by 2010, both accompanied by individual targets. TheEU Member States agreed to increase their ODA to 0.51% of their national incomeby 2010 while those Member States that had already achieved already higher levels(0.7% or above) promised to maintain these levels; the Member States that accededto the EU in or after 2004 (EU-12) promised to strive to spend 0.17% of their GNI onODA38by 2010 and 0.33% by 2015.4.1.EU ODA decreased in 2009Since 2008 the financial crisis has hit EU Member States hard, triggering the deepestglobal economic recession since decades. State-financed rescue packages for theaffected banking sector, higher social protection costs and lower budget revenueshave dramatically changed the fiscal situation of many Member States. The crisis hasaffected EU ODA levels.In 2009 EU-27 ODA continued to increase as a share ofGNI from 0.40% in 2008 to 0.42%, but decreased in volume terms to EUR49billion.The trend among Member States varied, as the tables and figures inAnnex 2show.Theincreasewas led byFrance,which contributed EUR1.3 billion, followed by theUK(EUR285 million), andBelgium(EUR214 million). Malta (0.20%) and Cyprus(0.17%) attained or exceeded the individual, intermediate target threshold of 0.17ODA/GNI, one year ahead of schedule.Aid volumeincreasesor maintenance in 12 Member States wereoffset by aid cutsin others. The biggest cuts occurred inGermany;its aid was reduced by almostEUR1.1 billion. The worst aid cuts – more than 30% - were made inItaly(downEUR990 million, to 0.16% ODA/GNI), putting Italy's ODA lowest among the EU38
For the exact wording see European Council, 18 June 2005, Doc. 10255/05 Conc. 2, par. 26 onwards.
EN
14
EN
donors that had committed to spend at least 0.51% of their income as ODA by 2010,andAustria(down EUR365 million), bringing the country's ODA down to 0.30% ofGNI, i.e. below the level that the EU-15 Member States had promised to achieve in2006 (0.33% ODA/ GNI).Greece'aid declined by EUR51 million from already lowODA levels. For the first time in many years ODA spending was substantiallyreduced in theNetherlands(down EUR234 million) andSpain(EUR42 million).Under the impact of the crisis,Irish aiddisbursements were cut by EUR203 million,albeit from higher levels and keeping aid spending at 0.54% of GNI.Member States' Percentage share of EU ODA 2009Share of Member State ODA in Total EU ODA (2009)in € million and %LU 289; 1%EU12 812; 2%
PT 364; 1%GR 436; 1%IE 718; 1%AT 823; 2%FI 924; 2%BE 1868; 4%DK 2017; 4%
FR 8927; 18%
IT 2380; 5%
SE 3267; 7%
DE 8605; 18%
NL 4614; 9%
ES 4719; 10%
UK 8267; 17%
Source: COM estimates based on OECD DAC data and Monterrey survey 2010
4.2.
Set to miss the agreed intermediate ODA targets of 2010According to preliminary Commission estimates, the EU needs to bridge aEUR18.4billion gap to reach the collective 0.56% ODA/GNI target in 2010 from 2009outcome levels.According to Member States' forecasts, EU ODA should increase in2010, but the collective EU result in2010would be in the range of0.45% - 0.46%ofGNI (around EUR55 billion). The EU is thus set to miss its collective intermediatetarget of 0.56% of GNI by 2010 by a wide margin because many Member States willnot reach the individual minimum intermediate EU ODA targets fixed for 2010.Low or negative economic growth rates in the EU as a consequence of the crisis, andgiven the austerity measures that Member States introduced, lead to different risks.On the one hand lower GNI growth combined with higher public expenditureelsewhere may lead to a cut-back in spending on development co-operation, which inturn would result in a lower trajectory of up-scaling to meet 2015 targets. On theother hand, where aid volumes are not cut, they will show higher aid levels expressedas a percentage share of GNI, without providing additional ODA funding for
EN
15
EN
developing countries. These prospects will harm the credibility of the EU as a whole.Urgent action is therefore needed to remedy this.In their replies to the survey, a majority of Member States expressed their resolve tofurther increase ODA in 2010 despite the fact that many of them are facing uncertainbudgetary positions due to the crisis-related situation.The EU scaling-up process has been uneven, with asymmetric efforts. Member Statesnot contributing their fair share to theburden-sharingeffort endanger theperformance of the EU as whole and substantially increase the risk of collectivefailure on ODA targets. This needs to change. All Member States are important for asustained, joint EU scaling-up. The prospects for 2010 according to Member States'reports are as follows:•Four EU Member States –Sweden, Luxembourg, the Netherlands andDenmark -continued to spend at least 0.8% of their GNI or more ondevelopment and are planning to maintain this level or to achieve and sustain amore ambitious target, i.e. a 1% target. These four countries account for over 20%of the EU ODA although their relative economic weight within the EU is muchsmaller.Belgiumis set to join this group of early ODA target achievers bybringing its ODA spending up to 0.7% of GNI in 2010.•According to the forecasts provided, theUKremains on track to deliver on itsODA spending plans for the financial years (April to March) 2009-10 and 2010-11 (0.56% ODA/GNI) with a view to attaining 0.7% ODA/GNI by 201339.•IrelandandSpainhad set themselves national thresholds more ambitious thanthe EU timeframes. While they may miss those, they want, along with Finland, tomeet or surpass the agreed EU individual target of 0.51% of GNI set for 2010.•While remaining below the 0.51% ODA/GNI threshold,Franceindicated aidincreases for 2010 corresponding to 0.43-0.47% of GNI andGermanytargetsspending 0.40% of its GNI on aid.Italyshould increase its ODA to 0.20% of GNIbut risks remaining the weakest performer of the EU-15; ithas, meanwhile, beenovertaken by some of the EU-12,for which much lower individual ODA targetsapply. Due to their combined weight in the EU economythese three MemberStatesare thekeyto theEU's collective scaling up.Without their contributionthe EU cannot reach its collective ODA goal.•AustriaandPortugal'sODA levels remain far below the EU average; both areset to miss the 2010 target, although they project increasing ODA levels.Greece'spositionremains uncertain due to fiscal restraints; it is unlikely that Greece willfulfil its ambition to spend 0.35% of its national income on ODA in 2010.•There is some good news amongst EU-12 Member States:Cyprus and Maltaachieved or exceed their commitments of 0.17 one year aheadof the 2010deadline.Lithuaniasteadily increased its figures in recent years; but no forecast39
According to Commission estimates on the future economic growth in the Member States the UK mayeven exceed the national 2010/11 target, as a consequence of a lower economic growth forecast for theUK for 2010.
EN
16
EN
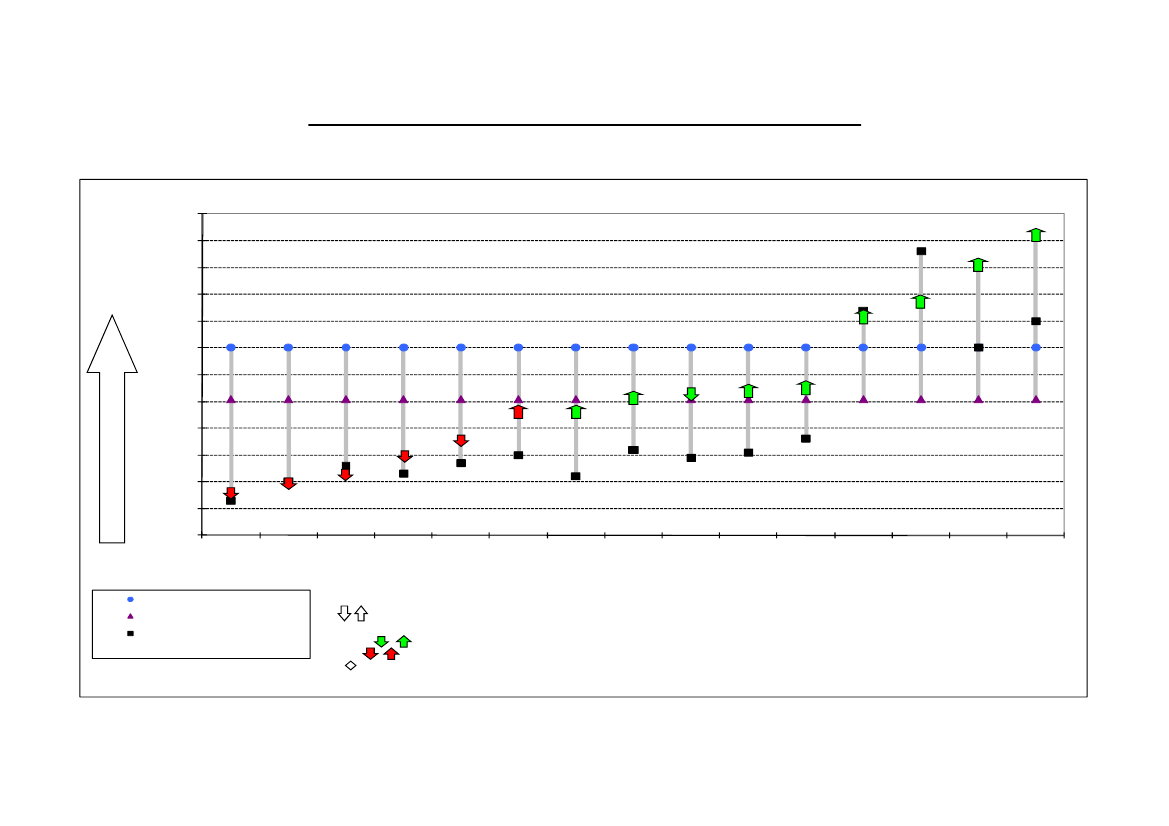
has been made available and the country is hard hit by the economic crisis. Theother EU-12 donors are off-track, as they forecast they will not reachthe0.17% ODA/GNItarget in 2010, althoughSlovenia is relatively close to thetarget in 2009.They need to take decisive steps to get their ODA budgets back ontarget.The ODA indicators graphs inAnnex 3show each EU Member State's readiness tomeet the individual ODA target levels of 0.51% and 0.17% of GNI respectively in2010.Annex 4outlines the methodology used to analyse ODA indicators andforecasts provided by the Member States.4.3.Lessons learnt - the impact of EU ODA targets on policy decisions in EUMember StatesSome key lessons can be drawn from experience since the adoption, in 2002, of EUODA commitments and their revision in 2005:back-loadingthe increase in ODAexpenditure has been the main factor in missing target levels.Sustained scaling-upprocess through debt relief grantsis impossible: debt relief grants are "one-off"exercises by nature andinsufficientif not replaced after the debt relief spike by"fresh money" in ODA budgets.The EU commitments have been a useful anchor for scaling-up processes in a number ofMember States:-by bolstering more ambitious national plans or multi-annual budget planning (e.g.Spain and the UK: 0.56% by 2010);-by "limiting the damage" in those Member States that have decided, since 2005, toslow down their initially more far-reaching national ODA plans: in France, Finland and Ireland0.51% ODA/GNI provided the bottom line for downgraded national objectives for 2010;-by setting in motion some kind of national process to increase ODA although not at apace sufficient to meet the 2010 target (e.g. the Czech Republic, Germany, Greece,Portugal, and Slovenia).This proves that the targets agreed at EU level have had a positive effect on increasingODA. Some Member States, however, have not demonstrated any sustained trend ofincreasing ODA levels and some have yet to strengthen their efforts as new donors (seetables inAnnex 5on the ODA trajectories of individual EU Member States since 1995).
4.4.
Enabling factors for aid increases in Member StatesThere has been some progress in establishing what can be considered "multi-annualtimetables" for ODA, as called for by repeated Council Conclusions40. Timetableshave proven a useful tool for embedding the scaling-up of aid volumes in nationalbudgets in line with stated commitments. Member States have taken different pathsin developing timetables.Enacting legislationto make 0.7% ODA/GNI a binding obligation.Belgiumhas set, by law,a minimum aid level commitment, called the ‘growth-path’ towards the 0.7 target. The‘growth path’ is set out in the solidarity notes and can also be amended by the solidaritynotes; these are drafted and approved by the government but the government cannot amendthe legally binding target of 0.7% to be reached in 201041. In theUK,a draft International
4041
Most recently in the Council Conclusions of 18 May 2009, point 14.See Article 10.http://www.ejustice.just.fgov.be/cgi_loi/change_lg.pl?language=fr&la=F&cn=1991071746&table_name=loi.
EN
17
EN
Development Spending Bill, published on 15 January 2010, introduces a legal obligation tospend 0.7% of GNI on ODA as from 2013; it is now being examined by the House ofCommons42.Multi-year budget spending plans/inclusionof ODA targets in national budget laws. So fartheUKGovernment has set departmental budgets on a multi-year spending cycle over athree-year period through spending reviews. The Pre-Budget Report and ComprehensiveSpending Review 2007 covers the financial years 2008/9 to 2010/11; it includes the ODAallocation to 2010 and details the commitment to reaching 0.7% ODA/GNI by 2013. InIrelandandSwedenthe national ODA targets are enshrined in the annual budget law43.Government-endorsed development policy documents: Spain's"Master Plan forDevelopment Cooperation 2009-2012" was endorsed by the Spanish Government andParliament. The Master Plan sets out the timeframes for reaching national ODA targets(which are more ambitious than the EU goals).Portugalpublished an annex to the budgetlaw outlining future aid increases that are, however, not commensurate with its individualtarget of 0.51% for 2010)44. TheFinnishDevelopment Policy Programme, i.e. a GovernmentDecision-in-Principle, has stated the Government's commitment to ensuring thatdevelopment cooperation appropriations will take Finland towards 0.7%.Indicative multi-annual timetables:BothBulgariaandRomaniaintend to have anindicative multi-annual timetable ready in 2010.Estoniawill include a timetable for 2015ODA targets in the Strategy for Estonian development cooperation and humanitarian aid for2011-2015, which is under preparation.
4.5.
How to demonstrate the EU's resolve to reach the 0.7% ODA/ GNI target by2015?As outlined in the Communication45, the EU now needs to demonstratehowto getback on-track to reach the0.7% ODA/ GNI targetand toprepare a crediblepathway for bridging the gap to meeting the 2015 deadline.Any back-loadedscaling up of aid would be detrimental to supporting partner countries in achievingthe MDGs and other internationally agreed development objectives, which is therationale behind the EU ODA targets. As development assistance takes time totrigger results in reducing poverty, a sudden increase in aid only in 2015 would nothelp. Member States should therefore begin early with gradual ODA increases andindicate their chosen trajectories. Suchnational action plansshould consist of thefollowing, complementary elements:(1)Confirmation of the 0.7% target for 2015as the EU collective target. Achieving thistarget entails that individually- The Member States (EU-15) undertake to achieve 0.7% ODA/GNI;- those which have achieved that target commit themselves to remaining above the target;- the Member States that joined the EU since 2004 (EU-12) strive to increase their ODA/GNIto 0.33%.This re-confirmation is necessary albeit, on its own, insufficient to re-establish EU credibilityand needs to be complemented by action on the part of each Member State.(2)Establishment of realistic and verifiable national ODA Action Plansby all MemberStates outlining how they aim to scale up and strive to achieve the 2015 ODA targets. Each
42
434445
In view of the forthcoming parliamentary elections in the UK the government has stated its intention topresent a full Bill in the next parliamentary session. Draft bill:http://www.official-documents.gov.uk/document/cm77/7792/7792.pdfhttp://www.regeringen.se/content/1/c6/13/17/16/95c2a5d5.pdf.http://www.dgo.pt/oe/2009/Aprovado/Relatorio/Rel-2009.pdf.See footnote 1.
EN
18
EN
Member State should commit to publishing individual plans for year-on-year ODA increases.The first action plans (covering actions in 2010 and 2011) should be published prior to theSeptember UN HLPM. Subsequent annual action plans should be published by the end ofthe year preceding the spring Foreign Affairs Council (Development) (FAC). Core elementsof the action plan are:- IncreasingODA each year(by volumes and as a percentage of GNI) compared to theprevious year in order to reach and sustain EU targets. ODA increases are an issue ofpolitical choice, even in difficult budgetary situations.- IndicatingODA estimates for the remaining period until 2015.Overall ODA increases inthe period 2010–2015 should be commensurate with the individual target to be reached orsustained by and beyond 2015 (= 0.7% of GNI for the EU-15 and 0.33% for the EU-12;higher aid levels already achieved by the strong performers above established EU ODAthresholds should be maintained);- Describingconcrete actions to build public support for developmentin the MemberState concerned;- Outliningconcrete actions to improve coverage of development-related issues in thenational mediaand find new and better means of communication on development46. TheEU and its Member States need to better communicate development success stories andshould do this more systematically and jointly. A better informed and educated public that issupportive to development cooperation can be a powerful ally in government commitmentsto increase ODA spending: only an educated public will be able to hold governmentsaccountable for delivering on their commitments.(3) Creating anEU-internal annual "ODA Peer Review" mechanismat the spring sessionof the FAC (Development) to assess the progress of each Member State, based on theannual monitoring report. The FAC should assess progress in every Member State andmake recommendations to improve performance, as appropriate. The FAC shouldreportthe resultsof the ODA Peer Review and progress towards the 0.7% ODA/ GNI targetannually to the European Council.(4) Describingmechanisms for ensuring scaling up.The existence of national legislation,ring-fencing ODA goals or making them legally binding has proven instrumental in someMember States to ensuring ODA increases designed to reach the 0.7% target early(Belgium) or to maintain aid levels at or above that level (Sweden). Against this background,Member States should consider enacting national legislation on ODA levels with a view toreaching the agreed EU ODA targets or maintaining higher national aid levels (either throughspecific legislation, such as that currently being examined in the UK) or through specificannotations in the national budget laws.
The Commission is ready to extend its support, especially to those Member Statesthat have joined the EU since 2004. Member States more advanced in the scaling-upprocess could also offer their cooperation to identify success factors that could fosternational processes in those Member States that have to do better.There are different options for going forward.Each Member State will have todefine its individual path to reach the 2015 targets. The trajectory will differdepending on the choice made. Various options are available to bridge the gap from
46
The Eurobarometer survey "Development aid in times of economic turmoil" of October 2009 revealedthat 72% of Europeans are in favour of honouring or going beyond existing aid commitments to thedeveloping world. Public support for the EU's motto “keeping our promises” is real. Europeansexpressed a genuine interest in knowing more about development, mainly through better presscoverage; most of the Mediterranean countries of the EU are dissatisfied with the level of mediacoverage:http://ec.europa.eu/public_opinion/archives/ebs/ebs_318_en.pdf.
EN
19
EN
2010–2015 (see illustrating graphs inAnnex 5for each Member State)47. Whateverchoice Member States make, serious and sustained efforts are required during theentire period. Back-loading ODA increases would harm efforts to reach the MDGs,as resources to support progress before 2015 are needed immediately.•Adoption of an intermediate target for 2012to bridge the gap between the 2009results (EU 27 0.42% of GNI) and the 0.7% target for 2015.Individualminimumtargets in the range of:– EU-15: 0.57% ODA/ GNI by 201248– EU-12: 0.22% of GNI by 201249could lead to a collective EU average of the order of 0.6% by 2012.•Linear ODA volume increasesfrom 2009 aid levels to individually reach aminimum of 0.7% ODA/GNI by 2015 (EU-15) and of 0.33% (EU-12) and tomaintain high levels once thresholds have been achieved.•Regular percentage increase in ODA volumes from 2010–2015with a view toreaching 0.7% by 2015 (same percentage of the absolute amounts in each year,but different percentage levels depending on where Member States stand today).The average annual increase required in ODA volumes is 12% for the EU-15 and30% for the EU-1250. This option is also ambitious but entails some slight back-loading compared to linear scaling-up.Fair burden-sharing among EU Member Statesis a key element in thisundertaking. Lack of action will jeopardise the success of the EU as a whole on itscollective 0.7% ODA/GNI target and each Member State needs to demonstrate itscontribution to achieving the agreed common goal.4.6.International burden-sharingAt the Pittsburgh Summit, the G-20 leaders reaffirmed their resolve to support theachievementof the MDGs and to deliver on their respective ODA pledges, includingcommitments on "Aid for Trade", debt relief, and those made at Gleneagles,especially to Sub-Saharan Africa, by 2010 and beyond51.Global ODA levels have steadily increased since 200052, and ODA volumes areexpected to rise by about 36% between 2004 and 2010. However, thisincrease fallsshortofdemonstrating the necessary dynamics to meet the international ODAcommitments,including those given by the G-8 in Gleneagles. While there shouldbe additional aid of USD28 billion from 2004 to 2010, there is a USD22 billionshortfall between the 2005 pledges and recent OECD estimates for the 2010
47
4849505152
The graphs confront the proposed trajectory with the forecast figures that Member States have providedfor 2010 and beyond.0.7%–0.44% of GNI in 2009 = 0.26%: 2 = 0.13% + 0.44% = 0.57%.0.33%-0.10% of GNI in 2009 = 0.23%: 2 = rounded up 0.12% + 0.10% = 0.22%.Annex 5 details the individual increase required under this option for each Member State.G-20 Pittsburgh Summit Leaders' Statement 24-25 September, 2009, point 37.Except in 2007, when global and EU aid slumped.
EN
20
EN
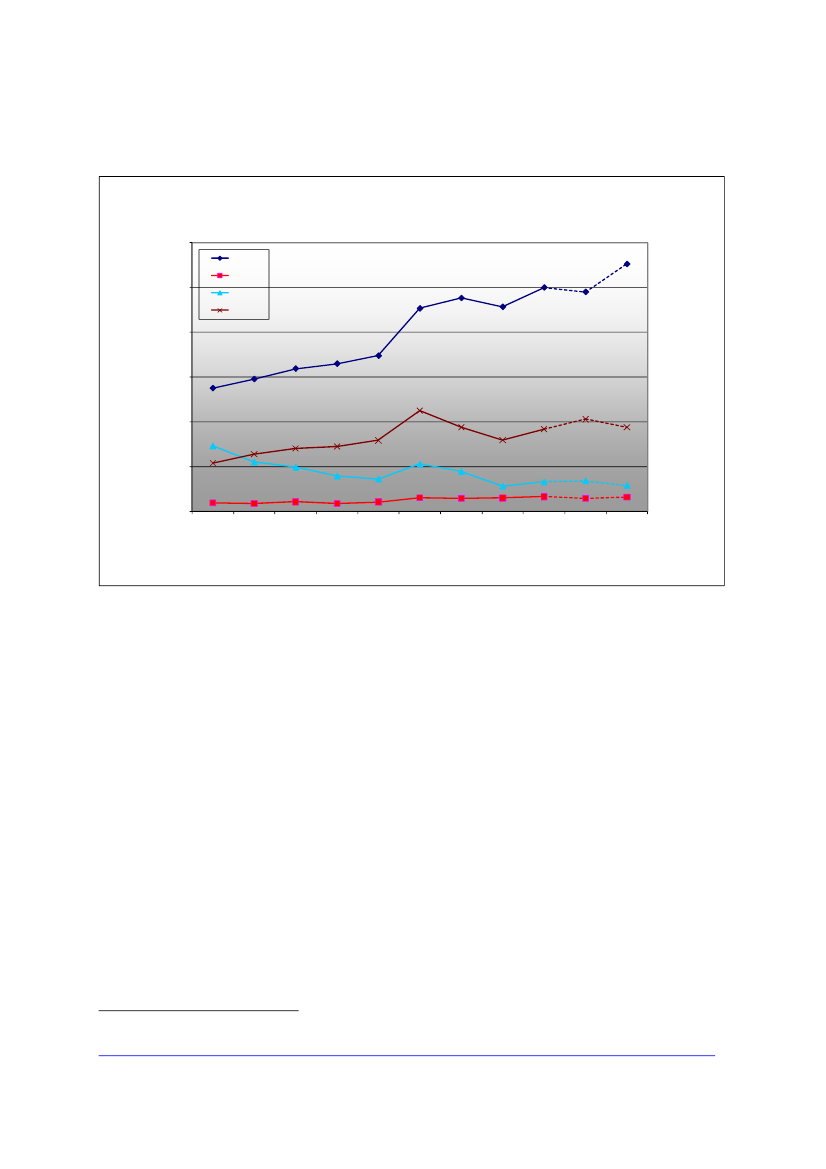
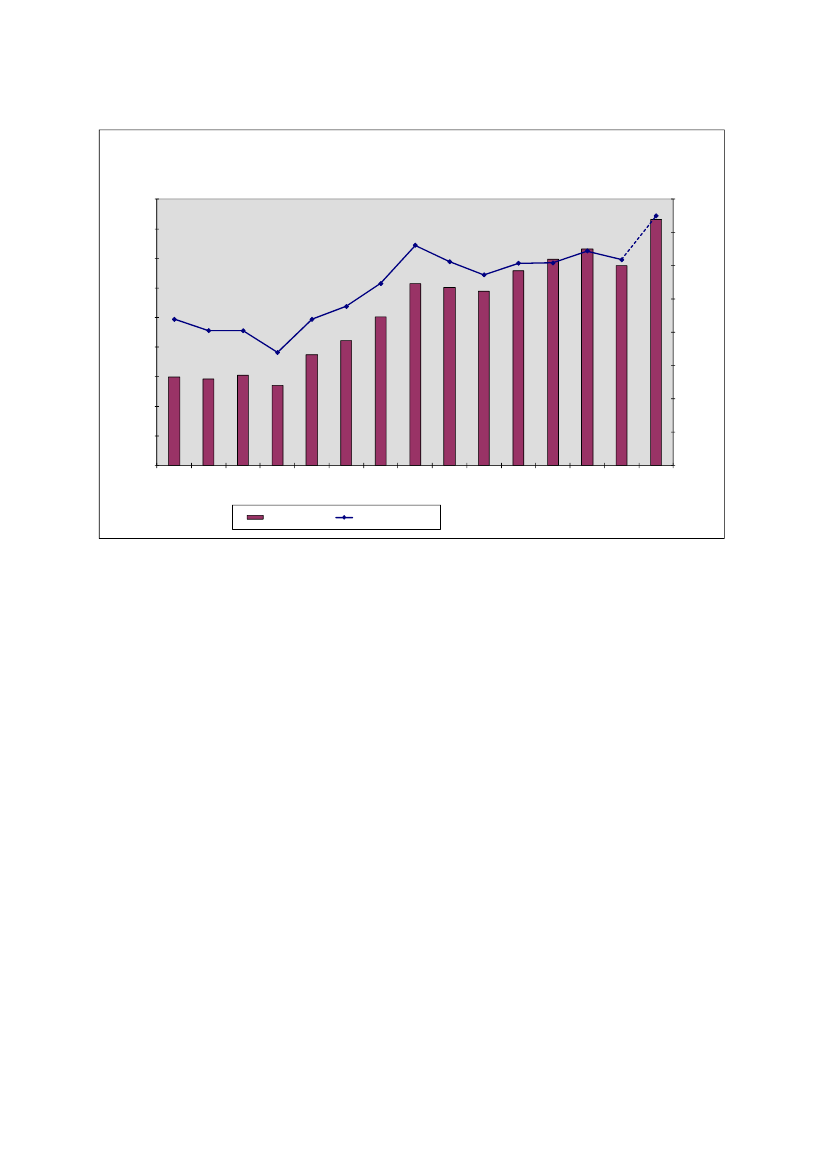
outcome. Of this shortfall, USD18 billion results from lower-than-promised ODAspending, and USD4 billion from lower-than-expected GNI growth53.Figure: Aid flows of EU and non-European G7 countries 2000 – 2010Global aid flows 2000 – 2010 (in € million current prices)
60000EU27Canada
50000€ million (current prices)
JapanUS
40000
30000
20000
10000
02000200120022003200420052006200720082009*2010*
Source: COM estimates based on OECD/ DAC data
* COM estimates based on data from member states and DAC 2010 forecast
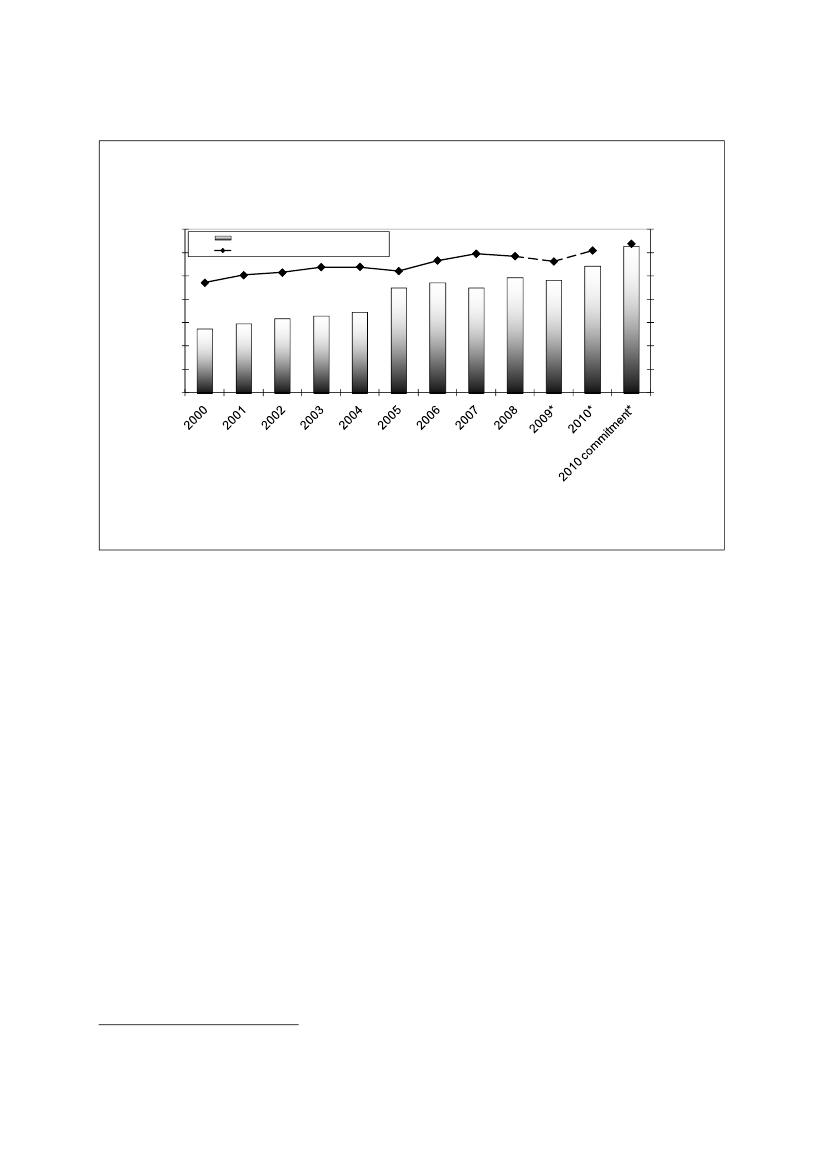
According to OECD projections for 2010 only Norway (1.0% ODA/GNI) andSwitzerland (0.47% ODA/GNI) will achieve aid levels higher than the expectedcombined EU-27 result: all other donors that are members of the OECD/DAC willhave a substantially lower outcome, despite increasing aid volumes. The US maydouble its ODA to Sub-Saharan Africa between 2004 and 2010, but overall aid levelsare forecast to remain as low as 0.19% of GNI. Japan may reduce the aid level to0.18% of GNI in 2010. Canada, Australia and New Zealand are expected to live up totheir pledge to double aid volumes from 2004 levels, reaching between 0.32% and0.35% of their national income. New partners in development also need to contributetheir fair share to the effort.TheEUcontinues to stand out as theonly group of donors that has given a time-bound commitment on the 0.7% of GNI goal for ODA(by 2015). EUdisbursements in line with this pledge could add up to EUR55.3 billion in 2010,mobilising an additional EUR7.6 billion compared with 2006 levels.The difference in donors' aid targets demonstrates a global imbalance in commitmentto supporting developing countries in achieving their development goals. As inprevious years, in 2009 the majority of the global ODA came from the EU, which
53
OECD DAC press release 14 April 2010:http://www.oecd.org/document/0,3343,en_2649_34487_44981579_1_1_1_1,00.html.
EN
21
EN
disbursed around 56% of the aid provided by DAC members. As up to now, most ofthe global ODA increase is set to come from the EU54.EU DAC Members (EU15) Net ODA(in € million current prices and as a percentage of DAC ODA)
70000in € million current prices
EU15 ODA in millions of €EU15 ODA as a percent of DAC ODA
70%percentage of DAC ODA
6000050000400003000020000100000
60%50%40%30%20%10%0%
Source: COM estimates based on OECD DAC data and COM Monterery Survey 2010
*percentages based on COM estimates, based on DAC 2010 forecasts
4.7.
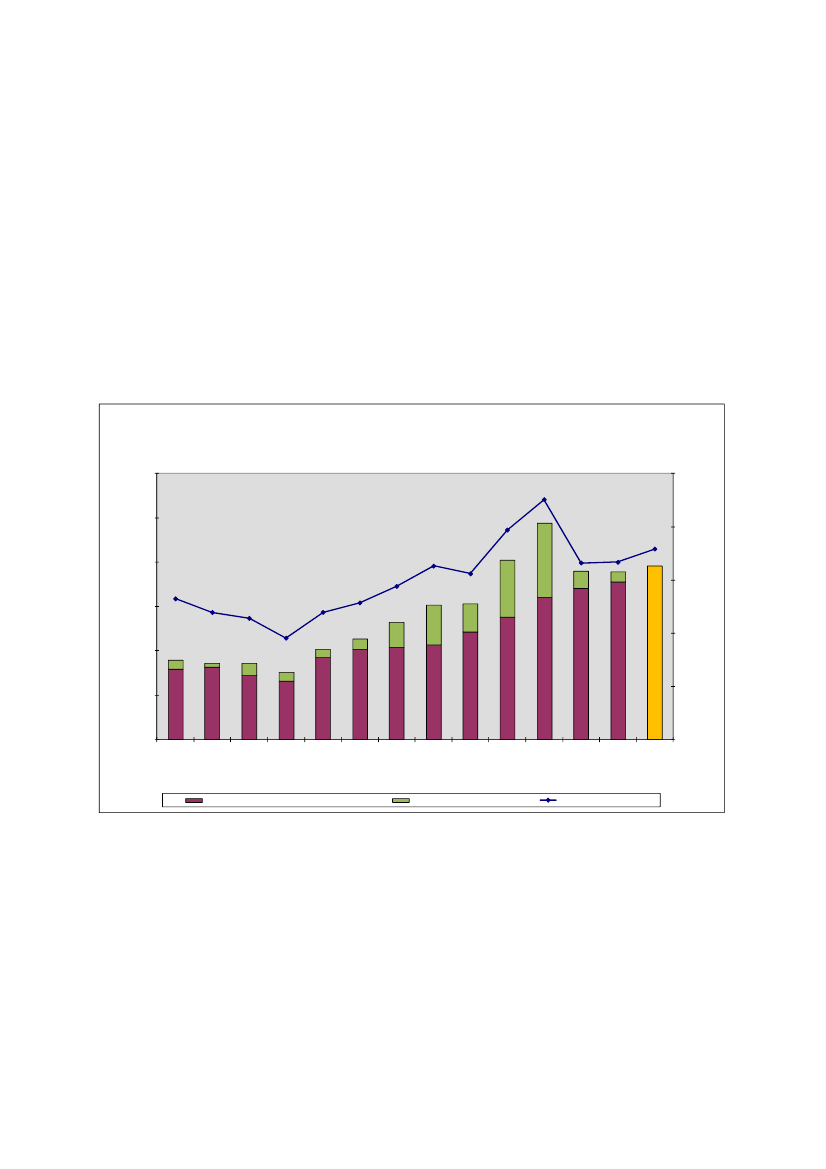
EU not acting in line with its promise on ODA to AfricaSince making the commitment to direct 50% of EU aid increases to Africa in 2005,the combined EU aid to Africa has not risen, but fallen. 2005 and 2006 were peakyears for debt relief operations, also benefitting some African countries. In the yearsthat followed, the increases in programmable aid did not make up for the drop in debtrelief grants. As a result, theEU-15 total net ODA to Africa fell by EUR2.7 billionfrom its 2005 level. The fall in aid to Sub-Saharan Africa was even more acuteas net ODA fell by EUR3.2 billion from its 2005 level. Combining this result withthe fact that the EU's overall ODA continued to increase, the EU has not delivered onthe commitment to provide 50% of the collective EU ODA increase to the Africancontinent. OnlyBelgium, Denmark, Finland, Luxembourg and Portugalchannelled more than 50% of the ODA increase to Africa in 2009, compared to2005 levels.Sub-Saharan Africa has also fared particularly badly in terms of the G8 Gleneaglespledge of an additional USD25 billion per year, with a gap of USD14 billion (in2004 prices) estimated by the OECD.Africa's overall share in the collective EU ODA has fallen from 44% to 37% from2005 to 2009.A positive signthough is that if looking exclusively at total net aidexcluding debt relief, ODA from the EU-15 to Africa rose from EUR7.2 billion in
54
See previous footnote.
EN
22
EN
2005 to EUR9.7 billion in 2009. Sub-Saharan Africa accounted for most of thisincrease (from EUR 6.2 billion to EUR 8.4 billion).Some EU countries stand out for their special focus on Africa and Sub-SaharanAfrica. Looking at the accumulated flows since 2005, 63% ofIrishODA has gone toAfrica, the same for 60% ofFrenchandPortugueseODA,with Belgium,Denmark,andLuxembourgand theUK also around the 50% level.Many Member States stated in reply to the Monterrey survey that their bilateral aidprogrammes focus on Africa. TheWhite Paper on Irish Aidstates that Africa shouldremain the primary geographic focus for Ireland’s development programme. OtherMember States - Belgium, Cyprus, Finland, France, Italy, Netherland, Portugal andSpain - have decided to spend or are spending at least 50% of their bilateralprogrammable aid in Africa. Most of the EU-12 contribute to Africa throughmultilateral channels, although some are considering increasing their bilateralcommitment to the region as well.EU15 ODA to Africa in € million and as a % of GNIincluding imputed multilateral flows
30 000
0.25
0.23
25 000
0.200.18
0.20
20 000
0.160.140.130.130.120.110.1028500.124511115894610394111382
0.170.16644284001989
0.1711820.15
€ million
15 000
31650.10
10 000
195821603317035177520.05
1034925510208103661065812144
13805
5 000
7936
8181
7232
6578
0
0.00
1996Source: OECD DAC
1997
1998
1999
2000
2001
2002
2003
2004
2005
2006
2007
2008
2009
For 2009, COM Simulation based on DAC data for 2009
EU15 Net ODA to Africa incl imp multi excl debt
EU15 Net Debt Relief to Africa
Per cent of donor's GNI
EN
%GNI
23
EN
EU15 Total Net Bilateral ODA to Africa in € million (current prices) and % of total net bilateral ODA,(Excluding Debt Relief)
14 0004412 00042
48
50454138383837403634351 3721 3503025208 379151051 349
10 000
34
8 0001 2561 1796 0001 1621 0827934 0006 9644 9462 0004 7495 3104 3244 1375 1455 0545 2165 1605 8996 1737437 7728 1769797158788629231 010
0199519961997199819992000200120022003200420052006200720082009Bilateral Net ODA to SSA excl. Debt ReliefBilateral Net ODA to North Africa excl. Debt ReliefSource: OECD DACFor 2009, COM Simulation basedon DAC data for 2009
Bilateral Net ODA to Africa as % of Total Bilateral Net ODA (excl. debt relief)
4.8.
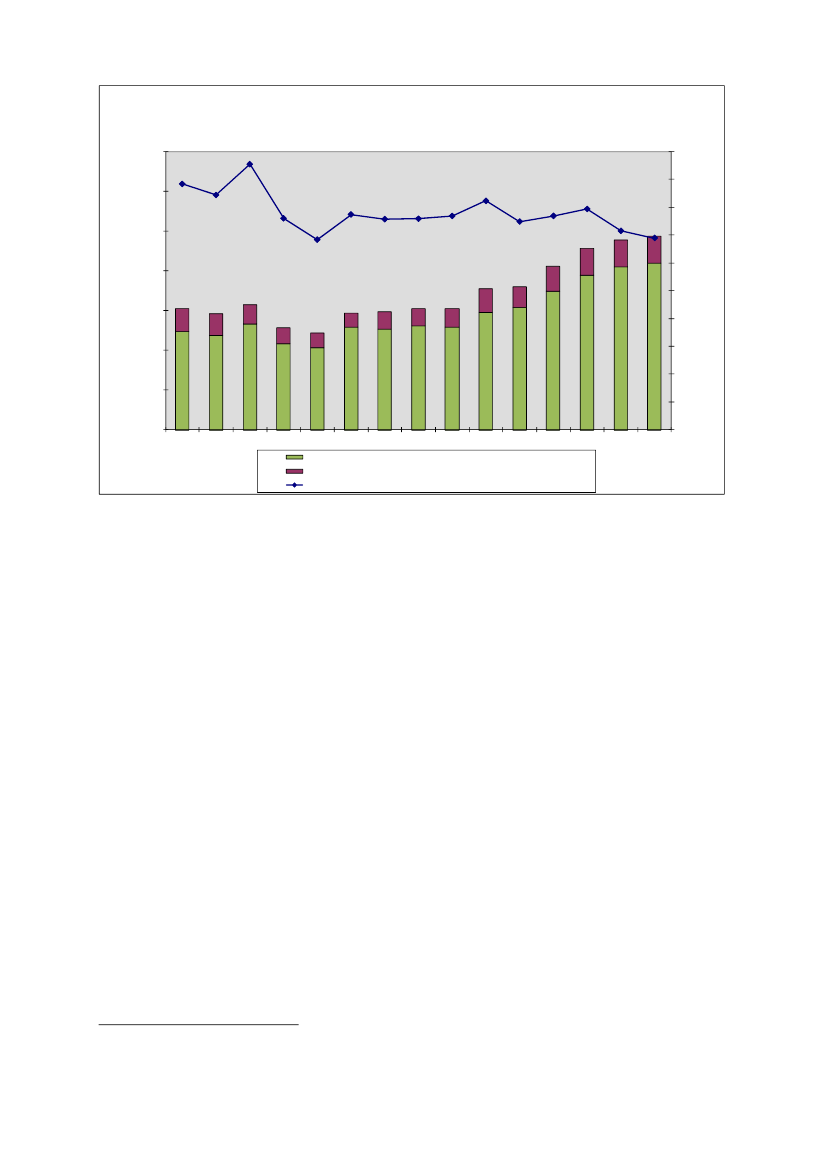
ODA to Least Developed Countries – EU target still within reachIn November 2008, Member States promised, as part of the EU's overall ODAcommitments, to provide collectively 0.15% to 0.20% of their GNI to LeastDeveloped Countries (LDCs) by 2010 while fully meeting the differentiatedcommitments set out in the "Brussels Programme of action for the LDCs for thedecade 2001-2010".According to the Commission simulations, LDCs' share of EU ODA has decreasedboth in absolute and relative terms and was at EUR 13.5 billion or 0.12% of GNI in2009. Nevertheless, reaching collectively the lower end of the target of 0.15%-0.20%ODA/GNI allocated to LDCs by 2010 and onwards remains feasible. According tothe replies to the 2010 Monterrey survey, 10 of the EU-1555will reach or havealready reached this target. The vast majority of the EU-12 are ready to reserve acertain amount of ODA for LDCs.
55
Austria, Belgium, Denmark, Finland, Ireland, Italy, Luxembourg, the Netherlands, Sweden, the UK.
EN
% of total net bilateral ODA excl. Debt Relief
39
38
38
40
million €
24
EN
Figure: EU ODA to LDCsEU15 ODA to LDCs in € million and as a % of GNIincluding imputed multilateral flows
18 000
0.15
0.16
16 000
0.130.120.110.110.120.12
0.14
0.130.120.12
14 000
12 000
0.10
0.10
€ million
0.0910 000
0.090.08
8 000
0.07131761203011783139511464913514
166440.06
6 000
1231710035
4 000
74915959583261215420
8450
0.04
2 000
0.02
0
0.00
1996
1997
1998
1999
2000
2001
2002
2003
2004
2005
2006
2007
2008
2009*
2010target*
Source: OECD DAC
Net ODA to LDCs
Per cent of donor's GNI
*2009: COM simulation based on DAC data for 2009*2010: COM simulation based on the collective ODA target of 0.15% to LDCs by 2010
4.9.
Reinforced reporting on ODA flowsMost EU non-DAC donors report their ODA to the OECD/DAC. The Commissionencourages all of them to do this, in line with DAC reporting rules, although none ofthe EU-12 are yet DAC members.BulgariaandMaltahave yetto start reportingsystematically to the DAC.The Commission will continue to work with the DACsecretariat on providing support to the EU's non-DAC donors in enhancing theirstatistical reporting capacity.The Commission is ready to support the OECD/DAC in its efforts to develop, inaddition to the work on ODA, more detailed reporting on other, non-ODA financialflows that have an impact on development. This information could providetransparency in donors' non-ODA actions, which may help or hinder developingcountries' progress towards their development objectives.
4.10.
A credible pathway for the future•In order to reach the ultimate EU goal to provide 0.7% of the combined nationalincome as ODA by 2015 and beyond, drawing upannual national action plansis essential and should be complemented by reinforcedEU internalmonitoring(annualODA "Peer Review").•Consideration should be given toenacting national legislation on ODA levelswith a view to reaching the 0.7% ODA target by and beyond 2015 and to ring-fencing ODA spending commensurate with this target.
EN
%GNI
0.08
0.08
25
EN
•Member States should redouble their efforts toincreasetheiraid to Sub-SaharanAfricaand to provide half of the pledged aid increases to the African continent.•Member States need to enhance their efforts toincrease aid to LDCswith a viewto meeting the 0.15-0.20% ODA/ GNI target in 2010 and to sustain their effortsonce they have achieved that level.•The EU should call onall international donors and new actors to contributetheir fair shareof the effort by increasing their aid levels.•Reinforced efforts are required by the EU and its Member States and by theOECD DAC tobetter track and report on ODA and non-ODA flowsrelevantto the development of poor countries.5.INNOVATIVE SOURCES AND MECHANISMS OF FINANCING:A NEW DEBATETheEuropean Council56:•agreed on the need to prepare a coordinated strategy for exiting from the broad-based stimulus policies when recovery is secured,•invited the Commission to examine innovative financing at global level,with aview to facilitating fiscal exit strategies and fiscal consolidation,•recognised the need to significantly increase financing to help developingcountries implement ambitious climate mitigation and adaptation strategies,without jeopardising the fight against poverty and continued progress towards theMDGs,•highlighted the role of innovative financing in ensuring predictable flows offinancing for sustainable development, especially towards the poorest and mostvulnerable countries.Initially, innovative financing mechanisms were considered in order to addressfinancing needs for development.Not least because of many donor countries'difficulties in meeting their ODA commitments in the medium term, innovativesources of financing could play a more prominent role in the near future.Development budgets are coming under increasing pressure, partly because of thesignificant commitments that developed countries made in the Copenhagen Accordto scale up the financing of climate change measures in developing countries.The Leading Group on Innovative Financing for Development is spearheading theinternational debate on this issue.It was founded in 2006 with a Secretariat in Paris andnow has 59 member countries from the North and South, in addition to the main internationalorganisations and NGO platforms57.EU Member States are very supportiveof thisinitiative: nine aremembers(Belgium,Finland, France, Germany, Italy, Luxembourg,Poland, Spain and the UK),as is the Commission;Austria,the Netherlands andRomaniaareobservers,andDenmark, the Netherlands, Portugal and Swedenhaveexpressed
5657
Conclusions of the European Council of 29-30 October 2009, point 27.For further information see www.leadinggroup.org.
EN
26
EN
interest in joining.Sector-relevant discussions are pursued in a number of thematicworking groups where concrete proposals for action against hunger and poverty, on illicitflows and tax evasion, on international financial transactions for development, and oneducation and development are examined. In addition, the Leading Group cooperates withthe Taskforce on Innovative Finance for Health Systems led by the World Bank and the UN.In October 2009 the Leading Group on Innovative Financing for Development established aTaskforce on International Financial Transactions for Development, in which Belgium,France, Germany Spain and the UK are represented, in addition to six non-EU countries.
In its recent Staff Working Paper "Innovative financing at a global level"58, theEuropean Commission provided an assessment of the various instruments ofinnovative financing relating to the financial sector, climate change and developmenton the basis of a number of criteria.5.1.EU Member States lead most initiatives on innovative sources of financeDepending on the definition, only about a third of all EU Member States raised fundsvia innovative mechanisms in 2009, but they are piloting most of the existingmechanisms.•Air ticket levy: Francewas one of the first countries (in July 2006) to introduce an airticket levy with a sliding scale based on destination and class. Most of the proceeds areearmarked for development finance, notably an International Drug Purchase Facility(UNITAID) aimed at combating the major pandemic diseases affecting the developingworld. The French air ticket levy collected EUR 165 million in 2007, EUR 173 million in2008 and EUR 162 million in 2009. Following this example, which was subsequentlypromoted by the Leading Group on Innovative Financing for Development , several othercountries around the world introduced similar air ticket levies, includingChile,theIvoryCoast,theRepublic of Korea, Madagascar, MauritiusandNiger,which allocate all ora share of the revenues to UNITAID. Furthermore,LuxembourgandSpaincollectvoluntary contributions from air passengers.Cyprus(EUR 0.4 million), Luxembourg(EUR 0.5 million) and the UK (£25 million) are supporting UNITAID from their generalbudgets.•International Financing Facility (IFF):The general concept of the IFF was first putforward by theUKGovernment in 2003. It is designed to frontload aid by issuing bonds ininternational capital markets, backed by binding long-term commitments from donors toprovide regular payments to the facility. The first concrete implementation of the IFFconcept is theInternational Finance Facility for Immunisation(IFFIm) begun inNovember 2006. The IFFIm' total anticipated disbursement of USD 4 billion is expected toprotect more than 500 million children through immunisation in more than 71 developingcountries. So far, IFFIm bonds have raised more than USD 2 billion for immunisationprogrammes run by a charity called the GAVI Alliance. IFFIm's financial base consists oflegally binding grants from its sovereign sponsors, which areFrance, Italy, Norway,Spain, Sweden, the United KingdomandSouth Africa.•Advance Market Commitment (AMC):The idea of an AMC was strongly promoted bythe governments ofItalyand theUKfrom the end of 2005. The idea is that donorsguarantee a set envelope of funding to purchase at a given price a new product thatmeets specified requirements, thus creating the potential for a viable future market. InJune 2009, the governments of Italy, the UK,Canada, the Russian Federation, Norwayand the Bill & Melinda Gates Foundationlaunched the pilot AMC againstpneumococcal disease with a collective USD 1.5 billion commitment. The supporters ofthis pilot AMC estimate that the introduction of a pneumococcal vaccine through the AMC
58
SEC(2010) 409 of 1 April 2010.
EN
27
EN
could save approximately 900,000 lives by 2015 and over 7 million lives by 2030. InOctober 2009, four suppliers made offers to supply vaccines under the PneumococcalAdvance Market Commitment.•Debt-for-development swaps:for instanceGermanyintroduced the conversion of debtinto grants for health financing in the "Debt2Health initiative". It reduces partner countries’debt as the corresponding amounts are invested in additional financial resources forhealth systems through the Global Fund. In this way, Germany disbursed EUR 40 millionin 2008 and EUR 10 million in 2009. Similarly, the government ofAustraliaisimplementing an arrangement worth some EUR50 million with the IndonesianGovernment.•Tax discounts:Many Member States provide tax exemptions or write-offs for privatefunding of development, for example through civil society organisation, foundations orcharities. Such tax reductions exist inAustria, Belgium, Denmark, Germany, Greece,Ireland, Italy, the Netherlands, Portugal, Spain and the UK.
Some Member States are considering broadening the application of the aboveexisting mechanisms either by joining them or by extending their scope to new areas.Romania considers the introduction of an airline ticket levy to support UNITAID andPortugal is assessing possible support to UNITAID. The UK is currently exploringthe potential for a second vaccine AMC and an AMC for climate change. TheCommission proposed in early 2009 to launch an IFF for climate change, but this isfinding little support among Member States59.In their replies to the annual questionnaireseveral Member Statesindicated theirinterest in introducing new levies, with all or part of the revenues earmarkedfor development.Several Member States consider afinancial transactions tax or acurrency transaction levy,in particular, a promising instrument for raisingrevenues60.More recently, a stability levy on certain positions on banks' balance sheets isgaining increasing international support. This follows its use bySwedenfor a crisismanagement fund and the proposal by the US administration to recover support forthe financial sector from the general budget in the current crisis. Forclimate change,auctioning emission allowanceswill be the mainstay of the EU Emission TradingScheme (ETS) from 2013 on, at least half of the revenues of which should be usedfor energy and climate change purposes, some of it for developing countries. AlreadyMember States can auction part of the ETS emission allowances. Germany has takenthis approach and raised revenues of EUR 933 million in 2008 and about EUR 530million in 2009, of which EUR 120 million and EUR 230 million respectively wereused for ODA. Several Member States also support using revenues fromlevies oninternational aviation and maritime transport to finance climate changeprojects in developing countries61. The feasibility of a specific mechanism for taxdiscounts called"De-Tax"is being examined byItaly:a certain share of value
59
6061
Communication COM(2009) 39 of January 2009 “Towards a comprehensive climate change agreementin Copenhagen”.For instance Austria, Belgium, Spain and the UK.Finland, France and Poland would support aviation and maritime levies to fund climate change relatedprojects. Belgium, Denmark and Spain only explicitly supported an aviation levy for that purpose, butdid not mention maritime transport levies. (Austria explicitly disagrees to an aviation levy for thispurpose).
EN
28
EN
added tax (VAT) on goods and services, based on consumer and business choices,would be earmarked for development and then be topped up by voluntarycontributions by the businesses benefitting from the scheme in a dedicated fund tostrengthen health systems in poor countries. Finally,Belgiumhas earmarked nearlyEUR 90 million oflottery proceedsfor development-related purposes.5.2.Broadening existing mechanisms and introducing new onesThe above FfD mechanisms, most of them frontloading public funding throughthe capital markets or leveraging private finance through public incentives,have proven to deliver important contributions.While their individual revenue-raising potential might be limited, the combination of these instruments has asignificant effect in specific areas, notably in the health sector. Frontloading publicfinance for development can be particularly efficient if it prevents substantiallyhigher costs or risks in the future by acting at an early stage. However, these debt-based instruments can entail the risk of additional and hidden burdens on the aidbudgets of donor countries in the future. As a consequence, future aid flows may beadversely affected, creating inter-temporal distribution problems where the projectsfinanced have a lower-than-expected economic rate of return. Instruments aimed atleveraging private finance increase the capacity of public funds to channel resourcesinto investments with high economic returns, but the risk of deadweight effects in theprivate sector needs to be properly addressed.The value added of innovative mechanisms compared to general budgetresources as sources of financing for development should be properly assessed.While the general budgets of donor countries will have to be the major source ofdevelopment finance, there is little doubt that pressure will mount to further exploitthe potential of innovative finance mechanisms, notably to increase the prospects ofmeeting the MDGs. However, innovative financing related to economic activities,e.g. taxes on transactions, transport or emissions, can also be subject to volatility asthe tax base changes with economic cycles. This became evident in the lowerrevenues from some of the above mechanisms in 2009. Revenues from innovativefinancing are also frequently used for so-called "verticalfunds"which faceproblems of aid effectivenessby often being insufficiently owned by partnercountries and not well integrated into their broader poverty reduction strategies.Furthermore, setting-up and managing such vertical funds can be complex and tie upconsiderable resources for administration, which are then not available for their mainpurpose of reducing poverty. It is therefore indispensable tosecure,alsoin the fieldof innovative finance, the full respect of the agreed principles of aideffectiveness.Relevant implementation issues to ensure effective disbursement atbeneficiary level have to be addressed. This requires specific in-depth analysis andfull agreement among the main stakeholders concerned.6.DEBT SUSTAINABILITY AND DEBT MANAGEMENT CAPACITY–MAJOR CONCERNSDebt relief has substantially alleviated debt burdens in recipient countries. However,a number of challenges remain as Heavily Indebted Poor Countries (HIPCs), which
EN
29
EN
have not yet reached completion point62under the IMF/ World BankHIPC initiativeand theMultilateral Debt Relief Initiative(MDRI)63, need to strengthentheir debtmanagement policies and institutionswith continued support from the internationalcommunity. It is crucial to that HIPCs are granted full debt relief, if eligible underthe HIPC Initiative and the MDRI, from all creditors, including smaller multilateralcreditors, non-Paris Club bilateral official creditors, and private creditors. Moreover,theseinternational debt relief initiatives themselves need to be fully financed,also to cover potential new HIPCs which may require additional resources fromsome contributors.Notwithstanding debt relief, maintainingdebt sustainabilitybeyond the completionpoint isa worry for many HIPCsand the global crisis has exacerbated suchconcerns. Although analyses from the World Bank and the IMF do not so far indicatea great danger of a widespread debt crisis among HIPCs, the risks are increasing.HIPCs need to carry outsound borrowing policiesand strengthen their capacity tomanage public debt to avoid falling back into debt distress situations.6.1.Implementing debt relief and preserving debt sustainability: all donors need toparticipateContinued participation by creditors and donors in existing debt reliefinitiatives,in particular the HIPC and MDRI, is central to debt sustainability. Inorder to alleviate the impact of the financial and economic crisis on progress towardsthe MDGs, the EU needs to continue to give full support to the HIPC/MDRIinitiatives. The statements byalmost all Member Statesin their replies to theMonterrey survey that they havedelivered on their commitments to the HIPC/MDRI initiatives on time,are consistent with World Bank/IMF reporting on thesubject.Member States' replies also suggested thatexisting debt management andsustainability mechanisms should be further enhanced, their membershipbroadened and capacity in developing countries improved.Despite the risk of more restricted access to new loans and the higher borrowingcosts, many developing countries will be forced to resort to new borrowing tosupport continued investment in human and physical capital. These new loans needto be carefully managed, especially since a number of post-completion-point HIPCswere already assessed as being at high risk of debt distress prior to the economicdownturn.Maintaining long-term debt sustainabilityin post-HIPC/MDRI Low-Income Countries (LICs) will be central in the future. EU Member States apply theOECD principles and guidelines to promote sustainable lending practices in theprovision of official export credits to low income countries and are committed tousing the joint World Bank/IMF Debt Sustainability Framework to make informeddecisions on lending. Much of the debt sustainability problem derives from thefailure to enhance debt management capacity. It is therefore encouraging that twelve62
63
Completion point is the second and last step (after the decision point) towards receiving a full andirrevocable reduction in debt under the HIPC/MDRI initiatives. It is reached once the triggers agreed atthe decision point are met by the debtor country.See 'Heavily Indebted Poor Countries (HIPC) Initiative and Multilateral Debt Relief Initiative (MDRI) -Status of Implementation 2009' of September 15, 2009, available on the IMF and World Bank web sites.
EN
30
EN
Member States64reported that they were taking action to promote debt sustainability,mainly by participating in existing international initiatives in this area such as theDebt Management and Financial Analysis System Programme (DeMFAS) managedby UNCTAD65and the Debt Management Facility (DeMF)66managed by the WorldBank, to which the Commission is also planning to contribute. Moreover, someMember States are exploring the possibility of supporting the African Legal SupportFacility67.Member States have not usually taken individual action to mitigate thenegativeimpact of the economic and financial crisis on debt sustainabilitybut have rathersupported and participated in multilateral initiatives, e.g. the EU Vulnerability Flexinitiative or the World Bank crisis response window.Questioned on the need to reform theinternational architecture for restructuringsovereign debtin order to deal with potential future cases of debt distress in LICs,Member States do not propose to go beyond the line expressed in the CouncilConclusions of May 200968, which is 'to support discussions, if relevant, onenhanced forms of sovereign debt restructuring mechanisms, based on existingframeworks and principles (…)'. Most Member States do not expect the EU or theCommission to take the initiative in this field but to participate in a coordinatedmanner in discussions which are mainly led by the international financial institutions(IFIs).A majority of Member States see a role for the EU and the Commission inencouraging moreparticipation from the non-Paris Club creditorsin debt relieffor LICs and to promotingcomparable treatment for non-HIPC countriesthathave benefited from the Evian approach of the Paris Club.In its May 2008 Conclusions69, the EU committed itself to not sell claims on HIPCsto creditors unwilling to provide debt relief and called on all countries to do likewiseand to deter aggressive litigation bydistressed-debt funds(commonly referred to as'vulture funds'). Questioned on the need for specific interventions to prevent theseaggressive litigations against HIPCs, the questionnaire replies demonstrate thatspecific interventions by EU Member States are still rare and isolated and that, forthe moment, there seems to be no desire for a Commission proposal or an EUinitiative in this area.6.2.Next stepsIn the light of these findings and challenges, and reflecting earlier CouncilConclusions, the following measures should be taken:
64
6566
676869
Austria, Belgium, Czech Republic, Denmark, France, Germany, Ireland, the Netherlands, Poland,Portugal, Spain, the UK.See http://r0.unctad.org/dmfas/.Information available on the Wold Bank web site:http://web.worldbank.org/WBSITE/EXTERNAL/TOPICS/EXTDEBTDEPT/0,,contentMDK:22359443~menuPK:6030665~pagePK:64166689~piPK:64166646~theSitePK:469043,00.html.http://www.afdb.org/en/topics-sectors/initiatives-partnerships/african-legal-support-facility/.Council Conclusions 18 May 2009 (Support to developing countries in coping with the crisis) point 12.Council Conclusions of 27 May 2008, point 41.
EN
31
EN
•provide continued full and timely support for implementation of the HIPC/MDRIinitiatives including for arrears clearance;•call on commercial and non-Paris Club official creditors to step up theircontribution to implement the HIPC initiative and to granting comparable treatmentto non-HIPC countries that have benefited from the Evian approach;•support discussions on enhanced sovereign debt restructuring mechanisms based onexisting frameworks and principles, including the Paris Club, with a broadparticipation by creditors and debtors and comparable burden sharing amongcreditors and with a central role for the IMF and the World Bank in the debate70;•strengthen the debt management capacity of debtor nations giving a preference toparticipation in existing international initiatives;•provide highly concessional loans to HIPC graduated countries in risk of debtdistress.7.GOVERNANCE REFORMS–STRENGTHENING THE VOICE ANDREPRESENTATION OF DEVELOPING COUNTRIES
INTERNATIONAL
International financial stability is a global public good. The global financial andeconomic crisis has revealed a clear global and economic governance deficit. Theongoinginternational review of the international financial and monetaryarchitecture and global economic governanceshould ensure more effective andcoordinated management of global issues such as financial stability, food and energysecurity, climate change and the fight against major pandemics. The review shouldencompass the World Bank, other multilateral development banks (MDBs), the IMFand the United Nations and its specialised agencies, funds and programmes (such asthe FAO, the WHO and the ILO), the WTO and relevant regional organisations. Themain challenge is to strike the correct balance between the legitimacy (throughrepresentativeness) and the effectiveness of global institutions. In this context theimplementation of the G20 London Summit commitments including those on thereform of global financial governance are essential71. Europe, in line with its long-standing commitments72, should be driving the necessary reforms and should ensurethat theinterests and needs of developing countriesare taken into account.7.1.Governance reform of the Bretton Woods institutionsThe 2008reform package adopted by the International Monetary Fundwas afirst step in improving the alignment of members' quotas with their relative positionsin the world economy and has helped to strengthen the voice and representation ofdeveloping countries; the next review of quotas should be completed by January201173.
707172
73
As reflected in the May 18, 2009 Council Conclusions.G-20 London Summit Communique of 2 April 2009.Council Conclusions on the UN Conference on Financing for Development (Monterrey), 14 March2002 point 7 g).G-20 London Summit Leaders' Statement of 2 April.2009, point 20.
EN
32
EN
The currently discussed World Bank governance reform packageincludes anincrease in developing and transition countries' voting sharesin the InternationalBank for Reconstruction and Development (IBRD) and International DevelopmentAssociation (IDA) with special emphasis on the smallest poor members as animportant first step. The G20 and Development Committee decided a shift in votingrights of at least 3% towards developing and transition countries in addition to the1.46% increase favouring underrepresented countries, agreed on in the first phase ofthe reform. The majority of EU Member States agree that a further realignment ofshareholdings in the Bank should take account of the evolving weight of all membersin the world economy74and contributions to the World Bank Group, particularly tothe IDA75. This is consistent with theWorld Bank Group's 'DevelopmentMission'.A number of Member States76and the Commission believe thatstrengthening basic votes (in the IBRD and IFC77) would be a good option to protectand strengthen the voting power of the poorest,the low income countries (LICs).The crucial question is how this increase in voting power for developing andtransition countries will be implemented. For the EU, thelong-term objectiveshould be one single European seat at the IMF and the World Bank.The majority of EU Member States78and the Commission support anopen,transparent merit-based process to select the IMF Managing Director, theWorld Bank Presidentand senior staff of the two institutions regardless of theirnationality.7.2.Improving the efficiency and instruments of the International FinancialInstitutions (IFIs)The G20 called forincreased the resources and improved IFI instruments,particularly for low-income countries, and the Bretton Woods institutions took stepsto support developing countries:•Regarding theIMF79: (1) allocation of USD250 billion of Special Drawing Rights(SDR); (2) gold sales; (3) changes to IMF instruments, also favouring low incomecountries; (4) an appeal from the G-20 Pittsburgh Summit to developed countries,to volunteer their own Special Drawing Rights (SDR) resources to support IMFlending to the poorest countries80.•TheWorld Bankcreated a new crisis response window in IDA to help LICs copewith the current crisis and to protect them from future crises. The World BankGroup, namely its concessional arm IDA, should have sufficient resources to fulfilits development mandate and future development challenges81.
74
75767778798081
14 out of 27: Austria, Belgium, Denmark, Finland, France, Germany, Greece, Ireland, Italy, theNetherlands, Portugal, Spain, Sweden and the UK.This was stated by several EU Member States, e.g. Belgium, France, Germany, Finland and Spain.Austria, Denmark, Finland, France, Greece, Italy, Luxembourg and the UK.The International Bank for Reconstruction and Development and the International Finance Corporation.All Member States that were members of the EU prior to 2004.http://www.imf.org/external/np/exr/facts/sdr.htm.G-20 London Summit Leaders' Statement point 36.Development Committee Communiqué of October 2009.
EN
33
EN
•The G20 called on allMultilateral Development Banksto conclude all reviewsduring the first half of 2010 to ensure that requests for capital increases can beexamined together with similar requests to the World Bank Group and to avoidhaving available resources distributed on a first come first served basis.The EU Economic and Financial Committee recently agreed on principles for futurecapital increases for Multilateral Development Banks and the division of labourbetween them. Several Member States, in their answers to the Monterreyquestionnaire, agreed that special emphasis should be given to replenishments for thebanks' concessional arms such as the IDA at the World Bank and the AfricanDevelopment Fund (ADF) at the African Development Bank.7.3.United Nations governance reformThe systemic reforms decided at the 2005 World Summit have yet to be fullyimplemented; they include improved transparency, representativeness andeffectiveness of the principal UN bodies. Moreover, the 'UN system-wide coherencereform' needs to progress in order to reduce fragmentation of the UN system, tostrengthen its operational capacity and to improve the UN's efficiency atheadquarters and in the countries where it operates. The coherence of policies andactions between the IFIs and the UN needs to be strengthened. The UN's contributionto the work of the IFIs should be improved and made more systematic.7.4.The way forward•The Commission will monitor emerging discussions on how best to use the newSDR allocations in particular to the benefit of low-income countries.•In line with the decision by the G20 and the Joint World Bank/IMF DevelopmentCommittee, the EU and other Governors on the Boards need to ensure that theincreases in developing and transition countries' voting shares are swiftly andessential and a good solution would be to increase basic votes.•Europe's voice in the International Financial Institutions should be strengthenedthrough consolidated, less fragmented European representation, with the ultimateobjective of a single European seat at the IMF and the World Bank and EUcoordination should be stepped up, particularly within regional developmentbanks.•the replenishments for concessional arms of Multilateral Development Banks suchas the IDA at the World Bank Group and the African Development Fund at theAfrican Development Bank are of particular concern in relation to capitaladequacy.•The 'UN system-wide coherence reform' needs support in order to reducefragmentation of the UN to strengthen its operational capacity and improve itsefficiency headquarters and in the countries where it operates.
EN
34
EN
8.8.1.
SUCCESSIVECHALLENGES
CRISES AND CLIMATE CHANGE
-
THE MOST IMPORTANT GLOBAL
Impact of the financial and economic crisis on developing countriesIn 2009 the European Commission reacted rapidly to support developing countries incoping with the crisis82and proposed a set of comprehensive, timely, targeted andcoordinated measures to be taken by the EU, largely endorsed by the Council83.One of the main concrete and short-term instruments is thead hocVulnerabilityFLEX (V-FLEX)mechanism to mobilise EUR 500 million in 2009 and 2010 tosupport the most vulnerable ACP countries with poor resilience, with a view toenabling them to maintain priority spending, notably in social sectors. In 2009, thefirst tranche of the allocations came to EUR 215 million for 13 ACP countries. Incollaboration with the IFIs, the Commission has already started working towardsidentifying the ACP countries potentially eligible under the 2010 V-FLEX exercise.The EU response also includes measures decided to address the previousfood crisis(including the EUR 1 billion Food Facility set up in reaction to the soaring foodprices in 2008). The Commission has delivered the main elements of a collective EUresponse but several EU Member States also acted, through bilateral responses aswell as their contributions to IFI resources.While theanalyses and reportsof the IFIs, the UN and the OECD have provideduseful information on the impact of the crisis on developing countries, severalMember States (Belgium,Germany, the Netherlandsandthe UK)have alsoconductedspecific assessmentsfor a number of developing countries, includingthrough enhanced consultations with partner countries. Most of the Member Stateshave sought close cooperation and coordination with the IFIs and the Commission intheir response to the crisis. Some (Austria,Finland, France, Germany, Spain,Swedenandthe UK)have contributed to the support mechanisms set up by the UNand the IFIs, including the World Bank's operational crisis response initiatives. Amajority of Member States have either reviewed or plan to review their developmentcooperation programmes on the basis of new needs and priorities resulting from thecrisis.
8.2.
Global Public Goods and global challengesThefinancing of global public goods,such as global health, food security andsecurity, is a priority for the European Union and its Member States. Member Statesand the European Commission contribute through avariety of instruments,including humanitarian assistance, country development assistance, contributions toglobal funds and multilateral programmes. This reflects the variety of needs and thefact thatdevelopment and global public goodsoftenstrongly interact.Furthermore, the outcome on global public goods also greatly depends on non-development policies and regulations.
82
83
COM (2009) 160, Brussels, 8.04.2009 Commission Communication 'Supportingdeveloping countriesin coping with the crisis'.10018/09, Brussels, Council Conclusions of 18 May, 2009.
EN
35
EN
Besides a strengthening of the international governance, notably in the area of foodsecurity, the new EU approach to Policy Coherence for Development (PCD)focusing on policies implemented to tackle global challenges (Trade and Finance,Climate Change, Food Security, Migration and Security) should contribute to greateraid efficiency and effectiveness.8.3.Climate change financing - a major issue in the international negotiationsThe key challenges for climate negotiations are toagree on emission reductiontargets and appropriate actionsto ensure that the global average temperature riseremains below 2�C and on international and national actions to adapt to the impact ofclimate change. The financing issue is central to the prospects for reaching thisambitious post-2012 agreement. Throughout 2009 the EU intensely debated theclimate change-related financing.•The Commission's views are summarised in the Communication 'Steppingupinternational climate finance: a European blueprint for the Copenhagen deal'84: By2020 roughly EUR 100 billion will be required for mitigating emissions and adapting toclimate change in all developing countries. Financing should come from three mainsources: (1) domestic public and private finance from developing countries (estimatedshare at 20-40 %), (2) the international carbon market (up to 40 %, depending on carbonprice) and (3) international public finance in the range of EUR22 to 50 billion per year.Industrialised countries and economically more advanced developing countries shouldcontribute, while LDCs should not. International public funding contributions should beshared on the basis of two criteria: the ability to pay and responsibility for emissions.•TheCouncilrecognised: (1) that a climate agreement will require a gradual butsignificant scaling up of both public and private financial flows to developing countries -including through the carbon market - for adaptation, mitigation, deforestation reduction,technology and capacity-building activities and that current institutional arrangements forclimate finance were not designed to handle disbursal of finance; (2) that adequate,predictable and timely financial support for implementation of an international agreementis crucial; and (3) that the EU is prepared to take on its fair share, in the framework of aglobal and comprehensive Copenhagen agreement which entails appropriate andadequate contributions by the Parties.•TheEuropean Councilcalled on all international parties to undertake that such financingwould not undermine or jeopardise the fight against poverty and continued progresstowards the MDGs and recognised the role of innovative financing for sustainabledevelopment85. It also stressed the importance of improving climate finance-relatedstatistics for monitoring financial flows to developing countries, including ODA.•The European Council of December 2009pledgedthat the EU would collectively providefast-start funding for 2010-2012of EUR2.4 billion on average per year.
The main outcome of theCopenhagen Accord (CA)86, which contains solidelements on finance for climate change, is consistent with the overall EU line on
848586
COM(2009) 475, 10.9.2009.Conclusions of the European Council of 29-30 October 2009.The Copenhagen Accord, includes a 'collective commitment by developed countries to provide new andadditional resources, including forestry and investments through international institutions, approachingUSD 10 billion annually for the period 2010-2012, with balanced allocation between adaptation andmitigation'. Council Conclusions of 11.12.2009 on the Copenhagen Conference on Climate Change,paragraph 37 concerning the climate fast-start international public support: 'The EU and its Member
EN
36
EN
finance. By March 2010, more than 100 developed and developing countries have, sofar, associated themselves, and notified their pledges for mitigation targets andaction, demonstrating sound support to the Accord and their commitment to act now.The Copenhagen Accord contains several positive points for developing countries that canbe considered a step forward:-recognition thattemperature rise should remain below 2�C;responding to demandsespecially of island states there will be a review by 2015 to consider a target of 1.5�C;-(emerging) developing countries are expected to implement mitigation actions; LeastDeveloped Countries (LDCs) and Small Island Developing States may undertake voluntaryactions on the basis of support;-special attention is envisaged tohelp LDCs, Small Island Developing States andAfrica;adaptation funding is to be prioritised for the most vulnerable;-recognition of the crucial role ofreducing emissions from deforestation anddegradation,and the need, in this context, toprovide positive incentives;-recognition of the importance oftechnology transfersand of the need to amechanism to enhance such transfers;-a collective financial commitment of developed countries forfast start fundingduring2010-12 approaching USD 30 billion for developing countries;-ajoint goalto mobilise USD 100 billion per year by 2020 from a range of private andpublic sources to address the needs of developing countries for mitigation (includingregarding deforestation), and adaptation, technology transfer and capacity building.As a precursor to the High Level Panel agreed upon in the Accord the UN Secretary Generalset up a High Level Advisory Group on Climate Finance to study the contribution of potentialsources of revenue, including alternative sources of finance.87.The European Commissionpledged a contribution of EUR50 million per year to fast start finance for 2010-12, which iscovered - for 2010 - by the EC budget for the Environment and Natural Resources ThematicProgramme (ENRTP).
Almost allMember States– in the Monterrey questionnaire – indicateadaptationas a priority88for support and especially highlightedwater management.Otherpriorities reported are: energy efficiency, renewable energy and Reducing Emissionsfrom Deforestation and Degradation (REDD). The majority of Member States andthe Commission concur on the need to further consider innovative financing tosupport developing countries coping with climate change. Among possibleinnovative sources, revenues linked to thecarbon marketas well as tointernational maritime or air transportare interesting options.In accordance withthe EU Emission Trading Scheme (ETS) Directive89, as agreed by EU MemberStates and the European Parliament in December 2008, at least 50% of the revenuesgenerated from the auctioning of allowances under the ETS should be used, interalia, for supporting developing countries that have ratified the internationalagreeement on climate change to finance measures to avoid deforestations and
87
88
89
States are ready to contribute with fast-start funding of EUR 2.4 billon annually for the years 2010 –2012.'The UN Secretary-General announced the launch of the High-level Advisory Group on 12 February2010. It will be co-chaired by the UK Prime Minister Gordon Brown and the Ethiopian Prime MinisterMeles Zenawi.Austria, Belgium, Cyprus, Czech Republic, Finland, France, Germany, Greece, Ireland, Italy,Luxembourg, Malta, Poland, Portugal, Romania, Slovakia, Slovenia, Spain and the UK.Directive 2009/29/EC of 23 April 2009 amending Directive 2003/87/EC so as to improve and extendthe greenhouse gas emission allowance trading scheme of the Community, OJ L 140, 5.6.2009, p 63.
EN
37
EN
increase afforestation and reforestation, to transfer technologies and to copewith adverse effects of climate change.Global instruments addressing internationalaviation and maritime transport could provide an important source of innovativefinancing building on existing commitments under the EU ETS for all aviation actionrevenues to be use for climate change measures.For the way ahead,priority should be given to:•implementingas soon as possible the EUfinancial pledge to the fast-startfunding under the Copenhagen Accordof EUR2.4 billion per year during 2010-2012. The European Commission could take a facilitating and coordinating role inthe implementation of the EU's fast-start funding commitment;•Continuedwork for the effectiveimplementation of the Global ClimateChange Alliancebetween the EU and poor developing countries most vulnerableto climate change;•exploring the contributionthat innovative sources and mechanisms of fundingcan make to support developing countries cope with climate change;•promotingmechanismsthat canleverage private sector finance by using publicfunding in innovative ways,including by taking into account the experience ofthe EU's Global Energy Efficiency and Renewable Energy Fund(GEEREF);•reflectingon therelation between climate funding and ODA;•establishing a fully transparent reporting system, using a comprehensive set ofclimate finance statistics, which build on the OECD-DAC system;•promoting amore balanced geographical distribution of financing under theClean Development Mechanismand encouraging to move from a pure projectapproach towards a sector-wide carbon market mechanism;•further promoting renewable energy,in the context of improved energysecurity and sustainability, andpaying careful attention to the sustainability ofbio-fuelsas one of the sources of renewable energy.
EN
38
EN
ABBREVIATIONSACPADFAfDBAfTAMCATAWEPAATAFBCPRBEBGCAPCIATCIFCOMCPSSCSPCSRCYCZDACDDRDEDKDRRDRRPDSFDTCEBRDECECOFINECOSOCEDFEEEEAEIBEIFEITIELENPEPAESETSEU-27EU-15EU-12FAOAfrican, Caribbean and Pacific States, party to the Cotonou AgreementAfrican Development FundAfrican Development BankAid for TradeAdvance Market CommitmentAustriaAssociation of European Parliamentarians for AfricaAfrican Tax Administration CentreUnited Nations Development Programme's Bureau for Crisis Prevention andRecoveryBelgiumBulgariaCommon Agricultural PolicyCentro International de Agricultura tropicalClimate Investment FundsEuropean CommissionCommittee on Payments and Settlements SystemsCountry Strategy PaperCorporate social responsibilityCyprusCzechDevelopment Assistance Committee of the OECDDisarmament, Demobilisation and Reintegration of former combatantsGermanyDenmarkDisaster risk reductionDisaster Risk Reduction PreventionDebt Sustainability FrameworkDouble Tax ConventionEuropean Bank for Reconstruction and DevelopmentEuropean CommunityEconomic and Financial Affairs CouncilEconomic and Social CouncilEuropean Development FundEstoniaEuropean Economic AreaEuropean Investment BankEuropean Investment FundExtractive Industries Transparency InitiativeGreeceEuropean Neighbourhood PolicyEconomic Partnership AgreementSpainEmission Trading SchemeEuropean Union and its 27 Member StatesThe 15 Member States of the EU members of the EU prior to 2004The 12 Member States of the EU joining the EU in or after 2004Food and Agriculture Organisation
EN
39
EN
FFDFIFLEGTFLEX:FoSFRFFDFSFG8GAERCGAVIGCCAGDPGEEREFGEFGFATMGFDRRGIIFGNIGPGGVPHIPCHLPMHUIATIIBRDICFIDAIDBIDLOIEIFADIFCIFFIFFIIFIsIFMILOIMFIMFCIPGISDRISO26000ITITCITRSLDCsLICs
Financing for DevelopmentFinlandForest Law Enforcement, Governance and TradeThe EU instrument to compensate African, Caribbean and Pacific (ACP)countries for short term fluctuations in export earningsFramework of StandardsFranceFinancing for DevelopmentFinancial Stability ForumGroup of Eight (Summit of Canada, France, Germany, Italy, Japan, Russia,United Kingdom and United States)General Affairs and External Relations CouncilGlobal Alliance for Vaccines and ImmunisationGlobal Climate Change AllianceGross Domestic ProductGlobal Energy Efficiency and Renewable Energy FundGlobal Environment FacilityGlobal Fund Against AIDS, Tuberculosis and MalariaGlobal Facility for Disaster Risk ReductionGlobal Index Insurance FacilityGross National IncomeGlobal Public GoodsGlobal Vertical ProgrammesHeavily Indebted Poor CountriesHigh Level Plenary MeetingHungaryInternational Aid Transparency InitiativeInternational Bank for Reconstruction and DevelopmentInvestment Climate Facility for AfricaInternational Development AssociationInter-American Development BankInternational Development Law OrganisationIrelandInternational Fund for Agricultural DevelopmentInternational Finance CorporationInternational Financial FacilityInternational Finance Facility for ImmunisationInternational Financial InstitutionsInnovative Finance MechanismsInternational Labour OrganisationInternational Monetary FundInternational Monetary and Financial CommitteeInternational Public GoodsInternational Strategy for Disaster ReductionStandard on Social responsibilityItalyInternational Tax CompactInternational Transactions Reporting SystemLeast Developed CountriesLow Income Countries
EN
40
EN
LTLULVMDGMDRIMDTFMTOsMTRMoUMSMTNAMAsNAPA:NGONLODAOECDOECD CRSOEWGPCDPEFAPFMPGAPIUPLPSDPTREDDRORSPSESISIDSSKSMEStabexSRFSTARTIEAsTRAUKUNUNDEFUNDPUNGAUNFCCCUNITAIDUNODCUNSC:
LithuaniaLuxembourgLatviaMillennium Development GoalsMultinational Debt Relief InitiativeMulti-Donor Trust Fund of World BankMoney Transfer OperatorsMid-Term ReviewMemorandum of UnderstandingMember StatesMaltaNationally Appropriate Mitigation ActionsNational Adaptation Programmes of ActionNon-Governmental OrganisationThe NetherlandsOfficial Development AssistanceOrganisation for Economic Cooperation and DevelopmentOrganisation for Economic Cooperation and Development Creditor ReportingSystemOpen-ended Working GroupPolicy Coherence for DevelopmentPublic Expenditure and Financial AccountabilityPerformance Measurements FrameworkPresident of UN General AssemblyProject Implementation UnitsPolandPayment Service DirectivePortugalReducing emissions from deforestation and degradationRomaniaRegional Strategy PaperSwedenSloveniaSmall Island Developing StatesSlovakiaSmall and medium-sized enterprisesSystem to Stabilise Export EarningsStatistics for Results FacilityStolen Assets Recovery InitiativeTax Information Exchange AgreementsTrade Related AssistanceUnited KingdomUnited NationsUnited Nations Democracy FundUnited Nations Development ProgrammeUnited Nations General AssemblyUnited Nations Framework Convention on Climate ChangeUnited Nations International Drug Purchase FacilityUnited Nations Office on Drugs and CrimeUnited Nations Security Council
EN
41
EN
WBWCOWFPWHOWTO
World BankWorld Customs OrganisationWorld Food ProgrammeWorld Health OrganisationWorld Trade Organisation
EN
42
EN
Annex 1: UN Convention against Corruption (Merida Convention) - State of signatureand ratification by the EUDate of Ratification, Date of SignatureAccession,Acceptance,ApprovalAustriaBelgiumBulgariaCyprusCzech RepublicDenmarkEstoniaFinlandFranceGermanyGreeceHungaryIrelandItalyLatviaLithuaniaLuxembourgMaltaThe NetherlandsPolandPortugalRomaniaSlovak RepublicSloveniaSpainSwedenUK11-Jan-0625-Sep-0820-Sep-0623-Feb-09---26-Dec-0620-Jan-10*20-Jun-06 (accepted)11-Jul-05---17-Sep-0819-Apr-05---05-Oct-0904-Jan-0621-Dec-0606-Nov-0711-Apr-0831-Oct-06 (accepted)15-Sep-0628-Sep-0702-Nov-0401-Jun-0601-Apr-0819-Jun-0625-Sep-0709-Feb-0610-Dec-0310-Dec-0310-Dec-0309-Dec-0322-Apr-0510-Dec-03N/A09-Dec-0309-Dec-0309-Dec-0310-Dec-0310-Dec-0309-Dec-0309-Dec-0319-May-0510-Dec-0310-Dec-0312-May-0510-Dec-0310-Dec-0311-Dec-0309-Dec-0309-Dec-03N/A16-Sep-0509-Dec-0309-Dec-03
EC12-Nov-0815-Sep-05* Estonia has concluded the national ratification process and is in the process of depositingthe ratification instruments at the UN/
EN
43
EN
Annex 2: EU ODA levels 2006-2009, estimates and gaps for 2010 (ODA in EUR million and % of GNI) - Baseline CaseGNI and ODA in million € at current prices2010(commitme nts/fore cast)2010: financial gap tome e t INDIVIDUALtarge ts2010: financial gap tome e t C O LLEC TIVEtarge t 0.56%O DAtarge t inmillionGap in Gap in % ofGNI€million €
2006
2007
2008
2009
2010 (fore cast)
O DA inmillion €O fficial Targe ts
O DA in %of GNI
O DA inmillion €
O DA in %of GNI
O DA inmillion €
O DA in % O DA inof GNImillion €
O DA in %of GNI
O DA inmillion €
O DA in %of GNI
O DA inmillion €
O DA in %of GNIEU-15: 0.51EU-12: 0.17(or nationaltarget)
Gap inmillion €
Gap in %of GNIEU-15: 0.51EU-12: 0.17
AustriaBe lgiumBulgariaC yprusC z e ch Re publicDe nmarkEstoniaFinlandFranceGe rmanyGre e ceHungaryIre landItalyLatviaLithuaniaLuxe mbourgMaltaThe Ne the rlandsPolandPortugalRomaniaSlovak Re publicSlove niaSpainSwe de nUKEU 15 TO TALEU 12 TO TALEU 27 TO TAL
1194157512112817821166584458313338119814290192023274343236316344353038315199264703363547664
0.470.500.000.150.120.800.090.400.470.360.170.130.540.200.060.080.890.150.810.090.210.000.100.120.321.020.510.430.090.41
132114251718131187212717722089783667687129011235274845472653448449403755317071944495474545699
0.500.430.060.120.110.810.080.390.380.370.160.080.550.190.060.110.920.150.810.100.220.070.090.120.370.930.350.390.090.37
1188165413261731944168087562969348874921337015352881148482584309464474761328179734920782550032
0.430.480.040.170.120.820.100.440.390.380.210.080.590.220.070.110.970.200.800.080.270.070.100.130.450.980.430.430.090.40
823186812291612017149248927860543683718238015352891146142493649953514719326782674821781249029
0.300.550.040.170.120.880.110.540.460.350.190.090.540.160.080.141.010.200.820.080.230.080.080.150.461.120.520.440.100.42
103124341630170204213966936499258157867130432035300114708437514995352526530201015954257101255270
0.370.700.050.170.130.880.100.540.470.400.350.090.510.200.120.150.950.190.830.130.330.080.080.150.520.960.620.490.110.46
14112434573022118632292110223126551188154671791529403151045155518062111146056893143911762866149964365
0.510.700.170.170.170.800.170.510.510.510.510.170.510.510.170.171.000.170.800.170.510.170.170.170.561.000.560.560.170.53
38041519859272937376487296
0.140.120.040.070.040.110.160.080.310.050.02
114292112628
0.040.180.090.090.02
95064889994
0.090.060.0867384121140.10
EN
44
EN
EU ODA levels 2006-2009, estimates and gaps for 2010 (ODA in EUR million and % of GNI)- Low Case2010(commitme nts/fore cast)2010: financial gap tome e t INDIVIDUALtarge ts2010: fi nancial gap tome e t C O LLEC TIVEtarge t 0.56%O DAtarge t inmil li onGap in Gap in % of€mi ll i on €GNI
2006
2007
2008
2009
2010 (fore cast)
O DA i nmi ll i on €O ffi cial Targe ts
O DA i n %of GNI
O DA i nmi l li on €
O DA i n %of GNI
O DA inmil li on €
O DA in % O DA inof GNImil li on €
O DA in %of GNI
O DA i nmi ll ion €
O DA in %of GNI
O DA i nmi ll ion €
O DA i n %of GNIEU-15: 0.51EU-12: 0.17(or nationalt arget)
Gap i nmi ll ion €
Gap i n %of GNIEU-15: 0.51EU-12: 0.17
Austri aBe lgiumBul gari aC yprusC z e ch Re publi cDe nmarkEstoni aFinlandFranceGe rmanyGre e ceHungaryIre l andItalyLatviaLithuani aLuxe mbourgMal taThe Ne the rlandsPol andPortugalRomaniaSlovak Re publi cSlove niaSpainSwe de nUKEU 15 TO TALEU 12 TO TALEU 27 TO TAL
1194157512112817821166584458313338119814290192023274343236316344353038315199264703363547664
0.470.500.000.150.120.800.090.400.470.360.170.130.540.200.060.080.890.150.810.090.210.000.100.120.321.020.510.430.090.41
132114251718131187212717722089783667687129011235274845472653448449403755317071944495474545699
0.500.430.060.120.110.810.080.390.380.370.160.080.550.190.060.110.920.150.810.100.220.070.090.120.370.930.350.390.090.37
1188165413261731944168087562969348874921337015352881148482584309464474761328179734920782550032
0.430.480.040.170.120.820.100.440.390.380.210.080.590.220.070.110.970.200.800.080.270.070.100.130.450.980.430.430.090.40
823186812291612017149248927860543683718238015352891146142493649953514719326782674821781249029
0.300.550.040.170.120.880.110.540.460.350.190.090.540.160.080.141.010.200.820.080.230.080.080.150.461.120.520.440.100.42
103124341630170204213966866499258157867130432035300114708437514995352526530201015953557101254570
0.370.700.050.170.130.880.100.540.430.400.350.090.510.200.120.150.950.190.830.130.330.080.080.150.520.960.620.480.110.45
14112434573022118632292110223126551188154671791529403151045155518062111146056893143911762866149964365
0.510.700.170.170.170.800.170.510.510.510.510.170.510.510.170.171.000.170.800.170.510.170.170.170.561.000.560.560.170.53
380415191559272937376487296
0.140.120.040.070.080.110.160.080.310.050.02
114292112628
0.040.180.090.090.02
1020648810694
0.090.060.0967384128140.11
Source: OECD/DAC for 2006-2009, where available; otherwise Commission data based on Member States' information to the Commission. Note: shaded cells contain information supplied by MemberStates, white cells are OECD DAC or Commission data or simulations. ODA is at current prices.Annex 4describes the Commission's methodology applied for analysing ODA indications/ forecasts providedby EU Member States.
EN
45
EN
Annex 3: ODA indicators – preparedness to meet the individual commitmentsODA indicator for the EU-15 – preparedness to meet the individual commitments of 0.51% and 0.7% ODA/GNI by 2010 and 2015
1.201.101.000.900.800.820.881.011.12
Towards reaching ODA targets
% ODA/GNI
0.700.600.500.460.350.300.200.160.100.000.230.190.300.460.400.520.540.540.55
Belgium
Netherlands
Portugal
Greece
Germany
France
Austria
Luxembourg
UK
Denmark
Ireland
2015 target of 0.7% ODA/GNI2010 target of 0.51% ODA/GNIODA/GNI in 2000ODA/GNI in 2009 Arrows
The position of the arrows represent the 2009 ODA/GNI level f or each country.The direction of the arrow indicates whether ODA went up or down f rom 2008 levels. Arrows are coloured:greenif the MS is "on track" with a clear timetable to meet the 2010 target of 0.51% ODA/GNI,redif it is not "on track", and needs to substantially reinf orce ef f orts to reach the target.A diamond indicates that ODA levels stayed the same f rom 2008 to 2009.
Source: European Commission 2010
EN
Finland
Sweden
Spain
Italy
46
EN
ODA indicator for the EU-12 – preparedness to meet the individual commitments of 0.17% and 0.33% ODA/GNI by 2010 and 2015
0.35
0.30
0.25
% ODA/GNI
0.200.170.150.120.100.080.050.040.00BulgariaLatviaPolandRomaniaSlovakiaHungaryEstoniaCzechRepublicSloveniaLithuaniaCyprus0.080.080.080.110.090.150.14
0.20
Towards reaching ODA targets
Malta
2015 target of 0.33% ODA/GNI2010 target of 0.17% ODA/GNIODA/GNI at tim e of EU accessionODA/GNI in 2009 Arrows
The position of the arrows represent the 2009 ODA/GNI level f or each country.The direction of the arrow indicates whether ODA went up or down f rom 2008 levels. Arrows are coloured:greenif the MS is "on track" with a clear timetable to meet the 2010 target of 0.17% ODA/GNI,orangeif the MS is also "on track" and planning to reach the 2010 target of 0.17% ODA/GNI but does nothave a clear timetable, andredif it is not "on track", and needs to substantially reinf orce ef f orts to reach the target.A diamond indicates ODA levels stayed the same f rom 2008 to 2009.
Source: European Commission 2010
EN
47
EN
Annex 4: The Commission methodology applied for analysingODA indications/ forecasts provided by EU Member States:Figures on Official Development Assistance (ODA) are in current prices and have been taken from theOECD Development Assistance Committee (DAC) for the years 1995 to 2009, inclusive, for thoseMember States for which DAC reports90. For those Member States that do not report ODA volumes toDAC, figures for 2008 and 2009 have been taken from Member States' replies to the annualquestionnaire. Where Member States did not make an indication for their 2009 ODA volume, it wasassumed that those Member States would maintain their 2008 nominal ODA volume.The Commission requested all Member States to share their replies to the DAC AdvanceQuestionnaire on ODA 2009, in order to ensure consistency between figures published here and thosethat Member States report to the OECD DAC in the Advance Questionnaire.From 2010 onwards, ODA figures have been taken, as far as available, from Member States’ replies.For those Members States that gave ODA figures in national currencies the Commission’s annualaverage exchange rates for the respective years have been applied to convert them into euro. Up to2011, the exchange rates have been taken from the Commission’s autumn 2009 forecast and, beyondthat, nominal exchange rate stability has been assumed. Where a Member State has presented onlythe ODA/GNI ratio, ODA has been calculated by multiplying it with the Commission’s estimate of GNI.Where a Member State has given both the ODA figure and the ODA/GNI ratio, we have givenpreference to using the ODA volume figure as ODA/GNI targets are more sensitive to differingassumptions on GNI.Theratios of ODA to GNI might be subject to changeafter the publication of this report. For theyear 2009 only preliminary GNI figures were available from the Commission's official AMECOdatabase91and from EU Member States' information on their ODA volumes and national GNI providedto the Commission (in the replies to the Monterrey questionnaire) and the OECD/ DAC (March 2010 inresponse to the DAC advance ODA questionnaire).For 2010:-indications show both (1) the forecasts the Member States made regarding their ODA levels in2010 and (2) the individual ODA/GNI targets of each Member States for that year (0.51% for EU-15Member States and 0.17% for Member States that joined the EU after 2004).-When Member States did not provide a forecast for 2010 ODA levels, it was assumed thatthey will maintain their nominal ODA volume of 2009.-When Member States indicated ODA volumes that exceed their individual targets, that aidlevel is reflected in the commitment column for 2010.-A baseline and a low case scenario were created to show the lower and higher outcome,when Member States indicated a range of possible ODA volumes.
90
91
For figures between 1995 and 2009, the Commission services used the OECD DAC exchange rates andGNI figures to ensure consistency with percentages already published by the OECD DAC. For figuresbetween 2010 and 2015, Commission estimates for exchange rates and GNI were used. Marginaldifferences in the ODA/GNI ratios for some countries in the Commission calculations compared to theOECD DAC calculations could still, however, be due to minor differences in the applied exchange ratesand GNI estimates. The OECD DAC also published figures for EU Member States that are not DACmembers. Where available, this data was used. For 2008 data however, some non-DAC Member Statesprovided more up to date information to the Commission than the data published by the DAC. Wherethis was the case, the Commission used the more up to date information.http://ec.europa.eu/economy_finance/ameco/user/serie/SelectSerie.cfm
EN
48
EN
For the remaining years the Commission established 3 different scenarios for reaching the 2015targets for Member States (0.7% for EU-15 Member States and 0.33% for Member States that joinedthe EU after 2002).-A linear increase scenario. In this scenario, the ODA volume required to meet the 2015 target foreach Member State, was calculated by using the official Commission estimates for GNI levels. TheCommission calculated the ODA amount that is required in addition to the 2009 ODA volume bydistributing this required increase evenly between 2010 and 2015. On that basis ODA as a % of GNIwas calculated using the official Commission GNI estimates.-A constant growth scenario. In this scenario, the ODA volume required to meet the 2015 target foreach Member State, were calculated as above. The Commission determined the average annualgrowth rate in the ODA volumes required to reach this target, starting from 2010. This growth rate wasthen applied to the 2009 ODA result, to obtain the ODA volumes in interim years. Finally ODA as a %of GNI was established using the official Commission GNI estimates.-A scenario with an interim 2012 target. The Commission determined an interim target that lies halfway – i.e. in 2012, between ODA as a % of GNI in 2009 and the 2015 targets. For this scenario, theCommission calculated a linear progression in ODA as a % of GNI, between the 2009 ODA outcomeand the 2012 interim target, and between the 2012 interim target and the 2015 target. On this basis,ODA volumes for interim years were calculated by multiplying the expected ODA as a % of GNI,applying the official Commission GNI estimates.-Where provided, the Commission also indicated Member State’s estimates for their ODA volumesbetween 2010 and 2015.Figures for Gross National Income (GNI) in current prices are estimates for 2009 and from theCommission’s autumn 2009 forecast and February 2010 interim forecast for the years 2010 and 2011.GNI figures for the years 2012 to 2013 were calculated by applying the Commission’s country-specificprojections of nominal GDP growth rates. The Commission’s projections are based on potential outputgrowth estimates until 2013, based on a methodology which was also used for the purpose ofbudgetary calculations in the context of the EU financial framework 2007-2013.92The GNI growthrates applied for the years 2014 and 2015 were assumed to be equal to the 2013 growth raterespectively.
92
The Commission estimates Member States’ potential output growth on the basis of the productionfunction approach. For further technical details see Cécile Denis, Kieran Mc Morrow and Werner Röger(2002), “Production function approach to calculating potential growth and output gaps – estimates forthe EU Member States and the US”Economic PapersNo. 176, European Commission, Brussels,September 2002, and Cécile Denis, Daniel Grenouilleau, Kieran Mc Morrow and Werner Röger (2006),"Calculating Potential Growth Rates and Output Gaps - A revised Production function approach ",Economic PapersNo. 247, European Commission.
EN
49
EN
Annex 5: ODA trajectories of all EU Member States 1995 – 2015
EU27 - ODA as a % of GNIHistorical data and scenarios for reaching 2015 targetsEU15Outcome linear increase in ODA volume2012_Intermediate_TargetsEU25Outcome constant growth rate in ODA volumeEU15 ODA to Africa incl. imputed multilateralEU27Collective Targets 2010/2015EU15 ODA to LDCs incl. imputed multilateral
0.80
0.70
ODA as a % of GNI•2009-2015increase required:•0.28 % of GNI over whole period•Averageof 0.047 % of GNI per year0.61
0.700.660.630.630.590.560.550.540.490.410.350.350.350.410.370.400.420.460.500.69
0.60
•Highestprevious annual increase:•2008:+0.03%•Highestprevious multi year increase:•2007-2009:+0.04% (annual: +0.02%)0.370.370.330.330.310.320.33
0.590.55
ODA as a % of GNI
0.50
0.40
0.30
ODA Volume (EUR)•ODAgap to 2015 0.7% target from 2009 level:•EUR52.7 billion•Annualincrease in ODA volume to meet target:•EUR8.78 billion increase each year•13% average annual growth rate inODA volume
0.20
0.10
0.00199519961997199819992000200120022003200420052006200720082009201020112012201320142015
EN
50
EN
Austria - ODA as a % of GNIHistorical data and scenarios for reaching 2015 targetsHistorical/MS Forecast2012_Intermediate_TargetsLinear increase in ODA volumeODA to Africa incl. imputed multilateralConstant growth rate in ODA volumeODA to LDCs incl. imputed multilateral2010 Target
0.80
0.70
ODA as a % of GNI
•2009-2015increase required:•0.40 % of GNI over whole period•Averageof 0.067 % of GNI per year•Highestprevious annual increase:•2004:+0.29%•2001:+0.11%•Highestprevious multi year increase:•2003-2005:+0.32% (annual: +0.16%)0.60
ODA Volume (EUR)
•ODAgap to 2015 target from 2009 level:•EUR1.5 billion•3.1% of EU27 ODA funding gap•Annualincrease in ODA volume to meet target:•EUR258 million increase each year•19% average annual growth rate in ODA volume0.520.470.500.430.390.390.370.350.300.260.510.480.470.410.370.700.660.610.570.530.470.590.530.650.61
0.50
ODA as a % of GNI
0.400.340.300.270.230.200.240.220.240.230.20
0.23
0.10
0.00199519961997199819992000200120022003200420052006200720082009201020112012201320142015
EN
51
EN
Belgium - ODA as a % of GNIHistorical data and scenarios for reaching 2015 targetsHistorical/MS Forecast2010 TargetODA to Africa incl. imputed multilateralODA to LDCs incl. imputed multilateral
0.80
0.70
ODA as a % of GNI
•Belgiumnational timeline on schedule to reachand maintain target in 2011.•2009-2015increase required:•0.15 % of GNI over whole period•Highestprevious annual increase:•2003:+0.17%•2005:+0.12%•Highestprevious multi year increase:•1999-2003:+0.30% (annual: +0.075%)•2007-2009:+0.12% (annual: +0.06%)0.380.340.310.350.300.360.370.70
0.70
0.70
0.70
0.70
0.70
0.600.530.500.430.430.480.550.51
0.60
0.50
ODA as a % of GNI
0.41
0.40
0.30
ODA Volume (EUR)
•ODAgap to meet and keep 2015 targetfrom 2009 level:•EUR1.1 billion•2.1% of EU27 ODA funding gap•Annualincrease in ODA volume tomeet/keep target from 2009 level:•EUR177 million increase each year•8% average annual growth rate inODA volume0.20
0.10
0.00199519961997199819992000200120022003200420052006200720082009201020112012201320142015
EN
52
EN
Bulgaria - ODA as a % of GNIHistorical data and scenarios for reaching 2015 targetsHistorical/MS ForecastLinear increase in ODA volumeConstant growth rate in ODA volume2010 Target2012_Intermediate_Targets
0.40
0.35
ODA as a % of GNI
•2009-2015increase required:•0.29 % of GNI over whole period•Averageof 0.048 % of GNI per year•Highestprevious annual increase:•2007:+0.06%ODA Volume (EUR)
•ODAgap to 2015 target from 2009 level:•EUR132 million•0.3% of EU27 ODA funding gap•Annualincrease in ODA volume to meet target:•EUR22 million increase each year•51% average annual growth rate in ODA volume0.220.210.170.230.290.260.250.33
0.30
0.25
ODA as a % of GNI
•Highestprevious multi year increase:•N/A
0.20
0.150.100.100.060.050.010.0019951996199719981999200020012002200320042005200620072008200920100.000.040.040.060.05
0.160.16
0.110.08
2011
2012
2013
2014
2015
EN
53
EN
Cyprus - ODA as a % of GNIHistorical data and scenarios for reaching 2015 targetsHistorical/MS ForecastLinear increase in ODA volumeConstant growth rate in ODA volume2010 Target2012_Intermediate_Targets
0.40
0.35
ODA as a % of GNI
•2009-2015increase required:•0.16 % of GNI over whole period•Averageof 0.027 % of GNI per year•Highestprevious annual increase:•2005,2006:+0.06%ODA Volume (EUR)
•ODAgap to 2015 target from 2009 level:•EUR45 million•0.1% of EU27 ODA funding gap•Annualincrease in ODA volume to meet target:•EUR7 million increase each year•17% average annual growth rate in ODA volume0.210.170.200.190.170.170.120.270.240.240.220.200.180.220.330.320.290.270.260.220.210.190.200.300.29
0.30
0.25
ODA as a % of GNI
•Highestprevious multi year increase:•2004-2006:+0.12% (annual: +0.06%)
0.200.170.150.15
0.10
0.09
0.05
0.03
0.00199519961997199819992000200120022003200420052006200720082009201020112012201320142015
EN
54
EN
Czech Republic - ODA as a % of GNIHistorical data and scenarios for reaching 2015 targetsHistorical/MS ForecastLinear increase in ODA volumeConstant growth rate in ODA volume2010 Target2012_Intermediate_Targets
0.40
0.35
0.30
ODA as a % of GNI
•2009-2015increase required:•0.21 % of GNI over whole period•Averageof 0.035 % of GNI per year•Highestprevious annual increase:•2003:+0.04%ODA Volume (EUR)
•ODAgap to 2015 target from 2009 level:•EUR406 million•0.8% of EU27 ODA funding gap•Annualincrease in ODA volume to meet target:•EUR68 million increase each year•23% average annual growth rate in ODA volume0.220.220.180.180.160.150.130.130.130.250.330.310.280.260.240.29
0.25
ODA as a % of GNI
•Highestprevious multi year increase:•2000-2003:+0.08% (annual: +0.027%)0.20
0.150.110.100.070.050.050.030.030.030.110.110.120.110.12
0.12
0.00199519961997199819992000200120022003200420052006200720082009201020112012201320142015
EN
55
EN
Denmark - ODA as a % of GNIHistorical data and scenarios for reaching 2015 targetsHistorical/MS Forecast2010 TargetODA to Africa incl. imputed multilateralODA to LDCs incl. imputed multilateral
1.201.060.970.991.01
1.041.000.96
1.030.960.850.810.800.810.880.820.880.800.800.800.800.80
0.80
0.60
ODA as a % of GNI
•Denmarkalready exceeds the 0.7% target and iscommited to staying above a minimum level of0.8%.•2009-2015increase required:•N/A•Highestprevious annual increase:•1996:+0.08%•Highestprevious multi year increase:•1997-2000:+0.09% (annual: +0.03%)0.84
ODA as a % of GNI
0.51
0.40
0.20
ODA Volume (EUR)
•Amountof ODA required to stay at 0.8% from2009 level:•EUR240 million•0.5% of EU27 ODA funding gap•Annualincrease in ODA to stay at 0.8% from2009 level:•EUR40 million increase each year•2% average annual growth rate in ODAvolume20032004200520062007200820092010201120122013201420150.0019951996199719981999200020012002
EN
56
EN
Estonia - ODA as a % of GNIHistorical data and scenarios for reaching 2015 targetsHistorical/MS ForecastLinear increase in ODA volumeConstant growth rate in ODA volume2010 Target2012_Intermediate_Targets
0.40
0.35
ODA as a % of GNI
•2009-2015increase required:•0.22 % of GNI over whole period•Averageof 0.037 % of GNI per year•Highestprevious annual increase:•2005:+0.03%ODA Volume (EUR)
•ODAgap to 2015 target from 2009 level:•EUR35 million•0.1% of EU27 ODA funding gap•Annualincrease in ODA volume to meet target:•EUR6 million increase each year•23% average annual growth rate in ODA volume0.220.230.180.170.190.160.330.290.260.28
0.30
0.25
ODA as a % of GNI
•Highestprevious multi year increase:•2004-2006:+0.04% (annual: +0.02%)
0.20
0.150.100.080.11
0.150.14
0.100.050.05
0.08
0.09
0.10
0.00199519961997199819992000200120022003200420052006200720082009201020112012201320142015
EN
57
EN
Finland - ODA as a % of GNIHistorical data and scenarios for reaching 2015 targetsHistorical/MS Forecast2012_Intermediate_TargetsLinear increase in ODA volumeODA to Africa incl. imputed multilateralConstant growth rate in ODA volumeODA to LDCs incl. imputed multilateral2010 Target
0.80
0.70
ODA as a % of GNI
•2009-2015increase required:•0.16 % of GNI over whole period•Averageof 0.027 % of GNI per year0.630.680.660.610.590.570.620.580.580.66
0.70
0.60
•Highestprevious annual increase:•2005:+0.09%•2009:+0.08%•Highestprevious multi year increase:•2000-2005:+0.15% (annual: +0.03%)•2007-2009:+0.13% (annual: +0.065%)0.310.330.320.310.330.350.310.320.350.460.400.370.390.44
0.54
0.570.560.540.51
0.58
0.50
ODA as a % of GNI
0.40
0.30
ODA Volume (EUR)
•ODAgap to 2015 target from 2009 level:•EUR611 million•1.2% of EU27 ODA funding gap•Annualincrease in ODA volume to meettarget:•EUR102 million increase each year•9% average annual growth rate inODA volume0.20
0.10
0.00199519961997199819992000200120022003200420052006200720082009201020112012201320142015
EN
58
EN
France - ODA as a % of GNIHistorical data and scenarios for reaching 2015 targetsHistorical/MS Forecast2012_Intermediate_TargetsLinear increase in ODA volumeODA to Africa incl. imputed multilateralConstant growth rate in ODA volumeODA to LDCs incl. imputed multilateral2010 Target
0.80
0.70
0.60
0.550.480.44
ODA as a % of GNI
•2009-2015increase required:•0.24 % of GNI over whole period•Averageof 0.040 % of GNI per year•Highestprevious annual increase:•2002,2005:+0.06%•Highestprevious multi year increase:•2000-2005:+0.17% (annual: +0.03%)0.470.400.370.300.310.410.380.470.460.390.700.660.610.570.530.510.500.490.470.430.570.530.610.65
0.50
ODA as a % of GNI
0.40
0.38
0.38
0.42
0.30
0.20
ODA Volume (EUR)
•ODAgap to 2015 target from 2009 level:•EUR7.8 billion•15.5% of EU27 ODA funding gap•Annualincrease in ODA volume to meettarget:•EUR1.30 billion increase each year•11% average annual growth rate inODA volume0.10
0.00199519961997199819992000200120022003200420052006200720082009201020112012201320142015
EN
59
EN
Germany - ODA as a % of GNIHistorical data and scenarios for reaching 2015 targetsConstant growth rate in ODA volume2012_Intermediate_TargetsHistorical/MS ForecastODA to Africa incl. imputed multilateralLinear increase in ODA volumeODA to LDCs incl. imputed multilateral2010 Target
0.80
0.70
ODA as a % of GNI
•2009-2015increase required:•0.35 % of GNI over whole period•Averageof 0.058 % of GNI per year•Highestprevious annual increase:•2005:+0.08%•Highestprevious multi year increase:•2004-2008:+0.10% (annual: +0.03%)ODA Volume (EUR)
•ODAgap to 2015 target from 2009 level:•EUR11.8 billion•23.3% of EU27 ODA funding gap0.610.700.66
0.60
0.50
ODA as a % of GNI
•Annualincrease in ODA volume to meettarget:•EUR1.97 billion increase each year•15% average annual growth ratein ODA volume0.370.380.35
0.570.510.500.510.420.400.450.56
0.63
0.400.310.300.320.280.260.260.270.270.270.280.28
0.36
0.36
0.20
0.10
0.00199519961997199819992000200120022003200420052006200720082009201020112012201320142015
EN
60
EN
Greece - ODA as a % of GNIHistorical data and scenarios for reaching 2015 targetsHistorical/MS Forecast2012_Intermediate_TargetsLinear increase in ODA volumeODA to Africa incl. imputed multilateralConstant growth rate in ODA volumeODA to LDCs incl. imputed multilateral2010 Target
0.80
0.70
ODA as a % of GNI
•2009-2015increase required:•0.51 % of GNI over whole period•Averageof 0.085 % of GNI per year•Highestprevious annual increase:•2000,2009: +0.05%•Highestprevious multi year increase:•2007-2009:+0.10% (annual: +0.05%)ODA Volume (EUR)
•ODAgap to 2015 target from 2009 level:•EUR1.5 billion•3.0% of EU27 ODA funding gap•Annualincrease in ODA volume to meettarget:•EUR253 million increase each year•28% average annual growth rate inODA volume0.570.510.480.700.660.610.64
0.60
0.560.57
0.50
ODA as a % of GNI
0.440.390.350.310.300.30
0.460.40
0.37
0.300.200.200.150.140.150.150.170.210.210.160.170.170.160.210.19
0.24
0.10
0.00199519961997199819992000200120022003200420052006200720082009201020112012201320142015
EN
61
EN
Hungary - ODA as a % of GNIHistorical data and scenarios for reaching 2015 targetsHistorical/MS ForecastLinear increase in ODA volumeConstant growth rate in ODA volume2010 Target2012_Intermediate_Targets
0.40
0.35
0.30
ODA as a % of GNI
•2009-2015increase required:•0.24 % of GNI over whole period•Averageof 0.040 % of GNI per year•Highestprevious annual increase:•2004,2005: +0.04%•Highestprevious multi year increase:•2003-2006:+0.10% (annual: +0.03%)ODA Volume (EUR billions)
•ODAgap to 2015 target from 2009 level:•EUR326 million•0.6% of EU27 ODA funding gap•Annualincrease in ODA volume to meet target:•EUR54 million increase each year•30% average annual growth rate in ODA volume0.200.170.180.180.270.260.240.220.220.330.300.29
0.25
0.27
ODA as a % of GNI
0.20
0.15
0.15
0.10
•NB:Hungary has indicated that ODA volumes- excluding contributions to the EuropeanDevelopment Fund - will remain stable innominal terms from 2011 to 2015.0.07
0.130.110.080.080.09
0.130.12
0.15
0.09
0.050.030.00199519961997199819992000200120022003
2004
2005
2006
2007
2008
2009
2010
2011
2012
2013
2014
2015
EN
62
EN
Ireland - ODA as a % of GNIHistorical data and scenarios for reaching 2015 targetsHistorical/MS Forecast2012_Intermediate_TargetsLinear increase in ODA volumeODA to Africa incl. imputed multilateralConstant growth rate in ODA volumeODA to LDCs incl. imputed multilateral2010 Target
0.80
0.70
ODA as a % of GNI
•2009-2015increase required:•0.16 % of GNI over whole period•Averageof 0.027 % of GNI per year•Highestprevious annual increase:•2006:+0.12%•2002:+0.07%•Highestprevious multi year increase:•2000-2008:+0.30% (annual: +0.04%)0.330.290.420.390.390.590.540.550.540.600.590.550.510.660.640.640.620.560.57
0.680.660.61
0.680.670.66
0.70
0.60
0.50
ODA as a % of GNI
0.40
0.400.290.310.310.300.31
0.30
ODA Volume (EUR)
•ODAgap to 2015 target from 2009 level:•EUR428 million•0.8% of EU27 ODA funding gap•Annualincrease in ODA volume to meettarget:•EUR71 million increase each year•8% average annual growth rate inODA volume0.20
0.10
0.00199519961997199819992000200120022003200420052006200720082009201020112012201320142015
EN
63
EN
Italy - ODA as a % of GNIHistorical data and scenarios for reaching 2015 targetsHistorical/MS Forecast2012_Intermediate_TargetsLinear increase in ODA volumeODA to Africa incl. imputed multilateralConstant growth rate in ODA volumeODA to LDCs incl. imputed multilateral2010 Target
0.80
0.70
ODA as a % of GNI
•2009-2015increase required:•0.54 % of GNI over whole period•Averageof 0.090 % of GNI per year•Highestprevious annual increase:•2005:+0.14%•1998:+0.09%•Highestprevious multi year increase:•2000-2002:+0.07% (annual: +0.035%)ODA Volume (EUR)
•ODAgap to 2015 target from 2009 level:•EUR10.7 billion•21.2% of EU27 ODA funding gap•Annualincrease in ODA volume to meettarget:•EUR1.79 billion increase each year•33% average annual growth rate inODA volume0.570.510.700.660.63
0.60
0.610.55
0.50
0.550.470.430.430.37
ODA as a % of GNI
0.40
0.300.200.200.150.110.100.200.150.130.150.200.170.15
0.290.220.190.160.300.270.200.200.260.17
0.34
0.20
0.15
0.00199519961997199819992000200120022003200420052006200720082009201020112012201320142015
EN
64
EN
Latvia - ODA as a % of GNIHistorical data and scenarios for reaching 2015 targetsHistorical/MS ForecastLinear increase in ODA volumeConstant growth rate in ODA volume2010 Target2012_Intermediate_Targets
0.40
0.35
ODA as a % of GNI
•2009-2015increase required:•0.25 % of GNI over whole period•Averageof 0.042 % of GNI per year•Highestprevious annual increase:•2004:+0.05%•Highestprevious multi year increase:•2003-2005:+0.06% (annual: +0.03%)ODA Volume (EUR)
•ODAgap to 2015 target from 2009 level:•EUR42 million•0.1% of EU27 ODA funding gap•Annualincrease in ODA volume to meet target:•EUR7 million increase each year•25% average annual growth rate in ODA volume0.220.210.170.170.170.140.290.260.270.33
0.30
0.25
ODA as a % of GNI
0.20
0.22
0.17
0.150.130.120.100.060.050.010.001995199619971998199920002001200220032004200520062007200820092010201120122013201420150.070.060.060.070.080.11
EN
65
EN
Lithuania - ODA as a % of GNIHistorical data and scenarios for reaching 2015 targetsHistorical/MS ForecastLinear increase in ODA volumeConstant growth rate in ODA volume2010 Target2012_Intermediate_Targets
0.40
0.35
ODA as a % of GNI
•2009-2015increase required:•0.19 % of GNI over whole period•Averageof 0.032 % of GNI per year•Highestprevious annual increase:•2009:+0.04%•Highestprevious multi year increase:•2003-2009:+0.14% (annual: +0.02%)ODA Volume (EUR)
•ODAgap to 2015 target from 2009 level:•EUR57 million•0.1% of EU27 ODA funding gap•Annualincrease in ODA volume to meet target:•EUR10 million increase each year•18% average annual growth rate in ODA volume0.220.190.170.160.200.190.280.250.230.220.260.310.290.33
0.30
0.25
ODA as a % of GNI
0.20
0.150.110.100.060.050.010.00199519961997199819992000200120022003200420052006200720080.040.080.11
0.14
2009
2010
2011
2012
2013
2014
2015
EN
66
EN
Luxembourg - ODA as a % of GNIHistorical data and scenarios for reaching 2015 targetsHistorical/MS Forecast2010 TargetODA to Africa incl. imputed multilateralODA to LDCs incl. imputed multilateral
1.20
1.00
ODA as a % of GNI
•Luxembourgalready exceeds the 0.7% target and iscommited to staying above a level of 1.0%.•2009-2015increase required: N/A•Highestprevious annual increase:•1997:+0.11% and 1998, 2006: +0.10%•Highestprevious multi year increase:•1995-2003:+0.50% (annual: +0.06%)0.700.781.010.970.860.790.790.890.920.95
1.00
1.00
1.00
1.00
1.00
0.80
ODA as a % of GNI
0.650.600.55
0.66
0.77
0.510.440.400.36
0.20
ODA Volume (EUR)
•Amountof ODA required to stay at 1.0%from 2009 level:•EUR159 million•0.3% of EU27 ODA funding gap•Annualincrease in ODA volume to stay at1.0% from 2009 level:•EUR26 million increase each year•8% average annual growth rate inODA volume19971998199920002001200220032004200520062007200820092010201120122013201420150.0019951996
EN
67
EN
Malta - ODA as a % of GNIHistorical data and scenarios for reaching 2015 targetsHistorical/MS ForecastLinear increase in ODA volumeConstant growth rate in ODA volume2010 Target2012_Intermediate_Targets
0.40
0.35
ODA as a % of GNI
•2009-2015increase required:•0.13 % of GNI over whole period•Averageof 0.022 % of GNI per year•Highestprevious annual increase:•2008:+0.05%•Highestprevious multi year increase:•N/AODA Volume (EUR)
•ODAgap to 2015 target from 2009 level:•EUR11 million•0.02% of EU27 ODA funding gap•Annualincrease in ODA volume to meet target:•EUR2 million increase each year•12% average annual growth rate in ODA volume0.230.220.210.200.180.180.150.150.200.190.170.300.280.260.330.320.310.29
0.30
0.25
ODA as a % of GNI
0.250.230.210.20
0.270.260.22
0.20
0.210.20
0.20
0.21
0.15
0.10
0.05
0.00199519961997199819992000200120022003200420052006200720082009201020112012201320142015
EN
68
EN
The Netherlands - ODA as a % of GNIHistorical data and scenarios for reaching 2015 targetsHistorical/MS Forecast2010 TargetNational PathODA to Africa incl. imputed multilateralODA to LDCs incl. imputed multilateral
1.000.870.840.810.800.730.700.810.810.800.790.820.810.800.820.810.810.800.820.830.810.800.780.80
0.90
ODA as a % of GNI
•TheNetherlands already exceeds the 0.7% targetand is commited to staying above a level of 0.8%.•2009-2015increase required:•N/A•Highestprevious annual increase:•2005:+0.09%•Highestprevious multi year increase:•N/A0.51ODA as a % of GNI
0.60
0.50
0.40
0.30
ODA Volume (EUR)
•Amountof ODA required to stay at 0.8% from2009 level:•EUR711 million•1.4% of EU27 ODA funding gap•Annualincrease in ODA volume to stay at 0.8%from 2009 level:•EUR119 million increase each year•2% average annual growth rate in ODAvolume0.20
0.10
0.00199519961997199819992000200120022003200420052006200720082009201020112012201320142015
EN
69
EN
Poland - ODA as a % of GNIHistorical data and scenarios for reaching 2015 targetsHistorical/MS ForecastNational PathConstant growth rate in ODA volume2010 Target2012_Intermediate_Targets
0.40
0.35
ODA as a % of GNI
•2009-2015increase required:•0.25 % of GNI over whole period•Averageof 0.042 % of GNI per year•Highestprevious annual increase:•2004:+0.04%•Highestprevious multi year increase:•2003-2007:+0.09% (annual: +0.02%)ODA Volume (EUR)
•ODAgap to 2015 target from 2009 level:•EUR1.24 billion•2.4% of EU27 ODA funding gap•Annualincrease in ODA volume to meet target:•EUR207 million increase each year•35% average annual growth rate in ODA volume0.230.220.330.300.290.270.260.26
0.30
0.25
ODA as a % of GNI
0.20
0.190.210.17
0.150.100.080.08
0.140.13
0.17
0.100.070.050.050.010.00199519961997199819992000200120022003200420050.010.020.020.01
0.09
0.11
2006
2007
2008
2009
2010
2011
2012
2013
2014
2015
EN
70
EN
Portugal - ODA as a % of GNIHistorical data and scenarios for reaching 2015 targetsHistorical/MS Forecast2012_Intermediate_TargetsLinear increase in ODA volumeODA to Africa incl. imputed multilateralConstant growth rate in ODA volumeODA to LDCs incl. imputed multilateral2010 Target
0.80
0.70
ODA as a % of GNI
•2009-2015increase required:•0.47 % of GNI over whole period•Averageof 0.078 % of GNI per year•Highestprevious annual increase:•2004:+0.41%•2008:+0.05%•Highestprevious multi year increase:•2006-2009:+0.08% (annual: +0.03%)0.700.660.630.570.570.510.460.420.340.330.380.350.500.420.410.490.500.460.610.640.580.59
0.60
0.50
ODA as a % of GNI
0.40
0.300.260.260.270.220.210.210.220.27
0.290.250.210.250.240.25
0.20
0.10
0.0019951996199719981999200020012002200320042005200620072008
ODA Volume (EUR)
0.23•ODAgap to 2015 target from 2009 level:•EUR964 million•1.9% of EU27 ODA funding gap•Annualincrease in ODA volume to meettarget: EUR161 million increase each year•24% average annual growth rate inODA volume2009201020112012201320142015EN
71
EN
Romania - ODA as a % of GNIHistorical data and scenarios for reaching 2015 targetsHistorical/MS ForecastLinear increase in ODA volumeConstant growth rate in ODA volume2010 Target2012_Intermediate_Targets
0.40
0.35
ODA as a % of GNI
•2009-2015increase required:•0.25 % of GNI over whole period•Averageof 0.042 % of GNI per year•Highestprevious annual increase:•2009:+0.01%•Highestprevious multi year increase:•N/AODA Volume (EUR)
•ODAgap to 2015 target from 2009 level:•EUR487 million•1.0% of EU27 ODA funding gap•Annualincrease in ODA volume to meet target:•EUR81 million increase each year•35% average annual growth rate in ODA volume0.240.220.270.260.330.300.29
0.30
0.25
0.26
ODA as a % of GNI
0.200.17
0.200.17
0.21
0.15
0.150.130.14
0.17
0.100.070.050.07
0.08
0.11
0.00199519961997199819992000200120022003200420052006200720082009201020112012201320142015
EN
72
EN
Slovakia - ODA as a % of GNIHistorical data and scenarios for reaching 2015 targetsHistorical/MS ForecastLinear increase in ODA volumeConstant growth rate in ODA volume2010 Target2012_Intermediate_Targets
0.40
0.35
ODA as a % of GNI
•2009-2015increase required:•0.25 % of GNI over whole period•Averageof 0.042 % of GNI per year•Highestprevious annual increase:•2005:+0.05%•Highestprevious multi year increase:•2002-2005:+0.10% (annual: +0.03%)ODA Volume (EUR)
•ODAgap to 2015 target from 2009 level:•EUR247 million•0.5% of EU27 ODA funding gap•Annualincrease in ODA volume to meet target:•EUR41 million increase each year•33% average annual growth rate in ODA volume0.230.220.170.190.170.170.130.210.300.290.270.260.33
0.30
0.25
0.26
ODA as a % of GNI
0.20
0.15
0.140.130.120.100.090.100.080.080.090.11
0.10
0.09
0.08
0.050.040.0019951996199719981999200020010.030.040.02200220030.05
0.07
2004
2005
2006
2007
2008
2009
2010
2011
2012
2013
2014
2015
EN
73
EN
Slovenia - ODA as a % of GNIHistorical data and scenarios for reaching 2015 targetsHistorical/MS ForecastLinear increase in ODA volumeConstant growth rate in ODA volume2010 Target2012_Intermediate_Targets
0.40
0.35
ODA as a % of GNI
•2009-2015increase required:•0.18 % of GNI over whole period•Averageof 0.030 % of GNI per year•Highestprevious annual increase:•2009:+0.02%•Highestprevious multi year increase:•2004-2009:+0.05% (annual: +0.01%)ODA Volume (EUR)
•ODAgap to 2015 target from 2009 level:•EUR95 million•0.2% of EU27 ODA funding gap•Annualincrease in ODA volume to meet target:•EUR16 million increase each year•19% average annual growth rate in ODA volume0.230.220.280.260.260.330.310.29
0.30
0.25
ODA as a % of GNI
0.240.210.19
0.20
0.19
0.20
0.170.150.150.100.100.050.110.120.120.130.150.16
0.17
0.00199519961997199819992000200120022003200420052006200720082009201020112012201320142015
EN
74
EN
Spain - ODA as a % of GNIHistorical data and scenarios for reaching 2015 targetsHistorical/MS Forecast2012_Intermediate_Targets2010 TargetODA to Africa incl. imputed multilateralLinear increase in ODA volumeODA to LDCs incl. imputed multilateralConstant growth rate in ODA volume
0.80
0.70
ODA as a % of GNI
•2009-2015increase required:•0.24 % of GNI over whole period•Averageof 0.040 % of GNI per year•Highestprevious annual increase:•2001,2008:+0.08%•Highestprevious multi year increase:•2003-2009:+0.23% (annual: +0.04%)0.370.300.320.260.230.220.230.270.240.460.530.510.510.600.580.550.530.70
0.700.650.630.61
0.700.680.660.66
0.70
0.60
0.620.590.57
0.50
ODA as a % of GNI
0.45
0.40
0.300.240.200.220.240.24
ODA Volume (EUR)
•ODAgap to 2015 target from 2009 level:•EUR3.8 billion•7.5% of EU27 ODA funding gap•Annualincrease in ODA volume to meettarget:•EUR635 million increase each year•10% average annual growth rate inODA volume0.10
0.00199519961997199819992000200120022003200420052006200720082009201020112012201320142015
EN
75
EN
Sweden - ODA as a % of GNIHistorical data and scenarios for reaching 2015 targetsHistorical/MS Forecast2010 TargetNational PathODA to Africa incl. imputed multilateralODA to LDCs incl. imputed multilateral
1.201.121.021.000.980.940.840.800.770.790.720.700.800.770.840.790.780.930.960.960.93
1.00
1.00
1.00
ODA as a % of GNI
0.60
0.40
ODA as a % of GNI
•Swedenalready exceeds the 0.7% target and iscommited to staying above a level of 1.0%.•2009-2015increase required: N/A•Highestprevious annual increase: 2005: +0.16%•Highestprevious multi year increase:•2004-2006:+0.24% (annual: +0.12%)0.51
ODA Volume (EUR)
•Amountof ODA required to stay at 1.0% from2009 level:•EUR1.0 billion•2.0% of EU27 ODA funding gap•Annualincrease in ODA volume to stay at 1.0%from 2009 level:•EUR166 million increase each year•5% average annual growth rate in ODAvolume0.20
0.0019951996199719981999200020012002200320042005200620072008
2009
2010
2011
2012
2013
2014
2015
EN
76
EN
United Kingdom - ODA as a % of GNIHistorical data and scenarios for reaching 2015 targetsHistorical/MS Forecast2012_Intermediate_Targets2010 TargetODA to Africa incl. imputed multilateralLinear increase in ODA volumeODA to LDCs incl. imputed multilateralConstant growth rate in ODA volume
0.80
0.70
ODA as a % of GNI
•2009-2015increase required:•0.18 % of GNI over whole period•Averageof 0.030 % of GNI per year•Highestprevious annual increase:•2005:+0.11%•NB:UK 2010 figure refers to UK financial
year, not calendar years.
0.670.650.620.560.560.540.510.590.580.550.620.610.57
0.700.650.640.61
0.700.680.670.66
0.70
0.60
0.510.50
0.52
ODA as a % of GNI
•Highestprevious multi year increase:•1999-2006:+0.27% (annual: +0.04%)•2007-2009:+0.17% (annual: +0.08%)0.340.310.36
0.470.43
0.400.320.300.290.270.260.270.240.32
0.35
ODA Volume (EUR)
•ODAgap to 2015 target from 2009 level:•EUR5.1 billion•10.1% of EU27 ODA funding gap•Annualincrease in ODA volume to meettarget:•EUR849 million increase each year•8% average annual growth rate inODA volume0.20
0.10
0.00199519961997199819992000200120022003200420052006200720082009201020112012201320142015
EN
77
EN


