Trafikudvalget 2010-11 (1. samling)
TRU Alm.del Bilag 99
Offentligt
The Danish Road DirectorateEvaluation of test with European Modular System
Midway Report
Grontmij | Carl Bro A/S in cooperation with
May 2010
Midway Report
The Danish Road DirectorateEvaluation of test withEuropean Modular SystemMay 2010
Midway Report
1
Appendix 1: Traffic statistics
2
Appendix 2: Cargo traffic
3
Appendix 3: Interview and surveys
4
Appendix 4: Master files for individual partial sections
5
Appendix 5: Master files for individual locations
6
Appendix 6: Air pollution and climate impacts
7
Appendix 7: Noice effects
8
Midway Report
The Danish Road DirectorateTest with European Modular System – Midway Report
Page 3
CONTENTS122.12.22.333.13.244.14.24.34.44.54.64.74.84.94.1055.15.25.366.16.277.17.28SUMMARYINTRODUCTIONPURPOSE OF MIDWAY REPORTDATA COLLECTION METHODSDEFINITIONSROAD NETWORKROAD NETWORK EXTENSION IN PHASESCONSTRUCTION INVESTMENTSTRAFFIC
PAGE688101113131416161717202223262930303434353851515253535556
EMSVEHICLE UNITS INCENTRALREGISTER FORMOTORVEHICLESTRAFFIC DEVELOPMENTTRAFFIC COUNTINGTHEGREATBELTBRIDGETHEORESUNDBRIDGEFERRY TRAFFICTRANSPORT PATTERS OFEMSVEHICLESSPEEDTOTAL WEIGHTS AND AXLE LOADSDEGREE OF OCCUPANCY ON SERVICE AND REST AREASFREIGHT TRAFFICFREIGHT TRAFFIC DIVIDED NATIONALLY AND INTERNATIONALLYFREIGHT TRAFFIC INTERNATIONALLYTHE NATIONAL FREIGHT TRAFFICTRAFFIC SAFETYACCIDENTSRISK ANALYSISENVIRONMENTAL CONDITIONSAIR POLLUTION AND CLIMATE IMPACTSNOISE EFFECTFINANCIAL CONDITIONS
Tetraplan A/S
Grontmij | Carl Bro A/S
The Danish Road DirectorateTest with European Modular System – Midway Report
Page 4
FIGURE SURVEYFigure 1Figure 2Figure 3Figure 4Figure 5Figure 6Figure 7Figure 8Figure 9Figure 10Figure 11Figure 12Figure 13Figure 14Figure 15Figure 16Figure 17Figure 18Figure 19Figure 20Figure 21Figure 22Figure 23Figure 24Figure 25Figure 26Figure 27Figure 28Figure 29Figure 30Figure 31Figure 32Figure 33Figure 34Figure 35Figure 36Tetraplan A/S
PAGE131415161719202122222324242525262727282829313233353636373738383939404041
The road network on which EMS vehicles are allowed to driveComplete survey of the reconstruction expenses of the Danish RoadDirectorateOperation costs of ports and transport centresDevelopment in EMS vehicle units in the Central Register for MotorVehiclesFreight traffic development since 2nd quarter 2001 of Danish trucksFreight traffic in 2009 (AADT) on the total test road networkDifference in AADT between 2008 and 2009EMS vehicles on the Great Belt Bridge 2009Total freight traffic on the Great Belt Bridge 2008 and 2009EMS vehicles on the Oresund Bridge in 2009The total freight traffic on the Oresund Bridge in 2008 and 2009The amount of ferried EMS vehicles between Elsinore andHelsingborgThe amount of ferried EMS vehicles between Frederikshavn andGothenburgAmount of EMS vehicles ferried by the ferry line between Grenaaand VarbergAmount of ferried EMS vehicles between Aarhus and KalundborgTransport patterns of EMS vehicles: ”Accumulation” of EMS vehiclesfrom January to September 2009The development in the total amount of EMS vehicles havingpassed Oresund (Oresund Bridge + Elsinore-Helsingborg)Development in the total amount of EMS vehicles having passed theGreat Belt (The Great Belt Bridge + Aarhus-Kalundborg)Transports with trucks on the Oresund Bridge the first 3 quarters of2009Trucks ferried on the Elsinore – Helsingborg line the first 3 quartersof 2009Freight traffic average speed in 2009Service areas where EMS vehicles can parkCapacity utilization of service and rest areas on the test roadnetworkDistribution of registered trucks on service areasTraffic work in 2007 and 2009 distributed on Danish and foreignvehiclesTraffic work performed in Denmark as part of international transportdistributed acc. to nationality typeGoods quantities transported in Denmark as part of internationaltransport distributed acc. to nationality typeShare of international transport distributed per truck typeQuantities transported goods in international transports distributed incommodity groups.Capacity utilization in international transports distributed on trucktypeTransport work in 2007 and in the first 3 quarters of 2009 distributedon truck typeAmount of truck trips and share of trips with load in selected yearsdistributed on truck typeThe amount of transported goods in 2007 and in the first 3 quartersof 2009 distributed on haulage contract and company transportThe transported goods quantity in 2007 and in the 3 first quarters of2009 distributed on truck typesCapacity utilization of trucks in national transports distributed ontruck type and ownership for selected yearsTransported goods on truck distributed on commodity groups inselected years
Grontmij | Carl Bro A/S
The Danish Road DirectorateTest with European Modular System – Midway Report
Page 5
Figure 37 Distribution in % on commodity groups transported with EMSvehiclesFigure 38 Distribution in % on commodity groups transported with all trucksFigure 39 Map with postal code relations with 10 or more trips made with EMSvehicles in the counting weekFigure 40 End destinations with a frequency of 10 or more for EMS vehiclesFigure 41 Relation between trip distance and goods weight for EMS vehiclesin the special runFigure 42 Trip distances for various types of EMS vehicle unitsFigure 43 Interchange locations for EMS vehicle)Figure 44 The relation between trip distance and loading for EMS vehiclesFigure 45 Average capacity utilization on EMS vehiclesFigure 46 Share of volume goods for the various goods typesFigure 47 Amount of accidents on reconstructed locations in two differentperiodsFigure 48 Calculated emissions for individual sections and as a total
414243444546474848495153
SURVEY OF APPENDICES1Traffic statistics:A. Ferry statisticsB. Bridge statisticsC. Capacity utilization on service areasCargo traffic:A. European Modular System vehicle units (EMS vehicleunits) in the Central Register for Motor Vehicles (CRM)B. Special run of the driver’s logInterview and surveys:A. Danish Cyclist Federation: QuestionnaireB. Port and transport centres: QuestionnaireC. Companies and drivers: Conducted interviewsMaster files for partial sections with traffic values and accidentdata per partial section1Master files for reconstruction locations with construction costsand accident data per locationAir pollution and climate impactsNoise effects
2
3
4
5
67
1
Kindly note that not all master files are translated into English.Grontmij | Carl Bro A/S
Tetraplan A/S
The Danish Road DirectorateTest with European Modular System – Midway Report
Page 6
1
SUMMARY
During the period from autumn 2008 to autumn 2011 a test with the Euro-pean Modular System (EMS) vehicles is performed on selected parts of theroad network in Denmark. Parallel with the test an evaluation is performedwith the purpose of registering the spread and use of EMS vehicles and toevaluate the direct and indirect effects.The evaluation was opened with a pre-test situation report giving status ofthe goods transport on the Danish road network at the end of 2008. Thepurpose of this report, which is a midway report, is to give status of the testprogress one year after start that is at the end of 2009. Finally a final reportwill be published in a year’s time which will give a total status of the test andat the same time give an evaluation of the effects of the test, direct and indi-rect, intentional and unintentional.The purpose of the midway report is to give an interim status of a number ofconditions in relation to construction investments, EMS transports, trafficsafety and environmental aspects. A number of these conditions has provento be difficult to throw, even an interim, satisfactory light on due to the factthat a number of data can either not be provided or will not be published be-fore at a later time.The interim results of the test with EMS vehicles are marked by the financialcrisis, which has hit Denmark as well as our nearest commercial partnershard. The financial recession has also hit the transport sector as there aresimply less goods and commodities to transport. This situation has an effecton the use and spread of EMS vehicles as well. Through a special run of thedriver’s log, sent out to 61 companies, using EMS vehicles, 17 have indi-cated that the financial recession has had a positive effect on the use ofEMS vehicles, as it has made heavier demands on enhancing the efficiencyof the transport. At the same time 24 have replied that the financial reces-sion has had a negative influence on the spread of EMS vehicles due to areduced amount of goods resulting in over-capacity.The interim results of the test illustrated and documented in the midway re-port can be summed up as follows:-With regard to constructions the estimation is that the Danish RoadDirectorate alone has invested almost DKK 114m in constructionsduring 2008 and 2009. To this can be added investments of approxDKK 16m made by ports and transport centres in the same period.The total investments in various reconstructions then sums up toDKK 130m.At the end of 2009 a total of 316 EMS vehicles were registered inDenmark grouped into the following EMS combinations: Type 1, ”Dollies”, with 105 units; Type 2, ”semi-trailers,” 4 units; Type 3, ”link-trailers”, with 207 units. With regard to type 4, ”long trailer”, it has notbeen possible to identify these in the Danish Central Register for Mo-tor Vehicles.Among the 316 registered units, 61 companies disposing of a total of99 EMS vehicles were contacted through a special run of the driver’slog.
-
-
Tetraplan A/S
Grontmij | Carl Bro A/S
The Danish Road DirectorateTest with European Modular System – Midway Report
Page 7
-
-
-
-
The mentioned special run of the driver’s log has revealed that to alarge extent EMS vehicles have to been applied for transport of foodsand general cargo. The total goods transport on trucks has primarilybeen distributed on gravel, stone, clay, etc.: agricultural and fisheryproducts, earth and waste; construction materials and foods.The general capacity utilization in relation to freight traffic seems tohave decreased from 2007 to 2009 with approx. 5 % especially ap-plying to international transports and haulage.On the basis of the material from the special run of the driver’s logthe estimate is that in 2009 EMS vehicles transported approx. 0.8 %of the national goods quantity. Furthermore EMS vehicles are esti-mated to account for 0.9 % of the traffic work in Denmark in 2009.With regard to traffic safety no accidents involving EMS vehicleshave been noted. On going through the accident figures for the 150locations having been reconstructed in connection with the EMS test,a modest rise in the amount of accidents particularly involving pas-senger cars has been noted in approx. 10 cases during 2009.Whether this has any connection with the reconstruction of the loca-tions in question is still too early to say. So far these locations havebeen selected as “focus locations”.
Tetraplan A/S
Grontmij | Carl Bro A/S
The Danish Road DirectorateTest with European Modular System – Midway Report
Page 8
22.1
INTRODUCTIONPurpose of midway report
The Danish Parliament (Folketinget) has passed a decision to carry out atest with the European Modular System (EMS) in Denmark. The test will beperformed over a 3-year period from 2008 to 2011. In connection with thetest an evaluation will be performed with the purpose of registering thespread and use of EMS and to assess the direct and indirect consequentialeffects. The evaluation will comprise examination and assessment of anumber of various consequences of physical, traffic safety and economicnature including a number of consequences for the goods transport. Theevaluation is performed during the period from November 2008 up to andincluding October 2010.The evaluationcomprises a pre-test report, amidway reportand a final reportIn April 2009 a pre-test report was prepared describing the situation for anumber of the parameters to be investigated before starting up the EMS test.The pre-test report is the basis to which the evaluation with midway reportand final report is compared. The present report is the midway report.Pursuant to the tender documents for the evaluation of the EMS test themidway report should contain the following:Preliminary statements of the following effects (the numbering follows thetender documents):1. The transport extent and capacity utilization with focus on the effectsof the test and its distribution on vehicle types including distributionon empty journeys and volume goods.3. Infrastructure costs: Investments in and types of reconstruction, re-sulting operation costs and changed maintenance costs as a conse-quence of road wear.5. Traffic safety in which connection risk statements and accidentstatements should be studied.6. Environment with focus on fuel consumption, emissions, noise andvibrations.In addition to the above the tender documents request preliminary descrip-tions of the following conditions (numbering according to the tender mate-rial):a. EMS transports with focus on sort of transport, nationality, appliedrouting, destinations, trip distances, interchange patterns, etc.b. Construction investments related to EMS vehicles: Costs, localisa-tion, location and type of reconstruction must be indicated.c. Accidents with EMS vehicles: Accidents involving EMS vehicles mustbe described.
Tetraplan A/S
Grontmij | Carl Bro A/S
The Danish Road DirectorateTest with European Modular System – Midway Report
Page 9
The midway report has been drawn up taking a follow-up of the pre-test re-port into account and at the same time assuring that the above requirementson the midway report are accomplished to the extent possible.As stated below, some data have been difficult to provide for the midway re-port. The data quality, data quantity and data access have great influence onthe possibility of reporting the evaluation. It can e.g. be mentioned that anumber of the data is calculated on an annual basis and the final calcula-tions for 2009 have yet not been finished resulting in the fact that a numberof data could not be incorporated in the report at the present time.Not all data couldbe providedParticularly within three areas the lack of data has influence on the reportingrequirements set forth for the midway report:It has turned out that there may be errors in the registered weightdata2from Weigh-in-motion devices (WIM devices). This circum-stance also applied at the time of the pre-test report, but the uncer-tainty was not known at the time of preparation of that report. The ex-tent of this issue is being clarified in collaboration with the DanishRoad Directorate.Equally, large challenges with regard to collection of traffic data fromthe WIM devices of the Danish Road Directorate have turned up. Sofar it has not yet been possible to collect data from a number of theWIM devices having registered EMS vehicles. Among other thingsthis has had the effect that a number of the WIM devices selected inthe pre-test situation have not registered as expected during the pe-riod up to the midway evaluation. Therefore it has been necessary tomake some changes with regard to the WIM devices originally in-cluded in the pre-test situation. In fact some of the WIM devices areno longer included in the midway report, as the required data is notavailable.In order to update the data from the pre-test situation, the intention inconnection with the midway reporting was to update the figures fromthe pre-test report. This would have made a comparison of the de-velopment between 2007 and 2009 possible, that is a situation withand without EMS vehicles where year 2008 would have been an “in-between” year, where the test with EMS vehicles was about to startup. For a number of areas it has turned out to be impossible to getupdated figures covering all of 2009. This particularly applies to theareas for freight traffic and accident statistics. The picture of both ar-eas is therefore not complete.Finally it has turned out to be too early to collect information on thecosts for the induced operation costs for the performed reconstruc-tions of the network, due to the fact that reports on the changed op-eration costs are still not available.
Operation costsnot yet quantified
All in all the mentioned lack of data means that e.g. road wear and mainte-nance costs cannot be calculated at the present time and thus the inducedoperation costs cannot be quantified.
2
Understood as statements of the vehicle’s total weight calculated through registra-tions on the road network.Grontmij | Carl Bro A/S
Tetraplan A/S
The Danish Road DirectorateTest with European Modular System – Midway Report
Page 10
2.2
Data collection methods
The evaluation of the European Modular System test has required collectionof data from a number of various sources to allow cross-checking of datavalidity.In principle data has been collected for the period from the test start-up toand including 31 December 2009. If material of special importance has beenavailable, which could not be collected before after 31 December 2009, thenthis has been included and remarks have been made in the text.Data sourcesSources to various data applied throughout the report can be outlined as fol-lows:Statistical material:This material comprises material accessible to the pub-lic and material which is in principle not public, but has been made availableto the evaluation team. The statistical material included in the report isgrouped under Appendix 1.The statistical material comprises:Ferry statistics applied for elucidation of traffic with various vehicletypes and on various lines.Bridge statistics: The Oresund Bridge has made data on the monthlyEMS vehicle traffic directly available. This data is sent automaticallyat the end of a month. With regard to The Great Belt Bridge it hasbeen more difficult, since Storebælt A/S does not separate theamount of EMS vehicles. However Storebælt A/S managed it by go-ing through its data and made the result available for the evaluation.The capacity statement for the use of service and rest areas: in con-nection with other investigations of this subject the Danish Road Di-rectorate is in these years collecting data on which vehicles use thenational service areas. At the suggestion of the evaluation team thiscollection now comprises classification of truck types as well.Material on freight traffic:This has been grouped under Appendix 2. Thematerial is grouped as follows:Data from a number of runs at fixed intervals during the evaluationperiod from the Danish Central Register for Motor Vehicles (CRM)made by Statistics Denmark upon the evaluation team’s request.This material is presented in Appendix 2 A.In addition to the above a special run of the driver’s log has been per-formed in which Statistics Denmark has upon the evaluation team’srequest sent out a detailed questionnaire about the use and spreadof EMS vehicles, which comprised a driver log especially designedfor this purpose. The results from the special run are presented inAppendix 2 B, where the applied questionnaires are included as well.Interviews and surveys:Appendix 3 contains the results of 3 different kindsof interviews and surveys. These are:Interview of DCFAt the annual meeting of Danish Cyclist Federation in October 2009all participants had an opportunity to answer a questionnaire aboutEMS vehicles and the use of EMS. The results from the survey havebeen compiles in part A of the Appendix.Grontmij | Carl Bro A/S
Ferry trafficBridge traffic
Service and restarea occupancy
Data from CRM
Special run ofDriver’s Log
Tetraplan A/S
The Danish Road DirectorateTest with European Modular System – Midway Report
Page 11
Survey at portsand transportcentres
A questionnaire was sent out to all ports and transport centres takingpart in the Test with the European Modular System. The primary pur-pose with the questions was partly to have quantified the extent ofthe infrastructure investments taken care of by locations in questionspartly to clarify whether any conditions at the locations in questionneeded special attention in connection with the EMS vehicle traffic.Part B of the Appendix contains the questionnaire and reporting onthe results.Appendix 3 C gives an account of a number of interviews with haul-age contractors and drivers applying EMS vehicles in their daily day.The interviews are presented directly in the interview guide appliedfor the interviews. The companies and drivers in question have beenselected in consultation with representatives from the trade. First partof Appendix 3 C is a survey of all planned interviews with companiesand drivers. In the Appendix the interviews are accounted of anony-mously.
Interview withhaulage contrac-tors and drivers
Master file forsurvey of data
Master fileswith traffic and accident data as well as construction costs perpartial section and per construction location have been included in Appendix4 and 5 respectively. To the extent possible all data is updated up to and in-cluding 31 December 2009.The results from the various sources are used across the report and there-fore relevant appendices will be referred to throughout the report.2.3Definitions
A number of terms are applied in the report and these are defined as follows:Trafficwork:Transportwork:Destina-tion:Performed vehicle-kilometresPerformed tonne-kilometresThe final destination where EMS vehicles are loaded, unloadedand/or interchanged for further transport. Destinations can betransport centres, ports, etc.The road network is the part of the Danish road network, whereEMS vehicles are allowed.The road network on which EMS vehicles are allowed to drive isdivided into the following road types:Motorway > 4 lanesMotorway = 4 lanesExpresswayRural roadUrban road (road in urban zone)As the urban roads being part of the EMS vehicle test are fewand relatively short, it is often difficult to identify urban roads onthe maps included in the report.
Roadnetwork:Roadtypes:
In some cases expressways and rural roads are mentionedcommonly as main roads (superior).Tetraplan A/SGrontmij | Carl Bro A/S
The Danish Road DirectorateTest with European Modular System – Midway Report
Page 12
Phases:
The EMS vehicle road network has been extended gradually whenready for being put into service. Phase 1, the main test, was started on24 November 2008. Then followed phase 2 consisting of two parts:Phase 2A, started on 1 September 2009 and phase 2B started on 1December 2009. Finally there is a phase 3 called Company arrange-ments, which is currently being extended. Phase 3 is, however, notincluded in the evaluation of the EMS vehicle test which is why thisphase is not treated further in the midway report.A geographically bounded area where it may be a question aboutone or more locations within the bounded area.For each turning manoeuvre which an EMS vehicle must be able toperform on a given road, a location has been defined. This may be aroundabout, a crossroads or the like. At a single location more turn-ing manoeuvres may occur. For each location where reconstructionshave been performed in connection with the EMS vehicle test, amaster file has been prepared cf. Appendix 5 as well.Each turning manoeuvre is categorised within a number of locationand manoeuvre types, such as a left turn in a traffic light controlledroad crossings or a right turn in a roundabout. A given turn or agiven manoeuvre will be registered as one turning manoeuvre.The road network where EMS vehicles are allowed to drive, hasbeen divided into 64 partial sections. The partial sections have beenselected with the purpose of giving an as precise as possible pictureof the traffic conditions, as on each partial section at least one WIMdevice has been set up. For each partial section a master file hasbeen created, as appears from Appendix 5.
Area:
Location:
Turningmanoeu-vre:
Partialsection
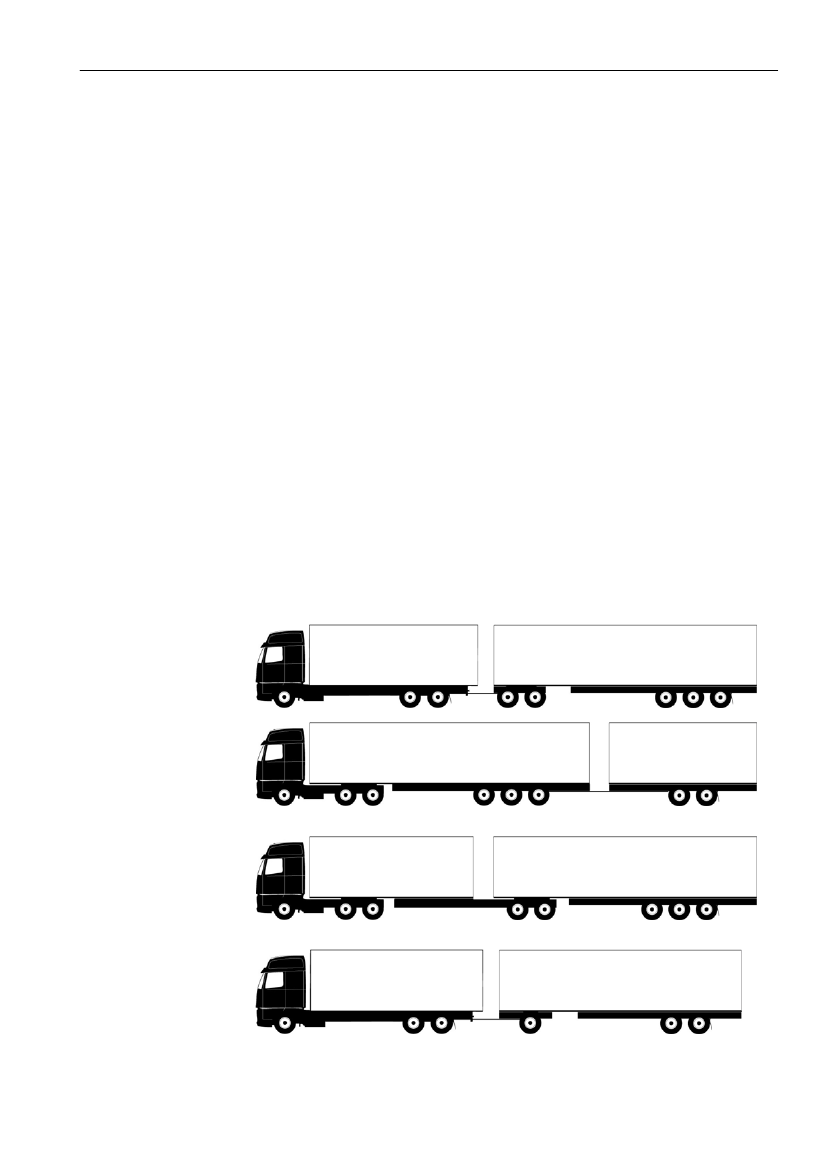
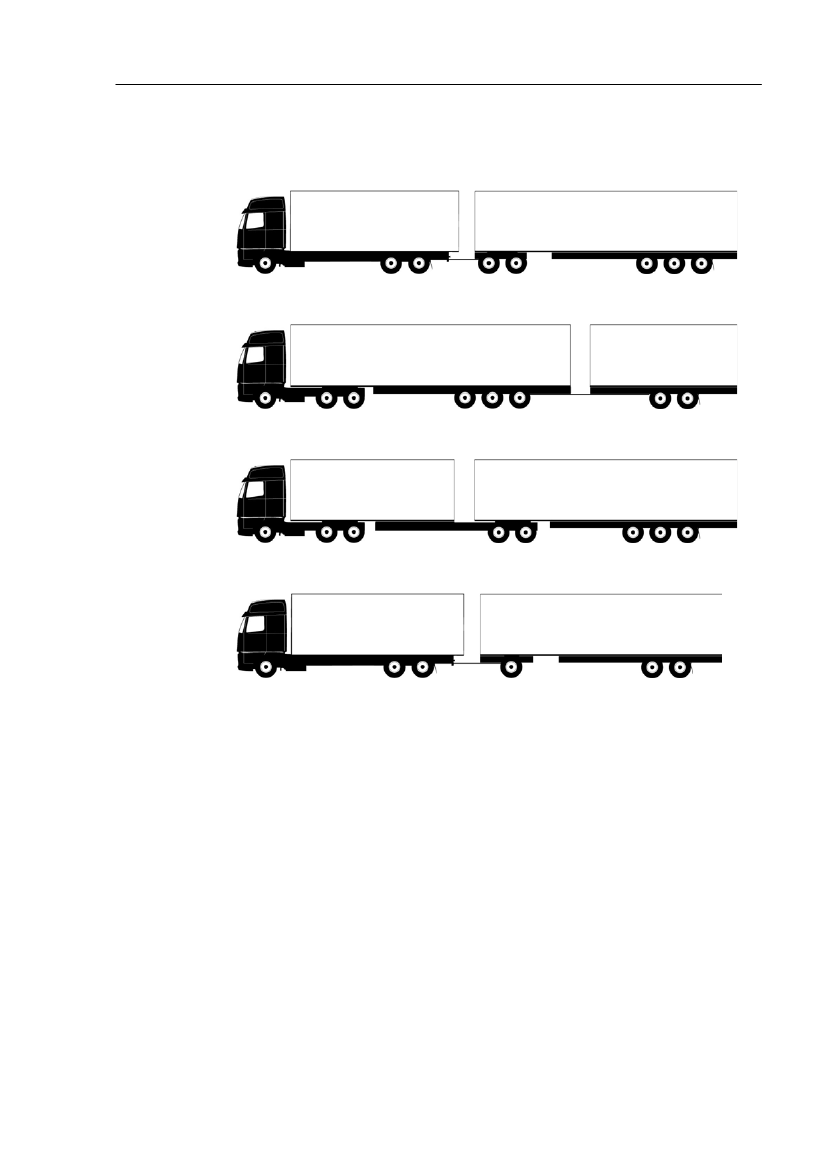
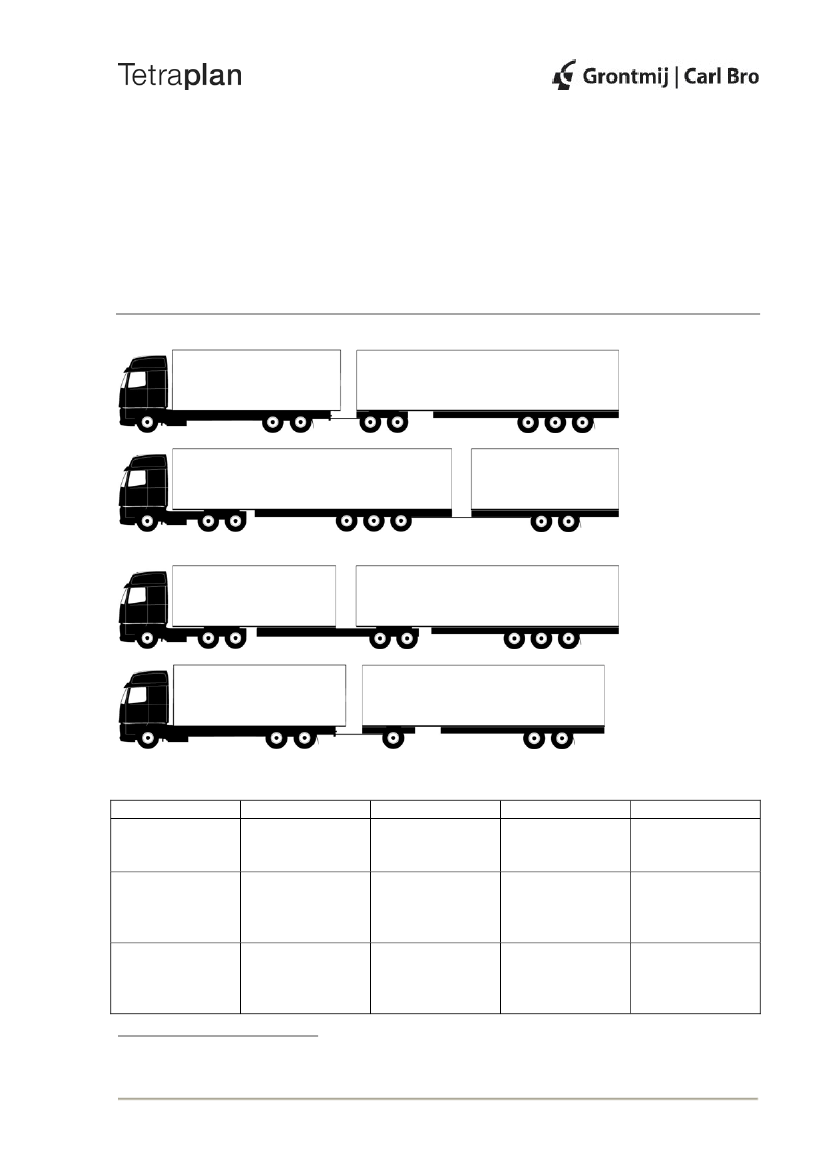
Throughout the report the following four types of EMS vehicles are applied:
Type 1: Truck and semitrailer with dolly
Type 2: Tractor with ordinary semitrailer and centre axle trailer
Type 3: Tractor with link-trailer and ordinary semitrailer
Type 4: Truck with long trailer
Tetraplan A/S
Grontmij | Carl Bro A/S
The Danish Road DirectorateTest with European Modular System – Midway Report
Page 13
33.1EMS road net-work
ROAD NETWORKRoad network extension in phases
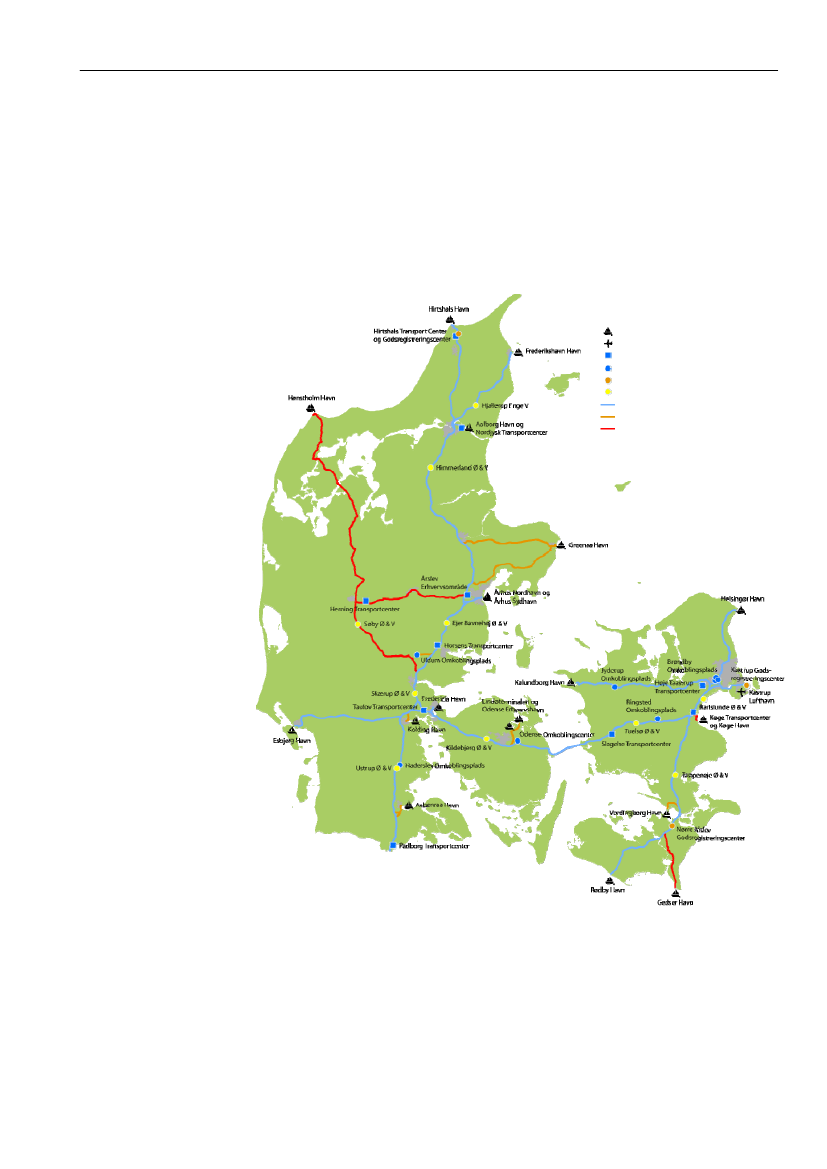
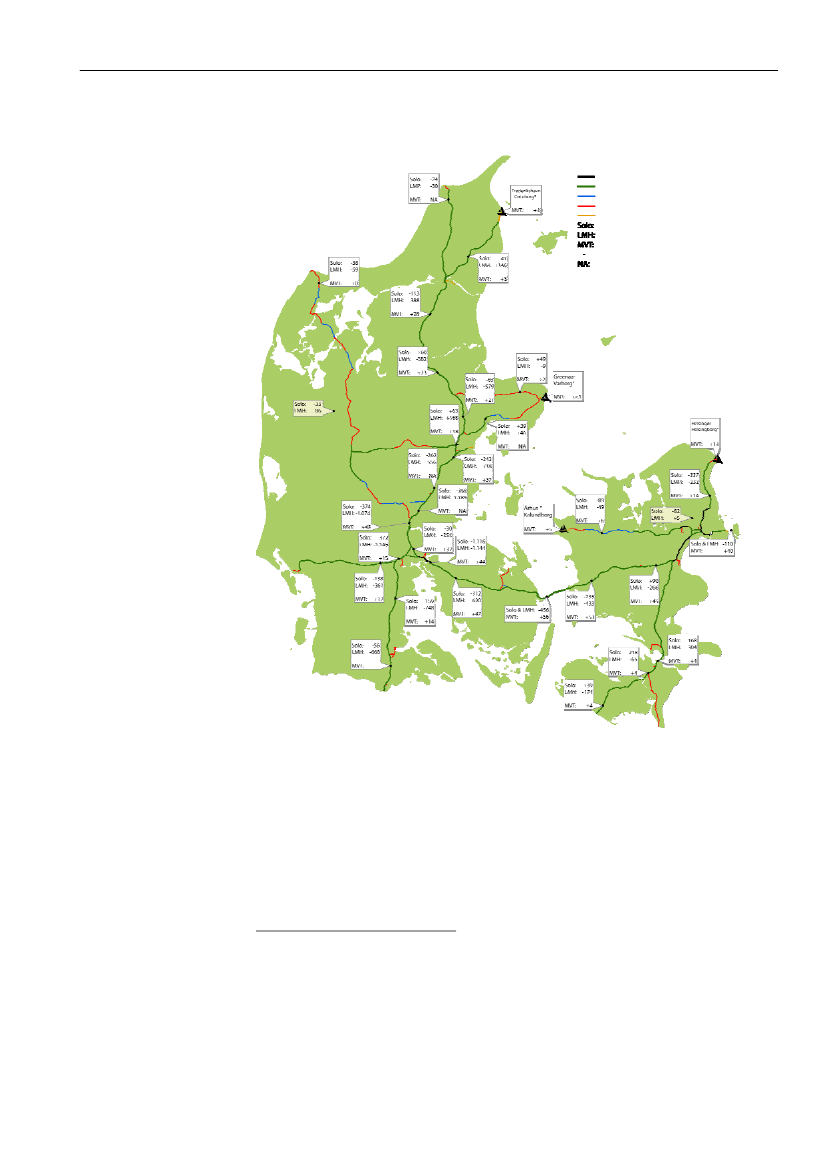
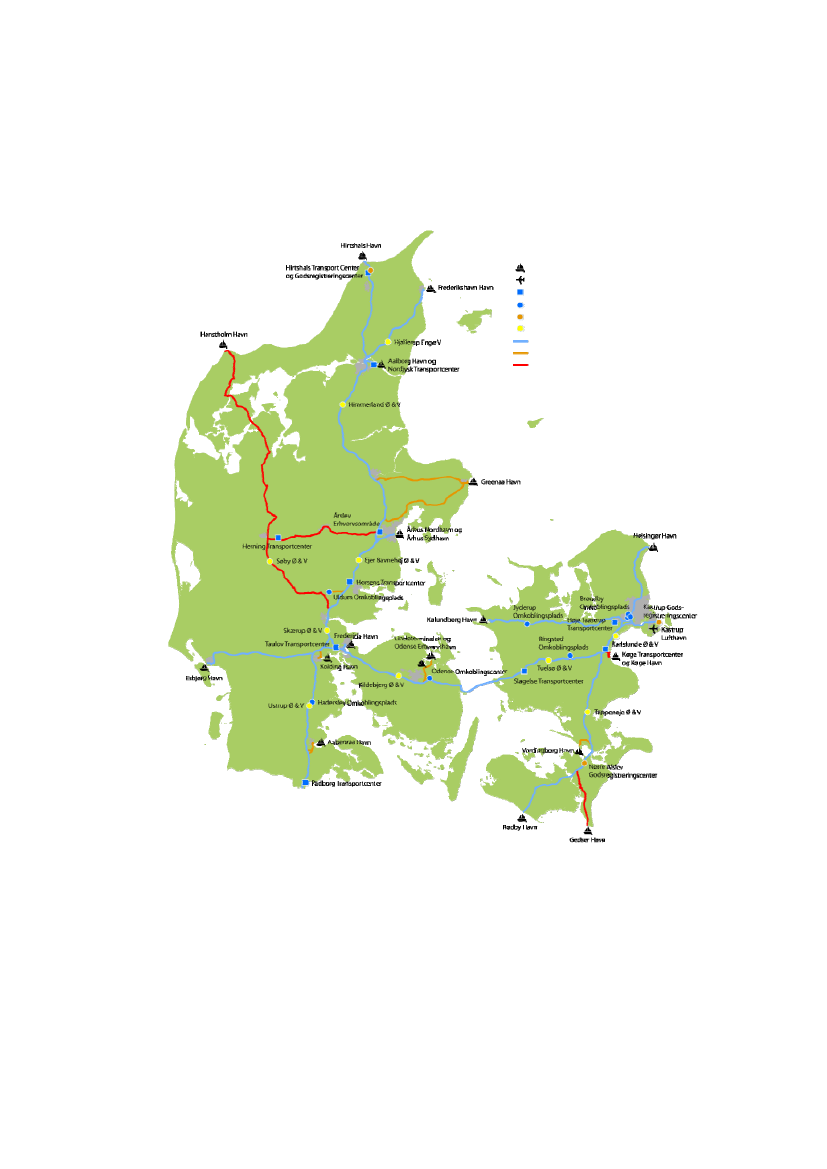
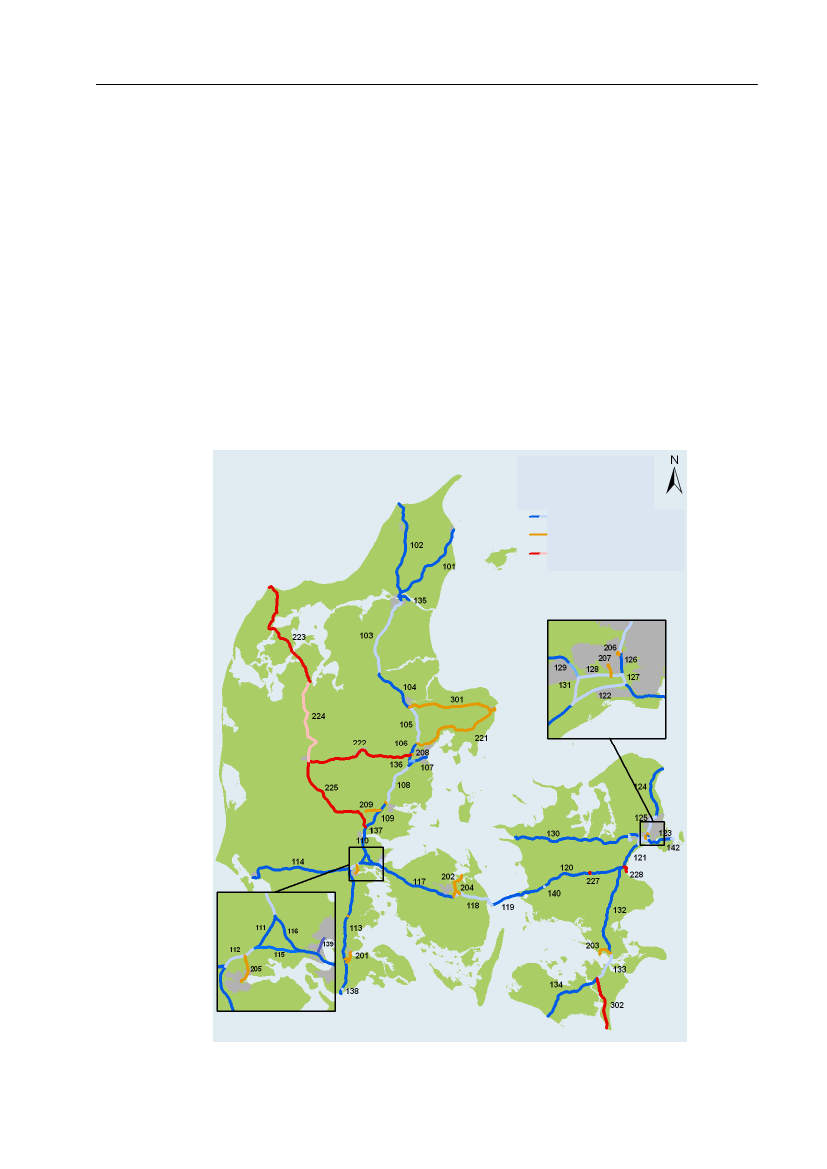
In accordance with the ”The executive order on the road network, etc. whereEMS vehicles are allowed to drive” of the Danish Road Directorate whichcame into force on 1 December 2009, the locations and road sections whereEMS vehicles are allowed to drive appear from Figure 1.Roads and destinations forEMS vehicles 2009PortAirportTransport centreInterchange locationsGoods registration centreService areasPhase 1 (2008)Phase 2A (Sep. 2009)Phase 2B (Dec. 2009
Figure 1 The road network on which EMS vehicles are allowed to drive
In addition to the marked locations and road sections, EMS vehicles canalso be applied for a number of individual companies where it is permitted todrive shorter sections on roads outside of the roads indicated in figure 1 – anarrangement which is often referred to as “the company arrangement”.These locations are, however, not comprised by the evaluation and thereforenot treated further.
Tetraplan A/S
Grontmij | Carl Bro A/S
The Danish Road DirectorateTest with European Modular System – Midway Report
Page 14
3.2
Construction investments
Up to the start of the EMS vehicle test in November 2008 the Danish RoadDirectorate performed reconstructions of a number of locations in order toensure that the EMS vehicles could manoeuvre on the road network. On afew of these locations there were still minor works to be finished during2009.The reconstructions have continued in 2009 and as they are finished, thesections and locations in question have been included in the test through thetwo executive orders passed in 2009.During 2010 less expenses for finishing of the works started in 2009 are ex-pected to be paid. In addition to this there may be expenses for new con-struction works which will be started during 2010.The Danish RoadDirectorate hasinvested DKK114m.A preliminary statement of the total construction expenses until today (theend of 2009) for various reconstructions appears from Figure 2.Phase descriptions:Phase 1. The sections included fromNovember 2008. Main expenses:Additional expenses for phase 1(var. finishing works):Total phase 1:Phase 2A. The sections included from Sep-tember 2009Phase 2B. The sections included from De-cember 2009Total phase 2:Total construction costs of the DanishRoad Directorate:Year20082009DKK50,274,6175,030,00055,304,6172009200920092008 & 200930,765,28627,803,04158,568,327113,872,944
Figure 2 Complete survey of the reconstruction expenses of the Danish Road Direc-torate3
The DKK 114m applied for reconstructions so far should be seen in connec-tion with the total construction allocation of DKK 128.7m.The expenses for reconstructions at the various locations appear from themaster files included in Appendix 5.In addition to the construction costs which are the responsibility of the Dan-ish Road Directorate, a number of ports and transport centres have beenresponsible for reconstructions which have been caused by the EMS vehicletest.
3
All prices mentioned are exclusive of VAT. The total figures for the construction costsinclude costs for projecting, supervision and project management, costs for trafficsafety revision and the actual construction costs including costs for planting, lighting,etc.Grontmij | Carl Bro A/S
Tetraplan A/S
The Danish Road DirectorateTest with European Modular System – Midway Report
Page 15
The ports and transport centres participating in the test have in a survey in-dicated the construction costs they have had in 2008 and 2009 respectively.Finally, they have been asked, whether they expect further reconstructionsout of consideration for the EMS vehicle test at a later time.22 ports andtransport centreshave indicatedthat they hadconstruction costsOut of 39 potential replies a total of 22 have replied to the questionnaire,which gives a reply percentage of 56. Among the replies returned the as-sessment is that we have to a large extent received replies from the portsand transport centres where the largest amount of EMS vehicle will drive aswell as the ports and transport centres assumed to have made an effort withthe reconstructions.The result of the returned replies has been assessed and indicated togetherwith the questionnaire in Appendix 3 C. Only some ports and transport cen-tres are planning further infrastructure investments as a consequence of theEMS vehicle test which would in that case have to be made in 2010 or later.Ports and trans-port centres haveinvested DKK16m.As it appears from Appendix 3 C, the construction costs for 2008 and 2009amount to the following amounts (all amounts are exclusive of VAT):Year:DKK:200812,800,00020093,025,000Total:15,825,000Figure 3 Operation costs of ports and transport centres
Total investmentin 2008 and 2009DKK 130m.
This means that all in all the construction costs amount to almost DKK 130mfor reconstructions or more precisely DKK 129,697,944.
Tetraplan A/S
Grontmij | Carl Bro A/S
The Danish Road DirectorateTest with European Modular System – Midway Report
Page 16
44.1
TRAFFICEMS vehicle units in Central Register for Motor Vehicles
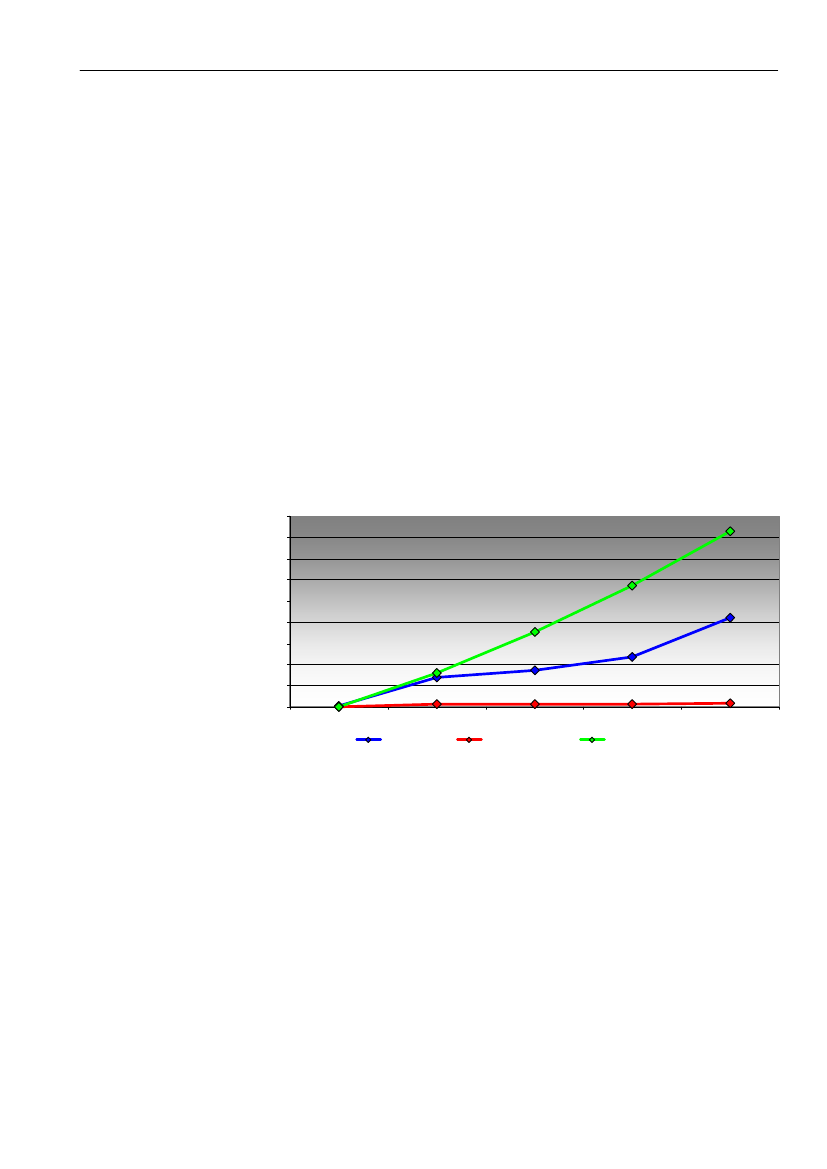
Since the month of August 2008 Statistics Denmark has registered theamount of EMS vehicles with Danish number plates. The information hasbeen collected through the Central Register for Motor Vehicles and the de-tailed information appears from Appendix 2 A.Extracts from the Central Register on Motor Vehicles reveals a current in-crease in the amount of vehicles which can enter into a EMS vehicle.At the end of2009 there arepotentially 316EMSs in Den-markFrom
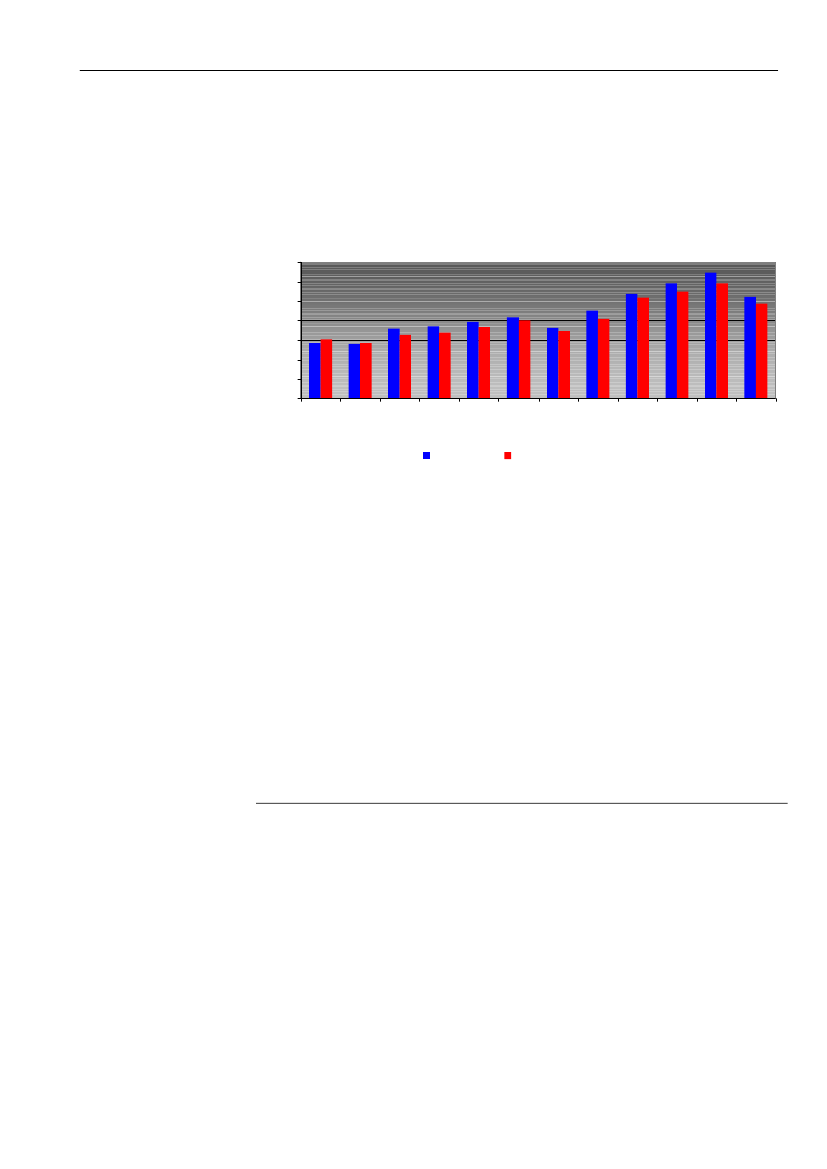
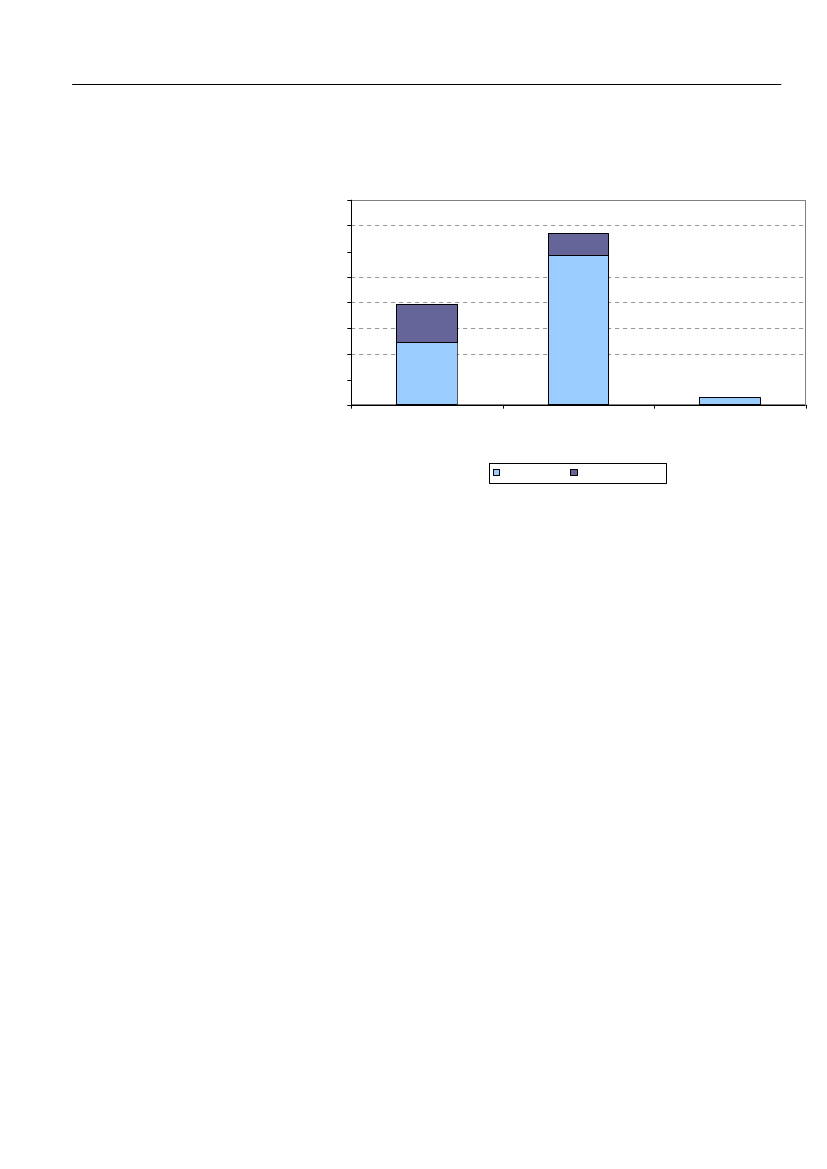
Figure 4 the development in EMS vehicle units in the Central Register forMotor Vehicles appears. The figure illustrates the development in registereddollies (EMS vehicle type 1), semi-trailers for centre axle trailers (EMS vehi-cle type 2) and link-trailers (EMS vehicle type 3). At the end of December2009 105 dollies, 4 semi-trailers and 207 link-trailers, a total of 316 EMS ve-hicle units.Danish registered EMS vehicle units distributed on types2252001751501251007550250aug 2008nov 2008Type 1; "Dollies"dec 2009Type 2; "Semitrailers"mar 2009Type 3; "Link-trailere"dec 2009
Figure 4 Development in EMS vehicle units in the Central Register for Motor Vehi-cles
In addition to this it is registered how many trucks and tractors have beenapproved for driving with EMS vehicle types 1 and 4 respectively and EMSvehicles types 2 and 3. From August 2008 until the end of December 2009the amount of approved trucks for EMS vehicles types 1 and 4 has in-creased from 491 to 4,054 while the amount of approved tractors for EMSvehicles types 2 and 3 have increased from 613 to 5,315.It should be mentioned that this type of trailers which form part of EMS vehi-cle type 4 cannot be extracted separately from the Central Register of MotorVehicles.
Tetraplan A/S
Grontmij | Carl Bro A/S
The Danish Road DirectorateTest with European Modular System – Midway Report
Page 17
4.2
Traffic development
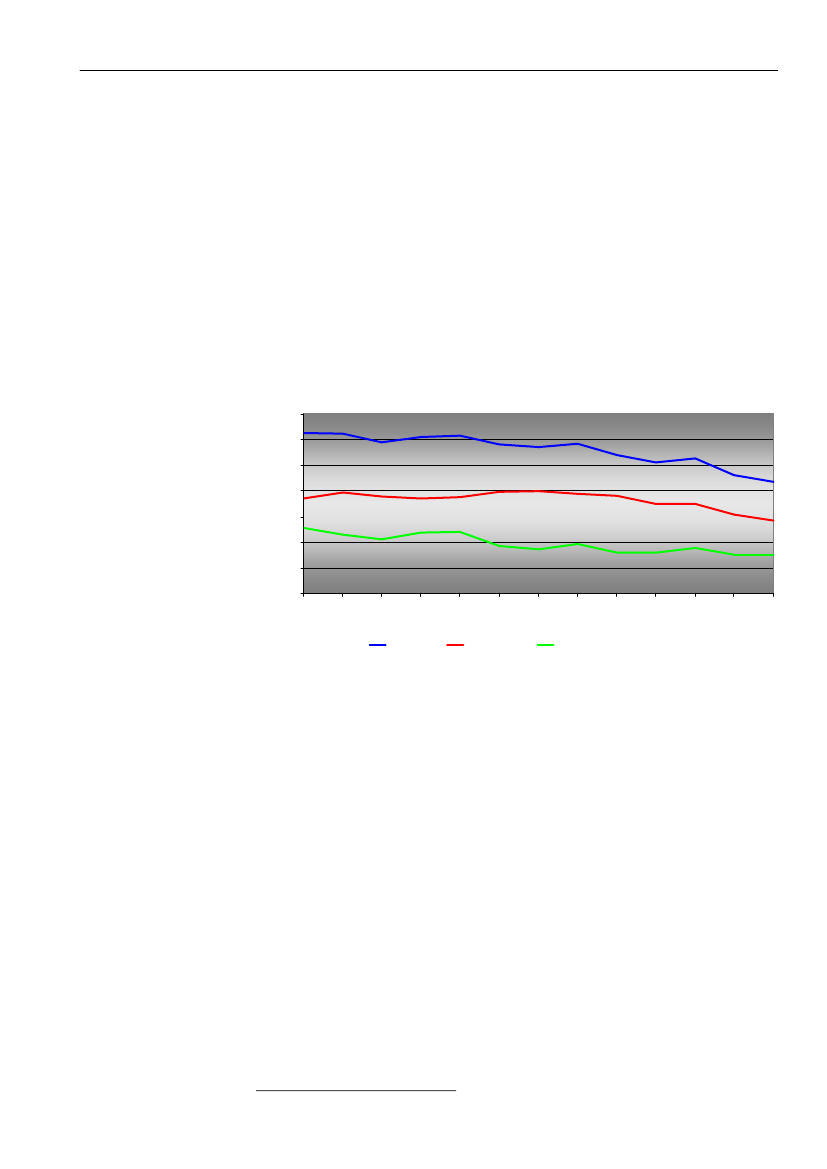
Generally the car traffic has decreased over the latest five quarters (3rdquarter 2008 – 3rd quarter 2009) by 1-2% compared to the same quarters inthe previous years.Road transporthas decreasedwith 18% from3rd quarter 2008to 2nd quarter2009.However the picture is considerably different for the freight traffic. Figure 5shows the freight traffic development with Danish trucks from the end of 2ndquarter 2001, where it peaked, to the end of 3rd quarter of 2009. The freighttraffic with Danish trucks in this period has decreased with 30 % distributedwith approx. 25 % on national transport and approx. 40 % on internationaltransport. Alone in the period from 3rd quarter 2008 to 3rd quarter 2009 thefreight traffic with Danish trucks has decreased with approx. 20 %.Truck traffic development with Danish trucks > 6 tonnes700600500
Million km
40030020010002001Q22002Q22003Q22004Q22005Q22006Q22007Q22008Q22008Q32008Q42009Q12009Q22009Q3
Total transport
National transport
Total international transport
Figure 5 Freight traffic development since 2nd quarter 2001 of Danish trucks
4
4.3The EMS traffic isregistered via thepermanent WIMdevices of theDanish Road Di-rectorate
Traffic counting
Currently the Danish Road Directorate collects traffic data from a number oflocations partly by means of permanent weigh-in motion (WIM) devicespartly by means of mobile WIM devices. In the evaluation primarily data fromthe permanent WIM devices is applied. Traffic data has been collected on 64partial sections.Various types of equipment are applied for registration of traffic and the reg-istration of vehicle types is calculated by means of various methods. TheDanish Road Directorate has informed that at present only one type ofequipment is capable of counting EMS vehicles and therefore only trafficdata from this type is applied.
The motorway inEastern Jutlandnorth of Vejle hasthe highestamount of trucks
The traffic load on the test road network varies from partial section to partialsection. On the partial sections of the road network the amount of trucksvary from 338 daily south of Hanstholm (road 26) to 13,077 near Vejle. Theroad sections most loaded with freight traffic in 2009 are:
4
Source for figures is data from Statistics Denmark, StatBank Denmark.Grontmij | Carl Bro A/S
Tetraplan A/S
The Danish Road DirectorateTest with European Modular System – Midway Report
Page 18
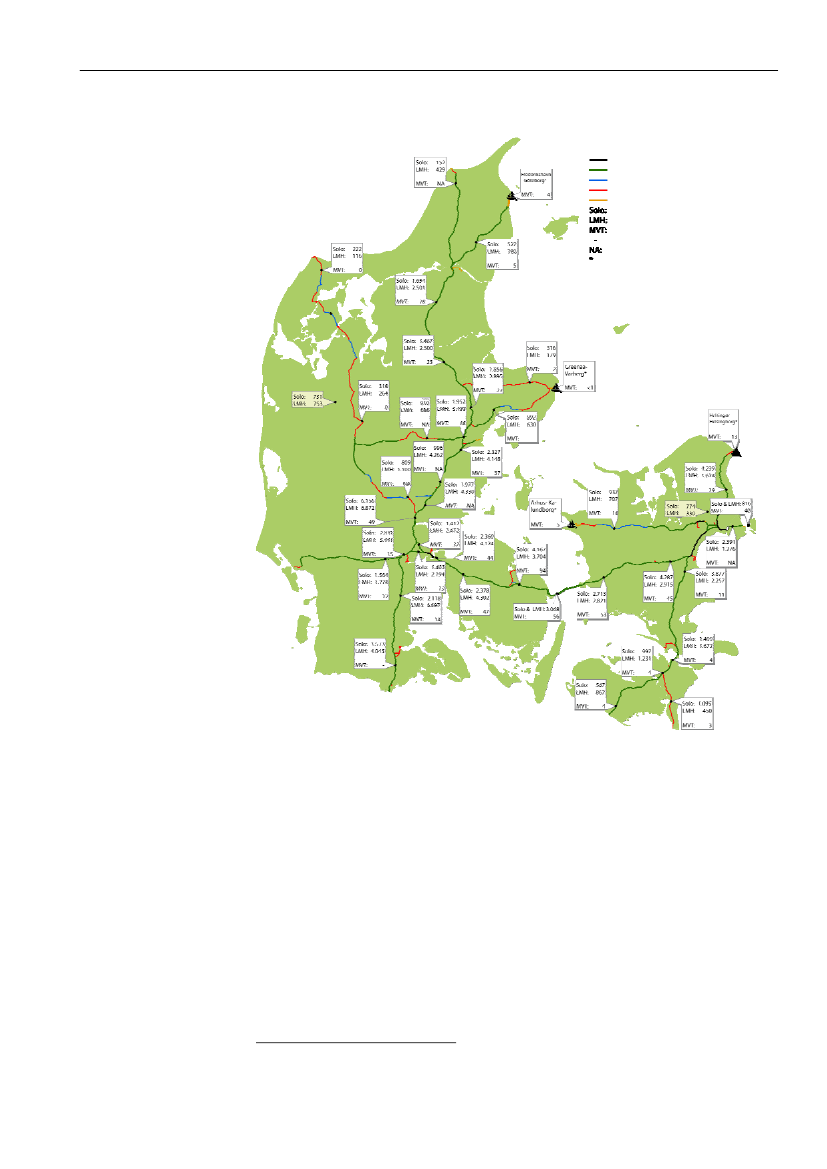
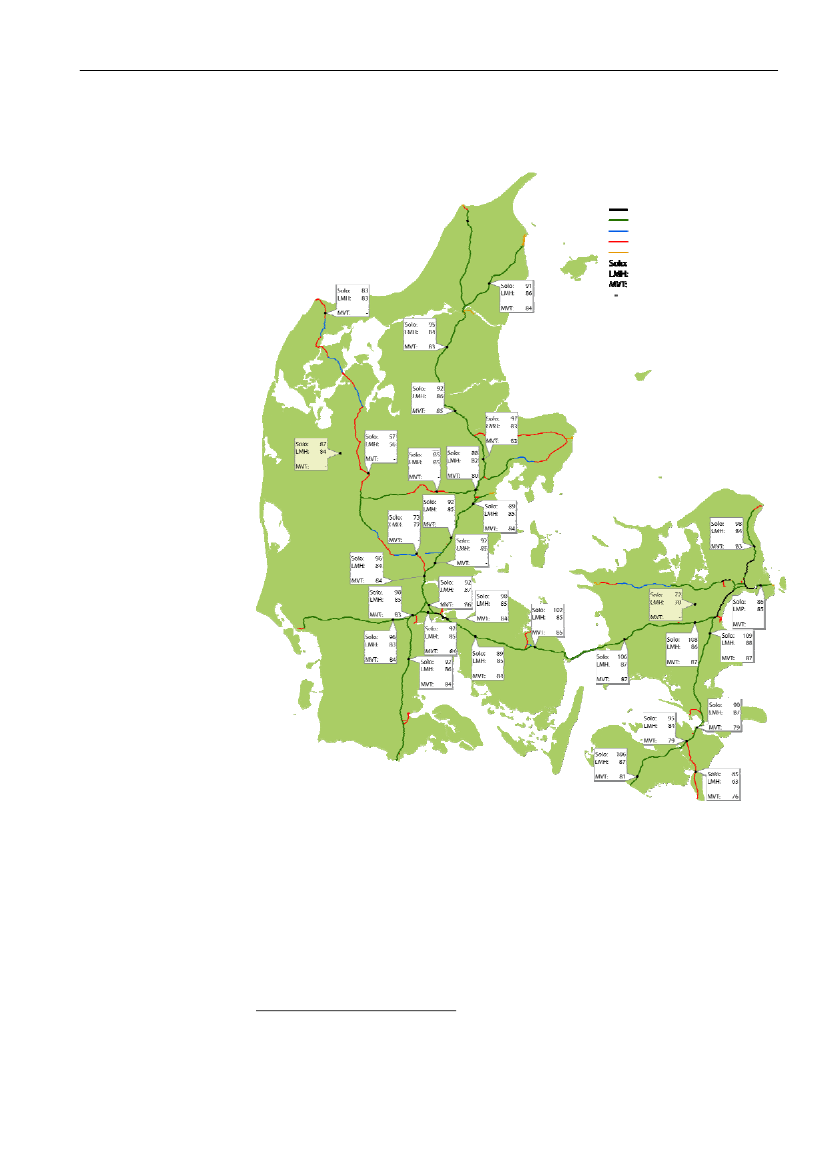
Motorway E45 north of the Vejlefjord Bridge on the Motorway inEastern Jutland with more than 13,000 trucks per day (14,500 in2008).The motorway in Eastern Jutland, E45, north of Kolding at KoldingMotorway crossings with approx. 8,300 (9,800 in 2008) trucks perday.The West Motorway, E20, between Ringsted and Køge with approx.7,200 (7,400 in 2008) trucks per day.The Funen Motorway, a little east of Odense with approx. 8,000trucks per day (new WIM device as of 2009). From the pre-test re-port it appears that 4,700 trucks per day were driving on almost thesame partial section. These traffic figures are not comparable as thecounting in the pre-test report was made between the ramps of exit48. Therefore the traffic to and from Tietgenbyen is not included inthe counting in the pre-test report.Development infreight traffic onthe individual par-tial sections from2004 to 2009 isstated in Appen-dix 4.The traffic load is calculated for the various forms of trucks and road trainsdriving on the road sections included in the test. The statement of freighttraffic in the years 2004 to 2009 on the individual partial sections grouped intruck types appears from the master files in Appendix 4, which comprises allthe partial sections of the road network expected to be included in the EMSvehicle test.When summing up, the freight traffic measured in annual average daily traf-fic (AADT) in 2009 can be stated as illustrated in Figure 65.
5
The WIM devices of the Danish Road Directorate register vehicles between 22 – 28m as EMS vehicles.Grontmij | Carl Bro A/S
Tetraplan A/S
The Danish Road DirectorateTest with European Modular System – Midway Report
Page 19
Freight traffic 2009 (AADT)Motorway > 4 lanesMotorway = 4 lanesExpresswayRural roadUrban roadSolo: Solo trucks and bussesTWT: Trucks with trailer or semitrailerEMS: European Modular System vehicleTechnical error in conc. with counting of EMSCounting not possibleFerry lines made up as at 31/09-2009
Figure 6 Freight traffic in 2009 (AADT) on the total test road network
An AADT figureof slightly above90 EMS is thehighest figure atthe end of 2009
In addition to the statements on the parts of the road network where EMSvehicles can drive, traffic figures for two control locations outside the EMSvehicle road network have been included. Both locations have been includedin order to be able to compare the development in traffic where the EMS ve-hicles can drive with the ordinary development in the freight traffic. The twocontrol locations have been selected because at these locations quite somefreight traffic can be expected. A location near Holstebro and a location atRing 4 near Ballerup have been selected. Both WIM devices are located onrural roads.Compared to 2008 the freight traffic has generally decreased all over thecountry. There are, however, some exceptions, as the freight traffic has in-creased slightly at some locations. Figure 7 shows the difference betweenthe traffic values (AADT) for 2008 and 20096.
6
In Figure 7 only data for the WIM devices where data is comparable between 2008and 2009 has been included. In practice the WIM devices where EMS vehicles areincluded have been the primarily selected WIM devices and thus also had an influenceon the choice of where the differences can be calculated.Grontmij | Carl Bro A/S
Tetraplan A/S
The Danish Road DirectorateTest with European Modular System – Midway Report
Page 20
Freight traffic 2009 compared to 2008(ADDT)Motorway > 4 lanesMotorway = 4 lanesExpresswayRural roadUrban roadSolo: Solo trucks and bussesTWT: Tricks with trailer or semitrailerEMS: EMS vehiclesTechnical error in conc. with counting of EMSsCounting not possibleFerry lines made up at 31/09-2009
Figure 7 Difference in AADT between 2008 and 2009
4.456 EMS pas-sages the GreatBelt daily at theend of 2009
The Great Belt Bridge
Since January 2009 the Great Belt Bridge has registered the amount of EMSvehicles passing the bridge. In 2009 more than 93,000 trucks passed theGreat Belt Bridge per month (AADT 3,100). Of these an average of approx.1,700 EMS vehicles per month (AADT 56)7. A more detailed statistic state-ment appears from Appendix 1 B.7
The figures for the passage at the Great Belt have been extracted manually by A/SA/S Storebælt. In connection with the presentation of the material, A/S Storebælt hasgiven the following information about the figures:- Only passages in BroBizz lanes are included.- Only vehicles higher than 3.9 m and 21.0 m long are included.- Only vehicles which both classification systems classified as belonging to thenew class are included.- Auto-transporters have been removed if they apply with a special BroBizz.Test runs have been removed.- Length and height are connected with some uncertainty. However data hasbeen analysed and video pictures have been watched and it has been foundGrontmij | Carl Bro A/S
Tetraplan A/S
The Danish Road DirectorateTest with European Modular System – Midway Report
Page 21
More EMSheaded towardsKorsør than to-wards Nyborg
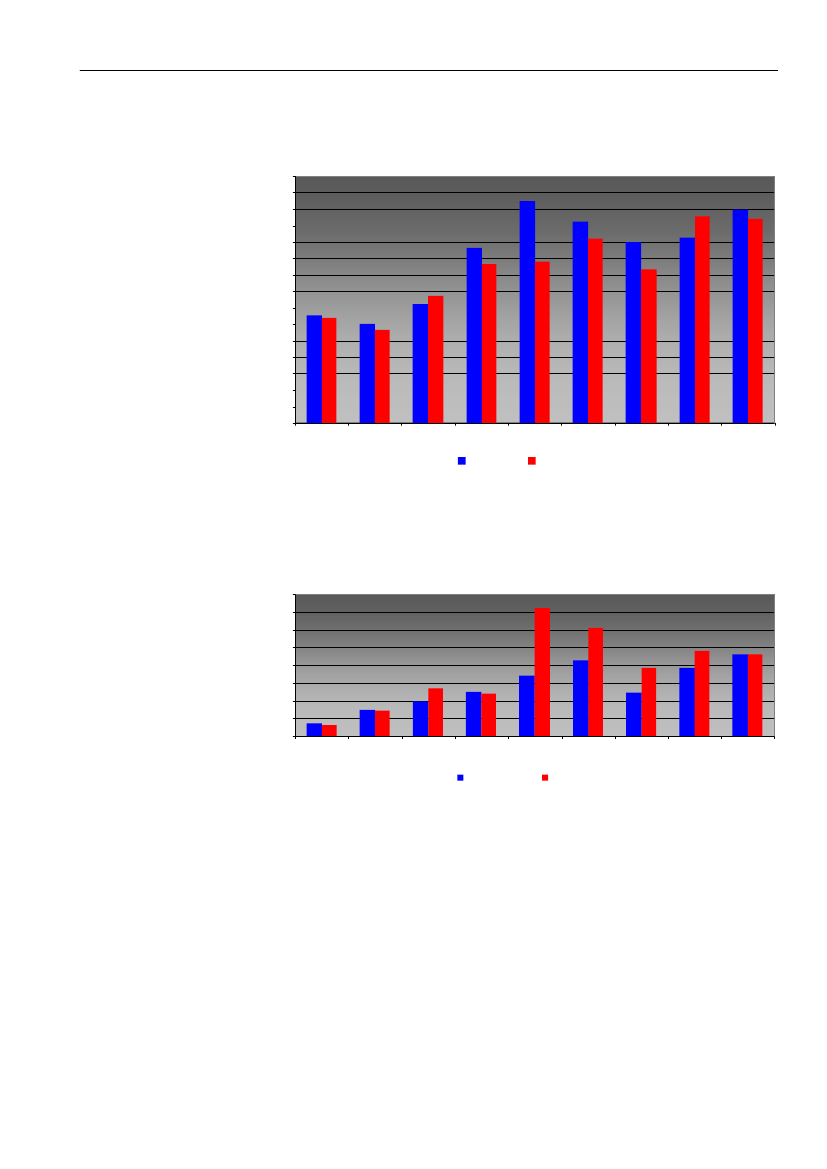
The amount of EMS vehicles passing the Great Belt Bridge per month in2009 appears from Figure 8. It appears that since the month of March moreEMS vehicle combinations drove to Korsør than to Nyborg8.EMS vehicles on the Great Belt Bridge 20091.4001.2001.0008006004002000SeptemberNovemberJuneJanuaryJulyOctoberDecemberMarchAprilFebruaryAugustMay
Towards Korsør
Towards Nyborg
Figure 8 EMS vehicles on the Great Belt Bridge 2009
Generally thefreight traffic hasdecreased lesson the Great Beltthan in the coun-try as a whole
In January 2009 the EMS vehicles amounted to 1.3 % of the total freight traf-fic on the Great Belt Bridge while in December 2009 it amounted to 2.4 %.Compared to 2008 the freight traffic as a whole, has decreased with ap-proximately 11,300 passages per month on average. This corresponds to adecrease of 10.8 %, which is less than the decrease in the traffic generallystated for the freight traffic on a national basis.If it is presumed that 2 EMS vehicles have replaced 3 semitrailer road trains,then 1 percentage point9of the total decrease of 10.8 % can be ascribed tothe introduction of EMS vehicles. The remaining decrease can be caused bythe financial crisis which has generally reduced the activity level in Denmark.The total freight traffic on the Great Belt Bridge in 2008 and 2009 appearsfrom Figure 9.
-
-
that especially the driver’s cabin and the trailer height are the best means forseparating EMS vehicles from exceptional transports.During the period the VDC system (one of the classification systems) has un-dergone a number of adjustments in order to be able to classify the new limitof 19 and later 20 m. Specifically a software upgrade in March 2009 showedsignificant results. Since the summer of 2009 no important changes havebeen made in this system.The OCS system (The other classification system) was placed 19 m from thestart and was moved to 20 m during April - May. However, this should not beof any importance. Generally the analysis seems to give a true and fair view ofthe development. Whether the level was this high at the beginning is not easyto assess.
8
These permanent flow imbalances which are also known from the Oresund Bridgeand the ferries cannot be explained immediately. Thus the question will be discussedfurther with the haulage contractors at a later time.91/3 of the EMS vehicles passing the Great Belt Bridge in 2009 corresponds to 1 per-centage point of the total decrease in the freight traffic on the Great Belt Bridge from2008 to 2009.Tetraplan A/SGrontmij | Carl Bro A/S
The Danish Road DirectorateTest with European Modular System – Midway Report
Page 22
Total freight traffic on the Great Belt Bridge 2008 and 2009120.000100.00080.00060.00040.00020.0000NovemberJanuaryJuneJulyOctoberSeptemberDecemberDecember
March
April
Trucks total in 2008Trend (Trucks in total 2008)
February
Trucks total in 2009Trend (Trucks in total 2009)
Figure 9 Total freight traffic on the Great Belt Bridge 2008 and 2009
4.540 EMS a daypassed the Ore-sund at the end of2009
The Oresund Bridge
Since January 2009 the Oresund Bridge has registered the amount of EMSvehicles passing the bridge. In 2009 an average of more than 26,000 truckspassed per month (AADT 856), of these an average of approx. 1,200 EMSvehicles per month (AADT 40)10. In Appendix 1 B a more detailed statementof the bridge traffic can be found.The amount of EMS vehicles passing the Oresund Bridge per month in 2009appears from Figure 10. Generally it appears that significantly more EMSvehicles are driving to Denmark than to Sweden.
More EMS areheaded towardsDenmark thantowards Sweden
EMS vehicles on the Oresund Bridge in 20091.2001.0008006004002000SeptemberNovemberJanuaryJuneJulyFebruaryOctoberMarchAprilAugustMay
Towards Denmark
Towards Sweden
Figure 10 EMS vehicles on the Oresund Bridge in 2009
In January 2009 the EMS vehicles amounted to 5.1 % of the total freight traf-fic on the Oresund Bridge, while in December 2009 the amount was 4.5 %.According to information from the Oresund Bridge, vehicles longer than 20 m areregistered as EMS vehicles. The figures should not include exceptional transports.The Oresund Bridge has been asked to verify this as well as the Bridge has beenasked about whether the difference in amount of registered passages from east andwest respectively could have a technical explanation. Both issues are still being exam-ined by the Oresund Bridge (April 2010).Tetraplan A/SGrontmij | Carl Bro A/S10
August
May
The Danish Road DirectorateTest with European Modular System – Midway Report
Page 23
Compared to 2008 the freight traffic has decreased by approx. 2,400 pas-sages per month (average). This corresponds to a decrease of 8.4 %.Provided that 2 EMS vehicles have replaced 3 semitrailer trains, 2 percent-age points11of the total decrease of 8.4 % can be ascribed to the introduc-tion of EMS vehicles. The remaining decrease could be caused by the finan-cial crisis which has generally reduced the activity level in Denmark. The to-tal freight traffic on the Oresund Bridge in 2008 and 2009 appears fromFigure 11.Total freight on the Oresund Bridge in 2008 and 200935.00030.00025.00020.00015.00010.0005.0000MayJanuaryFebruaryMarchAprilJulyAugustOctoberNovemberJuneSeptemberDecember
Trucks total in 2008Trend (Trucks total 2008)
Trucks total in 2009Trend (Trucks total 2009)
Figure 11 The total freight traffic on the Oresund Bridge in 2008 and 2009
4.6
Ferry traffic
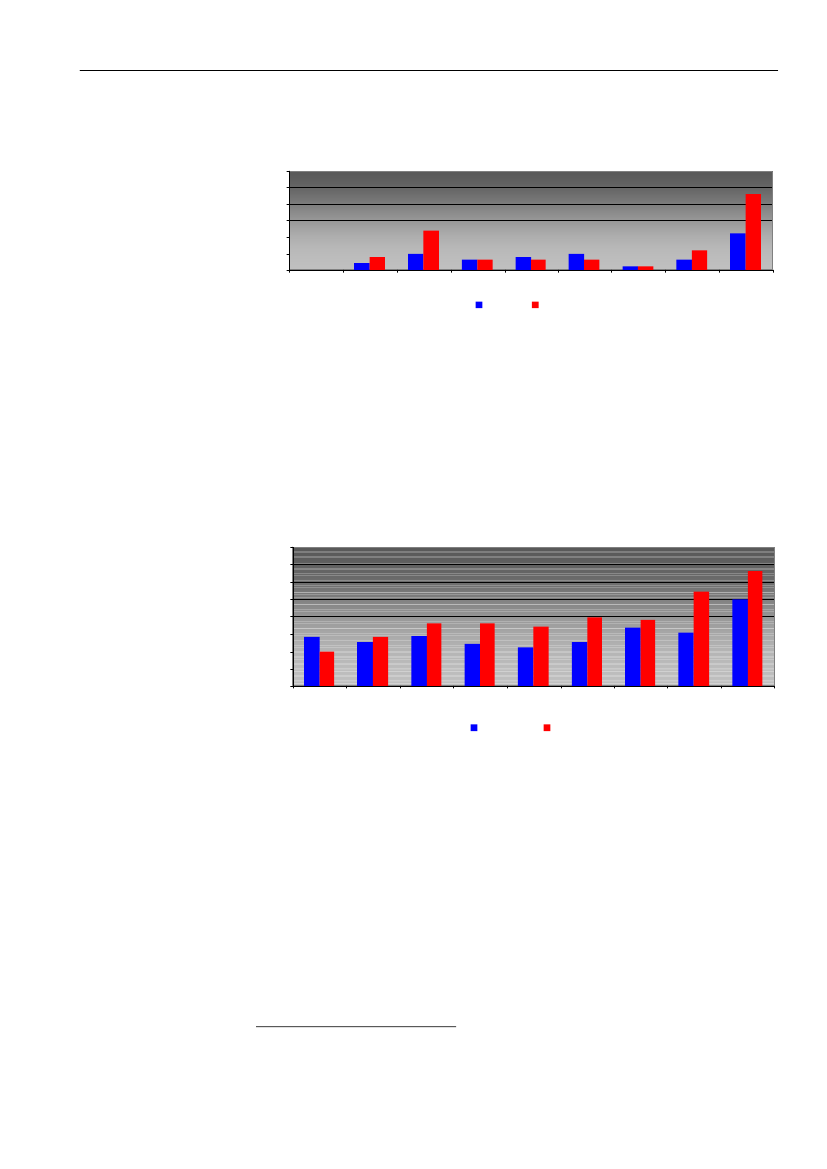
Since January 2009 the ferry lines in Denmark and between Denmark andSweden have registered the amount of EMS vehicles ferried in January2009. The more detailed statistic statements can be found in Appendix 1 A.Elsinore-Helsingborg is theferry line ferryingmost EMSsThe ferry line between Elsinore and Helsingborg is the line ferrying mostEMS vehicles. From the start in January to the end of September the totalamount of ferried EMS vehicles increased from 259 (AADT 9) to 507 (AADT17) per month. For the entire period it can be enumerated to AADT of 1312.From Figure 12 the amount of ferried EMS vehicles between Elsinore andHelsingborg appears. A slightly higher amount of EMS vehicles are ferried toElsinore than to Helsingborg.
1/3 of the EMS vehicles passing the Oresund Bridge in 2009 corresponds to 2 per-centage points of the total decrease in the freight traffic on the Oresund Bridge from2008 to 2009.12At the present time (March 2010) only figures for the ferry passages up to and in-cluding the end of 3rd quarter of 2009 are available.Tetraplan A/SGrontmij | Carl Bro A/S
11
The Danish Road DirectorateTest with European Modular System – Midway Report
Page 24
The amount of ferried vehicles in 2009, Elsinore - Helsingborg30028026024022020018016014012010080604020-JanuaryFebruaryMarchAprilMayJuneJulyAugustSeptember
To Elsinore
To Helsingborg
Figure 12 The amount of ferried EMS vehicles between Elsinore and Helsingborg
From Figure 13 the amount of ferried EMS vehicles between Gothenburgand Frederikshavn appears. For the entire period AADT can be calculated to4.Ferried EMS vehicles in 2009, Frederikshavn - Gothenburg16014012010080604020-JanuaryFebruaryMarchAprilMayJuneTo GothenburgJulyAugustSeptember
To Frederikshavn
Figure 13 The amount of ferried EMS vehicles between Frederikshavn and Gothen-burg
Only very fewEMS applyGrenaa-Varberg
From Figure 14 the amount of ferried EMS vehicles between Grenaa andVarberg appears. A little more EMS vehicles are ferried to Varberg than toGrenaa. For the entire period the AADT can be calculated to < 1.
Tetraplan A/S
Grontmij | Carl Bro A/S
The Danish Road DirectorateTest with European Modular System – Midway Report
Page 25
Ferried EMS vehicles in 2009, Grenaa - Varberg302520151050JanuaryFebruaryMarchAprilMayJuneTo VarbergJulyAugustSeptember
To Grenaa
Figure 14 Amount of EMS vehicles ferried by the ferry line between Grenaa andVarberg
At Aarhus-Kalundborg moreEMS are ferriedtowards Aarhusthan towardsKalundborg
On the national lines the ferry line between Kalundborg and Aarhus is theonly one ferrying EMS vehicles. This ferry line ferries EMS vehicles both withand without tractor13. The ferried amount of EMS vehicles have increasedfrom 96 per month in January 2009 to 232 per month at the end of Septem-ber 2009, which can be enumerated to an AADT of 5 for the entire period.Generally more EMS vehicles are ferried to Aarhus than to Kalundborg, cf.also Figure 15.Ferried EMS vehicles in 2009, Aarhus - Kalundborg160140120100806040200JanuaryFebruaryMarchAprilMayJuneTo AarhusJulyAugustSeptember
To Kalundborg
Figure 15 Amount of ferried EMS vehicles between Aarhus and Kalundborg
The following does not distinguish between whether the EMS vehicles are ferriedwith or without tractor. The detailed figures for the ferrying with and without tractor re-spectively appear from table 4 in Appendix 1 A, of which appears that there is a ratherlarge variance in the flow determined ferrying of EMS vehicles with and without tractor,respectively.Tetraplan A/SGrontmij | Carl Bro A/S
13
The Danish Road DirectorateTest with European Modular System – Midway Report
Page 26
4.7
Transport patters of EMS vehicles
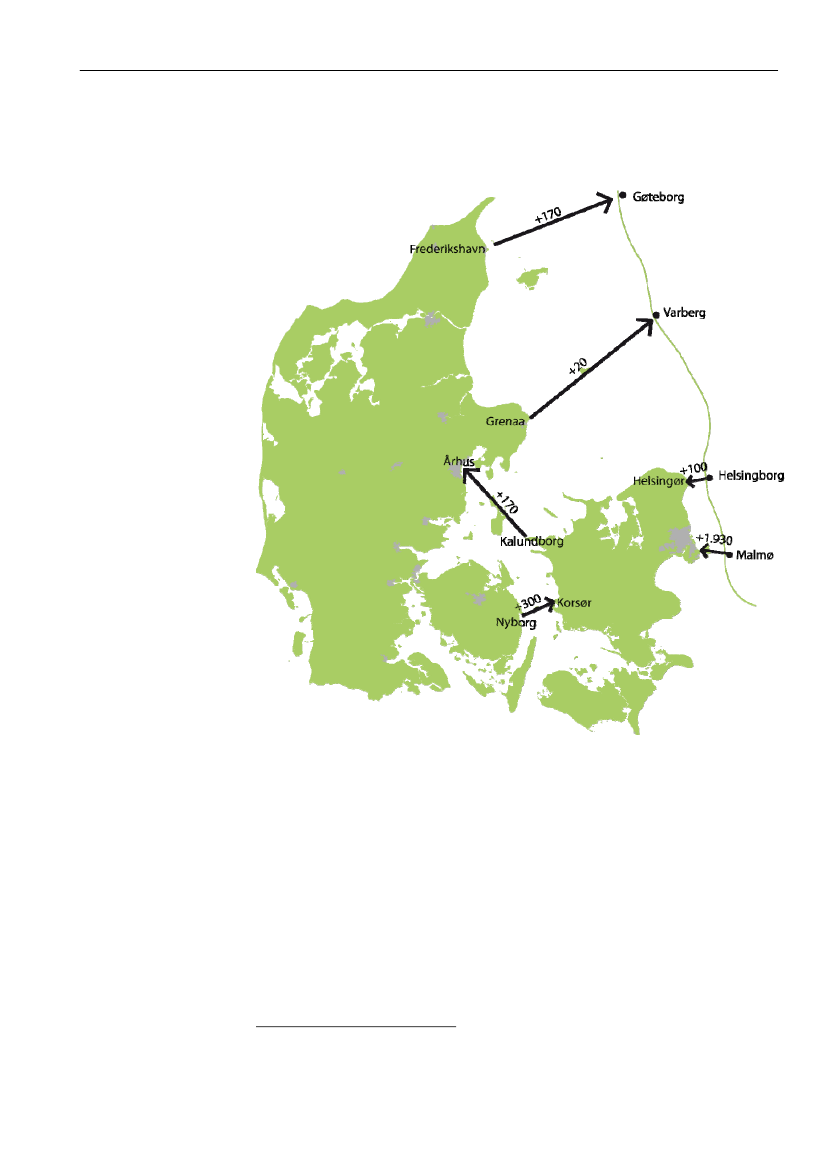
Figure 16 Transport patterns of EMS vehicles: ”Accumulation” of EMS vehicles fromJanuary to September 2009
It appears from Figure 16 that more EMS vehicles are transported from Jut-land to Sweden and from Kalundborg to Aarhus than the opposite way.During 2009 con-siderably moreEMS drove toSealand thanaway fromSealand!From Figure 16 it also appears that in the period January – September 2009there has apparently been an ”accumulation” of EMS vehicles on Sealand.Counts from ferry lines, the Great Belt Bridge and Oresund Bridge show thatmore EMS vehicles are driving to Sealand than from Sealand. Thus in thisperiod 2,160 more EMS vehicles drove to than from Sealand14. The flowdistribution and the total amount of EMS vehicle passages of Oresund ap-pear from Figure 17, while the flow distribution and the total amount of EMSvehicles of the Great Belt appear from Figure 18.
Taking into account that totally a little more than 300 EMS units are registered inDenmark, this corresponds to the fact that in the first 9 months of 2009, 6 times theamount on Sealand has been accumulated. In return it can be stated that this accumu-lation of EMS vehicles only corresponds to approx. 5 % of the total amount of EMSvehicles passing and/or being ferried on the Great Belt and Oresund.Tetraplan A/SGrontmij | Carl Bro A/S
14
The Danish Road DirectorateTest with European Modular System – Midway Report
Page 27
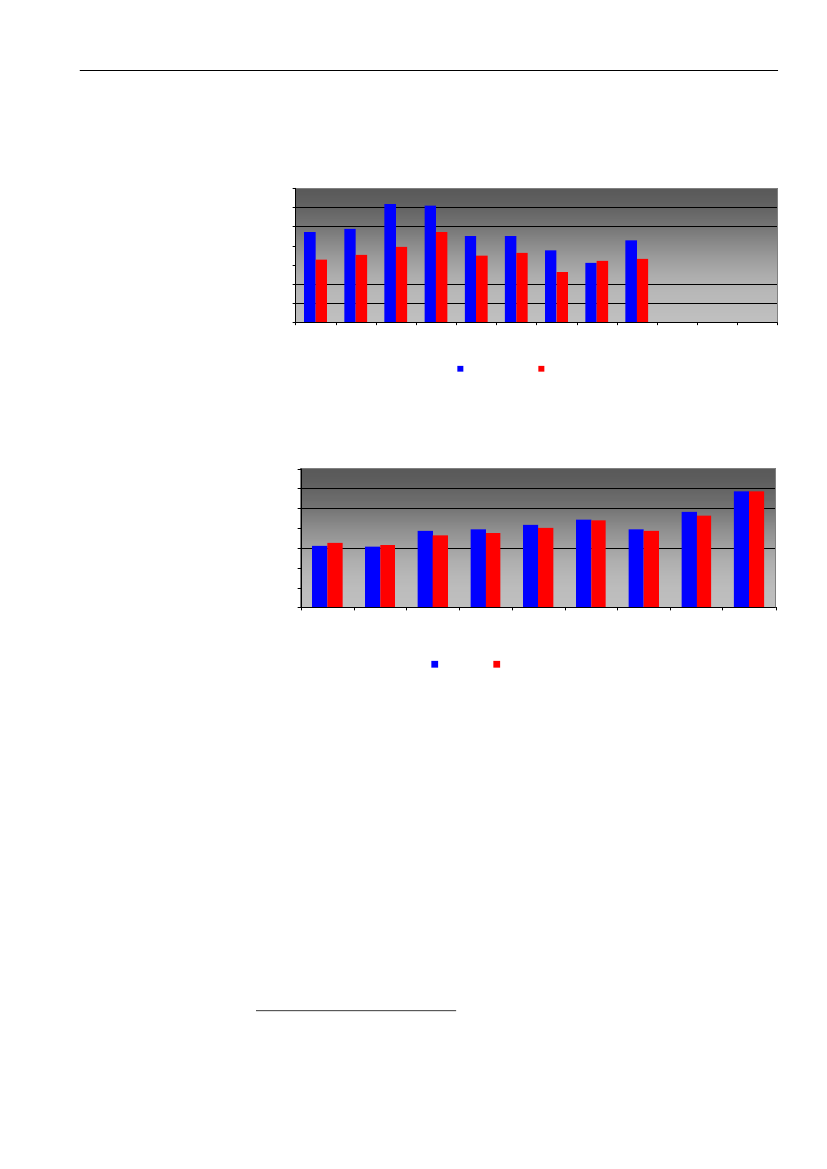
EMS vehicles passed Oresund in 2009 (the Oresund Bridge + Elsinore - Helsingborg lines)1.4001.2001.0008006004002000SeptemberNovemberJuneJanuayJulyOctoberDecemberMarchAprilFebruaryAugustMay
Towards Denmark
Towards Sweden
Figure 17 The development in the total amount of EMS vehicles having passed Ore-sund (Oresund Bridge + Elsinore-Helsingborg)EMS vehicles between Jutland/Funen and Sealand 2009 (Great Belt Bridge + Aarhus -Kalundborg line)1.4001.2001.0008006004002000JuneJanuaryJulySeptemberMarchAprilFebruaryAugustMayTo Jutland/Funen
To Sealand
Figure 18 Development in the total amount of EMS vehicles having passed theGreat Belt (The Great Belt Bridge + Aarhus-Kalundborg)
There are no immediate explanation to the accumulation of EMS vehicles onSealand, but it can be assumed that EMS vehicles driving to Sealand areinterchanged into smaller units to a larger extent e.g. in connection with fur-ther distribution before they return to their starting point15.EMSs and trucksunder 9 m drivetowards Den-mark, while othertrucks drive to-wards SwedenFor the Oresund traffic the flow determined distribution of the other freighttraffic has been studied for the first 3 quarters of 2009. This shows that in theperiod in question a total of 1,967 more trucks were headed towards Swe-den than towards Denmark.
It can be mentioned that the phenomenon of accumulation of EMS vehicles onSealand has been presented and discussed at a stakeholder meeting as well as at apanel meeting during the spring of 2010. In this connection a number of various ex-planations of the phenomenon has been given but any unique explanations have notbeen given. In the further evaluation work these possible explanations will be studiedfurther.Tetraplan A/SGrontmij | Carl Bro A/S
15
The Danish Road DirectorateTest with European Modular System – Midway Report
Page 28
The 1,967 trucks distributed with 5,605 truck over 9 meters (except EMS ve-hicles) and 257 trucks over 20 meters (apparently exceptional transports).To this came the 1,930 additional EMS vehicles mentioned in Figure 16headed towards Denmark, and finally 1,965 more trucks under 9 meters,also headed towards Denmark. In other words it is a question about thatEMS vehicles and trucks under 9 meters are headed towards Denmark whileroad trains not configured as EMS vehicles are headed towards Sweden.The transport pattern for trucks on the Oresund Bridge is illustrated in Figure19.
1.967 trucks-1,965 (<9m)5,605 (>9m)257 (exceptional trans-ports)
Figure 19 Transports with trucks on the Oresund Bridge the first 3 quarters of 2009
Looking at Elsinore - Helsingborg in the same period that is the 3 first quar-ters of 2009, then a total of 1,954 more trucks were ferried towards Denmarkthan towards Sweden – that is close to the 1,967 trucks passing over theOresund Bridge but in the opposite direction towards Sweden.Moreover, for the Elsinore – Helsingborg line it turns out that it is a questionabout EMS vehicles (100), solo trucks (267) and semitrailers (1,994) headedtowards Denmark while 407 trucks with trailer are headed towards Sweden.The transport pattern for trucks on the Elsinore – Helsingborg line appearsfrom Figure 20.1.954 trucks267 (solo)-407 (lvl)1,994 (swt)100 (ems)
Figure 20 Trucks ferried on the Elsinore – Helsingborg line the first 3 quarters of2009
All in all no clear picture begins to emerge for the Oresund traffic, as semi-trailers on the Elsinore – Helsingborg line have a flow imbalance bound to-wards Denmark (with 1,994 trucks over 9 meters), while on the OresundBridge there is a flow imbalance bound towards Sweden for trucks over 9meters (with 5,605 trucks over 9 months, except EMS vehicles).
Tetraplan A/S
Grontmij | Carl Bro A/S
The Danish Road DirectorateTest with European Modular System – Midway Report
Page 29
4.8
SpeedFreight traffic speeds 2009Motorway > 4 lanesMotorway = 4 lanesExpresswayRural roadUrban roadSolo: Solo trucks and bussesTWT: Trucks with Trailer or SemitrailerEMS: EMS vehicles-No measurements
Figure 21 Freight traffic average speed in 200916
The freight traffic speed has been measured on the average speed andgrouped into the same categories as the WIM counts (Solo, TWT, and EMSvehicles).
16
The speed measurements north of Herning can indicate that the measurement ismade in a 50/60 km/h speed zone. The permitted speed limit does not appear fromthe individual speed measurements in Matra.
Tetraplan A/S
Grontmij | Carl Bro A/S
The Danish Road DirectorateTest with European Modular System – Midway Report
Page 30
The freight trafficspeed is thesame on averagebefore and afterthe introduction ofEMS
In relation to the measured average speeds in connection with the pre-testsituation in 2008, the solo trucks are fluctuating around the same speeds asin 2009. On some of the sections the average speed has increased 1 km/hwhile on other sections the speed has decreased with 1 km/h17.Generally trucks with trailers are lying on the same speeds like in the pre-test situation in 2008 with a few small fluctuations on a few sections.More haulage contractors have indicated that their EMS vehicles are limitedto drive maximum 85 km/h. Speed measurements from 2009 could apply tomost EMS vehicles. So there is only one section in Jutland where the aver-age speed has edged up to 86 km/h. Moreover on the motorway betweenKorsør and Køge and a little south of Køge the average speed for EMS ve-hicles is up at 87 km/t.
The speed limiteris set to 85 km/h
4.9Due to uncertain-ties in conc. withweight data, thisis not updated inthe report
Total weights and axle loads
Some uncertainty about the weight data given by the WIM devices of theDanish Road Directorate has turned up. This uncertainty has apparently ex-isted for some time and apparently also at the time of the pre-test situationreport. Whether the uncertainty also applies to the registration of weight dataon EMS vehicles is not clear. In order to be certain about the weight datathat may be passed on in the report, a further investigation of the validity ofthe data will be necessary. This verification is at the moment ongoing in adialogue with the Danish Road Directorate. The work is not expected to befinished before after publication of the midway report, which is why the pre-sent report is not expected to include further material within this area.
4.10
Degree of occupancy on service and rest areas
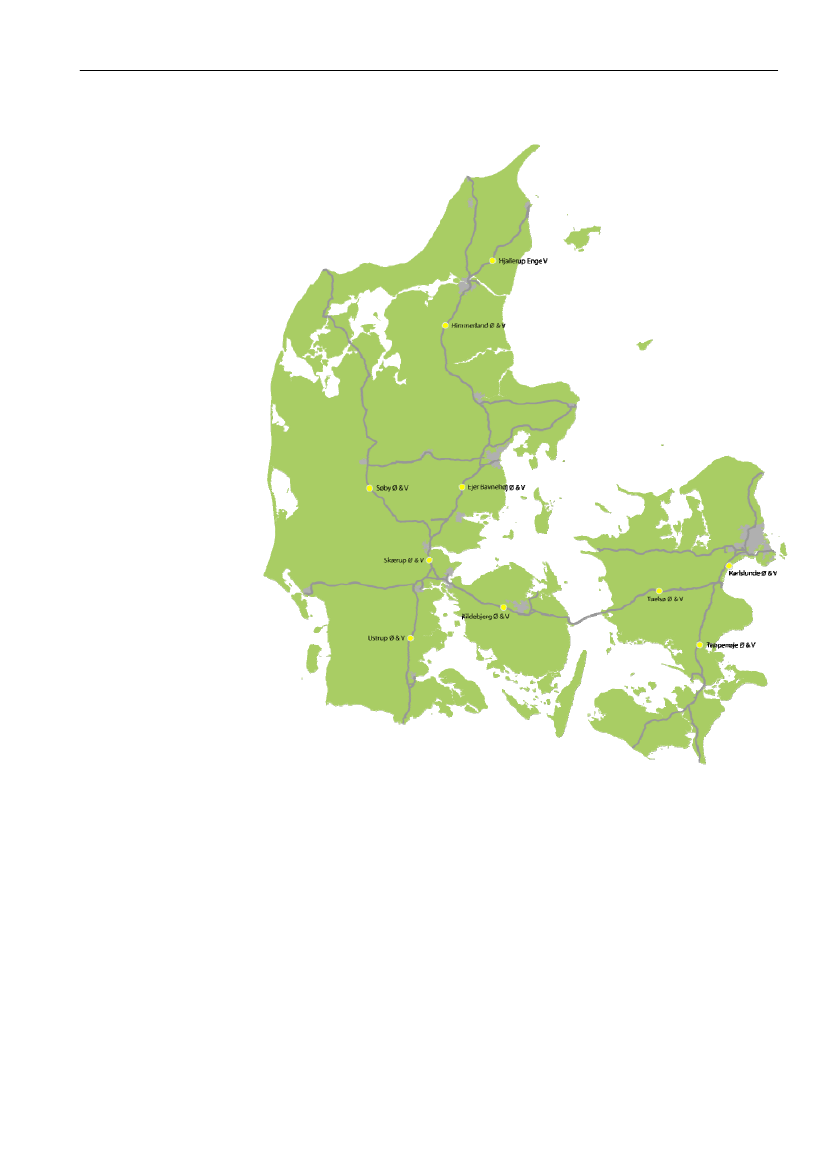
At the moment 17 service areas are part of the EMS vehicle test, and itshould be noted that typically 2 rest areas are located opposite of eachother. The service areas being part of the EMS vehicle test appear from themap in Figure 22.
It may wonder, why solo trucks are driving at a speed above 100 km/h on a numberof partial sections. The measurements in these cases have been checked an extratime and it seems like there are no errors in the data transfer.Tetraplan A/SGrontmij | Carl Bro A/S
17
The Danish Road DirectorateTest with European Modular System – Midway Report
Page 31
Service areas arranged for EMSvehiclesService areas
Figure 22 Service areas where EMS vehicles can park
At all service and rest areas in the country WIM devices are typically in-stalled in the form of semi-permanent stations. It is, however, pure quantitycounts, which do not classify on vehicle type. Consequently the applicationof this data is limited for the present evaluation.The degree ofoccupancy onservice areas isbeing registeredIn recent years the focus has been on the degree of occupancy of the ser-vice areas in the country, which is why the Danish Road Directorate hasstarted to register manually the amount of vehicles applying the service ar-eas for overnight accommodation. The counts to be applied for the midwayreport have been made mid March, end of July and end of October 2009.The counts have been made at night where the degree of occupancy fortrucks is expected to be largest. In connection with the counting the truckswere differentiated according to the following categorisation; Solo trucks,trucks with trailer, semitrailer and EMS vehicles.
Tetraplan A/S
Grontmij | Carl Bro A/S
The Danish Road DirectorateTest with European Modular System – Midway Report
Page 32
The average de-gree of occu-pancy on serviceareas decreasedin 2009
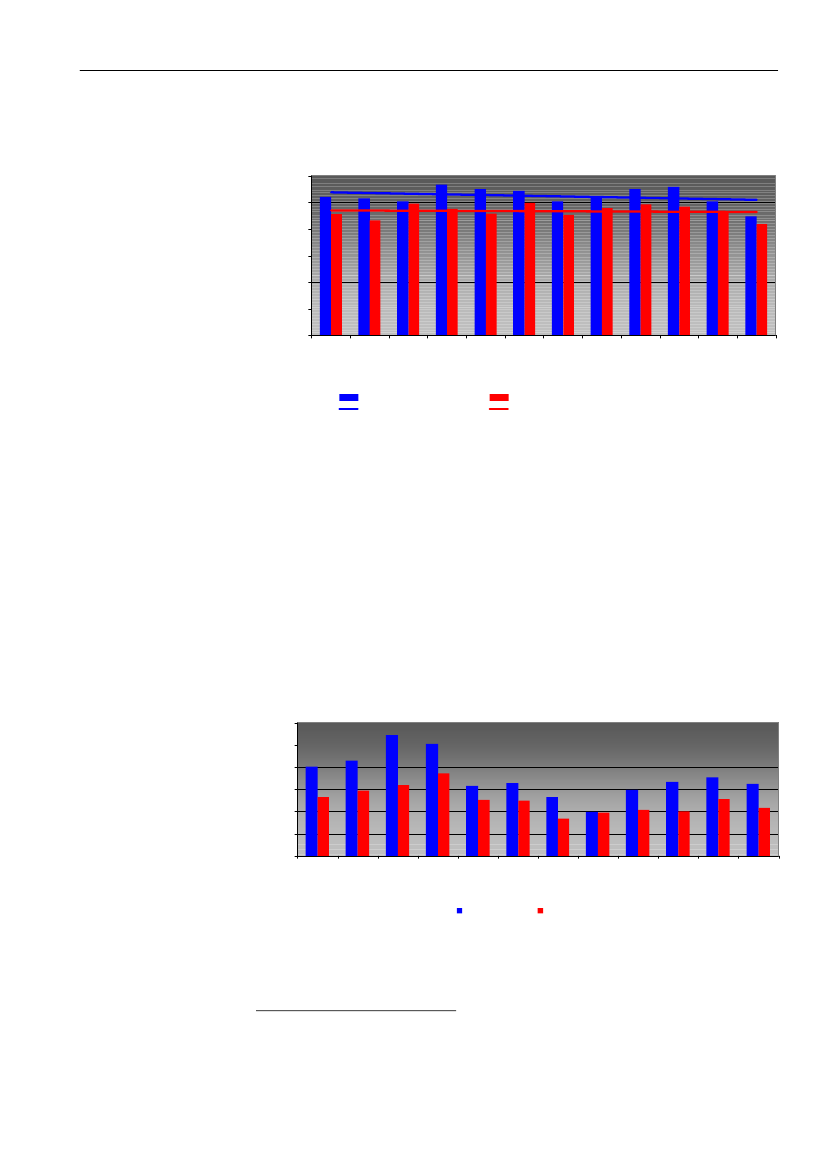
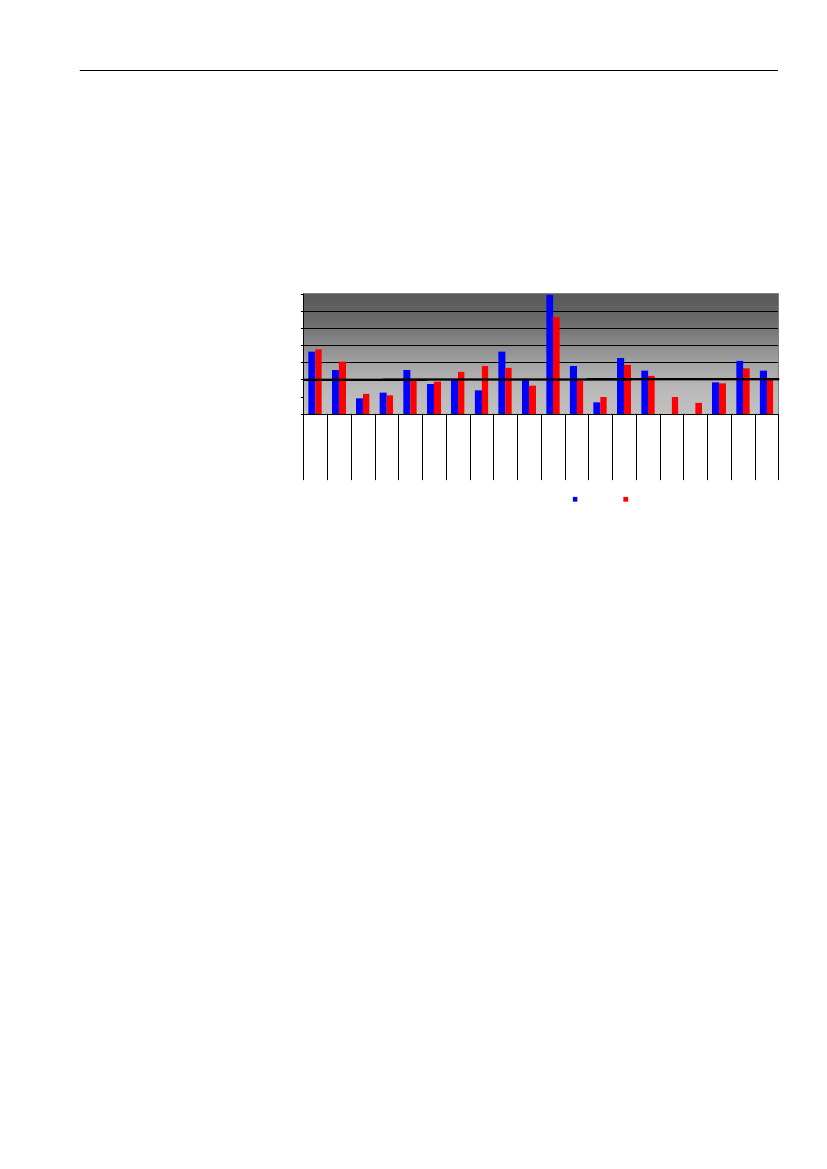
With regard to the 19 service and rest areas being part of the EMS vehicletest the result of the investigation appears from Figure 23. For each restarea the figure shows amount of parking spaces for trucks (designated asthe nominal truck capacity) and the average occupancy percentage for the 3counts. The outer right column shows the average occupancy percentage forall service areas. 100 percent occupancy is indicated with a bold line.Capasity utilization of service areas in 2008 and 2009350Average occupancy percentage300250200150100500TappernøjeØstTappernøjeVestEjerBaunehøj Ø.EjerBaunehøj V.HimmerlandØstHimmerlandVestSøby VestKarlslundeVestKarlslundeØstSøby ØstSkærupVestKildebjergNordTuelsø NordTuelsø SydHjallerupEnge VestSkærup ØstUstrup ØstUstrup VestKildebjergSyd20I alt,gennemsnit:18
18
18
28
28
12
12
12
12
19
21
12
212008
16
17
192009
16
16
33
Service area location(with the nominal truck capasity indicated in figuresl)
Figure 23 Capacity utilization of service and rest areas on the test road network
The degree ofoccupancy fluctu-ates between 30% and 280 %
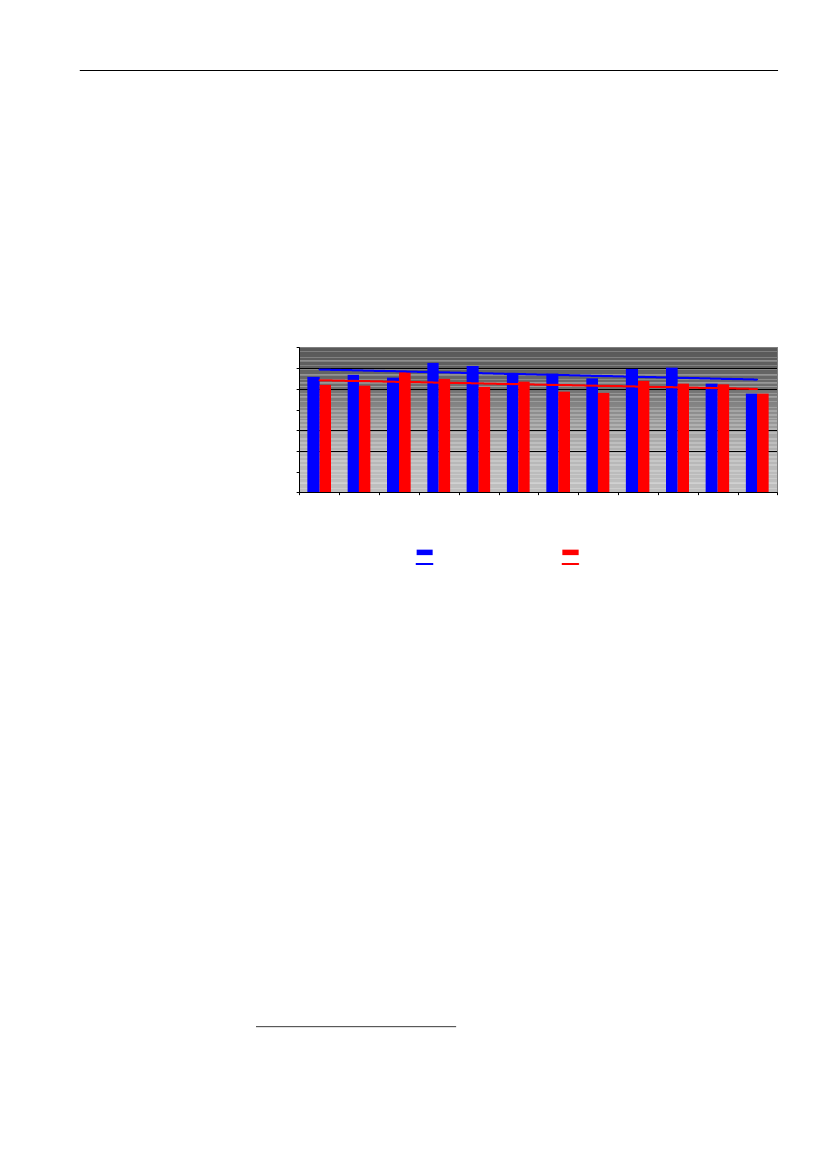
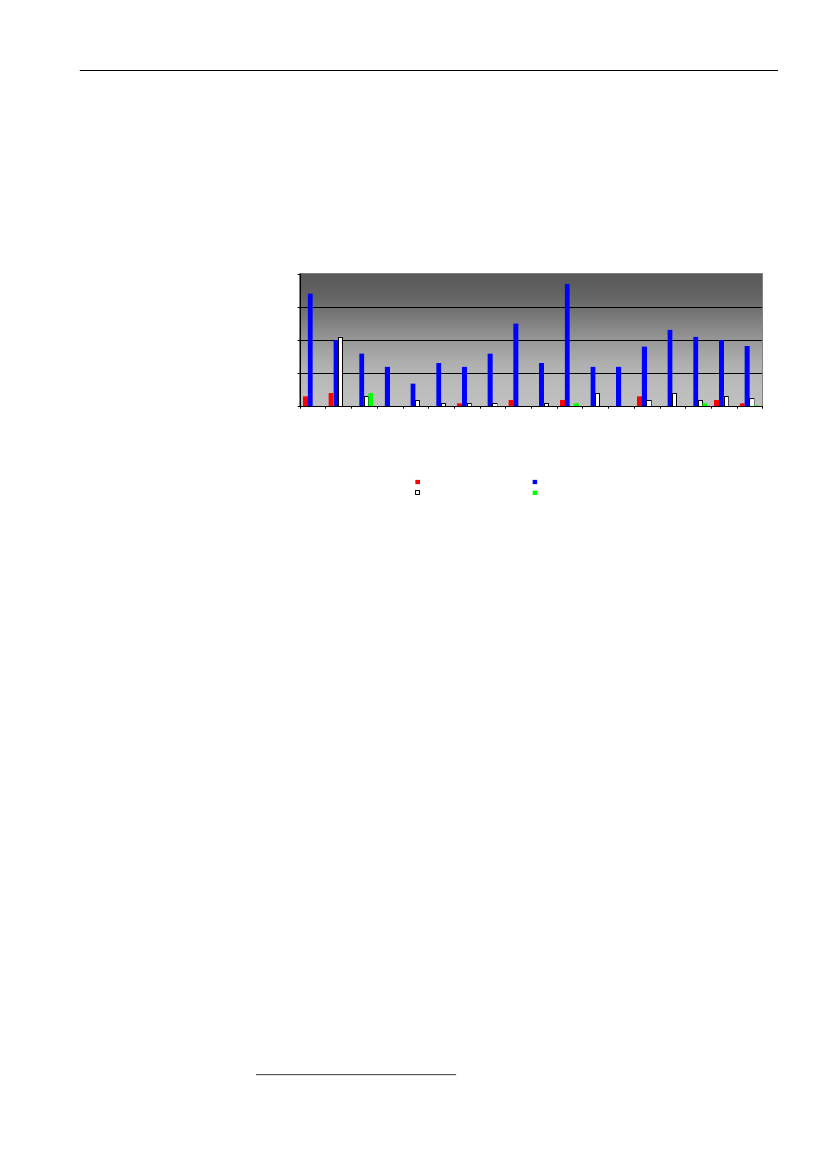
The capacity utilization varies somewhat from service and rest area to ser-vice and rest area in the night. In 2009 the highest utilization percentage wasapprox. 280% in average, which could be found in Skærup East, south ofVejle, while the lowest occupancy percentage was at Søby West, south ofHerning where the occupancy percentage was around 30 % in average.From Figure 23 appears likewise that the average load on the service areaswas higher in 2008 than in 2009. This corresponds with a general decreasein traffic over the recent quarters.Figure 24 shows the distribution of registered trucks on the service areas in2009, and it appears that the amount of EMS vehicles is very limited, whilethe majority is semitrailer road trains. Solo trucks and trucks with trailer forma minor part.
It is still the semi-trailers which areprimarily usingthe service areas
The explanation of this difference should apparently be found in the condi-tion that semitrailer road trains are by far the most widespread road traincombination (not least in international traffic) driving long distance over sev-eral days with a need for overnight accommodation out. Generally thestricter handling and consequently observance of driving time and rest pe-riod regulations seem to have increased the quantity of night staying, alsowith regard to national transports. These will apparently often take place oncarrier centrals etc. after unloading of the vehicle.
Tetraplan A/S
Grontmij | Carl Bro A/S
The Danish Road DirectorateTest with European Modular System – Midway Report
Page 33
In connection with EMS vehicle transports night stayings happens on thetrips between Eastern and Western Denmark18, but this mostly happens inthe logistics centrals which the vehicles are passing; that is not during thetrip but at the end destination. Transport with EMS vehicles through Den-mark can thus typically be performed without longer stays on service areas.Distribution of registered trucks in autumn 200940Amount of registered vehicles
30
20
10
0Ejer BavnehøjØEjer BavnehøjVTappernøjeVestTuelsø NordTuelsø SydTappernøjeØstKildebjergNordKarslundeVestHimmerlandØstHimmerlandVestSkærup VestSkærup ØstHjallerupEnge VestUstrup ØstUstrup VestKildebjergSydKarslunde ØstI altgennemsnit
Service area locationSolo trucksTrucks with trailerSemitrailer road trainsEMS vehicles
Figure 24 Distribution of registered trucks on service areas
It is expected that the Danish Road Directorate will continue to perform thistype of manual data collections throughout the remaining period of the EMSvehicle test.
18
This picture has been characteristic for several of the EMS vehicles being part ofthe first interview and other survey.Grontmij | Carl Bro A/S
Tetraplan A/S
The Danish Road DirectorateTest with European Modular System – Midway Report
Page 34
5
FREIGHT TRAFFIC
If nothing else is mentioned, data in this section has been derived from Sta-tistics Denmark either from Statistiske Efterretninger [StatisticInformation]orStatBank Denmark. A number of figures will contain data from the first 3quarters of 2009, which is the material published to date (March 2010). Insome cases data from the first 3 quarters of 2009 has been recalculated giv-ing an estimate for all of 2009. This makes the figures comparable with thefigures from 2007. In other cases the figures have been made comparableby including the figures for all of 2007, followed by the 3 first quarters in2007, and finally the 3 first quarters of 2009. In a number of cases the des-ignations ”N.A.” or ”–” will be applied which means that data is not available– e.g. because there were no EMS vehicles in 2007 or because data is stillnot available. Finally a ”0” will indicate that data is available and that thequantity has been calculated to zero units.With regard to preparation of the reporting for the final report, space hasbeen reserved in a number of cases in various figures for handling of the de-velopment of EMS vehicles. This has been done in spite of the fact that atthe present time (March 2010) only a relatively small amount of data isavailable on transport with EMS vehicles alone.Special run of thedriver’s log hasbeen performedby StatisticsDenmarkIn connection with the evaluation of the EMS vehicle test a special run of thedriver’s log has been performed solely focusing on the application andspread of EMS vehicles. In order to ensure total anonymity for the respon-dents, Statistics Denmark has been responsible for the distribution of ques-tionnaires and collection of data. The preparation of the questionnaires hasbeen made in close collaboration between Statistics Denmark and theevaluation team with consultation of the haulage trade. The treatment ofdata has been made by the evaluation team.The results of the special run of the driver’s log have been gathered in Ap-pendix 2 B. Here a copy of the questionnaires can be found as well. The re-sults of the investigation will be included currently where it can enrich andvary the other and typically more general analyses of the freight situation.
5.1Approx 2.5bn ve-hicle-km aredriven on theroad network inDenmark
Freight traffic divided nationally and internationally
The freight traffic on the Danish road network is combined by national andinternational traffic19. It is estimated that in 2007 a total of 2.7bn km wasdriven with truck on the Danish road network while in 2008 this had fallen toapprox. 2.6bn km. These kilometres were distributed with 1.7bn km on thenational road network and 0.9bn km on the municipal road network. Fur-thermore it is assessed that in 2008 2bn km of the driven 2.6bn km wereperformed by the national traffic, while the remaining approx. 0.6bn km wereperformed as a part of the international traffic. From 2007 to 2008 theamount of driven vehicle-kilometres has fallen with estimated 3.7 %.
19
In addition to national and international traffic there is transit traffic. As the transittraffic is normally not treated separately by Statistics Denmark, this will as an excep-tion be treated explicit further on.Grontmij | Carl Bro A/S
Tetraplan A/S
The Danish Road DirectorateTest with European Modular System – Midway Report
Page 35
With a certain caution a preliminary estimate is that the national traffic in2009 was approx. 19 % below the level in 2007. The international traffic withDanish vehicles was approx. 10 % below the level in 2007, also compared toFigure 25.All figures inmillion kmDanish vehi-Total trafficForeign vehiclescleswork200200920072009200720092.12,205.National traffic1,74043.2--622199International traf.179275.1-474.1-0Transit haulage3.1-48.3-51.4-2.32,730.Total-366.6-64Figure 25 Traffic work in 2007 and 2009 distributed on Danish and foreign vehicles
The nationalgoods transporthas decreasedwith approx. 28 %from 2008 to2009
The national goods transport in 2ndquarter of 2008 amounted to 46.6 milliontonnes, which in 2nd quarter of 2009 had fallen to 34.6 million tonnes corre-sponding to a fall of approx. 28 %. The transport work has fallen during thesame period from 2.8bn tonne-kilometres to 2.4bn tonne-kilometres, corre-sponding to a fall of approx. 15 %.5.2Freight traffic internationally
ITD’s counts of freight traffic at the border to Germany, the Oresund Bridgeand at the Elsinore – Helsingborg line, show a fall in the amount of vehiclesbetween 2nd quarter of 2008 and 2nd quarter of 2009 of approx. 15 %, seeAppendix 1 as well. It should be noticed that the traffic in 2nd quarter of 2008was the highest registered traffic in the period during which ITD has per-formed the counts. According to the driver’s log statistic the internationalgoods quantity on Danish vehicles fell from 2ndquarter 2008 to 2ndquarter of2009 with approx. 28 %, while the transport work (tonne-km) fell with morethan 30 %. Traffic work fell with approx. 20 %.When comparing the driver’s log and the figures of ITD, please recall thatthe driver’s log solely contains figures for Danish trucks while the counts ofITD comprise all trucks both Danish and foreign. In return the ITD counts donot comprise information about goods quantity and trip distance.The above figures about the development in the international freight trafficindicate that the largest fall can be found in the transported quantity whichhas fallen with 28 %, and in the transport work which has fallen with morethan 30 %. Apparently this means that a smaller goods quantity is trans-ported over somewhat shorter distances than earlier. As the fall in trafficwork is at the same time somewhat smaller than the fall in goods quantityand transport quantity, this should be expected to give a lower capacity utili-zation. A closer analysis of these conditions requires a somewhat more ho-mogeneous data basis, which is why it cannot be carried out before at a latertime, when data for the entire 2009 is present for the various types of freighttraffic.The traffic work isestimated to havefallen with 10 %in 2009 in relationto 2007Tetraplan A/S
In connection with the pre-test situation it has been assessed that in 2007450 million km were driven in Denmark as part of the international transport.A figure which in 2008, as mentioned above, is estimated to have increasedto 500 million km. For 2009 it is still too early to say anything certain aboutthe size of the figure but for the Danish trucks alone there are indications ofa fall of 10 % compared to the figures from 2007.Grontmij | Carl Bro A/S
The Danish Road DirectorateTest with European Modular System – Midway Report
Page 36
Vehicle type
Traffic work performed in Denmark as part ofinternational transport (million km)20073 first quarters of200920135-169-
Danish trucks(Except EMS)Danish EMSForeign trucks(Except EMS)ForeignEMS
200N.A.250N.A.
Total,450-Of these EMSsN.A.Figure 26 Traffic work performed in Denmark as part of international transport dis-tributed acc. to nationality type
Based on data from the first three quarters of 2009, the international trans-port performed with Danish vehicles can for all of 2009 be estimated toapprox. 11 million tonnes. Based on data from ITD and own estimates theinternational traffic performed with foreign vehicles can – with some uncer-tainty – be estimated to 15 million tonnes. The estimated figures for all 2009are based on actual figures for the first 3 quarters of the year.Nationality typeGoods quantities in international transport(million tonnes)2007Transport performed byDanish trucks(except EMS)Transport performed byDanish EMSTransport performed bytrucks registered abroad(Except EMS)213 first quar-ters of 20073 first quarters of2009
13.0
9.6
8.1
N.A.
N.A.
-
18.0
13.5
11.4
Transport performed byEMSs registered abroadTotal- of these EMSs
N.A.31.0N.A.
N.A.23.1N.A.
-19.3-
Figure 27 Goods quantities transported in Denmark as part of international transportdistributed acc. to nationality type
The source of this data is ITD and own estimates. The figures for the total amount oftrucks in 2009, Danish as well as foreign comprise EMS vehicles so far.21For transport performed by trucks registered abroad the figures for the 3 first quar-ters of 2007 are estimated on the basis of all-year data. For 2009 the figure is esti-mated on the basis of the 2007 share.Tetraplan A/SGrontmij | Carl Bro A/S
20
The Danish Road DirectorateTest with European Modular System – Midway Report
Page 37
The goods on the international transports are to a large extent ex-ported/performed by means of semi-trailer, and to some extent by means oftrailer road trains.Share of transported goods ininternational transports2007200922Transport carried out by solo trucks1.5 %-Transport carried out by trailer road trains15.0 %-Transport carried out by semitrailer83.0 %-Transport carried out by EMSsN.A.-Total99.5 %-Figure 28 Share of international transport distributed per truck typeVehicle type
The quantity ofgoods has fallenbut first commod-ity group is stillgeneral goods
Based on enumerated data for 3 quarters of 2009, the international goodsquantity on Danish vehicles can be estimated to approx. 11 million tonnes.The by far largest commodity group comprises general goods.Commodity groups23
Transport quantities (million tonnes)20073 first quar-ters of 20070.83 first quartersof 20091.1
Construction material1.0(gravel, soil, stones,bricks, etc.)Food stuffs2.11.61.3General cargo7.55.64.7Agricultural products1.40.90.6Coal, coke and chemi-0.80.60.5cal productsTotal12.89.58.2Figure 29 Quantities transported goods in international transports distributed incommodity groups.
Generally the ca-pacity utilizationhas grownsmaller
Based on data for the 3 first quarters in 2009, the capacity utilization for all of2009 can cautiously be estimated to be some percentages below the corre-sponding figures in 2007. However it should be noticed that in 2009 the ca-pacity utilization figures have been rather fluctuating.
the figures for 2009 will not be available before a total statement for the year hasbeen made.23It should be noticed that the method for the calculation of commodity groups hasbeen changed by Statistics Denmark between 2007 and 2009. In the figures concern-ing commodity groups the new nomenclature has been applied. This means that thefigures for 2007 cannot be compared with the pre-test report and the midway report.Tetraplan A/SGrontmij | Carl Bro A/S
22
The Danish Road DirectorateTest with European Modular System – Midway Report
Page 38
Truck type
Transport performedby solo trucksTransport performedby trailer road trainTransport performedby semitrailerTransport performedby EMS vehiclesAverage
Capacity utilization forall trips % of tonnes(corrected for volumegoods)2007243 firstquartersin 200928.8 %-(37.2 %)34.5 %-(42.9 %)41.6 %-(46 %)N.A.-
Capacity utilization fortrips with load % oftonnes (corrected forvolume goods)20073 firstquartersin 200933.1 %-(42.7 %)44.7 %-(55.5 %)55.4 %-(61.3 %)N.A.-
40.5 %34.4 %53.7 %45.6 %(45.5 %)(39.5 %)(60.3 %)(52.5 %)Figure 30 Capacity utilization in international transports distributed on truck type
As it appears from Figure 30, the capacity utilization has fallen in the period
25
.
5.35.3.1
The national freight trafficType of transport including capacity utilization
In the following type of transport is understood as transport with various types oftrucks including e.g. whether it is haulage contractor or company transport.In 2007 the national transport work amounted to a total of 11.73 billion tonne-km. For all of 2009 this is estimated to be 10 billion tonne-km.Transport work (billion tonne-km)20073 first quar-3 first quartersters inin 200920072.33--
Transport performed by solotrucksTransport performed by trailer3.00--road trainTransport performed by semi-6.40--trailerTransport performed by EMSN.A.N.A.-Total11.738.87.4Figure 31 Transport work in 2007 and in the first 3 quarters of 2009 distributed ontruck type
The total amount of trips for 2009 is estimated to be 17 million, and the expecta-tion is that the capacity utilization will be approx. 70 % for trips with load.The capacity utilization for 2007 for the various truck types has not been calculatedfor quarters. This is due to the fact that the total average figures for all truck vehicletypes are practically identical for the 3 first quarters of 2007 and for the entire year.This is why Figure 30 did not distinguish between the 3 first quarters of 2007 and theentire year.25This impression is also confirmed by the haulage trade being of the opinion that theindividual order has become smaller but the quantity of orders and thus the amount oftrips has not changed.Tetraplan A/SGrontmij | Carl Bro A/S24
The Danish Road DirectorateTest with European Modular System – Midway Report
Page 39
Amount oftrips with solotrucksAmount oftrips withtrailer roadtrainsAmount oftrips withsemitrailerAmount oftrips withEMS vehiclesTotal
Amount of trips (million)20073 first3 firstquartersquar-in 2007ters in200910.0--
Share of trips with load20073 first3 firstquar-quar-ters inters in2007200975--%70%--
4.1
-
-
7.2
-
-
75%N.A.
-
-
N.A.
-
-
N.A.
-
7472 %69 %%Figure 32 Amount of truck trips and share of trips with load in selected years dis-tributed on truck type
21.3
16.2
12.1
The total goods quantity transported in national transport and performed byDanish trucks amounted to 183,6 million tonnes for all of 2007. For 2009 thecorresponding total figure is estimated to 135 million tonnes.Transported goods quantities (million tonnes)20073 first quarters3 first quarters inin 20072009149.4114.479.9
Transport performedby haulage contrac-torsTransport performed34.223.621.4by company vehiclesTotal183.6138.0101.3Figure 33 The amount of transported goods in 2007 and in the first 3 quarters of2009 distributed on haulage contract and company transport
As it appears from Figure 33, the company vehicles seem to be relativelybetter at handling the competition compared to the haulage contractor vehi-cles. This can possibly be referred to the fact that companies with own vehi-cles in a crisis situation choose to increase the use of those at the expenseof the external vehicles.The goods are transported on various truck combinations but with a clearmajority of road trains.
Tetraplan A/S
Grontmij | Carl Bro A/S
The Danish Road DirectorateTest with European Modular System – Midway Report
Page 40
Transport performedby solo trucksTransport performed48.636.5-by trailer road trainsTransport performed84.763.5-by semitrailersTransport performedN.A.N.A.-by EMS vehiclesTotal183.6138101.3Figure 34 The transported goods quantity in 2007 and in the 3 first quarters of 2009distributed on truck types
Goods quantities transported (million tonnes)20073 first quarters3 first quarters26in 2007in 200950.337.8-
Based on information from the three first quarters of 2009, a minor fall in thecapacity utilization can be seen compared to 2007, cf. also Figure 35.Vehicle typeCapacity utilization for trips with load %of tonnes (% corrected for volume goods)2007273 first quarters in200958.1 % (60.3 %)-56.4 % (57.4 %)70.4 % (71.6 %)N.A.62.6 % (64.2 %)---59.3 % (61 %)
Transport performed by solotrucksTransport performed by trailerroad trainsTransport performed by semi-trailersTransport performed by EMSAverage for trips with load
Haulage contractor owned64.4 % (65.7 %)60.1 % (62 %)transportsCompany vehicle transports56.0 % (58.3 %)56.6 % (57 %)Figure 35 Capacity utilization of trucks in national transports distributed on truck typeand ownership for selected years
5.3.2
Sort of goods
Sort of goods are to be understood as goods distribution in various commod-ity groups.Of the total of 183 million tonnes transported goods construction materialrepresented the largest goods type with a total of 80 million tonnes in 2007.In 2009 the commodity group is expected to be the largest as well, with atotal volume of approx. 52 million tonnes, cf. also Figure 36.
For 2007 the distribution in the 3 first quarters is based on all-year data.Since the capacity utilization for the 3 first quarters of 2007 is practically identicalwith all of 2007, both distributions have not been included in the figure.27
26
Tetraplan A/S
Grontmij | Carl Bro A/S
The Danish Road DirectorateTest with European Modular System – Midway Report
Page 41
Commoditygroups2007 inmilliontonnes
Transported goods quantities2007in %2007, 3firstquar-ters inmilliontonnes61.12007, 3firstquar-ters in%44 %2009, 3firstquar-ters inmilliontonnes40.42009,3 firstquar-ters in%40 %
Constructionmaterials(gravel, earth,stones, bricks,etc.)Food stuffsGeneral goodsAgriculturalproductsCoal, coke, oiland chemicalproductsTotal
80.2
44 %
32.035.527.48.4
17 %19 %15 %5%
23.826.620.56.1
17 %19 %15 %5%
15.723.913.87.5
15 %24 %14 %7%
100138.1101.4100%%Figure 36 Transported goods on truck distributed on commodity groups in selectedyears28
183.5
Food stuffs andgeneral goods aretransported withEMS
On the basis of the special run of the driver’s log mentioned earlier Figure 37has been created showing the distribution on commodity groups among theEMS vehicles included in the special run.Estimated distribution of transported goods on commodity groups9000Goods quantity in tonnes80007000600050004000300020001000Foods, food stuffs, beverage products,tobacco, etc.Removal goods, motor vehicles for repair,etc.Agricultural, forestry and fishing productsTransport means and parts for theseGravel, stones, sand, clay, asphalt
0
Chemical products, fertilizers, etc.
Treated wood, paper, etc.
Textiles and garments
Furniture and other manufactured goods
Machinery and equipment, householdappliances, etc.
Empty containers and swap bodies, etc.
Ore, iron and other metal ores
Eartt, waste and recycling materials
Mineral construction materials
Letters and packages
General goods
Gasolines and other mineral oil products
Figure 37 Distribution in % on commodity groups transported with EMS vehicles
28
Changes in commodity group distribution cause the figures not to be directly compa-rable between 2007 and 2009.Grontmij | Carl Bro A/S
Tetraplan A/S
Unknown goods
Metal goods
Refuse
Coal
The Danish Road DirectorateTest with European Modular System – Midway Report
Page 42
Looking at the similar distribution for trucks with a total weight of more than 6tonnes and the transport in national traffic in 2008, it appears from Figure 38that the largest commodity groups are gravel, stones, clay, etc. foods andfood stuffs, agricultural and fishery products, earth and waste, and construc-tion material29.Goods transported in all trucks distributed on commodity groups25%Share of transported goods in percentage
20%
15%
10%
5%
0%Metal goodsCoalMachinery, household appliances, electrical articles,etc.Agricultural, forestry and fishing productsTreated wood, paper and paper productsGravel, stones, sand, clay, asphaltTextiles and garmentsFurniture and other manufactured goodsOre, iron and other metal oresEarth and wasteChemical products, fertilizers, plactic, rubberLetters and packagesRemoval goodsGeneral goods, mixed goodsFoods, food stuffs, beverage products, tobacco, etc.Gasolines and other mineral oil productsEmpty containers and swap bodies, etc.Transport means and parts for theseUnknown goods, e.g. containersMineral construction materials
Figure 38 Distribution in % on commodity groups transported with all trucks
Only two commodity groups; ”foods, food stuffs, beverages, etc” and ”gen-eral goods” appear in both truck groups in Figure 37 as well as Figure 38with a relatively large share. This stresses the fact that so far EMS vehiclesare primarily applied for transport of a minor amount of commodity groupswhere the strength with regard to volume of the EMS vehicles is apparentlybest exploited for transport of foods and general cargo.
5.3.3EMS trips mainlybetween Easternand WesternDenmark
Applied routes
Figure 39 illustrates that among the questioned companies in the specialrun, the majority of trips is between Eastern and Western Denmark and tripsbetween Northern and Southern Jutland supplemented with trips to accessi-ble destinations in the rest of Scandinavia.The picture is to a large extent similar to the pattern known from semitrailertransports as solo truck transports are typically applied over shorter dis-tances.
It has been decided to apply figures for commodity group from 2008, as the specialrun has been prepared with use of the new commodity group codes which cannot bereferred to commodity group figures for 2007.Tetraplan A/SGrontmij | Carl Bro A/S
29
The Danish Road DirectorateTest with European Modular System – Midway Report
Page 43
Figure 39 Map with postal code relations with 10 or more trips made with EMS vehi-cles in the counting week
5.3.4Brøndby is themost applied des-tination
Destinations
Data forming the basis of Figure 39 illustrates that the questioned compa-nies in the special run has 57 locations from where they drive with EMS ve-hicles, of these 16 are foreign, while 53 destinations are end destinations ofwhich 17 are foreign30.
Pursuant to ”The executive order for transport with EMS vehicles” (December 2009)there are 69 locations, from where EMS vehicles can drive from/to, including 19 ser-vice areas. If we look at Danish start locations alone, transport is done from 41 loca-tions and if the 19 service areas are excluded, 9 locations in the special run in thecounting week are not applied by EMS vehicles within this particular week.Tetraplan A/SGrontmij | Carl Bro A/S
30
The Danish Road DirectorateTest with European Modular System – Midway Report
Page 44
Most often applied end destinations(out of a total of 282 trips)QuantityPercentageBrøndby3412 %Tåstrup259%Padborg217%Vejle197%Glostrup166%Køge176%Kolding135%Odense SØ124%Herning104%Fredericia104%Aalborg104%Total18766 %Figure 40 End destinations with a frequency of 10 or more for EMS vehicles31
Figure 40 shows the end destinations for EMS vehicles from the questionedcompanies with a frequency of 10 and more. All destinations are cities of acertain size and they all have either a transport terminal, a port, large com-panies or a combination of these. Taking the 11 most frequent destinationsgives a picture of 66 % of the end destinations. Among foreign end destina-tions Oslo is the most important one with 7 trips ending here. Further downthe table some Swedish cities with 3 and 2 trips ending there are listed.
5.3.5
Trips distances
A comparison between trip distance and capacity utilization in the pre-testsituation showed that the best capacity utilization could mainly be found onthe long distance trips and for transport with haulage contractor vehicles.However, it has not been possible to update the corresponding figures fortrip length and capacity utilization for 2009, which is why it is still not possibleto conclude on, whether this pattern has changed.Good capacityutilization but stillpotential for opti-mizationIn the same way it was illustrated for the pre-test situation what the capacityutilization was for haulage contractor vehicles and company vehicles forvarious section lengths respectively. It has, however, turned out that thistype of statement can still not be updated for 2009. With regard to the pre-test situation in 2007, reasonable capacity utilization was revealed, but theo-retically there is a certain unused potential especially on shorter trips andespecially with regard to company vehicles.
It should be noticed that postal codes for end destinations were asked for, which iswhy postal codes can cover more locations. E.g. ”Brøndby” can cover 3 different inter-change locations.Tetraplan A/SGrontmij | Carl Bro A/S
31
The Danish Road DirectorateTest with European Modular System – Midway Report
Page 45
On the basis of the performed special run of the driver’s log, Figure 41 hasbeen created. The figure illustrates that there is no direct connection betweengoods weight and trip distance. On the contrary the figure illustrates that thereis a tendency that EMS vehicles of type 3 (the link-trailer) is applied on shorterdistances; while the modular combination type 1 (dolly) is applied on longerdistances.Relationship between trip distance and goods weight with EMS vehicles403530Goods weight in tonnes25201510500200400600800100012001400160018002000Trip distance in km
Type 3 (Link-trailer)
Type 1 (Dolly)
Type 2 (Central axle trailer)Type 2 (Central axle trailer)
Figure 41 Relation between trip distance and goods weight for EMS vehicles in thespecial run32
Especially type 1(dolly) is appliedfor long distancetrips
A possible explanation can be that type 1 is primarily applied for terminaltransport, while type 3 is to a large extent applied when all goods are for onecustomer. At the same time it should be notices that relatively many longtrips with low goods weight may be an expression for volume goods wherethe road train with regard to volume has been well-exploited without this hav-ing an effect on the weight. However, the opposite possibility is also present,as the special combination of EMS vehicle units could mean that a haulagecontractor sometimes chooses to drive with e.g. an empty link-trailer in orderto have this returned even if there is not goods onboard, but simply becauseit is going to be used for a modular combination e.g. the day after. This muste.g. be assumed to be the case on the long distance trips where the goodsweight is 0.However, comparing Figure 41 and Figure 42, the same pattern is seen asthere is a concentration of trips between 100 and 500 km, where especiallytype 1 (dollies) travels the longest distances33
Share of trips
It should be mentioned that a ”dot” in the figure can contain more trips.In principle type 2 (central axle trailer) travels rather long distances as well. But asthere are relatively few of these, it is not that significant.33
32
Tetraplan A/SType 2 (Cen-tral axle trailer)
Grontmij | Carl Bro A/S
Type 3 (Link-trailer)
Type 1
All units
The Danish Road DirectorateTest with European Modular System – Midway Report
Page 46
Distribution of trips distances grouped in unit types60,0%
50,0%
40,0%Share of trips
30,0%
20,0%
10,0%
0,0%0 - 50 km50 - 100 km100 - 200 km 200 - 500 kmTrip distanceType 3 (Link-trailer)Type 1 (Dolly)Type 2 (Central axle trailer)All units>500 km
Figure 42 Trip distances for various types of EMS vehicle units
In addition to the above should be added that as a main rule existing transportswith traditional road trains are replaced by EMS vehicles, which is why there areno immediate changes in the travelling patterns, distances, etc. and therefore nofundamental changes in the transport and traffic picture. Basically it should,however, still be assumed that especially longer trips are performed by EMSvehicles even if this pattern should change concurrently with the extension ofthe accessible road network and the fact that the road trains can to a larger ex-tent travel from a to b without interchanges.
5.3.6
Interchange patterns
Interchanging of EMS vehicles for transport as separated units ins done partlyaccording to the same system as is known from transport with traditional roadtrains in the haulier system and partly as transport with full loads34.The interchangepattern resemblesthe interchangepattern from othertruck transportsIn the first-mentioned case it is a question about the EMS vehicle travelling be-tween e.g. two goods terminals and are then interchanged in the terminal. Onunit (often a traditional solo truck) continues the transport as a distribution vehi-cle and delivers/collects cargo from a number of customers but (typically) thesemitrailer remains at the terminal where it is unloaded and then loaded againwith cargo from the terminal. In other words it is a question about a systemwhich only marginally differs from a traditional combination performed with (thesame) solo truck and a traditional trailer.
In Appendix 3 C, which refers to a number of interviews with hauling companies anddrivers of EMS vehicles, a number of illustrative examples of interchange patterns canbe found.Tetraplan A/SGrontmij | Carl Bro A/S
34
The Danish Road DirectorateTest with European Modular System – Midway Report
Page 47
In the other case the entire EMS vehicle must arrive at a customer but limita-tions on the road network makes this impossible. In such situations link-trailerbased solutions are often applied, where the long road train can be inter-changed and travel separately to the customer with the same tractor. This typeof transport can be reduced if the road network for EMS vehicles was extendedand included more company solutions.
Interchange isdone on many lo-cations, howevermostly at trans-port centres
Figure 43 lists the locations where companies, which took part in the specialrun, perform their EMS vehicles interchange. The figures show that inter-change is performed at a variety of locations, where the transport centresaccount for the largest part with 40 %, while private terminals, ports and ser-vice and rest areas play a minor but not unimportant role with 20 %, 17 %and 13 %, respectively.LocationsAmount ofcompanies13Ports10Service and rest areas30Transport centres15Private terminals2Toll stations1Industry areas4Did not make interchanges75TotalFigure 43 Interchange locations for EMS vehicle)
17 %13 %40 %20%3%1%5%100 %
5.3.7EMSs results intransfer of goodsfrom other trucktypes
Effect evaluation of changed capacity utilization and replacement ofgoods transport
An important issue in relation to the use of EMS vehicles is the assessmentof whether they replace existing road trains and the transport performed bythese or whether they generate new cargo transport on the roads. Based onthe conducted interviews, own observations on the transport centres, serviceand rest areas and road network of vehicle types, ownership, etc. the indica-tions are clear that it is a question about a transfer of cargo from existingroad trains.Good examples of this are the transports performed by e.g. DanskeFragtmænd, Transportgruppen, Frode Laursen and Alex Andersen Ølund.Here the EMS vehicles are involved totally on par with other road trains fore.g. transport between Eastern and Western Denmark. However except fortransport of very heavy products (such as paint), in which cases the EMSvehicles volume capacity cannot be exploited. The transport tasks are oftensolved by implementing e.g. one or two EMS vehicles ”supplemented” by anumber of traditional road trains.Often the EMS vehicle drives first, which may be due to the fact that it isfilled up first or it takes longer time to unload this vehicle as a consequenceof the subsequent interchange at the end destination. In such cases a 100 %capacity utilization of the EMS vehicles is often worked with, which meansthat it can reduce the capacity utilization on the traditional road trains sup-plementing the transport.
Tetraplan A/S
Grontmij | Carl Bro A/S
The Danish Road DirectorateTest with European Modular System – Midway Report
Page 48
The above evaluations have been confirmed by the conducted interviewswith haulage companies and drivers (see also Appendix 3 C), as well asthey appear from the data collected from the special run (see Appendix 2 B).Relationship between trip distance and utilization of EMS vehicles100%
80%
Load capasity conditions
60%
40%
20%Trip distance in kmType 3 (link-trailer)type 1(Dolly)Type 2 (Central axle trailer)
0%0200400600800100012001400160018002000Trip distance in kmType 3 (Link-trailer)Type 1 (Dolly)Type 2 (Central axle trailer)
Figure 44 The relation between trip distance and loading for EMS vehicles
On the basis of the results from the special run of the driver’s log, referred inAppendix 2 B, Figure 44 has been created. The figure illustrates the relationbetween the loading degree, measured in potential tonnes that can beloaded and the actual capacity utilization35. The figure illustrates that thereare no direct relation between loading degree and trip distance. However thefigures reveal that the dolly combinations are applied on the longest trips. Inthat case further investigations must be conducted in order to uncoverwhether this can be referred to the individual vehicle types’ flexibility andother conditions.Figure 45 shows the distribution of capacity utilization on EMS vehiclesstated on the basis of data of the special run (see Appendix 2 B). The state-ment covers all trips.Per-Average capacity utilizationcentageEMS type 1(dolly)47 %EMS type 2 (centre axle trailer)28 %EMS type 3 (link-trailer)42 %Figure 45 Average capacity utilization on EMS vehicles35
The unloading frequency measured in potential tonnes has been made on the basisof a cargo carrying capacity of 39 tonnes. The 39 tonnes has been found as an aver-age on the basis of the actual savings given by the respondents in the special run ofthe driver’s log.Grontmij | Carl Bro A/S
Tetraplan A/S
The Danish Road DirectorateTest with European Modular System – Midway Report
Page 49
EMS are to alarge extent ap-plied for volumegoods transports
It should be mentioned that in the above Figure 45 no corrections have beenmade for volume goods. In return the following Figure 46 elaborates on theissue in relation to the capacity utilization of EMS vehicles. As appears fromthe figure, a rather considerable part of the transported goods are volumegoods, as 44 % has been stated as tonne-km. For a number of commoditygroups it is a question about that even up to 100 % is volume goods. Therather high volume goods share in combination with the corresponding lowshare of heavy cargo within e.g. the commodity group ”earth, waste and re-cycling materials” gives a clear indication of the fact that the real capacityutilization for EMS vehicles is higher than stated in Figure 45. When the totalannual figures for 2009 from Statistics Denmark are ready, it will be possibleto carry out a comparing analysis of the ”volume goods corrected” capacityutilization on traditional road trains and EMS vehicles.
Commod-ity group1567121415161719
Goods typeAgricultural, forestry andfishery productsFoods, food stuffs, bev-erage, etc.Textiles and textileproducts, etc.Worked wood, paper,etc.Machines and equip-ment, white goods, etc.Furniture and other fin-ished productsEarth, waste and recy-cling materialsLetters and packagesEmpty containers andswap body, etc.General cargoTotal
Transportwork in EMStotal (1000tonne-km)2221314418104289481,270
As volumegoods intonnes0004018042648755636
Share in %0%0%0%100 %0%100 %0%100 %74 %51 %44 %
Figure 46 Share of volume goods for the various goods types
The capacity utili-zation in EMS issomewhat lowerthan in trucks ingeneral whencalculated inweight and notvolume
In spite of the fact that the expectation was that EMS vehicles would gener-ally have a higher capacity utilization than other truck combinations, a com-parison between Figure 35 showing the capacity utilization of trucks in na-tional transports and Figure 45, reveals that the capacity utilization based ondata in the special run seems to be lower for EMS vehicles than for trucks ingeneral.
It should be noticed that the figure only includes trips where the commodity groupsare indicated.Tetraplan A/SGrontmij | Carl Bro A/S
36
The Danish Road DirectorateTest with European Modular System – Midway Report
Page 50
The lower capacity utilization may be due to the fact that the capacity calcu-lation for EMS vehicles has solely been prepared on the basis of weight indi-cations. As EMS vehicles often transport volume goods, cf. above Figure 37,this may mean that the capacity utilization is larger than the figures in Figure45 indicate. An explanation of a somewhat lower capacity utilization for EMSvehicles than for trucks could also be the flow imbalance between Easternand Western Denmark, where EMS vehicles often travel empty in the west-ern bound flows. As we are talking about relatively expensive units, such aslink-trailers, it will apparently often be attractive to have these returned evenwhen travelling empty.The above considerations on capacity utilization of EMS vehicles will bestudied closer in the further evaluation process.Finally two conditions about the effect evaluation of the introduction of EMSvehicles should be mentioned:In 2009 EMStransported anestimated amountof 0.8 % of thenational goods-On the basis of Appendix 2 B referring to the special run of thedriver’s log, the respondents have answered that in the countingweek they transported 17,400 tonnes goods on EMS vehicles. This isassumed to have been performed by 269 EMS vehicle units. Pro-vided that the counting week is regarded as a normal week and the269 EMS vehicle units amount to 85 % of the total amount of regis-tered units of 316, this will correspond to a transport estimate of1,060,800 tonnes cargo on EMS vehicles on an annual basis37.Based on a total quantity of estimated transported cargo on trucks in2009 amounting to 135 million tonnes, this corresponds to EMS vehi-cles transporting 0.8 % of the total quantity of national cargo in 2009.On the basis of enclosure 2 B it also appears that in the countingweek the 52 reported EMS vehicle units travelled approx. 82,000 km.Based on the fact that at the end of 2009 there were 316 registeredEMS vehicle units in the Central Register for Motor Vehicles and that85 % of these can be expected to have been travelling as EMS vehi-cles, an estimate would be that EMS vehicles potentially travel22,000,000 km annually. All in all it is expected that in 2009 2.4 bil-lion km will be travelled with trucks in national traffic and of these itcan be estimated that EMS vehicles will account for 0.9 % of the traf-fic work performed in Denmark.
In 2009 EMS per-formed an esti-mated amount oftraffic work of 0.9%
-
37
In the calculation example it is presumed that all 316 registered EMS vehicle unitsare driving as EMS vehicles. This is hardly realistic, but in the great picture this is notthat important.Grontmij | Carl Bro A/S
Tetraplan A/S
The Danish Road DirectorateTest with European Modular System – Midway Report
Page 51
66.1
TRAFFIC SAFETYAccidents
In Appendix 4 and 5 a number of master files are shown. The master files inAppendix 4 deals with the individual partial sections into which the road net-work for EMS vehicles is divided. Each master file shows annual averagedaily traffic as well as accident figures for the partial section in question.Master files in Appendix 5 are grouped according to the locations whichhave been reconstructed in connection with the introduction of EMS vehi-cles. In each master file the performed reconstruction(s) is illustrated andafter this follows a survey of accident figures for the location in question.On the basis of master files in enclosure 5 the amount of accidents with per-sonal injuries and material damage are calculated for 2 five-year periods.The result appears from Figure 47.
Phase
Amountof loca-tions
Phase621Phase8870532411922Total15010979339284Figure 47 Amount of accidents on reconstructed locations in two different periods
Accidents with personalinjuries2003 -2005 –200720093926
Accidents with materialdamage2003 -2005 –200720099892
The amount of both types of accident has decreased over the years.Whether this is an expression of a general tendency or local conditions onthe given locations have not been studied further. When analysing the pic-ture of accidents for the reconstructed locations this is due to the fact thatthe traffic safety conditions in general in connection with e.g. reconstructionof a roundabout have been changed in order to facilitate the passage withEMS vehicles. But at the same time the passage has also become easierand in principle made a higher speed possible for other vehicle types.Even if the total amount of accidents has fallen a closer study of the materialin Appendix 5 reveals that this fall covers over a bred variety in the devel-opment. Actually the amount of accidents during 2009 has increased at anumber of the reconstructed locations which has especially involved pas-senger cars. Since it is a question about very small variations and since it isonly a question about one single year’s fluctuation, it is too early to speakabout a pattern or a trend. In the introduction to Appendix 5 these locationshave been sketched.No accidents reg-istered with EMSIt should be mentioned that since the start of the EMS vehicle test, no acci-dents involving EMS vehicles have been registered.
Tetraplan A/S
Grontmij | Carl Bro A/S
The Danish Road DirectorateTest with European Modular System – Midway Report
Page 52
6.2100 persons fromDCF have re-ceived a ques-tionnaire aboutEMSs
Risk analysis
At the national congress of the Danish Cyclist Federation (DCF) in October2009 a questionnaire was distributed to all approx. 100 delegates in agree-ment with DCF’s Secretariat.The introduction of the questionnaire comprised a brief description of EMSvehicles including the EMS vehicle test. The entire questionnaire in its origi-nal form is shown at the end of Appendix 3 A.73 persons have replied to the questionnaire and the major part (62 %)comes from Region Hovedstaden (Capital region) and Region Sjælland (Re-gion Sealand).
Only few cyclistshave registered aEMS in the traffic
However only very few have seen an EMS vehicle in the traffic which is whywe have chosen to postpone focus group interviews.For further details on the replies to the questionnaire for the DCF delegates,please refer to Appendix 3 A.Furthermore contact has been established with FDM (Federation of DanishCar-owners) with the same purpose – to have a survey of the possible dan-gerous situations between motorists and EMS vehicles. Here the conclusionis also that there is not enough experience at the moment which is why afocus interview will be conducted later this year, when more experience hasbeen gained by the motorists.A final issue which will be studied closer in the further evaluation is whetherit is possible to estimate the expected amount of accidents per driven tonne-km, in order to make a subsequent comparison as to how this estimate will“normally” develop and how it actually did develop during the test period.
Tetraplan A/S
Grontmij | Carl Bro A/S
The Danish Road DirectorateTest with European Modular System – Midway Report
Page 53
7Environmentalconditions fromthe pre-test reportcannot just becompared withthe situation oftoday
ENVIRONMENTAL CONDITIONS
On the basis of the traffic figures for the individual road sections in the EMSvehicle road network, as these are displayed in principle in enclosure 4, it ispossible to calculate the emission of various air contaminating substancesfrom the freight traffic, as well as the noise effect can be calculated. How-ever, there is a number of WIM devices being part of Appendix 4 where EMSvehicles are not registered. In order to be able to compare the figures be-tween the pre-test situation and the midway situation, only traffic values fromthe WIM devices where the results from 2008 and 2009 can be comparedhave been included. This means that environmental conditions in the mid-way report are assessed on the basis of much fewer WIM devices than inthe pre-test report. Therefore the total evaluation of the environmental condi-tions of the two reports cannot be compared.
7.1
Air pollution and climate impacts
With regard to air pollution a calculation of the emission of a number of airpolluting substances has been performed. Apart from these substances acalculation of the CO2emission has been calculated, which has an impacton the climate. The individual substances and their negative environmentalimpacts are described in detail in Appendix 6.For each of the air polluting substances a calculation of the emission ofthese has been made for relevant road sections. These calculations are tak-ing the following 5 parameters into account:Estimated emission factors for year 2006-2008 for each vehicle typeWIM counts from 2008 and 2009 respectivly in the form of figures forthe annual average daily trafficThe various vehicle types forming part of the figures for the annual av-erage daily trafficRoad sectionsSpeedsOn the basis of the setup emission factors, sections and traffic figures a theo-retical calculation of the emissions for the individual sections and the total for allsections has been made. The results of the calculation appear on Figure 48.SubstanceNOXCOHCPASO2CO22008tonnes81791110462122311,062,0002009tonnes7555102542611228981,000
Figure 48 Calculated emissions for individual sections and as a totalTetraplan A/SGrontmij | Carl Bro A/S
The Danish Road DirectorateTest with European Modular System – Midway Report
Page 54
The freight trafficfell from 2008 to2009 so did theemissions
From Figure 48 appears that from 2008 to 2009 there has been a fall in theemissions of approx. 8 %.Considering the emission of CO2the annual emission is approx. 1 milliontonnes. Every Dane emits approx. 10 tonnes CO2per year. The emission forthe calculated traffic volume thus corresponds to approx. 100,000 persons’annual emissions. The difference between 2008 and 2009 corresponds toapprox. 8000 persons’ emissions.It should be notices that the above calculations have been performed on thebasis of the methodical considerations which have been accounted for indetail in Appendix 6. Whether these calculations are 100 % correct is notimportant as mainly it is a question about conditions to be compared be-tween the pre-test situation and data from later periods in the evaluation.In connection with the calculations performed for the pre-test situation basedon traffic values for 2008, the total CO2emission was calculated to 870,000tonnes CO2. Due to the fact that the calculations in the pre-test report arebased on traffic values for some other road sections than for the midway re-port, these figures for emissions cannot be compared directly38.On the basis of various interviews with companies and drivers using EMSvehicles, it has been possible to qualify the above more theoretic goingthrough of the released emissions. Therefore it is possible to come withsome more realistic and preliminary assessments of the effect of the air pol-lution as a consequence of EMS vehicles.
More conditionsare of importancefor the extent ofthe truck air pollu-tion
A direct comparison of air pollution between traditional road trains and EMSvehicles is however made difficult by two conditions:-There is a tendency that haulage companies in a number of caseshave purchased tractors with more motor power than normal, that iswith 500/540 hp against normally 440/460 hp. In addition to this thenewly purchased units comply with the requirements to Euro stan-dards 4 or 5, while the earlier units only complied with the require-ments of Euronorm 3.39In addition to this the tendency is, apparently as an expression of giv-ing a certain signal value, that in general the EMS vehicle travellingspeed is slightly slower because the speed limiters of these vehicleshave been set to 85 km/h against normally 92 km/h.
-
The above conditions are of importance for the evaluation of environmentalimpacts and pulls up and down with regard to energy consumption andemissions. The following example must of course be subject to some reser-vation and is as such just intended as an example. Based on the informationfrom a haulage company experienced in driving with various vehicle combi-nations, the following consumption figures can be calculated under the pre-condition of equal conditions with regard to speed (set to 85 km/h):As mentioned elsewhere in the report, it has not been possible to register the EMSvehicles on the originally planned sections which were included in the pre-test report.39Among trade people there is a discussion about whether an Euronorm 5 truck ismore economic with regard to fuel that an Euronorm 3 truck. In principle this should bethe case. However there are so many conditions influencing the total fuel economythat it is not necessarily a question about an unambiguous situation.Tetraplan A/SGrontmij | Carl Bro A/S38
The Danish Road DirectorateTest with European Modular System – Midway Report
Page 55
-
-
Traditional road trains with a tractor combination with a total weight of48 tonnes and with a 440 hp motor, the motor is assessed to drive2.8 km/l.EMS vehicles with a total weight of 60 tonnes and 500 hp in motorpower are assessed to drive 2.5 – 2.6 km/l.
The additional consumption for the EMS vehicle is approx. 10 % per drivenkilometres. If this is compared with the increased total weight inclusive of anincreased carrying capacity calculated in tonnes of approx. 7 tonnes (from32 tonnes to 39 tonnes corresponding to approx. %) and a volume capacityincrease of approx. 40 % (from typically 32/36 pallet spaces in a road trainstructured with single stack), the example reveals that it is a question aboutrather considerable energy and environmental gains, as the additional con-sumption for a EMS vehicle is approx. 10 % per travelled kilometre, whilewith regard to load it can load approx. 22 % more than an ordinary road trainand has a volume capacity of up to 40 % more than an ordinary road train.
7.2
Noise effect
In continuation of the pre-test report, where the noise effect on a number ofselected sections was investigated prior to the start of the test period, thenoise conditions have been investigated again in the present report. Theconsequences with regard to noise are elucidated through calculation of thenoise effect from the heavy traffic on selected sections.The noise calculations are made primarily for motorway sections all over thecountry and the results for the individual partial sections are compared withthe results from the pre-test report.In order to compare the noise distribution under conditions with conventionaltrucks (2008) and conditions with conventional road trains and EMS vehicles(2009), the 58 dB lines for both 2008 and 2009 are examined. In Appendix 7about noise load a closer review of the technical precondition of the calcula-tions of the noise conditions can be found.The calculation results specifying the 58 dB line with the WIM counts forboth 2008 and 2009 can be seen in detail at the end of Appendix 7.The calculation results indicate very modest changes in the noise load of upto approx. -1 dB, however with the exception of a few sections. The few ma-jor deviations are provided by considerable changes in the traffic values forthe road sections. Generally the noise effect decreases slightly on the major-ity of the sections. This may have a connection with a general reduction inthe amount of vehicles on the Danish roads due to a broad financial reces-sion which must be expected to affect the goods transport with trucks.
Tetraplan A/S
Grontmij | Carl Bro A/S
The Danish Road DirectorateTest with European Modular System – Midway Report
Page 56
8
FINANCIAL CONDITIONS
In connection with the midway reporting primarily data on construction costsin continuation of various reconstructions on the road network has been col-lected. In a few cases it has been decided whether performed reconstruc-tions result in changed operation costs for maintenance and in that case howlarge these will be. At the present time data has not been collected system-atically and it is therefore too early to report on these conditions.During the evaluation and with a view to being able to assess a number offinancial conditions on goods economy and the national economy in the finalreport, the collection of data within the following areas is currently in focus:----Operation costs in connection with driving with EMS vehiclesOperation costs of reconstructions on the road networkOperation costs in connection with road wear changes as a conse-quence of changed total weights for the vehiclesAccident costs which must be evaluated on the basis of the accidentstatistics.
As mentioned above, data has not yet been collected systematically withinthese areas, and therefore nothing specific can be said about the develop-ment within these areas in the midway report.
Tetraplan A/S
Grontmij | Carl Bro A/S
Appendix 1: Traffic statistics
The Danish Road DirectorateTest with European Modular System – Midway ReportAppendix 1: Ferry-, bridge- and service area statistics
Page 1
Midway ReportAppendix 1: Ferry-, Bridge- and Service area statistics1. A Ferry statisticTable 1: Ferried trucks on lines between Elsinore and HelsingborgTruckno/trailerJanTo ElsinoreTo HelsingborgFebTo ElsinoreTo HelsingborgMarTo ElsinoreTo HelsingborgAprTo ElsinoreTo HelsingborgMayTo ElsinoreTo HelsingborgJunTo ElsinoreTo HelsingborgJulTo ElsinoreTo HelsingborgAugTo ElsinoreTo HelsingborgSepTo ElsinoreTo Helsingborg1,2751,3051,2671,3691,5431,4991,5181,5431,8501,9681,9601,9231,6521,6241,6981,7792,5912,599Trucksw/trailer1,0321,3251,0461,2911,2401,5901,0891,3981,1761,5231,2451,5501,0141,3761,0621,4591,3821,712Semitrailerw/tractor11,39811,44410,50510,94411,82312,17611,32811,13411,07211,70511,38011,74010,28110,57210,99310,96511,27611,302Semitrailerno/tractor------------------EMS vehiclew/tractor131128120117144155213193270196245224220187225251259248EMS vehicleno/tractor------------------
Tetraplan A/S
Grontmij | Carl Bro A/S
The Danish Road DirectorateTest with European Modular System – Midway ReportAppendix 1: Ferry-, bridge- and service area statistics
Page 2
Table 2: Ferried trucks on the line between Frederikshavn and GothenburgTruckno/trailerJanTo FrederikshavnTo GothenburgFebTo FrederikshavnTo GothenburgMarTo FrederikshavnTo GothenburgAprTo FrederikshavnTo GothenburgMayTo FrederikshavnTo GothenburgJunTo FrederikshavnTo GothenburgJulTo FrederikshavnTo GothenburgAugTo FrederikshavnTo GothenburgSepTo FrederikshavnTo Gothenburg248626226210251255234267242248289284329262301247328291Trucksw/trailer5,0564,5254,7274,3335,0674,6994,8044,4265,1034,6125,1894,7134,5624,0454,9594,8455,5215,180Semitrailerw/tractor411407415374433454408433434410541566444416507461590518Semitrailerno/tractor546574463470437405438438515510479439323315412405435450EMS vehiclew/tractor14133029405450486814586122497777969393EMS vehicleno/tractor------------------
Tetraplan A/S
Grontmij | Carl Bro A/S
The Danish Road DirectorateTest with European Modular System – Midway ReportAppendix 1: Ferry-, bridge- and service area statistics
Page 3
Table 3: Ferried trucks on the line between Grenaa and VarbergTruckno/trailerJanTo GrenaaTo VarbergFebTo GrenaaTo VarbergMarTo GrenaaTo VarbergAprTo GrenaaTo VarbergMayTo GrenaaTo VarbergJunTo GrenaaTo VarbergJulTo GrenaaTo VarbergAugTo GrenaaTo VarbergSepTo GrenaaTo Varberg9824124030242617273736293126213436Trucksw/trailer7499621,0861,2801,4671,7071,2751,4271,1941,4371,2791,5179679421,1541,3231,3431,619Semitrailerw/tractor333835396132373437474847242931334332Semitrailerno/tractor204169293261230200220188244239315304229196223207287259EMS vehiclew/tractor--2451233435311361123EMS vehicleno/tractor------------------
Tetraplan A/S
Grontmij | Carl Bro A/S
The Danish Road DirectorateTest with European Modular System – Midway ReportAppendix 1: Ferry-, bridge- and service area statistics
Page 4
Table 4: Ferried trucks on the line between Kalundborg and ÅrhusTruckno/trailerJanTo KalundborgTo ÅrhusFebTo KalundborgTo ÅrhusMarTo KalundborgTo ÅrhusAprTo KalundborgTo ÅrhusMayTo KalundborgTo ÅrhusJunTo KalundborgTo ÅrhusJulTo KalundborgTo ÅrhusAugTo KalundborgTo ÅrhusSepTo KalundborgTo Århus135128140133157151130118153159204192154151172145148161Trucksw/trailer152221175197212215141177159133198171116132177179191180Semitrailerw/tractor1,4901,3991,4711,2731,7091,5211,2981,1871,4421,2781,6121,4581,3361,3391,6151,5631,8001,902Semitrailerno/tractor3,6693,5273,2503,0953,7653,5503,7613,5603,3563,1703,4713,2263,0773,1663,3323,0553,4273,211EMS vehiclew/tractor473632233333353731463955424135514856EMS vehicleno/tractor9418332439133513221124253526585276
Tetraplan A/S
Grontmij | Carl Bro A/S
The Danish Road DirectorateTest with European Modular System – Midway ReportAppendix 1: Ferry-, bridge- and service area statistics
Page 5
1. B Bridge statisticTable 5: Trucks on the Oresund Bridge2008TrucksJanTo DenmarkTo SwedenFebTo DenmarkTo SwedenMarTo DenmarkTo SwedenAprTo DenmarkTo SwedenMayTo DenmarkTo SwedenJunTo DenmarkTo SwedenJulTo DenmarkTo SwedenAugTo DenmarkTo SwedenSepTo DenmarkTo SwedenOctTo DenmarkTo SwedenNovTo DenmarkTo SwedenDecTo DenmarkTo Sweden13,91714,05214,23014,15913,73713,93315,58215,64315,22415,28114,29814,61214,31114,44513,80413,76814,65815,16115,08115,03113,25213,09011,93011,900EMSvehicles------------------------Trucks12,15612,53312,05012,38413,71513,85012,74112,91312,14112,24812,83312,87011,49011,93811,40911,79912,88812,97812,57512,62412,20912,64311,57611,2622009EMSvehicles8075268565891.0896341.006745629503654497531337397389595413665402708511646435Total12,86313,05912,90612,97314,80414,48413,74713,65812,77012,75113,48713,36712,02112.27511,80612,18813,58313,39113,24013,02612,91713,15412,22211,697
Tetraplan A/S
Grontmij | Carl Bro A/S
The Danish Road DirectorateTest with European Modular System – Midway ReportAppendix 1: Ferry-, bridge- and service area statistics
Page 6
Table 6: Trucks on the Great Belt Bridge2008TrucksTotalJanTo KorsørTo NyborgFebTo KorsørTo NyborgMarTo KorsørTo NyborgAprTo KorsørTo NyborgMayTo KorsørTo NyborgJunTo KorsørTo NyborgJulTo KorsørTo NyborgAugTo KorsørTo NyborgSepTo KorsørTo NyborgOctTo KorsørTo NyborgNovTo KorsørTo NyborgDecTo KorsørTo Nyborg104,0802009TrucksEmsVehicles566607561569713655740680787734836803721696902815107210381184110012881179104497491,952
90,779
102,910
86,657
87,787
100,877
99,191
100,559
113,106
94,914
96,334
109,654
91,331
92,852
108,705
99,463
101,102
100,927
90,229
91,646
104,270
95,642
97,359
109,917
98,661
100,771
111,373
96,868
99,152
100,698
92,730
95,197
89,384
83,448
85,466
Tetraplan A/S
Grontmij | Carl Bro A/S
The Danish Road DirectorateTest with European Modular System – Midway ReportAppendix 1: Ferry-, bridge- and service area statistics
Page 7
1. C Service area statisticPercentage capacity utilizationfor trucks, counted at nightSpringSummerAutumn200920092009206139545783581831921429132514331153121188130150673961100150678311691183713814168614020625082431177511714214267333767513514273125
Service areaKarlslunde VestKarlslunde ØstTuelsø NordTuelsø SydTappernøje ØstTappernøje VestHimmerland ØstHimmerland VestEjer Baunehøj ØstEjer Baunehøj VestSkærup ØstSkærup VestHjallerup Enge VestUstrup ØstUstrup VestKildebjerg NordKildebjerg Syd
Capacityfor trucks1818282812121212192112211617193320
Tetraplan A/S
Grontmij | Carl Bro A/S
Appendix 2: Cargo traffic
The Danish Road DirectorateTest with European Modular System – Midway ReportAppendix 2 A: EMS vehicle units in the Danish Central Register for Motor Vehicles
Page 1
Midway ReportAppendix 2 A: EMS vehicle units in the Danish Cen-tral Register for Motor VehiclesSince August 2008 Statistics Demark has registered the number of EMS ve-hicle with Danish licence numbers. The information has been collected viathe Danish Central Register for Motor Vehicles (CMR).The extracts from CMR clearly show a current increase in the amount of ve-hicles which can form part of an EMS vehicle combination.Aug. 2008 Dec. 2008EMS vehicle, type1: DolliesEMS vehicle, type2: SemitrailersEMS vehicle, type3: Link-trailersEMS vehicle, type 1og 4: TrucksEMS vehicle, type 2og 3: Tractors100491613353402.1863.418Jan. 2009 Mar. 2009 Feb. 2010433882.6643.6335931433.2984.6371054
2074.0545.315
Totally the statement reveals that EMS vehicles are combined units with link-trailers and dolly combinations, which means a major part of combinationswith semitrailers.Statistics Denmark’s analysis methodStatistics Demark has on the basis of Road Safety and Transport Agency’sguide extracted EMS vehicles relevant data from the vehicle register (RoadSafety and Transport Agency; Communication no. 1916 about vehicles’ ar-rangement and equipment, etc., 22. May 2008).All units in EMS vehicles, except the rear ones, are registered with specialdata, which in most cases can be found in the CRM register.The units can be attached to user as well as owner.Foreign vehicles cannot be identified.The guide directs that special variable values and variable constellations areregistered for:EMS vehicle, type 1: trucks and dolliesEMS vehicle, type 2: tractors and semitrailersEMS vehicle, type 3: tractors and link-trailersEMS vehicle type 4: Trucks
Tetraplan A/S
Grontmij | Carl Bro A/S
The Danish Road DirectorateTest with European Modular System – Midway ReportAppendix 2 A: EMS vehicle units in the Danish Central Register for Motor Vehicles
Page 2
The rear units for the individual EMS vehicle types, such as semitrailers, cen-tral axle trailer, semitrailers and trailers are registered in a special way andtherefore they cannot be attached to an EMS vehicle type based on the reg-ister.In a gross data set created on the basis of the vehicle type and applicationfor:Common trucks/tractorsSemitrailer tractorsSemitrailers and any link-trailersTrailers and any dollies
the relevant EMS vehicle units can be found by analysing the below vari-ables in the vehicle register (the most interesting ones stated in bolditalic):Ident, [unique key for identification of the vehicles in CRM]Type approval numberType no., [4: Trucks and tractors, 5: Trailers, 6: Semitrailers]Application number,Registration dateAmendment dateInspection approval dateCoupling no.,[1: Coupling to trailers, 2: Coupling to semitrailers]Tare weightTotal weightTransport weightTechnical total weightCoupling weight 1,[Content determined by EMS vehicle type]Coupling weight 2,[Content determined by EMS vehicle type]Road train weight for trucks and tractors,[Total weight + couplingweight 1, Total weight + coupling weight 2, res.]Axle loadNumber of axlesTax axle numberTax axle loadSupplementary data
EMS vehicle units can be extracted from the gross data set in the followingway:EMS vehicle type 1 and 4: TrucksTrucks to have coupled a dolly+semitrailer (EMS vehicle type 1) or a trailer >18,75 metres (EMS vehicle type 4 have largest total weight inCouplingweight 1and W-value (maximum pulling power in kN) inCoupling weight 2.Ifthe W value is 0, the truck can only be coupled to a long trailer (EMS vehicletype 4). (Sec. 1.2 in guide).
Tetraplan A/S
Grontmij | Carl Bro A/S
The Danish Road DirectorateTest with European Modular System – Midway ReportAppendix 2 A: EMS vehicle units in the Danish Central Register for Motor Vehicles
Page 3
DolliesDollies to be coupled to a semitrailer, must have their wheel load approvedinCoupling weight 1and the largest total axle load of the semitrailer inCou-pling weight 2and have code 82 inSupplementary data(Sec. 3.2 and 6.1 inguide).
EMS vehicle type 2 og 3: TractorsThe tractors to be coupled with a semitrailer and central axle trailer (EMStrailer type 2) or link-trailer and semitrailer (EMS vehicle type 3) have thepermitted wheel load inCoupling weight 1and the maximum axle load forsemitrailer/link-trailer inCoupling weight 2.EMS vehicle type 2: SemitrailersSemitrailers to be coupled with a central axle trailer must have the largest to-tal weight of this trailer inCoupling weight 1and the so-called W-value inCoupling weight 2and have code 83 inSupplementary data(sec. 4.2 inguide).EMS vehicle type 3: Link-trailers (semitrailers)Link-trailers to be coupled with a semitrailer must have their permitted skam-melbelastning inCoupling weight 1and largest total axle load of the semi-trailer inCoupling weight 2and have code 82 inSupplementary data(sec.5.2 in guide).
Tetraplan A/S
Grontmij | Carl Bro A/S
The Danish Road DirectorateTest with European Modular System – Midway ReportAppendix 2 B: Special run of driver’s log
Page 1
Midway ReportAppendix 2 B: Special run of Driver’s logAppendix 2 B is divided into the following main headings:1.2.3.4.5.An introduction with a brief of the background for the investigation.Response to Form 1Response to Form 2Copy of the distributed Form 1Copy of the distributed Form 2
1
INTRODUCTIONIn collaboration with Statistics Denmark a survey divided into 2 Forms hasbeen prepared:Form 1: Generally about the application of EMS vehicles in the se-lected company, this is divided into two parts: Part 1 deals with thecompany’s application of EMS vehicles, if any, in a given week, andpart 2 deals with the company’s application of EMS vehicles in gen-eral.Form 2: Driver’s log for selected EMS vehicle units for the individualtrips in a given week.
The two forms are reproduced in full at the end of the appendix.These questionnaires have been sent out in a special run by StatisticsDenmark asking the companies to report on the trips they had made withthe specific EMS vehicle unit in calendar week 2, 2010 also referred to asthe counting week.Statistics Denmark sent out questionnaires to all 61 companies registeredwith EMS vehicle units. These companies had 99 dollies, 205 link-trailersand 4 central axle trailers1.Maximum 2 units have been selected per company for reporting of driver’slog, a total of 99 units distributed on 51 dollies, 45 link-trailers and 3 centralaxle trailers. The selection on units was made to ensure an as wide as pos-sible representativity per company.Calls have been made to the companies up to the counting week in order toensure that they were aware of the investigation. Moreover reminders forlacking responses have been sent out immediately after the expiry of thereply deadline.Statistics Denmark has received replies from 47 companies correspondingto 77 % of the questioned companies.
1
As the EMS vehicle type 4, called ”Long trailer”, is not represented explicitly in the CMR reg-ister, these units are not part of the special run of the driver’s log. This type may be included inany subsequent investigation.Grontmij | Carl Bro A/S
Tetraplan A/S
The Danish Road DirectorateTest with European Modular System – Midway ReportAppendix 2 B: Special run of driver’s log
Page 2
Reports for 75 EMS vehicle units have been sent in, corresponding to 76 %of the selected units, of which trip details have been reported for 52 units,as 23 units have not been applied as an EMS vehicle in the counting weekby the questioned company.Therefore the result of this special run can be regarded as extremely satis-factory as the response percentage is very high compared to the responseon the ordinary driver’s logs.
Tetraplan A/S
Grontmij | Carl Bro A/S
The Danish Road DirectorateTest with European Modular System – Midway ReportAppendix 2 B: Special run of driver’s log
Page 3
Reply to Form 1EMS vehicle units available250
200Number of units
150EngagedOwn/leased100
50
0DollySemitrailers withcoupling to centralaxle trailerLink-trailerLong trailer
Question 1:Number of unitsavailable in thecounting week
Figure 1 Distribution of units among questioned companies
Reply to question 1:Figure 1 reveals that the most applied unit of the EMS vehicles is the link-trailer with 202 units. The dolly came in second with 85 units. It should bementioned that the indicated amount does not take the Swedish registeredunits into account, which are apparently travelling on the Danish road quiteoften2. The dolly-combination is the most dominant for ordinary transport ofgeneral goods as it is known from e.g. the carrier system. This is character-ised by the fact that it is possible to use EMS vehicles between the termi-nals and then distribute to the customers by means of a tractor / solo truck.The last two types of EMS vehicles are applied to a very limited degree,since only 5 units of type 2 “semitrailer with central axle trailer” and 31 unitsof type 4 “long trailer” are applied.Among the 202 link-trailers having been at disposal, only one unit has beenengaged, while 8 were engaged as for the 85 dollies.
2 The application of Swedish registered dollies is especially due tothe fact that it is most often this unit, which is applied in the Swedishmarket and therefore can be applied relatively easily in the Danishtest.Tetraplan A/SGrontmij | Carl Bro A/S
The Danish Road DirectorateTest with European Modular System – Midway ReportAppendix 2 B: Special run of driver’s log
Page 4
EMS vehicle units applied as EMS vehicles200180160Number of units140120100806040200DollySemitrailers withcoupling tocentral axle trailerLink-trailerLong trailerEngagedOwn/leased
Figure 2 Distribution of units applied for transport with EMS vehicles
Question 2:Number of unitsapplied for trans-port in the countingweek
Reply to question 2:The actually applied units in Figure 2 confirm the picture that link-trailersand dollies are dominating in connection with the application of EMS vehi-cles including the fact that the long trailers only represent a small part of themarket. There are thus 72 dollies and 185 link-trailers and 4 semitrailerswith coupling to central axle trailer and 8 long trailers which have been ap-plied for transport with EMS vehicles. The assessment is that the long trail-ers are primarily applied in connection with transport of bulk cargo such asscrap. Transport of timber on long road trains, as it is known in e.g. Swe-den, will hardly be applied in Denmark.Of the units applied for transport with EMS vehicles, a link-trailer and 7 dol-lies have been engaged.
Tetraplan A/S
Grontmij | Carl Bro A/S
The Danish Road DirectorateTest with European Modular System – Midway ReportAppendix 2 B: Special run of driver’s log
Page 5
Foreing EMS vehicle units applied as EMS vehicles141210Number of units8Engaged6420DollySemitrailers withcoupling tocentral axle trailerLink-trailerLong trailerOwn/leased
Figure 3 Distribution of applied units registered abroad
Question 3:Number of unitsregistered abroadin the countingweek
Reply to question 3:The replies to question 3 appear from Figure 3, which shows that 12 of theapplied units of dollies as well as link-trailers were registered abroad and ofthese 1 dolly had been engaged. From this point of view two semitrailerswith coupling to central axle trailers were registered abroad, whereas nolong trailers fell under that category.Comparing the results from with the results from Figure 2 reveals that 16 %of the applied dollies are registered abroad, while the corresponding num-ber for the link-trailers is 6 %. This shows that the dolly units are registeredabroad to a larger extent, proportionally, than the link-trailers. This confirmsthe expectation that several dolly units may origin from Sweden where theyare both applied and registered.Reply to question 4:Of the EMS vehicles applied in the counting week, a total of 163 have beenapplied in international traffic. When considering that almost 300 EMS vehi-cle units have been applied during the counting week, a relatively highamount, a little more than half of the units, is applied in international traffic.This figure does not say anything about how many times the unit in questionwas abroad or how many times the unit in question was applied in thecounting week.Reply to question 5:During the counting week the respondents indicate that 3 have applied trac-tors registered abroad, while 35 indicates that they have not applied foreigntractors. Among those having applied foreign tractors, it is indicated that atotal of 94 tractors have been applied and are distributed with 5 to 84 percompany. This means that especially one company, even a relative largeone, applied foreign tractors.Grontmij | Carl Bro A/S
Question 4:Number of units ininternational traffic
Question 5:Units registeredabroad in thecounting week
Tetraplan A/S
The Danish Road DirectorateTest with European Modular System – Midway ReportAppendix 2 B: Special run of driver’s log
Page 6
Reply to question 6:Distribution of transport on road types per respondent100%90%80%70%60%50%40%30%20%10%0%
Motorway
Main road
Other3
Question 6:Danish road sec-tions where EMSvehicles travelled inthe counting week
Figure 4 Distribution of traffic work on road types for each company
Figure 4 reveals very clearly that by far the largest part of the traffic work iscarried out on motorways. This seems natural, as the road network in thefirst part of the test with EMS vehicles primarily related to motorways. Itshould be noticed that only 33 of the participating companies wanted to re-ply to question 6.Reply to question 7:Among the trip relations which the companies have indicated as the mostfrequently used, the following trips are in top 10, cf. Figure 5:Number ofTrips between destinationscompanies4600 - Køge7100 – Vejle52630 - Tåstrup7100 – Vejle42630 - Tåstrup9220 – Aalborg East36330 – Padborg8000 – Århus C28000 – Århus C9000 – Aalborg26330 - Padborg7100 – Vejle24600 - Køge6330 – Padborg24200 - Slagelse7100 - Vejle22630 - Tåstrup5220 – Odens SE25220 – Odense SE9220 – Aalborg East2Figure 5 Trips between destinations with EMS vehicles
Question 7:Trips (postalcodes) where EMSvehicles were ap-plied in the count-ing week
In addition to this, 8 respondents have indicated that foreign postal codeswere included in trips which were among the most frequent ones.Reply to question 8:3
It should be mentioned that the company, which solely applies ”Other” as road type,has made a note that this is a driving area which has one EMS vehicle only applied inthis private area.Tetraplan A/SGrontmij | Carl Bro A/S
The Danish Road DirectorateTest with European Modular System – Midway ReportAppendix 2 B: Special run of driver’s log
Page 7
Question 8:Transported tonneswith EMS vehiclesin the countingweek
Totally the respondents have replied that in the counting week, they trans-ported 17,400 tonnes of goods on EMS vehicles. This must be expected tohave been performed by 269 EMS vehicle units, cf. Figure 2. If the countingweek is regarded as a normal week and the 269 EMS vehicle units amountto 85 % of the total number of registered units being 316, this will corre-spond to an estimated transport of 1,060,800 tonnes of goods on EMS ve-hicles on an annual basis. Out of a total amount of estimated transportedgoods of 135 million tonnes on trucks in 2009, this corresponds to EMS ve-hicles having transported 0.8 % of the total amount of national goods in2009.Reply to question 9:The statements of commodity group distribution on EMS vehicles show thattwo commodity groups are dominating. These are the commodity groupfood, beverage and food stuffs and the commodity group general goods. Anumber of other commodity groups are also represented which appearsfrom Figure 6 and Figure 7. It should be stressed that this commodity groupdistribution is based on the company’s own experience and assessment ofthe distribution of commodity groups and that in practice in connection withthe statement of trip-based distributions, the picture is difference, which willbe illustrated later in Figure 234.Estimated distribution of transported goods on commodity groups9000
Question 9:Commodity groupstransported withEMS vehicles inthe counting week
8000
7000
Goods quantity in tonnes
6000
5000
4000
3000
2000
1000
Ore, iron and other metal ores
Gasolines and other mineraloil products
0Textiles and garmentsCoalGravel, stones, sand, clay,asphaltFoods, food stuffs, beverageproducts, tobacco, etc.Treated wood, paper, etc.Agricultural, forestry andfishing products
Mineral construction materials
Chemical products, fertilizers,etc.
Transport means and partsfor these
Machinery and equipment,household appliances, etc.
Removal goods, motorvehicles for repair, etc.
Metal goods
Letters and packages
Empty containers and swapbodies, etc.
General goods
Furniture and othermanufactured goods
Figure 6 Distribution on commodity groups of goods transported on EMS vehicles intonnes
4
It should be mentioned that the companies have only replied to the quantity of goods trans-ported totally in the counting week, and how this is distributed in commodity groups as per per-centage. The distribution on commodity groups and the subsequent summary has hereinafterbeen made by the evaluation team.Grontmij | Carl Bro A/S
Tetraplan A/S
Eartt, waste and recyclingmaterials
Unknown goods
Refuse
Tetraplan A/SShare of transported goods in percentage
Goods quantity in tonnes1000200030004000500060007000800090000
10%
15%
20%
25%
0%Agricultural, forestry and fishing productsCoalOre, iron and other metal oresGravel, stones, sand, clay, asphaltFoods, food stuffs, beverage products,tobacco, etc.Textiles and garmentsTreated wood, paper, etc.Gasolines and other mineral oil productsChemical products, fertilizers, etc.Mineral construction materialsMetal goodsMachinery and equipment, householdappliances, etc.Transport means and parts for theseFurniture and other manufactured goodsEartt, waste and recycling materialsLetters and packagesEmpty containers and swap bodies, etc.Coal
5%
Agricultural, forestry and fishing products
Ore, iron and other metal ores
Gravel, stones, sand, clay, asphalt
The Danish Road DirectorateTest with European Modular System – Midway ReportAppendix 2 B: Special run of driver’s log
Foods, food stuffs, beverage products, tobacco, etc.
Textiles and garments
Treated wood, paper and paper products
Gasolines and other mineral oil products
Chemical products, fertilizers, plactic, rubber
Mineral construction materials
Metal goods
Machinery, household appliances, electrical articles,etc.
Transport means and parts for these
Goods transported in all trucks distributed on commodity groups
Furniture and other manufactured goods
Earth and waste
Estimated distribution of transported goods on commodity groups
Letters and packages
Empty containers and swap bodies, etc.
Removal goods, motor vehicles for repair,etc.General goodsUnknown goodsRefuse
Removal goods
Figure 7 Distribution according to percentage of commodity groups with goods trans-ported on EMS vehicles
Only the two commodity groups foods, food stuffs, beverage and generalgoods, are represented in both transport groups with a relatively largeshare. This stresses the fact that so far EMS vehicles are applied primarilyfor transport of a minor quantity of commodity groups, where the volumestrength of the EMS vehicles is expressed.Figure 8 illustrates the total goods quantity distributed as per percentage oncommodity groups, transported on all trucks in Denmark in 2008.
Page 8
Figure 8 Distribution on commodity group in percentage of goods transported on alltrucks in 2008
Grontmij | Carl Bro A/S
General goods, mixed goods
Unknown goods, e.g. containers
The Danish Road DirectorateTest with European Modular System – Midway ReportAppendix 2 B: Special run of driver’s log
Page 9
Only the two commodity groups foods, food stuffs, beverage and generalgoods, are represented in both transport groups with a relatively largeshare. This stresses the fact that so far EMS vehicles are applied primarilyfor transport of a minor quantity of commodity groups, where the volumestrength of the EMS vehicles is expressed.Reply to question 10:Among the respondents, 32 reply that there is no difference between the ar-ticle numbers they transport with EMS vehicles and with ordinary road trainsin the counting week. A respondent replies that the article numbers theytransport on EMS vehicles are different compared to ordinary road trains, ason EMS vehicles, the company primarily transports article number 19 corre-sponding to general goods.Reply to question 11:DollyTrailer typeSemitrailer withLink-coupling to cen- trailertral axle trailer34611042114181511001260Long trailer
Question 10:Goods on EMStrains and commonroad trains in thecounting week
Advantages:High flexibilityLarger volumeBetween terminalsLow purchase costLower opr. costsWell-suited for except.goodsMore env. friendlyLarger road safetyOther
1119191017415124
456021420
Disadvantages:Less flexibility726High purchase price3111Difficult interchanges9216Spread of road net-work19717Poorer traffic safety012Larger environmentaleffect000Other501Figure 9 Advantages and disadvantages of the various types of EMS vehicles5
2315001
Question 11:Advantages anddisadvantages ofvarious types ofEMS vehicles
Figure 9 shows that advantages and disadvantages of EMS vehicle unitsare attached to the ability to transport more goods in combination with flexi-bility and the level of purchase cost. Without over-interpreting the figures, itappears that especially the flexibility is popular among the users of link-trailers, while the low purchase cost dominates the users of dollies.
5
The individual respondents could reply with more than one mark next to each type of EMS ve-hicleGrontmij | Carl Bro A/S
Tetraplan A/S
The Danish Road DirectorateTest with European Modular System – Midway ReportAppendix 2 B: Special run of driver’s log
Page 10
Further replies to question 11:Trailer typeAdvantagesDolly--Less diesel consumption(less units), less pollutionFlexibility in con. with par-allel use of the two combi-nationsFits with our need for hav-ing a tractor for transportsin the CHP area
Disadvantages-No interchangeplaces in RandersMore expensivebridge dutyMany limitations as towhere the vehiclesare allowedLack of sections e.g.near Gardermoen (4km)Difficult due to therange of road network
-
-
-
-Semitrailer with cou-pling to central axletrailerLink-trailerFlexibility in connection withparallel travelling with the twocombinations
At the moment the link-trailer cannot transportdangerous goods.Long trailerLack of sections e.g. nearGardermoen (4 km)Figure 10 Other advantages and disadvantages of EMS vehicle types
As part of the reply to question 11, the respondents could tick off in the field”Other”, after which they could ad other advantages and disadvantageswhen travelling with the various types of EMS vehicles. The result of thispart of the questionnaire appears from Figure 10, showing that generallythere is a request for extension of the EMS vehicle road network.Reply to question 12:From the replies to question 12 it appears that 4 do not interchange theirEMS vehicles in order to continue outside the EMS vehicle road network.Among the replies 71 replied to where they interchange as the respondentscould tick off more than once. The distribution of the replies appears fromFigure 11.Number ofcompanies
Question 12:Interchange ofEMS vehicles
LocationsPorts13Service areas10Transport centre30Private terminals15Custom locations2Industrial areas1Figure 11 Locations for interchange of EMS vehicles
Figure 11 supports the earlier assessments of the fact that interchangetakes place on a broad variety of destinations and that service and rest ar-eas as well as private terminals are rather important in this regard.
Tetraplan A/S
Grontmij | Carl Bro A/S
The Danish Road DirectorateTest with European Modular System – Midway ReportAppendix 2 B: Special run of driver’s log
Page 11
Reply to question 13:Change in costHigher0Unchanged3Lower, below 10 pct.7Lower, 10-20 pct.18Lower, above 20 pct.7Figure 12 Change in cost per transported tonne compared to traditional road trainsNumber ofcompanies
Question 13:Costs per tonnecompared to tradi-tional road trains
The costs for goods transport carried out with EMS vehicles are assessedby the major part of the respondents to be below the other road trains. FromFigure 12 it appears that the major part of the companies assess that thecost per transported tonnes lies at minimum 10 % below the price for anormal transport. This can be referred to the fact that the higher capital andoperation costs connected to the individual EMS vehicle should be com-pared to the larger goods volume that these vehicles can transport6.Reply to question 14:Among the respondents 17 indicated that the financial recession has had apositive influence on the application of EMS vehicles, while 24 have repliedthat the economic recession has had a negative influence. The respondentswere asked to give reasons for their check offs. The reasons are repro-duced in Figure 13.
Question 14:The financial re-cession’s influenceon the applicationof EMS vehicles
6
The savings of 10 – 15 % from driving with EMS vehicles cannot be a surprise, sincethis is the common expectation to driving with EMS vehicles in the trade. Thus the re-plies can be interpreted as either a real evaluation of the conditions or a confirmation ofthe expected effect from driving EMS vehicles.Grontmij | Carl Bro A/S
Tetraplan A/S
The Danish Road DirectorateTest with European Modular System – Midway ReportAppendix 2 B: Special run of driver’s log
Page 12
Positive influencesBetter exploitation of equipmentBetter exploitation of equipmentMore goods between terminals withless vehiclesCreative thinking more than ever toobtain lower cost.We save some extra trips betweenterminalsNo influenceMove more goods with less vehiclesRearrangement of transport (saved anight vehicle)Better profitability (savings)No importance, as we have appliedEMS vehicles for 10 years.
Negative influencesLower goods quantityWe have less to do = too muchequipmentLess to transport = too much equip-mentNo goodsNo influenceLess activityLower goods quantityMore difficult to fill up the road trainwith goodsLess combination optionsDrivers have more waiting time dueto driving time and rest period regu-lationsFall in goods quantityIn periods they could not be ex-ploited optimallyLess goodsGenerally lower demandMuch lower goods quantityLower goods loadNot so much cargo to transportLack of goods and lower pricesPrice for transport can no longercover costFigure 13 The companies’ evaluation of the financial recession’s influence on theapplication of EMS vehicles
As it appears from the replies to question 14, the financial recession hasbeen applied differently by the various companies seen in relation to EMSvehicles: For some companies the recession has been a motive to applyEMS vehicles because it has made the transport more efficient. For somecompanies the recession has meant that there are fewer goods and there-fore they have not been motivated for shifting to equipment with potentiallylarger capacity utilization.Reply to Question 15:The replies to question 15 appear from Figure 14. After the figure the verbalcomments given by the respondents follow.BarriersNo barrier2Minor extent4Road network which canbe applied31Access conditions5LargerPoor capacity utilization2extentEconomy, purchase1Economy, operation costs0Other7Figure 14 Experience barriers in relation to increasing the transport with EMS vehi-clesNumber ofcompanies
Question 15:Barriers for trans-port with EMS ve-hicles
Tetraplan A/S
Grontmij | Carl Bro A/S
The Danish Road DirectorateTest with European Modular System – Midway ReportAppendix 2 B: Special run of driver’s log
Page 13
Specific comments from haulage contractors and logistics companies aboutthe barriers for increasing transport with EMS vehicles:Copenhagen Municipality’s lack of understanding and participation.It is our opinion that there are many locations where you are not al-lowed to drive, even if this, according to our knowledge, is possiblewithout changing the roads.Link-trailers cannot transport dangerous goods. Very problematicwithin the range of general goods.Let the modular vehicles drive on the entire road network – it will in-crease flexibility and unnecessary km to interchange locations canbe avoided.Use too much time on travelling between interchange locations.Lack of interchange locations in Denmark especially in Randers.Lack of harmonisation with neighbour countries.Cannot transport ADR (dangerous goods) on the link combination.All in all it appears from Figure 14, that it is the extension of the EMS vehi-cle road network which is the largest barrier.Reply to ”other comments”:As the last part of Form 1 in the questionnaire, the respondents had the op-tion of adding further comments to the use of EMS vehicles. These com-ments are listed below:Dolly can carry dangerous goods – link-trailer cannot.Many dollies drive in Sweden with Danish registered vehicles. Needmore sections where it is allowed in Denmark. For example from ourown terminals.We are very pleased that the test is ongoing and all measures in-creasing flexibility is a plus for the trade and the transport purchas-ers.The attached vehicles are solely applied for training driving in con-nection with driver education and obtaining driver’s licenceWe live in an industrial area near the motorway outlet 42 in Randers.You cannot drive from Grenå via the rural road and then apply themotorway outlet 42 in Randers. Our nearest interchange location isAarhus. It is very uneconomic and environmentally polluting thatthere is no interchange location in Randers.We apply these only between the freight central in Esbjerg-Tåstrup –therefore no barriers for driving.The transport becomes more economic for the company through abetter and more rational terminal set up. Increased combination op-tions between the terminals.
Tetraplan A/S
Grontmij | Carl Bro A/S
The Danish Road DirectorateTest with European Modular System – Midway ReportAppendix 2 B: Special run of driver’s log
Page 14
Reply to Form 2In Form 2 the companies have had the option of registration of a driver’s logfor one or two selected EMS vehicle units depending on what they wereasked for. The replies to Form 2 can, as a consequence of the relativelylarge data quantity, not be treated in the same way as in the case of Form1. Instead a number of figures have been created which gathers and illus-trates the results across the received replies.Generally for Form 2, it can be said that a total of 314 trips were made inthe counting week, where the EMS vehicle units have been travelling as apart of an EMS vehicle. To this can be added 24 trips, where the unit inquestion did not travel as a part of an EMS vehicle and finally 72 trips weremade where it has not been informed, whether the unit travelled as an EMSvehicle or not. Totally there is data on 410 trips.Among the 314 trips where the unit has travelled as part of an EMS vehicle,the 267 trips were solely travelled in Denmark and the 13 trips betweenDenmark and abroad, while the remaining 34 trips were solely travelledabroad that is between various destinations abroad.As mentioned earlier, 99 EMS vehicle units have been identified, for whichthe companies have been asked to prepare driver’s logs in the countingweek. The 99 units are distributed on 51 dollies, 45 link-trailers and 3 cen-tral axle trailers. Reports were received for a total of 75 EMS vehicle units,corresponding to a reply percentage of 76 %. The replies are distributed on41 dollies, 31 link-trailers and 3 central axle trailers. Among the units forwhich trips have been reported, there were 52 replies distributed as follows:33 dollies, 17 link-trailers and 2 central axle trailers, which means that 23units distributed on 8 dollies, 14 link-trailers and one central axle trailerwhich were not applied by the reporting companies for transport with EMSvehicles in the counting week. Of the replies it appears that 3 of the 23 havereplied that the unit has not been applied because of overcapacity within thearea, 4 units have not been applied because the demand for transport wasnot within the EMS vehicle road network, while 16 have indicated ”Other”.Among these 16 replies, approximately half of these gave the reason for nothaving filled in the driver’s log that the unit had been hired out to other haul-age contractors or third parties which is typical for the link-trailers. It must beassumed that the hired / lent out units have been applied for transport asEMS vehicles, since it would not have been rented if it was not to be usedfor this purpose.
Tetraplan A/S
Grontmij | Carl Bro A/S
The Danish Road DirectorateTest with European Modular System – Midway ReportAppendix 2 B: Special run of driver’s log
Page 15
Figure 15 shows that there is no direct relation between goods weight andtrip distance. On the contrary the figure shows that there is a tendency toapply the link-combination over shorter distances while the dolly-combination is primarily applied over longer distances. A possible explana-tion to this may be the fact that the dolly-combination is primarily applied forterminal transport while the link-combination is to a large extent appliedwhen all goods are to be delivered to one customer. At the same time itshould be noticed that several relatively long trips with low goods weightcan be an indication of volume goods, where the road train is well-exploitedwith regard to volume goods but this will not affect the weight. The oppositepossibility is also present, as the special combination of EMS vehicle unitscould indicate that a haulage contractor chooses to drive with an empty link-trailer in order to have this returned, even with no goods in it, but simply be-cause it is to be applied for an EMS vehicle combination e.g. the day after.Relationship between trip distance and goods weight when the unitis part of an EMS vehicles403530Goods weight in tonnes25201510500200400600800100012001400160018002000Trip distance in km
Type 3 (Link-trailer)
Type 1 (Dolly)
Type 2 (central axle trailer)Type 2 (Central axle trailer)
Figure 15 Relation between trip distance and goods weight when travelling withEMS vehicles7
To the above should be added that mainly it is a question about replacingexisting transports with traditional road trains with EMS vehicles and there-fore there are not any immediate changes in the transport patterns, dis-tances, etc. and therefore no basic changes in the transport and traffic pic-ture. Basically it should, however, still be assumed that EMS vehicles will beapplied particularly over longer distances.
7
It should be mentioned that a ”dot” can contain more trips, and the dots may cover each other.The distribution of dots cannot be taken as a unique expression of the frequency of the trips.Grontmij | Carl Bro A/S
Tetraplan A/S
The Danish Road DirectorateTest with European Modular System – Midway ReportAppendix 2 B: Special run of driver’s log
Page 16
As it appears from the attached questionnaire, part 2, one of the questionsis, whether the EMS vehicle unit in question on a given trip was part of anEMS vehicle or not. As mentioned earlier, the units in question were not partof an EMS vehicle on 24 trips of the 410 trips. Among the 410 trips the unitwas part of an EMS vehicle on 314 trips. For 72 trips the respondents didnot inform whether the EMS vehicle unit was part of an EMS vehicle or not.The background for the relatively large share of uninformative replies is notclear; the cause may be that in some cases the question does not makesense. For example; typically a dolly unit only forms part of an EMS vehicle,why it may have been found irrelevant to reply to the question aboutwhether this unit has travelled as part of an EMS vehicle or not.Among the 24 units, which did not form part of an EMS vehicle on a trip,their trip distances combined with the goods’ weight appear from Figure16with regard to link-trailers. This statement only includes link-trailers, as thisis the only type of EMS vehicle where it is relevant to talk about that a unitdid not form part of an EMS vehicle.Relationship between trip distance and goods weight,when the unit is not part of an EMS vehicle403530Goods weigth in tonnes25201510500200400600800100012001400
Trip distance in km.
Type 3 (Link-trailer)
Figure 16: Transport with link-trailers not being part of an EMS vehicle
The distribution of transport with link-trailers not being part of an EMS vehi-cle does not show any unique results, cf. Figure16. A comparison betweenFigure 15 and Figure16does not show a distinct difference in trip distanceand goods weight between the link-trailers travelling alone or as a part of anEMS vehicle.
Tetraplan A/S
Grontmij | Carl Bro A/S
The Danish Road DirectorateTest with European Modular System – Midway ReportAppendix 2 B: Special run of driver’s log
Page 17
Relationship between trip distance and utilization of EMS vehicles100%
80%
Load capasity conditions
60%
40%
20%
0%0200400600800100012001400160018002000Trip distance in kmType 3 (Link-trailer)Type 1 (Dolly)Type 2 (Central axle trailer)
Figure 17 Relation between trip distance and load capacity for an EMS vehicle7
Figure 17 illustrates the relation between load capacity degree, measured inindicated potential tonnes that can be loaded and the real capacity utiliza-tion8. The picture is again that there is no direct relation between load ca-pacity degree and trip distance. However the figure shows that the dolly-combinations are applied on the longest trips. Further investigations will berequired in order to uncover, whether this can be related to the flexibility ofthe individual vehicle types or to other conditions.
8
Based on the respondents’ replies to the question about ”The road train’s total load capacity”,this has been set to 39 tonnes on average. On this basis it has been possible to calculate the loadcapacity percentage as appears from Figure 17.Grontmij | Carl Bro A/S
Tetraplan A/S
The Danish Road DirectorateTest with European Modular System – Midway ReportAppendix 2 B: Special run of driver’s log
Page 18
Traffic work distributed on trailer type800007000060000Travelled km.50000400003000020000100000Type 3 (Link-trailer)Type 1 (Dolly)Type 2 (Central axle trailer)
Part of EMS
Not part of EMS
Figure 18 Traffic work for various trailer types
Figure 18 reveals two quite striking phenomenon: First the total traffic workcarried out by dolly-combinations does to a large extent exceed the corre-sponding for link-trailer-combinations. Second the link-trailers are often partof the trip as other than an EMS vehicle. The last-mentioned can be referredto the fact that link-trailers are more often applied for trips between destina-tions, where it is not possible to apply EMS vehicles on the entire trip. Thelink-trailer-combination must therefore be split up on parts of the trip. In thisconnection the link-trailer is far more flexible than the dolly-combination andis therefore chosen more often for such transport tasks.Totally the number of trips for the individual types has also differed, as thereare 129 trips with link-trailers, 171 with the dolly-combination and 14 withcentral axle trailer. However, the significant difference in number of travelledkilometres with link-trailer and dolly-combination, respectively, cannot be re-ferred to these differences but also covers over differences in trip distancesfor the individual types, which is accounted for in connection with figure 10.
Tetraplan A/S
Grontmij | Carl Bro A/S
The Danish Road DirectorateTest with European Modular System – Midway ReportAppendix 2 B: Special run of driver’s log
Page 19
On the basis of Figure 18 it can be calculated, that the 52 reported EMS ve-hicle units in the counting week, on estimate, have travelled 82,000 km asEMS vehicles. Based on the fact that at the end of 2009 316 EMS vehicleunits were registered in CMR and as it can be expected that 85 % of thesehave travelled as EMS vehicles, an estimate would be that EMS vehiclesare potentially travelling 22,000,000 km annually9.Distribution of trips distances grouped in unit types60,0%
50,0%
40,0%Share of trips
30,0%
20,0%
10,0%
0,0%0 - 50 km50 - 100 km100 - 200 km 200 - 500 kmTrip lengthType 3 (Link-trailer)Type 1 (Dolly)Type 2 (Central axle trailer)All units>500 km
Figure 19 Trip lengths for various types of EMS vehicle units (not necessarily aspart of an EMS vehicle).
Figure 19 reveals at least two interesting issues: First; EMS vehicles are of-ten applied on trips between 200 and 500 km and that these trips are be-tween Eastern and Western Denmark. Totally this interval counts for almost45 % of the trips, while the second place is occupied by the interval be-tween 100 and 200 km with almost 25 % of the trips. Second; there is nosignificant difference as to what type of EMS vehicle combination is appliedon the various trip distances. Central axle trailers are only part of two dis-tance intervals due to the limited number being part of the EMS vehicleconcept. With regard to link-trailers and dollies there seems to be a littletendency that link-trailers have a certain dominance on the shorter dis-tances, while the dollies take over on the long distances. This picture fitsquite well into the earlier assessments of which distances and for whichtransport tasks the two types have their strengths.
The 82,000 km distributed on 52 units means that a unit travels 1,577 km on averageper week. As it has at the same time been reported that approximately half of the EMSvehicle units being part of the special run are hired out and these must be expected tobe applied for EMS vehicle transports, this means 52 + (23/2) = 64 units out of 75 re-plies. 64 of 75 units, corresponding to 85 % of the total EMS vehicle population, can beexpected to travel as EMS vehicles.Tetraplan A/SGrontmij | Carl Bro A/S
9
The Danish Road DirectorateTest with European Modular System – Midway ReportAppendix 2 B: Special run of driver’s log
Page 20
As it appears from Figure 19, the total transport is dealt with, which the EMSvehicle units have travelled. By way of comparisonFigure 20shows thenumber of trips where the EMS vehicle units have actually been part of anEMS vehicle. There is hardly any difference between the distributions in thetwo figures except for the fact that the link-trailers’ share of trips demon-strates a larger fall in the group 200 – 500 km, than for the other trips withlink-trailer and other trips in general.Distribution of trip distances distributed on unit types, wherethe unit has travelled as part of an EMS vehicle
70,0%60,0%50,0%Share of trips40,0%30,0%20,0%10,0%0,0%0 - 50 km50 - 100 km100 - 200 km 200 - 500 kmTrip lengthTrip lengthType 3 (Link-trailer)Type 1 (Dolly)Type 2 (Central axle trailer)All units>500 km
Figure 20 Trip distances for various types of EMS vehicle units being part of anEMS vehicle
Tetraplan A/S
Grontmij | Carl Bro A/S
The Danish Road DirectorateTest with European Modular System – Midway ReportAppendix 2 B: Special run of driver’s log
Page 21
Figure 21 Map with postal code relations with 10 or more trips with EMS vehicles inthe counting week
Figure 21 shows for 5 return trips or 10 single trips or more that these are to alarge extent trips between Eastern and Western Denmark, and trips betweenNorthern and Southern Jutland supplemented by trips to accessible destina-tions in the rest of Scandinavia.Based on the nationality of the tractor per trip, it has been calculated how manykilometres the various nationalities’ tractors are travelling. This appears fromFigure 22.NationalityTraffic work (1000 km)DK72.2D4.2PL2.5Figure 22 Traffic work with EMS vehicles distributed on nationality of tractor
Figure 22 gives a clear indication of the fact that the transport is mainly per-formed by Danish trucks/tractors. It should, however, be recalled that the com-panies, irrespective of size, has participated with maximum two EMS vehicles inthe investigation. A number of the large users of EMS vehicles using both Dan-ish and foreign tractors, does not have this condition expressed precisely in theinvestigation. Therefore the actual picture comprising all the companies’ EMSvehicles should be assumed to contain a significant part of tractors on foreignlicence plates10.
Looking at the replies to the earlier question 5 in Form 1, whether tractors registeredabroad were used, it was revealed that relatively few companies are applying tractorsregistered abroad. While those, who do, or part of those, do it to a large extent.Tetraplan A/SGrontmij | Carl Bro A/S
10
The Danish Road DirectorateTest with European Modular System – Midway ReportAppendix 2 B: Special run of driver’s log
Page 22
Transport work performed with EMS vehicles in the counting weekdistributed on commodity groupsTransport work i 1000 tonnes-km10009008007006005004003002001000Agricultural, forestry and fishing products
Machinery and equipment, household appliances,etc.
Removal goods, motor vehicles for repair, etc.
Ore, iron and other metal ores
Textiles and garments
Gasolines and other mineral oil products
Mineral construction materials
Coal
Transport means and parts for these
Gravel, stones, sand, clay, asphalt
Chemical products, fertilizers, etc.
Metal goods
Furniture and other manufactured goods
Letters and packages
General goods
Empty containers and swap bodies, etc.
Eartt, waste and recycling materials
Figure 23 Transport work with EMS vehicles distributed on commodity groups
Figure 23 shows that the transport work carried out with the selected EMSvehicles in the counting week distributed on commodity groups is to someextent in accordance with the corresponding investigation of goods quanti-ties on commodity groups, which was created on the basis of question no. 9in Form 1, there are, however, rather significant differences as well. It gives,however, food for thought that the commodity groups, food, food stuffs, etc.in the statement of the transported goods quantity in Figure 6 is on levelwith the group general goods, while in the statement in Figure 23 this onlycorresponds to a little more than 20 % of this.The explanation may be referred to significant differences in trip distancesfor the individual commodity groups, but the difference is striking. A similarpicture can be seen for a number of the other goods types where significantdifferences also seem to be the case when comparing these two state-ments.A more real explanation is probably that while Figure 6 expresses an esti-mated distribution (calculated from the questioned companies) of goodsquantities on all EMS vehicle units at the companies, Figure 23 expresses amore systematic way of calculating the distribution, why there is more rea-son to credit the last-mentioned statement.Looking at the corresponding distribution for the amount of ordinary truckswith a total weight of above 6 tonnes and transport in national traffic, it ap-pears from Figure 8, that the largest commodity groups here are gravel,stones, clay, etc., foods, food stuffs, agricultural and fishery products, earth,waste and construction materials.
Tetraplan A/S
Foods, food stuffs, beverage products, tobacco,etc.
Treated wood, paper, etc.
Grontmij | Carl Bro A/S
Unknown goods
Refuse
Scheme 1: General questions on transport with all of the companies EMS vehicle unitsPart 1: Concern the companies use in general of EMS vehicle units in the counting week,the second week of 20101. How many EMS vehicle units was available in the counting week for the company?
DollyEngagedOwn/leased
Semitrailers withcoupling to centralaxle trailer
Link-trailer
(24 meters trailer train)
Long trailer
2. How many of the above mentioned units have applied for transport at EMS vehicles in the counting week?
DollyEngagedOwn/leased
Semitrailers withcoupling to centralaxle trailer
Link-trailer
(24 meters trailer train)
Long trailer
3. How many of the EMS vehicle units that you used in the counting week, was registered abroad?
DollyEngagedOwn/leased
Semitrailers withcoupling to centralaxle trailer
Link-trailer
(24 meters trailer train)
Long trailer
4. How many of the used EMS vehicle units was driving in international tra c in the counting week?EMS vehicle units in international tra c in the counting week, in total:
5. Have the company used abroad registered driving units in EMS vehicle unitsin the counting week?YesNo6. On which danish road types did the companies EMS vehicles drove in the counting week?MotorvejEstimated distributionon road types:Sejrøgade 112100 København ØMainroadOtherDesignate number of abroad driving units:
%
%Fax 39 17 30 37
7. On which trips (indicate postal code) was EMS vehicles used in the counting week
indicate the most frequent trips (to/from)Trips - with postal code, from:Trips - with postalcode, to:
Trips - with postal code, from:
Trips - with postalcode, to:
8. How many tons did the company transport with EMS vehicles in the counting week?Estimated
Tons
9. Which commodity grops was transported with EMS vehicles in the counting weekIndicate an estimated distribution of the transported freightloadGoodNo.
DescriptionAgricultural-, forestry- og shing products................................................Coal ...........................................................................................................................Ore, iron and other metal ore..........................................................................Gravel, stone, sand, clay, asphalt ..................................................................Foods, food stu , beverage and tobacco....................................................Textile and garments.........................................................................................Treated wood, paper and paper products...................................................Gasoline and other mineral oil products......................................................Chemical products, fertilizer, plastic, rubber..............................................Mineral construction materials.........................................................................Metal goods............................................................................................................Machinery, household appliances, electical articles, etc. ......................Transportmeans and parts for these.............................................................Furniture and other manufactured goods..................................................Earth and waste.....................................................................................................Letters and packages..........................................................................................Empty containers and swap bodies, etc. .....................................................Removal goods......................................................................................................General goods, mixed goods............................................................................Unknown goods (non identi able goods)...................................................Refuse........................................................................................................................
share of totaltransport in %
010203040506070809101112131415161718192021
10. Are there di erence in which goods numbers the company transported inthe EMS trains and on common road trains in the counting week?
NoYesWhich goods numbers where primarily transported inEMS trains compared to common trains
Good No.
2
Part 2: Concerns your companys use of EMS trains at all11. Which advantages and disadvantegas are related to the various types of EMS vehicles for your company?Mark one og more boxes under every EMS type.Semitrailerwith couplingto centralaxle trailerLong trailer(24 m trailertrain)
Advantages:High exibilityLarger volumeSolution of transport demand between terminalsLow purchase priceLower operation costsWell suited for special goods,in which case what special goods:
Dolly
Linktrailer
More environmentally friendlyLarger tra csafetyOther:
Disadvantages:Less FlexibilityHigh purchase priceDi cult interchangesSpread of the road networkPoor tra csafetyLarger environmental e ectOther:
12. Do your company interchange the EMS vehicles to transport goods further outside the EMS road network?
NoYesWhere were the interchanges carried out?Mark one or more boxes
HabourRest areaTransportcentrePrivate terminalsOther pleces, indicate where:
3
13. How are the costs per transported tonne by EMS trains compared to traditional trains?
HigherUndisturbedLowerHow much lower are the costevaluated to be?
under 10%10 - 20%above 20%
14. Which in uence have the nancial recession had on your companys application of EMS vehicles?
Positive, justify:Negative, justify:
15. To which extend do your company experince barriers to expand transport with EMS vehicles
No barriersSmalle amountLarger amountIndicate the barrier(s)that seems the greatestThe road network, used in EMS vehicle transportAccess condition when collection/unloading goodsPoor capacity utilization, resulting in lack of demandEconomy, purchaseEconomy, operation costs
Mark one og ore boxes.
Other, which:
Comments
Contact personName
Telefone No.
E-mail
4
In the following section you are asked to give information about the use in of the above mentioned registration numberand only this unit and the EMS vehicle combinations, which the unit have been a part of,during the sencond week of 2010.The objective with this survey is to clarify, how the selected unit is used and used in di erent combinations of EMS trains.
Have the above mentioned registration number been used in the counting week?
YesNo
Inform about the trips in the counting week on the next pages.Indicate the reason why the unithaven’t been used and returnthe scheme to Danmarks Statistik:
The vehicle is sold/signed o
Techinal problemsShortage of drivers, e.g. vacation, illness, coursesOver capacity in the areaTransport demand outside the EMS train road network.Other economical contemplationsOther, indicate:
Sejrøgade 112100 København Ø
Fax 39 17 30 37
Trips in the counting weekNotice:That a trip with goods starts by loading the selected EMS vehicle train and ends with unloading it.A new trip starts at every interchange of the selected EMS vehicle unit.It is not perceived as a new trip if the driving unit are replaced on a trip.
It is perceived as an "empty trip" to drive with an unloaded EMS vehicle train.De nitions, Goods numbers and Country code can be found on 4.
Infomation on the selected EMS vehicle unitTrips driven from/toTrip infomationEmptySimilartripstripMark X Amo-untTrip length
Infomation on the whole EMS vehicle trainThe vehicle
Infomation on goodsGoods weightkgHazard- GoodsousvolumegoodsMark XMark X
Datedd.mm
From/to
Postal no.
City
Km
A partof aEMSMark XYesNo
Total loadcapacityof the EMSKilo
SameDriving unitsdriving unit nationalityon the trip at tripstartMark XYesNo
Goodsno.
Contry code
From
To
De nitionsEmpty trip:Transport without cargo with a EMS vehicle. Notice that transport with an empty container is cosidered transport with load.
Similar trips:
If a certain trip was drived more times within the periode, only describe the rst trip and note the amount of trips similar under ”Similar trips”.
Volume goods
Goods with large dimensions compared to its weight (e.g. glass wool) or of a certail caracter,that the vehicle units load capacity are not fully used (e.g. furniture).
Weight of the goods
The weight of the goods total quantity incl. wrapping and the weight of containers and swap bodies.
Goods numbersGoods Descriptionno.010203040506070809101112131415161718192021Agricultural-, forestry- og shing productsCoalOre, iron and other metal oreGravel, stone, sand, clay, asphaltFoods, food stu , beverage and tobaccoTextile and garmentsTreated wood, paper and paper productsGasoline and other mineral oil productsChemical products, fertilizer, plastic, rubberMineral construction materialsMetal goodsMachinery, household appliances, electical articles, etc.Transportmeans and parts for theseFurniture and other manufactured goodsEarth and wasteLetters and packagesEmpty containers and swap bodies, etc.Removal goodsGeneral goods, mixed goodsUnknown goods (non identi able goods)Refuse
Crountry codesCZDDKNPLSZZCzech ReublicGermanyDenmarkNorwayPolandSwedenOthers
4
Appendix 3: Interview and surveys
The Danish Road DirectorateTest with European Modular System – Midway ReportAppendix 3 A: Survey from Danish Cyclist Federation
Page 1
Midway ReportAppendix 3 A: Survey from Danish Cyclist FederationAnnual Meeting 2009At the annual meeting of Danish Cyclist Federation (DCF) in October 2009 aquestionnaire was distributed among all delegates, approx. 100 persons, inagreement with DCF.In the introduction to the questionnaire comprised a brief description of EMSvehicles, including the test with EMS vehicles. The entire questionnaire in itsoriginal form can be found at the end of the present appendix.Response73 persons responded to the questionnaire and the superior part (62 %)comes from Region Hovedstaden (the Capital Region) and Region Sjælland(Region Sealand).With regard to the responses there are problems with questions 2, 4 and 5.To question 2 six respondents replied that they had met an EMS vehicle inthe traffic as a cyclist, while to question 4 fifteen respondents expressesthemselves about how the meeting was compared to meeting an ordinaryroad train. This means that nine respondents, who at first indicated that theyhad not met an EMS vehicle in the traffic as cyclists express their opinionsabout whether this meeting was difference from meting an ordinary roadtrain. In the same way, to question 5, nine respondents have expressed howthey experienced the meeting was different from meeting ordinary roadtrains.Summary of replies1) Apart from the above, what do you know about EMS vehicles?57 % of the respondents have no or very little knowledge about EMS vehi-cles apart from what is standing in the introduction to the questionnaire, other5% have seen or read about the vehicles in the media. Approx. 10 % findthat EMS vehicles require changes of parts of the road network, such asroundabouts, which may result in a reduction of the traffic safety for cyclists.2) Have you met EMS vehicles in the traffic as a cyclist? If yes, on what roadsection was that?Only 8 % of the respondents have met an EMS vehicle as a cyclist in thetraffic, while 89 % respond now to this.3) Do you generally feel insecure when meeting a road train (yes/no)?60 % of the respondents feel insecure when meeting road trains, while 19 %do not have this experience. In this connection several respondents expressthat it depends on where they meet road trains. For example whether there isa cycle track.4) If you meet an EMS vehicle: Is this experience different from meeting or-dinary road trains (yes / no)?
Tetraplan A/S
Grontmij | Carl Bro A/S
The Danish Road DirectorateTest with European Modular System – Midway ReportAppendix 3 A: Survey from Danish Cyclist Federation
Page 2
* Out of the 15 respondents having replied to, whether meeting with the EMSvehicle was different from meeting ordinary road trains, 7 finds (approx. 47%) that the meeting was different, while 8 (approx. 53%) find that there is nodifference5) If yes, how did you find the meeting was different?* 9 respondents responded to how the meeting with the EMS vehicle was dif-ferent and their replies are within the areas surprising, larger air pressureand the considerable size of the EMS vehicles.6) Do you find that EMS vehicles are more dangerous for cyclists than otherroad trains (yes/no)?78 % of the respondents find that EMS vehicles are more dangerous for cy-clists than other road trains, while 11 % find that they are not more danger-ous than other road trains.7) If yes, what do you base this statement on?36 % of the respondents find that it is the size (length and width) of the vehi-cles that makes them more dangerous, while 16 % find that they are moredangerous because the driver’s possibilities of orienting himself is poorer and14 % find that EMS vehicles are more dangerous because they give moreturbulence when passing.9) Which measures in relation to road trains would increase your feeling ofsafety?There are more suggestions as to how the feeling of safety can be increasedfor the cyclists, e.g. 25 % find that separate cycle tracks could help and 16 %find that it is important to ensure that EMS vehicles are only driving on cer-tain roads (primarily the motorway network).10) Do you think that EMS vehicles can be an environmental gain due totheir ability to handle larger quantities of goods (yes / no)?49 % of the respondents find that there is no environmental gain from EMSvehicles, while 29 % find that there may be an environmental gain.11) Do you think that there is a need for more information to cyclists aboutEMS vehicles and their spread in order to ensure a safety level for soft road-users (Yes/ no)?67 % find that there is a larger need for information to cyclists about EMSvehicles, while 21 % do not agree to thisSelected quotes----”that public funds have been applied for changing road crossings androundabouts in consideration for EMS vehicles””very little, but they are large and more dangerous””Many national politicians are interested in introducing EMS vehicles””that Falster will be influenced by this. Large changes (costs) cross-ings and roundabouts so that other motorists can drive too fast in citycentres to reach Gedser. (In Germany EMS vehicles are not al-lowed)””that the risk of getting sucked under a train/vehicle is higher””They require road extensions in crossings and thus higher speed”
--
Tetraplan A/S
Grontmij | Carl Bro A/S
The Danish Road DirectorateTest with European Modular System – Midway ReportAppendix 3 A: Survey from Danish Cyclist Federation
Page 3
-----------
”in case of side wind the effect on the cycle track becomes larger as ittakes longer before the road train has passed.””When passing by, a longer road train generates a higher risk ofswaying and fall for the cyclist””Yes, longer, larger and more obstructed view for the driver””longer brake length, obstructed view””length, volume (air pressure), survey for driver, rear wheel cuts cor-ner, turning time””The EMS vehicle itself is not dangerous, but cut backs in speeddamping measures are dangerous””that they are forbidden totally together with soft road-users””That they only drive on motorways + express roads or other roadswithout cycle tracks””Lower actual speed, more focus on driver behaviour””forbid them””Marking of the roads, where they are allowed to drive through signs”
Focus group interview14 of the respondents have indicated that they would like to take part in a fo-cus group interview at a later timeWhere did the cyclists meet EMS vehicles?-Horsensvej in Vejle (once)-Marselis Boulevard-In city traffic in Aarhus-Thomas B. Thrige, Svendborgvej 83, Odense-Ferry berth in Kalundborg-On main road (respondent lives in CBH NV)
Distribution of replies to the individual questions (see questions below in theappendix):1) What do you know apart from the above-mentioned about EMS vehicles?No reply1318 %Nothing3345 %Very little912 %Have read and heard about itin the media45%Other1419 %73100 %2) Have you met EMS vehicles in the traffic as a cyclist? If yes, on whichroad section?No reply23%Yes68%No6589 %73100 %3) Do you feel generally insecure when meeting road trains (yes / no)?No reply811 %Yes4460 %No1419 %Tetraplan A/SGrontmij | Carl Bro A/S
The Danish Road DirectorateTest with European Modular System – Midway ReportAppendix 3 A: Survey from Danish Cyclist Federation
Page 4
Other
773
10 %100 %
4) If you have met an EMS vehicle: Is this experience different from meetingordinary road trains (yes / no)?No reply5677 %Yes710 %No811 %Other23%73100 %5) If yes, how did you experience that this meeting was different?No reply6386 %Wind pressure23%Surprise23%Other68%73100 %6) Do you find that EMS vehicles are more dangerous for cyclist than otherroad trains (yes / no)?No reply34%Yes5778 %No811 %Do not know34%Other23%73100 %7) If yes, on what do you base this statement?No reply17Length16Weight2Size in general8Driver’s possibility to orientatehimself12Air pressure10Other8738) If no, why not?No replyNot different from other trucksOther
23 %22 %3%11 %16 %14 %11 %100 %
656273
89 %8%3%100 %
9) Which other measures in relation to road trains would increase your feel-ing of safety?No reply2230 %Separation/cycle track1825 %Forbid them45%Only on motorway/certainroads1216 %Do not know23%
Tetraplan A/S
Grontmij | Carl Bro A/S
The Danish Road DirectorateTest with European Modular System – Midway ReportAppendix 3 A: Survey from Danish Cyclist Federation
Page 5
Other
1573
21 %100 %
10) Do you think that EMS vehicles can be an environmental gain due totheir ability to handle larger quantities of goods (yes / no)?No reply811 %Yes2129 %No3649 %Do not know34%Other57%73100 %11) Do you think that there is a need for more information to cyclists aboutEMS vehicles and their spread in order to ensure that safety level for softroad-users (yes/ no)?No reply68%Yes4967 %No1521 %Other34%73100 %12) Which town and postal code do you live in?No reply30-09991-19992-2999343-399934-499985-599916-699927-7999118-8999109-173
4%0%0%47 %4%11 %1%3%15 %14 %1%100 %
Tetraplan A/S
Grontmij | Carl Bro A/S
The Danish Road DirectorateTest with European Modular System – Midway ReportAppendix 3 A: Survey from Danish Cyclist Federation
Page 6
QUESTIONNAIRE DISTRIBUTED AT DANISH CYCLIST FEDERATION’S NATIONALCONGRESS 2009__________________________________________________________________________Questions about the use and spreading of EMS vehicles
IntroductionEMS vehicles are trucks with a length of up to 25.25 meters and a total weight of up to 60 ton-nes. By way of comparison a normal road train has a length of 18.75 m and a total weight of48 tonnes. The new EMS vehicles are built up by known elements from existing road trainsand will therefore not be broader or higher than existing road trains, but longer and apparentlyalso heavier. The EMS vehicles will at the rear end have the sign ”25 metres”. On the back ofthis paper sketches of the EMS vehicles types driving in Denmark today are shown.Since November 2008 it has, as part of a three-year test arrangement, been allowed to drivewith EMS vehicles on parts of the Danish road network, primarily the motorways. The roadnetwork, which can be applied for driving with these vehicles, is currently being extended.Mainly the extensions comprise road sections having connection to companies and transportcentres with a large need for transport, where the use of EMS vehicles can reduce the totalnumber of road trains driving to and from these companies. The main rule will be that EMSvehicles apply the road network outside of city areas and basically connect transport intersec-tions. EMS vehicles will therefore typically drive on sections where there are no access for softroad-users. However, in connection with e.g. servicing of a number of ports, the EMS vehicleswill have to drive through city areas with soft road-users. This applies to e.g. Elsinore,Kalundborg and Aarhus.As part of the three-year test arrangement, the Road Directorate conducts an evaluation of theaspects with regard to traffic, transport and safety which are connected to the application ofEMS vehicles. The evaluation is conducted by a consultant team consisting of consultantsfrom Grontmij | Carl Bro and Tetraplan. As part of this investigation, it will be of great value tous, if you would help us by replying to below questions.Questions1) What do you know apart from the above-mentioned about EMS vehicles?________________________________________________________________________________________________________________________________________________2) Have you met EMS vehicles in the traffic as a cyclist? If yes, on which road section?________________________________________________________________________3) Do you feel generally insecure when meeting road trains (yes / no)?_________________4) If you have met an EMS vehicle: Is this experience different from meeting ordinary roadtrains (yes / no)?: ____________________
5) Do you find that EMS vehicles are more dangerous for cyclist than other road trains (yes /no)?
Tetraplan A/S
Grontmij | Carl Bro A/S
The Danish Road DirectorateTest with European Modular System – Midway ReportAppendix 3 A: Survey from Danish Cyclist Federation
Page 7
6) If yes, on what do you base this statement?
7) If no, why not?
8) Which measures in relation to road trains would increase your feeling of safety??
9) Do you think that EMS vehicles can be an environmental gain due to their ability to handlelarger quantities of goods (yes / no)?
10) Do you think that there is a need for more information to cyclists about EMS vehicles andtheir spread in order to ensure that safety level for soft road-users (yes/ no)?11). Which postal code area do you live in? ____________________________In connection with the on-going evaluation we would like to interview a number of cyclistsmore detailed about the meeting between soft road-users and EMS vehicles. If you would liketo take part in such an interview of 2 times a couples of hours’ duration, we kindly ask you toinform us of:Name:__________________________________________________________________________Address (or just mail address): _________________________________________________Telephone: _________________________________________________________________
THANK YOU FOR YOUR ASSISTANCE!_______________________
Tetraplan A/S
Grontmij | Carl Bro A/S
The Danish Road DirectorateTest with European Modular System – Midway ReportAppendix 3 A: Survey from Danish Cyclist Federation
Page 8
Four types of EMS vehicles are applied:
Type 1: Truck and semitrailer with dolly
Type 2: Semitrailer tractor w. ord. semitrailer and central axle trailer
Type 3: Semitrailer tractor w. link-trailer and ord. semitrailer
Type 4: Truck with long trailer
Tetraplan A/S
Grontmij | Carl Bro A/S
The Danish Road DirectorateTest with European Modular Ssystem – Midway ReportAppendix 3 B: Survey among ports and transport centres
Page 1
Midway ReportAppendix 3 B: Survey among ports and transportcentresOn the basis of the revised Executive order for transport with EMS vehicleswhich came into force on 1 December 2009, all ports and transport centresare represented here and have nothing to do with the company arrangementwere contacted in writing.Mid December 2009 the contacted ports and transport centres received aquestionnaire about the traffic with EMS vehicles on the location in question.The questionnaire is included at the end of this appendix. As part of the in-vestigation the locations in question were asked, whether any reconstruc-tions had been performed before the transport with EMS vehicles could bepermitted and in that case who paid for these reconstructions.A total of 39 questionnaires were sent out. In spite of several reminders, only22 replies have been received so far, which means a response percentage of56. It can, however, be stated that a number of the replies, which have notbeen returned, are in most cases from more peripheral locations where therehave hardly been any reconstructions or where many EMS vehicles are notexpected to come by.The replies in the returned questionnaires are gathered in a survey wherethe question numbers refer to the following questionnaire. The survey followson the next page.The main conclusions which can be extracted from the questionnaire are:-A total of 9 ports and transport centres have responded that theyhave been responsible for reconstructions on the locations in ques-tion. The reconstructions are described in brief in the questionnaire.During 2008 DKK 12.8m was spent on reconstructions of various lo-cations in addition to the amount spent by the Road Directorate.For 2009 the corresponding figure is DKK 3.025m. After 2009 anotherDKK 500,000 are expected.Most respondents reply that the number of EMS vehicles daily fre-quenting the location almost corresponds to the expected. An esti-mate is that per day a little more than 150 EMS vehicles are frequent-ing the locations in question.15 of the asked reply that the port / transport centre in question is ap-plied as an interchange location, while 5 reply that the location is ap-plied as interchange location for reloading between various transportforms.The respondents’ comments etc. are presented in the questionnaire.There are no big surprises but several of the comments are rather in-formative about the attitude and the expectations to the test with EMSvehicle transport.
---
-
-
Tetraplan A/S
Grontmij | Carl Bro A/S
The Danish Road DirectorateTest with European Modular System - Midway ReportAppendix 3 B: Questionnaire for ports and transport centres
Page 1
Response to questionnaire for ports and transport centresLocation / question2Rrecon-structionsDate foron ownparticipa-tionarea?in the test13Number ofreconstruc-tions5Otherexpectedreconstruc-tionsCost of reconstruction42008Aabenraa Port01-09-2009 NoArrangedspace forparking anddecoupling ofEMS2009No67891011Advantagesfrom use ofEMS12Disadvan-tages fromuse of EMS13
If yes,which
Paid forreconstructions
Number of actual No. of EMS perday onEMS compared toaverageexpected numberLess1More
Location
Use of transport centrePointed out byInterchaneditorTrimodalt ge loc.Other111
Other issues
Aalborg PortBrøndby Interchangelocation; Industrivej
Nov. 08
Yes
3.500.000
No
Port itself
As expected
7-10 no WIM)
8
1
No immediateadvantages/disadvantages
Brøndby Interchangelocation; Park Allé
Brøndby Interchangelocation; PriorparkenOutside city,but still closeto, direct tomotorway.
Esbjerg Port
Nov. 08
Yes
Interchange loca
700.000
No
Port itself
1 5-6 pcs
6
1
No
NoIf opened for transportwith EMS to Germany,then a competitor to thefeeder traffic ofcontainers should beexpected, especially ifthe tonnage follows upto 60 tonnes
Fredericia PortFrederikshavn Port
Nov. 08Nov. 08
NoNo
NoNo
1As expected
0-5 Largefluctuations10
310 No
1PartlyTransitNoNo
Gedser Port
Tetraplan A/S
Grontmij | Carl Bro A/S
The Danish Road DirectorateTest with European Modular System - Midway ReportAppendix 3 B: Questionnaire for ports and transport centres
Page 2
Location / question
2Rrecon-structionsDate foron ownparticipa-tionarea?in the test
1
3Number ofreconstruc-tions
5Otherexpectedreconstruc-Cost of reconstructiontions20082009
4
6
7
8
9
10
11Advantagesfrom use ofEMS
12Disadvan-tages fromuse of EMS
13
If yes,which
Paid forreconstructions
Number of actual No. of EMS perEMS compared today onexpected numberaverageLessMore
Location
Use of transport centrePointed out byInterchaneditorTrimodalt ge loc.Other
Other issues
Grenaa PortSept. 09Haderslev Interchangelocation
No
No
1 10-15
Ferry to12 Sweden
Othergoods
The impressionis that it worksreally well andthat the add.capacityavailable withEMS is totallyexploited. EMSmaneouvresaround the portwithoutproblems.
We cannotsee anydisadvan-tages
Hanstholm Port
01-12-2009 NoAccess to andfrom ferrydeploymentarea andupgrading oflight signal.
No
On thebasis ofresponses fromhaulagecontractors a wideuse ofSo far no EMSEMS can in the Port. Abebit hesitatingexpected - attitude. Willlargerthey be allowedthanin Northernexpected! Germany?
Distributioncentre for1 fresh food
Highertransportcapacity for theEuropeanmarket forgoods landedin Hanstholm. NoVery fewadvantages buta necesssity tomaintain thecompetitionwith theOresundBridge.None found.
No
Helsingør Port
01-07-2008 Yes1 new road and3 roundaboutstaken care ofby the RoadDirectorate.01-12-2009 Yes
2.500.000
-
No1 Recon-structionof round-about,costapprox.DKK350,000
The port
As expected
4-5
5
For ferrytraffic
No
Herning-IkastTransport centre
1.800.000
Yes
100 % municipality!
No experiences
No experiences
Logisticscentre formoreproduction1 companies
Improvedcapacityutilization, lesstraffic andNopollution.experience
Tetraplan A/S
Grontmij | Carl Bro A/S
The Danish Road DirectorateTest with European Modular System - Midway ReportAppendix 3 B: Questionnaire for ports and transport centres
Page 3
Location / question
2Rrecon-structionsDate foron ownparticipa-tionarea?in the test
1
3Number ofreconstruc-tions
5Otherexpectedreconstruc-Cost of reconstructiontions20082009
4
6
7
8
9
10
11Advantagesfrom use ofEMS
12Disadvan-tages fromuse of EMS
13
If yes,which
Paid forreconstructions
Number of actual No. of EMS perEMS compared today onexpected numberaverageLessMore
Location
Use of transport centrePointed out byInterchaneditorTrimodalt ge loc.Other
Other issues
Hirtshals PortHirtshals TransportCentreHorsensTransportcentreHøje-TaastrupTransport centre
24-11-2008 NoNov. 08Yes2 roundabouts--
NoNoRoad Directorate
As expectedAs expected
1-35
25 Ferry/vehic1
Delivery ofgoods tocompanieson the areaof the port.
With reg. totransport withEMS on theport ara nospecialadvantageshave beenidentified.There seemsto beadvantages inrelation totransport costsconsideringtransport ofgoods to theport with EMS.More space
Nodisadvantages fromtrafficing theWhen the motorwayport withbetween Larvik andEMS havebeen found Hirtshals has beenconsidering finished a notiableincrease in the numberthat thevehicles are of EMS passing the portto Norway is expected.using theThe reason is theexistingroads in the obtained efficiency andport without the fact that theany inconv. motorway is expected tofor other road- be approved forusers.transport with EMS.A new motorwayNoextension in the spring
Nov. 08
Yes
1 vejsving og sm
150.000
No
Transport centreand municipality
1 29-30
30 Yes
Especially Recommenda Many
Nothing
EMS should not beusing roads with cycletracks.
Jyderup Interchangelocation
24-11-2008 No
None
No
1 30-40
1
1
Allows deliveryof goods withEMS tocustomer onWesterSealandwithout largeextra costs, wedrive with lessvehicles forour traffic toSweden. Totayall transport toand fromSweden is withEMS.None
Extra costs areconnected to transportswith EMS as long as wecannot delivery directlyto the customers.
Kalundborg PortKastrup Goodsregistration centre
Nov. 08
No
No
1
10-15
12
1
Transfer ofEMS on thefreight lineKalundborg -1 Aarhus.-
-
-
Tetraplan A/S
Grontmij | Carl Bro A/S
The Danish Road DirectorateTest with European Modular System - Midway ReportAppendix 3 B: Questionnaire for ports and transport centres
Page 4
Location / question
2Rrecon-structionsDate foron ownparticipa-tionarea?in the test
1
3Number ofreconstruc-tions
5Otherexpectedreconstruc-Cost of reconstructiontions20082009
4
6
7
8
9
10
11Advantagesfrom use ofEMS
12Disadvan-tages fromuse of EMS
13
If yes,which
Paid forreconstructions
Number of actual No. of EMS perEMS compared today onexpected numberaverageLessMore
Location
Use of transport centrePointed out byInterchaneditorTrimodalt ge loc.Other
Other issues
01-09-2009 NoKolding PortKøge Port+A21Køge TransportCentre (ScandinavianTransport Centre)Nov. 08No, transportcentre wasprepared.
No
1
1-5. Not knownas there are noduty to report.
2
1
1
This is tooearly to say.However it willbe ofimportance forthe marketing This is tooof the port.early to say.
-
No
As expected
25
25
1
Look forward to KøgePort being connected.
Nørre Alslev Goodsregistration centreOdense ErhvervshavnOdense Port terminal /LindøterminalThe interchangelocation is not used verymuch, as it is said to betoo expensive to use itand they prefer to drivedirectly from company tocompany.
Odense Interchangelocation
Nov. 08
No, onlywhat wascarriied outby the RoadDirecto-rate!Yes, seeAabenraaMunicipality'sreply (whichwe cannotfind!?)No
No
As expected
1-2
2
1
Padborg TransportcentreNov. 08Ringsted InterchangelocationNot startedRødbyhavn TrafikhavnSlagelse TransportcentreNov. 08Taulov Transportcentre
YesNo
See replyfromAabenraaMunicipality (!?!?)
Unknown--
Unknown
1
11
No inconveniences!No.
No
No
1
1-3
2
1
Uldum Interchangelocation
Sept. 09
No, newconstruc-tions plannedfor thepurpose.
No
As expected
5 andincreasing
5
Primarily forJysk's ownneed.
Economy inthe transportand then lesstrucks on thecadaster.
Lack ofspace in thearea andthus"dangerous"or blockedparkings.
Transports to all ofScandinavia would beappropriate!
Tetraplan A/S
Grontmij | Carl Bro A/S
The Danish Road DirectorateTest with European Modular System - Midway ReportAppendix 3 B: Questionnaire for ports and transport centres
Page 5
Location / question
2Rrecon-structionsDate foron ownparticipa-tionarea?in the test
1
3Number ofreconstruc-tions
5Otherexpectedreconstruc-Cost of reconstructiontions20082009
4
6
7
8
9
10
11Advantagesfrom use ofEMS
12Disadvan-tages fromuse of EMS
13
If yes,which
Paid forreconstructions
Number of actual No. of EMS perEMS compared today onexpected numberaverageLessMore
LocationExtension ofroundaboutandconstruction ofnewroundabout,change of roadwidth and sweppaths
Use of transport centrePointed out byInterchaneditorTrimodalt ge loc.Other
Other issues
Vejle Transport centre Nov. 08Vordingborg PortAarhus North PortAarhus South Port
Yes
1.500.000
1.500.000 No
Transport centre
20-25 inJanuary 2010they will have aWIM capable ofConsidera countingbly larger precisely
22
Distributioncentre/truck1 traffic
No specialadvantages
No founddisadvantage No, should bave beensintroduces much earlier.
Årslev Industrial areaTotal:
Sep. 09
Roads inAarslevIndustrialArea havebeenadapted as aconsequenceof the EMS Projecttest. This has adjustmentsbeen done in out of conside-connec-tion ration for EMSwith construc- cannot betion of roads extracted fromin the area. the projects.
Consequential cost forthe EMSadjustmentscannot beextracted.10.150.000
Not for Aarslev Industrialarea. A local extentionof the test in AarslevMunicipality is beingconsidered. A number ofapplications have beensent in and a dialogueabout the determinationof a road network to beinvestigated as well asfinansing of theinvestigation as well asreconstructions.1.500.000
Construction costsfor AarslevIndustrial areahave been coveredas part of the sitedevelopment whichis performed forthe account of themunicipality but asa principle formspart of the salesprice for the areas.
There were no expectations fromAarhus Municipality about the numberof frequenting EMS, as well as themunicipality have not made anyregistrations about the number of-EMS.5,004,0041,00
Aahus Municipality does not haveany particular knowlege about howEMS is actually applied, but theimpression is that it is a questionabout both companies situated inAarhus Port and in Aarslev IndustrialArea appling EMS and that othercompanies apply Aarhus Port andAarslev Industrial area forinterchange. More precise detailsshould be collected from theindividual companies in AarslevIndustrial area. A possible contact tothese could be Preben Juste fromAarhus Transport Group,[email protected]152,005,0015,00
AarhusMunicipalityhas no exactknowledgeabout this.
As a part of the test,more interchangepossibilities should havebeen established withdirect connection to themotorway network. Itshould have been mademore clear how theRoad Directorateinterprets the obligationto ensure free and directaccess to the areasconnected to the EMSAarhusroad network, and theMunicipality purely practicalhas no exact conditions /obligationsknowledgeshould have beenabout this.cleared prior to the test.
Tetraplan A/S
Grontmij | Carl Bro A/S
Evaluation of test with transport with EMS vehicles- questionnaire for transport centres and portsDear receiver of this letter
11 December 2009
Since November 2008 it has, as you may know, been allowed to apply EMS vehicles on selected partsof the road network and on a number of transport centres and ports.We are writing to you, because you work at a transport centre or in a Port comprised by the test withEMS vehicles. The Road Directorate is responsible for this test and has asked Grontmij | Carl Bro incollaboration with Tetraplan to conduct an evaluation of the 3-year test.As part of this evaluation we will ask you to answer a number of questions. If you have comments to theevaluation, you are most welcome to contact the signer.You are kindly asked to return the questionnaire as soon as possible and on17 December at the lat-est.Please note.Below on page 2 it is possible to add further comments / replies.We thank you very much in advance for your assistance.1. Since when have you been part of the test with EMS? Date: _________________2. Have any reconstruction at the transport centre’s / Port’s own area been performed in connec-tion with the introduction of EMS vehicles in order to ensure access to the transport centre forthe EMS vehicles (yes/no)?__________3. In that case, how many reconstructions have been made? (indicate number and type: E.g. 1roundabout, 2 left turns, etc.)
______________________________________________________4. What was the cost of the mentioned reconstructions in DKK in 2008 _________ and in2009________?5. Are performance of other reconstructions in relation to the test with EMS vehicles expected?No, no actual plans _____ Yes, ____6. If Yes, which (write number and type: E.g. 2 right turns, etc.)? Kindly indicate the estimatedamount set off for the reconstruction(s): ____________________ ______________________7. Who did in that case pay for the performed reconstructions (Make more crosses and markedthe distribution with percentage or size of amount):Transport centre / port: _________Municipality: ________Private actors: _________Other: _________8. Consider whether the number of visiting EMS vehicles is higher or low than expected when thetest was decided (in 2007): ___________________________9. How high an amount of EMS vehicles is estimated to apply the transport centre /port per day onaverage? Write number: __________________
Tetraplan A/SKronprinsessegade 46 E1306 København K
Tel. +45 33 73 71 00Fax +45 33 73 71 01www.tetraplan.dk
Grontmi | Carl Bro A/SGranskoven 82600 Glostrup
Tlf. +45 4348 6060Fax+45 4348 6898www.grontmij-carlbro.dk
page 2
10. Transport centres / ports are often regarded as goods intersections, where various transportforms meet. In the case of EMS vehicles it is, however, the perception that the transport centres/ports primarily are to function as interchange locations. For what is the present transporter /portprimarily applied in connection with the test with EMS vehicles?- As goods intersection where various transport forms meet: ______- As interchange location: ______- Other – describe: _____________________________________________________11. Are there special advantages connected with the use of /transport with EMS vehicles on thetransport centre’s / port’s area (could it be an impression of an improved capacity utilization ofroad trains and therefore less traffic and crush, less pollution, etc)? Describe the advantages,preferably in priority listing the most important advantages first:
______________________________________________________________________________________________________________________________12. Are there special disadvantages with the use of / transport with EMS vehicles on the transportcentre’s / port’s area (could be traffic safety conditions, manoeuvre skills, blocking of other road-users, critics from other road-users, increasing number of bumping into signs or other things?)Describe the disadvantages, preferably in priority listing the most serious disadvantages first:
______________________________________________________________________________________________________________________________13. Are there other conditions in connection with the test with EMS vehicles that you would like tocomment on?____________________________________________________________________________
Questionnaire filled in: Date: __________ Location (centre / port): ____________________________Name: _________________________ Information on you (tel./mail): __________________________
Once again thank you for your assistance.
Best regardsGrontmij | Carl Bro A/S in collaboration with Tetraplan A/Sv/ Henrik TornbladGranskoven 82600 GlostrupTel: +45 4348 6075 E-mail: [email protected]Any further comments to one or more questions:Question no.Comment:
Tetraplan A/S
Grontmij | Carl Bro A/S
The Danish Road DirectorateTest with European Modular System – Midway ReportAppendix 3 C: Interview with companies and drivers
Page 1
Midway ReportAppendix 3 C: Interview with companies and driversIn connection with the evaluation of the test with European Modular Systema number of interviews are to be conducted with the actors being variouscompanies and drivers daily applying EMS vehicles.In order to identify some of the major actors, the transport trade’s two mainorganisations in collaboration with Statistics Denmark have been asked toselect a number of companies supposed to apply EMS vehicles in their dailytransport work. On the basis of this selection the evaluation team has se-lected 10 companies assessed to have a geographical spread and a spreadon various types of transport work, including transport of various commoditycategories.Among the 10 companies it is the intention to conduct 3 qualitative interviewsin the autumn of 2009, 4 in the spring of 2010 and finally the last 3 in the au-tumn of 2010. To the extent possible the intension is to interview a manager,e.g. a transport manager or a department manger and 1 to 2 drivers from thesame company.A total of 20 qualitative driver interviews are to be conducted. These are di-vided into 6 in the autumn of 2009, 7 in the spring of 2010 and 6 in the au-tumn of 2010.The survey below shows the 10 companies selected for the interviews in-cluding comments on their location and reason for selection.DateAutumn2009:Company name LocalisationPer DamgaardTransportPadborgCharacteristicsTransports for Trans-portgruppen – espe-cially national trips.Transporting volumegoods/grocery goods– often Sweden andFinland.Large haulage com-pany – broad entry ofnew customersReason for selectionWe get the southern partof Denmark covered andpartly the transports fur-ther southwards.Actually outside the net –but apply EMS quite alot.Interview conducted inJyderup, so we have theKalundborg route cov-ered.
Autumn2009:
Alex AndersenØlund
Odense
Autumn2009:
Frode Laursen
Hinnerup / Jy-derup
Spring2010:
Jørgen JensenDistribution
Ikast
Member of Transport- Location in Ikast – at thegruppen.border of the net. Haspurchased variousequipment (dolly + cen-tral axle trailer) in orderto comply with the de-mand).Grocery goods distri-bution.Should be able to coverterminal/terminal andterminal/distribution
Spring2010:
Arla Distribution
Hobro
Tetraplan A/S
Grontmij | Carl Bro A/S
The Danish Road DirectorateTest with European Modular System – Midway ReportAppendix 3 C: Interview with companies and drivers
Page 2
DateSpring2010:
Company name LocalisationC. Schmidt &SønHerning
Characteristics
Reason for selection
Transports for Danske Actively promoting EMS,Fragtmænd. Was out- etc.side the net at thestart of the test.Solely transportingcontainers – solelydirect to customersLarge company – withmuch internationaland national trans-port!Also a member ofTransportgruppen.Rather big transportcompany. Grocerysuch as fruit andvegetables.Location for interviewshould be Aarhus and/ore.g. Høje Tåstrup.Esbjerg should be loca-tion, as this is where theold Roland Munch haul-age company is located.Interesting location - out-side the net.
Spring2010:Autumn2010:
Anco Trans A/S
Århus / Ch.
DSV Road
Esbjerg /Brøndby
Autumn2010:Autumn2010:
K. HansenTransportOle LarsenTransport A/S
VejenBrabrand
In addition to the 10 companies 3 ”stand-in companies” have been selected,which could replace one of the above-mentioned. The 3 stand-in companiesare:---Esbjerg GodstransportPoul SchouKim Johansen International
As mentioned above, the drivers to be interviewed, will typically come fromthe same companies. The 6 drivers interviewed in the autumn of 2009 comefrom the following companies:----Alex Andersen ØlundFrode Laursen (with two drivers)Per Damgaard TransportC. Schmidt & Søn (also with two drivers).
For the company interviews as well as for the driver interviews the same in-terview guide was applied, however so that the drivers were questionedabout a number of additional subjects with regard to the specific driving ofand traffic with EMS vehicles. On the following pages the interview guide isrendered, which has formed the basis of the interview conducted during au-tumn 2009. As it appears, the driver interviews are longer, as they compriseup to and including question 50, while the company interviews only compriseup to and including question 28.A study of the replies from the 3 company interviews and the 6 driver inter-views in the autumn of 2009 reveals in summarised form the following ten-dencies:-Tetraplan A/S
EMS vehicles are applied very differently by the trade:Grontmij | Carl Bro A/S
The Danish Road DirectorateTest with European Modular System – Midway ReportAppendix 3 C: Interview with companies and drivers
Page 3
-
--
-
-
-
-
-
Some only apply the system for terminal drivingOther apply it almost only in connection with interchanges inspite of the fact that this is time consuming and consequentlyexpensive.Various considerations lie behind this (thinking in grooves, needs,price and safety) provision of the various types of EMS vehicle units:The link-trailer is the most spread followed by the dolly.EMS vehicles are especially well-suited for volume goods (light food,flowers, general goods).The capacity of the EMS vehicles is exploited even as well andmaybe even better than of common road trains. This may be due tothe fact that EMS vehicles are not applied unless there is a capacityneed for this.Estimated savings from driving with EMS vehicles are between 10and 20 %. Depending on goods type, customer relation, etc. the sav-ings are more or less shared with the customers.Even if a road train must be interchanged on an interchange locationand it normally requires somewhat more planning/coordination of thetransport, EMS vehicles are applied quite often for national trans-ports.As expected, typically the older and more experienced drivers driveEMS vehicles. A Swedish driver found it interesting that earlier Dan-ish drivers were reluctant just to sit behind the wheel in an EMS vehi-cle.Some drivers have gone through some sort of training. The main partof the drivers find, that training in driving with an EMS vehicle shouldbe compulsory.Both Danish as well as foreign drivers are applied for the transportwith EMS vehicles.oo
Tetraplan A/S
Grontmij | Carl Bro A/S
Evaluation of Test with European Modular System
INTERVIEW OF EMS VEHICLE DRIVERS – conductedonboard the vehicle1The four below types of EMS vehicles are applied:
Type 1: Truck and semitrailer with dolly
Type 2: Semitrailer tractor with ordinary semitrailer and central axle trailer
Type 3: semitrailer tractor with link-trailer and ordinary semitrailer
Type 4: Truck with long trailer
1. For each of the 4 types of EMS vehicles, kindly reply to the following questions:Type 1A. Do you usethis type for na-tional transport?B. Do you usethis type for in-ternationaltransport?C. How many ofthis type do youhave in yourcompany?1
Both companies and drivers will be asked to and including question 28, while all questions will be gonethrough with the drivers in on-board interviews, where the route is at the same time video-filmed (2hours have been allotted per driver interview).Tel. +45 33 73 71 00Fax +45 33 73 71 01www.tetraplan.dkGrontmi | Carl Bro A/SGranskoven 8DK-2600 GlostrupTel. +45 4348 6060Fax+45 4348 6898www.grontmij-carlbro.dk
Tetraplan A/SKronprinsessegade 46 EDK-1306 Copenhagen K
Page 2
Are there any special advantages /disadvantages about the individual types with regard to:D. Cost, withregard to in-vestment:E. Costs pertransportedamount of goods(tonnes), opera-tionally:F. Manoeuvrecapability:G. Load capacityH. Other:
No
2. Are other tractors applied than is the case with traditional road trains? (With regardto particularly number of horse powers / moment of rotation and any other con-struction of the tractor)YesDifference:
3. On which sections are the EMS vehicles driving:a. Motorway no.b. Main roadc. Transport centre d. Portno.
e. City area
4. At which times of the day and week are the EMS vehicles driving? Is there anyspecific explanation to this condition?a. Dayb. Specific dayc. Nightd. Other
5. Are there differences in above-mentioned patterns (times of driving – days and weekdays) depending on traffic direction (north/south or east/west)?YesNoDon’t know6. If yes, why is thisa. Goods quantitiesb. Logistics patternsc. Other7. What are the typical distances when driving with EMS vehicles stated at trip level. (km-distance per trip)0-50 km50- 100 km100- 200 km200-300 kmmore than 300km8. Are there differences between these trip distances and normal road train trip dis-tances?YesNoDon’t know
Tetraplan A/S
Grontmij | Carl Bro A/S
Page 3
9. If yes, can this then be explained by:Which goods types theEMS vehicles transport?Which geographic rela-tions they service?10. Which intersections (terminals, ports, transport centres, etc.) and service and rest ar-eas are applied – and for what?Intersection (name)ParkingInterchangeOther
11. Are interchanges with EMS vehicles made per trip?Noa.Yes, oftenb.Yes, frequentlyc.Yes, but rarelyd.12. Are interchanges with EMS vehicles made on special / selected trips?YesNoDon’t know13. If yes, which trips (describe location and type of trip):
14. Has the application of EMS vehicles led to use of other routes than earlier?YesNoDon’t know15. If yes, which advantages and disadvantages are attached to this?AdvantagesDisadvantages16. Have there been any route shifts in connection with the extension of the road networkin September 2009?YesNoDon’t know17. If yes, which routes will be applied?Indication of route:
Tetraplan A/S
Grontmij | Carl Bro A/S
Page 4
18. Are any route shifts expected in connection with the expected extension of the roadnetwork in December 2009 (with Gedser, Hundested and Hanstholm, Herning, Ring-sted)?YesNoDon’t know
19. If yes, which routes will be applid?Indication of routes:
20. Are there specific requests for more EMS vehicle routes?YesNoDon’t know21. If yes, which would this be?Requested EMS vehicle route:
22. Which goods types are typically transported by EMS vehicles (more types can beticked off)?GodsDescription (NST 2007)Tick off if yesNo.01Agricultural -, hunting -, forestry – and fishery products02Coal, crude oil and natural gas03Ore and other mine - and gravel products04Food and beverage, and tobacco05Textiles and textile products, leather and leather products06Wood and wood products, steel material, cellulose and paperproducts, printed matter and recorded media07Coke and refined oil products08Chemical products and synthetic fibres, rubber and plastic prod-ucts, nuclear fuel09Other non-metallic – mineral products
Tetraplan A/S
Grontmij | Carl Bro A/S
Page 5
GodsNo.1011
Description (NST 2007)Metals and manufactured metal products, except machinery andequipmentMachinery and equipment, office equipment, computers, electricmachines, radios, televisions, communication equipment, medi-cal equipment, precision equipment and optical instruments,watchesTransport equipmentFurniture and other manufactured goodsRecycling material, municipal waste and other sorts of wasteLetters and packagesEquipment and materials applied for transport of goodsFurniture, baggage, motor vehicles for repair, etc.General goods (carrier goods)Non-identifiable goodsContainerSwap bodyOther goods
Tick off if yes
1213141516171819202122
23. Which similarities and differences are seen in relation to traditional road trains?SimilaritiesDifferences
24. Is the capacity utilization in EMS better or poorer than is the case with traditional roadtrains?, and evaluation of the capacity utilization (calculated in tonnes and volume – oranother measure)Better capacity utilizationPoorer capacity utilizationComments25. Do the customers (end-users, it may be shippers or other logistics planners such aspurchasers) understand how to exploit the possibilities of EMS vehicles, or is this en-tirely up to the haulage contractor or shipper to plan this?YesNoComments:26. How do you experience the driving with EMS vehicle compared to a traditional roadtrain. Is it in practice more difficult to drive an EMS vehicle compared to other ordinaryroad trains?EasierMore difficultComments:27. If yes, where do the problems occur (and are they attached to specific EMS vehiclecombinations):A. When passing crossings (clearing period)YesNodon’t know
Tetraplan A/S
Grontmij | Carl Bro A/S
Page 6
B. By turning manoeuvresYesNoC. When driving in roundaboutsYesNoD. At entry/exit to motorwaysYesNo
Don’t know
Don’t know
Don’t know
E. In relation to other road-users (motorists, cyclists, pedestrians)YesNoDon’t knowF. Rise on large bridgesYesNo
Don’t know
G. Irregular driving, including queuing, catastrophe braking and distanceto other vehiclesYesNoDon’t knowH. Passage/overtaking of slow driving vehiclesYesNo
Don’t know
I. Sidewind sensitive (especially on open sections and larger bridges)YesNoDon’t know
28. How are the safety aspects experienced when driving with EMS vehicles:A:BetterPoorerDon’t knowB. In relation to motoristsBetterPoorerC. In relation to soft road-users/cyclistsBetterPoorer
Don’t know
Don’t know
D. Do EMS vehicles meet soft road-users at all?YesNoDon’t know
29. To what extent are you familiar with the approved EMS road network?FamiliarNot familiar30. To what extent are EMS vehicles applied outside the approved road network?AppliedNot applied31. How do you receive information about this network including information on updates(extensions/changes) of the network?A. Haulage co.B. 3FC. MeetingsD. JournalsE. Internet
Tetraplan A/S
Grontmij | Carl Bro A/S
Page 7
F. Other: Please indicate:32. Which qualifications are required for driving EMS vehicles?FormallyActually
33. Have you gone through any special training /education before drivng with EMS vehi-cle?AppliedNot applied34. If yes, which training / educationa. Where?b. For how long time?c. Which subjects?35. Should it be mandatory to receive training /education before being allowed to driveEMS vehicles?YesNoDescription (Subjects, etc.:
36. Which drivers drive EMS vehicles in practice?AgeExperience
Education
37. Has EMS meant changed working houses for the drivers?YesNoDescription38. If yes, what is the reason for these changes and how does it work/does it cause anyproblems?Description
39. Do EMS in Denmark drive with foreign vehicles / drivers?NoYesDon’t know:40. Yes, to which extent are foreign vehicles /drivers driving in DK with foreign vehi-cles/driver ,More than 50 %:Below 50 %:Quantity:41. How do you experience space and capacity conditions on the permitted service andrest areas?A: Unchanged - goodB. Changed – good/betterC. Unchanged - badD: Changed – bad/worse42. Which advantages do you experience when driving with EMS vehicles compared toe.g. trucks with trailer and semitrailers?
Tetraplan A/S
Grontmij | Carl Bro A/S
Page 8
43. Which disadvantages do you experience when driving with EMS vehicles compared toe.g. trucks with trailer and semitrailers?a. Truck / trailerb. Semitrailer
44. Which types of EMS vehicles are you driving/have you been driving?Type 1, DollyType 2, central axleType 3, LinkType 4, Long trailertrailer
45. Are the above advantages and disadvantages of EMS vehicles connected to the EMSvehicle type or are they of general character?With the EMS vehicletypeOf general character46. Do other truck drivers (not driving EMS vehicles) notice EMS vehicles?YesNoDon’t know47. If yes, how is this experienced / which reactions are there primarily from these?a. Positiveb. Negativec. Indifferentd. Other
48. Do other road-users (and truck drivers) notice the EMS vehicles?YesNoDon’t know49. If yes, how is this experienced/Which reactions are the primary ones?a. Positiveb. Negativec. Indifferentd. Other
50. How do the drivers assess the effects of extending the road network with regard to ex-tent of transport/use of EMS vehicles and the various road trains’ interplay with theother traffic (read especially: ”soft road-users”.a. Positiveb. Negativec. Indifferentd. Other
Tetraplan A/S
Grontmij | Carl Bro A/S
Page 9
Below map is from the Danish Road Directorate’s executive order of September2009.Roads and destinations forEMS vehicles 2009PortAirportTransport centreInterchange locationsGoods registration centreService areasPhase 1 (2008)Phase 2A (Sep. 2009)Phase 2B (Dec. 2009
Traffic areas for the test with EMS
Tetraplan A/S
Grontmij | Carl Bro A/S
Appendix 4: Master files for individual partial sections
The Danish Road DirectorateTest with European Modular System – Midway ReportAppendix 4: Master files for the individual partial sections
Page 1
Midway ReportAppendix 4: Master files for the individual partial sec-tionsOn the following pages follows master files for each of the 64 partial sectionsinto which the EMS vehicle road network has been sectioned. The sectioningfollows the identification numbers for each individual road section shown in be-low figure.Each master file contains a survey map, where the section in question has beenroughly marked. In addition to this traffic volumes for one or two MIW devices onthe individual partial sections have been indicated.
Test road networkdivided into phasesand sectionsPhase 1 (2008)Phase 2A (Sep. 2009)Phase 2B (Dec. 2009)
Figure 1 The phase divided road network sectioned into partial sections with ID no.
The Danish Road DirectorateTest with European Modular System – Midway ReportAppendix 4: Master files for the individual partial sections
Page 2
Finally each master file contains information on traffic accidents on the section inquestion. These are traffic accidents involving trucks. As it appears from themaster file’s accident part, there is a statement of the number of accidents onthe section and a statement of the number of elements involved in the number ofaccidents in question. It should be noticed that more elements can involved inan accident, which is why the number of ”Elements” can be higher than thenumber of ”accidents”.As it appears from the master files, there is a number of sections for which notraffic volumes are indicated. This may either be the case for all the years or forsome of the years. If data is missing for all the years, this is due to the fact thatthere are no permanent or semi-permanent WIM devices on the section in ques-tion which can count the EMS vehicles.A semi-permanent WIM device is a counting station which only counts 5 weeksa year, typically before and after the summer. Since it is not of decisive impor-tance for the present analysis that the traffic data are collected over 5 or 52weeks over a year, it has not been stated in the following master files, whichcounts are permanent and which are semi-permanent.In total there are 24 partial sections, that is master files, for which there are notraffic data available.In addition to this 7 of the master files primarily covering the superior road net-work around the Capital city, only have traffic counts in TRIM. No data has beenextracted for these sections.The accident figures include extra accidents. An extra accident is an accidentwhere the police has registered an accident but not prepared a report. It is aquestion about material accidents where the damage is normally of no impor-tance.In relation to the pre-test report, which in principle covered to and including 2008it has later turned out that for a large part of the WIM devices the case is that thefigures were never updated. Therefore the informed traffic figures cannot in allcases be compared directly between the two reports. In the same way it can bepointed out that for certain sections in the midway report, AADT for transportwith EMS vehicles in 2008 is included, which was not included in the pre-test re-port.Furthermore it has turned out that a number of WIM devices applied for the re-porting in the pre-test report cannot count EMS vehicles. Therefore it has beenchosen to apply data from WIM devices on the particular section capable ofcounting EMS vehicles. In such cases a note is inserted in the master file in thefield “Remark”. Furthermore, the traffic figures for all the years have beenchanged in the midway report’s master files so that these reflect traffic volumesfor the WIM devices in question. This means that the traffic figures in such casescannot just be compared between the pre-test report and the midway report. Inreturn the traffic figures in the midway report can be mutually compared betweenthe individual years.
The Danish Road DirectorateTest with European Modular System – Midway ReportAppendix 4: Master files for the individual partial sections
Page 3
In the master files the following definitions are applied:AADT:SoloTWTSTTTSEMSTRE10SSAnnualAverageDailyTraffic – corresponding to the average dailytraffic on a given section with a given vehicle type.Solo trucks and bussesTruck with trailerSemitrailerTruck with trailer or semitrailerEuropean Modular System vehicleTruck – designation for all truck types except Semitrailer andEMS vehicles.E10 (ESAL10) is defined as the number of 10 tonnes axles giv-ing the same impact on a road pavement, as all the actual axleloads in a given period. E10SS means that the E10 calculationsare done in relation to a ”Super Single”, which means that eachaxle only has one wheel.Indicates that no accidents have been found in the location ofthe category in question for the year in question.This is an abbreviation for ”non-applicable, indicates that eitherthere is no detailed accident data for the section in question inthe year in question or traffic data is lacking for the section inquestion in that particular year. If NA is stated for a given yearoutside the row with AADT, this means that there are no data forthe year in question and that data cannot be found for the yearin question for the various trucks.
A ”0”:”NA”
The Danish Road DirectorateTest with European Modular System – Midway ReportAppendix 4: Master files for the individual partial sections
Page 4
Master file no.Main sectionPhase / road typeVersionDateRemark
101Frederikshavn – Aalborg1 (2008) – Motorway (main part) + Urban road313-04-2010
MIW ID80080316Traffic volumeAADTSoloTWT
LocationNear Thorup20049.90056986920059.977562860200610.166568871200711.487588966200810.576568926200910.52351877220102011
EMSE 10SS2.0582.0372.0612.2652.173
61.848
AccidentsNumberof acci-dents
200371653
20041321186
20058
2006121
200716115710
200892782
200931221
2010
2011
TotalPersonal injuryMaterial damageTVSTEMS
844
1148
Please be advised that on the following pages the Danish version of the midway reportcontains 64 master files with data on traffic volume and accidents. Each master file issimilar to the table on the current page, except for the fact that it covers another road sec-tion. The additional 63 master files could be made available upon request, but only in Dan-ish.
Numberof ele-ments
Appendix 5: Master files for individual locations
The Danish Road DirectorateTest with EMS vehicles – Midway ReportApppendix5: Master files for the individual locations
Midway ReportAppendix 5: Master files for the individual locationsThe following pages are master files for each of the areas having been recon-structed in connection with the introduction of EMS vehicles. In total there are58 master files each covering an area.Each area contains at least one location which has been reconstructed with aview to ensuring manoeuvrability for an EMS vehicle. If more turning manoeu-vres should be taken into account, a location can have more reconstructions.Totally the amount of locations is 150.In spite of the fact that more locations have been reconstructed with the pur-pose of being capable of handling EMS vehicles, the reconstruction may havean effect on the total traffic situation, also for the other road-users. As a conse-quence of this, accident data has been collected for the locations in question onall types of vehicles including cycles and mopeds.Figure 1 below indicates the amount of personal injury and material damageaccidents, respectively, stated for the locations in phase 1 as well as phase 2.The accidents have been stated for two periods each covering a 5-year period1.PhaseNo. oflocations6288150Personal injury accidents2003 - 2007 2005 – 20093926705310979Material damage accidents2003 - 2007 2005 – 20099892241192339284
Phase 1Phase 2TotalFigure 1: Number of accidents at reconstructed locations in two different periods
As it appears from the figure above, the amount of both types of accidents hasdecreased over time: The amount of personal injury accidents has decreasedby 28 %, while the amount of material damage accidents has decreased by 16%. Whether this is an expression of a general reduction in traffic in the period inquestion will not be discussed further here.The accident figures in the above Figure 1 covers a wide range of variations inthe development of the amount of accidents. In the figure below the locationswith the largest change in the amount of accidents have been included2.
As a rule of thumb accident statistics are calculated for a period of five years, in order to minimise the im-portance of fluctuations from year to year.2Contrary to the normal way in which accident statistics are calculated, over a 5-year period, 2009 has inthis case only been compared to the earlier years in order to assess, whether there are any special fluctua-tions in 2009 compared to earlier years.Tetraplan A/S
1
The Danish Road DirectorateTest with EMS vehicles – Midway ReportApppendix5: Master files for the individual locations
CommentsIn 2009 there was a minor increase in theamount of accidents in the crossings in questioncompared to earlier years. A rise is especiallyseen where the amount of elements rise.132Tappernøje service Up to and including 2008 no accidents were reg-area: 30.03 Eastistered for this service area. In 2009 3 accidentsare registered involving 2 passenger cars and 2trucks.142Kastrup Customs:Since 2006 there have not been accidents in theTSA 16 Southroundabout in question. In 2009 there were twoaccidents involving 5 passenger cars in total.207Brøndby: 11.02At this exit point there is generally a relativelyNorth exithigh number of accidents with passenger cars.This figure has increased in 2009 compared tothe previous years, especially with regard to theamount of passenger cars involved.207Brøndby: 511.01At this crossings there have not been any acci-dents in 2007 and 2008. In 2009 there havebeen 4 accidents involving 4 passenger cars, 2trucks and one cycle.211Hammelev: 50.04This is a roundabout at an exit where there hasbeen a small rise in the amount of accidentswith a somewhat more significant rise in theamunt of involved passenger cars.224.01Hanstholm – Vejle:Since 2005 there have been no accidents in this430-02crossings, but in 2009 there have been 2 acci-dents.225Hanstholm – Vejle:Compared to the previous years, 2009 shows a348.01minor rise in the amount of accidents and espe-cially in the amunt of elements comprising bothpassenger cars, trucks and semitrailers.227Ringsted: 102.01An exit from E20, where a minor rise in theamount of accidents has been registered andespecially the amount of involved elements suchas passenger cars.301Roundabouts onAgain a minor rise in the number of accidents,Grenåvej: 415.01but a somewhat lager rise in the amount of in-volved elements in the form of passenger cars.302Nykøbing Falster:In this crossings there are generally many acci-501.04dents and have been through the entire periodsince 2003. Actually the number of accidents fellcompared to the period from 2006 – 2008, how-ever the amount is relatively high with 5 acci-dents involving a number of various elementssuch as cyclists, passenger cars and trucks.Figure 2: Locations with the largest change in amount of accidents
Master file102
LocationHirtshals: 448.03
As it appears from the above Figure 2, the locations with major changes in theamount of accidents are almost solely characterised by a rise in the amount ofaccidents. Even if the amount of accidents has generally fallen through the lat-est years, cf. Figure 1, this fall has happened on the locations in general.For each location in a given area there is a table in the master files which calcu-lates the amount of accidents and states the amount of elements involved in theamount of accidents in question. Since more elements can be involved in anaccident, the amount of ”elements” can be higher than the amount of “acci-dents”Tetraplan A/S
The Danish Road DirectorateTest with EMS vehicles – Midway ReportApppendix5: Master files for the individual locations
The accident figures comprise extra accidents. An extra accident is an accidentwhere the police has registered the accident, but no reports were prepared. It isa question about material accidents where the damage is not serious.In the following master files the following definitions are applied:PC:TRSTEMSA ”0”:Passenger car also including vansTruck – a common designation for all truck types except forsemitrailers and EMS vehicles.SemitrailerEMS vehiclesIndicates that no accidents have been found in the location ofthe category in question for the year in question.In the cases where no accidents have been registered for anumber of years on a given location, this has been marked withthe text ”No registered accidents”.Please be advised that on the following pages the Danish version of themidway report contains 58 master files with details on the reconstructedlocations and the related figures on accidents. Below you will find an ex-ample of these master files. The additional 57 master files could be madeavailable upon request, but only in Danish.
Tetraplan A/S
The Danish Road DirectorateTest with EMS vehicles – Midway ReportApppendix5: Master files for the individual locations
Page 4
Master file no.Main sectionPoint locationPhase / Rd. typeVersionDateReconstruction
101_01-03_FrederikshavnFrederikshavn – AalborgThree crossings at the port in Frederikshavn1 (2008) / Urban road313-04-2010438.01: Extension of swept path438.01: Extension of swept path438.01: Extension of swept pathConstruction estimate excl. VAT-Constr. price excl. VATKr. 815.0002003020043212121200512006120070200802009020102011
Year of constr.2008438.01Number ofaccidentsNumber of elements
TotalPersonal injuryMaterial dam.PCTRSTEMSCycle/moped438.02
22003120041
020051
12006120072200812009020102011
Number ofaccidents
TotalPersonal injuryMaterial dam.PCTRSTEMSCycle/moped438.03
1
12
11
11
21
12
Number of elements
2
12003020040200502006020071200802009020102011
Number ofaccidents
TotalPersonal injuryMaterial dam-PCTRSTEMSCycel/moped
11
Tetraplan A/S
Number of elements
Grontmij | Carl Bro A/S
Appendix 6: Air pollution and climate impacts
The Danish Road DirectorateTest with European Modular System – Midway ReportAppendix 6: Air pollution and climate impacts
Page1
Midway ReportAppendix 6: Air pollution and climate impacts1. METHODA calculation has been performed of the total emissions of air polluting sub-stances:NOX(Nitrogen oxide)CO (Carbon monoxide)HC (Hydrocarbons)PA (Particles)SO2(Sulphur dioxide)
In addition to this a calculation has been made of the emission of CO2hav-ing an effect on the global heating. The primary negative environmental im-pacts of the emissions appear from figure 1.Sub-stanceAcidificationof water envi-ronmentEutrophica-tion (nitro-gen effecton nature)Photochemi-cal air pollu-tion Tropo-pheric ozoneforesticideBron-chialinfec-tionsCan-cerGreenhouse ef-fect
NOXCOHCPASO2CO2
X
X
XXXX
XXXXX
X
Figure 1: Environmental impacts of emissions from transport
The emissions are calculated for each of the informed sections to the extentthat traffic data has been available. In addition to this a total calculation for allsections was made.The calculations are based on:Estimated emission factors for years 2008-2009 for each vehicle typeTraffic counts from 2008 and 2009 as annual average daily traffic fig-uresRoad sections
No information on specific emission factors for the individual vehicle typeshas been given for the calculation.
Tetraplan A/S
Grontmij | Carl Bro A/S
The Danish Road DirectorateTest with European Modular System – Midway ReportAppendix 6: Air pollution and climate impacts
Page2
The estimation of the emission factors are based on Tema2000, which is atool for calculation of the transport’s energy consumption and emission inDenmark (Ministry of Transport 2000). The emission factors (g/km) havebeen estimated by Grontmij | Carl Bro A/S1. In addition to this corrections forspeed for the various vehicle types have been made as follows:SOLO: Solo truckTWT: Truck with trailer (emission factors = SOLO + 10 %)EMS: EMS vehicle (emission factors = SOLO + 20 %)
Emission factors are subject to large uncertainty and the calculated emis-sions are therefore subject to very large uncertainty. Therefore the calculatedvalues should primarily be applied for assessment of, whether there are dif-ferences between the elucidated situations.The emission factors are also not corrected for road speed as there is noknowledge available about to what extent these speeds have influence onthe actual emissions, and there is no details available about speed depend-ent emission factors for the various vehicle types.The calculation of the emissions is performed by means of a spreadsheetwhere the factors can be adjusted centrally. New knowledge about emissionfactors for the individual vehicle types also as a function of the type of sec-tion can be changed afterwards and the consequences can be adjusted. Fur-thermore it will be possible to insert vehicle type(s) for EMS vehicles and at-tached emission factors.In order to be able to make a real environmental assessment of the effect ofthe introduction of EMS vehicles, the spreadsheet can be supplemented withdata for the size of the goods transport for a ”before” and ”after” situation.The emission factors applied for the present calculation appear from Figure2. The traffic values (annual average daily traffic) applied for the calculationappears from Figure 3.
SubstanceEmission factorsg/kmEstimated2008 dataAllspeedsNOXCOHCPASO2CO2Figure 2: Emission factors for vehicles
SOLO4.800.650.270.0720.018626
TWT5.280.720.300.0790.020687
EMS5.760.780.320.0860.022751
1
Further background knowledge and data on emissions can be found in the publication ”Denmark’s Na-tional Inventory Report 2008, Emission Inventories 1990-2006, National Environmental Research Insti-tute, 2008.”Grontmij | Carl Bro A/S
Tetraplan A/S
The Danish Road DirectorateTest with European Modular System – Midway ReportAppendix 6: Air pollution and climate impacts
Page3
Masterfileno.
Text
Roadcat.
Lengthkm61.461.954.630.525.316151520.317.66.941.341.369.89.28.95627.819.1353516.136.157.919.4222234.684.579.454.965.659.1
Speedkm/h90
2008Vehicles/daySolo568TWT
2009Vehicles/daySolo TWT EMS780282327180370491501412324794455301411444011626417900025
101 Frederikshavnmotorvejen Motorway102 Hirtshalsmotorvejen103 NordjyskeMotorvej104 NordjyskeMotorvej105 NordjyskeMotorvej106 ØstjyskeMotorvej108 ØstjyskeMotorvej108 ØstjyskeMotorvej109 ØstjyskeMotorvej110 ØstjyskeMotorvej112 SønderjyskeMotorvej113 SønderjyskeMotorvej113 SønderjyskeMotorvej114 Esbjergmotorvejen115 Kolding‐Fredericia116 ØstjyskeMotorvej117 FynskeMotorvej118 FynskeMotorvej119 Storebæltsbroen120 Vestmotorvejen120 Vestmotorvejen123 Øresundsmotorvejen124 Helsingørmotorvejen131 Sydmotorvejen132 Sydmotorvejen133 Sydmotorvejen133 Sydmotorvejen221 Århus‐Grenaa222 Århus‐Herning223 Thisted‐Hanstholm224 Hagebro‐Skive225 Brande‐Riis‐Vejle301 Randers‐GrenaaMotorwayMotorwayMotorwayMotorwayMotorwayMotorwayMotorwayMotorwayMotorwayMotorwayMotorwayMotorwayMotorwayMotorwayMotorwayMotorwayMotorwayMotorwayMotorwayMotorwayMotorwayMotorwayMotorwayMotorwayMotorwayMotorwayMotorwayRuralroadRuralroadRuralroadRuralroadRuralroad
926 527
9090 169890 355490 191990188990 125890 256990 1445653090 320390 162990 227790 17029090 144290 249090 15469090 419790 294890 1078457690 592290 157790 108750875757575757526033818267853
2873 1654 25013580 1467 25003474 1856 28953331 1952 34994818 996 42624866 2327 41485619 1077 43307946 6156 68726586 2831 54414713 1573 40455445 2118 46972139 1564 17782826 1412 24724922 2378 43023118 4167 37043181 4287 29153254 2713 28211059 2391 12761856 4239 16242482 3877 22571976 1409 16721394 997 12311041 547676 892175 222198 318188 316867630
15 809 1100
302 NykøbingF.‐GedserRuralroad 39.6Figure 3 Annual Average Daily Traffic (AADT) for sections
Tetraplan A/S
Grontmij | Carl Bro A/S
The Danish Road DirectorateTest with European Modular System – Midway ReportAppendix 6: Air pollution and climate impacts
Page4
2. RESULTS AND EVALUATIONOn the basis of the set up emission factors, sections and traffic values, atheoretic calculation of the emissions from the individual sections and one to-tal for all sections have been made. The results of the calculations appearfrom figure 4.SubstanceNOXCOHCPASO2CO22008tonnes81791110462122311,062,0002009tonnes7555102542611228981,000
Figure 4 Calculated emissions for individual sections and totally
From figure 4 appears that from 2008 to 2009 there is a fall in the emissionsof approx. 8 %.Looking at the emission of CO2, the annual emission is approx. 1 milliontonnes. Every Dane emits approx. 10 tonnes CO2per year. The emission forthe calculated traffic volume therefore corresponds to approx. 100,000 per-sons’ annual emissions. The difference between 2008 and 2009 correspondsto approx. 8000 persons’ emissions.It should be noted that the above calculations have been performed on thebasis of the methodical considerations accounted for earlier in the appendix.Whether these are 100 % correct is not that important as mainly it is a ques-tion about conditions which must be compared between the pre-test situationand data from later periods in the evaluation.In connection with the calculations performed for the pre-test situation andwhich were based on traffic values for 2008, the total CO2emission was cal-culated to 870,000 tonnes CO2. As the calculations in the pre-test report arebased on traffic values for some other road sections than were applied forthe midway report, these emission figures are, however, not directly compa-rable2.
As mentioned elsewhere in the midway report, it has not been possible to register EMS vehicles on thesections originally planned and included in the pre-test report.Tetraplan A/SGrontmij | Carl Bro A/S
2
Appendix 7: Noice effects
The Danish Road DirectorateTest with European Modular System – Midway ReportAppendix 7: Noise effect
Page 1
Midway ReportAppendix 7: Noise effect1INTRODUCTIONParallel with the ongoing test period of the Road Directorate about transportwith EMS vehicles on parts of the Danish road network, the consequenceswith regard to noise are investigated.This appendix has been prepared in direct continuation of the conditions pre-viously described in the pre-test report, where the noise effect was investi-gated on a number of sections prior to the start of the test period.The consequences with regard to noise are elucidated through calculation ofthe noise effect from the heavy traffic on selected sections. In the pre-testanalysis the noise effect was calculated for the heavy traffic in 2008. The in-vestigation forming the basis of this appendix treats WIM results for 2009where EMS vehicles are driving on the selected sections.The noise calculations are carried out primarily for motorway sections allover the country and the results for the individual partial sections are com-pared with the results from the previous investigation. The partial sections inquestion appear at the end of this appendix.In order to compare the noise spread in connection with conventional trucks(2008) and EMS vehicles, respectively, the 58 dB line is elucidated for both2008 and 2009. The 58 dB line has been selected as comparison parameter,as the 58 dB line represents the guiding limit value for noise on out-doorcommon areas near houses.
2
PRECONDITIONS FOR CALCULATIONThe noise effect from the heavy traffic has been calculated according to thecalculation method Nord2000 and is performed in accordance with the GuideNo. 4/2007 ”Støj fra veje” [Noise from roads] of the Danish EnvironmentalProtection Agency. The calculations have been performed with 9 roadclasses.The calculations performed with the calculation program ”SoundPLAN” ver-sion 6.5, update of 15.09.2009.The comparison parameter, the 58 dB line, is calculated by means of thecalculation module Grid Noise Map, where the result of the noise spreadperpendicularly away from the road section is calculated.
Tetraplan A/S
Grontmij | Carl Bro A/S
The Danish Road DirectorateTest with EMS vehicles – Midway ReportAppendix 7: Noise effect
Page 2
WIM counts for this investigation are grouped into solo trucks, trucks withtrailer and EMS vehicles. It has not been possible to provide noise data forEMS vehicles. Due to the lack of data a precondition is that the noise contri-bution from an EMS vehicle can be compared to the noise contribution froma truck with trailer. However this practice is not quite correct, as an extra con-tribution of some size should be expected from e.g. increased tire and roadnoise due to more axles on the EMS vehicles. This aspect should, however,be compared to an – after all – modest contribution of EMS vehicles com-pared to traditional trucks with trailers; up to approx. 2.5 %.Assuming that the noise effect of EMS vehicles is 5 dB higher than of a truckwith trailer, the total noise contribution for trucks with trailer and EMS vehi-cles will maximum be 0.2 dB higher than the present distributions.Out of consideration for the Nord2000 calculation method, the vehicles aregrouped with the following graduation:Category 2:oSolo trucksCategory 3:oTrucks with traileroEMS vehicles
Concerning the above groupings of vehicle categories it should be men-tioned that at the same time the individual categories contain e.g. busses ofvarious sizes and vans with trailers which cannot be expected to be replacedby EMS vehicles. The evaluation is, however, that the part and thus the ef-fect of these deviating vehicles is small.Nord2000 calculates the noise effect for day, evening and night periods, re-spectively, which requires a grouping of the traffic in the day periods. For thisthe guide lines in the Guide 4 / 2006, page 47 of the Danish EnvironmentalProtection Agency is applied. Here estimated day groupings for six differentroad types are indicated. In this investigation the day grouping for motorway,110 – 130 km/h and rural roads, 80 – 90 km/h, respectively.The applied speeds have also been collected from the above guide. For ruralroads the speed is 75 km/h all day and for motorways 90 km/h all day.As it was done in the pre-test report, the individual road sections are “placed“in a simplified test setup solely taking traffic load with vehicle category andday distribution, speed, lane width and centre strip width into account. Thetest setup consists of an absorbing flat terrain without shielding, where theroad sections are placed individually with a distance of 2 km with north-southorientation. The road surface is presupposed to be reflecting. The calculationarea has a width of 50 metres and is placed perpendicularly on the road sec-tion. In this way the distance from road centre to the 58 dB line can bemeasured.
Tetraplan A/S
Grontmij | Carl Bro A/S
The Danish Road DirectorateTest with EMS vehicles – Midway ReportAppendix 7: Noise effect
Page 3
3
RESULTSThe calculation results specifying the 58 dB line with the WIM counts for both2008 and 2009 can be seen on the next page in the columns58 dB line.From the columnsDifferencethe difference in metres from 2008 to 2009 ap-pears. At the same time the difference to the noise level in the 58 line for2008 is indicated as well.The calculation results on the following page show very modest changes inthe noise effect of up to approx. -1 dB. However with the exception of a fewsections. The few larger deviations are conditioned by considerable changesin traffic values for the road sections. Knowledge about the basis of thesechanges in this investigation is not available. In general the noise effect fallsslightly on the major part of the sections. This may be connected with a gen-eral fall in the number of vehicles on the Danish roads due to the financialrecession which must be expected to have influence on the goods transportwith trucks.
Tetraplan A/S
Grontmij | Carl Bro A/S
The Danish Road DirectorateTest with European Modular System - Midway ReportAppendix 7: Noice effect
Page 4
DataMasterfileno.TextRd.CatLoc_idMAINSEC.SoloLWT
2008EMSAADTSoloLWT
2009EMSAADT
SpecificationsRoadCentreSpeedlanestripwidthkm/h90909090909090909090909090909090909090909090909090909090907575757575758,58,27,588,28,57,58888888,28128,5877783,83,83,83,83,542,511,5312,56123,833373,53,511553,56,53,53,53,53000000Metres7,27,27,27,588,2Metres3,53,511,43,233
ResultsDistanceto58dBline2008Metres10502972923453374004284316115124024452550293428314038635915832839123216711110001921519132009Metres90442722713123493663913665724603674092252502713994142663773322313063292031509999481724632045
DifferenceMetres‐1544‐25‐21‐33120‐34‐37‐65‐390‐52‐35‐36‐30250‐22‐29100266‐9‐2773‐220‐62‐29‐17‐120‐148‐2358132dB‐0,7‐‐‐‐0,4‐0,3‐0,40,2‐‐‐‐0,4‐0,4‐0,7‐0,3‐‐‐‐0,5‐0,4‐0,4‐0,5‐‐‐‐0,3‐0,31,2‐‐‐‐0,1‐0,31,6‐0,3‐‐‐‐0,7‐0,6‐0,5‐0,5‐‐‐0,0‐‐‐‐0,50,611,00,25,4
Vehicles/d Vehicles/d Vehicles/ Vehicles/ayaydayday101 Frederikshavnmotorvejen102 Hirtshalsmotorvejen103 NordjyskeMotorvej104 NordjyskeMotorvej105 NordjyskeMotorvej106 ØstjyskeMotorvej107 ÅrhusSydMotorvejen108 ØstjyskeMotorvej108 ØstjyskeMotorvej109 ØstjyskeMotorvej110 ØstjyskeMotorvej111112 SønderjyskeMotorvej113 SønderjyskeMotorvej113 SønderjyskeMotorvej114 Esbjergmotorvejen115 Kolding‐Fredericia116 ØstjyskeMotorvej117 FynskeMotorvej118 FynskeMotorvej119 Storebæltsbroen120 Vestmotorvejen120 Vestmotorvejen123 Øresundsmotorvejen124 Helsingørmotorvejen125‐130131 Sydmotorvejen132 Sydmotorvejen133 Sydmotorvejen133 Sydmotorvejen201‐209221 Århus‐Grenaa222 Århus‐Herning223 Thisted‐Hanstholm224 Hagebro‐Skive225 Brande‐Riis‐Vejle301 Randers‐Grenaa302 NykøbingF.‐GedserMotorwayMainroadMainroadMainroadMainroadMainroadMainroad7040101970403034764800116503506034801741504202506050Hanstholm‐SkiveSkive‐HerningHerning‐VejleRanders‐GrenåHavnNykøbingF‐GedserHavn2603381826729917519815188043553633455299Århus‐Grenå853676MotorwayMotorwayMotorwayMotorway25030048350301063503013235030154Køge‐VordingborgVordingborg‐NykøbingFNykøbingF‐rødbyHavnNykøbingF‐rødbyHavn5922157710875082482197613941041MotorwayMotorwayMotorwayMotorwayMotorwayMotorwayMotorwayMotorwayMotorwayMotorwayMotorwayMotorwayMotorwayMotorwayMotorwayMotorwayMotorwayMotorwayMotorwayMotorwayMotorwayMotorwayMotorwayMotorwayMotorway250200493002009215003061150140266005008550050015500500586005223560040214600600954204018542040162NordomKoldingKolding‐PadborgKolding‐PadborgEsbjerg‐KoldingKolding‐FredericiaNordligfletningE45/E20Fredericia‐OdenseOdense‐StorebæltsbroenStorebæltsbroenStorebæltsbroen‐KøgeStorebæltsbroen‐KøgeMotorvejO3‐CPHMotorvejO3‐Helsingør419729481078457631813254105918561442249015462826492231183203162922771702658647135445213960060139700601616006012260060110800803168009005180070269800702267007016970060173Frederikshavn‐AalborgHirtshals‐AalborgAalborg‐HobroHobro‐RandersRanders‐ÅrhusE45‐ÅrhusN‐ÅrhusSÅrhusS‐ÅrhusHavnÅrhusS‐HorsensNÅrhusS‐HorsensNHorsensN‐VejleNVejleN‐Nordligfletning1258256914456530481848665619794616983554191918892873358034743331568926149404571713453935220060767435706414476097896342772238410426874124664073786202213764320840435532481154901529
Vehicles/ Vehicles/ Vehicles/ Vehicles/daydaydayday5271521654146718561952099623271077615628311573211815641403141223784167042872713239142393877140999754789281022231880931610957804292501250028953499042624148433068725441404546971778219424724302370430682915282112761624225716721231867630686116264110017945023014114441412133247945645534915282327180037513125814183399047785469052586512540713077828756186829335436103916672779653124724755873667587761453085223214181522149633858219094971548
Tetraplan A/S
Grontmij | Carl Bro A/S
