Trafikudvalget 2010-11 (1. samling)
TRU Alm.del Bilag 59
Offentligt
Routes to Sustainable Transport
1
Routes to Sustainable Transport
2
Table of ContentsIntroductionAustriaDenmarkEuropean ParliamentFinlandFlandersGermanyGreeceItalyThe NetherlandsNorwayPolandSwedenSwitzerlandUnited KingdomEndnotes46142024304856606876848896104108
Routes to Sustainable Transport
3
Routes to Sustainable Transport
4
IntroductionTransportation is a large energy consumer in modern societies. In a future with considerably less fossilfuels and restrictive policies towards global warming it seems improbable that transportation can stillincrease its share of the available energy. The term Sustainable Transport is used as a signal of a newdevelopment in transportation, which involves strategy shifts with regards to for example energy-efficienttransport, the use of renewable energy sources, motor and vehicle technologies, taxation systems,private/public transportation, and physical planning. Countries and regions aim to reduce emissions ofCO2, to ensure security of energy supply, to maintain mobility and to protect their economy and growth –and Sustainable Transportation seems to be a key concept.No country or region can claim to have a sustainable transportation system in place yet. Many of theneeded technologies are not commercially available. The transitions needed involve enormousinvestments, from society, industry and for the citizens. And not least, we demand effective and cheaptransportation, which provides us with the mobility we need at any time – and therefore, the claim for alarge transition is often met with scepticism. Accordingly, new policy options are discussed, experimentedwith and evaluated.The purpose of this report is to help to exchange knowledge to policy-makers by providing an overview ofcurrent developments, major challenges, policies and strategies in the EPTA member countries andregions. The presentations from the various countries share a common structure, while at the same timeallowing for a focus on country-specific issues. Each country is reporting on issues concerning:
The State of PolicyEnergy Use for TransportRegulation and Technology Options for Sustainable TransportLand Use and Physical PlanningBorder-crossing Transport in EuropePresentations have been kept short to ensure readability, accessibility and oversight. We hope that thiswill be valuable to parliamentarians and other decision-makers.This report is the result of a joint project of some of the members of the European ParliamentaryTechnology Assessment network (EPTA):
Member Organisations:CAPCIT - The Advisory Board of the Parliament of Catalonia for Science and Technology. Catalonia,Spain.
Routes to Sustainable Transport
5
Committee for the Future, Parliament of Finland. Finland.DBT - The Danish Board of Technology. Denmark.GPTCA - Greek Permanent Committee of Technology Assessment. Greece.IST - Institute Society and Technology. Flandern, Belgium.The Norwegian Board of Technology. Norway.OPECST - Office Parlementaire d´Evaluation des Choix Scientifiques et Technologiques. France.PER - Parliamentary Evaluation and Research Unit. Sweden..POST - Parliamentary Office of Science and Technology. UK.Rathenau Institute. Netherlands.STOA - European Parliament. European Union.TA-SWISS - Center for Technology Assessment. Switzerland.TAB - Office of Technology Assessment at the German Parliament. Germany.VAST - Comitato per la Valutazione delle Scelte Scientifiche e Tecnologiche. Italy.
Associate Members:BAS - Bureau of Research. Poland.The Committee on Culture, Science and Education of the Parliamentary Assembly of the Council ofEurope.ITA - Institute of Technology Assessment. Austria.OSTC - Belgian Federal Office for Scientific, Technological and Cultural Affaires. Belgium.
The different institutions are responsible for the description of the country or region where they belong.The project has been coordinated and managed by the Danish Board of Technology (Teknologirådet),which holds the EPTA precidency for 2010. We would like to thank all participating institutions for theircontributions to this extremely important topic.
Lars Klüver, directorIda Leisner, project managerUlla Holm Vincentsen, project managerSune Bjarke Stefansson, project assistant
Copenhagen, October 26, 2010
Routes to Sustainable Transport
6
AustriaITA – Austrian Academy of Sciences, Institute of Technology AssessmentProject Manager: Walter PeisslAuthor: Willy Raimund
State of PolicyCurrently, there is no “overall sustainable transport strategy” in Austria as such, but sustainable transportgoals are integral parts of theAustrian National Climate Strategy(“Österreichische Klimastrategie 2007”; including “soft measures”in transport such as mobility management, bundled in the national transport climate protectionprogramme “klima:aktivmobil”),which attempts to achieve the “Kyoto goals” (for AT: minus 13%green house gas (GHG) emissions 2008-2012 compared to 1990.Furthermore GHG emissions are to be reduced by 16% by 2020 compared to 2005 levels (excludingemission trading), according to the EU’s “20-20-20 targets”, and theAustrian National Energy Strategy(“Energiestrategie Österreich”), paving the way for the EU “20-20-20” targets at national level. For transport in AT this means that by 2020 10% of the whole energyinput will have to come from renewable energy sources, contributing to the target of a 19% reductionof final energy consumption in transport. As of 2008, the transport sector in AT was 95% dependenton fossil fuels1(almost entirely oil).These goals for transport are quite ambitious, since it is the sector with the fastest growing GHGemissions (+60.8% from 1990 to 2008) and the one which deviates most from the sectoral target of theclimate strategy.To help meet the ambitious targets, varying instruments have been implemented to boost a cut in GHGemissions, energy consumption and to encourage energy efficiency in transport:Climate and Energy Fund, a national fund endowed with €150 million per year for climate protectionand energy efficiency measures in all sectors“klima:aktivmobil”programme, Austria’s national climate protection programme in transport,offering consulting and financial support for CO2-prevention measures (€25 million per year)an e-mobility master plan “under construction” (bringing together the action plans of varyiousministries)For the “white hope”– e-mobility – alone, approximately €30 million per year is spent via “klima:aktivmobil”, “e- mobility model regions”, “beacons of light for e-mobilty” and the technology researchprogrammes “A3plus” and “energy systems of the future”.
1
Erneuerbare Energie in Zahlen, S.8, BMLFUW Dez. 2009
Routes to Sustainable Transport
7
Governance and Responsibilities for ImplementationThe latest version of the Austrian National Climate Strategy (2007) has only been endorsed by the federalgovernment but not by the regional governments of Austria’s nine provinces (“Bundeslaender”). Thatmeans that the federal level is responsible for reaching (or not) the targets set in the strategy.Nevertheless, a “climate protection law” is under construction, which is to determine the sharing of theburden regarding GHG emission reductions between the federal and regional levels for the “post-Kyoto”period (2013-2020).Accordingly to the targets and visions described above, 200,000 e-cars should be on Austrian roads by2020, which is a very ambitious plan, considering that 185 e-cars registered as of the end of 2009.
Energy Use for Transport34% of Austria’s final energy consumption (and 26.1% of GHG emissions, 2008) are within the transportsector (2009). Between 1990 and 2005, final energy consumption in transport rose by 80%2.In 2008 renewable energy sources contributed 5.3%3to the final energy consumption of the transportsector in Austria. Biofuels in particular helped to increase this share (and save GHG emissions: e.g. 1.375million tons between 2007 and 2008). In the future, e-mobility (with electricity from renewable energysources such as water, wind, biomass, solar energy) is expected to make a major contribution toincreasing the share of renewables in transport to 10% by 2020 and to reducing energy consumption,especially from fossil energy sources.
Plans, policies and discussions on increasing the use of renewable energy sources for transport.See point 1) and 2) above
Regulation and Technology Options for Sustainable TransportAs of today, a clear focus is laid on e-mobility/BEV (battery electric vehicles) but also on hybrids(combination of internal combustion engine plus electric motor):On the one hand e-mobility is an important part of all strategies regarding GHG emission reductions andenergy efficiency gains (see above). The Austrian Energy Strategy for instance is reckoning on some tenthousands of e-cars (powered with electricity from renewable energy sources) in 2020.
23
Klimaschutzbericht 2010, S. 43, Umweltbundesamt, Wien 2010Erneuerbare Energie in Zahlen, S.8, BMLFUW Dez. 2009
Routes to Sustainable Transport
8
On the other hand both federal and regional level have come up with several funding and supportopportunities for different purposes (“model regions” and “beacons of light” for e-mobility, RT&D fundsfor technological developments, financial support for companies and private persons for the purchase ofe-vehicles4and for electricity charging stations, exemption from vehicle purchasing tax, exemptions fromlocal driving prohibitions due to high air pollution figures …).Beyond alternative propulsion technologies such as BEV and hybrids, the blending of biofuels into fossilpetrol (bio ethanol) and diesel (biodiesel) contributed to a significant drop of GHG emissions fromtransport and the share of fossil energy sources in transport. Since 2005, 5.75% (in terms of energycontent) of regular fuels for road vehicles come from biogenic sources.There is an Austrian road-pricing scheme for both cars (including two-wheelers such as motorcycles etc)and lorries, but only on motorways (”Autobahnen und Schnellstrassen”). For cars, every vehicle using themotorways has to pay a “flat rate” in the form of a sticker independently of the mileage. For heavy-dutyvehicles the charge is dependent on the mileage and on the EURO class of the respective vehicle (thecleaner, the cheaper). In some places this road pricing scheme leads to “detouring traffic” on non-motorways, for which no charge is made.Freight transport on Austrian roads has seen a decrease in the last two years due to the general economiccrisis (e.g. minus 20% between January 2008 and January 20095). This of course leads to less energyconsumption and GHG emissions in/from transport, but is not “sustainable” as such, since the mileage willincrease again once the economy prospers and since freight transport on more sustainable modes (railand inland shipping) has also fallen to roughly the same extent.Congestion charging schemes are often discussed, especially for cities and urban agglomerations, but asyet there is no such scheme in place anywhere in Austria.The “purchase tax” on the purchase of a motorized vehicle (“Normverbrauchsabgabe - NoVA”) can beconsidered a green tax, since vehicles with lower standardized CO2emissions (in terms of theNEDC/MVEG6driving cycle) pay less.The NoVA has to be paid when a vehicle is registered for the first time in Austria (registration tax). As thetax burden is linked progressively to the vehicle's fuel consumption, NoVA is an incentive to buy moreefficient cars regardless of the expected mileage. On 1 July 2008 the NoVA system was improved by abonus-penalty system. This means that vehicles with CO2emissions of more than 180 g/km have to pay anadditional NoVA of 25 Euros per gram in excess. If the car emits less than 120 g/km, a bonus of 300 Euroswill be paid out. Furthermore, a bonus of 500 Euros is due if the vehicle has an alternative propulsionsystem (hybrid, gas, electric etc.). In 2010 the new system was tightened. Vehicles with an emission ofmore than 160 g CO2/km have to pay the additional NoVA of 25 Euros per gram excess. Electric vehiclesare exempt from this tax (so far).45
not at federal level, but most of the provinces provide funding for private persons when buying e-vehiclesKlimaschutzbericht 2010, S. 43, Umweltbundesamt, Wien 20106NEDC…New European Driving Cycle; MVEG…Motor Vehicles Emission Group)
Routes to Sustainable Transport
9
The “engine-related insurance tax” (“Motorbezogene Versicherungssteuer”) on motor vehicles is stillbound to the vehicle's power in kW and not yet “greened” by binding it to the vehicle's CO2emissions.
Methods for Monitoring Environmental Impacts from the Transport SectorYearly “Climate protection reports” of the Umweltbundesamt (Federal Environmental Agency):According to EU reporting requirements, these reports provide recent figures regarding GHGemissions from all sectors (compared to the year before and to 1990, the Kyoto baseline year).Transport is included and emission developments are split into sub-sectors like cars, heavy-dutyvehicles, biofuels etc. Since CO2emissions are calculated indirectly from the amounts of fuel sold,energy values (PJ) are also available in this way.All air pollutants are also monitored by the Umweltbundesamt.There is a yearly report specifically on road transport/passenger cars, again by Umweltbundesamt, on"CO2emissions of newly registered passenger cars”, describing the development in GHG emissionsfrom new cars.
Regulation on Specific Use of TechnologiesIn Austria the usual EU EURO classification (setting limits to emitted air pollutants pervehicle) is in place.Particle filters are not mandatory for diesel vehicles. Nevertheless a consumer pays € 300.-more when purchasing a diesel car without filter. In 2009 90% of all newly purchased dieselcars were equipped with a filter.
Available and/or Necessary Technologies Beyond 2020Beyond 2020 wide parts of the drive train of road vehicles will be electrified. At present BEV lead,followed by all types of hybrids and alternatives (plug-in hybrids, range extenders, hybrids etc.) However,technological solutions targeting vehicles only will never be able to solve the transport problem as awhole. It needs a balanced mix of awareness raising, intermodality, ICT, technology measures etc.
R & D Plan for Developing New Transport Technologies or InfrastructureThere is no plan specifically on this matter. However, transport technology is mainly tackled in R&Dprogrammes of the transport ministry (known as IV2S+) and at present a comprehensive “Master plan one-mobility” is being prepared by the government.
Routes to Sustainable Transport
10
Land Use and Physical PlanningGenerally speaking land use planning tools are quite weak at federal level in Austria (except perhapsinfrastructure measures “of general public interest”). Land use planning mainly takes place at local andprovincial level, which brings huge problems regarding climate change caused by more traffic resultingfrom scattered structures.
Transport and Mobility: Rural Areas Versus Densely Populated AreasMotorization rates (cars per household) especially in rural areas are growing rapidly in Austria (overallfrom 460 cars per 1000 inhabitants in 1995 to 510 in 20087), as in the rest of Europe, whereas the rate isdecreasing in the Viennese urban area (the modal split of cars decreased from 40% to 32% during recentyears).In most land use plans, intermodality and “soft transport modes” such as walking and cycling are not dealtwith in the same intensity as motorized transport.
Influence of Physical or Urban Planning to Reduce of Transport GrowthThe car ownership rate in Vienna (403 cars/1000 inhabitants, 2005) and other urban agglomerations issignificantly lower than in rural areas such as Lower Austria (570 cars/1000 inhabitants, 2005) orBurgenland (575 cars/1000 inhabitants, 20058). The need to own a car in urban environments is not asgreat as in rural areas with insufficient or even no public transport. In urban agglomerations distances areshorter, roads more congested, public transport infrastructure is much better, and cycling and walkingfacilities are mostly also available.E-mobility offers a chance for a paradigm change away from “you have to own a car” to “use cars inintermodal context”, e.g. for the “last mile”, especially in rural areas.
Strategies for Sustainable Urban Mobility and the Shift from Private to Public TransportStrategies have been determined e.g. in the “Master Plan Transport Vienna 2003”, where targets likereducing the modal split of motorized individual transport are set. Many initiatives such as testing electricvehicles, “model regions for e-mobility” (“VLOTTE” in Vorarlberg and “ElectroDrive” in Salzburg) pluscycling and walking incentives try to help to achieve the general modal shift towards more sustainablemodes of transport.
78
Statistik Austria; http://www.statistik.at/web_de/services/wirtschaftsatlas_oesterreich/verkehr/024196.htmlVerkehr in Zahlen, S. 80; Herry Consult für bmvit; Wien November 2007
Routes to Sustainable Transport
11
Border-crossing Transport in EuropeRegulation/Policies of Transit TrafficTransit (border-crossing heavy-duty goods vehicles) is a serious problem for Austria. Nevertheless, aformer transit scheme for Austria ("eco points") was dropped by the EU and replaced with the possibilityfor “extra road-pricing“ in sensitive areas like the “Brenner” in Tyrol. Furthermore, the “road on rails“(heavy-duty road vehicles on trains) is hugely subsidised in Austria in order to avoid excessive heavy-dutyvehicle traffic on transit routes.The “alpine convention“ would also offer appropriate tools but is not legally binding yet.A desirable development would be to increase the EU share of goods transported via rail to Austrianlevels (about 31% compared to 18% on EU25 level (20049).Hauliers from abroad in particular (mainly from the EU member countries in the east) use older ratherthan the newest EURO generations of lorries. These pay more for road pricing than newer ones (EURO IV,EURO V), and cause greater air pollution.A specific issue here is also the VAT on fossil fuels. Since this tax is lower in Austria than in neighbouringcountries the overall price for diesel and petrol is lower in Austria with the effect that fuel (causing about5.6 million tons of GHG emissions) is purchased in Austria but used in other countries (“price induced fuelexport”). These 5.6 million tons count towards the Austrian climate balance, causing a major part of the6.9 million tons GHG emissions that Austria is in excess of its Kyoto targets10.
Emission Standards and Speed LimitsEmission standards are determined by EU regulations. Speed limits have been unchanged since years.Lowering the latter would help to save GHG emissions, but generally is not to be expected. Rigorouscontrols of existing limits would, while regionally implemented lower speed limits due to NEC (NationalEmission Ceiling) Directive do help to lower GHG and pollutant emissions.
Environmental Impact Assessment of Large Infrastructure Investments and GreenTransport CorridorsThe EIA of large infrastructure investments up to now has not helped too much to reduce the negativeenvironmental consequences of transport.“Green transport corridors” at present is not much more than a nice catchword. Nevertheless, memberstates are working on plans to introduce such corridors.
9
10
Verkehr in Zahlen, S. 114; Herry Consult für bmvit; Wien November 2007Klimaschutzbericht 2010, S. 43, Umweltbundesamt, Wien 2010
Routes to Sustainable Transport
12
HarmonisationRegarding the harmonisation of border-crossing railways, problems with e.g. signalling etc. are stillevident. The biggest problem, at least for Austria and e.g. Italy, seems to be the different frequencies ofthe electricity used to power the trains. Only “dual-frequency locomotives” can handle these differences.In addition, different gauges (especially between Austria and the “Russian system”) starting with theUkraine, but also – for instance – between France and Spain have not been solved yet.
European Strategies for Long Distance Transport – Concerns and Experiences in GeneralFrom an environmental point of view road TENs (Trans European Networks) are a reason of concern.“TENs” for a more sustainable transport system, for local and regional transport, for public transport andfor cycling would be desirable.
Routes to Sustainable Transport
13
Routes to Sustainable Transport
14
DenmarkDBT – The Danish Board of TechnologyAuthors: Ida Leisner and Naja Olesen
Pkm rose from 69.879 in 2000 to 75.326 in 2008. 83% pkm were driven in cars, 13% in publictransport – the rest other modes, with inland aviation having increased.I Denmark the road network is approximately 71.600 km and the cycle path network is more than12.000 km.
State of PolicySustainable transport entered the Danish government’s agenda with the transport initiative “Sustainabletransport – better infrastructure” from December 2008. In January 2009 the government and oppositionalparties agreed a Green Transport Policy. Until 2014 8,1 billion kr. (1,2 billion euros –figures to be checked)will be spent to improve the conditions for the environment, the security and the mobility in the transportsystem. Investments include the Fehmarn Belt connection - highway and electrified high speed rail. Otherinvestments are directed at improving the railway network, in particular updating signal systems to EUstandard (ERTMS).
Transport Policy AimsReducing of the transport’s CO2 emissions.Public transport should lift most of future growth in traffic. The railroad should be reliable, safe andmodern.Road capacity must be developed, in places with congestion problems, but also where future trafficgrowth resulting from economic and social development will require an expansion of infrastructure.Transport by bike must be encouraged - the choice of the bicycle is preferable, where it is a realisticoption.Denmark shall be a laboratory for green transport.Bridges, roads and railways must not destroy irreplaceable natureNoise and air pollution have to be reduced in cities.
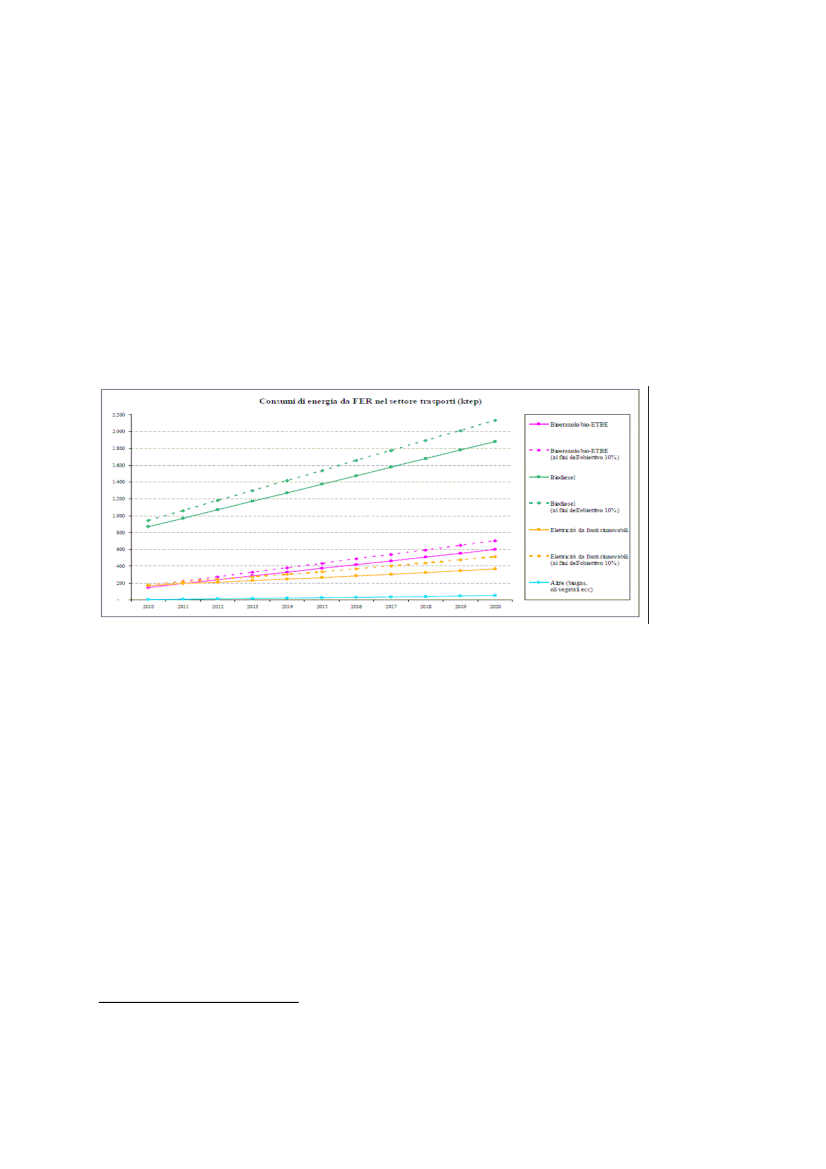
Climate Targets and TransportGHG – reduction 2050 (1990 level)GHG – reduction 2020 Transport should contributeRenewables share of energy consumption 2020Renewables share of transports energi consumption 2020Share of biofuels (surface transport) 202080-95%> 20%30%10%
10%
Routes to Sustainable Transport
15
R&DA strategic research programme aimed at transport has set aside 8 billion euros in 2010 for research insustainable transport and infrastructure.A fund (approx 40 billion euros) has been set aside for projects that will develop technical solutions togreen traffic.
The Climate CommissionThe government’s Climate Commission has worked out suggestions for a coherent energy system, whichcan ensure improved energy efficiency, increased share of renewable energy and promote thecompetition on the energy market. The vision is to make Denmark independent of fossil fuels before2050. The energy system includes the transport sectors energy consumption as well.The Danish Board of Technology’s project on sustainable transport has taken up the idea and willinvestigate what it takes to switch over the transport system to 100% renewable energy before 2050.
Governance and Responsibility for Sustainable Development in the Transport SectorDue to globalisation and rising competition (liberalisation) in the transport sector, the organisation of thesector has changed. Big international operators in both rail and bus service has entered the market,causing a fragmentation of public transport. Increase in transit freight transport and a shift from rail toroad has created a pressure on road network capacity. Accordingly, needs for coordination, planning andregulation have increased. The national Danish Transport Authority together with regional transportauthorities and local governments carries out these tasks. The Ministry of Transport has the overallresponsibility for implementing strategies for a sustainable transport sector. Regulation and procurementis delegated to several authorities.
Energy Use for TransportEnergy Consumption in the Transport Sector and Renewable Energy SourcesThe energy consumption in the transport sector was in 2007 225 PJ. This corresponds to approximatelyone third of the whole energy consumption of 685 PJ. The energy consumption in the transport sector ishigher than the energy consumption in the households.Today the share of renewable energy in the transport sector accounts for 1 % of the total share. Windpower and bio fuels are the two primary sources of renewable energy in the transport sector.
Routes to Sustainable Transport
16
Plans, Policies and Discussions on Increasing the use of Renewable Energy Sources forTransportWind power and biofuels are the most important renewable energy sources in Denmark.Ongoing discussions are about the balance (we allready import biofuels which can be not sustainable) andorder of introducing biofuels and wind power electricity for transport. This is connected to technologies:biofuels can be used directly without shifting the carpark to BEV’s. Much research and development isaimed at second-generation biofuels. On the other hand, BEV’s are clean tech regarding CO2 and otherpolluters, and they can be integrated into the energy system as both capacity and consumer. Expectationsare that even with the current policy BEV’s will not reach sufficient numbers in 2020 (original target was ½million, now the figure is reduced to 80.000). Some argue that in the short term biofuels might be thebetter option for transport, to achieve CO2 reduction targets before 2020.
Regulation and Technology Options for Sustainable TransportBEVsBEVs were boosted when Better Place (an american BEV company) agreed with the Danish energyconsortium, DONG Energy, to invest 770 mio.dkr. in building a network for BEVs in Denmark.DONG Energy sees BEVs as having the potential to increase flexibility in the energy system and turnsurplus wind energy into business.BEVs are exempted from the otherwise high taxes on cars in Denmark until 2012. Currently it is discussedwhether the exemption should be prolonged.
Green TaxesThe green tax has long been an important tool to reducing the use and covering the expenses related tothe environment. Depending on how far the vehicle can run on the litre the owner has to pay a green tax.If the car runs at least 20 km it costs approximately 35 Euros every 6 months and if the car runs les than4,5 km on the litre it costs 1.240 Euros every 6 months.A reduced tax on cars with low fuel consumption has increased the share of small, energy efficient cars.The green taxes and better information about the car’s energy efficiency have increased the average GHGemissions from the new and more efficient cars more than 20 % since 2000.
Road PricingIt was a governmental decision to introduce roadpricing by 2012, using the same model and technology asthe Netherlands. However, as the Netherlands stopped their plans, the Danish Government took theconsequence to postpone the Danish plans.
Routes to Sustainable Transport
17
Methods for Monitoring Environmental Impact from the Transport SectorThe Environmental Protection Agency keeps an eye on the quality of air through measurements. Toprotect the citizens from adverse health effects of air pollution there has been set limits on how muchpollution in the air we can accept and for each of the substances there are threshold limits. Denmarkcomplies with the threshold limits for most of the substances but for particulates and NO2, we still needto do an extra effort. The Environment Protection Agency also measures the levels of noise from trafficand railways in Denmark.In general, large infrastructure projects should undergo an environmental impact assessment beforecarried out.
Particle FiltersSince 1st. of April 2010 diesel cars should use a particle filter or otherwise pay a fee/tax of 1000 kr a year.To install a particle filter on old cars will however cost 5.000 – 10.000 kr, which from a cost-benefitanalysis can be more expensive than paying the fee/ tax. A recent evaluation showed that by 1.September 2010 only 1000 out of 354.000 diesel cars had installed the particle filter. Further, critique saysthat the standard for the particle filter is not good enough to remove dangerous particles.
LandUse and Physical PlanningPhysical planning and transport infrastructure building is in Denmark focused on three main transportcorridors connecting Denmark to Scandinavia and the rest of Europe. Around Copenhagen the so-called”finger plan” has prevailed for more than half a century, building space are the fingers and green zonesare in between. This strategy is about to be developed for all of Zealand, so that urban development willtake place in cities with railway connections. This is meant to avoid continued urban sprawl.
Transport and Mobility in Rural Areas Versus Densely Populated AreasAs part of a plan to avoiding further marginalisation of rural areas, the Government has initiated a plan tobuild new infrastructure (roads and highways) to connect rural areas with the more densely populatedareas with dynamic economies. It also includes particular rules of physical planning, making it moreattractive for production and retail companies to settle in these areas.
Routes to Sustainable Transport
18
Urban Planning Aiming at Reducing Transport GrowthIt is a general aim in Denmark to encourage bicycling, but some cities have chosen to take it further andhave become cities of cyclists. Copenhagen and Odense are cities of cyclists and they have both made amassive effort in developing a comprehensive cycle infrastructure.Cyclists in Copenhagen travel a total of 1.2 million km by bike every day. This is the equivalent of cyclingto the moon and back – twice! There is a total of 350 km of cycle tracks and 40 km of green cycle routes inCopenhagen, equivalent to the length of Jutland. 37% of those working or studying in Copenhagen bikeevery day. A big city with so many cyclists offers many benefits. In terms of the environment alone,cyclists help keep the city’s CO2 traffic emissions at a low level compared to other big cities. When wereach the stage that over 50% of commuters choose to cycle to their place of work or education, thenCopenhagen traffic will be able to save an additional 80,000 tons of CO2 per year.
Border-crossing Transport in EuropeThe biggest Danish border crossing infrastructure project, the Fehmarn Belt connection, prolongedtowards Sweden via a new Helsingør-Helsingborg connection. The case shows the focus on connectingScandinavia to Europe, paving the way for transit freight transport and high-speed rail connectionsbetween larger cities. Unfortunately the environmental aspects are not that much in focus. High-speedrail is discussed as an option, mainly to connect the large Danish cities with large cities outside Denmark.The plan for the Fehmarn Belt connection is to have electrified rail. However, in the short term there areno plans for electrification.
Routes to Sustainable Transport
19
Routes to Sustainable Transport
20
European ParliamentSTOA – Science and Technology Options AssessmentAuthor: Dr. Jarka Chloupková
State of PolicyGlobally, transport contributes with 13-14% to Green House Gases (GHC).iFor Europe, this figure mountsto 21%ii; a half of this amount is attributed to long distance transportiii- a sector totally dependent on oil.Not only is this a pressure on natural resources and environment, in addition, the increase in congestionsand bottlenecks in the European transport network restricts the free flow of goods and people, especiallyin the centrally located and densely populated regions of the European Union. Such trends run counterthe Lisbon strategy, which aims at making Europe the most competitive and the most dynamicknowledge-based economy in the world. The increased traffic led to a reduction of the quality of life -emissions of air pollutants, noise and reduced spaces for living.The future European transport has to overcome a range of challenges and will be on the agenda of theEuropean Parliament's in the years to come. STOA projects were undertaken with the aim of reducing oildependency by 80% and CO2 emission by 60% in the year 2047.This report is primarily based on a number of completed STOA projects, carried out by Ida Leisner, JensSchippl, Christian Dieckhoff, Torsten Fleischer, and Anders Kofoed-Wiuff et al. Given the importance oftransport related issues, STOA is currently running a project "Technology Options for Urban Transport"and will soon start a new one around the theme of "User perceptions on eco-efficient transport futuresfor Europe".
Energy Use for TransportTrucks (freight) consume the largest amount of energy used for transport, followed by aviation(passengers), mainly oil, emitting most of transport related CO2 emissions. The breakdown for well-to-wheel energy consumption is: Trucks (54%), Aviation (27%), Private cars and motorcycles (14%) - statusquo of 2005.
Regulation and Technology Options for Sustainable TransportThe European Commission has established a proposal that requires a reduction of the average emissionsof CO" from new passenger cars in the EU from around 160 g/km to 130 g/km in 2012 - the average sold
Routes to Sustainable Transport
21
car produced between 160-190 g/km during 1995 - 2006 period. In scenarios, a reduction down to 100g/km is assumed to be obtained by 2030.With an aim to improve energy efficiency and reducing emissions, a wide range of technological pathwaysare being discussed. Hydrogen production from renewable sources (wind, photovoltaic, solarthermal,water) via electrolyses enables close to zero emissions of GHG. A 'clean' production of hydrogen fromnuclear power is also feasible. Hybrid technology offers a possibility to save energy and emissions by usingestablished technologies and infrastructures. The commercialization of electric cars (Battery ElectricVehicles) depends on the development of sustainable batteries. Electric vehicles and plug-in hybridelectric vehicles offer multiple benefits by improving fuel efficiency as well as the utilisation of windenergy by using electricity in a more flexible way - e.g. by charging at certain times or serving as"batteries" for the electricity systems.Biofuels can be derived from a wide range of biomass and might serve as a relatively clean 'bridging' and'additional' technology. First generation of biofuels, mainly biodiesel and bioethanol, are the onlyrenewable transport fuel option that is commercially deployed. Second generation biofuels are producedby synthesis, in most cases from synthesis gas which is then treated in a so-called 'biomass-to-liquid'process (BTL) - offering an option to define specific fuel properties. It is estimated that 20-30% of EU 27road transport fuels in 2030 could be covered by biofuels. Natural gas technology (CNG) is feasible in thetransport sector and has the potential to bring at least mid-term GHG emissions improvements. Autogas(LPG), an uncomplicated technology, is becoming popular in several European countries. It is likely thatinnovative technological developments will be implemented and established faster in the road sector.For air transport, there are less options and kerosene fuelled gas turbines will probably remain therelevant technology for the near future.
Land Use and Physical PlanningThe task is to influence spatial planning with the aim to prevent transport growth that would jeopardizecitizens' mobility. Sustainable (urban) infrastructure ought to serve mobility needs of the population -examples walking, cycling or public transport. Transport technologies and transport flows need to beorchestrated efficiently without wasting resources. ICT applications allow 'load matching' - improvingcapacity use and reducing empty running of trucks. An optimized distribution of warehouses shouldreduce transport volume. Industrial areas and railway station could be located closer together. IntelligentTransport Systems could improve traffic flow and thus accessibility. Route guidance has a potential toimprove efficiency by avoiding detours or by circumnavigating congested areas. Rail transport would bethe best way to introduce electricity in freight transport.Land use planning is a relevant measure for the long run and will be more effective if coordinated atEuropean level. Distribution of airports in a country, such as development of a few huge airports could
Routes to Sustainable Transport
22
strengthen high-speed railways, given there is a corresponding infrastructure. Transport volumes in theair sector could be tackled by the implementation of high-speed railway lines.
Border-crossing Transport in EuropeThe Trans-European transport network is a European Union current strategy, among others aiming ataiding with free movement of goods, people and services. It is also an element for economic growth andthe creation of employment. It includes upgrading and building new airports, new high-speed railwaylines, motorways of the sea, etc. Examples include the railway corridor Lyon-Trieste-Divaca/Koper-Divaca-Ljubljana-Budapest-the Ukrainian border and the Fehrman Belt railway corridor between Denmark andGermany.
ConclusionIt was concluded that no single policy can solve these problems. In conclusion, options for reducing oildependency, including lowering CO2 emissions include: Investment in rail infrastructure to encouragemodal shift, including cross-border high-speed rail; Reorganisation of airports distribution with the aim oftravel reduction – only few mega airports and integration of rail and air; Introduction of hybrid trucks,especially if combined with renewable energies, including hydrogen and biomass. Further measureswould utilise the ICT potential within the transport sector, and a link-up of transport modes –intermodality. Reassessing of pricing measures – fuel prices, carbon based taxation, road pricing – couldbe wise.
Routes to Sustainable Transport
23
Routes to Sustainable Transport
24
FinlandCommittee for the Future
State of PolicyMinistry of transport and Communications published A Climate Policy Programme 2009-2020 fortransport sector on March 17th2009.The aim the Programme is to substantially reduce emissions from business, industry, administration andpeople’s everyday lives by means of transport and communications policies.Besides the use of biofuels, emissions from transport will be cut by 2.8 million tonnes compared to theestimated emissions level of 2020.The administrative sector of the Ministry of Transport and Communications will adapt to the climatechange in construction, maintenance and management of the transport and communicationsinfrastructure so as to maintain the level of transport and communications services. Advantage will betaken of the possible benefits of the climate.The following measures will be taken to achieve the climate policy aims of the administrative sector:1. The vehicle fleet will be renewed. 2. Energy efficiency in transport will be improved. 3. The growth ofpassenger traffic volumes in urban areas will be directed to more environmentally friendly transportmodes. 4. The attainment of Finland’s climate policy objectives will be supported by information societyand communications policy. 5. A decision will be made in 2012 on the financial steering methods used inthe transport sector. 6. Action will be taken to adapt to the climate change.
Climate Programme in Transport Sector Aims1. That in 2020 specific emissions of new cars sold in Finland would be near the EU objective (95 g/km; thecurrent level is at around 163.5 g/km) and the rate of vehicle fleet renewal would be around 7 per cent ayear. The goal with regard to the entire vehicle fleet is that by 2020 the average carbon dioxide emissionswould be 137.9 g/km at the most (currently around 180.1 g/km).2. That goods transport and public transport operators party to energy efficiency agreements will savenine per cent in energy consumption and that the overall energy efficiency in the transport sector willimprove. The emissions reduction potential from improved energy efficiency is 0.3 million tonnes.3. That by 2020 a total of 100 million more public transport journeys and 300 million more walking andcycling journeys will be made, which means an around 20 per cent increase to the current figures.
Routes to Sustainable Transport
25
4. That the administrative sector will systematically promote the use of information society services,which decrease emissions in business, industry, administration and people’s everyday lives.5. That the climate change will not lower the current service level in transport and communications. Inorder to attain the goal the Ministry’s administrative sector will update its instructions about transportinfrastructure construction, maintenance and management, outline an action plan for exceptionalcircumstances and invest in research.
Climate Targets and TransportThe emissions reduction potential:from the vehicle fleet renewal (1) amounts to 2.1–2.4 million tonnes,from improved energy efficiency (2) is 0.3 million tonnes andfrom the change in the modal split (3) amounts to 0.3 million tonnes.
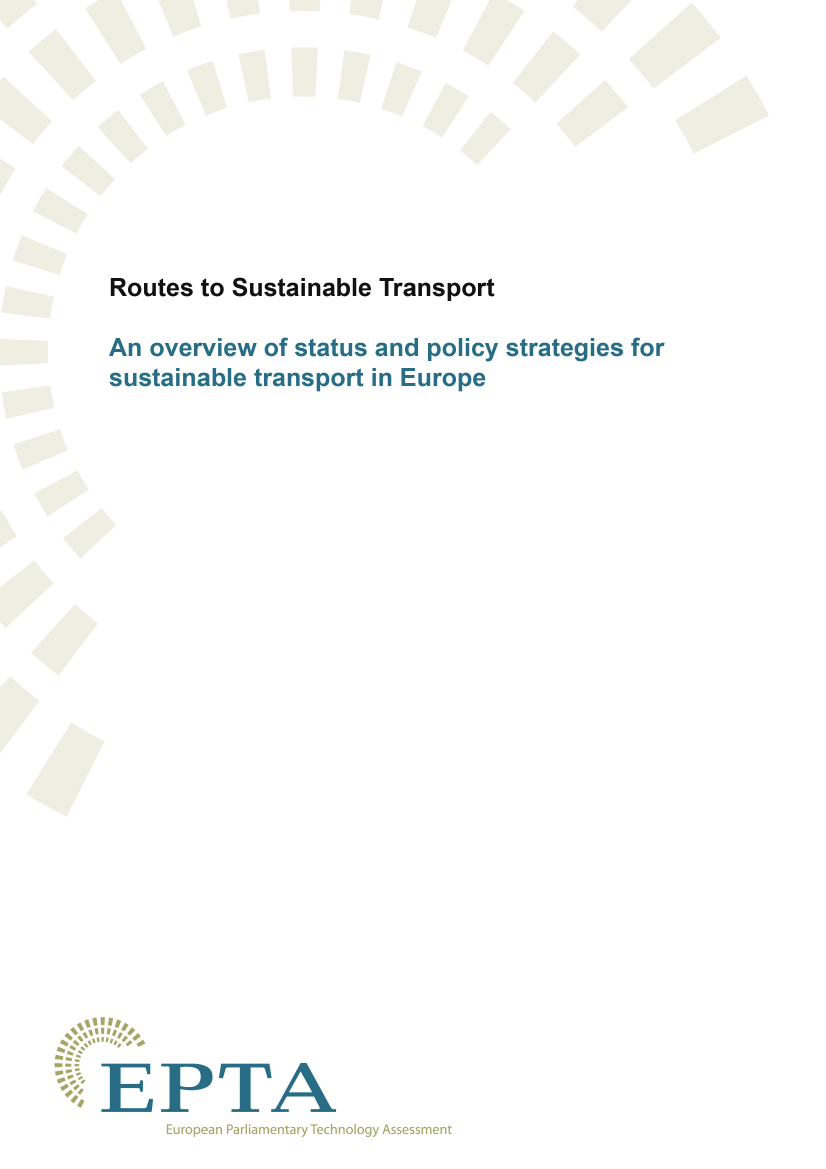
161412Milj. t CO210ekv.864201990 1992 1994 1996 1998 2000 2002 2004 2006Total CO2 emissions in domestic transport
Waterborne transportAviationRailway transportRoad transport
Routes to Sustainable Transport
26
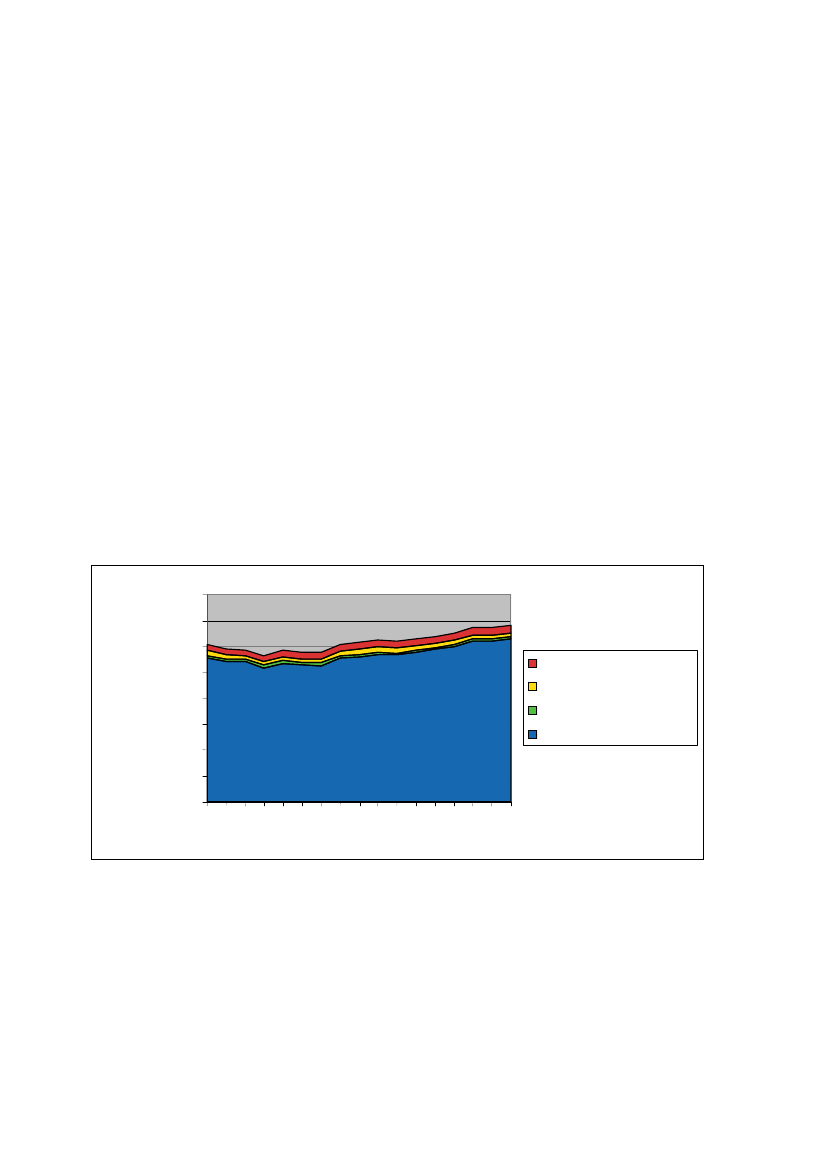
18,016,014,012,0Milj. t.10,08,06,04,02,00,0199019921994199619982000200220042006AviationMaritime transportRailway transportRoad transport
Total CO2 emissions transport sector of Finland, domestic plus international
Emissions of Transport and the Energy Use for TransportEmission sand energy use of transport of Finland [t]Energyuse [PJ]146147149152155161169178185195200195194189197
YEARI198019811982198319841985198619871988198919901991199219931994
CO501 781506 689509 193514 718516 608511 579506 334507 670509 628511 639497 372474 699461 090442 769428 560
HC70 44571 09171 83972 67673 66873 89974 28675 56577 45979 19977 70074 09572 04269 53267 223
NOx192 735191 297189 852188 786189 072191 398192 304196 475199 811203 102201 392190 585185 666185 518186 596
Particles8 9349 1339 3119 4939 7059 93510 13710 15110 1439 9809 8819 3159 0229 0078 871
CH44 2864 2864 3244 3554 4054 4284 4474 5404 6664 7754 6524 3954 2564 0943 953
N2O442442453466483506521549579607632627626631639
SO231 64030 01228 43628 00627 58327 72326 28926 91226 17225 81925 39924 49623 94423 92424 250
CO2[milj. t]111111111112121314141514141414
Routes to Sustainable Transport
27
1995420 64665 703 181 0588 548 3 832 648 22 737141951996408 69763 188 174 8268 167 3 672 650 21 399141941997400 84061 391 174 3287 889 3 540 666 22 148152051998391 85559 282 164 5497 316 3 393 673 20 720152061999382 27157 429 169 0047 108 3 292 695 20 667162152000365 53954 171 160 0886 587 3 098 686 19 962162132001352 98651 778 155 0736 254 2 956 698 19 586162152002337 58149 244 148 2785 980 2 823 696 19 846162162003319 68546 595 144 5535 813 2 688 702 20 160162202004299 33643 424 134 5125 391 2 467 689 18 790162252005277 01340 450 133 8455 286 2 302 692 19 741172272006252 92337 371 121 3734 855 2 064 675 18 159162232007243 25235 502 118 3564 802 1 935 675 18 318172302008221 12529 062 112 1574 494 1 706 647 18 177162272009187 92224 81595 1423 872 1 396 605 14 071152122010181 93924 02794 3813 863 1 323 619 13 795152182011179 72123 90993 5273 827 1 304 632 13 598162242012177 95623 76293 0233 810 1 287 647 13 456162292013174 30723 49692 0273 742 1 261 661 13 216162342014170 15323 10589 6053 667 1 227 674 12 502172382015165 90322 68387 4053 603 1 193 687 11 838172412016160 76022 11284 9303 482 1 160 698 11 218172432017155 79021 74082 6603 386 1 127 709 10 637172442018150 74421 49180 6363 310 1 098 721 10 091172462019145 84420 92978 7933 236 1 069 733 9 578172472020141 86020 63477 1323 155 1 047 750 9 092172482021138 05820 21175 6313 097 1 027 764 8 633172482022134 39919 99774 3513 046 1 008 778 8 196172482023130 97619 65273 2463 005 989 793 7 782172482024127 96919 33372 2642 969 973 807 7 389172482025126 08619 07271 3742 928 962 820 7 014172482026124 34618 90770 7722 904 952 833 6 660172482027122 95118 75170 2162 870 943 844 6 322172482028122 01418 66169 7482 837 937 853 5 99817248The figures covers the domestic and international transport from and to Finladn but not the internationaloverlights. In case of electric railways and trams the emissions are based on the total power supply in Finlandand is calculated from share of the electricity use of trains and trams.Lähde: LIPASTO 2008 laskentajärjestelmäLast Updated22.10.2009By Kari Mäkelä, VTTEmail:[email protected]
Routes to Sustainable Transport
28
The Current Share of Energy Consumption Used for TransportThe energy consumption in the transport sector was in 2007 227 PJ. This corresponds to one fifth of thewhole energy consumption of1 132 PJ.The energy consumption in the transport sector is higher than theenergy consumption in the households.The share of gross energy production coming from renewable energy sources such as bio fuels, hydrogen,electricity and other alternative fuelsThe use of renewable energy sources at present in transport (excluding railways) is insignificant.
Plans, Policies and Discussions on Increasing the Use of Renewable Energy Sources forTransportGovernment has introduced an Energy Package to enhance the use of renewable energy sources. Thepackage includes different instruments (subsidies, R & D funding, and regulations) to develop andincrease the use bio fuels and other renewable sources of energy. The Package does not have anydedicated means for transport. At the same time the Government has introduced a proposal for a reformof energy taxation, based on CO2 emissions – including some exceptions. New taxation is aimed to comeinto force at the beginning of year 2011.
Land Use and Physical PlanningTransport and Mobility in Rural Areas Versus Densely Populated AreasThe main challenge in reducing the use of energy in transport in Finland is that the country is sparselypopulated and distances are long. The population is rapidly concentrating to urban areas but at the sametime there is some signs of disintegration of urban areas in the regions of our biggest cities.
Strategies for Sustainable Urban Mobility and the Shift from Private to Public Transport orCycling/Walking and Regulative Measures Like Road PricingReference to the Climate Policy Programme 2009-2020.
Border-crossing Transport in EuropeIn terms of vehicle volumes and total value of cargo Finland is the biggest import border-crossing countryof Russia in road transport. Finland applies same rules for transit transport as to domestic. The only
Routes to Sustainable Transport
29
exception is the maximum total weights and dimensions the vehicles. The maximum size of Russianvehicles is the same as in most of EU countries.There are no user charges or road tolls in use and also all technical regulations are equal to EUregulations.
Routes to Sustainable Transport
30
FlandersIST – Institute Society & TechnologyAuthors: Donaat Cosaert and Marian Deblonde
State of Policy : PACT 2020Flanders hardly has space to spare for new transport infrastructures. For that reason, more intelligent usemust be made of what already exists. This is possible by dividing transport among the varioustransportation modes – both for the conveyance of passengers and goods. The relentless volume of roadtraffic has additional disadvantages: the number of traffic victims is unacceptable; there is the problem oftoo much traffic noise, plus the excess of greenhouse gas emissions and concentrated fine dust particlesinto the atmosphere. Flanders needs to promote environmentally responsible transport modes, especiallywithin the urban centres.Pact 2020 consists of twenty ambitious objectives with a clear delineation of the target figures. With thisFuture Pact, the signatories want to book progress within five principal domains:
A Competitive and Sustainable EconomyFlanders iseasily accessibleby road and rail, via the waterways and by air, using both private and publictransit and transport modes. The region manages to attract a sufficient number of logistics players thatare in a position to contributeadded valueand benefits andgenerate more employment.Flanders will have stabilized its access toenergy sources.This guarantees increased certainty of energysupply and results in sharper pricing. TheCO2emissionshave beenlowered,in keeping with theEuropean commitments already concluded.Flanders makesmore efficient use of energy andmaterials. Energy consumption inside buildings hasbeen lowered considerably and new housing development meetsoptimal performance norms.In its water and air quality standards, soil protection and purification, and the elimination of nuisancenoise, Flanders scores on a par with the top European economic regions. The emission ofgreenhousegasseshas been lowered conform to the European objectives. The average annual concentration offinedust particleshas beenloweredby 25% vis-à-vis 2007.Flanders will have developed atraffic and transportation systemto rank among thefinest and mostefficient in Europe.The year 2020 will register a substantially lowered count of traffic fatalities andseriously injured victims. Flanders has managed to combine the various transportation modes in anintelligent manner.
Routes to Sustainable Transport
31
Logistics and InfrastructureThe economic gateways are readily accessible via the various transportation modes (road, rail, water, orair) and via the array of available carriers (both private and public). As a result, we will register less than5% in hours lost (calculated on the total number of hours travelled by vehicle) on the trunk roads while, atthe same time, we will limit the environmental impact of goods and passenger transport.To this effect, missing links within the transportation network (on the road, on water, and by rail) in theSpatial Structural Plan Flanders will be eliminated. The transportation flows will be dynamically managedin order to be able to make optimal use of the available infrastructure. In order to derive maximum valuefrom logistic operations, we will be attracting logistics players with the ability to generate full added valueand employment.
High Quality of Life: MobilityIn 2020, Flanders will have developed a traffic and transportation system to rank among the mostefficient in Europe. To this end, co-modality, supported by a purposeful location policy and by the STOPprinciple (first pedestrians, then cyclists, then public transport, and finally private vehicles), will figure asthe cornerstone of the Flemish mobility policy, to the extent that from an economic, social, ecological,andlogistic point of view the optimal mode is being implemented. We will ensure that we satisfy theenvironmental objectives that are, likewise, being imposed on other European countries by 2020.Investmentsin traffic and transportation systems will be supported within the policy by means of a socio-economicevaluation and a Flemish accessibility monitor.By 2020, Flanders will figure as one of the best European regions in terms of traffic safety, expressed bothin terms of the number of killed or seriously injured road casualties per million kilometres travelled andper million inhabitants. Vis-à-vis the objectives outlined in the Flemish traffic safety plan, to be in place by2015, a drop of 20% in fatalities and of 25% in seriously injured road casualties will be realized in 2020.
Transport Policy AimsFlanders is looking forward to 2020. In that year, it wants to assume a leading position among the bestperforming European regions, an ambitious goal, indeed, yet one that has every chance of succeeding ifthe Flemish community can fully bring to bear all of its considerable assets on the endeavour. For thatreason, Flanders in Action anno 2008 is focussed on break-through actions.Break-throughs demand drastic interventions that really will make the difference so as to strengthen andbreathe new life into the Flemish economy and its society in a number of crucial aspects. Authorities,industry, the civil society, and the citizens, all must roll up their sleeves and get to work in order to enablecrucial break-through.
Routes to Sustainable Transport
32
Environmentally Friendly and Responsible TransportThe quality of life within urban centres is being raised through the construction of park and nature zonesand by the realisation of improved traffic flows. Flanders maximizes passenger traffic that is conscious ofenvironmental health. It stimulates research into alternative and less polluting fuels and energy-responsible vehicles. It offers financial incentives for the purchase of vehicles with reduced exhaustemission and encourages new forms of pooled and collective transport. Likewise, it devotes greatattention to the strengthening of the Flemish automotive industry and its supply network. All parties mustbe in a position to satisfy the demand for lighter and renewable materials and for hybrid power trains forvehicles.
Standing Out in Traffic ManagementFlanders can boast of outstanding achievements in intelligent mobility technology. The authorities,industry, and research institutions are collaborating in that respect to devise ICT applications to trafficmanagement. ICT is the key to such novel technological mobility applications. The new systems inform theroad traveler about the fastest, least expensive, and environmentally friendly traffic solutions. Thisinformation can be received via different media: via the Internet, electronic information panels, andinformation kiosks at railway stations and along the highways; it is likewise accessible via the traveller’sGPS, GSM, or PDA. Businesses will be collaborating on logistical themes via electronic communicationplatforms. For instance, the transport of goods will be conducted as much as possible by using multi-modalities, outside of peak times, and by using improved grouping.Flanders has the ambition to become a genuine intelligent pivot for transport and logistics in Europe. Forthat purpose, it is integrating traffic management for citizens and businesses into a wide-ranging actionplan that has a variety of approach angles:concern for infrastructure;multimodal transferia;broad policy plan as compass;intelligent kilometrage levy;multimodal brokering;logistics with added value.
Concern for InfrastructureFlanders needs to invest in accordance with an appropriately conceived plan, not only to make maximumuse of existing traffic infrastructures but also to improve and expand them where necessary. Freighttransport combines a variety of transportation modes (ship, train, truck). Individuals also purposefullyselect the most efficient transport mechanism for every travel route: on foot, by bicycle, train,
Routes to Sustainable Transport
33
automobile, or plane. That kind of multimodal system demands a radical change in one’s mentality andway of thinking.
Multimodal TransferiaTransferia render the traffic and transportation systems more effective. A transferium is a transit pointwhere travellers can make a transfer from one conveyance to another (for instance, from automobile tostreetcar), or a transit point for the transfer of containers (for instance, from an inland transport barge toa truck). More transferia enable a better distribution of passenger and freight movement across thevarious transport modes.
Broad Policy Plan as CompassTransportation activities exert their impact on a number of different domains, for instance, in the areas ofspatial development, industrial terrains, logistics, and mobility. This calls for a well-considered planningpolicy in the process of which the various administrations, partners, and initiatives join in a concertedeffort to harmonize and attune their individual plans to one another. That kind of approach likewiseneeds to offer investors and businesses adequate reliability and legal certainty about its composition, thusto increase Flanders’ attractiveness asa desirable place to establish a business.
Intelligent Kilometrage LevyThe introduction of an intelligent kilometrage levy pursues traffic-technical, economic, and ecologicalgoals. From a traffic-technical point of view, such a levy improves the accessibility, and optimizes the use,of the traffic infrastructure. From an economic standpoint, it asks the road user to pay his or her share ofthe infrastructure investment and maintenance costs. The levy furthermore serves an ecological purpose:the polluter pays for the pollution caused to the environment. As a result, road users will give greaterthought to the impact of their road conduct and modify their behaviour accordingly.
Multimodal BrokeringThe authorities and business organisations safeguard the presence of sufficient independent multimodaltransport brokers. The latter’s tasks are to stimulate businesses, assist them with counsel and advice, andsupport them in the realisation of a proper and appropriate transport mix.
Routes to Sustainable Transport
34
Logistics with Added ValueInvestments in novel ICT solutions and innovative mobility applications are highly necessary. By betterattuning the logistics and the education sectors to one another, one also improves the influx of talent intothe region. Flanders maintains its position as a logistics top player and is the most readily accessibleregion.
Emission of Greenhouse Gases: Transport Is the Only Sector in WhichEmissions Continue to IncreaseTransport (including private transport; 17 %) and households (15 %) are important sources. The emissionsof greenhouse gases by transport continue to increase further after a strong increase at the start of the1990s. In contrast to passenger transport, the increased energy efficiency of most modes of transport wasnot enough for freight transport to compensate for the growth of the transport flows.
Routes to Sustainable Transport
35
The CO2 emissions followed this trend up to 2006. In 2007 there was a slight deviation due to the use ofbiodiesel by road traffic. Biofuels are considered to be CO2 neutral. The changes in the energyconsumption and the CO2 emissions were largely determined by road traffic, which represents the bulk oftransport flows. The gradual increase of diesel cars in the vehicle fleet and an increased availability andpurchase of more energy efficient vehicles explain the slight fall for passenger transport. The strongergrowth in freight transport, on the other hand, resulted in rising greenhouse gas emissions.
R&DFlanders’ DRIVE was set up in 1996 as anindustry initiativeby: Agoria Flanders, LMS International,Bekaert, Bosal, Tenneco and Sirris. Activities started in 2001 with the support of the Flemish Government.In 2004, the building and infrastructure of Flanders' DRIVE in Lommel came into operation.At first, Flanders' DRIVE focused solely on product innovation. Since 2005, we expanded our focus toinclude process innovation for production and assembly companies as well. The Flemish government gaveFlanders' DRIVE new impetus for the 2007-11 period so that Flanders’ Drive could develop into aninternational competency pool.C aim at:a coordinated approach to innovation, driven by the industrya targeted build up of competencies and research with the aim of international recognitionthe development of a wide network in Flanders and the ELAT triangle (Eindhoven, Leuven, Aachen)with the objective of exchanging experience, cross-pollination and cooperationa cross-border and international profile.
Routes to Sustainable Transport
36
Energy Storage: Battery and Battery Management in Electric VehiclesThe availability of sustainable, reliable and cost-effective energy storage, in batteries for example, iscrucial to the development and acceptance of vehicle electrification. This project is studying the latestgeneration of lithium-ion batteries for electric and hybrid vehicles. There is a special focus on the batterymanagementsystem.The first step in this project is to define the demands a vehicle places on the battery system. Marketresearch into the available technology is already in its final stage. Based on the data gathered, the first setof battery cells have already been bought. Tests with these cells will begin shortly. The basic structure ofthe battery pack has already been defined as well. Details will be provided in the coming months.GOALSThis project will develop a modular battery pack, which can be used for hybrid as well as fully electric carsand buses. The pack consists of lithium cells connected in parallel or series that are controlled by anintelligent battery management system. Knowledge about lithium batteries is being built up and used todevelop an intelligent management system that controls batteries safely and efficiently.
Research Vehicle for Active Safety: Active SuspensionActive safety systems for avoiding accidents are extremely complex electro-mechanical systems. Theproduct developer has a strong interest in managing this complexity in a short development time. Thisproject uses a specific methodology called V-methodology. In this project it is used specifically in thedevelopment of a new active suspension system. If this system is coupled to a vision system, the vehiclecan see potholes in the road and anticipate them. The active suspension is fitted to and tested on a realvehicle, which can later be used to test other active safety applications. The basic functions of the systemhave already been fitted and tested. Safety functions and energy management have been integrated andan initial parameter optimisation was carried out on the vehicle.GOALSThe goal of this project is to make V-development methodology proprietary, specifically through thedevelopment of active suspension. The approach of judging the forces acting on the wheels and theintelligent management of the suspension lead to improvements in comfort and vehicle dynamics. Avehicle equipped with active suspension will display stable ride characteristics under all conditions. Theresearch has been backed by an innovative rapid prototype, a powerful computer which can calculatecomplex algorithms. The project includes research into future vehicles' architecture and the use ofsensors.
Internal Logistics Improvements Through RFID Technology: Monitoring GoodsFlows with Radio Frequency IdentificationRadio Frequency Identification (RFID) is a technology used in many domains, such as in clothing tags toprevent shoplifting for example. In this project, this technology is being used for the first time to chart and
Routes to Sustainable Transport
37
follow the flow of goods actively. RFID can contribute to a more efficient and streamlined delivery ofcomponents to production lines, and thus also to a reduction of logistics costs. This project is researchingthe possibilities of using RFID technology to analyse and redesign internal goods flows.The participants in this project have defined their scope and explored the technology. Currently, researchcase studies are under preparation.The aim of this project is cost savings through the improvement of internal logistics flows with the help ofRFID technology.ETHODOLOGYBy applying RFID technology, goods flows can be examined and analysed. Using dynamic models, goodsflows can then be visualised and improved.
Energy Consumption for TransportEnergy consumption of transport is not decreasing in spite of efficiency improvement.In 2007, the transport sector was responsible for 11.7 % (188.8 PJ) of the gross domestic energyconsumption in Flanders. Road transport accounted for 95 % of the transport sector. Compared to 1990,the total energy consumption of the sector increased by 12.6 %. The energy consumption of passengertransport by road experienced a certain stabilisation from 2000 onwards. This is the result of a smallerincrease in activity combined with an increase in the energy efficiency of vehicles. For freight transport byroad, which also uses more energy efficient technologies, there was a general increase in the energyconsumption (+33.4 % compared to 1990) due to the still strongly increasing activity.
The energy consumption by rail has increased by 6.4 % compared to 1990, this is less than the increase inactivity. The further electrification of the railway is responsible for that as electric motors are much moreefficient than diesel engines.
Routes to Sustainable Transport
38
In 2007, 74 % of the energy consumption for rail was provided by electricity, in 1990 that was still only 53%. Inland navigation saw an increase in energy consumption of 40.3 % in the period 1990-2007. Economicconcerns ensured that the energy efficiency of the ships was also forced upwards.
The Climate Commission: Eco-efficiency of Passenger Transport Better thanthat of Freight TransportThis indicator compares the environmental pressure caused by the transport sector (emissions, resourceuse) with a relevant activity indicator. For that reason the sector was divided into passenger traffic (firstfigure) and freight traffic (second figure). Decoupling occurs when the growth rate of a pressure indicatoris lower than the growth rate of the activity indicator. Decoupling is absolute if the growth of the pressureindicator is zero or negative and is relative if the growth of the pressure indicator is positive but not aslarge as that of the activity indicator.
Routes to Sustainable Transport
39
The energy consumption of passenger transport (road and rail traffic) decreased by 2.1 % in the period2000-2007. There was an absolute decoupling with the passenger kilometres. The energy consumption ofgoods transport (road and rail traffic and inland navigation) increased by 9.9 % in this period; although arelative decoupling occurred with the tonne kilometres.
Routes to Sustainable Transport
40
Plans, Policies and Discussions on Increasing the Use of Renewable EnergySources for Transport.BiofuelsPotential for local production of biodiesel (1st generation)In Flanders: 1.3 ktoe/yrIn Belgium: 13 ktoe/yrPotential for local production of bio-ethanol (1st generation)In Flanders: 440 ktoe/yrIn Belgium: 930 ktoe/yrSeven producers of biofuels received a quotum from Belgian authorities4 biodiesel producers; 300 ktoe/yr3 bio-ethanol producers; 127 ktoe/yrThese quota are valid till september 2013. Still no obligation to partly mix biofuels in the regular fuelcircuit.
HydrogenHydrogen technology at most a complement to, not a competitor of, other energy sources for transportuse.Flanders has the largest underground pipeline grid for hydrogen (900 km) worldwide.Consortium of 35 Flemish organisations active in the domain of hydrogen and fuel cell technology.Lacking infrastructure of filling stations
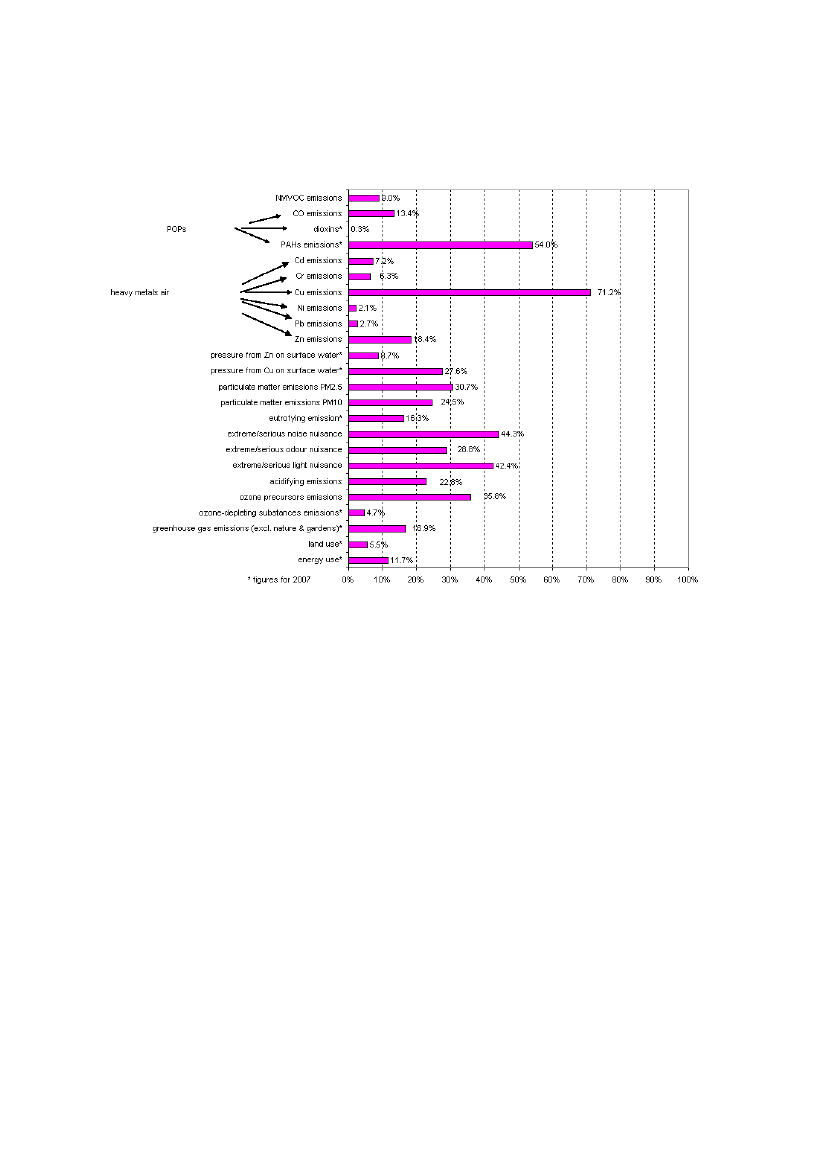
Methods for Monitoring Environmental Impact from the Transport SectorThe transport sector causes air pollution that is harmful to humans and nature. The traffic makes amajor contribution to the emissions of CO, NOx, NMVOC and CO2. These emissions make a significantcontribution to climate change, photochemical air pollution and acidification. Particles and heavy metalsare also emitted by the traffic and are harmful to health.
Routes to Sustainable Transport
41
Figure: Share of transport in the environmental pressure of various themes (Flanders, 2008)(
The sector also causes major pressure on other environmental themes. Rail, air and road traffic causenoise nuisance. Rail, water and road infrastructure result in fragmentation and barrier function resultingin a decrease in biodiversity. The lighting of the roads also causes nuisance. The increasing amount ofmeans of transport also causes an increase in the waste problem once the vehicles are taken out of use.The marginal environmental damage costs caused by the transport sector are important but the marginalexternal costs for transport are mainly controlled by the costs caused by congestion.
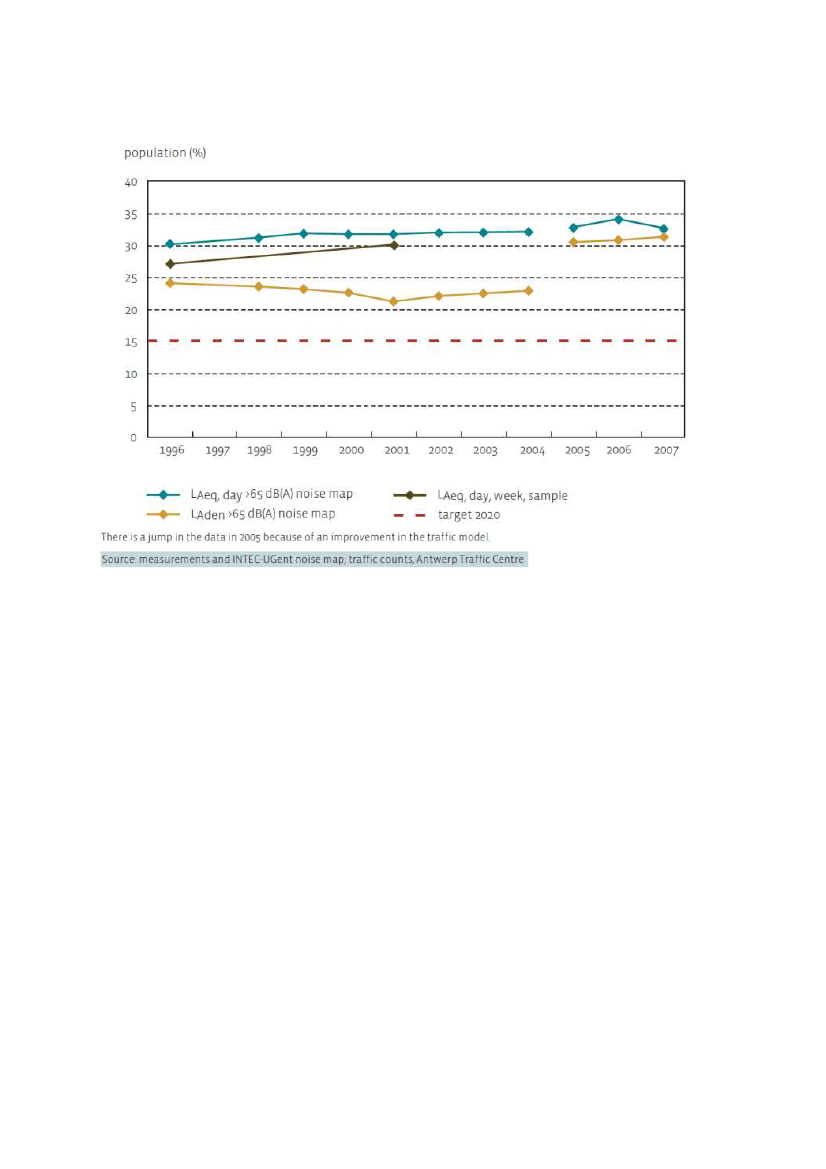
Road Traffic is a Major Source of Noise Nuisance.The exposure of the population to sound pressure levels above 65 dB is described by means of threeindicators which show the sound pressure level at the building facade, i.e. a measured indicator (LAeq,day, week, sample), a calculated indicator that shows the exposure during the day (LAeq, day >65 dB(A)noise map) and a calculated indicator that includes the need for quiet at night (LAden >65 dB(A) noisemap).
Routes to Sustainable Transport
42
Sound Pressure Levels in Flanders Keep IncreasingThe long-term target in the MINA plan 3+ (2008-2010) stipulates that in 2020 only 15 % of the populationwill be exposed to outside traffic noise during the day in front of the house (LAeq >65 dB(A)). At presentthis is still twice as much.Between 1996 and 2001 the sound pressure level at the measured indicator has increased significantly.We see the same change in the indicator that shows the sound pressure level during the day. The soundpressure level for a good night’s rest has also increased since 2001. In 2007, the exposure to high soundpressure levels during the day has decreased while the indicator that includes the need for a night’s restincreased slightly. This seems to indicate that traffic is shifting to the night hours and/or that the averagedriving speed during the day is increasing. A detailed analysis of the data is needed to confirm this.
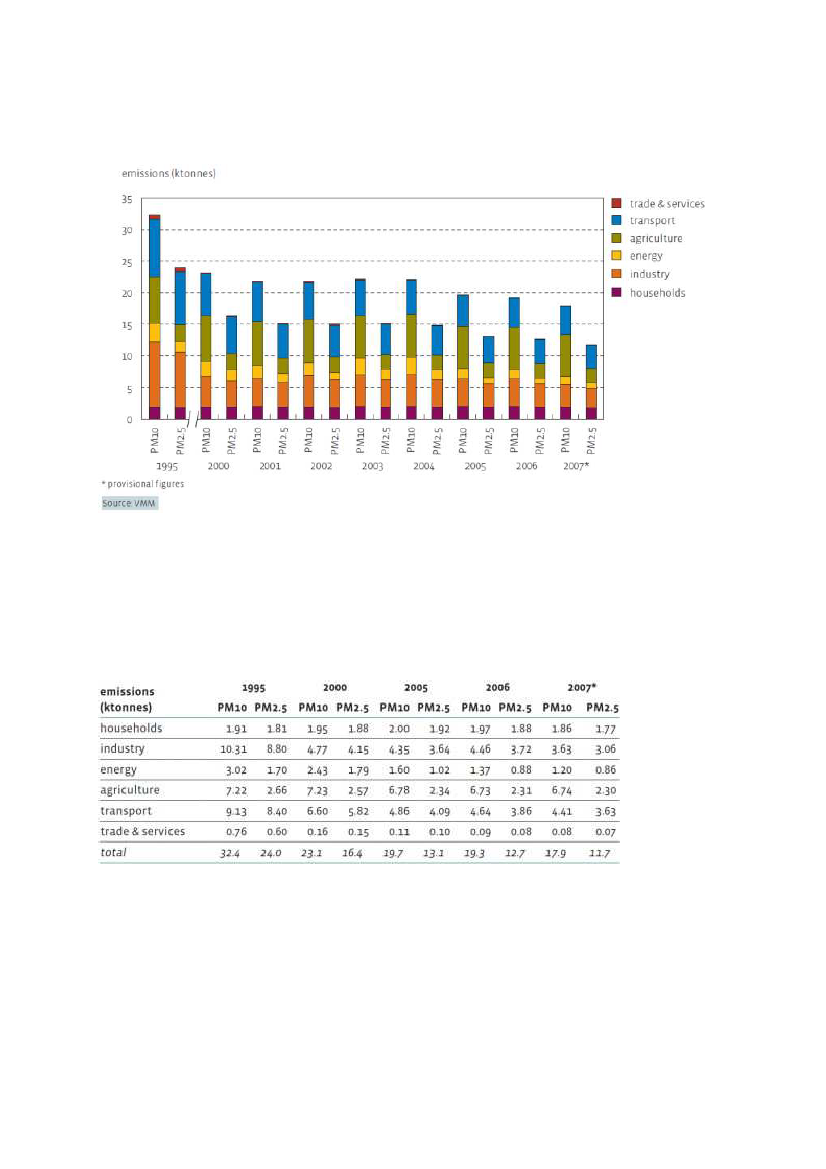
Emission of PM10 and PM2.5Attention is increasingly shifting to finer fractions of particulate matter such as the PM2.5-fraction. Thesefiner fractions could be even more harmful to health than the larger PM10-fraction. PM2.5 may enter theatmosphere via direct emission (primary particles). This indicator shows the emissions of primary PM2.5divided according to the different sectors.
Routes to Sustainable Transport
43
Transport remains a major source of PM10 and PM2.5 emissions. The method of calculation for transportwas changed, as a result of which these figures can differ strongly from figures reported earlier. Afteragriculture, transport (25 %) and industry (20 %) the most important emission sources of PM10. ForPM2.5, transport, with a share of 31 % is the most important emission source. Industry comes second (26%). The introduction of Euro 4 engines in 2005 caused a stronger decrease in the emissions of fineparticles (PM2.5) in both passenger and freight transport.
Routes to Sustainable Transport
44
Technologies Beyond 2020BiofuelsEstimated demand (by 2020) for biodiesel in BelgiumScenario 1: 800 ktoe/yrScenario 2: 708 ktoe/yrEstimated demand (by 2020) for bio-ethanol in BelgiumScenario 1: 90 ktoe/yrScenario 2: 107 ktoe/yrR&D of a diversity of energy sources—both different generations of biofuels and alternatives forbiofuels—should be supported. Where the step is made from experiment to societal introduction, theprecautionary principle should be appliedFlemish authorities should stimulate research with respect to a diversity of energy sources and thesustainability impacts of various circumstances of mobilisation, production and use of various generationsof biofuels and of alternatives to biofuels.
HydrogenFlemish authorities shoulddevelop a clearlong term visionon energy policy and strategy, constituted by avariety of energyresources and technologiesand prioritising renewable energy resourcessupportR&Dto keep pace with international developments w.r.t.hydrogen and fuel cell technologyattune regional and federal initiatives w.r.t.(safety) regulations, permits, trainingin order to simplifyintroductions of new technologies or infrastructure
Electric vehicle (EV)Volvo: EV-production ( planned 2012/13, market development plan: leasing companies, localauthorities, ..)Unicore: metal production for LI – batteriesVito: energy management
Routes to Sustainable Transport
45
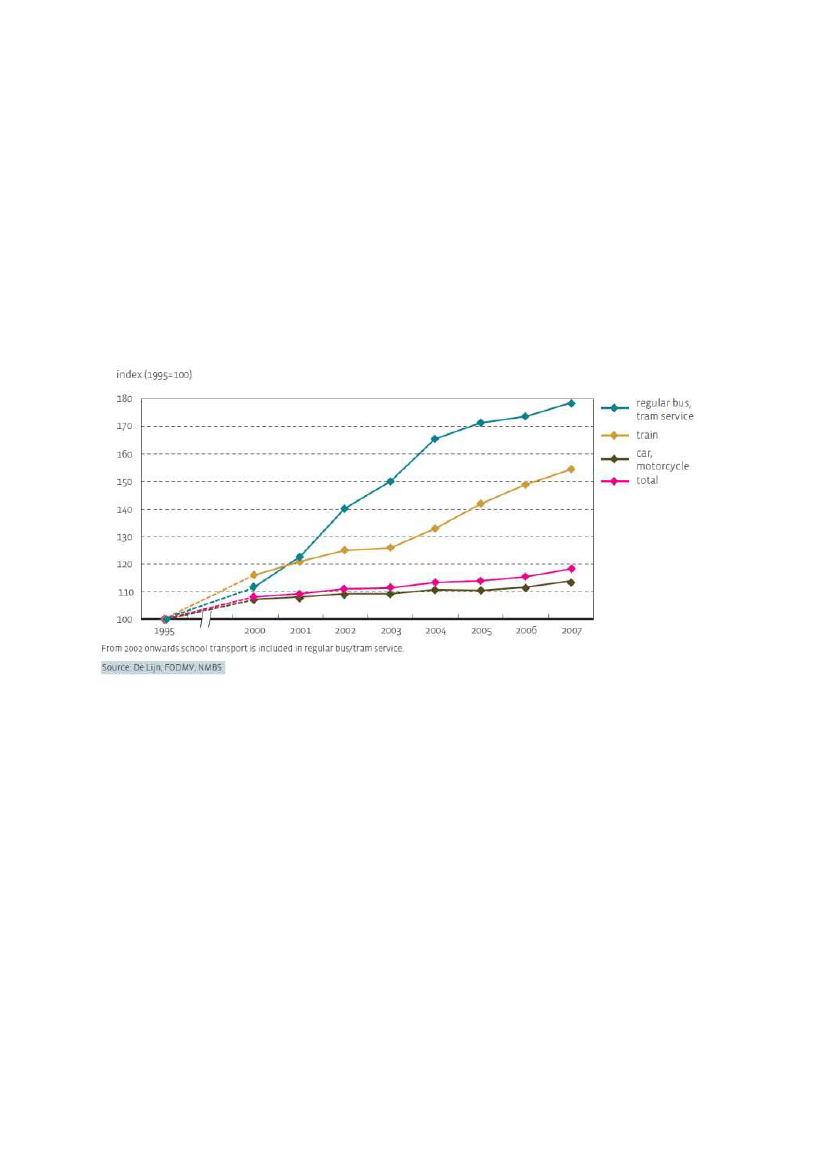
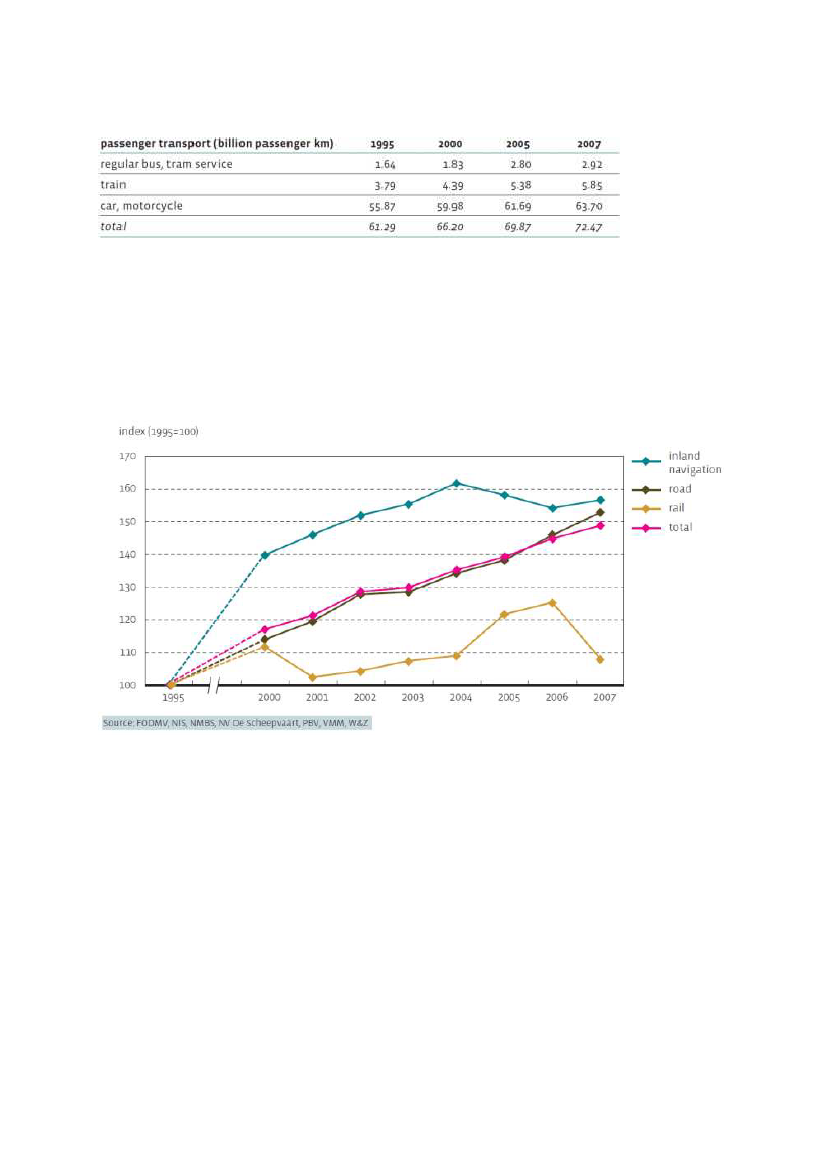
Strategies for Sustainable Urban Mobility and the Shift from Private to PublicTransport or Cycling/Walking and Regulative Measures like Road PricingPassenger Transport : Limited Modal Shift in Passenger TransportIn 2007 the total number of passenger kilometres amounted to 72.47 billion, 2.4 % higher than in 2006and 18.2 % higher than in 1995. In 2007 private motorised transport still accounted for 88 % of transportflows, regular bus/tram services represented 4 % and rail transport 8 %. In 1995 the shares were 91 %(car, motorcycle), 3 % (regular service bus/tram) and 6 % (rail). Despite the significant growth in publictransport, only a limited modal shift has been observed.
The number of passenger kilometres travelled with public transport has increased strongly since 1995.Between 1995 and 2000 there was a larger growth for train transport than for the regular bus/tramservices. In the period 2000-2004 mainly passenger transport with bus/tram services grew explosively(+48%). Passenger transport by train has experienced again a larger growth in the last four years (+23 %). Afocused pricing strategy and an expanded service stimulated the use of bus/tram services. For rail travelthere are also reduced prices for certain groups. The capacity was also increased further by a 5 % increasein the number of train kilometres and the introduction of more double deck carriages. Last year the traincontinued its growth by 3.8 %, regular bus/tram services reinforced their growth in return and increasedby 2.9 %.Passenger transport by car and motorcycle continued to increase. In 2007 the increase was 2.3 %, thelargest growth since 1999.
Routes to Sustainable Transport
46
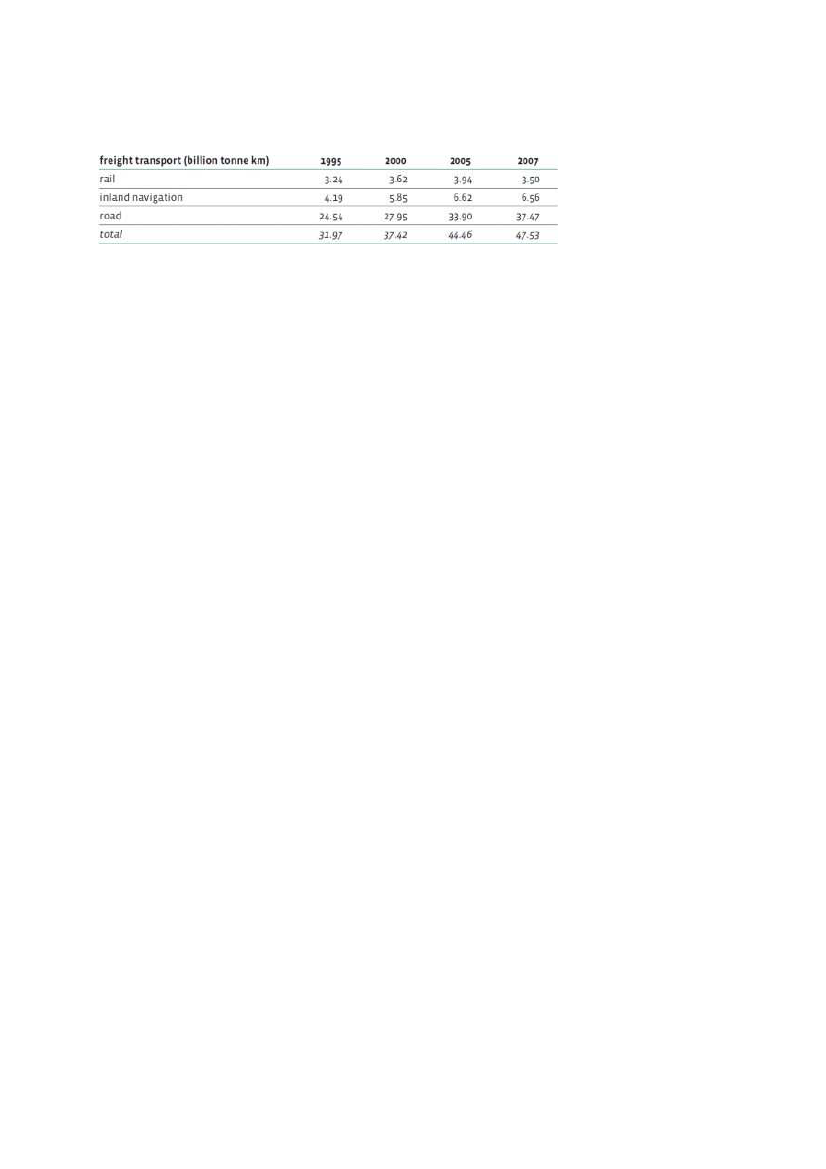
Freight Transport FlowsThe transport flows are a measure of the activity of the transport sector. The freight transport flows areevaluated on the basis of the tonne-kilometres covered by truck, train and inland shipping. The tonne-kilometres show the number of kilometres covered per tonne transported by a specific category of modesof transport, multiplied by the number of tonnes of freight transported.
Since 1995, the transport of freight by road has continued to grow. In 2007 it amounted to 37.47 billiontonne kilometres, a growth of 53 % compared to 1995. Freight transport by rail decreased in 2007 to 3.50billion tonne kilometres, a decrease of 14 % compared to 2006. This can be partially attributed to adecrease in the transportation of iron ore, coke and coal. In 2007, the number of tonne kilometres byinland navigation amounted to 6.56 billion. Compared to 1995, freight transport by water increased by 57%. Since 1998, inland navigation has been stimulated by the Flemish government’s embankmentprogramme, a financial incentive for the construction of loading and unloading facilities. That has resultedin a continuous increase in activity. In the last three years there has however been a stabilization.No modal shift in freight transport. In 2007 the total number of tonne kilometres was 47.53 billion, whichmeans a 49 % increase compared to 1995. Road transport made up 79 % of the total, railway transport 7% and inland navigation 14 %. In 1995, this was 77 %, 10 % and 13 %. The target values for 2010 (FlandersMobility Plan Policy Resolutions, sustainable scenario) are 69 %, 14 % and 17 % respectively. To reachthose objectives and to realise a modal shift must be stimulated further.
Routes to Sustainable Transport
47
Routes to Sustainable Transport
48
GermanyTAB – Office of Technology Assessment at the German BundestagAuthors: Reinhard Grünwald, Juliane Jörissen, Maike Puhe and Jens Schippl
State of PolicyGermany is a rather densely populated country and is located at the heart of the European Union. As formany other EU countries, the transport infrastructure is a basic pillar for economic growth and a highquality of life. On the other hand, induced by heavy growth rates in particular in road transport, Germanysuffers from congestions and bottlenecks which restrict the free flow of goods and people especially inthe densely populated regions. European enlargement and the heavy increase in east-west freightvolumes strongly contributed to this development.At the same time, the increased traffic volume has led to serious environmental consequences includingemissions of greenhouse gases, air pollutants and noise as well as reduced spaces for living and thesegregation effects caused by the expanding transport infrastructure. So, paradoxically one of the basicpillars of today’s quality of life at the same time threatens and reduces that quality.This introductory statement is underpinned by the following figures, which illustrate that especially in thefreight sector strong growth rates are expected for the next decades. Currently the German transportperformance totals 1.100 Mrd passenger-kilometers. Individual motor car traffic accounts for 80 % of thisnumber. In the area of freight traffic the gross number is ca. 650 Mrd tonne-kilometers of which roadtransport has a share of ca. 70 %, rail transport about 18 % and inland waterway transportation ca. 10 %.In a scenario11with ambitious CO2-reduction goals (1990-levels minus 40 % until 2020, minus 85 % in2050) this transport performance is projected to decrease only modestly (by less than 10 %) in thepassenger domain but to rise by more than 60 % in the freight sector till 2050. The modal split will changeonly slightly except a moderate increase of the share of freight transport by rail (from 18 % to 27 %)(Prognos, EWI, GWS (2010)).This means that the assumed greenhouse gas reduction in the transport sector derives mainly from anincreased efficiency of propulsion systems and transport carriers and from a switch to biofuels. Theirshare is expected to rise from 6 % today (2008) to 33 % in 2030 and 85 % in 2050.Against this background, it is of utmost importance to find ways for tackling the expected growth in thefreight sector. An important document is the so-called “Masterplan on Freight Transport and Logistics”(Masterplan Güterverlehr und Logisitk), that was published by the Federal Ministry of Transport in theyear 2008. The plan encompasses the following aims:Improving efficiency of the system and optimizing the capacity utilization of existing infrastructureThe quoted scenario exercise was commissioned by the German government and forms the analytical basisfor the recently adopted “energy strategy“ (Bundesregierung (2010)).11
Routes to Sustainable Transport
49
Improved usage of Intelligent Transport Systems (telematics) for the management and betterintegration of all modes of transportAvoiding the transport of goods wherever this is feasibleModal Shift to rail and waterA sustainable, socially acceptable and environmental friendly extension of transport infrastructuresAlso in 2008, the federal government adopted the so-called “Integrated Energy and Climate Program”(Integriertes Energie- und Klimaprogramm, IEKP), that lists measure to be implemented for thedevelopment of a climate friendly energy and transport system. Key elements of the program are:CO2limits for carsTaxation of motor vehicles based on the CO2emissions of the vehicleTransparent labeling of energy consumption and CO2emissions of vehiclesA toll system for lorries that is strongly based on emission of the vehiclesIncreasing the shares of biofuels and, at the same time, introducing regulation that should ensure asustainable production of the biomassIn Germany the responsibilities for the transport system are dispersed to different institutions, on federallevel, the level of the 16 states (“Länder”) and the local level. It surely can be stated that the principle ofsustainability is an immanent part of transport policy making on all levels, but it is conceptualised invarying ways. The most important actor on the federal level, the Ministry for Transport, highlights theneed for a transport system that is both efficient and environmentally friendly. The economic relevance oftransport and its infrastructure is emphasised. Intelligent transport systems or Telematics are seen as akey technologies to make a more efficient usage of the infrastructure, to enable optimised logistics andthus, to strengthen the economic competitiveness of the German industry. Currently, a main focus ofGerman transport policy is on the promotion of electric vehicles. The Federal Government, together withindustry, jointly created the „National Platform for Electric Mobility, NPE“ with the aim to turn Germanyinto a leading market for electric vehicles. To this end, the Federal Ministry of Transport has launchedpilot projects in eight cities and regions. In context of electric mobility, in the meantime many actorsconsider not only technologies but also business models (such as car-sharing) as being crucial forsustainable mobility mainly in urban areas.On local level, many urban authorities are promoting sustainable urban transport in their transportdevelopment plans or city development plans. In particular, a variety of successful approaches to makepublic transport, walking and cycling more attractive can be observed. However, many experts argue thatthe potentials for modal shift are not fully tapped yet and further initiatives are needed.
Energy Use for TransportCurrently the transport sector is responsible for 28 % of final energy consumption in Germany in absoluteterms 2575 PJ (year 2008) (Tab. 1). In a long term perspective the aim is to reduce this consumption to ca.
Routes to Sustainable Transport
50
1500 PJ in 2050. At the same time the share of renewable energies is expected to rise from presently5,5 % to 64 % in 2050. Another marked trend is the large scale introduction of electricity as an energysource for transport from just over 2 % today to more than 15 % in 2050 (Tab. 2).The associated greenhouse gas emissions amount to 153 Mio t/a (2008) which is 20 % of the totalemissions (Tab. 3). In terms of the contribution to CO2reduction goals compared to 1990 levels, thetransport sector emissions today have already decreased only by ca. 7 %, which is significantly less thanthe other sectors. In the longer term it is expected that the transport sector will catch up and deliver -20 % in 2020, -45 % in 2030 and -90 % in 2050 (Tab. 4).Tab. 1: Final Energy Consumption in Germany (2008)SectorPrivate HouseholdsTrade, Commerce, ServicesIndustryTransportTOTALSource: Prognos, ewi, gws (2010)Final EnergyConsumption (PJ)25021404264525759126Share(%)27,415,429,028,2100
Tab. 2: Final energy use in the transport sector (Szen. IA)2008854,81139,2378,321,259,60132,12575,22020466,81154,3381,695,879,00232,52410,12030269,3747,8361,4154,6115,70,1499,82148,6205034,5102,2313,241,6233,514,8772,01511,7
Gasoline (fossil)Diesel (fossil)Aviation fuel (fossil)Natural Gas (fossil)ElectricityHydrogenBiofuelsTOTALBio-sharegasoline/diesel(%)6,1RES incl.Electricity (%)5,5Source: Prognos, ewi, gws (2010)
12,810,9
33,626,2
87,963,6
Routes to Sustainable Transport
51
Tab. 3: Greenhouse Gas Emissions in GermanySectorShare (%)(2008)13,96,3Mio t (2008)Mio t (2020)793171132259581Mio t(2030)51186191175403Mio t(2050)188481849145
Private Households105Trade, Commerce,48ServicesIndustry12,696Transport20,2153Energy Industry47,0357TOTAL100773Source: Prognos, ewi, gws (2010)Tab. 4: Change (%) relative to 1990-levelsSector2008Private Households-19,8Trade, Commerce,Services-46,1Industry-38,5Transport-7,3Energy Industry-15,0TOTAL-19,6Source: Prognos, ewi, gws (2010)2020-39,7-65,2-54,5-20,0-38,3-39,5
2030-61,1-79,8-60,9-44,8-58,3-58,1
2050-86,3-91,0-69,2-89,1-88,3-84,9
Regulation and Technology Options for Sustainable TransportThere is a wide range of instruments and technical approaches to support the development of a moresustainable transport system in Germany. In the following, some of the most important regulations andtechnology options for sustainable transport in Germany are described:
Promoting the Usage Alternative Fuels and Propulsion TechnologiesIn the past, the German automotive industry was primarily focussed on the development of hydrogen (ormethanol) powered fuel cell technology. In the mid-1990s a big company (Daimler Benz) communicatedthe goal to achieve full commercialisation of fuel cell vehicles before 2005. The worldwide trend towardshybrid and full-electric propulsion was taken up in Germany just recently. In order to (re-)establish aleading role in technology development for alternative propulsion technologies, German government hasannounced the goal to have one million BEVs (battery electric vehicles) on the road by 2020 and sixmillion by 2030. This would translate to a share of about 10 % relating to the total fleet. In addition ca.
Routes to Sustainable Transport
52
20 % of the fleet would be hybrid electric vehicles. There exists a general awareness that these goals willnot be achieved without political support. However, concrete policies and measures to this avail still awaitrealisation. Apart from financial support schemes (e.g. tax rebates, “cash for clunkers”) also othermeasures e.g. privileged parking exempt from charges are being discussed.
Intelligent Transport Systems (ITS) / TelematicsIn order to optimise the usage of the capacities of the transport system, the development andimplementation of applications based on information and communications technologies (ICT) areconsidered as being crucial. The relevant ICT applications are usually subsumed under the terms“Telematics” or “Intelligent Transport Systems” (ITS). ITS can contribute to a better organisation andmanagement of the transport system and lead to improved traffic flows, less congestion, more efficiencythrough better load factors and the use of less energy consuming modes of transport. These concepts arerelated to control and guidance, road pricing, parking, assistance, freight and fleet control andmanagement.ICT applications collect, create and supply real time data to the users, individual travellers as well asfreight distributors. Due to user friendly interfaces, better information on travel options, possible delaysor congested networks help to better plan and execute a trip in an effective and comfortable way. In thecar sector, the idea is that the cars start communicating between each other, exchanging information oncongestions or accidents, and, thus improving travel flows. Also for public transport (road and rail) and forfreight logistics the technology offer huge potentials. Furthermore, it can be considered as an enablingtechnology for innovative concepts such a car sharing or bike sharing.There are many promoters in Germany, in particular in the Ministry for Transport, in the Ministry ofEconomics and Technology as well as in the car industry ITS are high on the agenda. However someexperts and environmental associations do question the sustainability effects of ITS in the road sector.The argument is, that the technology might well help to make improved use of existing capacities, but thiscould make road transport more attractive and, thus, attract additional transport and hamper a modalshift to “cleaner” modes of transport.
Road PricingIn 2005 Germany introduced a distance-based toll for heavy trucks (12 t gross vehicle weight and above).A service provider (Toll Collect), acting on behalf of the state, has set up an automatic toll system tocalculate and collect road use charges. The price level of the toll is based on the emissions class andnumber of axles on the truck and on the distance travelled. The system is based on a combination ofmobile telecommunications technology (GSM) and GPS. Main element of the system is an on-board Unit(OBU) that stores all relevant information to automatically determine how many kilometres have beendriven and transmits the information to the Toll Collect computer centre for further processing. OBUs willbe installed, initialized and personalized in all registered trucks. For truck drivers and transport companiesusing only infrequently German motorways, a manual log-on to the system is provided.
Routes to Sustainable Transport
53
Environmental ZonesTo ensure that the limits currently specified for fine particulate matter are complied with, Germanyintroduced so called “environmental green zones” (Umweltzonen) in areas especially burdened byparticulates, eg. city centres. All vehicles have to be labelled with an environmental badge based on theiremission levels. Only appropriately labelled cars are allowed to enter environmental zones.
Methods for Monitoring Environmental Impact from the Transport SectorThe Federal Environmental Agency (UBA) publishes periodically a handbook of Emission Factors for RoadTransport (HBEFA) in cooperation with agencies in Switzerland, Austria, Sweden, Norway and France aswell as the JRC (Joint Research Centre of the European Commission). HBEFA provides emission factors, i.e.the specific emission in g/km for all current vehicle categories (PC, LDV, HDV, buses and motor cycles),each divided into different categories, for a wide variety of traffic situations. The newest version datesfrom January 2010. Additionally the monitoring tool TREMOD (Transport Emission Estimation Model) isused to identify air pollutant emissions of motorized transport. These serve as a basis for environmentalimpact assessment and the development of emission standards.
Available and/ or Necessary Technologies Beyond 2020What is particularly missing in technology development today are methods and options to interlinkdifferent modes of transport in order to encourage intermodal transportation. Effort needs to be put intothe integration of different infrastructures and technologies. Innovative and service oriented concepts forexisting and upcoming technologies, which meet users’ preferences, are needed.
Germany’s R&D PlanTo relief the tension between traffic growth and environmental compatibility, the Federal Governmentpresented the "Federal Government Fuel Strategy" for the time horizon to 2020 to support the launch ofalternative fuels and innovative propulsion technologies. A declared goal is it to have one million electricvehicles and a further 500,000 fuel cell powered vehicles operating on Germany's roads by 2020. Between2009 and 2011, the Federal Government is providing a total of 500 million Euros to fund the developmentand commercialization of electric mobility.
Land Use and Physical PlanningSettlement dispersion is linked with a higher specific land use rate per capita and a drop in populationdensity. The consequences are an increase of traffic flows, a loss of fertile arable land and a dividing up ofpreviously connected open areas. That’s why the fight against land consumption and urban sprawl is animportant topic in spatial planning for several decades and is considered to be a key factor for sustainabledevelopment. The German National Sustainability Strategy of 2002 postulates a limit for the additionalland use rate of 30 ha/day by 2020. The strategy to reach this ambitious target will be primarily a
Routes to Sustainable Transport
54
promotion of inner urban development by mobilisation of land reserves, reutilisation of brownfields,filling of vacant lots and improving inner-city living conditions by upgrading existing structures. In growthregions, where expansion of settlement might be inevitable, this should be realized in line with theguiding principles of spatial planning like “decentralized concentration”, well adapted to the publictransport network and giving preference to land-saving constructions (e.g. multi-storey commercialbuildings). In recent years there have been considerable efforts on federal, regional and local level todevelop and improve innovative concepts for sustainable land use management. The German planninglaw offers a wide range of instruments for the control of land use, which has been considerably extendedand improved through fundamental amendments to the German regional planning act (ROG) and theGerman federal building code (BauGB). Although the current rate of land consumption indicates adownward trend in recent years, it is with approximately 100 ha/day far away to meet the 30- ha/day-goal. This unsatisfactory implementation of the reduction target is not due to a lack of efficient planninginstruments but due to a lack of enforcement. Therefore a support of planning law by economicincentives is considered to be necessary, which should make land consumption more expansive andthereby economically less attractive. Several proposals are under discussion, including the introduction of“tradable land use certificates”, which have been already tested in different simulation games, theintroduction of a “new site development charge”, to be paid by property developers and investors and aradical reform of the land tax system. Various parties call furthermore for the complete abolishment ofsubsidies promoting urban sprawl like the commuter’s tax allowance (Entfernungspauschale).
Border-crossing Transport in EuropeBorder crossing transport is a crucial issue for Germany, which is situated in the centre of the EuropeanUnion. Many rather general statements can be found in official documents, supporting the need for anefficient and environmental friendly long distance transport in Europe. However, several specificinstruments and measures can be identified as well:Regulation/policies of transit traffic: In contrast to many other countries Germany has no road chargefor cars. But cross border freight traffic (on trucks over 12 t) passing though Germany is charged a toll.Harmonisation of the technical standards and regulations are a major issue. This holds trueparticularly in the rail sector. The different systems in different countries impede the flexibility incross-border rail transport. One illustrative example: recently German Railways introduced a newhigh-speed train called the Velaro D, to be launched at the end of 2011. The train will be used inGermany but also is designed for cross-border traffic to France and Belgium. A rather sophisticatedtechnology is needed to cope with the requirements of the systems in the different countries. Thetrain is able to run on four different electricity systems (direct and alternate current). Connections tothe UK and the Netherlands would necessitate still further retrofitting. In terms of harmonisedregulation, the German government wants to accelerate the introduction of the European TrainControl System (ETCS) which is a signalling, controlling and train protection system designed toreplace the many incompatible safety systems currently used in different European countries,especially on high-speed lines. The aim is to make cross-border train traffic more efficient and to
Routes to Sustainable Transport
55
avoid an exchange of the locomotive at the border. Transit traffic (on roads and rails) is expected toincrease by a factor of 2.5 until 2025, this means that transit traffic grows more than twice as much asfreight transport in Germany. Germany wants to optimize this traffic by a reduction of the transit tripsand by shorter and more energy efficient routes (rail, short-sea-shipping or inland watertransportation).
SourcesBMVBS (Bundesministerium für Verkehr, Bau und Stadtentwicklung) (2008):Masterplan Güterverkehrund Logistik http://www.bmvbs.de/cae/servlet/contentblob/31218/publicationFile/10731/masterplan-gueterverkehr-und-logistik.pdfBundesregierung (2010):Energiekonzept für eine umweltschonende, zuverlässige und bezahlbareEnergieversorgung.http://www.bmwi.de/BMWi/Redaktion/PDF/Publikationen/energiekonzept-2010,property=pdf,bereich=bmwi,sprache=de,rwb=true.pdfPrognos, EWI, GWS (2010):Energieszenarien für ein Energiekonzept der Bundesregierunghttp://www.bmwi.de/BMWi/Redaktion/PDF/Publikationen/Studien/studie-energieszenarien-fuer-ein-energiekonzept,property=pdf,bereich=bmwi,sprache=de,rwb=true.pdf
Routes to Sustainable Transport
56
GreeceGPTCA – Greek Permanent Committee of Technology Assessment
State of PolicyThe use of environmentally friendly and energy efficient vehicles and other transportation means isstrongly promoted by the EU for the growth and development of sustainable transport. To this end,Greece promotes and implements several instruments, policies and programs, such as:The design and construction of environmentally friendly and energy efficient transport infrastructure,which include:The extension of subway lines.The construction of new metro lines in Piraeus (country’s biggest port) and Thessaloniki.The expansion of the suburban railway.The Modernization of specific parts of the national railway infrastructure.The electrification of the national railway network between Athens and Thessaloniki.The adoption of regulatory and administrative programs and actions, such as:Promoting public transport.Training transport personnel.Informing and training passengers.Implementing new traffic management measures for the decongestion of the city center.Replacing fleet with new cleaner* and energy efficient vehicles (cars clean technology, CNG, hybrid,electric, etc.).Linking vehicle taxation to CO2 emissions.Inspecting vehicles (including emissions control and the obligatory issue of Exhaust Control Card).Promoting incentives for the replacement of old vehicles not using environmental friendlytechnologies.
Energy Use for TransportIn Greece, on the basis of the 2005 energy consumption energy balance, the transport sector representsalmost 39% (8,07 Mtoe) of the total final energy consumption in the country.With respect to greenhouse gas emissions, the transport sector emits 23% (Odyssee 2004) of the totalCO2 in Greece.Under Law 3851/2010 the national target for participation of RES in final energy consumption in transporthas been increased to 10%. To meet this target, we will have to implement all institutional changes that
Routes to Sustainable Transport
57
have been initiated in order to achieve less energy consumption through the use of more efficientsystems and adoption of policies for the rational use of energy in all sectors. Regarding biofuels, the effortlies in the use of domestic resources to produce bio-diesel from crops and to develop and manage anetwork of biomass for energy use.
Regulation and Technology Options for Sustainable TransportThe regulation and the technological options for sustainable transport are not solely a responsibility ofthe Ministry of Transport, but a responsibility of the Ministry of the Environment and Energy, of theMinistry of Finance and of the General Secretariat of Public Works.In collaboration with the Ministry of Finance, measures taken for the promotion of the use of cleanerengines are:The prohibition of the import of used cars from other EU countries if their emissions do not meet therequirements of the EU Exhaust Gas Directive in force (exceptions apply to special groups).The progressive taxation of imports for private passenger vehicles from the EU, depending on enginecapacity and levels of emissions (according to vehicle’s age and gas emissions), with discounts orreductions for cleaner technologies (e.g. hybrid vehicles).Also, the Ministry of Transport, the Ministry of the Environment and Energy and the Ministry of Financehave prepared a proposal regarding the levy of a tax on vehicles bought after January 1st 2011, calculatedeither on the engine capacity or CO2 emissions.Cleaner and more energy efficient vehicles that promote sustainable transport is the goal of both the EUlaw (which is incorporated into national law through the relevant instruments) and national provisions.This category includes transactions and activities relating to:The regulatory framework for the approval of vehicles that meet the new demands.EU Guidelines associated with the emission limits of gaseous pollutants from internal combustionengines in vehicles.Relevant technical regulations which have been accepted by our country both from the UN and theEuropean Parliament and Council concerning all vehicles with internal combustion engines, hybridvehicles, electric, hydrogen, etc.It is pointed out that the perspective of widespread use of cleaner and more energy efficient vehiclesusing hybrid technology, natural gas, hydrogen and electric vehicles, is a key priority for the Ministry ofTransport.
Routes to Sustainable Transport
58
Land Use and Physical PlanningLand use and planning is basically a responsibility of the Ministry of the Environment and Energy and theMinistry of Rural Development and Food.Efforts are made to persuade the public to use public transportation rather than private vehicles. Theseefforts - initiatives focus on:Supporting - expanding of the bus lane network.Redesigning the transport network in order to promote the use of combined transport, that is to saythe use of multiple transport means (bus, metro, suburban railway) with particular emphasis given onmeans of stable orbit (as a cleaner and more energy efficient means of travel).As part of the promotion of combined transport, the use of the same ticket for one and a half hourhas been applied. Also, the pricing policy (low ticket costs) aims to increase the use of publictransport.In an effort to integrate cycling on the roads of the country and highlight its use as an alternative mode oftravel, it was decided in the summer of 2008 to provide funds of fifteen million Euros for the"Construction of bicycle related infrastructure”. Today, the program includes several projects that operatein seventeen municipalities of the country.At the same time, the following research programs have been completed (under the supervision of theMinistry of Transport):“Research methods of implementation to promote conditions for sustainable mobility in Greece”.This project includes the integration of cycling in the municipality of Halandri (nearby Athens) and inthe Strategic Plan for the Sustainable Development of Transport in Rethymno (Crete).“Planning cycling infrastructure in the Constabulary Park (Metro Station Katehaki-Athens) and theconnection between them through the Goudi Metropolitan Park, National Technical UniversityCampus and National Capodistrian University Campus”.
Border-crossing Transport in EuropeA long-term program providing as a key policy both the upgrading and expansion of existing infrastructureand the promotion of intermodal freight transport, with emphasis on optimal use of road, rail, port andairport infrastructure, is applied. It is estimated that the successful implementation of this program willhelp in upgrading the Greek role in European transport, providing a significant boost to freight services,but also giving impetus to environmental friendly means of transport. In particular, the Ministry ofTransport has already promoted legislative or other means with significant national and internationalimportance, such as:The Pan-European Way.The Adriatic Intermodal Way.
Routes to Sustainable Transport
59
The Maritime Way of South - East EuropeThe rail network, which will connect Greece with South - East Europe.The proposal of the European Parliament and Council for the European Rail Network for competitivefreight.The Law 3333/05 (A 91/12-4-05): “Establishment and Operation of Freight Centers and otherprovisions”.Significant investment in rail infrastructure.Integration of rail EU law into national law.In order to achieve the promotion of intermodal transport, major projects to upgrade networks areadopted. However, the creation of Logistics Centers constitutes a key infrastructure and an importantprecondition for the rationalization and consolidation of functions in the transport chain and for thepromotion of sustainable and energy-efficient transport.In addition to the above, regarding road freight, incentives are granted for the replacement of the fleet ofold truck carriers, with new ones of clean vehicle technology.Finally, regarding emission standards and speed limits for road freight, the following measures are in use:In line with EU legislation, our country uses the emission standards set out in EU legislation andreviews them from time to time.Regarding the speed limits for trucks, our country has adopted, in line with EU legislation, a speedlimit of 90 km / h for common vehicles, and of 80 km / h. for vehicles transporting dangerous loads.
Routes to Sustainable Transport
60
ItalyVAST – Comitato per la Valutazione delle Scelte Scientifiche e Tecnologiche
State of PolicyAccording to the 3rd Euromobility Report12, in Italy, the number of motor vehicles per number ofinhabitants is the highest in Europe (about 61 motor vehicles per 100 inhabitants compared with aEuropean average of 46). Furthermore the use of low impact fuels is not very widespread, with vehiclesrunning on GPL and methane accounting for less than 4% of total vehicles.Thedifficult traffic conditionsprevailing in Italian cities are also described in the Legambiente report“Ecosistema urbano”13, which reports that about one third of CO2emissions are produced by thetransport system (of which 80% accounted for by road transport).The latest National Plan allocating CO2shares for 2008-2012 specifies the followingCO2reductionmeasuresto be applied over this period in the sectors not included in the Directive 2003/87/EC (emissiontrading).The measures applyingto the transport sectorare as follows:MeasuresOver the period 2007-2011 the scrapping ofcirculating vehicles registered prior to 1996 andproducing emissions exceeding 145 gCO2/km andtheir replacement with vehicles having emissions ofless than 145 gCO2/kmInfrastructural measures in the transport sectorUse of biofuelsReductions over the period 2008-2012 [MtCO2eq/year]9.0
4.56.0
As far asinfrastructural measuresare concerned theStrategic infrastructure programme(PIS)providedfor inlaw no. 443/2001 (socalled‘target’ law)involving the implementation of 348 projects (mainlyrailway and road works) for an estimated total value of 358 billion euro. Against the total works includedin the PIS as at the end of April 2010, the value of the works or parts thereof approved by the CIPE, that isafter the preliminary design or detailed plan and the financial framework have been decided, amount to131 billion, or 37% of the cost of the entire programme14.In the case ofbiofuels,the 2007 budget law states that by 31 December 2010 the percentage of biofuelsand other renewable fuels versus the total diesel and petrol fuelsoffered on the consumer marketmustbe at least 5.75%.
1213
www.euromobility.org/documenti/atti_di_convegni/2009_50_citt%C3%A0/index.html.www.legambiente.eu/documenti/2009/ecosistemaUrbano/EcosistemaUrbanoXVIedizione-1.pdf.14For a summary see www.camera.it/465?area=23&tema=71&Le+infrastrutture+strategiche.
Routes to Sustainable Transport
61
Furthermore, subjects placing on the consumer market petrol or diesel fuels for motor transport derivingfrom non renewable primary sources are obliged the following year to make available a minimum quotaof the following biofuels; bioethanol and derivatives, ETBE and biohydrogen, as well as of synthetic fuelsobtained from biomasses. This quota is set at 3.5% for 2010, 4% for 2011 and 4.5% for the year 2012.The development of the biofuel supply chain is to be supported also by means of tax breaks (reductionofexcise duty).Uncertainty over the chances of attaining the targets of greenhouse gas emissions set by the KyotoProtocol necessitated the launching, as approved in CIPE resolution no. 135 of 11 December 2007, of aprocess of revision of the guidelines referring to national policies and measures aimed at reducinggreenhouse gas emissions which culminated in the establishment of aGreenhouse Gas EmissionTechnical Committee (CTE)mandated to adoptnew reduction measures,with priority accorded to thetransport sector (in particular, urban and extraurban mobility management).Several days ago, Parliament began the examination ofa bill(C. 2844) designed torefinance theSustainable Mobility Fundfor which, in the three years 2007-2009, some240 million eurowereearmarked for projects designed to improve air quality in urban areas as well as to boost public transport.Also of significance is the recent establishment of theFund for the promotion and support of local publictransport developmentto the tune of 463 million euro for the period 2008-2011.An active role in the sustainable mobilityinitiativesaimed at sustainable mobility was also played by theMinistry of the Environment,which, over the past decade, has fostered a total of approximately 500interventions to the tune of a total of approximately 500 million euro in favour of local authorities andregions (municipal level car sharing, low environmental impact fuels, methane project initiative, ecologicalSundays, structural interventions to rationalize mobility in an urban environment, etc.)15.Lastly, with the promulgation oflegislative decree no. 155/2010,the Government proceeded beyond thesimple transposition of Directive 2008/50/EC and also provided for the substitution of Directive2004/107/EC, setting up aunified legislative framework covering the evaluation and management ofenvironmental air quality.
Energy Use for TransportThe Energy Quota Currently Utilized in TransportThe share of final energy consumption that may be assigned to the transport sector in 2009 is32.2 percent.It should be noted that the highest share among the final energy user sectors (35.2%) in 2009 wasaccounted for by use in civil sectors (which includes the domestic sector, commerce, services and thepublic administration); this is followed by the transport sector (32.2%) and the industrial sector (22.6%)16.1516
www.minambiente.it/opencms/opencms/home_it/menu.html?mp=/menu/menu_attivita/&m=Mobilita.html.http://www.istat.it/salastampa/comunicati/non_calendario/20100706_00/testointegrale20100706.pdf
Routes to Sustainable Transport
62
The Share of Energy Produced from Renewable SourcesAccording to the national energy budget17, energy from renewable sources utilized in the transport sectorin 2008 amounted to 0.662 million tons of oil equivalent (MTOE), compared with 0.148 MTOE theprevious year.In theNational renewable energy action plan18(June 2010), the renewable energy quota in the transportsector19for 2010 is estimated at 3.5% versus 0.87% in 2005. The same Plan also contains an estimate ofthe renewable energy sources actually used in the transport sector and their forecast development infuture years for the purpose of ensuring the European target of 10% of renewable sources in this sector isachieved.
Plans, policies and discussions referring to the development of renewable energy in thetransport sectorProvision is made in Italian legislation for incentives benefiting renewable sources in the transport sector,most of which based on compulsory quotas and tax breaks. As an incentive to exploit renewable sourcesin the transport sector subjects placing motor vehicle fuels on the market are obliged to offer also a fixedquota of biofuels (biodiesel, bioethanol and derivatives, ETBE and biohydrogen). This compulsory quota,which will be progressively increased, amounts to 3.5% in 2010.In recent years a reversal of tendency has been observed in the end user utilization of biodiesel, whichhad previously been used almost completely for heating purposes, while the current use remainsprevalently for motor vehicles. Growth in this sector has contributed to the increase in the minimumcompulsory quota of biofuels versus total fossil fuels placed on the market and in the excise dutyreduction applied to biodiesel fuels.In future, according to the recent national renewable energy action plan, it is intended to rely principallyon thecompulsory minimum quota approachwhile respecting the conditions of sustainability, as well as
1718
http://dgerm.sviluppoeconomico.gov.it/dgerm/ben/ben_2008.pdfhttp://www.governo.it/GovernoInforma/Dossier/energie_rinnovabili/PAN_Energie_rinnovabili.pdf19Aggregate of national production and imported biofuels.
Routes to Sustainable Transport
63
focusing attention on the development of second and third generation biofuels and on the socialsustainability of biofuels.
Regulation and Technology Options For Sustainable TransportIn the period 2006-2009incentiveswere grantedfor the purchaseof motor vehicles with a lowenvironmental impact, in particular vehicles with exclusive or dual fuel supply based on methane,hydrogen, GPL or equipped with an electric motor. Incentives were made available also for the purchaseofbicycles.Low environmental impact vehicles also benefit fromreduction of or exemption fromthepayment of theannual road tax(the regions are competent in this matter and each region has a differentsystem).In order to encourage the spread ofelectric vehiclesit is proposed to favour the development of agrassroots network ofrecharging and assistance pointsthroughout the national territory, adopting asingle standard for all electric power points.In the case of vehicles withpetrol or dieselengines, over the past few years a number ofincentivestoencourage thesubstitution(scrapping) of vehicles at least 10 years old with brand new vehicles. Similarmeasures have been taken also regarding the replacement ofcommercial vehiclesfor the transport ofcommodities, while the introduction of incentive measures regarding the renewal of motor busescirculating in Italy, the age of which exceeds the European average, is still under discussion.
Tolls, Congestion Tax, Green TaxesIn legislative decree no. 7/2010 Italy transposed the socalled ‘eurovignette’ Directive 2006/38/ECregulating the taxation of heavy vehicles used for freight transport. In an urban environment, mentionmust be made of the system of paid access to the city centre, introduced in Milan (socalled ecopass)following the example of London, which has resulted in a decrease in traffic in the city centre and aconsequent reduction in atmospheric pollution. Under the ecopass system drivers of the more pollutingvehicles have to pay to gain access to uptown Milan. Euro 3, 4 and 5 motor vehicles, motor bikes, mopedsand bicycles are exempt from this payment.
Methods for Monitoring Environmental Impact in the Transport SectorLegislative decree no. 155/2010 established a unitary regulatory framework covering the assessment andmanagement of environmental air quality. It entails in particular the zoning of the entire national territoryby the Regions for the purpose of assessing air quality with respect to each of the pollutants mentioned inthe decree. As far as the activity of assessing air quality performed by the Regions is concerned, detailedregulations govern the way measures are made at fixed sites, the reference measures used, and the
Routes to Sustainable Transport
64
modelling techniques or techniques for ensuring an objective estimation is made in each zone or built-uparea, also by means of reference to the technical annexes accompanying the decree itself. Each Region orAutonomous Province must draw up an assessment programme compliant with the new provisions andpresent to the Ministry of the Environment a project covering the updating of the measuring network.The network stations must be managed or monitored by qualified public entities and must be maintainedand run in conditions such as to ensure that all the requirements of the decree are met.
Regulation of Specific Uses of TechnologyAntiparticle filters:in 2009 some11 million eurowere allocated to equipping public transport vehicleswithantiparticle filters.Intelligent traffic systems:In March 2009, the Transport Committee of the Chamber of Deputiesapproved the final document regarding the Commission communication “Action Plan for the Deploymentof Intelligent Transport Systems in Europe” (COM(2008)886 definitive).
Use of the Territory and Territorial PlanningIn July 2010, the Transport Committee of the Chamber of Deputies approved a document containinggovernment guidelines to theAction plan on urban mobility presented by the European CommissionCOM(2009)490 def.which sets out the principal requirements to be taken into consideration by theGovernment in legislating on the matter.
Mobility of PersonsThe mobility of persons in the larger Italian cities is still largely based on private motor car vehicles.Conversely, the development of public transport, especially railway and tramway transport, is inadequateand has led to traffic congestion and increased journey time. The strategies proposed for the replacementof private vehicles with public transport are proceeding in both these directions.To reduce the use of private vehicles the following measures are envisaged:the expansion of limited traffic areas,with remote monitoring of access thereto;measures in favour of non motor transport,such as bicycle and pedestrian traffic by institutingdedicated and protected itineraries, avoiding mixed usage thanks to a rational functional subdivisionof the road network;the raising of citizens’ awarenessby means of publicity/progress campaigns, focusing in particularon younger people, also at school level.
Routes to Sustainable Transport
65
Bike SharingRecent years have seen a much more widespread use of this means of sustainable transport also in Italy,and by sharing may now be found in almost all the cities.According to the 2009 Euromobility Report, the users of this service have increased by 206.5% comparedwith the previous year. Milan in particular is the city in which bike sharing is most widespread, with12,346 users, followed by Rome with 8,700. The service consists in users sharing bicycles made availableby the Municipality. Subscribers can pick up a bicycle at any one of the parking spots located in their owncity and drop it off again at a different parking area. The aim of the service is to cater for short journeysinside the city.
Transport of GoodsIn Italy, one of the problems most keenly felt in the urban environment consists of goods delivery to shopin the historic centres. This critical aspect of this problem is that the vehicles transporting the goods travelhalf empty, are often obsolete (and so are more polluting) and the deliveries take place during the shops’opening hours and therefore at times in which there is more traffic, thus contributing to increasecongestion. To overcome this problem, outside many cities trucking terminals have been constructed, orit is planned to do so, where the goods are unloaded and subsequently delivered to the shops usingsmaller vehicles with a lower environmental impact.
Border-crossing Transport in EuropeItaly is a participant in numerous trans-European transport projects within the framework of the TEN-TNetworks. One of the more significant and complex of these is the projected new high-speed Turin-Lyonline which will link this coutnry to the great Lisbon-Kiev railway axis(Corridor 5).The sustainability targets of long-distance transport, with special reference to freight transport, has nowbeen at the focus of transport policies in this country for a number of years. The principal approachidentified for the purpose of achieving these targets is the development of intermodal transport, whichwill allow an increasing share of traffic to be transferred from road transport to rail and sea transport. TheMotorways of the Seaproject have been included by the European Commission in the list of the thirtytop priority projects. In this country several different steps have been taken to implement the Motorwaysof the Sea project. These include in particular funds earmarked for the rehabilitation and modernizationof sea port infrastructures provided for in laws nos. 413/1998 and 166/2002, incentives granted to themotor transport sector to enable the transfer of all-road traffic to combined road-sea traffic by means ofthe introduction of the socalled “ecobonus” and the boosting of the sea port installations and logisticplatforms provided for in the ‘target law’. Regarding this issue, mention must also be made of theagreement signed on 10 September 2009 by the Italian and Spanish Ministers for Transport aimed at thepromotion and development of one or more motorways of the sea between the two countries.The growth in terms of quality and efficiency of the rail links between Italy and the other Europeancountries stands out as an essential prerequisite for the reduction of road congestion. The estimates
Routes to Sustainable Transport
66
regarding traffic across the Alpine passes, which represent a compulsory access path for incoming andoutgoing freight, reveal that the number of heavy lorries using these passes will increase by about 30%by 2020; it is expected that by 2030 the road capacity of the entire Alps area will be saturated. One of theprojects under way to solve this emergency is thenew San Gotthard tunnelwhich should come intoservice by 2017. This will be the world’s longest tunnel and will not only reduce journey time betweenSwitzerland and Italy but above all considerably increase rail freight volume.
Routes to Sustainable Transport
67
Routes to Sustainable Transport
68
The NetherlandsRathenau InstituutAuthor: Monique Riphagen
State of PolicyThe Dutch sustainable transport policy is formulated in the policy document “Nota Mobiliteit”(Memorandum Mobility) from September 2004. This document describes the general transport and trafficpolicy until 2020 and includes a chapter about sustainable transport. The aim of this chapter is to limit thenegative effects of traffic while giving space to transport and traffic in a growing economy.The short term policy is to meet the international agreements about the environment. In order to preventclimate change, air pollution and noise pollution, the international rules for technical demands to vehiclesand fuels for vessels and vehicles have to be sharpened according to the Dutch government. The longterm policy aims at a transition to sustainable transport and a complete new concept for transportation.In the climate program “Schoon en Zuinig, nieuwe energie voor het klimaat” (Clean and Economical, NewEnergy for the Climate) from September 2007, CO2- reduction targets are sharpened. According to Cleanand Economical, The Netherlands wants to profile itself as one of the most innovative countries in trafficand transport and wishes to have one of the most efficient transport systems in Europe with a large rolefor climate neutral, sustainable fuels. New forms of cooperation between government, business andsocial partners are necessary according to the climate program.In order to achieve this, the government pushes for a preferably European emission policy. Second, thegovernment wishes to stimulate the demand for clean and economical cars by putting environmentalcosts in the price of mobility and informing citizens and business in their choice for more sustainabletransport.Policy has to be developed to reduce emissions from the international air traffic and maritime shipping.The amount of hybrid, plug-in hybrid, electrical, flexifuel and natural gas/biogas vehicles will have toincrease.Because of a growing traffic jam problem and a greater use of the public transport system than expectedin the Memorandum Mobility, in October 2008 policy as formulated in this memorandum is sharpened inthe MobilityProcedure (MobiliteitsAanpak).The question is whether these ambitious policy goals work out as planned with an ever growing transportsystem and a growing need for mobility. Although vehicles with renewable energy sources are stimulated,their share in the total amount of vehicles and transport movements is still very small. Since thegovernment keeps on stimulating mobility and limitations are no option, the question is whether cleanerand more efficient engines and renewable fuels make up for a total increase in transport movements.The policy as mentioned above was formulated by former governments. The Netherlands is forming anew government at the moment with less environmental ambitions. It is not sure how this will work out
Routes to Sustainable Transport
69
for the formulated plans and for the successions of these policy plans. The speed limitation will be raisedfrom 120 to 130 km/hr, where this is possible without a conflict with air quality and noise regulation. Theambitions for climate policy will be downscaled to European ambitions. It seems that the Netherlandsdoesn’t want to be a European leader concerning environmental and climate policy.However, there will be a kind of feed-in regulation for renewable electricity.
Transport Policy AimsImprove air quality and more efficient use of energy.Building projects have to meet the European norms for air quality. In the National CooperationProgram Air Quality (2008) measurements are taken to improve the air quality.Control and force back CO2-emissions. International regulation of emissions is necessary, thereforethe Netherlands pushes internationally for:further optimization of the combustion enginehigh usage of sustainable biofuelsstrong growth of electric or “plug in” hybrid vehiclesgrowth of fuel cells/ hydrogen vehiclesfurther development of vehicle efficiencyForce back high noise exposure by traffic by implement noise policy, develop and implementinnovative noise reducing measurements along roads and railway. No houses next to state highwayswith a noise exposure of more than 65 dB. Reduction of bottlenecks over 70 dB along railroads until2020. Growth of railway transport within the valid noise exposure legislation.There should be no negative effects for special nature values by the construction of infrastructure.The quality of the soil should be maintained and possibly improved. Nature should be conserved orcompensated for. The government wants ambitious international agreements for improving waterquality.
Climate Targets and TransportThe ambition of the Dutch government in 2007 was to realise a 30% CO2-reduction in 2020 compared to1990 and to make 20% of the energy use sustainable. In the climate program “Clean and Economical” theambitions for traffic and transport are formulated. According to the program the sector is responsible foralmost 20% of the Dutch emission of CO2 and has to reduce 13 till 17 Mton CO2/year in 2020 comparedto an unaltered situation (47 Mton CO2 emission in 2020). The total CO2 emission for transport and trafficin 2020 compared tot 1990 may be 30-34 Mton. This means the CO2 emission is allowed to grow with 0-13% compares to the emission in 1990 (30Mton). Overall there will be no CO2 reduction from transport in2020 compared to 1990.
Routes to Sustainable Transport
70
199030
2020 unchanged policy47
With CO2 policy Clean and Economical30-34
reduction13-17
CO2-emissions from transport and traffic in the Netherlands and planned effects of policy in Mtons/year(table 1 chapter 7 Schoon en Zuinig).In the governmental agreement 2010-2014 of the coming new government, is formulated that theNetherlands will follow European agreements about CO2 emission reduction. This means that also theDutch reduction targets will be equal to the European targets and change to 20% CO2 emission reductionin 2020. The share of renewables in 2020 should be 14% compared to 1990.
R&DFor improving the quality of the environment, € 1 billion is reserved for the period 2011-2020.30 million euro is available for measures for the introduction of clean fuels and the implementation of ICTto support a better flow through.€ 5 million is available for pilot projects for driving on hydrogen and € 65 million is available for pilotprojects to promote electric driving.
Energy Use for TransportThe current share of energy consumption used for transportThe energy use of traffic and transport in the Netherlands in 2009 was 561 PJ . In 1990 it was 451 PJ. Thecause of growth is mainly due to a growth in passenger cars. The road traffic used 426 PJ, navigation 86,4PJ, air traffic 9,0 PJ and rail traffic 0,9 PJ. The transport sector contribution 17% to the total amount ofenergy used in 2009. This total use of energy in the Netherlands in 2009 was 3262 PJ. Householdscontributed 425 PJ in 2009. The amount of energy used by transport and households is nearly equal.http://www.compendiumvoordeleefomgeving.nl/indicatoren/nl0030-Energieverbruik-door-verkeer-en-vervoer.html?i=6-40.
The Share of Gross Energy Production from Renewable Energy SourcesIn 2009 3.4% of the petrol and car diesel sold in the Netherlands consisted of biofuels. The governmenttarget for biofuels was 3,75% for 2009. No figures for other renewable energy sources are found.
Routes to Sustainable Transport
71
Plans, Policies and Discussions on Increasing the Use of Renewable Energy Sources forTransportAt this moment, the transport sector almost solely depends on fossil fuels. To keep fuels affordable andreduce CO2 emissions, according to Dutch politics vehicles have to become more economical andrenewable energy sources have to become more important.For 2040 the Dutch government wishes to stimulate the use of sustainable biofuels to reduce CO2 withoutthe disadvantuous consequences for food production, biodiversity etc. Furthermore, the governmentwants to stimulate the growth of electrical vehicles and vehicles with a fuel cell or on hydrogen.To stimulate and to profit from these possibilities for innovation, until 2020 the Dutch governmentpleads for norm reduction in a European context. Instead of choosing a technology from the renewablepossibilities, the market will be stimulated to innovate and compete in order to meet the strict norms.The Taskforce Energy Transition, a initiative of the government, is established to create an energytransition towards a sustainable energy household. Different platforms are established, amongst whichthe Platform Sustainable Transport. This Platform consists of representatives of government, industry andngo’s. Their goals are to reduce emissions of GHG from new vehicles by a factor 2 in 2015 and by a factor3 of the entire fleet of cars in 2035. For this, four transition paths are formulated: 1. Hybridization andelectric driving; 2. Sustainable biofuels; 3. Driving on hydrogen; 4. Intelligent transport systems.The Platform wants to stimulate the creation of an international infrastructure for the dissemination ofalternative fuels and stimulate the demand for new fuels and clean vehicles. The working groups thatsupport these transition paths stimulate local initiatives and try to detect bottlenecks.
Regulation and Technology Options for Sustainable TransportBiofuelPart of the total amount of fuels have to consist of biofuels. Target for the use of biofuels in 2010 was5,74 %, but this percentage has been adjusted to 4%. The most important reason is concern over theeffectiveness and sustainability of the biofuels, for instance in the competition with food.In 2006-2007 there was a tender biofuels which stimulates the introduction of innovative, secondgeneration sustainable biofuels, for the period until 2013 with a total amount of € 12 million.
Electric DrivingThe former government had the intention to support electric driving by supporting market initiatives. Ithas taken the initiative for a Formula-E team, a joint project of governments, market parties and socialorganisations. Its mission is to encourage market developments and take away obstructions. At the sametime the government will stimulate pilot projects including the necessary loading infrastructure. In total €65 million is available. From 2012-2015 the amount of cars is expected to increase and from 2015-2020there will be a further rolling out of the amount of electric vehicles. From 2020 on there should be amature market.
Routes to Sustainable Transport
72
Road PricingThe former government planned to introduce a different system for paying for mobility by theintroduction of road pricing. However, there was discussion about the technological possibilities of adifferentiated road pricing system and the political desirability. In their governmental agreement, the newDutch government mentions road pricing is no longer a policy option.
Green TaxesThe tax on new cars is differentiated and partly depends on the CO2 emission of the vehicle. From 2013the tax will solely depend on the CO2 emission. Economic and clean cars will be cheaper in purchase thanheavier and less economic cars. Electric cars don’t have to pay tax. Hybrid cars and cars that run on lpg ornatural gas pay a reduced tax rate. The road taxes are also CO2 dependent. Since 2010 clean cars don’thave to pay road taxes.
Green DrivingThe program “The green driving” tries to influence the driving behaviour of car drivers. To programpromotes a more economic driving style by showing that driving at a constant speed and switching gear ata low number of revolutions saves fuel.
Euro 4-5To prevent PM10 and NOx the government wishes to stimulate an early introduction of Euro 4 and Euro 5engines in trucks and busses.
Particle FiltersThere is a subsidy program for particle filters in light vehicles for existing cars and light vans with a totalbudget of € 50 million. Up till week 39 80.515 filters are installed.
Scrapping ArrangementIn 2009 a national scrapping arrangement started. With buying new cars, old cars could be traded in. Thearrangement ended in 2010 with the exchange of over 81.000 old vehicles.
Routes to Sustainable Transport
73
Reduction of Maximum SpeedAt five locations in the highwaysystem the maximum speed was reduced to 80 km/hr to reduce theemission of PM10. In the new governmental agreement the general speed limit will be raised to 130km/hr.
Noise Reducing Source MeasurementsNew, innovative noise reducing (source) technologies like silent road surfaces and silent train brakingsystems are being developed and tested to promote implementation. Implementation of silent roadsurface on highways near residential development.
Quality of NaturePolicy is to reducing 208 bottlenecks in the highway structure in realising the ecological mainstructure. Itis not sure whether this policy will be maintained, since the new government will limit the ecologicalmainstructure.
Land Use and Physical PlanningThe Netherlands are densely populated and we have a great need for transportation, which conflicts fromtime to time. The last twenty years so-called VINEX-locations are planned at the outside of cities. TheseVINEX-locations are large urban residential areas for living but without many possibilities for employment.This has created quite some commuter traffic. Therefore, the need for transportation has grown, withoutmany possibilities for public transport. This has contributed to a rise in car traffic. There is a publicdiscussion about the necessity of more and broader highways. Because procedures for the expansion ofexisting highways and the planning of new ones took long procedures and quite some time, the formergovernment has implemented emergency legislation to speed up the construction of highways.To reduce the increasing traffic jam problem, two strategies are formulated that come down to : 1. realisea growth in transport by train by amongst others creating high frequency railway transport, six trains perhour in the densely populated area’s and stimulate regional public transport. In September 2010 a teststarted with high frequent railway transport between Eindhoven and Schiphol. Unfortunately, this leadsto more delays in other regions. The question is whether the railroad system an actually process moretrain travellers.And 2. development and more efficient use of highways by untwining regional and trough traffic andcreating at least 2x4 carriageways on the most important highways in between cities in the mostpopulated western part of the Netherlands. One highway already received an extra carriageway. Thequestion is whether extra highways solve traffic jam problems or create extra mobility.
Routes to Sustainable Transport
74
Almere is a growing city near Amsterdam. There are plans for the construction of an extra highway as wellas a railway between Amsterdam and Almere. Since they will go through a nature area this raises a lot ofpublic discussion.According to the former government, the negative effects of infrastructure on nature should beminimalised. There should be no negative effects on special nature values, the quality of the soil systemshould be maintained and negative impacts on nature should be compensated. However, the realisationof the ecological mainstructure, a natural structure that ties nature reserves together to enlarge the livingareas of many species and improve biodiversity, is not running on time and the new government willinvest less in the purchase of land.The Netherlands have a strong tradition of biking. Most citizens use a bike for short distances, especiallyin cities. The expansion of good bike facilities near train stations is stimulated. Many towns have a policyfor stimulating bikes by improving bike paths, often part of the climate policy of the town.Road pricing is no longer desired by the new governmentSince a few years most towns have some form of climate policy. This climate policy includes a program onsustainable traffic. The Platform Sustainable Transport supports many local and regional initiatives topromote and facilitate sustainable traffic, e.g. hydrogen busses, electric transport in Amsterdam, hybridpublic transport in Gouda.
Border-crossing Transport in EuropeThe Netherlands wants to sharpen the EU-regulation concerning the norms for emission by road trafficand dieseltrains. Further regulation of emission norms for air traffic and the sea navigation sector isstrongly promoted by the Netherlands.The position of the national airport Schiphol is point of discussion for many years now. The airport wishesto grow while it creates noise pollution and not always meet the noise reduction norms. The recentoutcome of a new study is that Schiphol should have the possibility to grow within limits, made possibleby new noise reducing technologies.There is no specific international component in the sustainable transport policy plans of the Netherlands.
Routes to Sustainable Transport
75
Routes to Sustainable Transport
76
NorwayThe Norwegian Board of TechnologyAuthor: Jon Magnar Haugen
State of PolicyMajorpolicy documentsareThe National Transport Strategy for 2010-2019, which mainly concerns infrastructure.The White paper on climate, supplemented by the Climate Settlement between the government andmajor opposition parties of 2008. The settlement takes up car taxation and incentives for publictransportation and alternative fuels.The overallobjectiveoutlined in the National Transport Strategy is to provide an efficient, accessible, safeand environmentally friendly transport system. It shall satisfy society’s needs for transport and promoteregional development.The strategy states that different forms of transport havedifferent advantagesin the transport market.Policies must differentiate between, inter alia, geographical conditions ranging from the more denselypopulated Oslo-area to the rugged western and northern coasts. This means that funding for publictransport and railways is targeted at and around major towns, while roads have priority in the rest of thecountry. Overall, the aim is to spend an average of 32.2 billion NOK (>4 billion EUR) annually oninvestments and maintenance of infrastructure during the 10-year period, compared to 24.6 b NOK for2009. This involves 22 b on roads, 9 b on rail, 1 b on coastal infrastructure. Focal areas for investmentsinvolvestronger capacities for rails in the Oslo areaimproving roads along major axes to reduce travel timesfacilities that protect roads from landslides and avalanches.Taken combined, the Transport Strategy and the Climate Settlement emphasize the followinginitiativestowards sustainability:Investments in rail for freight and passenger transportInvestments in harbours for freight transportSubsidies for public transportation (bus/rail)Strong CO2-components in taxation for cars and fuelsIncentives for alternative fuel use. Strongest incentives for electric vehicles, more modest for hybridsand biofueled vehicles.Investment in facilities for walking/cycling
Routes to Sustainable Transport
77
Climate targets and transport:GHG – reduction 20501990 levelGHG-reduction 2020,domesticallyGHG-reduction in transport 2020Renewables share of energyconsumption 2020Renewables share of transports’energi consumption 2020Share of biofuels (surfacetransport) 2020100%, based on a combination of policiesdomestically and abroad12-14 Mt compared to BAU (approx. 20%)2.7-4.7 Mt compared to 1990 level1-2 Mt (< 10% of overall emissions fromtransport)No set target, currently>50%10%No set target
The climatesettlementThe climatesettlement
The renewablesdirective
R&DR&D towards efficient vehicles include efforts towards renewable electricity supply in general, includinghydro, solar, offshore wind and waves, and CCS. Hydrogen technology is also prominent, including supply,storage and fuel cells. Even infrastructure and transport system management are continuous issues ofresearch.Transnova is a public enterprise funded by the state to supportestablishment of infrastructure for alternative fuel/propulsion technologiesother efforts towards sustainable transport or reduced transport volumes.
Climate Cure 2020Norwegian authorities are undertaking their most comprehensive assessments of opportunities and costsfor emissions reductions across sectors – called the ”Climate Cure 2020”. The assessment establishes aBAU-scenario where emissions from mobile sources are expected to increase from 16.8 Mt CO2currentlyto 19 and 21 Mt in 2020 and 2030. The Climate Settlement aims to reduce emissions by 2.5-4 Mtcompared to BAU by 2020. Climate Cure 2020 sees this as an ambitious target given that certain policieshave already been implemented and form basis for the BAU, including green taxes and new propulsiontech.The strongest potential contribution within 2020 is identified for biofuels, measuring 1.8-1.9 Mt CO2. Thisfigure does not reflect eventual emissions abroad relating to supplies of biofuels. The theoreticalcontribution of propulsion technology (BEV, hybrids and a more efficient fleet) is estimated at 0.8 Mt CO2.Other targets like doubling the proportion of cycling, improved public transport, ecoefficient driving, gasferries and efficient ship technology are estimated to contribute 0.8 Mt. Heavily restrictive measures
Routes to Sustainable Transport
78
against air and car travels are estimated to contribute 1.2 Mt. This would involve doubling of fuel prices,heavy toll and parking prices, combined with stuimulating alternative public transport. The assessmentstates that such policies may have unwanted implications for demography, welfare distribution etc.For 2030, alternative fuel and propulsion, combined with improved rail capacity for freight transport,could kick in and contribute 8-12 Mt in reduced emissions compared to the BAU.Governance and responsibility for sustainable development in the transport sectorThe Ministry of Transport has the overall responsibility for implementing strategies for a sustainabletransport sector. Regulation and supplies of transport services involves a multitude of actors. Localauthorities play important roles in spatial planning, which may determine transport needs and whichmodes of transport that are feasible. County authorities are responsible for public transport services bybus, tram and boat. They would either own services, or procure services from others. They also ownnational and regional road infrastructure, although new investments are the domain of the state. Thestate also runs the national infrastructure for rail, and holds stocks in SAS.While most passenger transport providers havepublic ownership,this is not so much the case for freight.As investment and wage costs are high, one sees a tendency that foreign trucks eat into the domesticmarket for freight.
Energy Use for TransportThe energy consumption in the transport sector in 2008 was 200 PJ, compared to a total domesticconsumption of 778 PJ. Renewables contribute the following shares:Electricity (mainly hydroelectric): 46.5%Biomass and waste: 5.3%Thermal/surplus heat: 1.5%In 2008, the energy supply to transportation consisted of195.7 PJ petroleum2.0 PJ natural gas (gas ferries and buses)2.5 PJ electricity (rail)
Plans, Policies and Discussions on Increasing the Use of Renewable Energy Sources for TransportAs Norway is broadly self-sufficient with renewable electricity (hydro), a shift in transportation towardselectricity is an obvious way forward. Options for this include:1: Substitution to modes of transport where electricity is established (e.g.rail)2: Introduction ofelectric cars,bikes etc.
Routes to Sustainable Transport
79
Policies towards such options include investments in rail infrastructure and green taxes/subsidies whichare discussed below.An expert group established by the minister of Transport in 2009 found 2400BEVin Norway. The groupsuggested to aim that BEV, including plug-in hybrids, should contribute 10% of the total fleet within 2020,corresponding to >200,000 units. An expert group in the Norwegian Board of Technology the same yearwas less optimistic about the pace of substitution, and estimated that all alternative propulsion combinedcould at best be found in5-10% of new carspurchased within 2020. With annual rates of purchase fornew cars at >100,000, this could amount to 50,000-100,000 units. The Climate Cure assessments calculatewith 120,000 units in 2020, with equal shares for BEV and plug-in hybrids. This effort is calculated to costsociety 1100 NOK (140 EUR) per tCO2saved. With increasing maturity, BEVs are estimated to be profitableby 2030.To consider sustainability of BEVs raises questions about the source of electricity. Even if one couldguarantee that the load is based exclusively on hydropower, this implies that less hydropower is availablefor other purposes (opportunity costs). However, the efficiency of BEV is so high that even the impacts ofa large scale introduction on the energy system are considered rather marginal. If the proportion of BEVrises to 10 %, they are estimated to demand 0.7 TWh per year (0.6 % of domestic electricity production).Another option of interest ishydrogen.However, as hydrogen must either be derived from fossilmethane, leaving a CO2-residue, or through energy-intensive hydrolysis, this option also has its sceptics.Some propose that if CO2-residues could be stored, methane-based hydrogen could be counted as climateneutral.Support for 1stgenbiofuelsis modest, while more or less mature alternatives based on waste and woodattract support. Some hope that such options may contribute to self-sufficiency for biofuels in Norway.Current policies include compulsory mixing of biofuels into petroleum, currently set at 3.5%. The intent isto increase the level to 5% as soon as schemes to ensure sustainability in supplies are introduced.Biofuels could be expected to play the strongest role where electricity is less competitive, like in ships, air,and trucks. In themaritime sectorthere are also ambitions towards fuel cells and increased use of windand sea currents. Already, ships that supply and support rigs in the North Sea harvest some of theirenergy from currents.
Regulation and Technology Options for Sustainable TransportGreen TaxesTaxation forcombustion engine cars and fossil fuels.The CO2-component in car purchase taxes hasstimulated demand for low-emission cars including 1stgeneration hybrids. Fuel taxation is combinedof a road use tax (amounting to 4.54 NOK/l (0.57 EUR) for gasoline and 3.56 NOK/l (0.45 EUR) for
Routes to Sustainable Transport
80
diesel), a CO2-component (amounting to 0.88 NOK/l (0.12 EUR/l or 50 EUR/tCO2) for petrol and 0.59NOK/l (0.075 EUR) for diesel), and VAT. Taken together, these amount to >60% of consumer prices.Such taxation must have left its marks; even though studies show that car and fuel use have low priceelasticity.Biofuelsmeet a complex taxation structure. Flexifuel-cars meet a tax-reduction of 10.000 NOK (1250EUR) on the specific car purchase tax. Bioethanol and biodiesel is excempt for the CO2-component ofthe fuel tax. Biodiesel is charged with 1.78 NOK/l as a road use tax (50% of the level for fossil diesel).Petrol/ethanol mixtures are charged with the same road use tax as petrol whenever petrol is the mainingredient, and excempt in the opposite situation.
BEVBEV are supported through tax exemption (VAT and specific car purchase tax, as well as a reduction onthe annual car tax), and free admission to public ferries, public parking and toll roads. Further, they areadmitted to road lanes that are otherwise restricted to public transport. The state also supportsestablishment of loading stations with approx 50 mill NOK/year. There are discussions how to prepare thegrid for ultrarapid loading.
HybridsCurrently, only pure BEV meet all kinds of stimuli, while 1st generation hybrids are handled like any otherefficient combustion engine car. Plug-in EV may challenge current schemes for car taxation.
Hydrogen VehiclesHV meet may of the same stimulants as BEV, but are not excempt for VAT. Hydrogen can only beintroduced through large scale coordinated investments in fueling stations. The state has supportedestablishment of loading stations along a pilot route Oslo-Stavanger.
Public ProcurementThe Climate Settlement concludes that public procurement should be used as a tool to kick-start themarket for new propulsion technologies. A few Norwegian towns have invested in fleets of BEV.
Road Tolls, Road Pricing and Parking RestrictionsThe Oslo road toll scheme was a pioneer in road pricing, installed to fund investments in infrastructureand public transportation. It is based on a settlement (called the Oslo-package) between the municipality,county and state. The state government has urged towards modifying the scheme more in line with
Routes to Sustainable Transport
81
Stockholm or London congestion charge models, with differentiated taxes across time and space.However, such decision claim local support, and was excluded from the last Oslo-package. The stateremains committed, and say that regions that establish congestion charge schemes will be prioritized forstate subsidies to public transport.In the National Budget for 2011, the government signals intent to shift taxation from purchase to use. Asheavy fuel taxation may be unacceptable as it would put a disproportionate burden on rural areas whereno alternative modes of transportation exist, the government signals intent to look into road pricing.There are also discussions to use parking prices as a restrictive tool for urban transport.
Methods for Monitoring Environmental Impact from the Transport SectorThe Environmental Protection Agency monitors air quality. Last winter, air quality in Bergen, Norway’ssecond largest city, was so poor that the local authorities introduced unprecedented traffic restrictions,including prohibitions for half the car fleet within a certain zone, and limiting space available for parking.In many urban centers, threshold levels for particulates and NOx are surpassed a number of days eachwinter.
Particle FiltersDiesel cars without particle filter are charged 455 NOK extra on their annual car tax. An added car-wrecking subsidy of 5000 NOK (630 EUR, compared to the standard level of 1300 NOK), targeted at oldervehicles with high emissions of NOxand particulates, was in force in 2008.
Spatial PlanningSpatial planning could play a role both at reducing transport needs and substituting from high-emissive tolow-emissive modes of transport. When assessing the potentials of this tool, one must keep in mind thatthere is a political priority to maintain population all over the country. This materializes through heavyinvestments in road infrastructure, as well as subsidies to boat and air transport in the west and north.Admitting that transport use in these regions could hardly be reduced or substituted, efforts towardssustainability in these regions would rather focus on efficiency and alternative propulsion.
Routes to Sustainable Transport
82
Opportunities to reduce transport needs or shift transport modes can be learned from studies oftravelpatterns.For the population in central Oslo daily travel distances amount to 23 km, and pkm made bypublic transport equals those made by car. The similar distances as one moves to the suburbs andfurther surroundings are 30 km and 35-40 km, respectively, while the proportion covered by publictransport is reduced to 1:2 and 1:4. However, people in Oslo spend more time travelling than people insurroundings, indicating that transport in Oslo is hampered by congestion.For the population in Oslo overall, a study from 2005 demonstrated that public transport covers 21% ofall daily travels, compared to 35% by car and 35% for walking/cycling combined. In areas outside theten larger cities/towns with surroundings, public transport’s share of daily travels diminishes to 4%while the car’s share grows to 60%. Turning to long-range travels (>100 km), 64% of such travels go bycar, compared to 20% by air, and 5% by bus, rail and boat, respectively. For travels >300 km, the portionserved by air increases to 45%, compared with 9% by rail.
Options to change travel patterns are illustrated in the textbox above. This indicates that opportunities tosubstituteto low-emissive modes of transport are most feasible for the following tasks:urban personal transportintercity personal transportintercity freight transportInfrastructure forintercity transportis in the governments domain. Air and car transport dominatespassenger travels between the major cities across southern Norway, and 3 domestic Norwegian air-routesare listed among the 10 busiest in Europe. Nationwide, air transport contribute equal amounts ofpassenger kilometres (pkm) as those by bus or rail, despite that the latter are also present in urbanpersonal transport. This indicates that rails are not really competitive. There are now undertakings tostudy the feasibility of high-speed rail between urban centers in southern Norway.Intercity freight transportis served by ships, rail and trucks. Strengthening the role of ships and rails inthese markets is a priority in the National Transport Strategy.
Strategies for Sustainable Urban MobilityThere is a growing awareness to develop urban areas so that family life, work and social needs can besustained without much transport. Most specifically, establishment of new residential or business ischannelled towards hubs for public transportation. The state operates a reward scheme for towns thatmobilize towards public transport, cycling and walking. The reward scheme allocates 431.1 mill NOK (55mill EUR) in 2011.The National Transport Strategy aims that cycling will contribute 8% of all travels in 2020. This comparesto 5% of all travels in 2005, and to 12 % in Sweden, 17 % in Denmark and 27 % in the Netherlands.Dedicated facilities for cycling are more modest than in other Scandinavian countries. In Oslo, dedicated
Routes to Sustainable Transport
83
bicycle lanes amount to approx. 70 km, aiming at 100 km in 2012. In addition there are secondary lanesthat are not physically separated from other traffic. The Transport Strategy outlines to construct 500 kmnew cycling/walking lanes the coming ten years. For 2011, 330 mill NOK (42 mill EUR) are allocated to thepurpose.
Border-crossing Transport in EuropeApart from transport through Sweden, and by car-ferries through Denmark, much of Norwegians’travelsabroad go by air.This will hardly change in the near future. In the ongoing assessments of high-speed rail,however, connections to the Swedish high-speed rail grid are part of the consideration.Another issue of large-scale dimensions concerns the opening of the North-east passage forfreighttransportfrom Asia to Europe and eastern America, as well as for petroleum and mineral shipments fromthe Barents regions of Norway and Russia. A number of North Norwegian towns try to positionthemselves to become the preferred supply harbour and entry point for such traffic. There are concernsthat such transport may affect the vulnerable Arctic ecosystems through chronic or accidental spills andleaks; whether of oil, chemicals, or alien species.As a country in the European periphery, Norway is no transit country whether for passenger transport orfor freight – apart from shipping. There are certain concerns that our position in the periphery hamperscompetitiveness. For foreign traffic to Norway, we operate certain unique restrictions. Firstly, we operatelow speed limits, with 100 km/t as the top level. Secondly, the upper limit for the length of containertrucks is lower than in most countries.
Routes to Sustainable Transport
84
PolandBAS – Bureau of Research
State of Policy‘Transport quality improvement and development of transport system in accordance with principles ofsustainable development’ is the main goal of theNational Transport Policy 2006-2025.The document,adopted by the government in June 2005, describes prevailing trends and weaknesses in the transportsector (among others it points out: the growing role of road passenger transport and freight, diminishingshare of railway transport and of public transport in cities, high number of road fatalities, growingnegative impact of transport on the environment). Consequently, as the main challenges the Policy hasidentified: reduction of the demand for transport, greater share of railway and intermodal transport,development of public transport in cities, improvement of road traffic safety and reduction of harmfulpressure on the environment (noise, air and water pollution, GHG emissions). However, there are no clearand precise description of targets the Policy aims to achieve.The Policy is accompanied by other strategic documents of a more sectoral nature (e.gRailway MasterPlan 2030, Program of building national roads 2008-2012),often mutually unintegrated. Despite highpriority they all give to the idea of sustainable transport any practical implementation of the idea oftenproves unsatisfactory. The reasons for that are complex. On the one hand, it is a poor technical conditionof the public transport infrastructure, today badly in need of modernization. On the other hand, it is theprevailing consumption modes that promote the use of private cars (though in some peripheral regions,where public transport has ceased to operate, private cars are necessity, since they serve as a sole meansof transport). The state policy mostly tends to fulfill the society and economy rising demands fortransport, and to a lesser extent attempts to reduce their needs for transport.Over the last years the total length of railway network has been reduced by a quarter (from 26200 km in1990 to 19400 km in 2007), which deprived many urban areas of access to railway. At the same time theroad network has expanded by 20%. The number of private cars increased from 10 million in 2000 to 16million in 2008 (but still the number of cars per thousand inhabitants is below EU-27 average). Thanks tothe EU cohesion and structural funds the transport infrastructure in Poland is significantly beingdeveloped or modernized. However, the great majority of funds are allocated to road infrastructure. Atthe end of September this year representatives of railwaymen organized a protest in front of the Ministryof Infrastructure to alert public opinion to the deteriorating condition of their sector. One of theirdemands was an increase in funds allocated to railway infrastructure, to a proportion: 40% railway - 60%roads.Recently, the government initiated a process of horizontal integration of all state strategies anddevelopment programs. The expected result should be 9 new long-term strategies covering areas crucialfor the development of the society and economy. One of them is an integrated strategy for developmentof transport.
Routes to Sustainable Transport
85
Many local governments develop their own sustainable transport strategies. Such strategies andprograms include a variety of measures promoting public transport, cycling paths or pedestrian zones,and restricting the use of private cars.
Energy Use for TransportOver the last years transport has been the economy sector with the fastest increase inenergyconsumption(see: graph below). Road transport account for 94% of energy consumption of the sector(railway approx. 3%, air and water transport 3%). In the years 1990-2008 the share (volume) of roadtransport increased three times, while the share of railway passenger transport decreased by 60% andrailway transport of goods by 38%.
Structure of energy consumption in Poland [% ]35302520151050IndustryTransportHouseholds19982008AgricultureServices
The main source ofrenewable energy in transportare biofuel components: ethanol blended into petroland methyl-ester blended into diesel (at present the additives do not exceed 5% content) or biodiesel(100% biofuel). Their use in transport results mostly from an EU requirement imposed on Member Statesto achieve 10% minimum share of biofuels consumption in transport sector by 2020 (Directive2009/28/EC). The Polish government has adopted a schedule with national minimum targets to beachieved each year by 2013. Up to now all the targets have been achieved (the 4,60% target set for 2009was slightly exceeded). According to the schedule in 2010 the share of energy from renewable sourcesshould reach 5,75%, however there are fears this year target and the future targets may not be achieved,unless higher levels of biofuel components are allowed. To make it possible the government is currentlyworking on a standard allowing the blending of higher levels of biofuel components (e.g. diesel B7).
Routes to Sustainable Transport
86
The consumption of biofuel has so far been encouraged byfiscal incentives(i.e. reduced excise duty).However, the incentive will be withdrawn in April next year. It is likely the price of biofuels will then rise,which might hinder accomplishment of the required share of biofuels in transport energy consumption.Quite significant and growing share of the energy consumption in transport is represented byautomotiveLPG(autogas). At present it is the leading alternative fuel in Poland. Although it is an environmentallyfriendly fuel (as it is characterized by low particle and NOx emissions, low sulphur content), the mainreason for its widespread use is not ecological, but rather economical (i.e. much lower price than that oftraditional fuels). Autogas currently powers approx. 13% of Poland’s passenger car fleet (more than 2100thousand vehicles), which is serviced by an extensive infrastructure network (more than 6000 fillingstations and a network of services specialized in gas system installation and maintenance).Today electric cars represent only a tiny fraction of the transport sector. However, some initiatives havebeen launched to stimulate the use of hybrid vehicles and to develop plug-in infrastructure. Several citiesare testing hybrid buses with a view to supplement their public transport fleet.
Regulation and Technology Options for Sustainable TransportFrom the 1st July 2011 the existing vignette system will be replaced by ETC system. It is planned that theETC will gradually expand, from 1600 km of national roads in the first year, to 4000 km in 2014. The tollwill vary depending on vehicle’s weight and emissions. The system is expected to contribute to a greaterrationalization of costs and improvement of freight structure (i.e. shifting to alternative modes oftransport, especially from road to rail).There is a growing interest in ITS solutions and services. However, initiatives launched by some cities lackcoordination, which in time may lead to an emergence of a fragmented system. There is an urgent needfor a national ITS development strategy. Recently, a financial support scheme for ITS has been adopted,being an opportunity to significant development of ITS services. The scheme aims at subsidizing initiativesin such areas as traffic management, road safety, road pricing, information for passengers, urban mobility.Its overall budget amounts approx. to 164 million euro (financed mostly by the European RegionalDevelopment Fund).
Land Use and Physical PlanningLand use planning falls within the scope of competence of local authorities, which can use it forimplementation of their local transport strategy. Practical implementation varies depending on citizens’transport needs, the authorities’ determination, available budget etc. For example, theStrategy forSustainable Development of Warsaw Transport System by 2015includes a variety of physical planningmeasures to restrict traffic and to promote public transport (e.g. zones with restricted traffic, limited
Routes to Sustainable Transport
87
parking capacity in the city centre, protection of green areas, separate bus lanes, park and ride system,cycling paths). The Strategy also points out a necessity to coordinate local land use plans in order tocontrol developments generating transport needs. But, in practice, it is highly difficult to implement asland use plans are often dispersed, not integrated and generally in scarcity. Lack of land use plans is amore general problem in Poland (only 25% of the country is covered with land use plans). Today, it is themain reason for chaotic spatial development in suburban areas (urban sprawl) and along main roadcorridors. Also the regional planning system needs to be strengthened. Lack of regional spatial plans orpoor integration between them and local plans often hinders line infrastructure projects (building newroads, power lines etc.). The main role of planning at regional scale - so far often neglected - is to balancetransport needs and provide access to public transport in peripheral areas.
Border-crossing Transport in EuropePoland is a transit country with a heavy transport moving along the West-East direction (from Russia,Belarus and Ukraine). As the railway is still less competitive most of the freight is put on roads that oftenlack sufficient capacity (frequently the traffic crosses city centers). An extensive and long-term program ofbuilding new roads (motorways, express roads, ring roads around urban agglomerations) is currentlybeing realized. One can expect that with time the transit situation will improve.One of the major projects in transport sector will soon be ahigh speed rail(according to a recentdeclaration of the minister of infrastructure). A high speed line of 450 km will connect Warsaw withPoznan and Wroclaw. This should be a part of the European network of high speed rail. The projectfeasibility study should be ready by the end of 2012.
Routes to Sustainable Transport
88
SwedenPER – The Parliamentary Evaluation and Research Unit, Research ServiceAuthors: Lena Broman, Helene Limén, Anders Linnhag and Anders Wikström
State of PolicyObjectives and Targets
The overall objective of the Swedish transport policy is to ensure the economically efficient andsustainable provision of transport services for people and businesses throughout the country. Theobjective has been divided into a functional and an impact objective.The functional objective on one hand implies that the design, function and use of the transport systemwill contribute to provide everyone with basic accessibility of good quality and functionality and todevelopment capacity throughout the country. The transport system will be gender equal, meeting thetransport needs of both women and men equally. The impact objective on the other hand, implies thatthe design function and use of the transport system will be adapted to eliminate fatal and seriousaccidents. It will also contribute to the achievement of the environmental quality objectives and betterhealth conditions. More specifically, the transport sector will contribute to the achievement of reducedclimate impact, by aiming at following CO2reduction targets:The transport sector will reduce the climate impact by gradually increasing energy efficiency in thetransport system and decoupling from dependence on fossil fuels.The year 2020 10 per cent renewable energy in the transport sectorBy 2030, Sweden should have a vehicle fleet that is independent of fossil fuels.
Governance
The Swedish Transport Administration began operations on 1 April 2010. It is a public authority that takeson responsibility for long-term planning of the transport system for road, rail, maritime and air traffic. Theauthority is also responsible for the construction, operation and maintenance of public roads andrailways. The Swedish Transport Administration includes activities and operations that before 1 April2010 were undertaken by the Swedish Rail Administration and the Swedish Road Administration, as wellas certain activities that were undertaken by the Swedish Maritime Administration and the SwedishInstitute for Transport and Communications Analysis. By organizing these activities under one umbrellathe administration of the transport system as a whole can be achieved more efficiently.Example of responsibilities:Mobility management - more efficient use of transport modes, roads and other infrastructuregreater use of more environmentally-sound modes of transportRoutes to Sustainable Transport
89
better accessibilitymore efficient transports and use of landless demand for travel in motorised vehiclesThe Swedish Transport Administration has a large responsibility to advance the development of publictransport. However, the real responsibility for local and regional public transport lies with the publictransport authorities i.e. the local authorities together with the County Council in each county. Financingis arranged by local authorities and the county council in the respective county.
Energy Use for TransportTransport Energy Consumption
The transport sector accounts for about a quarter of Sweden's total energy use. The energy use in thetransport sector in 2009 was 93 TWh. The transport sector is divided into four subsectors: road transport,aviation, rail traffic and shipping. Of the transport sector's total energy use in 2009, including bunkers forforeign air and shipping, the road transport sector accounted for 69%, air traffic for 8%, rail traffic for 2%and shipping for 21 %.The road subsector mainly consists of private vehicles, public transport and freight transport by truckwhere gasoline and diesel are the main fuels. In the road sector are also a number of alternative fuelsused, mainly ethanol, FAME (fatty acid methyl esters, of which the RME, rapeseed methyl ester is themost common in Sweden today), biogas and natural gas. Ethanol is used both in low-level blends in petroland as a major component of fuels such as E85 and ED95. FAME is used as pure FAME and low-levelblends in diesel. Vehicles gas usage has increased strongly in recent years and this trend is expected tocontinue. The renewable fuel consumption share was 7.2 % in 2009 and is expected to increase to 10% inyear 2012.Table 1. Energy use in the Swedish transport sector 2009 and forecast 2010-2012, TWh2009PetrolLow-admixture ofethanolDieselLow-admixture ofFAMEHeating oilHeavy fuel oilAviation fuel,domestic421402012%45%1%43%2%0%1%2%2010411402012%45%1%43%2%0%1%2%2011403422012%42%3%44%2%0%1%2%2012413442012%41%3%44%2%0%1%2%
Routes to Sustainable Transport
90
Pure EthanolPure FAMEElectricityBiogasNatural gas
10300
1%0%3%0%0%
10310
1%0%3%1%0%
10310
1%0%3%1%0%
10310
1%0%3%1%0%
Total92,8100% 92,5100% 95,4100% 98,5100%Renewable fuelconsumptionpercentage1)7,2 %7,7%9,8%10,0%1) Under EU directive reckoning: Biogas are doubled, renewable electricity is about 50%.The calculation excludes fuel oil, heavy fuel oil and natural gas. Source: Swedish Energy Agency
Regulation and Technology Options for Sustainable Transport
The Swedish transport sector accounted in 2007 for approximately 30% of carbon dioxide emissions inSweden, 52% of nitrogen oxides emissions and about 6% of sulphur dioxide emissions.The Swedish Tax System on Fuels
A general energy tax is paid for fossil fuels and is partly based on the energy content. The carbon dioxidetax is paid per kg emitted carbon dioxide for all fuels other than biofuels and peat. The sulphur tax on fuelamounts to 30 per kg sulphur emissions in coal and peat, and 27 per cubic meter for every tenth weightpercent sulphur content in oil. Oils with less than 0.05 weight percent sulphur content is exempt fromsulphur tax. Biofuels are exempted from the energy and carbon dioxide taxes. The system allows apromotion of renewable fuels. The current tax exemption for biofuels has been approved by the EUCommission, and Sweden has received an approval in force until 2013.The Pump Act
In 2005 a new Act on the obligation to supply renewable fuels, also known as the Pump Act was adoptedin Sweden. The Act states that from 1 April 2006 the major filling stations are obliged to supply renewablefuel, such as ethanol or biogas. The objective of the decision was to reduce carbon dioxide emissions byimproving the availability of renewable fuels, mainly in the light of the fact that accessibility has beenregarded as one of the major obstacles to increased use of renewable fuels. The obligation to supplyrenewable fuels is to be realised in several stages in which all points of sale in Sweden with sales volumesof over 1,000 cubic metres of motor gasoline or diesel fuel from 1 March 2009 onwards are, by means ofone or more fuel pumps or in an equivalent manner, to supply at least one type of renewable fuel.Routes to Sustainable Transport
91
The Committee on Transport and Communications performed in 2009 a follow-up of the implementationand consequences of the introduction of the Pump Act20. The results show that the possibility to userenewable fuels has increased dramatically since the Pump Act was introduced. The are however largegeographical differences regarding accessibility to renewable fuels, both between different parts of thecountry and between urban and rural areas. The Pump Act was intended to be technologically neutral,that is not promoting the use of any specific type of renewable fuel at the expense of others. In practice,however, to a great extent the Act has resulted in the installation of pumps providing E85 at fillingstations covered by the Act. The follow-up concludes that the Act has helped to increase the use ofrenewable fuels and that there is a considerable scope for increasing domestic production and use ofbiogas as a fuel.
The Congestion Tax in Stockholm
A congestion tax is charged for Swedish-registered vehicles that are driven into and out of centralStockholm, Mondays to Fridays between 06.30 and 18.29. The tax is not charged on weekends or publicholidays, on a day preceding a public holiday or during the month of July. Some vehicles are excludedfrom the congestion tax. Vehicles are automatically registered at 'control points' during the periods whencongestion tax is charged. Each passage into or out of central Stockholm costs SEK 10, 15 or 20, dependingon the time of day. The maximum amount per day and vehicle is SEK 60.21The primary aim with a congestion tax is to reduce congestion and thereby improve the environmentalconditions in Stockholm. The city of Gothenburg will, in a similar way, use a congestion tax system startingin January 2013.The Motor Vehicle Carbon Dioxide Tax in Sweden and Weight-based Vehicle Tax
The vehicle tax is determined on the basis of the vehicle’s fuel use and its carbon dioxide emissions. TheCO2-based vehicle tax includes only newer cars from “vehicle year” 2006 or later, and older cars that meetthe requirements for Environmental Class 2005, Environmental Class Electricity or Environmental ClassHybrid. All other cars are taxed according to their weight and fuel use.Research
The Swedish state funded jointly and by agreement with the Swedish auto-motive industry, research,innovation and development activities. The authorities involved are The Swedish Governmental Agencyfor Innovation Systems (VINNOVA), the Swedish Transport Agency and the Swedish Energy Agency.Research and development effort involves collaboration between the parties to achieve the societal andindustrial targets within the two thematic areas: Climate & Environment and Security. The background to2021
Parliamentary Report 2009/10: RFR7 (In Swedish)http://www.transportstyrelsen.se/en/road/Congestion-tax/Congestion-tax-in-stockholm/.
Routes to Sustainable Transport
92
this initiative is the development of the road transport system and the importance of the Swedishautomotive industry for the economic growth.There is already good experience a successful cooperation between the parties. The experience has beenharnessed in the new joint-venture-one formulated under the "Strategic Vehicle Research andinnovation".The collaboration programs are currently: Sustainable Manufacturing, Vehicle Development, Transportefficiency, Vehicle and Traffic Safety, Energy and Environment. The entire investment will lead to R&Dactivities of approximately 1 billion SEK per year of which public resources are 450 million SEK per year.
Land Use and Physical PlanningThe Infrastructure – An Important Asset
The Government points out that the transport infrastructure is one of the country's most importantassets. Roads and railways need to be maintained to keep them in working order. The infrastructure alsoneeds to be expanded as new housing and businesses emerge and when globalisation and technologicaladvances create new opportunities. According to the Government the transport sector, like all otheractivities, need to be constantly developed and made more efficient. Maintenance and new investmentsmust be performed efficiently so that the taxpayers' money is spent where it is most needed and willsuffice for the discussed actions. Greater efficiency can be achieved through improved coordinationbetween the responsible actors, efficient agencies, a smoothly functioning regulatory system and propercompetition in the transport sector.
Transport Planning
Transport of persons or goods often involve several different modes of transport. Goods transport maystart with a truck that goes to a terminal, where the goods are reloaded onto a train that then goes to aport where the goods are shipped to another country. A commuter trip may start with a bike ride to thebus stop, then a bus trip to the station, a train ride to another town and finally a walk to the place ofwork. According to the government the transport system must be planned with the aim of ensuring thatthe entire journey, or mode of transport, functions smoothly for everyone and that all travel andtransport modes have been token into consideration. Greater interaction is needed between the usersand those who are responsible for infrastructure at local, regional and national level. The transport sectoraccounts for about one-third of Sweden's greenhouse gas emissions and a shift to transports with lessemission is needed for the future. Further development of the transport system requires, according to theGovernment, a combination of measures. These may include instruments that put a price tag onemissions, a climate-efficient vehicle park and climate-efficient construction and operation of theinfrastructure. Developing the transport system requires both measures to reduce climate impact andincreasing energy efficiency, but also to maintain economic profitability. Both the user focus and theRoutes to Sustainable Transport
93
climate efficiency point to the need for solutions that involve several traffic modes. This approach is thekey, according to the Government.22A near-term package (2009-2010) will, according to the Government, ensure that crucial railway projectssuch as the Haparanda Railway and investments in the Emmaboda-Karlskrona line can be implementedand that concerted efforts are directed at improving punctuality in the Stockholm region, western Swedenand Skåne. Access in major goods corridors is to be enhanced and priority road projects can get underwayearly and be efficient implemented. This applies to projects throughout the country, including the E18approach road into Stockholm, the E22 in Skåne and the road connections to the port of Göteborg.
Border-crossing Transport in EuropeCross-border Traffic and Green Corridors
The Swedish Government23is working for open competition in the field of passenger traffic, improvedtransport corridors in an east-west direction and support to an intermodal system, all of which call forclimate adapted solutions.The Green Corridors project24origins from a European Commission initiative aiming at reducingenvironmental and climate impact while increasing safety and efficiency. Characteristics of a greencorridor include:sustainable logistics solutions with documented reductions of environmental and climate impact, highsafety, high quality and strong efficiency,integrated logistics concepts with optimal utilization of all transport modes, so called co-modality,harmonised regulations with openness for all actors,a concentration of national and international freight traffic on relatively long transport routes,efficient and strategically placed trans-shipment points, as well as an adapted, supportiveinfrastructure, anda platform for development and demonstration of innovative logistics solutions, including informationsystems, collaborative models and technology.Responsibility for managing the Green Corridors project has been placed within the Swedish LogisticsForum, the advisory body serving the Minister for Communications.The Logistics Forum has developed Green Corridors as a project and co-operative structure linkingbusiness, society and research, and has set up working groups for issues, policy and communication,intermodality, innovation and technology. From now on focus will be on making reality of the concept.The idea behind the Swedish work is:2223
http://www.sweden.gov.se/sb/d/11941/a/125740.http://www.sweden.gov.se/sb/d/1194124Green Corridores, fact sheet, 15 June, Ministry of Enterprise, Energy and Communications
Routes to Sustainable Transport
94
to demonstrate efficient transport solutions,to promote the development of Green Corridors in EU transport policy, andto establish international partnerships that can lead to Green Corridors to and from the Nordicregion.In Sweden alone around 30 local projects have been identified and of these ten have short-term priority.In order to implement the transnational efforts better, Sweden is currently carrying out its work in closecollaboration with the new Super Green research consortium, yet another EU initiative. This consortiumevaluates the conditions for the geographic transport corridors and maps out the bottlenecks. A numberof pilot corridors will be chosen and, after Super Green’s mapping, concrete implementation proposalswill be presented.Through international collaboration corridors will be established that stretch through Finland, Norway,Sweden and Denmark, as well as Germany, Holland and Belgium. East-west corridors are also possible.Collaboration takes place with the government offices in Denmark, Finland and Norway, as well as theEuropean Union’s research consortium Super Green.
Routes to Sustainable Transport
95
Routes to Sustainable Transport
96
SwitzerlandTA-SWISS – Swiss Centre for Technology AssessmentAuthors: Adrian Rüegsegger and Sergio Bellucci
State of PolicySwitzerland has developed an integrated strategy for transport policy, focusing on better coordinationbetween transport modes, and paying greater attention to environmental problems. This strategy hasbeen strengthened in recent years with a broader integration of transport policy into spatial developmentand the general sustainability context. The main thrust of the resulting policies lies in promoting a shifttowards more sustainable modes of transport, planning and providing infrastructure that supports such ashift, and by passing legislation that reduces emissions and promotes low-emission technologies.
Passenger TransportSwitzerland has an excellent road and rail infrastructure that is permanently maintained, modernized andimproved.The first phase of a major expansion of rail transport capacity RAIL 2000 was completed in 2004. Itmarked a milestone for Swiss public transport, as rail service levels increased by 12%. At the same time,work is progressing on the New Rail Link through the Alps. A first tunnel (Lötschberg) opened in 2007, thesecond is expected to open in 2017 (St. Gotthard). The tunnels are increasing the capacity andattractiveness for both transalpine freight and passenger transport from Switzerland and northern Europeto Italy.Funding for development and maintenance of road infrastructure is provided through the infrastructurefund, which has been launched in 2008. Amongst others, Switzerland runs an agglomeration programmeaimed at providing financial resources for infrastructure projects that promote public and non-motorizedtransport in suburban regions and agglomerations out of this fund. Switzerland has developed furtherprogrammes aimed at specific parts of the transport sector like leisure transport, non-motorizedtransport, traffic telematics and a service centre for innovative mobility. These programmes arecomplemented with regulations and recommendations at the technical level, such as emission standards,environmental labels for motor vehicles, promotion of biofuels and measures at the cantonal andcommunal level.
Freight/Heavy Goods TransportSwitzerland’s freight transport policy rests on article 84 of the federal constitution, which requires thattransalpine freight transport shifts from road to rail. The central policy element to reach this target is the
Routes to Sustainable Transport
97
heavy vehicle fee (HVF) combined with measures to improve competitiveness of international railtransport. The HVF is applied to passenger and freight transport vehicles of more than 3.5 tonnes grossweight. The fee is calculated according to three criteria: the kilometres travelled on Swiss roads, thehighest authorized gross weight, and the pollutants emitted by the vehicle, according to EURO classes.Additional measures to support modal shift of freight traffic from road to rail include for example themodernisation of rail infrastructure by 2030, the further increase of the productivity and competitivenessof rail transportation or bringing down slot prices and providing additional intermodal services.
Energy Use for TransportEnergy Use and ProductionIn Switzerland, the share of energy used for transport was 34.7% of total consumption in 2009 (i.e. 305 of878 PJ). In 2009, 55.1% of total final energy consumption was oil, 23.6% electricity and 12.1% gas. Theremaining 9.2% comprised wood (4.1%), district heating (1.8%), industry waste (1.2%), coal (0.7%) andseveral other renewable forms of energy (1.4%). Amongst the latter, the shares were 1% for ambientheat, 0.19% for solar heating, 0.17 % for biogas and 0.04% for biofuels.In the year 2009, 55.8% of electricity generation in Switzerland was from hydropower plants, 39.3% fromthe five domestic nuclear power plants and the remaining share from thermal power plants or otherrenewable sources, i.e. solar, wind and biogas. The contribution to electricity generation from solar andwind is still small (< 1 per mill). However, supported by the Energy 2000 programme and since 2001 bySwissEnergy, it increased markedly between 1990 and 2009: Solar energy from 1.0 to 50 GWh and windpower from 0.0 to 23 GWh.
Biofuels PolicyTax exemption for biofuels is limited to fuels that meet ecological and social criteria. The conditions areset out in such a way that biofuels do not compete with food production and are not causing degradationof rainforests or other valuable ecosystems. The Swiss Centre for Technology Assessment (TA-Swiss,www.ta-swiss.ch ) conducted the study “Impact Assessment of 2ndGeneration Biofuels”. The study waspublished in June 2010. Its aim was to analyse the potential and risks involved in using second generationbiofuels, i.e. assess different sources of biomass, production technologies and forms of energetic use,their potential and impact of complete value-added chains, and their ecological, economic and socialimpacts. The short version (in German, French, English) of this study can be downloaded and thecomplete version (in English) is available as a book or as an e-book at www.vdf.ethz.ch .
Routes to Sustainable Transport
98
Regulation and Technology Options for Sustainable TransportRegulationsThe Federal Act on the Protection of the Environment defines maximum immission values for air pollution(Art. 14): The maximum immission values for air pollution must be set so that, in the light of currentscientific knowledge and experience, immissions below these levels (a) do not endanger people, animalsor plants, their biological communities and habitats; (b) do not seriously disturb the well-being of thepopulation; (c) do not damage buildings; (d) do not harm soil fertility, vegetation or waters.The CO2Act entered into effect on 1 May 2000 and forms the central pillar of Swiss climate policy. Itsobjective is to reduce the emission of climate-relevant carbon dioxide (CO2) arising from the combustionof fossil fuels by 10% versus the 1990 level by 2010. This means that the consumption of heating fuelsmust be reduced by a total of 15% and of motor fuels by 8%. The targeted reduction of CO2emissions isprimarily to be achieved through voluntary measures on the part of companies and private individuals.The relevant legislation provides that the federal government may introduce a steering fee on fossil fuels(CO2fee), if the voluntary measures fail to produce the desired effect. A CO2fee on combustibles will beintroduced from 2008.
Research and Support for Energy EfficiencyThe SwissEnergy programme aims at promoting energy efficiency and the use of renewable energy. Themain objectives of SwissEnergy in the area of mobility are as follows:Reduction of CO2emissions from new vehicles to 140 g/km by 2010 (same as EU targets), togetherwith reduction of energy consumption and air pollutants (e.g. particulate matter from diesel engines).Increase of gas-powered fleet to 30,000 vehicles, hybrid/electric car fleet to 20,000 vehicles, andelectric bikes to 30,000 by 2010.To familiarise all new drivers with the main principles of EcoDrive� by 2008.To achieve these objectives, the focus has to be on two main areas:Technology: SwissEnergy supports innovative research and development projects, and co-ordinatespublic sector energy research in the area of mobility, especially concerning the development of lightvehicles and new drive systems, e.g. for natural gas and biogas drives.Market: SwissEnergy promotes the distribution of energy-efficient vehicles, primarily through the useof an energy label for motor cars. It also promotes energy-efficient driving, and supports a variety ofmeasures targeting energy-efficient mobility and accompanying publicity campaigns.
Road PricingFrom time to time, road pricing is discussed in Switzerland – at least 20 political motions have beenformulated in this context so far. But as a “publifoucs”, a participative project oragnized by TA-SWISS in2004 has shown, the acceptance for this measure is quite small. One question of dissent among the
Routes to Sustainable Transport
99
participants of the publifoucs was the aim of road pricing. Should it reduce pollution? Should it providemoney for the traffic infrastructure? Should it reduce the traffic in the cities? The participants claimedthat road pricing measures should be simple, the use of the money earned by road pricing should betransparent and only the communities where road use is charged should be recompensed. Thus, at thelocal level, there is no road pricing system operating in Switzerland at the moment. But for the use ofnational highways (Autobahn), in 1985 Switzerland introduced a road tax for motor vehicles and trailersweighing up to 3.5 tonnes. It has to be paid annually by every car driver who uses the highways (flat rate,CHF 40 per year). The Directorate General of Customs levies this tax by selling motorway tax stickers(vignettes). Furthermore, there is the heavy vehicle fee (HVF), which is applied to passenger and freighttransport vehicles of more than 3.5 tonnes gross weight (see also p. 1, Freight/heavy goods transport).
Monitoring of Environmental ImpactsThe National Air Pollution Monitoring Network (NABEL) measures air pollution at 16 locations inSwitzerland. The stations are distributed throughout the country and monitor pollution at typicallocations (e.g. city-centre streets, residential areas, rural stations). NABEL measures indicator pollutants ofnational significance (e.g. nitrogen dioxide, ozone, fine particles (PM10), etc.). It serves to monitor thesuccess of air-pollution control measures (Art. 44 of the Environmental Protection Law). Furthermore, thedata collected through NABEL are made available for use in scientific investigations of air pollutants(effects on the environment and on human health), meteorological aspects, atmosphericchemistry studies, etc.). NABEL was expressly conceived as a monitoring network and not as an early-warning system.
Specific Use of Technologies e.g. Particle FiltersIn 2006, the Federal Council approved an action plan to reduce particulate matter, which is also beingsupported by the cantons. The aim is to bring about a significant reduction in soot emissions, especiallyduring periods of weather inversion in winter. The plan contains five new measures:The federal government will notify the World Trade Organisation (WTO), the European Free TradeAssociation (EFTA) and the European Union (EU) about its premature introduction of the future EURO5 soot emission limit value for all light diesel vehicles. This means that, as of 2007, all new diesel cars,mini-buses and light duty goods vehicles (up to 3.5 tonnes) in Switzerland must be equipped withparticle filters.In future, oil tax refunds to public transport operators are to be effected in a differentiated manner.For diesel buses which are not equipped with a particle filter, the operators will only receive areduced refund of the oil tax.For new diesel tractors, too, the federal government will notify the WTO, EFTA and EU about thepremature introduction of the future European diesel soot emission limit value, III B. In addition, thepossibility of providing financial incentives for retrofitting vehicles is to be closely examined.
Routes to Sustainable Transport
100
From 2007, the Federal Council will only purchase diesel-driven cars, utility vehicles and heavy goodsvehicles (HGVs) for use in the administration and armed forces if they are equipped with particlefilters (subject to availability on the market).With respect to the next increase in the HGV fee, which is due in 2008, and within the framework ofthe joint committee on the land transport agreement, the Federal Council wanted to negotiate withthe EU on the option of collecting a reduced fee for HGVs that are equipped with a particle filter.
Land Use and Physical PlanningSpatial Development / Urban PlanningThe Swiss national policy in respect of spatial and transport planning, sustainable development and thealpine conservation convention is prepared and implemented by the Federal Office for Spatial Planning(Bundesamt für Raumentwicklung, ARE). The remit of ARE includes the following:Strategies for spatial and transport planning and for sustainable developmentPrinciples of spatial planning, general and leisure traffic, sustainable development and the alpineconservation conventionLiaison between federal authorities on projects affecting land use and transportCollaboration with the cantons in all official tasksAssisting with coordination to solve problems connected with agglomeration policy and equalisationmeasures in rural areasInformationMonitoring spatial planning from a legal viewpointARE follows the aim to make a fundamental contribution to sustainable spatial development inSwitzerland and its regions and to guide this development within the framework of the relevant principlesand provisions, e.g. those of the Federal Constitution, the Regional Planning Act, transport policy, thesustainable development strategy and the Alpine conservation convention. Over the next ten years, AREwill help to achieve the following objectives:Improvement of quality of life for the populationSustainable development of urban and rural areasPreservation of undeveloped space, areas of outstanding natural beauty, and biodiversityPromotion of non-motorised and public transport in the context of an all-embracing transport policyBalanced development of all of Switzerland's regionsSpatial integration of Switzerland into EuropeOne major hurdle for the implementation of these objectives is the federal organization of Switzerland. Inmany areas, the national state has only little decision-making power but the cantons or even thecommunities have their own authority to decide. This is the case for many aspects spatial planning, so the
Routes to Sustainable Transport
101
co-ordination on a national level is difficult. E.g. housing development is a matter of the communities andevery community decides on its own, which land areas are provided as building sites. In this context,private interests (land owners) are also important. At least for national highways (Autobahn) and forrailway lines, planning and financing of the infrastructure is on a national level, but of course theconcerned cantons and communities are consulted during the planning process.
Sustainable ForestryThe first federal Forest Act of 1876 only covered the Alpine region. Its aim was to put a halt to thedepletion of forests, to manage the remaining forest areas in a sustainable way, and to promoteafforestation. The Forest Act of 1902 covered the whole country. The Forest Act and an enabling overalleconomic development resulted in an increase of the forested area in Switzerland by nearly 50%compared to the mid 19th century. The Forest Act that came into force in 1993 reaffirms the long-standing Swiss tradition of preserving forest area as a natural ecosystem. It prescribes sustainable forestmanagement, prohibits clearing, and bans deforestation unless it is replaced by an equal area ofafforested land or an equivalent measure to improve biodiversity. The forested area is still increasing. Thegrowing stock is estimated to have increased from less than 150 in 1880 to 359 m3/ha in 2005. In 2004,the national forest programme was published, outlining an action plan for 2004–2015. It specifies fivepriority objectives:The forest’s protective function is guaranteedThe economic viability of the forestry sector is improvedThe value-added chain for wood is strengthenedBiodiversity is conservedForest soils, trees and drinking water are not threatenedThese objectives encompass that CO2removals by sinks and emissions by sources in the forests shall berecognized in terms of compliance with the Kyoto Protocol while making better use of the potential offorests for timber production and fuel wood through economic incentives and implementing newtechnologies. Taking into account the high growing stock, Swiss forest policy’s climate related goal is toreduce CO2emissions by substituting fossil fuels rather than enhancing sink capacity. The sink potential ofSwiss forests is dwindling. Among other reasons, this results from largely old forests, which havedecreasing productivity and wood quality, so that a large proportion of mature trees need to be harvestedin the near or more distant future.In 2006, the Swiss government intended that forest management will be accounted under Article 3.4 ofthe Kyoto Protocol. One goal was to give forest owners the option of trading carbon credits on the basisof the sink service provided by their forests. But the revision of the Forests Act necessary for this purposewas rejected by parliament in 2008. Moreover, because use of wood becoming economically moreattractive over recent years, carbon trading based on sink services is commercially less interesting.However, few forest owners are preparing to offer carbon credits on the basis of sinks provided by theirforests on the voluntary market.
Routes to Sustainable Transport
102
To implement the objectives of the national forest programme, the wood resource policy is coordinatedwith the other relevant sectoral policies (e.g. energy policy, regional development policy). A wood actionplan has been started in 2009. Its main focus lies in on the ecologically and economically effective use ofwood. With a view to the efficient use of wood, cascade use is prioritised, i.e. wood is used as materialprior to its use for energy. In the case of energy use, greater overall efficiency of the conversiontechnology should be targeted.
Border-crossing Transport in EuropeRail InfrastructureSwitzerland provides a very important infrastructure for border-crossing transport in Europe, connectingGermany through the alps with Italy, part oft the “European corridor A Rotterdam-Genoa”. The Swissinfrastructure consists in one highway link (through the St. Gotthard tunnel) and in two railway links (St.Gotthard and Lötschberg tunnels). Switzerland’s transport policy requires that transalpine transport shiftsfrom road to rail. For this purpose, a modernization of the rail links is essential. The New Rail Link throughthe Alps project was accepted 1998 by the Swiss voters in a referendum. The first new tunnel (Lötschberg,length 34.6 km, cost Euro 3 billion) opened in 2007. The second is expected to open in 2017 (St. Gotthard,length 57 km, cost estimated Euro 7 billion). On October 15, 2010, a milestone of this project – thelongest railway tunnel in the world – has been celebrated: The cut-through of one of the two tubes oft theSt. Gotthard tunnel was achieved. The new Lötschberg an St. Gottahrd tunnels are increasing / will beincreasing the capacity and attractiveness for both transalpine freight and passenger transport fromSwitzerland and northern Europe to Italy. An open question is, if the Italian infrastructure will be ready to“digest” the additional traffic coming from the north in 2017, when the St. Gotthard tunnel is expected toopen. What concerns harmonization, Switzerland plays an active role in the application of internationalstandards, e.g. the European Train Control System (ETCS) is already in use on several Swiss railway lines.
AviationWith respect to climate change, Swiss aviation policy is focused on international aviation, as the share ofSwitzerland’s domestic aviation emissions is very small. Switzerland joined the International Civil AviationOrganization (ICAO), the European Civil Aviation Conference (ECAC), and the European Aviation SafetyAgency (EASA). Switzerland adopted European civil aviation legislation within the framework of thebilateral transport agreement between Switzerland and the EU. Within the ECAC, EASA and ICAO,Switzerland strives for internationally coordinated measures to limit GHG emissions from aviation.Switzerland applies and promotes airport emissions charges systems and works towards stricterinternationally accepted emission standards for new aircraft engines. With respect to market basedmeasures, Switzerland is studying how civil aviation could be integrated in an emissions trading systemcompatible with European aviation policy. The Federal Council evaluates to what extent revenues from
Routes to Sustainable Transport
103
current taxes on kerosene in domestic aviation could be used to finance environmental protectionmeasures relating to aviation.
SourcesSchweizerische Gesamtenergiestatistik 2009. Bundesamt für Energie, 2010:www.bfe.admin.ch/themen/00526/00541/00542/00631/index.html?lang=de&dossier_id=00763
Switzerland’s Fifth National Communication under the UNFCCC. FOEN (Ed.), 2009:http://unfccc.int/national_reports/annex_i_natcom/submitted_natcom/items/4903.php
Homepages of the Swiss Federal Office of Energy (SFOE): www.bfe.admin.ch ; the Swiss Federal Office for the Environment (FOEN):www.bafu.admin.ch and the Swiss Federal Office for Spatial Development (ARE): www.are.admin.ch
Routes to Sustainable Transport
104
United KingdomPOST – Parliamentary Office of Science and TechnologyAuthor: Dr. Stephen Allen
BackgroundThe UK’s recent general election of May 2010 resulted in a Coalition Government of the Conservative andLiberal Democrat parties succeeding the previous Labour Government. At the time of writing, the shorttime period since the change in government meant that transport policy was still under development.Further details will follow after 20 October 2010 and the publication of the Spending Review, which willset out the spending plans for the years 2011-15. Nevertheless, certain information regarding theGovernment’s vision for sustainable transport, and of initial policies and short-term funding schemes, wasavailable at the time of writing and is summarised in this report.National governance for transport is led by the Department for Transport (DfT) which, together with thedevolved administrations for Scotland, Wales and Northern Ireland, sets the strategy and policy contextfor transport in the UK25. These bodies liaise with the organisations that provide transport infrastructureand services.The new Government’s vision for a more sustainable transport system was indicated recently by theSecretary of State for Transportiv. For long distance, inter-city journeys within the UK, the long-term visionis for a national, high-speed rail network to make rail travel the mode of choice for citizens. Nearer-termgoals have also been outlined, such as reform and improvement of the wider rail network. The DfT has anIntercity Express Programme, for example, that has been aiming to develop a new generation of inter-citytrains, although this programme has recently been reviewedvand awaits a decision in October 2010. Forshort-distance urban travel the aim is to make public transport, cycling and walking the most attractivemodes of transport. And for intermediate journeys across rural and suburban areas, the Governmentenvisages private cars remaining dominant but decarbonisation being achieved through a technologicalshift towards low-carbon cars such as electric vehicles. In addition, the Government aims to devolve moreresponsibility for local transport initiatives to the local level and to encourage alternatives to travel (suchas home working) where appropriate.
Energy Use for TransportThe UK’s domestic transport sector used 2360 PJHCVof delivered energy26and emitted 150 Mt CO2eqin2008, 37% and 24% respectively of the national (domestic) totalsvi,vii. Delivered energy demand for
25. Where appropriate, transport policy is designed to support wider Government goals, for example to support the climate changemitigation and energy policies of the Department of Energy and Climate Change.26. Commercial energy carriers (e.g. fuel or electricity) delivered to the end-user.
Routes to Sustainable Transport
105
transport has doubled since 1970 largely because of increased energy use for freight and passenger roadtravel as well as air travel. These modes represented 24%, 48% and 23% of energy demand respectively in2009. Petroleum products are the main form of energy used, meeting 97% of total delivered energydemand and currently providing for all air, water and road transport. In the rail sector, which accounts for3% of transport-related energy use, approximately half of the delivered energy used is in the form ofpetroleum products while half is electricity (a small but negligible quantity of coal is also used).Renewable sources of energy account for less than 2% of the energy currently used for transport. Aproportion of the electricity used by the rail sector comes from renewable sources, implying that 0.1% oftransport’s delivered energy use is in the form of renewable electricity. Liquid biofuels, meanwhile,provided 1.8% of delivered energy for transport in 2009viiivia 1044 million litres of biodiesel and 317million litres of bioethanolvi. Almost all the bioethanol and 79% of biodiesel were imported rather thandomestically produced, though capacity for biodiesel production has been estimated to double for2010viii. The use of biofuels has been encouraged by the Renewable Transport Fuels Obligation, acertificate trading scheme that came into effect in 2008 and obligates fuel providers to source a growingproportion of their fuel from renewable sources. The (recently amended) targets are 3.5% for 2010/11,4.0% for 2011/12, 4.5% for 2012/13 and 5.0% for each subsequent obligation period.
Policy and Technology Options for Sustainable TransportPolicy-making regarding sustainable transport is framed by the Climate Change Act (2008). This legislationcommits the UK to reducing greenhouse gas emissions by at least 80% by 2050 compared to 1990 levels,and three five-year ‘carbon budgets’ have been set to give a trajectory towards the 2050 target. Thebudgets limit the allowable quantity of greenhouse gas emissions over each five-year period, reflectingthe fact that the UK’s overall contribution to global greenhouse gas emissions is determined by emissionsover time, not through meeting specific targets in specific years. The requirement of the third budgetperiod (2018–2022) is that average annual emissions are 34% below 1990 levels.In addition to the implications of the carbon budgets, a significant increase in the use of renewable energyfor transport is required to meet the targets set by the EU’s Renewable Energy Directive (2009). Thisspecifies that the UK must source 10% of the delivered energy used for transport from renewable sourcesby 202027, and also that any biofuels used comply with certain sustainability criteria. The Fuel QualityDirective (2009), meanwhile, requires fuel suppliers to reduce life-cycle greenhouse gas emissions by 6%by 2020.In light of the carbon-reduction and renewable-energy targets the DfT produced a strategy for thetransport sector in 2009ix, but have not yet confirmed or updated the strategy since the formation of thenew Government in May 2010. The House of Commons Transport Committee found that the emissions-related figures of the previous strategy were confusing and created an overly optimistic impression, andstated that the DfT needs to be clearer in the way such figures are presented in the future. Although
27. Calculated on a net calorific value basis and with a cap on fuel used for air transport.
Routes to Sustainable Transport
106
longer-term details of strategy and funding are currently absent, the Coalition Government has made avariety of commitments that indicate policy direction, and have also announced some initial fundingschemes related to transport.It appears that a major area of focus will be in the area of low-emission vehicles, led by the recentlycreated cross-government ‘Office for Low Emission Vehicles’. The Coalition has committed, for example,to mandating a national recharging network for electric and plug-in hybrid vehicles, and in this contexthas continued the demonstration programme ‘Plugged-in Places’ that was initiated by the previousadministration. The aim is to build evidence for the design of a national charging infrastructure, and sofar £8.8m (€10m) has been awarded to three areas (London, Milton Keynes and the North East). A secondround of funding is planned by will be determined by the conclusions of the Spending Review. Toencourage consumer demand for electric, plug-in hybrid or hydrogen-fuelled vehicles, the recentlyconfirmed ‘Plug-in Car Grant’ reduces upfront costs by 25%, capped at maximum grant of £5000 (€5900).£43m (€50m) is available for these grants until March 2012; the level of incentive thereafter will besubject to a review in January 2010. It is important to note that the potential for these vehicles tocontribute to decarbonising the transport sector relies on the decarbonisation of electricity supplies.The Government has also recently announced support for research-and-development (R&D) via the ‘LowCarbon Vehicles Innovation Platform’. Six projects have been awarded £24m (€28m) of Governmentfunding and a total of £52m (€61m) given contributions from the private sector. The projects includedevelopment of new engines for plug-in hybrids, a lightweight electric bin wagon, lightweight materialsfor vehicle weight reduction, and new technologies using thermal energy to improve vehicle performance.Projects involving improvements to conventional vehicle technologies are particularly important in light ofthe King Review of Low Carbon Carsx, which asserted that such improvements are vital to theachievement of short-term (five to ten year) emissions-reductions for road transport. Widespreadpenetration of electric vehicles, for example, is not only uncertain but also unlikely until into the 2020sxi,as is the case for the proposed high-speed rail network.Research funded by the DfT during 2004 to 2009 has indicated that behaviour change can provide notablesustainability benefits within relatively short timescales, with three ‘Sustainable Travel Towns’demonstrating reduced car use and increased walking, cycling and bus usexii. In this context, the DfT isinvesting £58m (€68m) in cycling initiatives for England in 2010, as well as providing £40000 (€47000) tothe national transport charity Carplus for the accreditation of car clubs. In addition, £30m (€35m) offunding supported the purchase of 350 new low-carbon buses in December 2009, and a further £15m(€18m) is available for 2010. In line with the new Government’s aims to devolve more responsibility tothe local level, simplified funding streams have recently been announced together with a ‘LocalSustainable Transport Fund’ for local authorities, further details of which will follow the Spending Review.
Routes to Sustainable Transport
107
Routes to Sustainable Transport
108
EndnotesEuropean Parliamenti
IPCC (2007)EEA (2007)iiiSTOA (2008ii
United Kingdomiv. Department for Transport (10 September 2010),Sustainable Transport – Speech by Philip HammondMP, Secretary of State for Transport,www.dft.gov.uk.v. Foster, A (2010),A Review of the Intercity Express Programme,www.dft.gov.ukvi. Department of Energy and Climate Change (2010), Digest of United Kingdom Energy Statistics,www.decc.gov.ukvii. Department of Energy and Climate Change (2010), Estimated emissions of Greenhouse Gases byNational Communication source and end-user category, 1990-2008, www.decc.gov.ukviii. Department of Energy and Climate Change (2010),Digest of United Kingdom Energy Statistics,www.decc.gov.ukix. Department for Transport (2009),Low Carbon Transport: A Greener Future (A Carbon ReductionStrategy for Transport).The Stationery Office Limited: London.x. HM Treasury (2007),The King Review of low-carbon cars. Part I:the potential for CO2 reduction.TheStationery Office: London.xi. Committee on Climate Change (2010),Building a low-carbon economy – the UK’s innovation challenge.www.theccc.org.ukxii. Sloman L, Cairns S, Newson C, Anable J, Pridmore A, and Goodwin P (2010),The Effects of SmarterChoice Programmes in the Sustainable Travel Towns: Summary Report.The Department for Transport:London.