Sundhedsudvalget 2010-11 (1. samling)
SUU Alm.del Bilag 410
Offentligt
DANMAP 2010
DANMAP2010DANMAP 2010 - Use of antimicrobial agentsand occurrence of antimicrobial resistance inbacteria from food animals, food andhumans in Denmark
Statens Serum InstitutDanish Medicines AgencyNational Veterinary Institute, Technical University of DenmarkNational Food Institute, Technical University of Denmark
Editors:Helle Korsgaard ([email protected]),Yvonne AgersøNational Food Institute,Technical University of DenmarkMørkhøj Bygade 19, DK - 2860 SøborgAnette M. Hammerum ([email protected]),Line Skjøt-RasmussenDepartment of Microbiological Surveillanceand Research,Statens Serum InstitutØrestads Boulevard 5,DK - 2300 CopenhagenAuthors:National Food Institute:Yvonne Agersø, Tine Hald, Birgitte Borch Høg,Lars Bogø Jensen, Vibeke Frøkjær Jensen,Helle Korsgaard, Lars Stehr Larsen, Sara Pires,Anne Mette Seyfarth, Tina StruveStatens Serum Institut:Anette M. Hammerum, Ulrich Stab Jensen,Lotte M. Lambertsen, Anders Rhod Larsen,Eva Møller Nielsen, Stefan S. Olsen, AndreasPetersen, Line Skjøt-Rasmussen,Robert L. Skov, Marit SørumDANMAP board:National Food Institute:Yvonne Agersø, Vibeke Frøkjær JensenNational Veterinary Institute:Flemming BagerStatens Serum Institut:Anette M. Hammerum, Robert L. SkovDanish Medicines Agency:Jan PoulsenLayout:Susanne CarlssonNational Food InstitutePhotos: Colourbox and Mikkel AdsbølPrinting: Rosendahls-Schultz Grafisk A/SDANMAP 2010 - August 2011ISSN 1600-2032Text and tables may be cited and reprintedonly with reference to this report: DANMAP2010. Use of antimicrobial agents and occur-rence of antimicrobial resistance in bacteriafrom food animals, food and humans in Den-mark. ISSN 1600-2032The report is available fromhttp://www.danmap.org
This report is issued by DANMAP - The DanishIntegrated Antimicrobial Resistance Monitoringand Research Programme. It presents theresults of monitoring of antimicrobial use andantimicrobial resistance in food animals, foodand humans in 2010. The report is producedin collaboration between the National FoodInstitute, Technical University of Denmark;the National Veterinary Institute, TechnicalUniversity of Denmark; the Danish MedicinesAgency and Statens Serum Institut. TheDANMAP programme is funded jointly by theMinistry of Science, Technology and Innovationand the Ministry of Health and Prevention.
DANMAP2010DANMAP 2010 - Use of antimicrobial agents and occurrenceof antimicrobial resistance in bacteria from food animals,food and humans in Denmark
TABLE OF CONTENTS
1.
1.1.1.2.1.3.2.12.2
Introduction
About DANMAPAcknowledgementsDANRESSammendragSummary
6667
2.
Summary
914
8
3.4.
General information4.1.Textbox 1:Textbox 2:4.2.4.3.
20232426282932
Antimicrobial consumption in animals
IntroductionOne health evidence based prudent use guidelines for antimicrobialtreatment of pigs in DenmarkThe yellow card initiative - special provisions for reduction of theantimicrobial consumption in pig holdingsTotal antimicrobial consumptionAntimicrobial consumption by animal speciesIntroductionTotal consumption of both primary health care and hospital carePrimary health careHospital care
5.
5.1.5.2.5.3.5.4.
Antimicrobial consumption in humans
41
424347546170
6.
6.1.6.2.Textbox 3:
Resistance in zoonotic bacteria
SalmonellaCampylobacterOccurrence ofClostridium difficilein Danish pig farms, andin cattle and broilers at slaughterEnterococciDanish pigs are a reservoir of High-level gentamicin resistantEnterococcus faecalisassociated with infective endocarditis in humansDetection of vancomycin resistantEnterococcus faeciuminDanish broilers 15 years after the ban of avoparcinEscherichia coliZoonotic aspects ofE. coliurinary tract infectionsOccurrence of Extended spectrum β-lactamase (ESBL)-producingEscherichia coliafter selective enrichment with ceftriaxonein meat and food producing animalsEscherichia coliKlebsiella pneumoniaReduction in the prevalence of ESBL-producingKlebsiella pneumoniaeafter changing the antibiotic policy and antimicrobial consumptionat Bispebjerg HospitalPseudomonas aeruginosa
60
74
7.
7.1.Textbox 4:Textbox 5:7.2.Textbox 6:Textbox 7:
Resistance in indicator bacteria
76
77
8081828587
8.
8.1.8.2.Textbox 8:8.3.
Resistance in human clinical bacteria
89
9092
9596
4
DANMAP 2010
TABLE OF CONTENTS
8.4.8.5.8.6.Textbox 9:Textbox 10:
StreptococciEnterococciStaphylococcus aureusMethicillin resistantStaphylococcus aureus(MRSA) in Danish pig herds,broilers and cattle at slaughter, and in Danish and imported retail meatDetection of a newmecAhomologue in methicillin resistantStaphylococcus aureusfrom human samples with a possible link to cattleEscherichia colifrom pigs
969798103105
9.
Resistance in diagnostic submissions from animals9.1
106108
Appendix 1
Antimicrobial consumption in animalsAntimicrobial consumption in humansSalmonellaCampylobacterEnterococciIndicatorEscherichia coliDiagnostic submissions from animals
108
109114118125128136140142145154
Appendix 2
List of abbreviations and terminologyMaterials and methods
141
Appendix 3
DANMAP publications 2010
153
DANMAP 2010
5
1.
INTRODUCTION
1. Introduction1.1About DANMAP1.2Acknowledgements
The Danish Integrated Antimicrobial ResistanceMonitoring and Research Programme, DANMAP,was established in 1995 on the initiative of the DanishMinistry of Health and the Danish Ministry of Food,Agriculture and Fisheries, as a coordinated nationalsurveillance and research programme for antimicrobialconsumption and antimicrobial resistance in bacteriafrom animals, food and humans. The participants inthe programme are Statens Serum Institut, the NationalVeterinary Institute, the National Food Institute, and theDanish Medicines Agency. The DANMAP programmeis funded jointly by the Ministry of Health and theMinistry of Science, Technology and Innovation.The objectives of DANMAP are:• to monitor the consumption of antimicrobial agentsfor food animals and humans.• to monitor the occurrence of antimicrobialresistance in bacteria isolated from food animals,food of animal origin and humans.• to study associations between antimicrobialconsumption and antimicrobial resistance.• to identify routes of transmission and areas forfurther research studies.The monitoring of antimicrobial resistance is basedon three categories of bacteria: Human and animalpathogens, zoonotic bacteria, and indicator bacteria.Human and animal pathogens are included becausethese cause infections and they reflect primarilyresistance caused by use of antimicrobial agents in therespective reservoirs. Zoonotic bacteria are includedbecause they can develop resistance in the animalreservoir, which may subsequently compromisetreatment effect when causing infection in humans.Indicator bacteria are included due to their ubiquitousnature in animals, food and humans and their ability toreadily develop antimicrobial resistance in response toselective pressure in both reservoirs.This report, DANMAP 2010, describes the annualconsumption of antimicrobial agents and the occurrenceof resistance in different reservoirs in Denmark in 2010.Results from the monitoring program as well as fromselected research projects are presented in overviewtables and figures. In the Appendices, detailed tablesof antimicrobial consumption in animals and humansand specific MIC distributions are presented, alongwith a list of abbreviations, explanations of terminologyand description of materials and methods. A list ofDANMAP publications in the international scientificliterature in 2010 is also included.This DANMAP report is also available atwww.danmap.org.
The National Food Institute and the NationalVeterinary Institute from the Technical University ofDenmark would like to thank:• the meat inspection staff and the companypersonnel at the slaughter houses for collectingsamples from animals at slaughter. Without theircareful recording of the animals’ farm of originthe results would be less useful.• the Laboratory of Swine Diseases, Danish MeatAssociation at Kjellerup for making isolates ofanimal pathogens available to the programme.• the Danish Medicines Agency for collecting andtransmitting data on veterinary consumption ofantimicrobial agents from the pharmacies.• the staff of the Regional Veterinary and FoodControl Authorities for collection of foodsamples and isolation of bacteria.• the staff of the Zoonosis Laboratory at theNational Food Institute.• the staff of the research group of Antimicrobialresistance and molecular typing at the NationalFood Institute.• the staff of the division of Poultry, Fish and FurAnimals at the National Veterinary Institute.Statens Serum Institut would like to thank• the Departments of Clinical Microbiology inthe DANRES group - Danish Study Group forAntimicrobial Resistance Surveillance - forproviding data on resistance in bacteria fromhuman clinical samples.• the staff of the Neisseria and StreptococcusTyping Unit at SSI.• the staff of the Foodborne Pathogens Unit at SSI.• the staff of the Staphylococcus Laboratory at SSI.• the staff of the Antimicrobial ResistanceReference Laboratory and Surveillance Unit atSSI.• Maja Laursen and Jan Poulsen from the DanishMedicines Agency for providing data onconsumption of antimicrobials in humans.• Erik Villadsen from the Danish National Boardof Health for providing data on hospital activity.
6
DANMAP 2010
INTRODUCTION
1.
1.3
DANRES
The Danish Study Group for Antimicrobial ResistanceSurveillance provides data from the Departments ofClinical Microbiology (DCM) in Denmark.DCM, Hvidovre Hospital:Alice Friis-MøllerJenny Dahl KnudsenElly KristensenPia LittauerKristian SchønningHenrik WesthDCM, Rigshospitalet:Maria Kristin BjõrnsdottirMichael TvedeDCM, Herlev Hospital:Magnus ArpiHanne Wiese HallbergTina LarsenDCM, Hillerød Hospital:Dennis Schrøder HansenLisbeth NielsenDCM, Slagelse Hospital:Ram DessauOle HeltbergBent Røder
DCM, Odense University Hospital:Bente Gahrn-HansenThøger Gorm JensenUlrik Stenz JustesenDCM, Esbjerg Hospital:Kjeld Truberg JensenDCM, Vejle Hospital:Anette HolmPer SchouenborgDCM, Herning Hospital:Helga SchumacherMarianne Hedegaard SøndergaardDCM, Skejby Hospital:Svend Ellermann-EriksenKurt FuurstedBrian KristensenMarianne K. ThomsenDCM, Viborg Hospital:Jørgen PragBirgitte TønningDCM, Aalborg Hospital:Tove HøjbjergLena MortensenHenrik C. Schønheyder
DANMAP 2010
7
2
SAMMENDRAG / SUMMARY
8
DANMAP 2010
SUMMARY
2.
2. Summary2.1 SammendragDette er den femtende DANMAP rapport. DANMAP2010 beskriver det årlige forbrug af antibiotika og fore-komsten af resistens i forskellige reservoirer. Den konti-nuerlige overvågning af antibiotikaresistens og -forbruggør det muligt at analysere tendenserne i antibiotikafor-brug og -resistens over tid.DANMAP præsenterer antibiotikaforbrug til menneskerog dyr på årsbasis. Lægemiddelstyrelsen har overvågetforbruget af receptordineret medicin på patientniveausiden begyndelsen af 1990erne. Siden 2001 er al anven-delse af receptordineret medicin til dyr registreret pådyreart, aldersgruppe og besætningsniveau i VetStatdatabasen på Veterinærinstituttet, Danmarks TekniskeUniversitet.Antibiotikaforbrug til dyrI 2010 var antibiotikaforbruget til dyr i Danmark på126,9 ton, hvilket repræsenterer en 2,1 % reduktion iforhold til 2009. Faldet skyldtes hovedsagligt et mindreforbrug til svin. Størstedelen af det totale antibiotikafor-brug kan henføres til svineproduktionen (79 %), mensen mindre andel kan tilskrives kvæg- (12 %) og fjerkræ-produktionen (0,7 %).Svin:For første gang siden 2002 er der sket et fald i anti-biotikaforbruget til svin. Målt i antal antibiotika doserper svin produceret, blev forbruget i 2010 reduceret med5 % (korrigeret for eksport af 30 kg grise) sammenlignetmed 2009, men var fortsat højere end forbruget i 2008.Antibiotika forbruget pr. svin er steget med 39 % over desidste 10 år.Faldet i 2010 skete især i forbruget af tetracykliner(5 %), med der var også et reduceret forbrug af makro-lider (2 %), aminoglykosider (16 %), lincosamid/spec-tinomycin (7 %) og cefalosporiner (48 %). Tetracykliner,makrolider og pleuromutiliner, som primært bruges tilflok-medicinering i foder eller drikkevand, var fortsat demest almindelige antibiotika brugt til svin. Faldet i dettotale forbrug af antibiotika til svin var for størstedelenforbundet med et 11 % fald i ordinering af antibiotikatil fravænningsgrise med tarminfektioner. Ordinationertil so-besætninger (inkl. smågrise) med tarminfektionerfaldt med 22 %, svarende til et fald på 3 % per so-år.Faldet i det totale antibiotikaforbrug relaterer sig kun tildet andet halvår af 2010. Forbruget steg reelt med8 % i de første seks måneder i forhold til sammeperiode i 2009. I juli 2010 modtog 20 % af de danskesvineproducenter, som havde det højeste forbrug afantibiotika, et informationsbrev, der beskrev den nye‘Gult kort’ ordning. I samme måned indførte industrienet frivilligt stop for brugen af cefalosporiner til svin.Samlet er dette en sandsynlig forklaring på den 13 %reduktion i antibiotikaforbruget til svin, der blev obser-veret i anden halvdel af 2010 sammenlignet med sammeperiode året før.Kvæg:Antibiotikaforbruget til kvæg var 14,6 ton i 2010,og har været relativt stabilt på omkring 14 til 15 tonsiden 2005. I denne periode er andelen af smalspektrede(beta-lactamase følsomme) penicilliner til køer stegetfra 48 % til 59 % af doser til systemisk behandling, mensmakrolider faldt fra 11 % til 3 %, hvilket er i overens-stemmelse med de officielle anbefalinger. Også til kalvefaldt forbruget af makrolider fra 35 % af forbruget i 2009til 24 % af forbruget i 2010, mens forbruget af tetra-cykliner steg fra 26 % til 30 % af forbruget, hvormedtetracykliner igen blev de mest anvendte antibiotika tilkalve. Der var meget få ordinationer af fluorokinoloneri 2010 (1 kg i alt). Forbruget af tredje og fjerde genera-tions cefalosporiner til intramammær og systemisk be-handling faldt med hhv. 29 % og 17 % i forhold til 2009.Fjerkræ:Det totale antibiotikaforbrug til fjerkræ faldtmed 18 % i 2010 i forhold til 2009 (fra 1.070 kg til 879kg), men niveauet ligger stadig højere end i perioden fra2001 til 2008. Antibiotikaforbruget i kyllingeproduk-tionen er generelt lavt, og sygdomsudbrud hos nogle fåproducenter kan medføre betydelige fluktuationer i dettotale antibiotikaforbrug. I 2009 var der sygdomspro-blemer i adskillige fjerkræflokke, hvilket medførte etrelativt højt forbrug. Disse problemer synes løst i æglæg-gere samt i opdræt til slagtekyllinger. I slagtekyllinge-flokkene var antibiotikaforbruget i 2010 fortsat relativthøjt i forhold til perioden 2001–2008. Forbruget på0,14 ADDkgpr. kg kyllingekød produceret er imidlertidfortsat lavt i forhold til andre dyrearter, og også megetlavt i forhold til forbruget i kyllingeproduktionen i ikke-skandinaviske lande.Antibiotikaforbruget i kalkunproduktionen variererogså markant fra år til år. Sygdomsproblemer medførte i2009, at forbruget var højt sammenlignet med de forrigeår. En vaccinationskampagne modPasteurella multocidasynes at have reduceret sygeligheden, og har medførtat antibiotikaforbruget i 2010 var på det laveste niveausiden 2005 (0,62 ADDkgpr. kg kød produceret).I 2010 blev fluorokinoloner ikke ordineret til kalkun-,æglægger- og i slagtekyllingeproduktionen. Forbruget affluorokinoloner i fjerkræproduktionen har været falden-de siden 2006, hvor fluorokinoloner udgjorde 7 % af dettotale forbrug for både kyllinger/høns og kalkuner.Akvakultur:Det totale forbrug i 2010 var på 3.060kg, en 7 % reduktion i forhold til 2009. Faldet skyldesprimært et skifte i præparatvalg. Havbrug har generelt ethøjt antibiotikaforbrug pr. kg fisk produceret, sammen-lignet med andre dyregrupper, men forbruget har væretfaldende siden 2006, hvor forbruget toppede med 13ADDkgpr. kg fisk produceret, i forbindelse med usæd-vanligt varm sommer. Antibiotikaforbruget i akvakul-tur er kraftigt påvirket af vandtemperaturen. Faldet erdesuden relateret til en markant forbedret vaccinations-strategi i samme periode (2006-2010), hvor forbrugeter faldet med 51% i havbruget, til 9 ADDkgpr. kg fiskproduceret. Forbruget i ferskvandsfisk ligger mere stabiltomkring 2 ADDkgpr. kg fisk produceret. Sulfonamidkombineret med trimethoprim samt kinoloner (oxolin-syre) var de mest anvendte antibiotika til fisk.DANMAP 20109
2.
SUMMARYKæledyr og heste:Antibiotikaforbruget til kæledyr ogheste var i 2010 på 3 tons. Forbruget er estimeret ud fraordinationer til disse dyrearter samt salg af præparatertil smådyrs- og hestepraksis. For 2010 blev det totaleforbrug af fluorokinoloner estimeret til 14 kg, hvorafstørstedelen (>13 kg) blev brugt til kæledyr. Dette svarertil 72 % af det totale veterinære forbrug af fluorokino-loner. Amoxicillin kombineret med clavulansyre vardet mest brugte antibiotika til kæledyr (539 kg), hvilketudgør en stigning på 3% sammenlignet med 2009.I 2010 var forbruget af cefalosporiner til kæledyr på 320kg. Dette var primært 1. generations cefalosporiner tiloral behandling, men forbruget af 3. generations og 4.generations cefalosporiner var omkring 3 kg, svarendetil 1,8 % af det totale veterinære forbrug.Antibiotikaforbrug til menneskerPrimærsektor og hospitalssektor:Det totale forbrugaf antibiotika til systemisk brug i mennesker (primær-sektor og hospitalssektor) steg med 5 %: fra 17,89 DDDpr. 1000 indbyggere pr. dag (DID) i 2009 til 18,84 DIDi 2010. Hospitalsforbruget udgjorde 10 % af det totaleforbrug. Stigningen i forbruget blev kun observeret iprimærsektoren. Siden 2001 er det totale forbrug stegetmed 4,54 DID (32 %).Primærsektor:I 2010 steg det totale antibiotikaforbrug(J01) i primærsektoren med 6 % til 16,93 DID sammen-lignet med 15,95 DID i 2009. Det er det højeste forbrug,der er målt i DANMAPs historie. Beta-laktamase føl-somme penicilliner repræsenterede den største gruppeaf antibiotika i 2010 (31 %) og penicilliner (J01C)udgjorde 62 % af det totale forbrug i 2010.Forbruget af bredspektrede antibiotika var 6,48 DID i2010; en stigning på 0,53 DID i forhold til 2009. Forbru-get af antibiotika steg for alle grupper af antibiotika medundtagelse af sulfonamider.Der kan være flere forskellige forklaringer på det sti-gende forbrug: 1) en stigning i antallet af behandledepatienter; 2) udbrud medMycoplasma pneumoniaeianden halvdel af 2010, som medførte et øget forbrugaf beta-laktamase sensitive penicilliner til empiriskbehandling af nedre luftvejsinfektioner og makrolidertil behandling af bekræftetM. pneumoniaepneumoni –ifølge de nationale retningslinjer; og 3) et øget forbrug af”kombinationspenicilliner”, sandsynligvis som følge afbedre opslutning til de ændringer i behandlingsvejled-ningerne for patienter med kronisk obstruktive lungeli-delser, der kom for få år siden.Siden 2001 er det totale forbrug (J01) i praksis stegetmed 32 %; DDD er den forbrugsindikator, som er stegetmest, men også antallet af behandlede patienter og antalpakninger er steget i samme periode.Hospitalssektor:Det totale forbrug af antibiotika i helehospitalssektoren (rehabiliteringscentre, hospice, pri-vat-, psykiatriske-, specialiserede- og somatiske hospita-ler) lå på 1,91 DID i 2010 (svarende til forbruget i 2009).Siden 2001 er det totale forbrug steget med 0,46 DID(31 %). Bredspektrede antibiotika udgjorde 67 % af dettotale forbrug på hospitalerne i 2010 ligesom i 2009.Somatiske hospitaler:Det totale antibiotikaforbrug stegmed 3 % opgjort i DDD pr. 100 sengedage (DBD) (fra85,03 DBD i 2009 til 87,72 DBD i 2010), mens det faldtmed 4 % opgjort i DDD pr. 100 indlæggelser (DAD) iforhold til 2009 (fra 297,36 DAD til 284,89 DAD).Antallet af DDD i 2010 var det samme som i 2009, mensantallet af indlæggelser steg og antallet af sengedagefaldt i forhold til 2009.For tre grupper af antibiotika steg forbruget fra 2009 til2010: kombinationspenicilliner steg med1,48 DBD(26 %); carbapenemer steg med 0,88 DBD (28 %) ogkombinationen af sulfonamider/trimethoprim steg med0,76 DBD (34 %). Forbruget faldt fra 2009 til 2010 forfølgende stofgrupper: penicilliner med udvidetspektrum faldt med 0,76 DBD (5 %); beta-laktamasefølsomme penicilliner faldt med 0,41 DBD (4 %);3. generations cefalosporiner faldt med 0,16 DBD(11 %); og fluorkinoloner faldt med 0,27 DBD (2 %). I2010 udgjorde cefalosporiner 20 % af det totale forbrugpå de somatiske hospitaler. Penicilliner med udvidetspektrum (17 %), fluorkinoloner (12 %) og beta-lakta-mase følsomme penicilliner (11 %) var andre af de mestanvendte antibiotika i 2010.Over de sidste 10 år er det totale forbrug steget med39,40 DBD (82 %) eller 35,13 DAD (14 %) afhængig afnævneren. Det er vigtigt at påpege, at antallet af udskri-velser er steget med 18 % i løbet af de sidste 10 år, mensantallet af sengedage er faldet med 26 % som følge afændringer i hospitalssektoren.Det totale antibiotikaforbrug til dyr faldt i 2010,og for første gang siden 2002 faldt forbruget tilsvin. Derimod steg det humane antibiotikaforbrugtil det højeste niveau siden starten af DANMAPprogrammet i 1995. Stigningen i forbruget blevkun observeret i primærsektoren, og kunne delvistforklares med en stigning i antallet af behandledepatienter og et udbrud medMycoplasmapneumoniaei anden halvdel af 2010.
Resistens i zoonotiske bakterier
Zoonotiske bakterier somSalmonellaogCampylobacterer sygdomsfremkaldende bakterier, der kan overføresfra dyr til mennesker, enten via direkte kontakt med dyreller via kontaminerede fødevarer.De højeste niveauer af resistens blev fundet i importeretkalkunkød, hvor ingen af de isoleredeS.Typhimuriumisolater var fuldt følsomme overfor alle 16 antibiotikainkluderet i testpanelet, og 93 % af isolaterne var multi-resistente. Desuden steg apramycin, gentamicin ogstreptomycin resistensen signifikant fra 2009 til 2010.BlandtSalmonellaTyphimurium isolater fra danske svinblev der fra 2009 til 2010 observeret signifikante stignin-ger i antibiotikaresistens overfor ampicillin, streptomy-cin og tetracyklin. Der var ingen signifikante ændringeri resistensforekomsten i dansk svinekød, men tetracyk-linresistensen iS.Typhimurium isolater fra dansk svi-nekød (27 %) var signifikant lavere end blandt isolaterfra danske svin (47 %).S.Typhimurium fra importeretsvinekød havde en højere resistensforekomst (for 8 ud
10
DANMAP 2010
SUMMARYaf 16 testede antibiotika) sammenlignet med isolater fradansk svinekød.I 2010 blev ingenS.Typhimurium isolater fra svin,kvæg, dansk svinekød, importeret svinekød og impor-teret kylligekød fundet resistente overfor cefalosporinereller fluorokinoloner. KunS.Typhimurium isolaterfra importeret kalkunkød var resistente overfor disseantibiotika. Blandt de humane tilfælde blev der obser-veret en højere ciprofloxacin resistens hos de rejserelate-rede tilfælde (14 %) i forhold til de tilfælde, som havdeerhvervet infektionen i Danmark (4 %). Cefalosporinresistens blev kun rapporteret fra rejserelaterede tilfælde(3 %), eller hvor oprindelsen af infektionen var uoplyst(1 %).Klonal spredning har haft stor indflydelse på udbredel-sen af antibiotikaresistens blandtSalmonellabakteri-erne; dette gælder især forS.Typhimurium. Siden 2005har man blandtS.Typhimurium isolater fra svin kunnetobservere en parallel stigning (14 %) i resistens over-for ampicillin (A), streptomycin (S), sulfonamid (Su)samt tetracyklin (T). Dette resistensmønster (ASSuT)forekommer ofte i fagtyperne DT120 og DT193, som eralmindeligt forekommende i svin. En anden almindeligtforekommende klon blandtS.Typhimurium fra svin erisolater med resistens overfor ASSuT samt chloramp-henicol (C), og dette resistensmønster (ACSSuT) rela-teres primært til fagtypen DT104. Blandt de humaneS.Typhimurium isolater blev denne sammenhæng mellemresistensmønstre og fagtyper også observeret.I de seneste år er der udarbejdet et smittekilderegnskabforSalmonella,som angiver de vigtigste fødevarebårnekilder til human salmonellose i Danmark. Denne modelblev benyttet til at estimere kilderne til de humaneinfektioner forårsaget afS.Typhimurium med resistensoverfor ampicillin, sulfonamid og tetracyklin (ASuT).Modellen estimerede, at dansk svinekød kunne tilskriveset udbruds-relateret ASuT-tilfælde og fem sporadiskeASuT–tilfælde, importeret svinekød 41 ASuT-tilfælde,endvidere blev et ASuT-tilfælde tilskrevet importeretkalkunkød.SalmonellaEnteritidis er relativt sjælden i dansk fjerkræ-produktion og kun få isolater var til rådighed fra danskfjerkræ og fjerkrækød i 2010. Kun isolater fra importeretkyllingekød var resistente overfor nalidixansyre og ci-profloxacin. Humant var resistensen overfor ciprofloxa-cin signifikant højere i rejseassocierede tilfælde (21 %)end i tilfælde erhvervet i Danmark (8 %).I 2010 var der ingen signifikante ændringer i resistens-forekomsten blandtCampylobacter jejuniisolater fradanske slagtekyllinger og kvæg eller blandtCampylobac-ter coliisolater fra svin. Siden 2005 er der sket en svagstigning i forekomsten af tetracyklin resistens blandtC.jejunifra danske slagtekyllinger og kvæg samt iC. colifra danske svin. I samme periode var tetracyklin et af demest almindelige antibiotika ordineret til svin.Som i de foregående år indeholdt importeret kyllinge-kødC. jejunimed signifikant højere resistens overforciprofloxacin (50 %) sammenlignet med dansk kyllinge-kød (17 %).Blandt de humaneC. jejuniisolater fra tilfælde erhverveti Danmark, var der i 2010 ingen signifikante ændringeri resistensforekomsten i forhold til 2009. Ciprofloxa-cin resistensen blandtC. jejuniisolater fra infektionererhvervet herhjemme (25 %) var signifikant lavere endblandt isolater fra rejserelaterede tilfælde (80 %).Forekomsten afClostridium difficilei svinebesætnin-ger, samt hos kvæg og kyllinger på slagterierne blev forførste gang undersøgt i 2010.C. difficileblev isoleret fra15 % af svinebesætningerne, 15 % af kvæget og 3 % ofkyllingeflokkene. Alle tre toksin-gener blev påvist i73 % af svine-isolaterne og 24 % af kvæg-isolaterne,mens et eller to toksin-gener blev påvist i de resteredeisolater. Isolater med tre toksin-gener blev PCR riboty-pet, og PCR ribotype 078 blev fundet både blandt svine-og kvægisolater. Ribotype 078 forekommer hos menne-sker, mens de resterende PCR ribotyper er sjældent elleraldrig fundet i humane isolater i Danmark. Isolaterneblev testet for resistens overfor fem antibiotika, og defleste isolater var resistente overfor clindamycin (87 %),mens resistens overfor de andre antibiotika var relativlav.Fundet afC. difficile078 i svin er forventelig, da dennetype er almindelig blandt svin. Men nogle af de andretyper med alle tre toksin-gener samt deletioner itcdCkan muligvis forårsage alvorlig human sygdom. Denpotentielle humane risiko ved forekomst afC. difficilemedtcdAogtcdBtoksin-gener i husdyr bør undersøgesnærmere.Resistensforekomsten i S. Typhimurium fra svin stegi 2010, mens forekomsten i dansk svinekød forblev påsamme niveau som i 2009. Resistensforekomsten i S.Typhimurium fra dansk svinekød og i Campylobacterjejuni i dansk kyllingekød var signifikant lavere endi isolater fra det importerede kød. Et tilsvarendemønster blev observeret blandt de humane S.Typhimurium og Campylobacter jejuni infektioner,hvor rejserelaterede tilfælde havde signifikant højereresistensforekomst sammenlignet med tilfælde somhavde erhvervet infektionen i Danmark.Resistens i indikatorbakterier
2.
Indikatorbakterier er inkluderet i overvågningspro-grammet for at give information om de generelle resi-stensniveauer i sunde og raske husdyr.BlandtEnterococcus faeciumisolater fra svin og slagte-kyllinger blev der observeret signifikante fald i resistensoverfor tetracyklin, penicillin og ampicillin fra 2009til 2010. Desuden faldt forekomsten af streptomycinresistens i isolater fra svin, og resistens overfor quinu-pristin/dalfopristin og avilamycin i isolater fra slagtekyl-linger. Sammenlignet med importeret kyllingekød varresistensforekomsten signifikant lavere i dansk produce-ret kyllingekød (for 7 ud af 16 testede antibiotika). Vedbrug af selektive opformeringsmetoder blev der påvistvancomycin resistenteE. faeciumi 47 % af slagtekyllin-gerne. Dette indikerer udbredt forekomst af VRE i lavekoncentrationer i en stor del af besætningerne, selv ombrug af vækstfremmeren avoparcin har været forbudt iDanmark siden 1995.I 2010 havdeEnterococcus faecalisisolater fra slagtekyl-linger signifikant lavere resistens overfor tetracyklin,DANMAP 201011
2.
SUMMARYerythromycin, streptomycin og salinomycin sammenlig-net med 2009, mens det blandt isolater fra svin kun vartetracyklin resistensen, som blev reduceret signifikant.Faldet i tetracyklin resistens blandt enterokok isolaterfra svin kan være relateret til de registrerede fald i for-bruget af tetracyklin.En undersøgelse viste, at det var den samme klon af ’højniveau’ gentamicin-resistenteE. faecalis(ST16) som blevpåvist i svin, svinekød, raske personer og fra patientermed infektiøs endokardit. Dette indikerer en zoonotisksammenhæng.I 2010 var der ingen signifikante ændringer i resistens-forekomsten blandt indikatorE. coliisolater fra svin ogslagtekyllinger sammenlignet med 2009. Der var en sig-nifikant stigning i tetracyklin resistensen blandt isolaterfra kvæg (fra 2 % til 9 %), formentlig relateret til en 10%stigning i tetracyklinforbruget til kalve i 2010. I 2010blev der ikke observeret fluorokinolon resistens blandtE. colifra danske svin og kvæg, derimod var 8 % afE.coliisolater fra slagtekyllinger fluorokinolon resistente.I 2002 blev brugen af fluorokinoloner til behandling afhusdyr begrænset, og forbruget har siden da genereltværet lavt. Forekomsten af fluorokinolon resistens i kyl-lingeproduktionen kan hænge sammen med, at forbru-get her er relativt højere end i de andre husdyrgrupper.Som forCampylobacterog enterokokker var resistens-forekomsten iE. coliisolater fra importeret kyllingekødsignifikant højere end i isolater fra dansk kyllingekød(for 13 ud af 16 testede antibiotika), og 60 % af isolater-ne fra importeret kyllingekød var multiresistente. Cef-tiofur resistens (og dermed ESBL) blev i 2010 observeretfor første gang uden brug af selektiv opformering i etE.coliisolat fra dansk kyllingekød (1 %). Fluorokinolonresistensen var ti gange højere i importeret kyllingekød(41 %) end i dansk produceret kyllingekød (4 %).BlandtE. coliisolater fra dansk svinekød faldt sulfon-amid resistensen signifikant fra 38 % til 19 %, og i 2010var resistens overfor tetracyklin og sulfonamid signi-fikant lavere iE. coliisolater fra dansk svinekød sam-menlignet med isolater fra importeret svinekød. Fluoro-kinolon resistensen i dansk svinekød var fortsat lav (etisolat) i forhold til 4 % afE. coliisolaterne fra importeretsvinekød.BlandtE. coliisolater fra kvæg og fra dansk og importe-ret oksekød var resistensen lav.ESBL-producerende bakterier er resistente overfor bred-spekterede cefalosporiner, der ofte bruges til behandling.Derfor er forekomsten af disse, selv i et lavt niveau, etpotentielt alvorligt problem. Ved brug af selektive op-formeringsmetoder blev forekomsten af disse bakterierundersøgt i svinebesætninger, hos kvæg og kyllinger påslagterierne samt i kød fra detailforretninger og engros-lagre. Den højeste forekomst af ESBL-producerendeE.colihos dyrene blev påvist i kyllingeflokke på slagteriet(27 %), på trods af at cefalosporiner ikke har været brugti den danske kyllingeproduktion de sidste ti år. I kød-prøverne blev de højeste forekomster af ESBL-produce-rendeE. colipåvist i importeret (50 %) og dansk (8.6 %)kyllingekød. Forekomsten af ESBL-producerendeE. colifra importeret kyllingekød var i 2010 signifikant højereend i 2009.Tilstedeværelsen af de forskellige ESBL-gener afhangaf dyrearten. CMY-2 og SHV-2 blev ofte fundet hosslagtekyllinger, mens CTX-M-8 kun blev påvist hoskvæg. Flere af ESBL-generne iE. colifra dyr og kød ertidligere fundet i humaneE. coliisolater. Slagtekyllin-ger og kyllingekød synes at være et vigtigt reservoir forESBL-producerendeE. coli,også i lande som Danmark,hvor brugen af cefalosporiner i kyllingeproduktionenfor længst er ophørt eller aldrig har været brugt.I Danmark kan slagtekyllinger og kyllingekød væreet vigtigt reservoir for ESBL-producerendeE. coli,selvom cefalosporiner ikke benyttes i kyllingepro-duktionen. Der er stadig en lav forekomst af resistensoverfor vancomycin og quinupristin/dalfopristinblandtE. faeciumisolater fra svin, selvom brugen afvækstfremmere har været forbudt i mere end ti år.
Resistens i bakterier fra diagnostiske indsendelserfra mennesker
Rapporteringen af antibiotikaresistens i bakterier
fra diagnostiske indsendelser fra mennesker er baseretpå frivillig indsendelse af data fra DANRES gruppen,som dækker de klinisk mikrobiologiske afdelinger iDanmark. De eneste undtagelser omfatter methicillinresistenteStaphylococcus aureusog invasiveStreptococ-cus pneumoniae,som er anmeldepligtige. Data vedrø-rende disse bakterier kommer fra referencelaboratori-erne på SSI.BlandtE. coliisolater fra blod var 3. generations cefalo-sporin resistensforekomsten i 2010 på 7 %, det sammeniveau som i 2009. Niveauet var højere end i de andrenordiske lande i 2009. I 2010 steg gentamicin resistens-forekomsten til 6 %. Ciprofloxacin resistensen var 14 %i 2010 (min 7 %, max 22 % for de individuelle KMAer),dette niveau var det samme som i 2009. IngenE. coliiso-later fra blodinfektioner var carbapenem resistente. I lø-bet af de seneste 10 år er resistensen overfor cefuroxim,ciprofloxacin og gentamicin steget signifikant. Resistensoverfor 3. generations cefalosporiner er rapporteret tilDANMAP siden 2008; i denne periode er resistensfore-komsten steget.BlandtE. coliisolater fra urin fra hospitaler var 3. gene-rations cefalosporin resistensforekomsten på 5 % i 2010,det samme niveau som i 2009. For de følgende antibio-tika var der et lille fald (1 %) i resistensforekomsten:ampicillin (41 %), sulfonamid (35 %), ciprofloxacin(12 %) og cefuroxim (2. generations cefalosporin) (5 %).BlandtE. coliisolater fra urin fra praksis var 3. genera-tions cefalosporin resistensforekomsten på 5 % i 2010,det samme niveau som i 2009. Nalidixansyre resistensensteg fra 14 % i 2009 til 15 % in 2010. Fra 2009 til 2010var der små fald i resistensforekomsten (1-2 %) for am-picillin (40 %) og sulfonamid (37 %).BlandtKlebsiella pneumoniaeisolater fra blod var resi-stensforekomsten for 3. generations cefalosporiner9 % (min. 4 %, max 24 %), hvilket er samme niveau somi 2009. Denne resistensforekomst var højere, end hvadder blev rapporteret til EARS-Net for de andre nordiske
12
DANMAP 2010
SUMMARYlande i 2009 og på samme niveau som i flere sydeuropæi-ske lande. Forekomsten af 3. generations cefalosporin re-sistens var signifikant højere i den østlige del af Danmark(23 %) sammenlignet med den vestlige del (9 %). Bådefluorkinolon resistensen (ciprofloxacin 11 %, nalidixan-syre 17 %) og gentamicin resistensen var højere end i deandre nordiske lande og på samme niveau som i fleresydeuropæiske lande. Fra 2009 til 2010 var der et fald iresistensforekomsten for gentamicin, ciprofloxacin ogcefuroxim; dette fald sås mest forK. pneumoniaeisolaterpå Sjælland. Dette kunne delvis forklares ved interven-tion på hospitaler i Københavnsområdet (Tekstboks 8).IngenK. pneumoniaeisolater fra blod var carbapenemresistente.BlandtKlebsiella pneumoniaeisolater fra urin var fore-komsten af resistens for 3. generations cefalosporiner12 % i isolater fra hospitaler og 7 % i isolater fra primær-sektoren, dette var på samme niveau som i 2009. Bådefor isolaterne fra hospital- og praksis-urinprøverne varforekomsten af resistens for 3. generations cefalospo-riner og ciprofloxacin signifikant højere i den østligedel af Danmark (Sjælland) end i den vestlige del (Fynog Jylland). Der var et signifikant fald i forekomsten affluorkinolon resistens iK. pneumoniaeurinisolater frahospitalerne fra 2009 til 2010 (i 2010: ciprofloxacin 14 %,nalidixansyre 20 %). Sulfonamid resistensen steg til29 % blandt urinisolater fra hospitalerne og til 34 %blandt isolaterne fra praksis.Carbapenem (meropenem) resistens var til stede iK. pneumoniaeurinisolaterne fra både hospitals- ogpraksissektor. Et af de carbapenem resistente isolaterproducerede det nye carbapenemase enzym NewDelhi Metallo-β-lactamase 1 (NDM-1). Dette isolatvar resistent overfor alle testede antibiotika undtagentigecyclin og colistin. Forekomsten af carbapenemresistens iK. pneumoniaeer ikke anmeldepligtig; derforkunne der ikke beregnes en frekvens for carbapenemresistens.ESBL-producerendeE. coliogK. pneumoniaeer ikkeanmeldepligtige i Danmark, og de var kun rapporterettil DANMAP fra få KMAer; det var derfor ikke muligt atberegne forekomsten.Resistensforekomsten iPseudomonas aeruginosaisolaterfra blod var lav for alle de testede antibiotika.I 2010 var penicillin og erythromycin resistensfore-komsten stadig lav blandtStreptococcus pneumoniaeoggruppe A, B, C og G streptokokker.Forekomsten af ampicillin resistens iEnterococcusfaeciumisolater fra blod steg i 2010 til 92 %. Forekom-sten af vancomycin resistens var 1.8 % hosE. faeciumogmindre end 1 % iE. faecalisblodisolater. I 2010 var deret udbrud med vancomycin resistente (vanA)E. faeciumpå Aarhus Universitetshospital. Dette udbrud er stadigved at blive undersøgt. Høj niveau gentamicin resistens(HLGR) fra blodinfektioner blev kun testet på én afde-ling for klinisk mikrobiologi. Her var 36 % af de testedeE. faecalisisolater HLGR og 74 % af de testedeE. faeciumisolater HLGR.I 2010 blev der indrapporteret 1.418 tilfælde afStaphy-lococcus aureusbakteriæmi svarende til en incidens på
2.
24.6 pr. 100.000 indbyggere (uændret fra 2009). I alt 20(1.4 %) var forårsaget af methicillin resistenteS. aureus(MRSA). Dette er på samme niveau som i 2009 og erfortsat blandt de laveste incidenser observeret i Europa.Frekvensen af resistens overfor fusidinsyre og norfloxacinsteg, mens frekvensen af resistens overfor øvrige antibio-tika lå på samme niveau som de foregående år.Antallet af nye tilfælde af MRSA var i 2010 1.097 sam-menlignet med 817 i 2009. Antallet var det højeste i mereend 25 år. Stigningen blev set både blandt tilfælde erhver-vet i udlandet (247 vs. 156) og tilfælde erhvervet i Dan-mark (852 vs. 661). For tilfælde i Danmark skyldes dettespecielt flere tilfælde i gruppen ”samfundserhvervet, medrapporteret kontakt til hospital/plejehjem indenfor desidste 12 måneder” (169 vs. 81). Hos 129 af disse var derdog ingen kendt MRSA eksponering; stigningen i dennegruppe kan således skyldes bedre rapportering af hospi-tals-/plejehjemskontakt. Antallet af hospitalserhvervedetilfælde er fortsat lavt og på samme niveau som i 2009(62 vs. 53).For samfundserhvervede tilfælde uden kendt hospitals/plejehjemskontakt er der set en signifikant ændring,således at der i 2010 er betydelig flere, der har rapporte-ret kendt eksponering for MRSA. Dette gælder både forpatienter med infektioner samt personer, der er bærere afMRSA (screeningsprøver).Der blev i 2010 set en signifikant stigning i antallet afhumane MRSA af typen CC398, der har relation til svin;fra 40 tilfælde i 2009 til 109 i 2010. I 15 af disse tilfældehar personerne ikke haft direkte kontakt til svin eller bori husstand med én, der har direkte kontakt til svin; dettekan betyde, at MRSA CC398 er begyndt at adaptere sig,således at den lettere smitter fra menneske til menneske.Hovedparten af disse 15 personer bor i nærområde tilandre personer med CC398, eller hvor der er konstateretMRSA CC398 i svin. Der er fortsat ingen tegn til spred-ning til egentlige byområder, og der er således fortsatingen tegn på, at MRSA CC398 spredes via kød.I 2010 blev erkendt et nyt gen, der koder for methicillinresistens, kaldetmecAlga251.Disse stammer var negativemed hidtidige detektionsmetoder. I 2010 var der i alt 21personer smittet med denne type. Undersøgelse af tidlige-re års stammer har vist, at disse har spredt sig i Danmarksiden 2004.Forekomsten af 3. generations cefalosporin resistenteE.coliogK. pneumoniaefra blod- og urinvejs-infektionervar på samme niveau som i 2009. Forekomsten afresistens for tredje generations cefalosporiner ogciprofloxacin var højere iK. pneumoniaeisolater fraSjælland sammenlignet med forekomsten på Fyn og iJylland. Et interventionsstudium på Bispebjerg Hospitalviste, at det er muligt at nedbringe antallet af resistenteK. pneumoniaeisolater.De flesteE. faeciumisolater var ampicillinresistente.Resistensforekomsten var stadig lav hosP. aeruginosaog streptokokker.Antallet af hospitalserhvervede MRSA var uændret,mens stigningen i MRSA infektioner generelt skyldesen spredning i samfundet udenfor hospitalerne. Der varen stigning i antallet af humane MRSA CC398, en typesom er associeret med kontakt til svin.DANMAP 201013
2.
SUMMARY
2.2 SummaryThis is the 15th DANMAP report. DANMAP 2010 de-scribes the annual consumption of antimicrobial agentsand the occurrence of resistance in different reservoirs.The continuous monitoring of antimicrobial resistanceand consumption makes it possible to analyse trendsover time.DANMAP presents the use of antimicrobial agents inhumans and animals. In humans, the use of prescriptionmedicines has been monitored by the Danish MedicinesAgency at the level of the individual patient since theearly 1990s. In animals, data on all medicines prescribedby veterinarians for use in animals have been registeredat farm and species level by the VetStat program at theVeterinary Institute (Technical University of Denmark)since 2001.Antimicrobial consumption in animalsIn 2010, the total veterinary consumption of antimi-crobial agents amounted to 126.9 tonnes, representinga 2.1% decrease relative to 2009, which was attributedto a decrease in consumption in pigs. The antimicrobialconsumption in pigs, cattle and poultry comprised 79%,12%, and 0.7% of the total veterinary consumption,respectively.Pigs:For the first time since 2002, the totalantimicrobi-al consumption in pigsdecreased. The decrease in con-sumption was 5% measured in doses per pig produced(adjusted for export of pigs around 30 kg) comparedwith the 2009 level, but remained above the 2008 level(by 7%). Over the past decade, the consumption per pigproduced has increased by 39% (2001–2010).The decrease in 2010 was mainly in use of tetracyclineswith a reduction of 100.5 tonnes, representing a 5%decrease per pig produced. Also the use of macrolides(2%), aminoglycosides (16%), lincosamides/spectino-mycin (7%) and cephalosporins (48%) was reduced.Tetracyclines, macrolides and pleuromutilins mainlyused for oral therapy, continued to be the most com-monly used antimicrobial agents in pigs throughout2001–2010.The overall decrease in consumption was mainly associ-ated with an 11% decrease in prescription for weaningpigs primarily for gastrointestinal infections, but alsodecreasing prescription for sow herds was observed. Theconsumption in sow herds (including piglets) decreasedby 3% per sow-year, related to a 22% decrease in pre-scription for gastrointestinal disease.The decrease in consumption in 2010 was entirely relat-ed to the second half of the year, while in the first half ofthe year, the consumption increased by 8% compared tothe same period in 2009. The decrease in use of cepha-losporins was related to a voluntary ban by the industryenforced in July 2010. The same month, the “yellowcard” intervention was announced with an informationletter to part of the pig farmers, representing the farmswith the 20% highest consumption per pig (Textbox
2). This is a likely explanation for the 13% reduction inthe second half year compared with the same period in2009.Cattle:In 2010, approximately 14.6 tonnes of antimi-crobial agents were prescribed for cattle; overall, theconsumption has been stable since 2005, with a smallincrease in 2009. Since 2005, the proportional use ofbeta-lactamase sensitive penicillins for cows has beencontinuously increasing from 48% to 59%, while use ofmacrolides has decreased from 11% to 3%, in accord-ance with the official guidelines. In calves, the use ofmacrolides decreased from 35% in 2009 to 24% in 2010,while tetracyclines increased from 26% to 30% of the to-tal consumption, becoming the major drug of choice asbefore 2006. In 2006–2009, macrolides were the majordrug of choice; the reduction in use of macrolides forcalves from 35% in 2009 to 24% in 2010, was in accord-ance with the official guidelines.The use of fluoroquinolones in cattle was only onekg. The use of 3rd and 4th generation cephalosporinsdecreased both for systemic and intramammary use, by17% and 29% respectively, as compared to 2009. Overthe past decade, the highest consumption of 3rd and 4thgeneration cephalosporins for cattle was in 2008 (a totalof 92 kg).Poultry:The consumption ofantimicrobial agents inpoultrydecreased by 18% to 879 kg in 2010 comparedwith 2009, but was higher than the levels in previousyears, 2001–2008.The antimicrobial consumption in domestic fowl (Gallusgallus)is generally at a very low level. Therefore, diseaseoutbreaks in a few farms affect importantly the nationalconsumption in poultry causing considerable fluctua-tions. In 2009, increasing disease problems caused asteep increase in consumption [DANMAP 2009]. Theseproblems appeared to be under control in 2010 for thebreeding and rearing for layer production, and rearingfor broiler production.For broilers, an additional increase was observed in2010, mainly in the prescription of amoxicillin. Theconsumption per broiler produced (including breed-ing and rearing) was unchanged at 0.14 ADDkgin 2010compared with 2009, but this was more than double ofthe consumption during 2001–2008.The antimicrobial consumption in turkeys also fluctu-ates significantly between years. The consumption wasvery high in 2009 compared with previous years but avaccination campaign (Pasteurellamultocida)seemedto be successful in the combat of the problems, causinga decrease in antimicrobial consumption to the lowestlevel since 2005.In 2010, fluoroquinolones were used neither in the tur-key production nor inGallus gallus;the use of fluoro-quinolones has been decreasing since 2006 when fluo-roquinolones comprised 7% of the consumption both inGallus gallusand in turkey production.
14
DANMAP 2010
SUMMARYAquaculture:The antimicrobial consumption in aqua-culture decreased by 7% to 3,060 kg in 2010, continuingthe decrease observed in 2009. This was mainly due to achange in choice of antimicrobial agent towards oxolinicacid. The consumption is generally high in salt wateraquaculture and peaked in 2006 reaching 13 ADDkg/kg fish produced, due to unusually high summer tem-peratures. Since then the consumption has decreasedby 51% to 9 ADDkg/kg fish produced, partly because ofvariation i water temperature, partly due to a gradualimprovement of vaccination strategies. The consump-tion in fresh water is more stabile around 2 ADDkg/kg fish produced. In previous years the major class ofantimicrobial was sulfonamide/trimethoprim, followedby quinolones (oxolinic acid).Companion animals:The consumption of antimi-crobial agents in companion animals (pet animalsand horses) was around 3 tonnes, estimated from theprescription for these species and sales for companionanimal practices. The use of fluoroquinolones in com-panion animals was estimated to 14 kg in 2010 (>13kg for pet animals), corresponding to 72% of the totalveterinary consumption of fluoroquinolones. The majorantimicrobial agent used in pet animals was amoxicillinin combination with clavulanic acid (539 kg), represent-ing an increase of 3% compared with 2009. Other agentsfrequently used in pet animals were cephalosporins(estimated 320 kg), mainly 1st generation for oral use.In pet animals, the consumption of 3rd and 4th genera-tion cephalosporin was an estimated 3 kg, correspond-ing to 1.8% of the total veterinary consumption of theseantimicrobial agents.Antimicrobial consumption in humansPrimary health care and hospital care:The totalconsumption of antibacterial agents for systemic use(primary health care and hospital care) increased by 5%:from 17.89 DDDs per 1,000 inhabitants per day (DID)in 2009 to 18.84 DID in 2010. Hospital care contributed10% of the total consumption. The increase was noticedin primary health care only. Since 2001, the total con-sumption of antibacterial agents has increased by 4.54DID (32%).Primary health care:The consumption of antibacte-rial agents for systemic use (J01) in primary health careincreased by 6% to 16.93 DID as compared with 15.95DID in 2009. This is the highest level of consumptionmeasured in the history of DANMAP. Beta-lactamasesensitive penicillins represented the largest therapeu-tic group of antibacterial agents consumed (31%), andpenicillins (J01C) accounted for 62% of the total con-sumption in 2010. Consumption of broad-spectrumagents represented 6.48 DID in 2010, increasing by 0.53DID (9%) compared with 2009. Consumption of allbut one therapeutic group (short-acting sulfonamides)increased. Possible explanations for the increased con-sumption include: 1) an increased number of patientstreated; 2) an outbreak ofMycoplasma pneumoniaeinthe second half of 2010 with increased consumption ofbeta-lactamase sensitive penicillins as empirical treat-ment of lower respiratory tract infection and macrolidesas treatment of confirmedM. pneumoniae pneumonia- according to national guidelines; and 3) an increasedconsumption of ‘combination penicillins’ presumably asa result of better adherence to the changes in the treat-ment guidelines for patients with chronic obstructivelung diseases that were introduced a few years ago.Total antibacterial consumption (J01) in primary healthcare has increased by 32% since 2001, and DDD seemsto be the indicator that has increased the most. On atreated-patient-level both the number of DDDs pertreated patient and DDDs per prescribed package hasincreased since 2001.Hospital care:Total consumption (J01) in Danishhospital care (rehabilitation centres, hospices, private-,psychiatric-, specialised-, and somatic hospitals) addedup to 1.91 DID in 2010; similar to that of 2009. Since2001, the consumption has increased by 0.46 DID(31%). Broad-spectrum agents represented 67% of thetotal consumption, as in 2009.Somatic hospitals:The total consumption (J01) ex-pressed in DDDs per 100 occupied bed-days (DBD)increased by 3% (from 85.03 DBD in 2009 to 87.72 DBDin 2010). When expressed as the number of DDDs per100 admissions (DAD) it decreased from 297.36 DADto 284.89 DAD (4%). These figures are based on almostequal numbers of DDD, but less occupied bed-days andmore admissions in 2010 compared with 2009.In three therapeutic groups, consumption increasedfrom 2009 to 2010 when expressed as DBD: ‘combina-tion penicillins’ increased by 1.48 DBD (26%); carbap-enems increased by 0.88 DBD (28%) and combinationsof sulfonamides and trimethoprim increased by 0.76DBD (34%). Consumption decreased in other therapeu-tic groups from 2009 to 2010: penicillins with extendedspectrum with a decrease of 0.76 DBD (5%); beta-lacta-mase sensitive penicillins with a decrease of 0.41 DBD(4%); 3. generation cephalosporins with a decrease of0.16 DBD (11%); and fluoroquinolones with a decreaseof 0.27 DBD (2%). In 2010, cephalosporins accountedfor 20% of the total consumption in somatic hospitals.Penicillins with extended spectrum (17%), fluoroqui-nolones (12%) and beta-lactamase sensitive penicillins(11%) were the other top four contributing therapeuticgroups in 2010.Over the last decade (2001–2010), somatic hospital con-sumption has increased by 39.40 DBD (82%) or by 35.13DAD (14%) depending on the denominator. It is im-perative to exemplify that the number of admissions hasincreased by 18% during the last decade and the numberof bed-days has decreased by 26% as a consequence ofchanges in hospitalization patterns.
2.
Overall, the total antimicrobial consump-tion in animals decreased during 2010, and forthe first time since 2002, the consumption in pigsdecreased. In contrast, the human consumptionincreased to the highest level seen since the start ofthe DANMAP programme in 1995. The increasedconsumption was observed in primary health care,and could partly be explained by an outbreak ofMycoplasma pneumoniaeand increased number oftreated patients during 2010.
DANMAP 2010
15
2.
SUMMARYResistance in zoonotic bacteria
Zoonoses such as salmonellosis or campylobacteri-osis are infections and diseases that are transmissiblebetween animals and humans, either via direct contactor indirectly via contaminated food. Data on antimi-crobial resistance originate from the DANMAP pro-gramme as well as national surveillance and controlprogrammes forSalmonellaandCampylobacter.Among theSalmonellaTyphimurium isolates fromDanish pigs, a significant increase in resistance toampicillin, streptomycin and tetracycline was observedfrom 2009 to 2010. When comparing the resistancein Danish pork (27%) to resistance in Danish pigs(47%), a significantly higher occurrence of resistance totetracycline was found in the animals.S.Typhimuriumisolates from imported pork had a significantly higheroccurrence of resistance to five of the 16 tested anti-microbial agents thanS.Typhimurium isolates fromDanish pork.The highest level of resistance was observed in im-ported turkey meat, where none of theS.Typhimuriumisolates were fully sensitive, whereas 93% were foundto be multi-resistant. In addition, a significant increasein resistance was seen for apramycin, gentamicin andstreptomycin resistance in 2010 compared to 2009.In 2010, no animal isolates ofS.Typhimurium orS.Enteritidis were found resistant to cephalosporins,ciprofloxacin or nalidixic acid. OnlyS.Typhimuriumisolates from imported turkey meat were found re-sistant to these three antimicrobial agents. Among thehuman cases, a higher level of ciprofloxacin resistancewas observed in the travel-associated infections (14%)when compared with the domestically acquired infec-tions (4%), and resistance to cephalosporins was onlyreported among cases that had travelled abroad (3%) orwhere the origin of the infection was unknown (1%).Clonal dissemination plays an important role in thespread of antimicrobial resistantSalmonellaspp., par-ticularly withinS.Typhimurium. Since 2005, there hasbeen a parallel increase (14%) in pig isolates resistant toampicillin, streptomycin, sulfonamide and tetracycline(ASSuT), a resistance pattern often observed in thephage types DT120 and DT193. Among the pig isolatesresistant to ampicillin, chloramphenicol, streptomycin,sulfonamide and tetracycline (ACSSuT), the majoritywere phage type DT104. Among the humanS.Typh-imurium cases, the same correlation between resistancepattern and phage types was observed.A source attribution model is routinely applied toestimate the contribution of the major animal-foodsources to humanSalmonellainfections in Denmark.This model was used to estimate the number of do-mestically acquired human cases caused byS.Typh-imurium isolates resistant to ampicillin, sulfonamideand tetracycline (ASuT). Overall, one outbreak-relatedand five sporadic ASuT cases were attributed to Danishpork, 41 ASuT cases to imported pork and one ASuTcase to imported turkey meat.
AmongSalmonellaEnteritidis isolates from humancases, a higher level of ciprofloxacin resistance wasobserved in the travel-associated infections (21%) andcases of unknown origin (21%) when compared withthe domestic sporadic cases (8%).From 2009 to 2010, no significant changes in resistancewere observed among isolates ofCampylobacter jejunifrom Danish broilers and Danish cattle nor forCampy-lobacter coliisolates from pigs. In general, a slightlyincreasing trend has been observed in the occurrence ofresistance towards tetracycline inC. jejunifrom Dan-ish broilers and Danish cattle, as well as forC. colifromDanish pigs since 2005. During the same period, tetra-cyclines have been the most or second most frequentlyused group of antimicrobial agents for these animalspecies. As in previous years, the level of ciprofloxacinresistance inC. jejuniwas significantly higher amongisolates from imported broiler meat (50%) when com-pared with isolates from Danish broiler meat (17%).From 2009 to 2010, no significant changes in resistancewere observed inC. jejuniisolates from human campy-lobacteriosis cases acquired domestically. However,C.jejuniisolates from cases associated with a history oftravel have had significantly higher level of ciprofloxacinresistance (80%) compared to domestically acquiredcases (25%).Pig farms as well as cattle and broilers at slaughter wereinvestigated for the occurrence ofClostridium difficilefor the first time. Fifteen percent of the pig farms, 15%of cattle and 3% of the broiler flocks were positive forC.difficile.Isolates with up to three toxin genes were foundwith the highest occurrence among isolates from pigfarms (73%). The isolates with three toxin genes presentwere ribotyped, and PCR ribotype 078 commonly foundamong pigs was found among pig farm isolates and cat-tle isolates. The rest belonged to PCR ribotypes rarelyor not previously found in humans in Denmark. Theisolates were tested to five antimicrobial agents and mostisolates were resistant to clindamycin (87%); resistancewas low to the other antimicrobial agents tested.Findings ofC. difficile078 in pigs are not surprisingsince this type is known to be common among pigs. Butother types may also have a potential to cause severedisease in humans as types with all three toxin genesand deletion intcdCwere found. Moreover, the impor-tance ofC. difficilewithtcdAandtcdBin animals shouldbe further investigated.
The level of resistance inS.Typhimurium frompigs increased in 2010, whereas the level in Danishpork remained the same. The level of resistance inS.Typhimurium from Danish pork andCampylobacterjejunifrom Danish broiler meat was significantlylower than in isolates from imported meat. A similarpattern was observed among the humanS.Typhimu-rium andCampylobacter jejunicases, where casesassociated with a history of travel had significantlyhigher levels of resistance compared to domesticallyacquired cases.
16
DANMAP 2010
SUMMARYResistance in indicator bacteria
2.
Indicator bacteria are included in the DANMAP pro-gramme to provide information about the general levelsof resistance in healthy production animals and meat.Enterococcus faeciumisolates from both pigs and broil-ers showed a significant decrease in the occurrence ofresistance to tetracycline, penicillin and ampicillin from2009 to 2010. In addition, a decrease in the occurrenceof streptomycin resistance was seen in isolates frompigs, and the occurrence of quinupristin/dalfopristinand avilamycin resistance in isolates from broilers alsodecreased. When comparingE. faeciumisolates fromDanish and imported broiler meat, a significantly higheroccurrence of resistance to seven different antimicrobialagents was found among isolates from imported broilermeat. Using a selective enrichment method, vancomycinresistantE. faeciumwas detected in 47% of the broilersamples indicating presence of VRE at low levels, eventhough the use of avoparcin has been banned since 1995in Denmark.AmongEnterococcus faecalisisolates from broilers, a sig-nificant decrease in resistance was seen for tetracycline,erythromycin, streptomycin and salinomycin, whileamong isolates from pigs only a significant decrease intetracycline resistance was observed. The reduced oc-currence of tetracycline resistance among all enterococciisolates from pigs can be related to the reduced con-sumption of tetracyclines.The same type (ST16) of high-level gentamicin resistant(HLGR)E. faecaliswas detected in pigs, pork, healthyhumans, and from patients with infective endocarditis,indicating a zoonotic link.In indicatorE. coliisolates from pigs and broilers, no sig-nificant changes in the levels of resistance were observedfrom 2009 to 2010; however, the level of resistance to tet-racycline in bovine isolates increased significantly from2% to 9%. In 2010, no fluoroquinolone resistance wasfound inE. colifrom Danish pigs and cattle, probablyreflecting the low consumption since 2002 when the usein production animals was restricted by law. In contrast,8% of theE. coliisolates from broilers were resistant tofluoroquinolone, which corresponds to the relativelyhigher use of fluoroquinolones in the broiler productionduring the last ten years compared with other produc-tion animal species.Resistance inE. coliisolates from imported broiler meatwas significantly higher compared with isolates fromDanish broiler meat for 13 of the 16 tested antimicro-bial agents. In 2010, ceftiofur resistance was observedfor the first time in an isolate from Danish broiler meat,obtained without selective enrichment (1%), althoughsignificantly lower than amongE. colifrom importedbroiler meat (7%). The occurrence of fluoroquinoloneresistance in imported broiler meat (41%) was tenfoldhigher than in Danish broiler meat (4%).InE. colifrom Danish pork, resistance to sulfonamidedecreased significantly from 38% to 19%. In 2010,significantly lower resistance to tetracycline and sulfona-mide was found in isolates from Danish pork compared
with imported pork. The resistance to fluoroquinolonesremained low (one isolate) in Danish pork; in importedpork, 4% of theE. coliisolates were resistant to fluoro-quinolones.The occurrence of resistance inE. colifrom importedand Danish beef was low.ESBL-producing bacteria are resistant to extended-spec-trum cephalosporins, which are often used for treatmentof infections. Consequently, even a low occurrence ofthese bacteria can potentially be a serious problem.Using selective enrichment methods, the occurrence ofESBL-producingE. coliin pig farms, cattle and broilersat slaughter and in meat at retail was investigated. Inproduction animals, the highest occurrence of ESBL-producingE. coliwas found in broilers at slaughter(27%) despite no usage of cephalosporins in the Dan-ish broiler production for at least a decade. In meat, thehighest occurrence of ESBL-producingE. coliwas foundin broiler meat of imported (50%) and Danish (8.6%)origin. For imported broiler meat, the occurrence wassignificantly higher than in 2009.The presence of ESBL-genes differed depending onanimal reservoir. CMY-2 and SHV-2 seemed to be morerelated to the broiler production, whereas CTX-M-8was found only in cattle. Several of the ESBL-genesdetected amongE. coliobtained from animals and meatcan also be detected inE. coliof human origin. Broilersand broiler meat seem to be an important reservoir forESBL-producingE. coli,also in countries like Denmarkwith no consumption of cephalosporins in the broilerproduction.Broilers and broiler meat seem to be an im-portant source for ESBL-producingE. coli,also incountries like Denmark with no consumption ofcephalosporins in the broiler production. Resistanceto vancomycin and quinupristin/dalfopristin stillprevails at low levels amongE. faeciumisolated frompigs even though usage of these growth promotershas been banned for more than ten years.
Data on antimicrobial resistance in bacteria from diag-nostic submissions are gathered by voluntary reportingfrom the DANRES group which covers the Depart-ments of Clinical Microbiology (DCM) in Denmark.The only exceptions are methicillin resistantStaphylo-coccus aureusand invasiveStreptococcus pneumoniaethat are notifiable. Data on these bacteria are obtainedfrom the reference laboratories at SSI.AmongE. coliblood isolates, resistance to 3rd genera-tion cephalosporins was 7% in 2010, the same level asreported in 2009, but above the 2009 level in the otherNordic countries. Resistance to gentamicin increased to6% in 2010. In 2010, ciprofloxacin resistance was 14%(min. 7%, max. 22% at the individual DCM), the samelevel as in 2009. NoE. coliisolates from blood were
Resistance in human clinical bacteria
DANMAP 2010
17
2.
SUMMARYcarbapenem resistant. Over the last decade, resistance tocefuroxime, ciprofloxacin and gentamicin has increasedsignificantly. Resistance to 3rd generation cephalo-sporins has only been reported since 2008; during thisperiod the resistance has increased.InE. coliurine isolates obtained from hospitals, resist-ance to 3. generation cephalosporins was 5% in 2010,the same level as in 2009. Small decreases (one percent)in the occurrence of resistance were observed for thefollowing antimicrobial agents: ampicillin (41%), sul-fonamide (35%), ciprofloxacin (12%) and cefuroxime (2.generation cephalosporin) (5%).InE. coliurine isolates obtained from primary healthcare, resistance to 3rd generation cephalosporins was3% in 2010, the same level as in 2009. Nalidixic acid re-sistance increased significantly from 14% in 2009 to 15%in 2010. From 2009 to 2010, small (1-2%) but significantdecreases in resistance were observed for ampicillin(40%) and sulfonamide (37%).InKlebsiella pneumoniaeblood isolates, 3rd generationcephalosporin resistance was 9% (min. 4%, max. 24%),the same level as reported in 2009. The level was abovethe level reported to EARS-Net by the other Nordiccountries and corresponded to the occurrence reportedby several other European countries in 2009 [EARS-Net2009]. In the Eastern part of Denmark (Zealand), theoccurrence of 3. generation cephalosporin resistantK.pneumoniae(14%) was significantly higher than in theWestern part (Funen and Jutland) (6%). Fluoroquinolo-ne resistance (ciprofloxacin 11%, nalidixic acid 17%)and aminoglycoside (gentamicin) resistance (6%) wereabove the levels reported from the other Nordic coun-tries and the same as reported to EARS-Net by otherEuropean countries. When comparing 2009 with 2010,significant decreases were observed for gentamicin,ciprofloxacin and cefuroxime resistance; this was mostlydue to decreased occurrence of these resistances inK.pneumoniaeisolates from Zealand. This could in partbe explained by interventions at hospitals in the Copen-hagen area (Textbox 8). In 2010, carbapenem (mero-penem) resistance was absent inK. pneumoniaebloodisolates.InK. pneumoniaeurine isolates, 3rd generation cepha-losporin resistance was 12% in isolates obtained fromhospitals, and 7% in isolates obtained from primaryhealth care, the same levels as reported in 2009. 3rd gen-eration cephalosporin resistance inK. pneumoniaeiso-lated from urine was significantly higher in the Easternpart of Denmark (Zealand) compared with the Westernpart (Funen and Jutland). A significant decrease influoroquinolone resistance (in 2010; ciprofloxacin 14%,nalidixic acid 20%) was observed from 2009 to 2010amongK. pneumoniaeurine isolates from hospitalizedpatients. In the Eastern part of Denmark (Zealand), theoccurrence of ciprofloxacin resistantK. pneumoniaeinurine isolates from both hospitals and primary healthcare was significantly higher than in the Western part(Funen and Jutland).Carbapenem (meropenem) resistance was present in theK. pneumoniaeurine isolates from both hospitals andprimary health care. One of the carbapenem resistantisolates produced the new carbapenemase enzyme NewDelhi metallo-β-lactamase 1 (NDM-1) and was resistanttowards all tested antimicrobial agents except tigecyclineand colistin. The occurrence of carbapenem resistance isnot mandatory reportable and no calculation of the fre-quency of carbapenem resistance could be made forK.pneumoniae.Sulfonamide resistance increased signifi-cantly among urine isolates from both hospitals (29% in2010) and primary health care (34% in 2010).ESBL-producingE. coliandK. pneumoniaeare not man-datory reportable in Denmark and were only reported tothe DANMAP report from a few DCMs; it is thereforenot possible to calculate the frequency of this resistance.Antimicrobial resistance inPseudomonas aeruginosaisolatesobtained from blood was low for all the testedantimicrobial agents.Resistance to penicillins and erythromycin inStrepto-coccus pneumoniaeand in Group A, B, C and G strepto-cocci remained low in 2010.In 2010, resistance to ampicillin increased to 92% inEnterococcus faeciumisolates from blood. Vancomycinresistance was 1.8% in theE. faeciumand less than 1%in theE. faecalisblood isolates. During 2010, an out-break of vancomycin resistant (vanA)E. faeciumwasdetected at Aarhus University Hospital. This outbreak isstill under investigation. Only one of the DCM tested allenterococci from bloodstream infections for High-levelgentamicin resistance (HLGR). Here, 36% of the testedE. faecalisisolates were HLGR, as were 74% of the testedE. faeciumisolates.In 2010, 1,418 cases ofStaphylococcus aureusbacte-raemia were reported, corresponding to 24.6 cases per100,000 citizens. The number of methicillin resistantS.aureus(MRSA) was 20 (1.4%). This is at the same levelas in 2009 and still among the lowest recorded inci-dences in Europe. The frequency of resistance towardsfucidic acid and norfloxacin increased while resistancetowards other antimicrobials was at the same level as inThe number of new cases of MRSA increased in 2010to 1,097 compared with 817 in 2009. The number ofcases was the highest reported in more than 25 years.The increase was recorded both among cases acquiredabroad (247 in 2010 vs. 156 in 2009) and cases acquiredin Denmark (852 vs. 661). Among Danish cases theincrease was most marked in the group categorised ashealth-care associated, but with a community onset(HACO, 169 vs. 81). Of these, 129 cases did not reportany known MRSA exposure and the increase may thusbe attributed to a better completion of report forms. Thenumber of hospital-acquired cases was still low and atthe same level as in 2009 (62 vs. 53 cases).Among the community-acquired cases, a significantchange was recorded. In 2010, considerably more casesreported known exposure to MRSA, both patients withMRSA infections and carriers. The number of MRSAbelonging to clonal complex CC398, which is associatedwith pigs, increased from 40 in 2009 to 109 in 2010. In
18
DANMAP 2010
SUMMARY15 of these cases, no known contact to pigs or peoplewith contact to pigs was reported. This may be an adap-tation of the clone to the human host and the possibil-ity for a human-to-human spread. The majority of the15 persons lived in areas with recorded CC398 cases inhumans and/or pigs. There are still no signs of spread tourban areas or spread through the food chain.In 2010, a new gene conferring resistance to methicillinwas recognised (mecAlga251). Previous methods failedto detect this new variant. In 2010, a total of 21 personswere demonstrated positive with this type. Investigationof MRSA strains from previous years showed that thesestrains have been spreading in Denmark since 2004.The prevalence of MRSA was investigated in pigs atthe farms, cattle and broilers at slaughter and in meatsamples. The prevalence in pigs (16%) was at the samelevel as found among pigs at slaughter in 2009. This islower than observed in some other European countries.MRSA was not found among cattle or broilers. TheMRSA from pigs were CC398, and CC398 was found in109 human cases, the majority in persons with con-tact to pigs. In 15 cases no direct contact was reported,whereas the majority was found in persons living inrural areas with known occurrence of MRSA CC398 inpigs. There are still no sign of spread of CC398 to urbanareas. Imported meat still has the highest occurrence ofMRSA (19%) as compared to Danish meat. The relative-ly frequent occurrence of MRSA in meat combined withno/very few cases in urban areas makes it safe to con-clude that there is very little if any risk for meat being arisk for contracting MRSA CC398. Pigs still seem to bethe most important reservoir for MRSA CC398.
2.
Regarding blood and urinary tract infectionsin humans caused byE. coliandK. pneumoniae,3rdgeneration cephalosporin resistance was at the samelevel as in 2009. Third generation cephalosporin andciprofloxacin resistance were significantly higherin the Eastern part (Zealand) compared with theWestern part (Funen and Jutland) of Denmark. Anintervention study at Bispebjerg Hospital has shownthat it is possible to decrease the number of resistantK. pneumoniaeisolates. Most of theE. faeciumiso-lates were resistant to ampicillin. The occurrence ofresistance inP. aeruginosaand Streptococci was low.The number of hospital-acquired MRSA cases wasstill low and at the same level as in 2009, whereas thenumber of community-acquired cases increased. Anincrease in the number of human CC398 cases wasobserved, CC398 being associated with contact to
DANMAP 2010
19
3
GENERAL INFORMATION
20
DANMAP 2010
GENERAL INFORMATION
3.
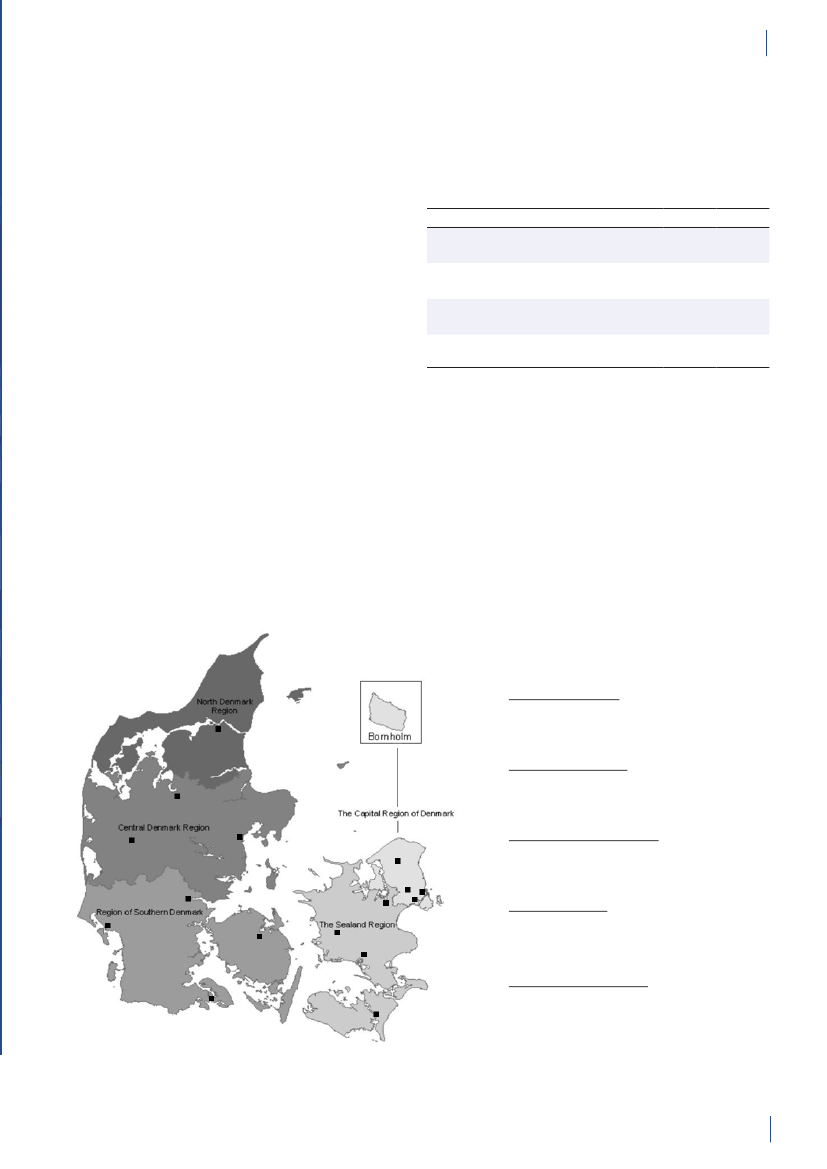
3. General informationThe distribution of the Danish population in whichantimicrobial agents were used in 2010 is displayed inFigure 3.1 together with the five health care regions andthe 15 Departments of Clinical Microbiology (DCMs).The amount of meat available for consumption inDenmark during 2007–2010 is presented in Table3.1. Cooled and frozen fresh meat is included as wellas natural-marinated broiler meat. The amount ofdomestically produced meat available for consumptionin Denmark is estimated as production minus export.Table 3.2 shows the antimicrobial agents that areregistered for treatment of bacterial infections inanimals and humans. Growth promoters, which areno longer used for animals in Denmark, are shown inparentheses. Most of the antimicrobial agents used forgrowth promotion in Denmark had effects on Gram-positive bacteria. Since 1995, the indicator enterococcifrom animals and meat (and in some years from healthyhumans) have been used as a measure of resistance tothe growth promoters.Vibeke Frøkjær Jensen and Ulrich Stab JensenTable 3.1. Danish and imported meat available forconsumption (in 100 Tons)(a), Denmark
DANMAP 2010
SourcePorkBeefBroilermeat(b)Turkeymeat
OriginDanishImportDanishImportDanishImportImport
2007174551673080062630484
2008211395683181247832583
2009186883384588851330370
20101819873922102653242787
a) Source: Statistics Denmark. The volumes of Danish meat areestimated as production minus exportb) Natural-marinated broiler meat included
Figure 3.1. The five health care regions and 15 Departments of Clinical Microbiology (DCM) of Denmark
DANMAP 2010North Denmark RegionNo. of inhabitantsNo. of inhabitants/km2No. of inhabitants/GPCentral Denmark RegionNo. of inhabitantsNo. of inhabitants/km2No. of inhabitants/GPDCM ÅRHUSDCM HERNINGDCM HILLERØDDCM HERLEVDCM VEJLEDCM SLAGELSE(ROSKILDE)DCM ESBJERGDCM ODENSEDCM SLAGELSEDCM RIGS-HOSPITALET
DCM AALBORG
579,628731647
DCM VIBORG
1,253,998961498
The Capital Region of DenmarkNo. of inhabitantsNo. of inhabitants/km2No. of inhabitants/GPThe Sealand RegionNo. of inhabitantsNo. of inhabitants/km2No. of inhabitants/GPDCM SLAGELSE(NÆSTVED/NYKØBING F)
1,680,2716561536
DCM HVIDOVRE
820,5641131584
Region of Southern DenmarkNo. of inhabitantsNo. of inhabitants/km2No. of inhabitants/GP1,200,277981482
DCM SØNDERBORG
Source: Statistics Denmark (www.dst.dk) and the Danish Medical Association (www.laeger.dk). GP=general practitioner
DANMAP 2010
21
3.
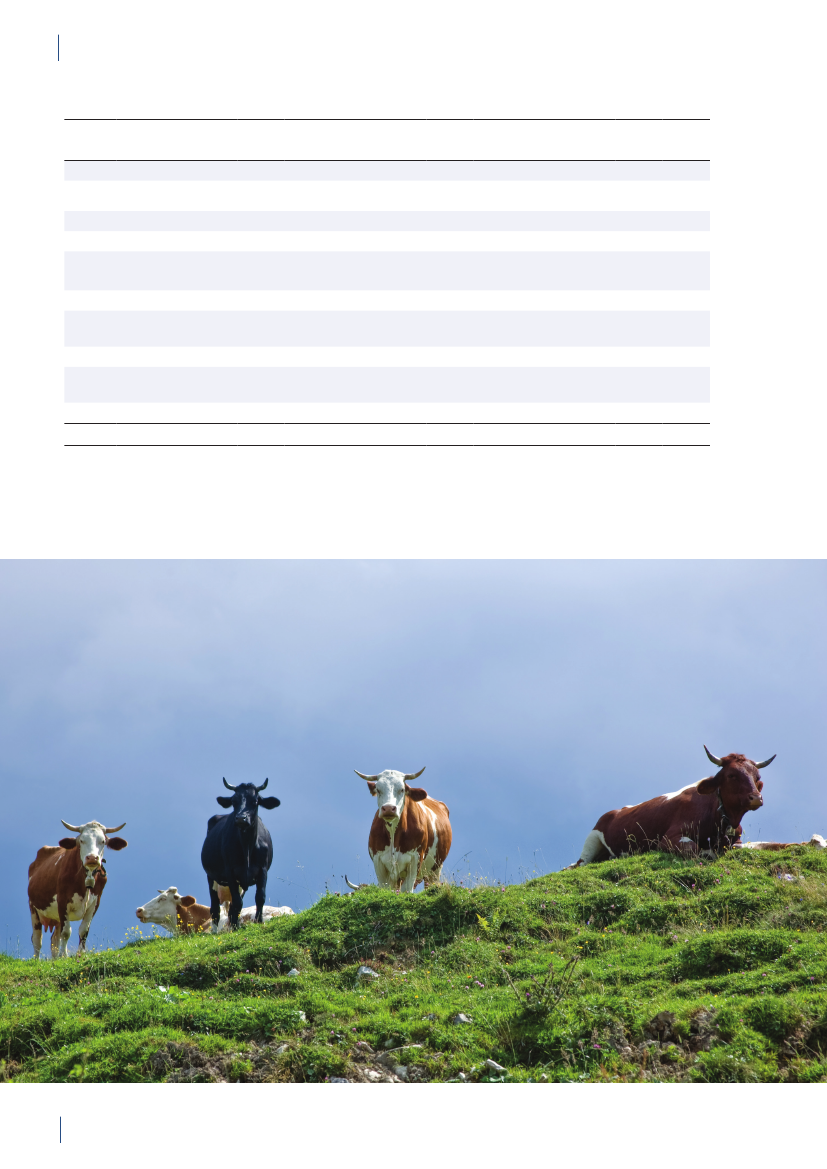
GENERAL INFORMATIONTable 3.2. Antimicrobial agents marketed for systemic and veterinary intramammary therapeutic use inanimals and humans, Denmark 2010DANMAP 2010ATC / ATCvet codes(a)Therapeutic groupJ01AA /QJ01AA,QJ51AAJ01BA / QJ01BAJ01CA / QJ01CAJ01CE / QJ01CETetracyclinesAmphenicolsPenicillins with extendedspectrumBeta-lactamase sensitivepenicillinsBeta-lactamase resistantpenicillinsComb. of penicillins, incl. beta-lactamase inhibitorsFirst-generation cephalosporinsAntimicrobial agents within the therapeutic groupsAnimalsHumansChlortetracycline, doxycycline, Doxycycline, lymecycline,oxytetracyclineoxytetracycline, tetracycline,tigecyclineFlorfenicolAmpicillin, amoxicillinAmpicillin, pivampicillin,amoxicillin, pivmecillinam,mecillinamBenzylpenicillin,Benzylpenicillin,phenoxymethylpenicillin,phenoxymethylpenicillinprocaine penicillin,penethamate hydroiodideCloxacillin, nafcillinDicloxacillin, flucloxacillinAmoxicillin/clavulanate,piperacillin/tazobactamCefalexin, cefadroxil, cefapirin CefalexinCefuroximeCefotaxime, ceftazidime,ceftriaxoneAztreonamMeropenem, ertapenem,doripenemTrimethoprimSulfamethizoleSulfamethoxazole/trimethoprimErythromycin, roxithromycin,clarithromycin, azithromycinClindamycinTobramycin, gentamicinAmoxicillin/clavulanate
J01CF / QJ51CFJ01CR / QJ01CRJ01DB /QJ01DB,QJ51DBJ01DCJ01DD /QJ01DD,QJ51DDJ01DE / QJ51DEJ01DFJ01DHJ01EAJ01EB / QJ01EQJ01EE / QJ01EWJ01FA / QJ01FAJ01FF / QJ01FFJ01FG / QJ01XX(b)J01G /QJ01RA,QA07AAJ01MA / QJ01MAQJ01MBQJ01MQ(b)J01XA,A07AA /Not in ATCvet(b, c)J01XB / QA07AA(b)J01XCJ01XD,P01AB(c)J01XEJ01XX / QJ01FFQJ01XQQP51AG04Not in ATCvet(b)Not in ATCvet(b)
Second-generationcephalosporinsThird-generation cephalosporins Cefoperazone, ceftiofur,cefovecinFourth-generationCefquinomecephalosporinsMonobactamsCarbapenemsTrimethoprim and derivativesShort-acting sulfonamidesComb.of sulfonamides andtrimethoprim, incl. derivativesMacrolidesLincosamidesStreptograminsAminoglycosidesSulfadimidineSulfadiazine/trimethoprim,sulfadoxine/trimethoprimSpiramycin, tylosin,tilmicosin, tylvalosintartrat,tulathromycin, gamithromycinClindamycin, lincomycin(Virginiamycin)Streptomycin,dihydrostreptomycin,gentamicin, neomycin,apramycinEnrofloxacin, marbofloxacin,difloxacin, ibafloxacinOxolinic acid(Carbadox, olaquindox)(Avoparcin)Colistin, (bacitracin)
FluoroquinolonesOther quinolonesQuinoxalinesGlycopeptidesPolypeptides (incl. polymyxins)Steroid antibacterialsImidazole derivativesNitrofurane derivativesOther antibacterialsPleuromutilinsAntiprotozoals, sulfonamidesOligosaccharidesFlavofosfolipols
Ofloxacin, ciprofloxacin,moxifloxacin
Vancomycin, teicoplaninColistinFusidic acidMetronidazoleNitrofurantoinMethenamine, linezolid,daptomycin
SpectinomycinTiamulin, valnemulinSulfaclozine(Avilamycin)(Flavomycin)
a) ATCvet codes starts with a Qb) Animal growth promoters used before 1999 are listed in parenthesesc) Although intestinal antiinfectives (A07AA) and imidazole derivatives for protozoal diseases (P01AB) are used to treat humanpatients, they are not reported by DANMAP
22
DANMAP 2010
ANTIMICROBIAL CONSUMPTION IN ANIMALS
4
DANMAP 2010
23
4.
ANTIMICROBIAL CONSUMPTION IN ANIMALS
4. Antimicrobial consumption in animals4.1 Introduction4.1.1 Demographic dataIn 2010, the production of meat and dairy increasedcompared to 2009 (Table 4.1). The number of pigsproduced (slaughtered or exported) increased by 3.3%,while the production in kg pork produced increased by4% (Table 4.1), suggesting a slight increase in averageweight at slaughter. This may be related to a decrease innumber of sows in the last quarter. The export of fat-tening pigs (15–50 kg) has increased over the past yearsand at export, these pigs have received a large amountof antimicrobial agents relative to their bodyweight.Since 2006, more than 99% of the turkeys produced wereexported for slaughter.4.1.2 Policies and regulations of the use ofantimicrobial agents in animals
Since the early 1990’ies there has been political and pub-lic focus on the use of antimicrobial agents in the Dan-ish animal production. This led to the ban on avoparcinfor growth promotion in 1994 and voluntary phasingout of the remaining antimicrobial agents for growthpromotion during 1996–1999. In 2002, restricted useof fluoroquinolones was enforced. In July 2010, the pigindustry imposed a voluntary ban on use of cephalo-sporins.
Regarding prescription medicines, a number of inter-ventions affect the present antimicrobial consumptionpattern in Denmark. Some of this legislation has had anevident influence on the prescription pattern, such as asteep decrease in consumption from 1994 to 1995 and asteep decrease in use of fluoroquinolones from 2001 to2003. The effect of other parts of the legislation may beless obvious, but are important to keep in mind wheninterpreting the veterinary prescription patterns.DANMAP 2010
Table 4.1. Production of food animals and the production of meat and milk, Denmark
Year
Broilers
Turkeys
Cattle(slaughtered)
Dairy cows
Pigs
10001000mill. kgmill. kgheadsheads1990199219941996199820002001200220032004200520062007200820092010Increase(%)(d)94560107188116036107895126063133987136603136350129861130674122179106182107952107595108851117653811613715214916818119219018118118016317818618118735717611091961112410421086107377710861237785100910681175118412.55.48.69.311.610.313.212.811.219.617.411.314.412.311.114.026
Export10001000 mill. Kg 1000mill. kg1000 mill. kg mill. kg mill. kgheadsheads milk heads(b)heads(c)789219753 454216425-1260--862236712 440518442-1442357813210700 444220651-1604357789198701 449420424-1592328732179669 446822738-1770327691171636 452022414-1748327653169623 441823199-1836318668169611 445524203-1892328625161596 454024434-1898348632165569 443425141 1712 1967349549145559 444925758 2720 1988318509140556 449225763 3204 1957298512141545 451526311 3522 20463110509138559 458527078 4943 19853010507137569 473427603 6642 18982911519142574 483028505 7074 1974--2312374.0--
Farmed fish(a)FreshSaltwater water
Source: Statistics Denmark (www.dst.dk) and The Danish Directorate for Fisheries. All data include export of live animals for slaughter.Export data for poultry from Statistics Denmark (personal communication) and export of 15-50 kg pigs from Danish Agriculture andFooda) The production of farmed fish includes fish transferred from one production facility to another. In 2009, this included 2.7 tonnestransferred between freshwater facilities (9.4% of the freshwater production), and 1.9 tonnes transferred from freshwater to salt waterfacilities, corresponding to 18% of the saltwater productionb) Including export of all age groups (not only for slaughter)c) Export of 15-50 kg pigs. These are included in total number of heads, but antimicrobial use after export until slaughter is not registeredas it takes place outside Denmarkd) Increase from 2009 to 201024
DANMAP 2010
ANTIMICROBIAL CONSUMPTION IN ANIMALS
4.
Official guidelines for choice of antimicrobial agents inpigs and cattle have been available for veterinarians since1996. The guidelines provide specific recommendationsfor the selection of the appropriate antimicrobial agentsfor the treatment of all common indications in majorproduction animal species. Initially, guidelines weredeveloped by the National Veterinary Serum Labora-tory (presently, the National Veterinary Institute). Since
2005, the guidelines have been updated by theDanishVeterinary and Food Administration (DVFA)incollaboration with the National Veterinary Institute,the National Food Institute, the Practicing Veterinar-ians Organization, University experts, and the DanishAgriculture and Food Council. The latest update is from2010, see Textbox 1.
Relevant legislation regarding veterinary use of antimicrobial agents since 1993
Order (DK) 142/1993:Restricted the use of extemporaneously prepared medicines; also called thecascade rule, imposing mandatory first priority to medicinal products approved for the relevant species,subsidiary approved for other species.Directive (DK) 60/1995:Limits the veterinarians’ profit when distributing medicines to a maximumof 5–10% at sales.Order (DK) 303/1995 and 304/1995:Limit the veterinary prescription to a maximum of 5 days oftreatment in production animals. Exceptions only granted when a veterinary advisory service contractbetween the veterinarian and the farmer was signed. In those cases, up to 35 days of treatment isallowed for a diagnosed disease or a disease that was expected in the pigs, calves and poultry, on thebasis of the veterinarian’s knowledge of the herd (revised by Order (DK) 785/2010). By July 2010,veterinary advisory service contracts became obligatory for all larger pig and cattle herds in Denmark.Order (DK) 303/1995:Treatment allowed only in diseased animals or animals in a well definedincubation period (metaphylaxis) and prophylactic use became illegal (revised by Order (DK)910/2006).Mandatory registration by the veterinary practitioners of used, delivered and prescribed drugs tofarmed animals. The information must be available for inspection by veterinary officials for 3 years).Since 2001, reporting into the VetStat database has been mandatory.Order (DK) 285/1996:Pharmacies and the pharmaceutical industry prohibited from offeringeconomic incentives to veterinarians or others for the purpose of increasing product sales.Order (DK) 119/2002:Flouroquinolones intended for injection were restricted to use by theveterinary practitioner only.Order (DK) 134/2003:Mandatory susceptibility testing in relation to use of fluoroquinolones forproduction animals, documenting the need. Notification of use of fluoroquinolones to the authorities ismandatory.Order (DK) 785/2010:Legal regulation of use of antimicrobial agents for mastitis in cattle(recommending using simple penicillins). A similar rule has applied since 2006, for part of the cattleherds, with “new health consultancy contract” [Order (DK) 1045/2006].Order (DK) 1319/2010:The “yellow card” control of antimicrobial use in the pig production, imposingpreventive measures in the herds with highest consumption per pig. In July 2010, an information letterabout the upcoming “yellow card” was sent to the pig farmers, using the 20% highest number of ADD’sper pig (Textbox 2).
DANMAP 2010
25
4.
ANTIMICROBIAL CONSUMPTION IN ANIMALS
Textbox 1
One health evidence based prudent use guidelines for antimicrobial treatment ofpigs in DenmarkIntroduction:New prudent use guidelines for treatment of pigs in Denmark were presented atthe Annual Meeting for the Danish Veterinary Hyologic Society in 2010. In May 2011, these newguidelines were published on-line.The guidelines are based on available scientific evidence. For every combination of class ofantimicrobial agents, swine disease and pathogen, an assessment of prudent use will be providedby the Danish Veterinary and Food Administration (DVFA) in a simple spreadsheet on-line. Thespreadsheet presents all currently registered veterinary antimicrobial products for the specific diseasesin drop-down lists with recommended dosages and treatment periods registered along with a colourcoding indicating the most prudent choices based on efficiency, susceptibility, pharmacokinetics andhuman importance. The guidelines are dynamic lists, which can be changed on request or if newinformation or new antimicrobial agents emerge. The guidelines in Danish are found on the DVFAhomepage (http://www.foedevarestyrelsen.dk).Background:The new guidelines are the third step elaboration of prudent use treatment guidelines;the guidelines are part of the ongoing risk management strategy in Denmark for optimisation ofantimicrobial consumption and reduction of antimicrobial resistance. The DVFA commencedelaboration of dynamic prudent use treatment guidelines for food-producing animals, starting withswine in 2005, followed by a reviewed concept for treatment guidelines for cattle in 2008 and nowthese new dynamic evidence based prudent use treatment guidelines.The guidelines demonstrate the need for collaboration between the human and veterinary side ina one health concept in order to combat risk of development of resistant bacteria. The one healthconcept results from a strong collaboration between all stakeholders in a task force hosted by theDVFA. Members of the task force are: the Danish Veterinary Association, the Danish AnimalHealth Industry, epidemiologists and risk assessors from the Danish Meat Association and DVFA,researchers in pharmacology and swine diseases from the Faculty of Life Sciences, CopenhagenUniversity as well as researchers from the Statens Serum Institut, the National Food Institute and theNational Veterinary Institute.Guidelines:Based on the available evidence, the different classes of antimicrobial agents are assessedby the following four criteria: a) clinical documentation of efficacy, b) susceptibility based on nationalmicrobiological data, c) pharmacokinetics and d) risk profiling of the human health concernswhen the antimicrobial agents are used for veterinary antimicrobial treatment. In the new dynamicguidelines, the actual ranking is based on the scoring shown in Table 1, and the documentation forthe ranking is included in the guideline spreadsheet.Table 1. Categorisation of antimicrobial agents in the new guidelines, DenmarkDANMAP 2010
CategoryEfficiencySusceptibilityPharmacokinetics
Scoring1 = Documented in summary of product characteristics (SPC)2 = Documented in peer-revieved papers, EMEA or FDA papersPercent susceptible, among the isolates sent to the National Food Institute andNational Veterinary InstituteScore based on MICKill/MIC50: 1 = range 0 - 0.19, 2 = range 0.2 - 0.39, 3 = range 0.4- 0.59, 4 = range 0.6 - 0.79 and 5 = > 8.8. Based on estimated MICkill where 80% ofthe dosage are covered by a concentration above MIC50 estimated from the nationaldata1 = very high, 2 = high, 3 = mediocre, 4 = low and 5 = very low. Follows FDA and OIEguidelines
Human importance
26
DANMAP 2010
ANTIMICROBIAL CONSUMPTION IN ANIMALS
4.
The risk profiling of human health concerns is done according to the principles of FDA guidance 152’Evaluating the safety of antimicrobial new animal drugs with regard to their microbial effects onbacteria of human health concern’, as well as the principles in OIE-guidelines. For every antimicrobialgroup, it is estimated whether the probability for selection of antimicrobial resistance, exposure ofhumans and human consequences are very high, high, medium, low or very low. Based on theseestimates, a common estimate for the human health consequences of the use of this antimicrobial groupfor swine is estimated. The common estimate gives a qualitative ranking of the expected future humanhealth consequences by antimicrobial usage for swine of the different antimicrobial groups.A new feature is that recommendations of usage of antimicrobial classes for the specific diseases (site ofaction) and specific pathogens are indicated by three different colours, green, yellow and red, in order tosimplify the veterinary practitioner’s choice of a prudent antimicrobial agent (Figure 1).Figure 1.Prudent use guidelines for antimicrobial treatment of swine, DenmarkEfficiancySusceptabilityPharmaco-kineticsEstimate ofhumanimportanceEvaluationBetter alternativesavailableRecommended
Not recommented
Green indicates antimicrobial agents that are recommended to be used for that specific disease andpathogen combination. The green labelled antimicrobial agents will have susceptibility above 80%, goodpharmacokinetics and a risk profiling of human health consequences assessed to have no or only lowconsequences and preferably also evidence based documentation of clinical efficacy. Examples of greenlabelled antimicrobial agents with good judgement in all four categories for specific diseases and pathogensare: benzylpenicillinprocain, tiamulin, valnemulin and colistin sulfas. Yellow indicates antimicrobial agentsthat can be used, but where better alternatives are available.Red indicates antimicrobial agents not recommended due high human health consequence or a very lowsusceptibility. Examples of red labelled antimicrobial agents are enrofloxacin, marbofloxacin, cefquinomand other cephalosporins, but also other antimicrobial agents with a low score on susceptibility for aspecific pathogen will be labelled with a red colour.To be used by the veterinary practitioners:The guidelines are directed towards veterinary practitioners.In Denmark, all veterinary medicinal products are prescription only and this places the veterinarypractitioners as key persons in prudent antimicrobial usage. The veterinary practitioners may use theguidelines as a working tool in their counselling of preventive veterinary strategies in herds, therebyoptimizing antimicrobial usage with due consideration to both human and animal health. They can look upa specific disease and pathogen in the guidelines; use the colours to choose a prudent antimicrobial and thedrop-down lists to find products, dosage and treatment period. If they want to know how or why a certaintreatment has a good or pour judgement in one or more of the categories, they can use the documentationspreadsheets included the guidelines to study the evidence behind.For further information: Annette Cleveland Nielsen ([email protected])
DANMAP 2010
27
4.
ANTIMICROBIAL CONSUMPTION IN ANIMALS
Textbox 2
The yellow card initiative - special provisions for reduction of the antimicrobialconsumption in pig holdingsBackground:In Denmark, therapeutic antimicrobial consumption in animal production has increased by35% from 2001 to 2009. In order to reverse an increasing trend in antimicrobial consumption in the pig pro-duction and the related potential risk to human and animal health, the Danish Veterinary and Food Adminis-tration (DVFA) established the yellow card initiative in 2010.As more than 80% of the antimicrobial agents used in livestock production in Denmark are used in the pigsector, the yellow card initiative was designed to target pig holdings with a high consumption of antimicrobialagents, beginning with the 5–10% of the pig producers with the highest antimicrobial consumption. In Oc-tober 2010, the goal of a 10% reduction in consumption (in kg) in 2013 compared to the 2009 levels was set.The yellow card initiative is therefore an incentive for the pig producers to achieve this goal.The yellow card initiative:Each year, the DVFA will issue threshold limits for antimicrobial consumption inthree age groups of pigs. The limits for 2010 were as follows:1.2.3.Weaners (7–30 kg): 28 Animal Daily Doses (ADD) per 100 weaners per dayYoung pigs, including young females (over 30 kg), excluding sows, gilts and boars: 8 ADDper 100 pigs per daySows, gilts and boars: 5.2 ADD per 100 pigs per day
If the average antimicrobial consumption in a holding within a nine-month period exceeds one or more ofthe above threshold limits, DVFA may issue an order or injunction (the yellow card) compelling the owner ofthe holding, in collaboration with the veterinary practitioner, to reduce the antimicrobial consumption in theholding below the threshold limits within nine months.In Denmark, prescription-only medicines can only be used and stored for a limited period of time. To pro-long this period, the veterinarian must re-prescribe the medicine for a new limited period of time. However,during the nine-month injunction period, the DVFA may prohibit re-prescription of specific antimicrobialagents administered orally. In addition, the DVFA may also carry out one or more unannounced inspectionvisits to the holding during the nine-month period while the injunction is in effect.If the antimicrobial consumption in the holding has not been reduced below the threshold limits after the ex-piry of the nine-month period, the DVFA may issue a second injunction compelling the owner of the holdingto consult another veterinarian for second opinion advice on how to reduce the antimicrobial consumptionbelow the threshold limits. This injunction may also be issued if the antimicrobial consumption in the hold-ing has been reduced below the threshold limits within the nine-month period, but exceed the threshold lim-its during the succeeding 12-month follow-up period. The expert advice must include an action plan present-ing specific interventions to reduce the antimicrobial consumption in the holding. As with the yellow cardinjunction, the DVFA may also prohibit re-prescription of specific antimicrobial agents administered orallyand carry out unannounced inspection visits to the holding to ensure that animal welfare is not compromisedby reduction in treatment of disease.If the antimicrobial consumption in the holding has not been reduced below the threshold limits after theexpiry of the second injunction period, the DVFA may carry out unannounced inspection visits to the hold-ing within short intervals until the antimicrobial consumption in the holding has been reduced below thethreshold limits.The owner of a holding is required to pay a fee for each injunction or prohibition issued and for all inspectionvisits carried out in accordance with the special provisions. All other expenses, including the costs of veteri-narian expert advice must also be paid by the owner.Legislation:The requirements of the yellow card initiative are set out in Government Order No. 1319 of De-cember 1st 2010 on special provisions for the reduction of the consumption of antibiotics in pig holdings.For further information: Tim Petersen ([email protected])
28
DANMAP 2010
ANTIMICROBIAL CONSUMPTION IN ANIMALS4.1.3 Data sourcesData on antimicrobial use has been collected in Denmarksince 1996, including historical data back to 1990. Until2001, data were available on product level, based onreport from the pharmaceutical industry of the totalannual sales. In addition, sales of antimicrobial growthpromoters and coccidiostatic agents approved as feedadditives were reported by the feed mills to the PlantDirectorate before 2001. Since 2001, consumption datapresented in the DANMAP report have been obtainedfrom the national monitoring programme, VetStat.Prior to 2001, data were based on overall sales figuresfrom the pharmaceutical industry (Table AP1.0). InDenmark, all therapeutic drugs are prescription-onlyand VetStat collects data on all medicines prescribed byveterinarians for use in animals. Data on consumptionof antimicrobial feed additives including coccidiostaticagents (non-prescription) and antimicrobial growthpromoters (no longer in use) are also collected byVetStat. The VetStat database contains detailed data onall prescription medicines for animals, including item ID(Nordic Item Number), date of sale, recipient (farm-IDor practice ID), prescribing veterinarian (ID), species andage group, disease group a.o. (see Appendix 2 for furtherdescription).4.1.4 MethodsThe measures of antimicrobial consumption arenumerous. For the description of trends withinspecies, the number of Defined Animal Daily doses(ADDkg) is preferred, because it describes the exposureindependent of the choice of drug (see description inDANMAP 2009). ADDkgis defined as the assumedaverage maintenance dose per day for treatment of onekg animal for the main indication in a specified species;correspondingly, the ADDx, is the species specificassumed average maintenance dose for a standard bodyweight of x kg. The standard body weight is the assumedaverage body weight at treatment; e.g. for weaning pigs(7–30 kg) it is 15 kg, and the consumption for weaningpigs can be measured in ADD15(see further detail inDANMAP 2009). However, doses are species specific,and have not been defined for all species; therefore,grams of active compound are used for measurement ofoverall consumption in DANMAP.In this report, the production is used as the preferreddenominator and is measured either in kg-meat-produced (including export of live animals) or in numberof animals produced, i.e. slaughtered or exported.Population at risk (animal-year-at-risk) is used whenlooking specifically at consumption in sows or in dairycows.The number of pigs exported around 30 kg increasedfurther by 7%, involving 25% of pigs produced in 2010.Because this production type has expanded importantlywithin a few years, it importantly affects the statistics.Particular for the evaluation of trends over time, datashould be adjusted for such changes in productionstructure, as discussed in DANMAP 2009.Pigs produced only to 30 kg contribute relatively littleto the total production (by weight), while the amountof antimicrobials used for this part of the production(sows, piglets and weaning pigs) comprise two thirdsof the total antimicrobial consumption for pigs. Thus,as illustrated in Figure 4.2, the consumption wouldbe underestimated if merely divided by number ofpigs produced. Conversely, the consumptions wouldbe overestimated if the pigs exported at 30 kg wereincluded in the production (by weight) (see alsoDANMAP 2009). The adjustment is based on theassumption that pigs exported at 30 kg comparedto those not exported, on average received the sameamount of antimicrobial agents before export, as otherpigs from farrowing to 30 kg, giving a more robustmeasure of production (see Section 2.1 in Appendix 2)4.2 Total antimicrobial consumptionTable 4.2 shows the total antimicrobial consumption inproduction animals from 2001 to 2010, with a decreasefrom 128.3 tonnes in 2009 to 125.5 tonnes in 2010. Dueto the phasing out of antimicrobial growth promotersand legal regulations of the therapeutic use implementedin the 1990’ies, the overall antimicrobial consumptionin production animals decreased importantly in thatdecade (Appendix 1, Figure AP1.1 and table AP1.0).During the period 2001–2009, the consumption inproduction animals increased gradually by 36%, butin 2010, the consumption was still 40% lower than in1994, before the aforementioned interventions hadbeen implemented (Table 4.2). In addition, the meatproduction has increased by 17% since 1994 (Table 4.1).In 2010, the total veterinary consumption ofantimicrobial agents including companion animalsamounted to 126.9 tonnes (see details in Table 4.3),representing a 2.1% decrease compared to 2009. Thedecrease was mainly attributable to a decrease inconsumption in pigs despite the increase in production(Table 4.1). The distribution of total consumption ofantimicrobial agents among the major animal specieshas not changed importantly from previous years(Figure 4.1). In 2010, the antimicrobial consumption inpigs, cattle and poultry comprised 79% (100.5 tonnes),12% (14.6 tonnes), and 0.7% of the total veterinaryconsumption, respectively.
4.
For pigs, the adjusted figures are used to de-scribe temporal trends, while non-adjustedfigures are used to describe the relative con-sumption of different antimicrobial agents withinindividual years.
DANMAP 2010
29
4.
ANTIMICROBIAL CONSUMPTION IN ANIMALSTable 4.2. Estimated total consumption (kg)(a)of prescribed antimicrobial agents for production animals(b),DenmarkDANMAP 2010ATCvetgroupc)Therapeutic group20012850016400860010095509501340040501160090094000200224500175009500150105509001365045001170016002003271501895010600200106008501400054001175014002004293502090012300250115008501615066001165095020052955022250116502501220075015300650010800120020063180022650109502501370075014350635010600120020073660023850109003001380070016500610081001150200835400239501055030013300600152509200600016502009384002595012000250149504505173501065063001900201035550271001245020013900550168001070062002100
QJ01AA TetracyclinesPenicillins, b-lactamaseQJ01CEsensitiveQJ01C Other penicillinsQJ01DQJ01EWcephalosporinsSulfonamides +trimethoprimMacrolides,lincosamides
QJ01EQ SulfonamidesQJ01F
QJ01XQ PleuromutilinsQJ01G/AminoglycosidesQA07AAOthersTotal
94700 100900 110500 110400 112700 118000 116100 128200 125500
Data source VetStat. Only veterinary drugs are included (including parenteral treatment in companion animals). Veterinarydrugs almost exclusively used in pets (tablets, capsules, ointment, eye/ear drops) are excluded. Dermal spray with tetracycline,extensively used in production animals, is the only topical drug includeda) Kg active compound rounded to nearest 50 for antimicrobial classes and 100 for totalsb) Included also the parenteral use in companion animalsc) Only the major contributing ATCvet groups are mentioned
30
DANMAP 2010
ANTIMICROBIAL CONSUMPTION IN ANIMALSTable 4.3. Antimicrobial agents sold (kg active compound)(a)by animal species and age group, Denmark
4.
DANMAP 2010
Therapeutic group(b)ATCvet groups(c)Pigs, total- Sows and piglets- Weaners- Finishers- Age not givenCattle, total(d)- Intramammaries- Cows and bulls- Calves<12months- Heifers, Steers- Age groupunknown(e)Poultry, total- Broilers- Breeding andrearing, broilers- Layersincl. rearing- Turkeys- Geese and ducks- Gamebirds- Species unknown- Small ruminants- Fur animals- Aquaculture- Other productionanimalsspecies unknown(f)Companion animals,total- Pet animals- Horses or pets- HorsesSpecies unknown(g)- Systemic use- Topical drugs- IntramammariesTotal
AmcolQJ01B1501182390390018362916000500.40.100.1190008710.1000744
AmglcQJ01G495021912449294168323037432821794000004022840.130745518155416209
CephQJ01DA4941520117694221300000000.10.200.2032131730.4202491
FQ QuinolQJ01MA000001000.1010000000.10.100.400.1014131030019000838000000000838QJ01MB00000000000000000
Linco Macro PleuroQJ01 QJ01FFFA2663 1297869282911366283260.416200000200135010.263620.31000888739846514221601436652202392131440310.157900-2302281-2500
Pen-b-sensQJ01 QJ01XXCE10661 18323147739285232251600.10.20161200110010.110000.5422080097641679684931775418969973641733231191200000.1420316454691631238204
Pen-otherQJ01CA9011462729041450291361157803197261792701893921401515153351367466770.317007
Sulfa-Tet OthersTotalTMPQJ01 QJ01 QJ01EAAX8914 32318510 10052772783004704317111217011001000.1000.4000.1373700.1160.1301503859731552228146364571077323043447578793389148252141241231371430602533084225270812489249151487 17464138 11785112063811124744742210983050.287523822026140.410474564841061330.216518450128049762524282342941411517798131167144212163390
Other production animal species
2891 13978
10703
27149 13038
14691 35595
567 126915
a) Amounts over 0.5 kg are given with one decimal; amounts of 0.0 kg are given as 0b) Amcol=amphenicols; Amglc=aminoglycosides; Ceph=cephalosporins; FQ=fluoroquinolones; Quinol=other quinolones; Linco=lincosamides;Macro=macrolides; Pleuro=Pleuromutilins; Pen-β-sens=beta-lactamase sensitive penicillins; Pen-other=penicillins with extended spectrum, cloxacillinand amoxicillin/clavulanic acid; Sulfa-TMP=sulfonamides+trimethoprim; Tet=tetracyclines. Sulfaclozin (a prescription coccidiostat) is included in thesulfonamide/trimethoprim groupc) Only the ATC group contributing mostly to the antimicrobial group is mentioned. Combination drugs are divided into active compoundsd) in 2010, half of the prescribed antimicrobials for cattle was purchased at pharmacies; half was either administered or handed out by veterinarypractitioners. Reporting from large animal practice on medicines for cattle is validated against data on medicines sold from pharmacies to cattle practice(not mixed practice), and the proportion in accordance is included under the respective age groups. Medicines sold to cattle practice, but usage notreported by a veterinarian are included under “age group unknown”e) About 10% of the pharmacy sales for use in practice is not reported (possibly due to factor errors at reporting), when used or sold in practice,amounting to 700 kg in 2010. In addition, part of pharmacy sales to farms are lacking age group ID, amounting to 55 kg in 2010f) Sales to farmers (valid farm ID codes) given, but animal species not identifiable. Negative numbers are due to prescribed antimicrobials that were notpicked up by the farm owner and where the records the species identity is missingg) Negative numbers are due to over-reporting by veterinarians of antimicrobial medicines used in practice to specific species
DANMAP 2010
31
4.
ANTIMICROBIAL CONSUMPTION IN ANIMALS
Figure 4.1. Antimicrobial consumption per kg meat produced from pigs(a), broilers, turkey andaquaculture(b), Denmark180130120170mg antimicrobial agent/ kg meat produced150100140908013070605040302010001020304050607080910Turkey production001020304050607082ADDkg/ kg meat produced1101601210864
DANMAP 2010
262b)
14
09
10
Pig production
Broiler production
Fish, salt water
Fish, fresh water
a) Export of animals for rearing or slaughter is included. However, data for pig production is not adjusted for the increasing export of pigs at30 kg body weight, although the body mass at export is included in the production (see text). Thus, the figures overestimates the increasingconsumption in the pig production in particular during the last three yearsb) In 2006, the consumption reached 262 mg/kg fish produced in salt water, related to unusually warm summer months. The doses for fishare defined as 30 mg/kg for sulfonmide-trimethoprim, 10 mg/kg for oxolinic acid and 15 mg for florphenicol (source: Danish Aquaculture)
4.3 Antimicrobial consumption by animalspeciesA comparison of trends in antimicrobial use, perspecies, is shown in Figure 4.1; the trend lines differdepending on the unit used. For example, for turkeysthe peak in 2009 is highest using mg, whereas the peakin 2002 is higher using the ADD, due to shift fromamoxacillin towards tetracyclines. Correspondingly,the consumption in aquaculture is extremely highcompared to other species when measured in mg, butmore similar to the consumption in pigs (at least insome years) when measured in ADDkg, because thedominant drug of choice in aquaculture is used in a veryhigh dosage (30 mg/kg).Trends may also be affected byshifts in the production. In this report, number of pigsproduced has been used as the denominator, adjustedfor changes in production as described above. The effectof using this measure is shown in Figure 4.2.For comparison between species, kg meat producedhas been used; this measure overestimates theselection pressure in species with long lives (e.g. cattle)relative to species slaughtered at an early age (e.g.poultry). Alternatively, live biomass could be used forcomparison of selection pressure between species.Because cattle in Denmark are almost entirely dairycattle, living many years after reaching the slaughterweight, the consumption cannot be directly comparedwith other species using ‘kg meat produced’ as thedenominator.
4.3.1 Antimicrobial consumption in pigsIn 2010, the total antimicrobial consumption inpigs was 100.5 tonnes active substance (Table 4.3),a decrease of 3 tonnes compared to 2009. Relativeto the meat production, including live export, theconsumption decreased to 50.9 mg/kg or 4.6 ADDkg/kg pork produced (Figures 4.1 and 4.2). Consumptionof antimicrobial agents for systemic use in pigs (2001–2010), given as Animal Daily Doses (ADDs) to thedifferent age groups, are presented in Appendix 1 (TableAP1.1).In 2010, the overall consumption for pigs decreased by5% in ADDkgper pig produced (adjusted for live export,Figure 4.2). The decrease was mainly related to a 5%decrease in consumption of tetracyclines. However,large relative reductions were also observed formacrolides (2%), aminoglycosides (16%), lincosamides/spectinomycin (7%) and cephalosporins (48%) (Figures4.3 and 4.4). The 2010 overall decrease in consumptionwas entirely related to the second half of the year.During the first six months the consumption increasedby 8% (in ADDkg) compared to the same period in 2009.Regarding cephalosporins, the decrease was relatedto a voluntary ban by the industry, enforced in July2010 (Figures 4.3 and 4.4). As in previous years, thecephalosporins were mainly (86%) prescribed for sowherds, including use in piglets for expected outbreaksof umbilical infection (DANMAP 2007). Also in July2010, an information letter about the upcoming “yellow
32
DANMAP 2010
ANTIMICROBIAL CONSUMPTION IN ANIMALSFigure 4.2. Consumption of antimicrobial agents in sows, weaner pigs(a), finishers(b)and total pig production(c),given as Animal Daily Doses (ADDs), Denmark16144ADD25 / pig produced121086412020012002200320042005200620072008200920100ADDkg/kg meat produced(right axis)2ADDkg / kg pork producedWeaner pigs5
4.
DANMAP 2010Sows
3
Finisher pigs
Total
Total, adjusted
a) Consumption in sows and weaners is given as ADD25 divided by number of weaning pigs producedb) Consumption in finishers is given as ADD25 divided by number of finisher pigs producedc) The” adjusted total” is given with the same units as the total, but adjusted for the increasing export of pigs at 30 kg (see text).Consumption per kg meat produced is given as ADDkg divided by meat production including live export
Figure 4.3. Consumption of 3rd and 4th generationcephalosporins in pigs and cattle, Denmark140120100Kg active compound
card” was sent to the pig farmers, using the 20% highestnumber of ADD’s per pig (Textbox 2). This is a likelyexplanation for the overall reduction in consumptionof 14% in July alone, and a 13% reduction in the secondhalf year compared with the same period in 2009(measured in ADDkg).However, since 2001, the consumption has beengradually increasing, and during the past decade, thetotal consumption in pigs increased by 39% (adjustedfor live export, Figure 4.2). Tetracyclines, macrolidesand pleuromutilins, mainly for oral therapy, continuedto be the most commonly used antimicrobial agents inpigs throughout 2001–2010(Figure 4.3).From 2001–2009, the use of tetracyclines in ADD25 perpig produced increased by 100% (adjusted), followed bythe 8% decrease in 2010; both trends have mainly beendriven by trends in prescription for weaning pigs butalso in finishers (Figure 4.4). Since 2005, tetracyclineshave been the most common antimicrobial agent usedin pigs, likely affected by treatment guidelines launchedby the veterinary authorities that year, recommendingthat tetracyclines should be preferred over macrolides(critically important in human medicine), when a firstpriority agents could not be used.Over the past decade, the consumption ofmacrolides has fluctuated between 2.2–2.6 ADD25per pig produced, with no clear trends. The overallconsumption of pleuromutilins was similar in 2009 and2010, after a 53% increase since 2007 when prices fortiamulin were reduced making it price competitive withmacrolides and tetracyclines. However, the consumptionDANMAP 201033
DANMAP 2010
80604020001020304050607080910
Systemic treatment of pigsSystemic treatment of cattleIntramammary treatment of cattle
4.
ANTIMICROBIAL CONSUMPTION IN ANIMALS
Figure 4.4. Antimicrobial consumption(a)in the pig production(b), Denmark4.54.03.5ADD25/ pig producedADD25/ pig produced3.02.52.01.51.00.50.0010203040506070809100.001020304050607080910Total pigsproduced1.0
DANMAP 2010Finishers
0.5
4.03.53.02.5ADD15/ pig produced2.01.51.00.50.001020304050607080910ADD200/sow-yearWeaners
3.02.52.01.51.00.50.0
Sows and piglets
01Tetracyclines
02
03
04
05
06
07
08
09
10
MacrolidesLincosamides (c)CephalosporinsPenicillin/streptomycin
PleuromutilinsPenicillins, otherSulfonam./trimeth.
Penicillins, b-lact. sen. (d)Aminoglycosides
Note: Amphenicols, colistin, fluoroquinolones, intramammaries, gynecologicals and topical drugs are not included in the figure. Datafrom veterinary practice are not included (<1% of the consumption in pigs)a) ADD25: doses for treatment of 25 kg pigs, to compare treatment across age groups. ADD15: Doses for treatment of 15 kg pigs, theassumed average dose for treatment of weaners (7.5–30 kg). ADD50: Doses for treatment of 50 kg pigs, the assumed average dosefor treatment of finishers (30–110 kg), estimate based on the number of pigs produced excluding those pigs exported at 15–50 kg.ADD200: Doses for treatment of 200 kg pigs: the medicines are used either in sows (bodyweight>200 kg) or in piglets (<2 kg–7.5 kg)b) Total pigs produced includes pigs exported at 30 kg, which has increased in numbers from 1.7 million in 2004 to 7.1 million in 2010,comprising 25% of the total consumtion, although consumption in these pigs is included only from birth to 30 kg body weight. Seediscussion in the textc) Beta-lactamase sensitive penicillinsd) Lincosamide/spectinomycin combinations comprise 65% of this group
34
DANMAP 2010
ANTIMICROBIAL CONSUMPTION IN ANIMALSof pleuromutilins increased by 5% in finishers, whilethe consumption in sow herds decreased by 23%.Pleuromutilins have been recommended for sanitationagainstBrachyspira hyodysenteriaein sow herds inDenmark, and the decrease in use of pleuromutilinswas related to the overall decrease in prescription forgastrointestinal disease in sow herds (Figure 4.4).The overall decrease in consumption in pigs wasmainly due to a decrease in consumption in weaningpigs but also in sows (Figure 4.4). In both age groups,the decrease was related to a decrease in prescriptionsfor gastrointestinal disease. In weaning pigs, theprescription for gastrointestinal infections is the majorindication (70% in 2010), and decreased by 10% from6.6 ADD15 in 2009 to 5.9 ADD15 per pig producedin 2010, reaching the level from 2008; the overallprescription for weaning pigs decreased from 9.1 ADD15to 8.4 ADD15 per pig produced. In sow herds, theprescription for gastrointestinal disease decreased by22% from 2.0 ADD200 to 1.6 ADD200/sow-year, whilethe total consumption decreased from 11.6 ADD200 to11.3 ADD200 per sow-year. In finishers, the prescriptionwas 2.9 ADD50 per finisher produced both in 2009 and2010, and no important changed occurred in indication(Figure 4.5). However, a large increase in prescriptionfor gastrointestinal disease was seen from 2008 to 2009.In all age groups, the prescription for respiratory diseasehas been increasing throughout the last decade (Figure4.5).It should be noted that these statistics are derivedfrom the information on indication (disease group)in the VetStat database. The indication is entered by
4.
Figure 4.5. Antimicrobial consumption by indication(a)for sows/piglets, weaner and finisher pigs,Denmark7.06.05.0ADD200/sow-year4.03.02.01.00.0024.54.03.5ADD200/sow-year3.02.52.01.51.00.50.020022003200420052006200720082009201003040506070809100.00203040506070809101.5ADD200/sow-year2.0Weaning pigs
DANMAP 2010Finisher pigs
1.0
0.5
Sow herds, incl. piglets
Urogenital system
Udder
Gastrointestinal system
Respiratory tract
Limbs/joints/CNS/skin
a) The indication given on the prescription. At prescription, VetStat codes are used, representing the target organ system. In thisfigure, indications representing <0.1ADD (per sow year or pig produced) is not shown
DANMAP 2010
35
4.
ANTIMICROBIAL CONSUMPTION IN ANIMALSTable 4.4. Consumption of antimicrobial agents for intramammary application in cattle, Denmark
DANMAP 2010
Antimicrobial agentsPenicillins(b)Aminoglycoside-benzylpenicillincombinations(c)Cephalosporins,1stgenerationCephalosporins,3rdand 4thgenerationOthers(d)TotalADD/cow-year
ATCvetclassesQJ51CE, QJ51CF, QJ51CRQJ51RCQJ51DAQJ51DC, QJ51DD
20054542312062294211632.08
20064642031972553511532.07
20074542021772623111262.07
20085062011692313011382.04
20095992201781562711802.07
20106711761741054411702.04
ADD (1000's)(a)
a) For intramammary treatment, 1 ADD is defined as the dose to treat one teat for 24 hoursb) Includes benzylpenicillin, cloxacillin, and cloxacillin-ampicillin combinationsc) Mainly dihydrostreptomycin-benzyl benicillin combinations; includes also combinations of penicillin/aminoglycoside with bacitracin ornafcillind) Lincosamides, neomycin-lincomycin combinations and trimethoprim-sulfonamide combinations
the veterinarian and refers to either the current orexpected disease within a 30 day period (based on his/her knowledge of the herd). However, the prescribedantimicrobial agents may in some cases be usedfor other diseases than originally indicated on theprescription, in which case it is re-prescribed by theveterinarian at the farm. Such re-prescriptions are notregistered in VetStat.4.3.2 Antimicrobial consumption in cattleIn 2010, it was estimated that14.6 tonnes ofantimicrobial substance were prescribed for cattle,as compared to 15 tonnes in 2009, representing a 3%decrease (Table 4.3). These estimates are based onpharmacy data, including prescription for cattle andcattle practiceConsumption of antimicrobial agents for systemicuse in cattle (2005–2010), given as Animal DailyDoses (ADDs) to different age groups, are presentedin Appendix 1 (Table AP1.2). For cattle, data are onlyshown for the period 2005–2010, because data qualitywas not acceptable before 2005 due to reporting errors.Before 2006, the majority of medicines for cows werepurchased through veterinary practices, and in 2002–2006, up to 20% of some of the antimicrobial used inpractice were missing due to technical errors in theamounts reported and the data transmissions. However,in 2010, underreporting from veterinary practicehad reached a level of 5–10%, corresponding to anoverall 2–5% underreporting on age group level. Thus,information about age groups was available for 95–98%of the total consumption.Pharmacy data have a very high quality, and theoverall improvement of data quality for cattle is alsoa result of an increasing proportion of the medicinebeing purchased through the pharmacies. In 2010,approximately half of the antimicrobial agents for cowswere purchased through the pharmacies.36
Based on the type of technical errors, we assume thatthe missing data are random, and thus that the datafrom the veterinarians are representative for the relativechoice of drugs over time.From the pharmacy sales, data for cattle practice, andthoroughly validated data from veterinary practices, itcan be concluded that the antimicrobial consumptionin cattle has been stable, between 14–15 tonnes during2005–2009. During this period, the veal and beef pro-duction has decreased by 2% and the milk productionhas increased by 9% (Table 4.1).The temporal trend in choice of drug for systemic useis shown in Figures 4.6 and 4.7. In 2010, the relative useof beta-lactam sensitive penicillins for systemic use incows increased by 3.5%, mainly related to a relative de-crease in the usage of tetracyclines (4%) and macrolides(29%). The major indication for treatment of cows wasmastitis (64% of systemic use). Also for intramammarytreatment, penicillins - mainly narrow spectrum (beta-lactamase sensitive and beta-lactmase resistant) - wasthe major class, comprising 57% of the treatments (Table4.4). Combinations of benzylpenicillins (mainly withdihydrostreptomycin) comprised an additional 15%.In cows and bulls, the proportional use of beta-lacta-mase sensitive penicilins has increased from 48% in2005 to 59% of the overall consumption in 2010, whilethe use of macrolides decreased from 11% to 3% of theconsumption for systemic use in cows. This is in accord-ance with the official guidelines.The use of intramammary treatment has been stableduring 2005–2010, while the proportion of narrowspectrum penicillins increased from 39% to 57% ofthe treatments (Table 4.4). From 2005 to 2010, the useof intramammary treatments has decreased by 2%measured in ADD per cow-year.
DANMAP 2010
ANTIMICROBIAL CONSUMPTION IN ANIMALSFigure 4.6. Proportional consumption (in ADD) of antimicrobial agents(a)for systemic treatment in cows andbulls, Denmark10090807060Percent5040Penicillins, β-lactamase sensitive3020100200520062007200820092010Penicillins, otherSulfonamide/trimethoprim
4.
DANMAP 2010Penicillin/streptomycin
Macrolides
Cephalosporins (3rd and 4th gen.)
Tetracyclines
a) The antimicrobials not shown (amphenicols, fluoroquionolones, lincosamides, aminoglycosides, colistin and pleuromutilins ), eachaccount for less than one percent of the consumption
Figure 4.7. Proportional consumption (in ADD) of antimicrobial agents(a)for systemic treatment in calves,Denmark10090807060Percent50403020100200520062007200820092010Colistin (local GI)AminoglycosidesPenicillin/streptomycinMacrolidesSulfonamide/trimethoprimCephalosporins (3rd and 4th gen.)Penicillins, β-lactamase sensitivePenicillins, otherTetracyclinesAmphenicols
DANMAP 2010
a) The antimicrobials not shown (fluoroquionolones, lincosamides, and pleuromutilins), each account for less than one percent of theconsumption
DANMAP 2010
37
4.
ANTIMICROBIAL CONSUMPTION IN ANIMALSIn calves, the major drug of choice in 2010 wastetracyclines (mainly oxytetracyclines), and theconsumption increased from 26% in 2009 to 30% in2010. From 2006 to 2009, macrolides were the mostfrequently used class, but the use was reduced from35% in 2009 to 24% in 2010, in accordance with theofficial guidelines. The major indication in calves wasrespiratory disease (64% of systemic use).The use of fluoroquinolones in cattle was only 1 kgactive compound, and has remained at a low levelsince 2003. As in 2009, the consumption of 3rd and4th generation cephalosporins decreased in 2010both in cows and in calves. Systemic use decreasedby 17% and intramammary use decreased by 29%.Overall since 2008, when the consumption measuredin kg active substance was highest, the consumptionof 3rd and 4th generation cephalosporins for systemicand intramammary use has decreased by 29% and50% (Figure 4.4, Table 4.4). These trends in choice ofantimicrobial agents for intramammary treatment mayreflect a response to debate, guidelines and informationin recent years, about the consequences regardingdevelopment of ESBL. However, they may also bethe result of new regulations that require testing forantimicrobial resistance in cases where antimicrobialagents other than simple penicillins are prescribed formastitis.4.3.3 Antimicrobial consumption in poultryIn Denmark, the poultry production is comprisedmainly of broiler production (Gallusgallus),followedby egg layers (Gallusgallus)and turkey production. Inaddition, there is a minor production of ducks, geese,and game birds, while pigeons are kept for sports.Consumption of antimicrobial agents for systemicuse in poultry (2001–2010), given as Animal DailyDoses (ADDs) to the different species, are presented inAppendix 1 (Table AP1.3).In 2010, the total antimicrobial consumption inpoultry was 879 tonnes active substance (Table 4.3),representing an 18% decrease compared to 2009.However, this was still higher than the levels in previousyears (2001–2008). In general, increasing diseaseproblems caused a steep increase in antimicrobialconsumption for poultry in 2009 (see DANMAP 2009);these disease problems seems to be under control in2010, as indicated by the decrease in antimicrobialconsumption, both for the layers, rearing for broilerproduction, and the turkey production; however,further increased use was observed in broilers.The antimicrobial consumption in domestic fowl(Gallusgallus)is generally at a very low level (Figure4.8). Therefore, few disease outbreaks in some farmsimportantly affect the national consumption indomestic fowl, causing considerable fluctuations inannual consumption.The total consumption in broilers in 2010 was 429 kgincluding breeding and rearing (Table 4.3). For broilers,an additional increase in consumption was observedin 2010, mainly in the prescription of amoxicillin,which was still the major drug of choice (Figure4.8). Prescription for 79 broiler farms was registered,corresponding to 28% of the broiler farms [StatisticsDenmark 2011]. According to some of the majorpoultry practitioners, at least part of the increase inantimicrobial consumption was related to outbreaks ofdiarrhoea associated with coccidiosis, due to treatmentfailure (resistance to salinomycin). Due to the decreasein consumption in the parent and grandparent flocks(breeding and rearing), the overall consumption (0.014ADDkg/kg meat produced) in the broiler productionwas at the same level as in 2009, but two–five timeshigher than in previous years (Figure 4.8).The antimicrobial consumption in the layer production(Gallusgallus)is quite low, and the total consumption in2010 was only 48 kg (Table 4.3). Measured in ADDkgperkg eggs produced, the consumption in layers includingrearing in 2010 was at the same level as in 2009, a levelthree to four times lower than in the broiler production,however the production (meat vs. eggs) is not fullycomparable (Figure 4.8).In turkeys, the annual consumption is highly variable.In 2010, the consumption again decreased to a relativelylow level to a total of 252 kg or 0.62 ADDkg/kg meatproduced (Table 4.3 and Figure 4.8). According to thepoultry practitioners, the 2009 increase in prescriptionin turkeys was mainly due toPasteurella multocidainfections, and a vaccination campaign was conductedto control the disease in April–October 2009. Also,vaccination against haemorrhagic enteritis (viral) inturkeys was initiated in April 2010.In 2010, tetracyclines comprised 70% of theantimicrobial consumption in turkeys, and havefrom 2008 been the major drug of choice. However,before 2007, amoxicillin constituted 70–99% of theconsumption in turkeys, while the use had decreasedto 3% in 2010. The changes in prescription occurredafter the marketing of tetracyclines and other agentsfor use in poultry during 2007–2008. Before 2007,only amoxicillin and fluoroquinolones were marketedfor poultry. Fluoroquinolones were not used in 2010,neither in the turkey production nor inGallus gallus,and the consumption has decreased since 2006 whenfluoroquinolones comprised 7% of the antimicrobialconsumption in these species.Measured in ADDkg per kg meat produced, theconsumption in ducks and geese increased three fold in2010, a level approximately three times higher (per kgmeat produced) than in the broiler production (Figure4.8).Annual production data are not available for gamebirds. The population was estimated at 1 millionpheasants, 0.5 million ducks and 0.1 million otherbirds in 2004. Assuming a constant population, theantimicrobial consumption in game birds has beenstable during 2002–2009; around 1 ADDkg/kg meatproduced (Appendix 1, Table AP1.3). At least part of theapparent increase in consumption in 2010 is due to a
38
DANMAP 2010
ANTIMICROBIAL CONSUMPTION IN ANIMALS
4.
Figure 4.8. Consumption of antimicrobial agents in the poultry production, DenmarkDANMAP 20100.200.05
Broilerproduction0.15ADDkg/ kg meat producedADDkg/ kg meat produced
0.04
Layerproduction
0.03
0.10
0.02
0.05
0.01
0.00010.5020304050607080910
0.00012.5020304050607080910
Duck and geeseproductionADDkg/ kg meat producedADDkg/ kg meat produced0.4
Turkeyproduction2.0
0.3
1.5
0.2
1.0
0.1
0.5
0.001020304050607080910TetracyclinesPenicillins, b-lactamase sensitiveMacrolidesTotal
0.001020304050607080910
AmoxicillinSulfonamides(a)Others (AMG, FQ, Pleuromut, others)
bias in the previous years of reporting, because missinginformation of poultry species has mostly been relatedto the production of game birds. Thus, the increase inregistered consumption for game birds is - at least inpart - related to the decrease in the “species unknown”category.4.3.4 Antimicrobial consumption in fur animals,aquaculture and pet animalsThe production of fur animals included 14 millionmink, 34,000 chinchillas and a minor production offoxes in 2010 (as in 2009). In 2010, the consumption infur animals increased to 3,714 kg in 2010, representinga 16% increase compared with 2009. Please note thatthe data in DANMAP 2009 are not directly comparable,when including all data reported from practice, theconsumption amounted to 3,200 kg in 2009. In 2010,
aminopenicillins remained the most commonly usedantimicrobial class in fur animals, increasing to 41% ofthe antimicrobial consumption (kg active substance)in 2010. Macrolides, tetracyclines and sulfonamide-trimethoprim combinations comprised another 56%.Fluoroquinolones were not used in 2010.The antimicrobial consumption in aquaculturedecreased by 7% to 3,060 kg in 2010 compared to2009 (Figure 4.1). In aquaculture, the major classof antimicrobial was sulfonamide/trimethoprim,comprising 66% of the consumption in aquaculture. Theconsumption of quinolones (oxolinic acid) comprised27% of the consumption in aquaculture in 2010, and hasincreased continuously since 2007. The overall decreasewas mainly due a change in choice of antimicrobialagents towards oxolinic acid (10 mg/kg), which has amuch lower dosage than sulfonamide-trimethoprim(30 mg/kg). The consumption in salt water fish wasDANMAP 201039
4.
ANTIMICROBIAL CONSUMPTION IN ANIMALS
9 ADDkg/kg fish produced in 2009 and 2010. Theantimicrobial consumption in salt water aquaculturepeaked in 2006, reaching 13 ADDkg/kg fish produced,due to an unusually warm summer. Fish production isvery sensitive to water temperatures, but also increasingvaccination intensity has caused a gradual 51% decreasein antimicrobial use in salt water aquaculture through2006–2010 [personal communication: N.H. Henriksen,Danish Aquaculture]. Regarding fish produced in freshwater, the consumption is more stable around 2 ADDkg/kg fish produced; the consumption increased by 8% toADDkg/kg fish produced from 1.8 ADDkg/kg in 2009,to 2.0 ADDkg/kg in 2010, when assuming the sameproduction volume as in 2009. The increase was mostlikely related to a failure in vaccine deliveries duringwinter 2009–2010 [personal communication: N.H.Henriksen, Danish Aquaculture].
The consumption of antimicrobial agents in companionanimals (pet animals and horses) was 3 tonnes,estimated from the prescription for these species andsales for companion animal practices. This is higherthan the estimated 2.2 tonnes in 2009, but this is partlydue to an underestimation in previous years. Lookingat oral medicines for pet animals only, the prescriptiondid not increase from 2009 to 2010, however, duringthe past decade the veterinary prescription of oralmedicines increased by 24%. The major antimicrobialagent used in pet animals, amoxicillin in combinationwith clavulanic acid, increased by 3% to 539 kg in 2010compared to 2009, as part of a continuous increaseover the past decade. Other frequently used drugs werecephalosporins (317 kg), mainly first generation for oraluse, representing a 9% decrease compared to 2009. Inpet animals, the consumption of 3rd and 4th generationcephalosporin was an estimated 3 kg, correspondingto 1.8% of the total veterinary consumption ofthese antimicrobials. The use of fluoroquinolonesin pet animals was estimated 14 kg in 2010 and thiscorresponded to 72% of the total veterinary use offluoroquinolones in Denmark.Vibeke Frøkjær Jensen andVibe Dalhoff Andersen
40
DANMAP 2010
ANTIMICROBIAL CONSUMPTION IN HUMANS
5
DANMAP 2010
41
5.
ANTIMICROBIAL CONSUMPTION IN HUMANS
5. Antimicrobial consumptions in humans5.1 IntroductionAll systemic antimicrobial agents used in Denmark areprescription medications only, and all Danish medicaldoctors have the right to prescribe freely what they findappropriate for their patients. There are no restrictionsin the prescribing of antibacterial agents. Nationalguidelines exist for the prudent use of antibacterialagents, as well as local guidelines from each of theDepartments of Clinical Microbiology (DCM); takinginto account the local resistance patterns.Throughout the ‘Antimicrobial consumption inhumans’ section, the consumption of 2010 is comparedwith the consumption of 2009 and of the last decade(2001), respectively. Also, combinations of penicillins,incl. beta-lactamase inhibitors (J01CR) are referred toas ‘combination penicillins’.Antibacterial agents used for systemic treatment inhumans (and in animals) are listed in Table 3.2.Narrow- & Broad-spectrum Agents.Antibacterial
agents have been classified as either narrow-spectrumor broad-spectrum agents according to the width ofthe activity against Gram-positive and Gram-negativebacteria (Table 5.1).Defined Daily Dose (DDD).The DDD is the assumed
average maintenance dose per day for a drug used for itsmain indication in adults. It should be emphasised thatDDD is a unit of measurement and does not necessarilyreflect the recommended or prescribed daily dose[http://www.whoc.no].DDD per 1,000 inhabitants per day (DID).
Consumption in primary health care is presentedin DID. Also, consumption in hospital care(rehabilitation centres, hospices, private-, psychiatric-,specialised-, and somatic hospitals) and the mergedtotal consumption is presented in DID enabling thecomparison of the two sectors, and illustrating theconsumption in hospital care without the activity in
Table 5.1. Classification of antibacterial agents for systemic use in humans into narrow-spectrum and broad-spectrum agents, Denmark
DANMAP 2010
ATC group(a)J01CEJ01CFJ01DBJ01DFJ01EAJ01EBJ01FAJ01FFJ01XAJ01XCJ01XDJ01XEJ01XXJ01AAJ01CAJ01CRJ01DJ01DCJ01DDJ01DHJ01EEJ01GBJ01MAJ01XB
Narrow-spectrumBeta-lactamase sensitive penicillinsBeta-lactamase resistant penicillinsFirst-generation cephalosporins (included in data from primary health care as a broad-spectrum agent in the group J01D)MonobactamsTrimethoprim and derivativesShort-acting sulfonamidesMacrolidesLincosamidesGlycopeptidesSteroid antibacterials (fusidic acid)Imidazol derivativesNitrofuran derivatives (nitrofurantoin)Other antibacterialsBroad-spectrumTetracyclinesPenicillins with extended spectrumCombinations of penicillins, incl. beta-lactamase inhibitorsCephalosporins and related substances (primary health care only)Second-generation cephalosporinsThird-generation cephalosporinsCarbapenemsCombinations of sulfonamides and trimethoprim, incl. derivativesAminoglycosidesFluoroquinolonesPolymyxins
Therapeutic group
a) From the 2010 edition of the Anatomical Therapeutic Chemical (ATC) classification system
42
DANMAP 2010
ANTIMICROBIAL CONSUMPTION IN HUMANS
5.
the hospitals. Data presented in DID provide a roughestimate of the proportion of the population withina defined area treated daily with certain drugs. Forexample, 10 DIDs indicates that 1% of the populationon average gets a certain treatment daily.Packages per 1,000 inhabitants per year.Assuming
care and hospital careTotal consumption compared with 2009
that one package is prescribed for one prescription,packages per 1,000 inhabitants per year serve as asurrogate for prescriptions or treatments given to theprimary health care population.Treated patients per 1,000 inhabitants per year.
Illustrates the number of patients treated in primaryhealth care.Kilogram.To allow comparison with consumption
In 2010, the total consumption of antibacterial agentsfor systemic use (primary health care and hospital care)increased by 5%: from 17.89 DDDs per 1,000 inhabitantsper day (DID) in 2009 to 18.84 DID in 2010 (Figure 5.1).The increase was noticed in primary health care only,whereas the consumption in hospital care was similarto the year before. Broad-spectrum agents increased by7%; representing 7.76 DID of the total consumption in2010 compared with 7.24 DID in 2009 (Figure 5.2). Thepercentage of DDDs prescribed in primary health carerepresented 90% of the total human consumption.Figure 5.3 shows the distribution of the total numberof DIDs of antibacterial agents between primary healthcare and hospital care. For example, sulfonamides andtrimethoprim (J01E) and beta-lactamase resistantpenicillins (J01CF) had a ratio of consumption inprimary health care vs. consumption in hospital care ofaround 9/1 and 6/1, respectively.Total consumption - the last decade
of antibacterial agents in animals, total humanconsumption is also presented in kilograms.
DDD per 100 occupied bed-days (DBD) and DDDper 100 admissions (DAD).Consumption in somatic
hospitals is presented in both DBD and DAD toinclude the activity in hospitals. DAD is introduced inthis report, since it is the internationally recognisedabbreviation. It is the same measure as DDD per 100discharges (discharged patients) which has been usedin the previous DANMAP reports.
5.2 Total consumption of both primary health
Since 2001, consumption has increased by 4.54 DID(32%) (Figure 5.1). Also, broad-spectrum agents haveincreased by 3.3 DID (74%); comprising 41% of thetotal consumption in 2010 compared with 31% in 2001(Figure 5.2). During the last decade, the proportion ofDDDs prescribed in primary health care represented89–90% of the total human consumption.To view the detailed distribution of DIDs amongantibacterial groups in primary health care and hospitalcare, please refer to Table 5.3 and Table AP1.4 inAppendix 1, respectively.Total consumption in kilograms
In 2010, 50.67 tonnes of antibacterial agents for systemicuse were used in humans in Denmark representing anincrease of 2.06 tonnes (4%) compared with 2009, andan increase of 8.67 tonnes (21%) compared with 2001(Table 5.2).
DANMAP 2010
43
5.
ANTIMICROBIAL CONSUMPTION IN HUMANS
Figure 5.1. Total consumption of antibacterial agents (J01) in humans by sector, DenmarkDANMAP 20101.912010201011.087.7616.93201.6718DDD/1000 inhabitant-days1.451.511614121086412.8513.2613.5314.0614.7515.2316.1715.91202001200220032004200520062007Hospital care
1.81
1.51
1.56
1.70
1.89
2008
2009
Primary health care
Figure 5.2. Total consumption of antibacterial agents (J01) in humans by narrow-spectrum(a)and broad-spectrum(b)agents, DenmarkDANMAP 201020186.545.465.8616DDD/1000 inhabitant-days4.474.604.7314121086410.1710.3110.6110.9611.0511.4410.929.84202001200220032004Narrow-spectrum
5.01
6.88
2005
2006
2007
2008
2009
Broad-spectrum
a) Narrow-spectrum includes: beta-lactamase sensitive penicillins, beta-lactamase resistant penicillins, trimethoprim, sulfonamides,macrolides, lincosamides, glycopeptides, fusidic acid, imidazol derivatives, nitrofuran derivatives and ‘other antibiotics’b) Broad-spectrum includes: tetracyclines, penicillins with extended spectrum, combinations of penicillins incl. beta-lactamaseinhibitors, cephalosporins and related substances, combinations of sulfonamides and trimethoprim, aminoglycosides,fluoroquinolones and polymyxins
44
DANMAP 2010
10.65
7.24
15.95
1.94
ANTIMICROBIAL CONSUMPTION IN HUMANS
5.
Figure 5.3. Distribution of DIDs between primary health care and hospital care, DenmarkDANMAP 2010J01CR Penicillins, incl. beta-lactamase inhibitorsJ01D Cephalosporins and related substancesJ01E Sulfonamides and trimethoprimJ01G AminoglycosidesJ01MA FluoroquinolonesJ01XA GlycopeptidesJ01XB PolymyxinsJ01XC Steroid antibacterials (fusidic acid)J01XD Imidazol derivativesJ01XE Nitrofuran derivatives (nitrofurantoin)J01XX Other antibacterials0.000.250.50DDD/1000 inhabitant-daysJ01AA TetracyclinesJ01CA Penicillins with extended spectrumJ01CE Beta-lactamase sensitive penicillinsJ01CF Beta-lactamase resistant penicillinsJ01F Macrolides, lincosamides andstreptogramins0.01.02.03.04.0Primary health careHospitalsPrimary health careHospitals
0.75
1.00
5.0
6.0
DDD/1000 inhabitant-days
DANMAP 2010
45
5.
ANTIMICROBIAL CONSUMPTION IN HUMANS
Table 5.2. Consumption of antibacterial agents for systemic use in humans (kg active substance), DenmarkDANMAP 2010
ATC groupJ01AAJ01BJ01CAJ01CEJ01CFJ01CRJ01DJ01EAJ01EBJ01EEJ01FAJ01FFJ01GJ01MAJ01XAJ01XCJ01XDJ01XE
(a)
Therapeutic groupTetracyclinesAmphenicolsPenicillins with extended5385 5356 5295spectrumBeta-lactamase sensitive20730 21263 21630penicillinsBeta-lactamase resistant3230 3738 4075penicillinsComb. of penicillins,including beta-lactamase146249336inhibitorsCephalosporins and related739811830substances(b)Trimethoprim and derivatives 280293307Short-acting sulfonamides3113 3092 3064Comb. of sulfonamides andtrimethoprim, including289288273derivativesMacrolides(c)4089 4150 3876(b)Lincosamides374045Aminoglycosides303128(b)Fluoroquinolones398451611Glycopeptides364243Steroid antibacterials (fusidic595958acid)Imidazoles168179191Nitrofuran derivatives155163166(nitrofurantoin)Methenamine(b)1637 1662 1590Linezolid, daptomycin034Antibacterial agents for41997 43371 43964systemic use (total)(d)2001147512002150102003154202004163605346
Year200517480556120061835057222007185506188200818840606120092039060762010216106317
22230 22520 22760 24003 22466 21744 2230143774808943343067185374353317224652195171147354565534158235929872083775523186651622061801107104842724177838228652083542662797956651981851076145037101222854022565148343478271162616720219010601251831348253040222731833164942513516464241192108714525018362740399220019329661132313718662255201104714541825972696417215825230381242414578965258208107813
J01XX05J01XX08+09J01
45040 46404 47324 49788 48629 48614 50673
Note: Includes data from both primary health care and hospital care and has been recalculated from original data expressed as DDDs. Formonitoring in human primary health care and hospital care, the recommended way of expressing consumption is DDDs per 1000 inhabitant-days and DDDs per 100 occupied bed-days / DDDs per 100 admissions (see Tables 5.3, 5.5 and 5.6)a) From the 2010 edition of the ATC classification systemb) Since 2005, the kg active substance was estimated taking into account the DDD for each route of administration, e.g. cefuroxime parenteralDDD = 3 g and cefuroxime oral DDD = 0.5 g. From 2001 to 2004, it was estimated with a DDD corresponding to an average for the variousroutes, e.g. for cefuroxime: 1.75 gc) When two different DDDs of an antimicrobial agent existed for different presentations, an average DDD was used. Estimates using thelowest and the highest calculated limit are 2473–3603 for 2010d) Does not include polymyxins
46
DANMAP 2010
ANTIMICROBIAL CONSUMPTION IN HUMANS
5.
5.3. Primary health care5.3.1 Total consumption in primaryhealth careTotal consumption compared with 2009
In 2010, the total consumption of antibacterial agentsfor systemic use (J01) in primary health care increasedby 6% to 16.93 DID compared with 15.95 DID in2009, and increases were observed for 10/19 of thetherapeutic groups (Table 5.3). Four therapeuticgroups constituted most of the increase: macrolides(0.23 DID); ‘combination penicillins’ (0.23 DID);penicillins with extended spectrum (0.18 DID);and beta-lactamase sensitive penicillins (0.13 DID).Consumption decreased within only one group: short-acting sulfonamides 0.01 DID (2%).
The increase this year of 0.98 DID (6%) was the largestincrease observed, since the DANMAP programme wasinitiated in 1995. Each treated patient, in primary healthcare, used almost equal numbers of DDD comparedwith 2009 (19.6 DDD vs. 19.2 DDD), as demonstratedin paragraph 5.3.2. However, more patients were treatedin 2010 with additional packages prescribed (TablesAP1.4, AP1.5 in appendix 1). The fact that more patientswere treated in 2010 - at least once by an antibacterialagent with an equal number of DDDs per patient - hasled to the increase in consumption.The observed increase in consumption was markedlylarger in the second half of 2010, both for totalconsumption (J01), but also for macrolides and beta-lactamase sensitive penicillins. This coincided with anincreased burden of lower respiratory tract infections(LRTI) in the second half of 2010, confirmed by anoutbreak ofMycoplasma pneumoniaein the (third
Table 5.3. Consumption of antibacterial agents for systemic use in primary health care (DDD/1000 inhabitant-days), DenmarkDANMAP 2010
ATCgroup(a)J01AAJ01CAJ01CEJ01CFJ01CRJ01DJ01EAJ01EBJ01EEJ01FAJ01FFJ01GBJ01MAJ01XAJ01XBJ01XCJ01XEJ01XXJ01
Therapeutic groupTetracyclinesPenicillins with extended spectrumBeta-lactamase sensitive penicillinsBeta-lactamase resistant penicillinsCombinations of penicillins,including beta-lactamase inhibitorsCephalosporins and relatedsubstancesTrimethoprim and derivativesShort-acting sulfonamidesCombinations of sulfonamides andtrimethoprim, including derivativesMacrolidesLincosamidesAminoglycosidesFluoroquinolonesGlycopeptidesPolymyxinsSteroid antibacterials (fusidic acid)Nitrofuran derivatives(nitrofurantoin)Other antibacterials(methenamine >99%)Antibacterial agents for systemic use(total)
20010.992.474.910.650.030.030.350.360.042.100.010.010.170.000.020.010.390.33
20021.042.515.000.770.040.030.360.360.032.150.010.010.180.000.020.010.410.34
20031.072.525.070.850.050.020.380.360.032.130.010.010.250.000.020.010.420.32
20041.172.635.200.920.060.020.410.360.002.230.010.010.280.000.020.010.430.30
Year2005 20061.28 1.382.79 2.955.28 5.400.97 1.050.080.030.440.350.002.410.010.010.330.000.020.010.450.280.120.030.470.350.002.310.020.010.370.000.020.010.460.27
20071.483.255.671.090.190.030.490.310.002.420.020.010.440.000.020.020.470.26
20081.543.265.301.120.270.030.490.280.002.280.030.010.510.000.020.020.470.27
20091.613.295.121.130.450.030.480.270.002.210.030.010.520.000.020.010.490.26
20101.693.475.251.170.680.030.510.260.002.440.040.010.570.000.020.010.510.27
12.85 13.26 13.53 14.06 14.75 15.23 16.17 15.91 15.95 16.93
a) From the 2010 edition of the Anatomical Therapeutic Chemical (ATC) classification system
DANMAP 2010
47
5.
ANTIMICROBIAL CONSUMPTION IN HUMANS
and) fourth quarter of 2010 (Figure 5.11). LRTI’s ofsuspected bacteriological origin are empirically treatedwith beta-lactamase sensitive penicillins, and confirmedM. pneumoniaepneumonia by macrolides accordingto guidelines in Denmark. Therefore, it is a likelyconclusion that theM. pneumoniaepneumonia outbreakexplains a good part of the increased consumption.Unfortunately, indication codes are incomplete, andtherefore this presumption cannot be verified.Another important factor was the increasedconsumption of ‘combination penicillins’, contributing23% of the total increase. In this therapeutic group,indeed more patients were treated in 2010 withadditional packages pre-scribed (Tables AP1.4 andAP1.5 in appendix 1), and additional DDD’s weregiven to each treated patient (Table 5.4). For possibleexplanations to this increase; refer to paragraph 5.3.2.Beta-lactamase sensitive penicillins still representedthe largest therapeutic group of antibacterial agentsconsumed (31%) followed by penicillins with extendedspectrum (20%) and macrolides (15%) (Figure 5.4).Penicil-lins (J01C) accounted for 62% of the totalconsumption in 2010. Consumption of broad-spectrumagents increased by 0.53 DID (9%) compared with 2009(Figure 5.5).
Total consumption - the last decade
Antibacterial consumption (J01) increased by 32%from 12.85 DID in 2001 to 16.93 DID in 2010 (Table5.3). Broad-spectrum agents represented 6.48 DID(38%) of the total consumption in 2010 compared with3.75 DID (29%) in 2001; representing an increase of73% (Figure 5.5). For all leading groups of antibacterialagents (tetracyclines, penicillins with extendedspectrum, beta-lactamase sensitive penicillins, beta-lactamase resistant penicillins, ‘combination penicillins’,macrolides, and fluoroquinolones) consumption washigher in 2010 than 10 years before, and for mostgroups the trend in consumption has been a steadyincrease year by year (Figure 5.6). Only short-actingsulfonamides (J01EB) and ‘other antibiotics’ (J01XX)were at a lower reported level in 2010 compared with2001.5.3.2 Measures at treated patient levelMeasures at treated patient level compared with2009
The total number (J01) of DDDs per treated patientwas 19.6 in 2010 compared with 19.2 in 2009. Amongsubstances with the highest consumption (DID), eachtreated patient received from 11–21 DDDs in 1.4–1.6packages with the exception of tetracyclines (45.2
Figure 5.4. Distribution of the total consumption of antibacterial agents in primary health care, DenmarkDANMAP 2010Tetracyclines (J01AA);10%Beta-lactamase resistantpenicillins (J01CF); 7%Sulfonamides andtrimethoprim (J01E); 5%Penicillins with extendedspectrum (J01CA); 20%Comb. of penicillins, incl.beta-lactamase inhib.(J01CR); 4%Fluoroquinolones(J01MA); 3%
Macrolides, lincosamidesand streptogramins(J01F); 15%
Other antibacterials(J01D,G,X); 5%Beta-lactamase sensitivepenicillins (J01CE); 31%
48
DANMAP 2010
ANTIMICROBIAL CONSUMPTION IN HUMANS
5.
Figure 5.5. Consumption of antibacterial agents (J01) in primary health care by narrow-spectrum(a)andbroad-spectrum(b)agents, Denmark20
DANMAP 2010
DDD/1000 inhabitant-days
10
5
3.75
3.85
3.98
4.20
10.22
4.53
10.35
4.88
10.76
10.26
5.65
10.01
5.94
15
5.41
02001200220032004200520062007Broad-spectrum200820092010
Narrow-spectrum
a) Narrow-spectrum includes: beta-lactamase sensitive penicillins, beta-lactamase resistant penicillins, trimethoprim, sulfonamides,macrolides, lincosamides, glycopeptides, fusidic acid, imidazol derivatives, nitrofuran derivatives, and ‘other antibiotics’b) Broad-spectrum includes: tetracyclines, penicillins with extended spectrum, combinations of penicillins incl. beta-lactamaseinhibitors, cephalosporins and related substances, combinations of sulfonamides and trimethoprim, aminoglycosides,fluoroquinolones and polymyxins
Figure 5.6. Consumption of leading antibacterial groups for systemic use in primary health care, DenmarkDANMAP 20106Beta-lactam. sens. penicillins(J01CE)Penicillins with extend. spectrum(J01CA)
5
DDD/1000 inhabitant-days
4
Macrolides (J01FA)Tetracyclines (J01AA)Beta-lactam. resis. penicillins(J01CF)Fluoroquinolones (J01MA)
3
2
1
Combinations of penicillins,including beta-lactamase inhibitors(J01CR)
02001200220032004200520062007200820092010
DANMAP 2010
10.46
9.10
9.41
9.55
9.86
6.48
49
5.
ANTIMICROBIAL CONSUMPTION IN HUMANS
DDDs in 2.0 packages) (Table 5.4 and Table AP1.6 inappendix 1).Measures at treated patient level - the last decade
tablets could be explanatory for this trend as pointed outin DANMAP 2008.Penicillins with extended spectrum:a few low-strengthpackages (for children) are no longer marketed (higherstrength packages are prescribed for small children) andnational guidelines have increased the recommendeddosage of certain substances over the last decade[DANMAP 2008].Beta-lactamase sensitive penicillins:some low-strength packages (for children) are no longer marketedwhile packages with higher strength have beenintroduced (higher strength packages are prescribed forsmall children); recommended dosage has increasedfor certain indications over the last decade [DANMAP2008].Beta-lactamase resistant penicillins:no changesin packages have occurred over the last decade, butnational guidelines have introduced new indications oftreatment for certain infections (mastitis and impetigo)over the last decade [DANMAP 2008].
Different indicators of antibacterial consumptionat treated patient level in primary health care areavailable (Figure 5.7). Comparing 2001–2010, DDD’shave been the indicator increasing the most; both asan increasing number of DDDs per treated patient(25%) and as DDDs per prescribed package (20%)(Table 5.4). Tetracyclines, ‘combination penicillins’, andfluoroquinolones have shown the largest increases.The nature of these changes in trends found over thelast decade are not clear, mainly because codes ofindication are incomplete as pointed out in Textbox 3,DANMAP 2008. A list of the changes in packages andguidelines that have occurred during the last decadethat could help to explain these trends is displayedbelow.Tetracyclines:the available packages (size andstrength) have not been altered over the last decade.Prescriptions of packages with higher numbers of
Table 5.4. Number of DDDs and packages per treated patient among leading groups of antibacterial agents inprimary health care, DenmarkDANMAP 2010
ATCgroup(a)J01AA
J01CA
J01CE
J01CF
J01CR
J01FA
J01MA
J01
Year2001 2002 2003 2004 2005 2006 2007 2008 2009 2010DDDs / patient30.6 33.0 34.4 36.9 39.0 40.9 43.0 44.4 45.2 45.9TetracyclinesPackages / patient 1.91.91.91.92.01.92.02.02.0 2.0DDDs / package16.1 17.5 18.1 19.0 19.6 21.0 22.0 22.7 22.7 22.7DDDs / patient13.0 13.2 13.4 13.6 13.9 14.2 14.4 14.7 14.8 14.9Penicillins withPackages / patient 1.61.61.61.61.61.61.61.61.6 1.6extended spectrumDDDs / package8.18.28.28.48.58.99.09.29.2 9.0DDDs / patient10.3 10.5 10.7 11.1 11.3 11.5 11.7 11.8 11.8 11.8Beta-lactamasePackages / patient 1.41.51.51.51.51.41.41.41.4 1.4sensitive penicillinsDDDs / package7.17.27.37.57.78.08.28.28.4 8.4DDDs / patient12.4 11.8 11.8 12.4 12.7 13.0 13.4 13.7 13.9 14.2Beta-lactamasePackages / patient 1.61.61.61.61.61.51.51.51.5 1.5resistant penicillinsDDDs / package7.97.57.47.88.08.68.79.09.1 9.3DDDs / patient15.9 14.7 16.6 17.2 16.8 19.3 19.1 19.9 20.4 21.1Combinations ofpenicillins, incl. beta- Packages / patient 1.71.71.82.02.01.81.61.61.5 1.5lactamase inhibitorsDDDs / package9.18.69.19.19.3 10.7 11.7 12.4 13.3 13.7DDDs / patient11.3 11.7 12.1 12.4 12.4 12.6 12.4 12.5 12.5 12.2MacrolidesPackages / patient 1.51.51.61.61.61.51.51.51.5 1.5DDDs / package7.57.67.87.98.08.38.18.18.1 8.1DDDs / patient8.38.6 10.3 9.59.6 10.3 10.6 11.0 11.2 11.2FluoroquinolonesPackages / patient 1.41.41.61.51.51.51.51.51.5 1.5DDDs / package5.96.06.66.46.56.97.07.57.6 7.6DDDs / patient15.6 16.0 16.4 17.0 17.5 17.9 17.3 18.9 19.2 19.6Antibacterial agentsPackages / patient 2.02.02.12.12.12.01.92.12.1 2.1for systemic use (total)DDDs / package7.87.87.98.18.38.78.99.19.3 9.3Therapeutic groupIndicator
a) From the 2010 edition of the Anatomical Therapeutic Chemical (ATC) classification system
50
DANMAP 2010
ANTIMICROBIAL CONSUMPTION IN HUMANS‘Combination penicillins’:the proportion ofchildren (<15 years) receiving these substances havedecreased and been replaced by adults as pointedout in the DANMAP 2007 report. As a consequence,the lowest strength packages are no longer marketedand low-strength packages have presumably beenreplaced by packages with higher strength. Also,national guidelines have introduced amoxicillin andclavulanic acid (J01CR02) as first-choice drug fortreatment requiring acute exacerbation of chronicobstructive pulmonary disease, and for the treatmentof recurrent/persistent upper respiratory tractinfections (2007 guideline). In fact, whereas 28%of the consumption was dispensed as mixture (forchildren) in 2001, the fraction was only 5% in 2010.Macrolides:the packages have not changes over thelast decade, but national guidelines have increasedthe recommended treatment dosage for certainindications over the last decade [DANMAP 2008].Fluoroquinolones:National guidelines onlyrecommend these substances as second line choicesfor a limited number of indications, and no changesin packages have occurred over the last decade that
5.
could explain the trends in consumption.5.3.3 Tetracyclines (J01AA)Consumption of tetracyclines (J01AA) comparedwith 2009
In 2010, consumption of tetracyclines increasedby 0.08 DID (5%) compared with 2009 (Table 5.3).Tetracycline (0.71 DID (42%)) was the most usedof the tetracyclines in 2010 followed by doxycycline(0.55 DID (33%)), lymecycline (0.36 DID (21%)) andoxytetracycline (0.07 DID (4%)), respectively (Figure5.8). Within the group, consumption of all substancesincreased in 2010 compared with 2009.Consumption of tetracyclines (J01AA) - the lastdecade
Since 2001, an extensive increase in the consumptionof tetracyclines (0.70 DID (70%)) has been observed(Table 5.3). As previously pointed out in the DANMAP2007 report, a large part of the consumption oftetracyclines is prescribed for teenagers and youngadults, and a binary pattern of consumption has beenobserved (tetracycline and lymecycline with peak
Figure 5.7. Indicators of antibacterial consumption (J01) in primary health care, DenmarkDANMAP 2010130%
Index: 2001 = 100%
120%
110%
100%
90%2001200220032004200520062007200820092010
DDD/1000 inh./day
Packages/1000 inh./year
Treated pat./1000 inh./year (a)
a) Cumulated number of patients treated with anbacterials (ATC-4 level). The Danish Medicines Agency counts the first treatmentwithin each ATC-group for each patient, each year
DANMAP 2010
51
5.
ANTIMICROBIAL CONSUMPTION IN HUMANSvalues in the spring and autumn, doxycycline withpeak values in January and June). Also, 43% of thetetracycline (J01AA07) consumption is known to beprescribed against acne, and 9% of the doxycycline(J01AA02) consumption as malaria prophylaxis[Textbox 3 DANMAP 2008]. However, a totalunderstanding of the increased consumption is notpossible, as codes of indication are incomplete.5.3.4 Penicillins (J01C)Consumption of penicillins (J01C) compared with2009Consumption of penicillins (J01C) - the last decade
In 2010, consumption of penicillins increased by 0.57DID (6%) compared with 2009. The four main groups:penicillins with extended spectrum, beta-lactamasesensitive penicillins, beta-lactamase resistant penicillins,and ‘combination penicillins’ all increased (Table 5.3).The only penicillin that did not increase in 2010 waspivampicillin (J01CA02) (Figure 5.9).
The decreasing consumption of phenoxy-methylpenicillin and amoxicillin seen in 2009 and2008 was not continued in 2010, but a new plateaumay have been reached (Figure 5.9). This lowered levelof consumption could be the result of a decreaseddisease burden after the introduction of a heptavalentconjugate pneumococcal vaccine (PCV7) in the DanishChildhood Immunization Programme in October2007, but this has not been documented. Recently, areport has demonstrated that the incidence of invasivepneumococcal disease has dropped from 20 cases /100,000 inhabitants (1,055 cases per year on average) inthe years prior to the introduction of PCV7 to 18 cases/ 100,000 inhabitants (982 cases per year on average) inthe years after the introduction of PCV7 [EPI-NYT 19,2011].Over the last decade (2001–2010), the consumption ofpenicillins with extended spectrum has increased by1.00 DID (40%), beta-lactamase sensitive penicillinshas increased by 0.35 DID (7%), beta-lactamase
Figure 5.8. Consumption of tetracyclines in primary health care, Denmark1.2
DANMAP 2010
0.9DDD/1000 inhabitant-days
0.6
Doxycycline(J01AA02)Lymecycline(J01AA04)Oxytetracycline(J01AA06)Tetracycline(J01AA07)
0.3
0.02001200220032004200520062007200820092010
Figure 5.9. Consumption of leading penicillins in primary health care, DenmarkDANMAP 20103.56.05.53.0DDD/1000 inhabitant-days2.55.02.04.51.51.00.50.02001200220032004200520062007200820092010Amoxicillin(J01CA04)Pivmecillinam(J01CA08)Phenoxymethylpenicillin (J01CE02)Dicloxacillin(J01CF01)Amoxicillin andenzyme inhibitor(J01CR02)Pivampicillin(J01CA02)
52
DANMAP 2010
ANTIMICROBIAL CONSUMPTION IN HUMANSresistant penicillins has increased by 0.52 DID(80%) and ‘combination penicillins’ has increasedby 0.65 DID (2277%), respectively (Table 5.3).Phenoxymethylpenicillin was still by far the mostconsumed penicillin, but among the other penicillinsthe order has changed during the last decade (Figure5.9).5.3.5 Macrolides (J01FA)Consumption of macrolides (J01FA) compared with2009
5.
2005 [Figure 12, DANMAP 2005], part of the increasein roxithromycin consumption was likely due to anoutbreak ofMycoplasma pneumoniaein the (third and)fourth quarter of 2010 [Rasmussenet al.2010. EuroSurveill. 15. pii: 19708] (Figure 5.11). In fact, macrolideconsumption was 0.91 DID (40%) higher in the fourthquarter of 2010 compared with the fourth quarter of2009.Consumption of macrolides (J01FA) - the lastdecade
The consumption of macrolides increased by 0.23DID (10%) from 2009–2010 (Table 5.3). Within thegroup of macrolides, clarithromycin (0.03 DID),azithromycin (0.04 DID) and erythromycin (0.04 DID)consumption fol-lowed the trends of the previousyears whereas roxithromycin showed a considerableincrease of 0.19 DID (Figure 5.10). As in 2004 and
Over the last decade (2001–2010), roxithromycin (0.79DID) consumption, and to some extend clarithromycin(0.07 DID) and azithromycin (0.02 DID) consumption,has increased while erythromycin (0.54 DID)consumption has decreased (Figure 5.10). Nationalguidelines regarding first-choice macrolide in primaryhealth care have changed from erythromycin towardsfirst roxithromycin (2004 guideline) and subsequently
Figure 5.10. Consumption of macrolides in primary health care, Denmark1.2
DANMAP 2010
0.9DDD/1000 inhabitant-days
Erythromycin(J0FA01)Roxithromycin(J01FA06)Clarithromycin(J01FA09)Azithromycin(J01FA10)
0.6
0.3
0.02001200220032004200520062007200820092010
Figure 5.11. Monthly consumption of macrolides and PCR positiveMycoplasma pneumoniaetests inprimary health care, DenmarkDANMAP 2010300No. of PCR positive tests per month5
250
4
DDD/1000 inhabitant-days
200315021001
50
0JanFebMarAprMayJunJulAugSepOctNovDec
0
PCR positive M. pneumoniae
Macrolides (J01FA)
DANMAP 2010
53
5.
ANTIMICROBIAL CONSUMPTION IN HUMANSclarithromycin (2007 guideline) [DANMAP 2008],but the latter change has not become apparent in thedistribution of the consumption. Throughout the lastdecade, azithromycin has been recommended forurethritis/cervicitis and epididymitis.5.3.6 Fluoroquinolones (J01MA)Consumption of fluoroquinolones (J01MA)compared with 2009
Fluoroquinolone consumption increased by 0.05 DID(10%) compared with 2009 (Table 5.3). Ciprofloxacinaccounted for 94% of the total fluoroquinoloneconsumption in 2010; ofloxacin and moxifloxacin eachaccounted for 2% and 3%, respectively (Figure 5.12).Consumption of fluoroquinolones (J01MA) - the lastdecade
Hospital care is the term for all hospitals in the hospitalcare sector of Denmark i.e. rehabilitation centres,hospices, private-, psychiatric-, specialised-, and somatichospitals. The majority of antibacterial consumptionoccurs in the somatic hospitals (97% of the totalconsumption in hospital care). Antibiotic consumptionis therefore correlated to bed-days in and admissionsto somatic hospitals only, and not to the number ofbed-days in and admissions in all hospital care, sincepsychiatric hospitals contribute a large proportion ofbed-days and admissions to all hospital care.The trends in numbers of occupied bed-days andadmissions to somatic hospitals 2001–2010 are shown inFigure 5.13. The regional numbers of occupied bed-daysand admissions to somatic hospitals 2010 are displayedin table AP1.7 in appendix 1.In Denmark, the hospitalization pattern has changedover the last decade. Today, more people are admittedto the somatic hospitals, but each length of stay hasshortened. Also, outpatient treatment has increased.Consequently, the hospital activity and the selectionpressure for the emergence of resistance are higher than10 years ago.In this report, the number of occupied bed-days andadmissions of 2001–2009 obtained from the NationalBoard of Health has been updated. This update hasparticularly affected the reported consumption of 2009and resulted in only minor changes from 2001–2008.Due to procedural rearrangements (merging ofantibacterial agents and infusion liquids) of certainchemical substances for infusion, the reporting ofsales (consumption) by the hospital pharmacies to theDanish Medicines Agency has been inaccurate for somegroups. Consumption of cephalosporins, carbapenems,combinations of sulfonamides and trimethoprim andimidazole derivates has been corrected, as in previousyears. In 2010, data were collected from all Danishhospital pharmacies.
Even though the trend of increasing fluoroquinoloneconsumption seemed to slow down in 2009,consumption has increased by 0.40 DID (238%) during2001–2010 (Table 5.3). The continuously increasingconsumption of ciprofloxacin began when the priceof ciprofloxacin dropped markedly following theintroduction of generics onto the Danish marked inDecember 2001 [Jensenet al.2010. J AntimicrobChemother. 65:1286–91].
5.4. Hospital care5.4.1 IntroductionHospital consumption is presented as both DDDper 100 occupied bed-days (DBD) and DDD per100 admissions (DAD) to include the activity inhospitals, and as DID to compare with primaryhealth care and to document the consumption in theentire hospital care sector without considering theactivity in the hospitals. DAD is the internationallyrecognised abbreviation and is the same measure asDDD per 100 discharges which has been used in theprevious DANMAP reports.
Figure 5.12. Consumption of leading fluoroquinolones in primary health care, Denmark0.6
DANMAP 2010
DDD/1000 inhabitant-days
0.4
Ofloxacin(J01MA01)Ciprofloxacin(J01MA02)
0.2
Moxifloxacin(J01MA14)
0.02001200220032004200520062007200820092010
54
DANMAP 2010
ANTIMICROBIAL CONSUMPTION IN HUMANS5.4.2 Total consumption in hospital care - DDDper 1,000 inhabitants per day (DID)Total consumption compared with 2009Total consumption - the last decade
5.
Total consumption (J01) in Danish hospital care(rehabilitation centres, hospices, private-, psychiatric-,specialised-, and somatic hospitals) added up to 1.91DID in 2010; similar to that of 2009 (Figure 5.14).Broad-spectrum agents represented 67% of the totalconsumption, as in 2009.
Since 2001, total consumption has increased by 0.46DID (31%). Broad-spectrum agents have increasedby 0.18 DID (37%); comprising 67% of the totalconsumption in 2010 compared with 49% in 2001(Figure 5.14 and Table AP 1.8 in appendix 1).
Figure 5.13. Number of bed-days and admissions in somatic hospitals, Denmark65No. bed-days (mill.)
DANMAP 20101.5
No. admissions (mill.)
432102001200220032004Bed-days200520062007200820092010
1
0.5
0
Admissions
Figure 5.14. Consumption of antibacterial agents (J01) in hospital care by narrow-spectrum(a)and broad-spectrum(b)agents, DenmarkDANMAP 20102.01.301.131.221.292010
DDD/1000 inhabitant-days
1.0
0.5
0.74
0.72
0.76
0.75
0.75
0.76
0.75
0.81
1.5
0.74
0.93
0.71
0.99
0.68
0.66
0.64
0.02001200220032004200520062007Broad-spectrum20082009
Narrow-spectrum
a) Narrow-spectrum antibiotics includes: beta-lactamase sensitive penicillins, first-generation cephalosporins, beta-lactamaseresistant penicillins, monobactams, trimethoprim, sulfonamides, macrolides, lincosamides, glycopeptides, fusidic acid, imidazolderivatives, nitrofuran derivatives, and ‘other antibiotics’.b) Broad-spectrum includes: tetracyclines, penicillins with extended spectrum, combinations of penicillins incl. beta-lactamaseinhibitors, second-generation cephalosporins, third-generation cephalosporins, carbapenems, combinations of sulfonamides andtrimethoprim, aminoglycosides, fluoroquinolones, and polymyxins.
DANMAP 2010
0.62
55
5.
ANTIMICROBIAL CONSUMPTION IN HUMANS
5.4.3 Somatic hospitals - DDD per 100 occupiedbed-days (DBD)Somatic hospital consumption (DBD) compared with2009
Total consumption (J01) in somatic hospitals increasedby 2.69 DBD (3%) from 2009 to 2010 (Table 5.5).Three therapeutic groups dominated the increase inconsumption: ‘combination penicillins’ 1.48 DBD (26%),carbapenems 0.88 DBD (28%) and combinations ofsulfonamides and trimethoprim 0.76 DBD (34%), butalso second-generation cephalosporins, beta-lactamaseresistant penicillins, macrolides and aminoglycosidesincreased ≥0.10 DBD. The increased consumption of thelatter three was due to decreasing numbers of bed-daysand practically equal numbers of DDDs. Regardingsecond-generation cephalosporins, consumptionmeasured as DBD went up even though the number ofDDDs used decreased compared with 2009.An intervention at Copenhagen University Hospital,Bispebjerg changed the local consumption pattern,with lower consumption of cephalosporins andfluoroquinolones, but nationally it did not influence theconsumption much [Textbox 8].
Consumption decreased ≥0.10 DBD in four therapeuticgroups: penicillins with extended spectrum 0.76 DBD(5%), beta-lactamase sensitive penicillins 0.41 DBD(4%), third-generation cephalosporins 0.16 DBD (11%),and fluoroquinolones 0.27 DBD (2%). Regarding allfour, the decreased consumption was due to bothdecreasing numbers of bed-days and DDDs.Cephalosporins accounted for 20% of the totalconsumption in somatic hospitals. Penicillins withextended spectrum (17%), fluoroquinolones (12%)and beta-lactamase sensitive penicillins (11%) were theother top four contributing therapeutic groups in 2010(Figure 5.15).Somatic hospital consumption (DBD) – the lastdecade
During 2001–2010, the total consumption (J01) insomatic hospitals has increased by 39.40 DBD (82%)(Table 5.5). This increase was due to a 35% increase inthe number of DDDs, and a concurrent 26% decrease inthe total number of hospital bed-days.
Figure 5.15. Distribution of the total consumption of antibacterial agents in somatic hospitals, DenmarkDANMAP 2010Beta-lactamase sensitivepenicillins (J01CE); 11%
Fluoroquinolones(J01MA); 12%
Beta-lactamase resistantpenicillins (J01CF); 9%
Penicillins with extendedspectrum (J01CA); 17%
Comb. of penicillins, incl.beta-lactamase inhib.(J01CR); 8%Carbapenems (J01DH);5%Macrolides, lincosamidesand streptogramins(J01F); 5%
Cephalosporins(J01DB,DC,DD); 20%Aminoglycosides (J01G);2%
Sulfonamides andtrimethoprim (J01E); 4%Other antibacterials(J01A,DF,X); 8%
56
DANMAP 2010
ANTIMICROBIAL CONSUMPTION IN HUMANS
5.
Table 5.5. Consumption of antibacterial agents for systemic use in somatic hospitals (DDD/100 occupied bed-days), DenmarkDANMAP 2010
ATC group(a)Therapeutic groupJ01AAJ01CAJ01CEJ01CFJ01CRJ01DBJ01DCJ01DDJ01DFJ01DHJ01EAJ01EBJ01EEJ01FAJ01FFJ01GBJ01MAJ01XAJ01XBJ01XCJ01XDJ01XEJ01XX05J01XX08J01XX09J01TetracyclinesPenicillins with extendedspectrumBeta-lactamase sensitivepenicillinsBeta-lactamase resistantpenicillinsCombinations of penicillins.incl. beta-lactamaseinhibitorsFirst-generationcephalosporinsSecond-generationcephalosporinsThird-generationcephalosporinsMonobactamsCarbapenemsTrimethoprim andderivativesShort-acting sulfonamidesCombinations ofsulfonamides andtrimethoprim. incl.derivativesMacrolidesLincosamidesAminoglycosidesFluoroquinolonesGlycopeptidesPolymyxinsSteroid antibacterials(fusidic acid)Imidazole derivativesNitrofuran derivatives(nitrofurantoin)MethenamineLinezolidDaptomycinAntibacterial agents forsystemic use (total)
20010.2811.3310.455.900.170.115.120.650.010.420.421.221.333.210.171.822.810.320.030.191.940.280.130.000.0048.31
20020.3211.3411.376.240.310.145.790.650.000.600.411.231.463.210.191.763.520.380.040.192.120.280.120.040.0051.73
20030.3011.5511.856.540.490.146.240.670.010.680.431.141.542.950.221.713.900.420.030.222.320.300.080.040.0053.77
20040.3211.5112.026.780.840.176.910.670.000.850.411.061.862.850.232.004.930.470.060.222.430.280.100.070.0057.04
Year2005 20060.330.3912.9012.176.711.160.158.390.830.001.160.410.992.112.890.241.956.140.520.120.252.620.290.080.150.0062.5813.0010.676.511.830.149.380.830.001.380.420.752.122.830.311.816.740.560.120.282.780.290.110.200.0063.47
20070.6313.4210.796.702.950.1312.311.030.042.130.440.341.523.080.351.798.160.630.050.282.620.280.090.160.0169.94
20080.7813.969.986.814.000.1813.321.250.072.700.440.351.953.060.411.649.530.680.050.263.270.290.100.210.0275.28
20091.0415.379.907.405.650.1315.761.420.063.150.440.352.283.420.501.5610.710.990.070.313.840.360.090.220.0285.03
20101.0914.619.497.717.130.1316.211.260.094.020.360.333.043.520.471.7110.441.070.100.343.930.310.080.220.0287.72
a) From the 2010 edition of the Anatomical Therapeutic Chemical (ATC) classification system
DANMAP 2010
57
5.
ANTIMICROBIAL CONSUMPTION IN HUMANSFigure 5.16 illustrates the steady shift towards increasingconsumption of ‘newer‘ broad-spectrum antibacterialagents - defined as: ‘combination penicillins’ (J01CR),cephalosporins (J01DB, DC, DD), carbapenems(J01DH) and fluoroquinolones (J01MA) - in Danishsomatic hospitals. In 2001, consumption of penicillinswith extended spectrum and beta-lactamase sensitivepenicillins represented 24% and 22% of total somatichospital antibacte-rial consumption in Denmark,respectively. These shares had decreased to 17% and11% in 2010. Within the group of the penicillins withextended spectrum, the decrease mainly concernedampicillin/pivampicillin/amoxicillin whereasconsumption of mecillinam/pivmecillinam hasincreased. Consumption of cephalosporins represented12% of total somatic hospital antibacterial consumptionin 2001, rising to 20% in 2010.The benefit of these changes in patterns of antibacterialconsumption over the last decade could be an empiricaltreatment covering more groups of pathogens.Nevertheless, this potential gain seems to be rapidlycounterbalanced by the emergence of resistance towardsnewer classes of antibacterial agents (see chapter 8).Importantly, it is interesting that the steeply increasingproportion of cephalosporins and fluoroquinolonesused during the last decade has yielded over the last twoyears.5.4.4 Somatic hospital consumption - DDDper 100 admissions (DAD)Somatic hospital consumption (DAD) comparedwith 2009
The total consumption (J01) in somatic hospitalsdecreased by 12.47 (4%) from 2009–2010 whenexpressed as the number of DAD (Table 5.6). Aswhen measured as DBD, consumption increasedin the same three therapeutic groups by ≥1DAD: ‘combination penicillins’ 3.41 DAD (17%),carbapenems 2.06 DAD (28%) and combinationsof sulfonamides and trimethoprim 1.91 DAD(24%). Consumption decreased ≥1 DAD in fourtherapeutic groups: penicillins with extendedspectrum 6.31 DAD (12%), beta-lactamasesensitive penicillins 3.78 DAD (11%), second-generation cephalosporins 2.47 DAD (4%), andfluoroquinolones 3.53 DAD (9%).
Somatic hospital consumption (DAD) – the lastdecade
Antibacterial consumption (J01) has increased by14% from 249.76 DAD in 2001 to 284.89 DADin 2010 (Table 5.6). This increase was drivenby a 35% increase in the number of DDDs,but counterbalanced by an 18% increase in thenumber of admissions during the last decade (as aconsequence of changes in hospitalization patterns).The difference between trends in consumptionmeasured by DBD and DAD illustrates that theinterpretation of the measures of consumption ishighly dependent on the denominator as well asthe nominator (DDD) and that one indicator is notenough to express hospital consumption.Ulrich Stab Jensen
Figure 5.16. Percentages of total somatic hospital consumption by leading groups of antibacterial agents(J01), DenmarkDANMAP 201025%Penicillins with extendedspectrum (J01CA)Beta-lactamase sensitivepenicillins (J01CE)Percentage of total consumption (%)20%Macrolides (J01FA)Aminoglycosides (J01GB)Fluoroquinolones (J01MA)10%Carbapenems (J01DH)Cephalosporins (J01DB,J01DC, J01DD)Comb. of penicillins, incl.beta-lactamase inhib.(J01CR)
15%
5%
0%2001200220032004200520062007200820092010
58
DANMAP 2010
ANTIMICROBIAL CONSUMPTION IN HUMANSTable 5.6. Consumption of antibacterial agents for systemic use in somatic hospitals (DDD/100 admittedpatients), DenmarkDANMAP 2010
5.
ATC group(a)Therapeutic groupJ01AAJ01CAJ01CEJ01CFJ01CRJ01DBJ01DCJ01DDJ01DFJ01DHJ01EAJ01EBJ01EEJ01FAJ01FFJ01GBJ01MAJ01XAJ01XBJ01XCJ01XDJ01XEJ01XX05J01XX08J01XX09J01TetracyclinesPenicillins with extendedspectrumBeta-lactamase sensitivepenicillinsBeta-lactamase resistantpenicillinsComb. of penicillins. incl.beta-lactamase inhibitorsFirst-generationcephalosporinsSecond-generationcephalosporinsThird-generationcephalosporinsMonobactamsCarbapenemsTrimethoprim andderivativesShort-acting sulfonamidesComb. of sulfonamidesand trimethoprim. incl.derivativesMacrolidesLincosamidesAminoglycosidesFluoroquinolonesGlycopeptidesPolymyxinsSteroid antibacterials(fusidic acid)Imidazole derivativesNitrofuran derivatives(nitrofurantoin)MethenamineLinezolidDaptomycinAntibacterial agents forsystemic use (total)
20011.4458.5954.0330.500.880.5826.483.340.052.162.196.336.8816.580.889.4214.511.630.151.0110.021.470.650.000.00
20021.5856.6856.7931.181.560.7228.953.250.022.982.076.167.3116.030.948.7917.601.880.200.9710.571.420.610.220.00
20031.4354.8856.3331.112.350.6729.663.170.023.242.055.447.3214.031.058.1418.531.970.141.0411.031.410.370.210.00
20041.4552.2254.5330.773.820.7631.363.060.023.851.864.828.4412.921.049.0722.382.120.271.0111.021.260.450.340.00
Year2005 20061.451.6756.4353.2029.335.090.6736.703.620.025.051.784.329.2112.641.058.5526.872.280.541.1111.471.280.360.640.0055.1345.2627.607.770.6039.763.530.005.861.783.188.9812.011.317.6828.582.380.531.1911.811.240.460.860.00
20072.5955.3944.5527.6412.170.5550.814.240.188.781.811.416.2812.701.467.3933.662.610.221.1710.831.170.380.680.03
2008(b)3.1957.1840.9027.8916.370.7254.555.100.2711.081.801.437.9812.531.696.7139.042.770.211.0513.391.190.430.840.06
20093.6353.7634.6125.8619.740.4655.124.980.2111.011.561.217.9611.971.745.4537.453.480.241.0913.431.270.310.760.06
20103.5547.4630.8325.0423.150.4352.654.100.2913.071.171.099.8811.451.525.5633.923.470.321.1212.761.010.270.720.07
249.76 258.46 255.59 258.81 273.67 269.18 288.70
308.39297.36 284.89
a) From the 2010 edition of the Anatomical Therapeutic Chemical (ATC) classification systemb) The number of admissions was affectedly low in 2008 due to a major hospital strike
DANMAP 2010
59
6
RESISTANCE IN ZOONOTIC BACTERIA
60
DANMAP 2010
RESISTANCE IN ZOONOTIC BACTERIA
6.
6. Resistance in zoonotic bacteriaZoonoses are infections and diseases that aretransmissible between animals and humans, eithervia direct contact or indirectly via contaminated food.Zoonotic bacteria such asSalmonellaandCampylobactercan develop resistance to antimicrobial agents as aresult of treatment of the animals, which subsequentlymay lead to treatment failure of human infections. Amore detailed description of the trends and sources ofzoonoses in Denmark and of national surveillance andcontrol programmes can be found in the Annual Reporton Zoonoses in Denmark 2010 [www.food.dtu.dk].6.1SalmonellaClonal dissemination plays an important role forthe spread of antimicrobial resistantSalmonellaspp., particularly withinS.Typhimurium. Examplesof this are the rapid, global dissemination of thepenta-resistantS.Typhimurium DT104, which isresistant to ampicillin (A), chloramphenicol (C),streptomycin (S), sulfonamide (Su) and tetracycline(T) (ACSSuT), and the emergence of the monophasic“S. Typhimurium-like” strains. In addition, andpresumably as a consequence of clonal dissemination,there also appears to be strong associations betweencertain phage types and particular resistance patterns.AgainS.Typhimurium DT104 is an example of this,and so are the monophasicS.Typhimurium DT193and DT120 that are typically resistant to ampicillin (A),streptomycin (S), sulfonamide (Su) and tetracycline(T), known as the ‘classic DT120 pattern’ or ASSuT.However, DT193 and DT120 are also commonly foundin other lineages, for instance lineages derived fromDT104, where they may show other resistance patternssuch as ACSSuT.Some phage types (e.g. DT12 and DT66) appear toonly very slowly acquire resistance - if at all. Rather,such phage types appear to be displaced by resistantphage types if a selection pressure is put on them due tochanges in the use of antimicrobial agents.In this report, monophasicSalmonellaisolates areincluded asS.Typhimurium, as recently recommendedby the European Food Safety Authority [EFSA journal2010. 8(10): 1826]. For animals and meat, the datafrom 2005 to 2009 have been updated accordingly. Seedefinition of multi-resistance in Appendix 2.6.2Salmonellafrom production animals
Salmonellais an important zoonotic pathogen with greateconomic significance in both animals and humans.The common reservoir ofSalmonellais the intestinaltract of a wide range of domestic and wild animals. Inanimals, infections are often sub-clinical. TransmissionofSalmonellato humans often happens through a foodvehicle which has been contaminated withSalmonellaand where the organisms have been allowed to multiplydue to e.g. inadequate storage temperatures, inadequatecooking or cross contamination of ready-to-eat food.In Denmark, as well as in the European Union,S.Enteritidis andS.Typhimurium are the serovars mostfrequently associated with human illness. Human casescaused byS.Enteritidis are mostly associated with theconsumption of contaminated eggs and poultry meat,whileS.Typhimurium cases are mostly associated withthe consumption of contaminated pig, poultry andbovine meat.Human salmonellosis is typically characterized bythe acute onset of fever, abdominal pain, nausea, andsometimes vomiting, after an incubation period of 12–36 hours. Symptoms are often mild and most infectionsare self-limiting. However, in some patients the infectionmay be more serious, and salmonellosis has also beenassociated with long-term and chronic sequelae such asreactive arthritis.In Denmark, all flocks of laying hens and broilers,including breeder flocks, are monitored forSalmonellaaccording to the EU requirements. Eggs fromSalmonellapositive laying hen flocks are heat treated or destroyed,and meat from broiler flocks found positive at theante-mortem control is heat treated. An extensiveSalmonellasurveillance and control program is alsorunning in the Danish pig production (at herd level)and samples of pork and beef are collected after chillingat the slaughterhouses. Finally, a control program forSalmonellain Danish and imported broiler meat, beefand pork has been implemented. Human salmonellosisis notifiable in Denmark, and all cases are reported tothe national database at SSI.
For pigs and poultry, the isolates originated mainlyfrom national surveillance programs. All Danishbroiler flocks and table egg layer flocks were testedforSalmonelladuring 2010 (3,773 and 455 flocks,respectively), of which 43 broiler flocks and eight layerflocks were positive. Overall, nine flocks were foundpositive withS.Typhimurium and five flocks withS.Enteritidis [Annual Report on Zoonoses in Denmark2010].S.Typhimurium was isolated from 434 of the1,089 pig herds appointed for testing based on resultsfrom the sero-surveillance. In addition, 21 isolates fromdiagnostic submissions were included. All 18 isolatesfrom cattle were from clinical submissions.Among the isolates tested for antimicrobial resistancein 2010, one isolate per farm was randomly included inthe report. Insufficient numbers ofS.Typhimurium andS.Enteritidis isolates (≥15) were obtained for Danishbroilers and layers, and the results of the susceptibilitytesting is not presented.
DANMAP 2010
61
6.
RESISTANCE IN ZOONOTIC BACTERIA
MIC distributions amongS.Typhimurium from cattleand pigs in 2010 are shown in Appendix 1 (TableAP1.9).In 2010, none of the isolates ofS.Typhimurium orS.Enteritidis from pigs or cattle were found resistant tocephalosporins, ciprofloxacin or nalidixic acid.SalmonellaTyphimurium in cattle
Of the 18S.Typhimurium isolates that weresusceptibility tested, 22% were fully sensitive and56% were found to be multi-resistant. The highestoccurrence of resistance was to streptomycin (67%),followed by tetracycline (61%), sulfonamide (56%) andampicillin (56%) (Table 6.1). Nine of the isolates hadthe ASSuT resistance pattern, primarily phage typeDT193 (6 isolates), but also DT120, DT7 and DTU302.SalmonellaTyphimurium in pigs
Since 2000, there has been a parallel increase inresistance to ampicillin, sulfonamide and tetracycline(Figure 6.1). In 2008 and 2009, a temporary reductionin tetracycline resistance was observed which has notbeen fully explained; although it was partly relatedto a reduction in DT104 and other phage typesoften resistant to tetracycline. However, in 2010 theoccurrence of resistance to tetracycline increasedagain (Figure 6.1), which is explained in part by anincrease in the monophasic DT193 with the resistancepattern ASSuT (Figure 6.2). In addition, the significantincrease in resistance to tetracycline coincided withan 5% decrease in consumption of tetracyclines perpig produced supporting that the increase is betterexplained by the spread of resistant clones.The level of resistance in 2010 was significantly higherfor ampicillin, streptomycin and tetracycline, ascompared to the 2009 levels.The proportion ofS.Typhimurium isolates with theASSuT resistance pattern increased from 15% to 29%from 2005 to 2010. The majority of the isolates withthe ASSuT resistance pattern was DT120, and tosome extent the monophasic DT193 which increasedmarkedly from 2009 to 2010. The increased occurrenceof the ASSuT resistance pattern inS.Typhimuriumisolates is primarily a reflection of the increasedoccurrence of these phage types in the Danish pigpopulation (Figure 6.2).
Among the selected 455S.Typhimurium isolatesfrom pigs, the most common phage types wereDT120 (23%), DT193 (19%), DT12 (9%) and DT104(7%). Overall, 38% of the susceptibility testedS.Typhimurium isolates from pigs were fully sensitive,whereas 53% were found to be multi-resistant. Thehighest occurrence of resistance was to streptomycin(56%), followed by sulfonamide (53%), ampicillin(49%) and tetracycline (47%) (Table 6.1).
Table 6.1. Resistance (%) amongSalmonellaTyphimurium from cattle, pigs, different types of meat and domesticsporadic human cases, DenmarkDANMAP 2010
CattleAntimicrobial agentTetracyclineChloramphenicolFlorfenicolAmpicillinCeftiofurCefotaximeSulfonamideTrimethoprimApramycinGentamicinNeomycinSpectinomycinStreptomycinCiprofloxacinNalidixic acidColistinNumber of isolates%6166560056000066700018
Pigs%479649005381231656000455Danish%2744350038000084600026
PorkImported%77211073008418003248700062
BroilermeatImported%600110011000002800018
TurkeymeatImported%100101068229327242724399322241
HumanDomesticsporadic(a)%3676420-445114943421227
a) The isolate was categorized as ‘domestic sporadic’ if the patient did not travel one week prior to the infection and was not reported asbeeing part of an outbreak
62
DANMAP 2010
RESISTANCE IN ZOONOTIC BACTERIAFigure 6.1. Resistance (%) inSalmonellaTyphimurium(a)The proportion ofS.Typhimurium isolates with theACSSuT resistance pattern varied between 6% and 8%from pigs, Denmark60
6.
DANMAP 2010
50
% resistant isolates
40
during the period 2005–2009, and was 8% in 2010. Themajority of the isolates with the ACSSuT resistancepattern was DT104 or DT104b, and the changes inoccurrence of the ACSSuT resistance pattern weremainly due to changes in the occurrence of phage typeDT104, although an increase in ACSSuT resistantDTU288 appears to have occurred over the last years(Figure 6.2).6.2.1Salmonellain meatSalmonellaisolates from Danish and imported broilermeat, turkey meat, beef and pork are collected aspart of the national case-by-case control programme.Salmonellawas not detected in any of the 97 batchesfrom Danish broiler meat tested in 2010, whereas it wasisolated from 12% (58/490) of the batches of importedbroiler meat.Salmonellawas detected in 9% (56/592)of the batches of imported turkey meat tested in 2010,with several isolates per positive batch. In importedbeef and pork, 3% (4/127) and 14% (40/296) of thebatches testedSalmonellapositive, respectively [AnnualReport on Zoonoses in Denmark 2010].Salmonellaisolates from Danish pork and beeforiginate from the National surveillance programme,where carcass swab samples are collected at theslaughterhouses. In Danish pork, 22,485 pooledsamples (each of five carcasses) were analysed in2010, and an estimated 1.2% of the pig carcasses
30
20
10
00001020304050607080910TetracyclineAmpicillinSulfonamideChloramphenicolNalidixic acidCiprofloxacin
a) The number of isolates varies between years (from 216 to 736)
Figure 6.2. Proportional distibution of phage types amongSalmonellaTypimurium isolates(a)from pigsresistant to ampicillin, streptomycin, sulfonamide and tetracycline without or with chloramphenicolresistance (ASSuT/ACSSuT), DenmarkDANMAP 20103010
ASSuT(b)258
ACSSuT(c)
20% Isolates% Isolates2005200620072008200920106
15
10
4
5
2
0
02005DTU28820062007200820092010
DT7
DT104 + DT104b
DT120
DT193
DTU302
Others or unspecified
a) Total number of isolates included in 2005: n = 752; 2006: n = 509; 2007: n = 577; 2008: n = 502; 2009: n = 386 and 2010: n = 455b) Isolates with ‘ASSuT’ can also include resistence to other antimicrobial agents except chloramphenicolc) Isolates with ‘ACSSuT’ all include resistance to chloramphenicol but can also include resistance to other antimicrobial agents
DANMAP 2010
63
6.
RESISTANCE IN ZOONOTIC BACTERIAwereSalmonellapositive. In addition, 223 individualcarcasses were tested in smaller slaughterhouses, where1.8% of the pig samples wereSalmonellapositive.In Danish beef, 7,660 pooled samples (each of fivecarcasses) were analysed in 2010, and an estimated0.3% of the cattle carcasses wereSalmonellapositive.In addition, 162 individual carcasses were tested in thesmaller slaughterhouses, with noSalmonellapositive[Annual Report on Zoonoses in Denmark 2010].All susceptibility testedS.Typhimurium andS.Enteritidis isolates were included, even in those caseswhere more than one isolate was found per testedbatch or pooled sample. Insufficient numbers ofS.Typhimurium isolates (≥15) were obtained for Danishbroiler meat, Danish beef and imported beef, and theresults of the susceptibility testing is not presented inthis report. Due to a low number of isolates, resistancedata fromS.Enteritidis in meat are also excluded.MIC distributions amongS.Typhimurium fromimported broiler meat, imported turkey meat and pork(Danish and imported) in 2010 are shown in Appendix1 (Table AP1.10).In 2010, onlyS.Typhimurium isolates from importedturkey meat were found resistant to cephalosporins(2%), ciprofloxacin (2%) and nalidixic acid (2%),whereas allS.Typhimurium isolates from importedbroiler meat and pork were sensitive towards these threeantimicrobial agents (Table 6.1).SalmonellaTyphimurium in imported broiler meat
tetracycline resistant, and the occurrence of resistance tosulfonamide (93%), streptomycin (93%) and ampicillin(68%) was also very high.Furthermore, imported turkey meat was the only foodsource where resistant to ceftiofur and cefotaxime wasfound. In 2010, a significant increase inS.Typhimuriumisolated from imported turkey meat was seen resistantto apramycin (from 0% to 24%), gentamicin (from 0%to 27%) and streptomycin (from 69% to 93%) comparedwith 2009.SalmonellaTyphimurium in pork
Among the 26S.Typhimurium isolates from Danishpork that were susceptibility tested, the most dominantphage types were DT120 (31%) and DT12 (23%),followed by DT17 (8%), DT7(8%), DTU66 (4%),DT193 (4%) and DTU302 (4%). Overall, 46% of thesusceptibility testedS.Typhimurium isolates were fullysensitive, whereas 35% were found to be multi-resistant.Resistance to ampicillin (35%), streptomycin (46%),sulfonamide (38%) and tetracycline (27%) was mostcommon (Table 6.1). There was no significant changein the level of resistance in the susceptibility testedS.Typhimurium isolates from Danish pork in 2010compared to 2009. When comparing the resistance inDanish pork to resistance in Danish pigs, a significantlyhigher occurrence of resistance to tetracycline (27% vs.47%) was found in the animals (Table 6.1).In imported pork, 99 susceptibility testedSalmonellaisolates were selected, and among the 62S.Typhimurium isolates the most common phage typeswere DT120 (45%) and DT17 (32%). Overall, 10% of theS.Typhimurium isolates were fully sensitive, whereas84% were found to be multi-resistant. The highest levelsof resistance were to streptomycin (87%), sulfonamide(84%), tetracycline (77%) and ampicillin (73%) (Table6.1). In the isolates from imported pork, none of theisolates were resistant to nalidixic acid and ciprofloxacin,a significant decrease compared with 2009 (16%). Atthe same time, a significant increase in resistance tostreptomycin (42%) and trimethoprim (344%, from 5%to 18%) was observed.S.Typhimurium isolates from imported pork hada significant higher occurrence of resistance toampicillin, chloramphinicol, florfenicol, spectinomycin,streptomycin, sulfonamide, tetracycline andtrimethoprim thanS.Typhimurium isolates fromDanish pork (Figure 6.3).
There were 18S.Typhimurium isolates among the137 susceptibility testedSalmonellaisolates selectedfrom imported broiler meat, where the most frequentphage type was DTU312 (83%). Overall, 13 (72%) ofthe susceptibility testedS.Typhimurium isolates fromimported broiler meat were fully sensitive, whereastwo (11%) were multi-resistant. One isolate (6%) wasresistant to tetracycline, two isolates (11%) to ampicillinand sulfonamide, and five isolates (28%) were resistantto streptomycin (Table 6.1). None of the isolates wereresistant to ciprofloxacin and nalidixic acid.SalmonellaTyphimurium in turkey meat
The vast majority of Danish turkeys are exportedfor slaughter; therefore, noSalmonellaisolates wereavailable for susceptibility testing from Danish turkeymeat in 2010.Among the 163 susceptibility testedSalmonellaisolatesselected from imported turkey meat, 41S.Typhimuriumisolates were found; where the monophasicTyphimurium strain 4,5,12:i:- accounted for almosthalf. The most common phage type was DT193 (59%),but DT104/104b was also reported. The highest levelsof resistance was found in the imported turkey meat,where none of the susceptibility testedS.Typhimuriumisolates were fully sensitive, and 93% were found to bemulti-resistant. In oneS.Typhimurium isolates fromimported turkey meat, resistance was found to alltested antimicrobial agents (Table 6.1). All isolates were
64
DANMAP 2010
RESISTANCE IN ZOONOTIC BACTERIAFigure 6.3. Resistance (%) inSalmonellaTyphimurium(a)isolated from Danish and imported pork, DenmarkDANMAP 2010100908070% resistant isolates605040302010020052006200720082009201020032004200520062007200820092010PorkDanishPorkImported
6.
Tetracycline
Chloramphenicol
Ampicillin
Sulfonamide
Ciprofloxacin
a) The number of isolates varies between years: for Danish pork from 64 to 103, and imported pork from 21 to 137. For Danish pork,data from before 2005 are not shown due to a low number of isolates
6.2.2Salmonellain humansIn 2010, the number of human cases of salmonellosisdecreased to 1,598 cases (29 per 100,000 inhabitants),compared with 2,129 cases reported in 2009. Ofthe 1,598 cases, information on susceptibility toantimicrobial agents was available for 1,508 isolates;of these, 629 isolates wereS.Typhimurium and 364isolates wereS.Enteritidis. The remaining 515 isolatesbelonged to 97 other serovars.MIC distributions amongS.Typhimurium andS.Enteritidis from human cases in 2010 are shown inAppendix 1 (Tables AP1.11 and AP1.12).SSI collected travel information from the patientsdiagnosed with salmonellosis by phone interviews. Thepatients were asked about the date of disease onset andwhether they had travelled abroad within a seven-dayperiod prior to disease. Patients who had travelled wereasked about their destinations. Cases were categorizedas “domestically acquired” if the patient had nottravelled during that time period, and categorized as“travel abroad reported” if the patient had travelled.Cases with no travel information reported to thegeneral practitioners, and where no phone interviewwas conducted, were categorized as “unknown origin”.In 2010, travel information was obtained for 80% of theSalmonellacases.Outbreaks of human salmonellosis are reported in the“Annual Report on Zoonoses in Denmark in 2010”. Allhuman cases associated with a detected outbreak wereconsidered outbreak-related in this report.
SalmonellaTyphimurium in humans
Fifteen percent of humanS.Typhimurium cases werecategorized as travel-related and 70% as domesticallyacquired. Of the domestically acquired, 48% werefound to be part of an outbreak and 52% were domesticsporadic cases. Travel information was not availablefrom 15% of the cases (Table 6.2).Of the 217 cases of salmonellosis that were partof domestic outbreaks, 90% were caused byS.Typhimurium and 1% byS.Enteritidis. Among the212 domestic outbreak-related human isolates ofS.Typhimurium, 78% were phage type DTU323, and theremaining cases were caused by phage types DT120,DT5, DT7, DTU311, DT104 and DT193. Overall, 8%of the humanS.Typhimurium isolates from domesticoutbreaks were fully sensitive whereas 78% were multi-resistant.The most commonly reported phage types in domesticsporadic humanS.Typhimurium isolates were DT193(20%), DT120 (15%) and DTU292 (11%). Overall,49% of the sporadic domestic humanS.Typhimuriumisolates were fully sensitive whereas 43% were multi-resistant. For the travel-related cases and cases ofunknown origin, 32% and 31% of theS.Typhimuriumisolates were fully sensitive, whereas 63% and 60% weremulti-resistant, respectively.Among the humanS.Typhimurium isolates, 21% ofthe domestic sporadic cases and 41% of the travel-related cases had the ASSuT resistance pattern. Amongthe ASSuT isolates, DT193 and DT120 were the mostcommon phage types, but DT7 also represented asubstantial part of the ASSuT isolates associated withthe domestic outbreaks (Figure 6.5).DANMAP 201065
6.
RESISTANCE IN ZOONOTIC BACTERIAThe ACSSuT resistance pattern was observed in 7% ofthe domestic sporadic cases and in 12% of the travel-related cases. The dominant phage type was DT104, butamong the travel associated cases DT120 and DT193were also common (Figure 6.5).In the humanS.Typhimurium isolates, the pattern ofresistance was similar to what is currently observedin the rest of Europe, with resistance to ampicillin,streptomycin, sulfonamide and tetracycline dominating.The occurrence of resistance to these four antimicrobialagents was similar among travel-related cases andcases with unknown origin. In the domestic cases,the occurrence of resistance in the sporadic cases wasmarkedly lower for all four antimicrobial agents thanwhat was observed in the travel-related cases and thecases of unknown origin (Figure 6.4 and Figure 6.5).In the domestic outbreak-related cases, tetracyclineresistance was much lower than what was observed inany other source of origin, but resistance to ampicillin,streptomycin and sulfonamide was much higher (Table6.2).Resistance to cefalosporins was only found among theisolates from travel-associated cases (3%) or from caseswhere the source of infection was unknown (1%).The higher level of ciprofloxacin resistance in the travel-associatedS.Typhimurium infections (14%) whencompared to the domestically acquired infections (4%)may reflect a higher consumption of fluoroquinolonesin production animals in the countries of destination.The occurrence of resistance to ciprofloxacin washigher than to nalidixic acid among human isolatesdue to the occurrence of the plasmid-borneqnrSgeneswhich confer resistance to ciprofloxacin only. Of the tenhuman isolates resistant to ciprofloxacin but sensitiveto nalidixic acid, nine hadqnrgenes. The four ceftiofurresistant isolates, three from travel associated infectionsand one from an unknown infection, were all producingthe ESBL-enzymes belonging to the CTX-M-1-group.Figure 6.4. Resistance (%) inSalmonellaTyphimurium(a)in human cases acquired(b)domestically (sporadic) orassociated with travel, DenmarkDANMAP 2010706050% resistant isolates4030201000708091007080910TetracyclineAmpicillinCiprofloxacinChloramphenicolSulfonamideDomesticsporadicTravelabroadreported
Note: Before 2007, the origin of infection was not documenteda) Include the monophasic Typhimurium isolates from 2010.b) The isolate was categorized as ‘domestically acquired’ if thepatient did not travel one week prior to the infection, and it wascharacterized as ‘travel abroad reported’ if the patient travelledone week prior to the infection
66
DANMAP 2010
RESISTANCE IN ZOONOTIC BACTERIA
6.
Table 6.2. Resistance (%) inSalmonellaTyphimurium(a)from human cases reported(b)as domestically aquired(sporadic or outbreak related), associated with travel abroad or as of unknown origin, Denmark
DANMAP 2010
Antimicrobial agentTetracyclineChloramphenicolFlorfenicolAmpicillinCeftiofurCefotaximeSulfonamideTrimethoprimApramycinGentamicinNeomycinSpectinomycinStreptomycinCiprofloxacin(c)Nalidixic acidColistinNumber of isolates
Domesticsporadic%3676420-445114943421227
Domesticoutbreak%2144780-871000487440212
Travel abroad%%591312603-6480321459148095
Unknownorigin%541411581-63802414581513195
a) Include the monophasicS.Typhimurium isolatesb) The isolate was categorized as ‘domestically acquired’ if the patient did not travel one week prior to the infection, and it was characterizedas ‘travel abroad reported’ if the patient travelled one week prior to the infectionc) The higher occurrence of resistance to ciprofloxacincompared toresistance to nalidixic acid in 2010was in part due toqnr genes
Figure 6.5. Proportional distibution of phage types amongSalmonellaTypimurium isolates(a)from human casesresistant to ampicillin, streptomycin, sulfonamide and tetracycline without or with chloramphenicol resistance(ASSuT/ACSSuT), Denmark5014
DANMAP 2010
ASSuT(b)12
ACSSuT(c)
4010308641020Domestic,sporadicDomestic,outbreakDT7TravelabroadUnknownoriginDT120Domestic,sporadicDT193Domestic, Travel abroad Unknownoutbreakorigin
% Isolates
20
0
DT104 + DT104b
% Isolates
Others or unspecified
a) In 2010, a total of 629S.Typhimurium cases were reported, including the monophasic Typhimurium isolates.Domestic sporadic: n = 227; Domestic outbreak: n = 212; Travel abroad: n = 95 and Unknown origin: n = 95b) Isolates with ‘ASSuT’ can also include resistence to other antimicrobial agents except chloramphenicolc) Isolates with ‘ACSSuT ‘ all include resistance to chloramphenicol but can also include resistance to other antimicrobial agents
DANMAP 2010
67
6.
RESISTANCE IN ZOONOTIC BACTERIASalmonellaEnteritidis in humans
In contrast to the few travel-related cases ofS.Typhimurium, 60% of the humanS.Enteritidis casesreported travelling abroad, 18% ofS.Enteritidis caseswere domestically acquired and the remaining 22% hadan unknown origin. Of the domestically acquired cases,97% were considered to be sporadic. These were ofphage types PT2, PT8, PT14c, PT15a and RDNC.The majority ofS.Enteritidis isolates from domesticsporadic cases (91%), travel-related cases (73%) andcases of unknown origin (78%) were fully sensitive,whereas one (2%) domestic sporadic case, six (3%)travel-related cases and one (1%) case of unknownorigin were multi-resistant.Of the 388S.Enteritidis isolates available, 364 isolateshad valid results from susceptibility testing for allantimicrobial agents in the test panel (Table 6.3). Twoisolates were part of a domestic outbreak, both resistantto ciprofloxacin and nalidixic acid. A total of 8% ofthe domestic sporadic isolates were ciprofloxacin andnalidixic acid resistant. In contrast, 21% of the casesreported to be travel-related or of unknown origin wereresistant to these two antimicrobial agents.6.2.3 Attribution of humanS.Typhimuriuminfections (ASuT) to sources of animal origin,2007–2010Salmonellahas been among the most importantfoodborne pathogen in Denmark in the last decades.To assist prioritization of interventions to reduce theburden of human salmonellosis in the country, the
Danish Zoonosis Centre has routinely applied a sourceattribution model to estimate the contribution of themajor animal-food sources to human infections ofSalmonella.The principle of the method is to compare the numberof human cases caused by differentSalmonellasero-and phage types with the distribution of the samesubtypes isolated from the various animal-food sources.Antimicrobial resistance patterns ofS.Typhimuriumisolates are also included to further distinguish betweensimilar phage types found in animals, food and humans[Annual Report on Zoonoses in Denmark 2010].In 2010, 642 humanS.Typhimurium cases werereported, of which 59 (9%) sporadic cases wereattributed to domestic pork, 68 (11%) to importedpork, 13 (2%) to imported poultry products, 133(21%) to international travel, 221 (34%) cases wereassociated with outbreaks, and 148 (23%) wereattributed to “unknown source”. In addition to the 59S.Typhimurium sporadic cases attributed to domesticpork, there were 172S.Typhimurium outbreak-relatedcases attributed to this source.Among the sporadicS.Typhimurium cases attributedto domestic pork, five were caused by isolates withASuT resistance pattern (resistant to at least ampicillin,sulfonamide and tetracycline but not chloramphenicoland one was caused by aS.Typhimurium isolate withACSuT resistance pattern (resistant to at least ampicillin,sulfonamide, tetracycline and chloramphenicol). Inaddition, one of the 172 pork related outbreak cases hadthe ASuT resistance pattern (phage type DTU323); mostof the isolates from these outbreak-related cases wereresistant to ampicillin, streptomycin and sulfonamideonly.
Table 6.3. Resistance (%) inSalmonellaEnteritidis from human cases reported(a)as domestically aquired (sporadicor outbreak related), associated with travel abroad or as of unknown origin, DenmarkDANMAP 2010
Antimicrobial agentTetracyclineChloramphenicolFlorfenicolAmpicillinCeftiofurCefotaximeSulfonamideTrimethoprimApramycinGentamicinNeomycinSpectinomycinStreptomycinCiprofloxacinNalidixic acidColistinNumber of isolates
Domesticsporadic%22030-2200002881664
Domesticoutbreak%00000-000000010010002
HumansTravel abroad%51080-2200002211929217Unknown origin%40040-000001121211681
a) The isolate was categorized as ‘domestically acquired’ if the patient did not travel one week prior to the infection, and it was characterizedas ‘travel abroad reported’ if the patient travelled one week prior to the infection68
DANMAP 2010
RESISTANCE IN ZOONOTIC BACTERIAAmong the 68 sporadicS.Typhimurium casesattributed to imported pork, 41 were caused byS.Typhimurium ASuT and 10 were caused byS.Typhimurium ACSuT. OneS.Typhimurium DT193with ASuT resistance pattern was attributed toimported turkey.TheSalmonellasource attribution model does notinclude results of streptomycin susceptibility testingand therefore the results relate to ASuT only. However,the majority of the attributed cases with the ASuT +/-Chloramphenicol was also resistant to streptomycin.An analysis of the number of sporadicS.TyphimuriumASuT and ACSuT cases attributed to Danish andimported pork during the period 2007 through 2010showed fluctuations in the relative importance ofsources and phage types over the years (Figure 6.6).The most relevant changes were observed in thecontribution of Danish and imported pork to humansporadic cases caused by both resistance patterns. Thenumber of sporadic ASuT cases attributed to Danishpork increased markedly from 2007 to 2008, wherecases were caused by DT120 and unspecified phagetypes in both years. The contribution of domestic porksubsequently decreased, and in 2010 was reduced tofive cases as described above. In contrast, the numberof sporadic ASuT cases attributed to imported porkincreased eight-fold from 2007 to 2010. The mostevident increase was observed in cases caused by phagetypes DT193 but also DT120 (Figure 6.6).Among sporadic cases caused byS.Typhimurium withACSuT resistance, the number of cases attributed todomestic pork also decreased substantially, from 14in 2007 to one in 2010, whereas the number of casesattributed to imported pork decreased from 2007 to2009, but increased again in 2010 where nine DT104or DT104b cases and one non-typeable isolate wereattributed to this source (Figure 6.6).During the period from 2007 through 2010, onesporadic ASuT case was attributed to imported broilermeat (95% Credibility Interval (CI): 0 - 3 cases), whereasthree sporadic ASuT cases (95% CI: 0 - 9) and twosporadic ACSuT cases (95% CI: 0-4) were attributed toimported turkey. In 2007, five sporadic ASuT cases wereattributed to Danish beef, and in 2009, one sporadicASuT case was attributed to Danish broiler meat. NoACSuT cases were attributed to Danish beef or broilermeat during this time period.Tina Struve, Helle Korsgaard,Sara Pires, Lars Stehr Larsen,Eva Møller Nielsen and Tine Hald
6.
Figure 6.6. Estimated number of sporadic humanSalmonellaTypimurium cases(a)resistant to ampicillin,sulfonamide and tetracycline(b)without or with chloramphenicol (ASuT/ACSuT), attributed to Danish andimported pork by phage type, DenmarkDANMAP 20104540Estimated number of cases353025201510500708091007080910(20%)(12%)(8%) (36%)(64%)(46%)(23%)16
ASuT(b)
(60%)
(22%)14Estimated number of cases121086420070809(5%)
ACSuT(c)
(15%)
(50%)(16%)(4%)(2%)(9%)
10
07
08
09
10
Danish porkDT104
Imported porkDT120DT193DTU302
Danish porkDTU311
Imported porkOthers or unspecified
a) Numbers in parentheses indicate the proportion of ASuT/ACSuT cases of all sporadic domesticS.Typhimurium cases attributedto Danish and Imported pork during the period. The total number of sporadic domesticSalmonellacases in 2007: n = 776; 2008: n =1,235; 2009: n = 802 and 2010: n = 592b) Isolates with ‘ASuT’ can also include resistance to other antimicrobial agents except chloramphenicolc) Isolates with ‘ACSuT’ all include resistance to chloramphenicol but can also include resistance to other antimicrobial agents
DANMAP 2010
69
6.
RESISTANCE IN ZOONOTIC BACTERIA
6.2
Campylobacter
Since 2005,Campylobacterhave been the mostcommonly reported cause of gastrointestinal bacterialinfections in humans in Denmark as well as in theEuropean Union.Human campylobacteriosis is caused by thermotolerantCampylobacterspp. The species most commonlyassociated with human infections areC. jejunifollowedbyC. coli,but other species are also known to causeinfections in humans. In Denmark, 85-95% of thehuman campylobacteriosis cases are caused byC.jejuni.ThermotolerantCampylobacterare widespreadin nature and the most important reservoirs are thealimentary tract of wild and domesticated birds andmammals. They are prevalent in production animalssuch as poultry, cattle, pigs and sheep; in pets, includingdogs and cats; in wild birds and environmental watersources. The bacteria can readily contaminate variousfoodstuffs. Among sporadic human cases, contact withlive poultry, consumption of poultry meat, drinkingwater from untreated water sources, and contact withpets and other animals have been identified as themajor sources of infection.6.2.1Campylobacter jejuniProduction animals
different farms. A total of 41C. jejuniwere isolated andsusceptibility tested. Of these, 75% were fully sensitiveto the antimicrobial agents tested.In isolates from Danish broilers, the highest levels ofresistance were found for ciprofloxacin (19% in 2010compared to 13% in 2009) and tetracycline (17% in2010 compared to 12% in 2009). An almost continuousincrease in resistance to ciprofloxacin and tetracyclinehas been observed over the last decade from less than10% resistant isolates in 2000 to 19% and 17% in 2010,respectively (Figure 6.7).Following an increase in consumption offluoroquinolones for rearing and parent flocks in 2009,fluoroquinolones were not used in these flocks in 2010.A decrease in consumption was also observed foramoxicillin, penicillins, sulfonamides and macrolidesin rearing flocks for the broiler production. However, inbroiler flocks, the consumption of tetracycline, whichincreased considerably from 2008 to 2009, continuedto increase in 2010. Second to amoxicillin, tetracyclinewas the most commonly used antimicrobial agent inDanish broilers in 2009 and 2010; this is a potentialexplanation for the increasing tetracycline resistance inC. jejunifrom Danish broilers. Furthermore, from 2009to 2010, the consumption of amoxicillin, penicillins andsulfonamides in broiler flocks also increased (Figure4.8).For cattle, 216 samples were analysed forCampylobacterand 98 randomly selectedC. jejuniisolates weresusceptibility tested; 75% of theC. jejuniisolates fromcattle were fully sensitive to the antimicrobial agentstested.
In 2010, samples from animals were collected atslaughter for the DANMAP programme and all furthertesting was performed at the National Food Institute.Only one isolate per farm was included in the report.C.jejunifrom pigs were not included because very fewC.jejuniisolates were found in pigs.For broilers, 382 flocks were sampled representing 169
Figure 6.7. Resistance (%) inCampylobacter jejunifrom broilers, Danish broiler meat and imported broilermeat, DenmarkDANMAP 201060Danish broilersDanish broilermeatImported broilermeat
50
% resistant isolates
40
30
20
10
001 02 03 04 05 06 07 08 09 10Tetracycline01 02 03 04 05 06 07 08 09 10Erythromycin01 02 03 04 05 06 07 08 09 10Ciprofloxacin
70
DANMAP 2010
RESISTANCE IN ZOONOTIC BACTERIAResistance to ciprofloxacin amongC. jejunifrom cattlehas remained virtually unchanged since 2008, at a levelaround 20% (Figure 6.8). As described in previousDANMAP reports, a significant increase in the level offluoroquinolone resistance occurred in 2005 despite lowconsumption of fluoroquinolones in cattle since 2003.As in previous years, only few of the fluoroquinoloneresistant isolates were also resistant to tetracycline in2010, indicating that co-selection by tetracycline (oneof the major drugs for treatment of calves) was not theexplanation for the high occurrence of fluoroquinoloneresistance. It has been discussed [DANMAP 2007]that clonal spread, particularly between farms, couldbe an explanation for the observed resistance tofluoroquinolones. Initially, the fluoroquinolone resistantC. jejuniisolates were obtained from cattle farms inSouthern Jutland, but the occurrence of resistance hasbeen moving north from 2007 to 2010 and in 2010,85% of the ciprofloxacin resistantC. jejuniisolatesoriginated from farms in Jutland, with a high prevalencein Northern Jutland.Since 2005, the resistance to tetracycline in isolatesobtained from cattle has increased from 0% to 6% andthe resistance is now at the same level as in 2002 (Figure6.8).MIC distributions amongC. jejunifrom cattle andbroilers in 2010 are shown in Appendix 1 (TableAP1.14).MeatFigure 6.8. Resistance (%) inCampylobacter jejunifrom cattle, Denmark40
6.
DANMAP 2010
30% resistant isolates
20
10
00001020304050607080910
ErythromycinCiprofloxacin
Tetracycline
The Danish Veterinary and Food Administration(DVFA) collected samples from broiler meat, sold atwholesale and retail outlets, forCampylobactertesting.In 2010, isolates from food were species identified in theregional laboratories of DVFA and susceptibility testedat the National Food Institute.
reported in 2008. Hence, resistance to ciprofloxacin inC. jejuniisolates from Danish broiler meat increasedsignificantly from 0% in 2009 to 17% in 2010. However,it should be noted that only half as many samples weretested in 2009 compared to 2010.As in previous years, resistance to ciprofloxacin andtetracycline was significantly higher inC. jejunifromimported broiler meat compared to Danish broilermeat (Figure 6.7). In 2009, a significant decrease inerythromycin resistance among the testedC. jejuniisolates from imported broiler meat was observed.
From broiler meat, all isolates verified asC. jejuni(120isolates; 52 Danish, 68 imported) were susceptibilitytested. Only one isolate per sample was reported (Table6.4). Among the Danish isolates, 75% were fully sensitiveto the antimicrobial agents tested, whereas only 37% ofErythromycin resistance has remained at a very lowthe isolates from imported meat were fully sensitive.level in both domestic and imported broiler meat foralmost a decade.The observed resistance to ciprofloxacin and tetracyclinehas fluctuated over the last three years, and in 2010 theMIC distributions amongC. jejunifrom broiler meat inresistance increased, returning to the same levels as2010 are shown in Appendix 1 (Table AP1.16).Table 6.4. Resistance (%) inCampylobacter jejunifrom animals, Danish broiler meat, imported broiler meatand in domestic and travel related human cases, DenmarkDANMAP 2010
Antimicroial agentTetracyclineChloramphenicolErythromycinGentamicinStreptomycinCiprofloxacinNalidixic acidNumber of isolates
CattleDanish%60001202098
BroilersDanish%170002201741
Broiler meatDanish%120202171352Imported%410400505068
HumansDomestically“Travelacquiredabroad”%%135700000022258023805246DANMAP 201071
6.
RESISTANCE IN ZOONOTIC BACTERIA
Humans
Campylobactercontinued to be the most frequentcause of bacterial intestinal infections in 2010. Atotal of 4,035 human laboratory confirmed cases ofcampylobacteriosis were reported (73 per 100,000inhabitants), representing an increase of 20% comparedto 2009 [Annual report on Zoonoses in Denmark2010]. For the surveillance of antimicrobial resistance,the former counties of Northern Jutland, Funen andRoskilde were selected, representing approximately 25%of all cases in Denmark in 2010.Since 2007, SSI has collected information ontravel history through phone interviews from allCampylobacterpatients residing in the above mentionedcounties. Patients were asked about the date of diseaseonset and whether they had travelled abroad withina seven-day period prior to the onset of disease.Furthermore, patients who had been abroad were askedabout their destinations. Cases were categorised as“domestically acquired” if the patients had not travelledwithin the last week prior to the onset of infection.In 2010, 141Campylobacter jejuniisolates weresubmitted to SSI for susceptibility testing continuouslyover the year. The isolates were randomly selected fromallCampylobacterisolated from stool samples in thethree counties mentioned above. Among the testedisolates, 46 (33%) were from travel-associated cases and52 (35%) were considered to be domestically acquired.For the remaining 43 cases, it was not known whetherthey were acquired domestically or abroad. Among theisolates from domestically acquired infections, 67% werefully sensitive to the antimicrobial agents tested, whilethe percentage of fully sensitive isolates was much lower,17%, among isolates from travel associated cases (Table6.4).
MIC distributions and the occurrence of antimicrobialresistance amongC. jejunifrom domestically acquiredhuman cases and human cases associated with travel areshown in Appendix 1 (Table AP1.17).In 2010, the level of resistance to ciprofloxacin inC.jejuniisolates from domestically acquired infectionsremained in between the level of resistance for isolatesobtained from Danish broiler meat and imported broilermeat. The consumption of imported broiler meat hascontinued to increase in Denmark, from 17% in 2003to 33% in 2006 to 45% in 2010 [Annual report onZoonoses in Denmark 2010]. It is likely that importedbroiler meat contribute to the relatively high occurrenceof ciprofloxacin resistance (25%) inC. jejuniisolatesfrom domestically acquired human infections.The occurrence of resistance to ciprofloxacin andtetracycline continued to be significantly higher intravel associatedC. jejuniisolates (80% and 57%,respectively) compared to isolates from domesticallyacquired infections (25% and 14%, respectively)(Figure 6.9). For the other antimicrobial agents tested,no significant differences in resistance levels wereobserved. Ciprofloxacin or other fluoroquinolones areoften used for empiric treatment of adults with severebacterial gastroenteritis. Fluoroquinolones are alsoused in animal husbandry. However, in Denmark theconsumption of fluoroquinolones in animal husbandryhas been restricted since 2002. Travelling to orconsuming meat from countries where fluoroquinolonerestrictions are not implemented can be associated witha higher risk of acquiring infection with ciprofloxacinresistantC. jejuni.
Figure 6.9 Resistance (%) inCampylobacter jejunifrom human cases, Denmark908070% resistant isolates605040302010000010203040506070809100607080910DomesticallyacquiredTravelabroad
DANMAP 2010
Tetracycline
Erythromycin
Ciprofloxacin
72
DANMAP 2010
RESISTANCE IN ZOONOTIC BACTERIA
6.
6.2.2Campylobacter coliProduction animals
For animals, only antimicrobial resistance amongC.coliisolates from pigs is reported in the DANMAPreport 2010. MIC distributions and the occurrence ofantimicrobial resistance amongC. colifrom pigs areshown in Appendix 1 (Table AP1.13).In 2010, 269 samples from pigs were analysed forCampylobacter;103 randomly selectedC. coliisolateswere susceptibility tested, and 26% were foundfully sensitive. As in the previous three years, nosignificant changes in fluoroquinolone resistancewere observed amongC. colifrom pigs from 2009to 2010. Fluoroquinolone resistance was detected inapproximately 8% of the tested isolates (Figure 6.10)despite low consumption of fluoroquinolones in pigssince 2003 (Table AP1.1).In 2010, erythromycin resistance inC. colifrom pigswas 15%. A continuous decrease in erythromycinresistance inC. coliwas observed after withdrawalof the growth promoter tylosin from the Danish pigproduction in 1998–1999. However, in the past years,the level of resistance has not changed significantlyand since 2006 the level of resistance has been 10-15%(Figure 6.10). In contrast, an increasing trend has beenobserved in the occurrence of resistance to tetracyclineforC. colifrom Danish pigs over the past decade,especially during 2004–2010. Overall, the consumptionof tetracycline has also increased from 2001 to 2009(Table AP1.1).Figure 6.10. Resistance (%) inCampylobacter colifrom pigs, Denmark50
In 2010, streptomycin resistantC. coliisolates frompigs increased significantly from 48% to 63%. Whilethis increase may reflect that the isolates coincidentallyoriginated from producers with high prevalence ofdiseases typically treated with streptomycin (limb, joint,CNS and skin), it is noteworthy that the consumptionof penicillin-streptomycin combinations for finisherpigs also increased during this period. However, itshould be noted that the increase in streptomycinconsumption represents only a very small fraction ofthe total consumption (Table AP1.1).MeatOnly one isolate per sample was susceptibility testedand reported. In 2010, a total of 47 C.coliisolatesfrom broiler meat were susceptibility tested, 20 isolateswere obtained from Danish broiler meat and 27 wereobtained from imported broiler meat.Among the Danish isolates, 11 (55%) were found fullysensitive, while only two (7%) isolates from importedbroiler meat were fully sensitive to the antimicrobialagents tested. Significant differences were observed inresistance depending on the origin of the meat (Danish/imported), the MIC values are shown in Appendix 1(Table AP1.15).Resistance levels in the isolates from Danishbroiler meat were: No resistance to ciprofloxacin orerythromycin, and 35% resistance to tetracycline. Thecorresponding values for the isolates obtained fromimported meat were: 85% resistance to ciprofloxacin,14% resistance to erythromycin, and 82% resistance totetracycline. While there were no significant changesobserved in the resistance levels in the Danish isolatesfrom 2009 to 2010, this was not the case for theimported isolates. Thus, 85% of the imported isolateswere resistant to ciprofloxacin in 2010 compared to 42%in 2009. Similarly, the resistance level for erythromycinincreased from 2% to 15% and resistance to tetracyclineincreased from 51% to 81%.HumansNoC. coliisolates from human cases were included inthe DANMAP report 2010, since there was only a smallnumber ofC. coliamong theCampylobacterisolatesreceived at SSI.Birgitte Borck Høg, Lars Stehr Larsen,Eva Møller Nielsen and Anne Mette Seyfarth
DANMAP 2010
40% resistant isolates
30
20
10
00001020304050607080910
ErythromycinTetracycline
Ciprofloxacin
DANMAP 2010
73
6.
RESISTANCE IN ZOONOTIC BACTERIA
Textbox 3
Occurrence ofClostridium difficilein Danish pig farms, and in cattle and broilers at slaughterBackground:Clostridium difficileis increasingly causing infection in humans and have lately caused outbreaksat hospitals in Denmark and other countries as well [DANMAP 2009]. Especially, the virulentC. difficile027 iscausing severe infections. Even though,C. difficilecan be isolated from animals and meat, its role as a zoonosisis not fully understood [Rupnik. 2007. Clin Microbiol Infect. 13: 457-9]. The aim of this study was to investigatethe occurrence ofC. difficilein pig farms, and in cattle and broilers at slaughter to determine if types more likelyto cause disease in humans were present in animals.Materials and methods:During June through November 2010, 99 stool samples from slaughter pig pens at 99farms, 192 faecal samples from cattle at slaughter and 197 pools of cloacal swabs of broilers at slaughter werecollected and tested for the presence ofC. difficile.The pools of cloacal swabs were added to 2.5 ml of 0.9% NaCland mixed. One milliliter of cells suspended in the 0.9% NaCl or 1 gram of faecal sample was added to 9 mlCDMN broth supplemented with 0.1% Sodium taurocholate and incubated anaerobically at 37�C for 7 days. Twoml were transferred to 2 ml 99% ethanol and left at room temperature for one hour. After centrifugation, 10 �l ofpellet was transferred to a CDMN agar plate. The plates were incubated for 44 to 48 hours anaerobically at 37�C.PresumptiveC. difficilewere re-streaked at CDMN agar plates and the presence ofC. difficileverified by PCRdetection of toxin genes (tcdA,tcdB,binary toxin) as previously described [Perssonet al.2008. Clin MicrobiolInfect. 14: 1057-64]. Isolates positive for all three toxin genes were furthermore PCR ribotyped and testedfor deletions intcdC.All isolates containing toxin genes were tested for resistance to clindamyin (1-16mg/l),erythromycin (0.5-8 mg/l), metronidazole (4-64 mg/l), moxifloxacin (1-16 mg/l), and vancomycin (4-64 mg/l)following CLSI guidelines (see Table 1 for resistance breakpoints).Results and discussion:Fifteen (15%) of the pig farm samples were positive forC. difficile.All of the isolateswere tested for toxin genes and 73% had all three toxin genes whereas 27% hadtcdAandtcdB.Twenty-nine(15%) of the cattle samples were positive forC. difficile.All of the isolates were tested for toxin genes and 24%contained all three genes, 69% containedtcdAandtcdB,and 7% contained onlytcdA.Six broiler flocks (3%)were positive forC. difficileand all six isolates containedtcdAandtcdB.Six of the eighteen isolates from pigs andcattle that contained all three toxin genes belonged to PCR ribotype 078 (two from cattle and four from pigs),the rest belonged to PCR ribotypes rarely or not previously found in humans in Denmark. Fifteen of the isolateshad a 39 bp deletion intcdCand three had a 54 bp deletion intcdC.These three isolates all belonged to the samePCR ribotype (named DK136) and originated from cattle. One human case with PCR ribotype DK136 has beenreported in Denmark. More than half of the isolates containedtcdAandtcdB,and approximately one-third of thehuman cases in 2009 were caused byC. difficilewith these toxins [DANMAP 2009]. Types found in animals andhuman cases cannot be directly compared since the human isolates are selected for typing based on three criteriaused to screen for the 027 type: Resistance to moxifloxacin, if the cases havesevere clinical manifestations, or ifcases are suspected to be part of an outbreak.The most common PCR ribotypes in humans in Denmark are 027,078, 066 and 023.The MIC distributions of five antimicrobial agents are presented in Table 1. Most isolates were resistant toclindamycin (87%) and all isolates were susceptible to vancomycin and metronidazole. One isolate from pigsand one isolate from cattle were resistant to erythromycin. Moreover, one isolate from pigs was resistant tomoxifloxacin. This isolate contained all three toxin genes and belonged to a PCR ribotype not previously foundin humans (named DK135). Resistance to moxifloxacin is one out of three criteria used to screen for type 027 inDanish hospitals (see above) [DANMAP 2009].In conclusion, the finding ofC. difficile078 in pigs is not surprising since this type is known to be commonamong pigs. However, other types may have a potential to cause severe disease in humans, as isolates with allthree toxin genes and deletion intcdCwere found. Moreover, the importance ofC. difficilewithtcdAandtcdBinanimals should be further investigated.Yvonne Agersø, Eva Møller Nielsen and Katharina OlsenFor further information: Yvonne Agersø ([email protected])
74
DANMAP 2010
RESISTANCE IN ZOONOTIC BACTERIA
6.
Table 1. Resistance (%) inC. difficilefrom broilers (n = 6), cattle (n = 26) and pigs (n = 14)
DANMAP 2010
Antimicrobial agentClindamycinErythromycinMetromidazoleMoxifloxacinVancomycin
Animal typeBroilersCattlePigsBroilersCattlePigsBroilersCattlePigsBroilersCattlePigsBroilersCattlePigs
% Resistant1008193047000007000
0.5
18
277
666979
838593
Distribution (%) of MICs248168317846587572933477100100100171247100100100
3287
64 mg/l
Note The resistance breakpoints are indicated with black vertical lines
DANMAP 2010
75
7
RESISTANCE IN INDICATOR BACTERIA
76
DANMAP 2010
RESISTANCE IN INDICATOR BACTERIA
7.
7. Resistance in indicator bacteriaIndicator bacteria (Enterococcusfaecium, EnterococcusfaecalisandEscherichia coli)have been included inthe DANMAP programme since 1995. These bacteriaare included since they can be isolated from faecalsamples from animals and humans. During slaughterof production animals, meat can be contaminated withenterococci andE. coli.Furthermore, enterococci andE.coli easily develop antimicrobial resistance in responseto selective pressure.Most of the antimicrobial agents which have been usedfor growth promotion in Denmark (banned in 1998)had effect on Gram-positive bacteria like enterococci;especiallyE. faecium.Today, many of the antimicrobialagents used in veterinary clinical therapy are broadspectrum and are mainly active against Gram-negativebacteria, such asSalmonellaandE. coli.Enterococci are still included in the DANMAPprogramme to follow the persistence of resistanceafter the ban of growth promoters.E. coliis includedin the programme, since they are more often isolatedfrom faecal samples and meat thanSalmonella,andare therefore a better indicator for occurrence ofantimicrobial resistance.were collected at the time of slaughter. Enterococci fromfood originated from meat sold at wholesale and retailoutlets, collected randomly in all regions of Denmarkby the Danish Veterinary and Food AdministrationRegional Laboratories in centrally coordinatedprogrammes. The identification and susceptibilitytesting was done at the National Food Institute. TheMIC distributions and occurrence of resistance amongE. faeciumandE. faecalisare presented in Appendix 1(Tables AP1.18, AP1.19, AP1.20 and AP1.21).7.1.1Enterococcus faeciumin productionanimalsE. faeciumwas isolated from 18% (136/738) of thesamples from pigs and 44% (169/382) of the samplesfrom broilers. Only one isolate per farm was includedand a randomly selected subsample of 133 and 119isolates from pigs and broilers, respectively, weresusceptibility tested and reported (Table 7.1).Pigs
7.1 EnterococciEnterococcus faeciumandEnterococcus faecaliswereisolated from faecal samples from pigs and broilers.No enterococci were isolated from cattle. All samplesincluded in the DANMAP surveillance programme
The highest occurrence of resistance was found fortetracycline (51%), followed by streptomycin (35%),erythromycin (27%) and kanamycin (23%) (Table7.1). Both streptomycin and kanamycin belong tothe aminoglycosides. From 2009 to 2010, significantdecreases in prevalence of antimicrobial resistanceamong isolatedE. faeciumfrom pigs were seen fortetracycline, penicillin, ampicillin and streptomycin.Both ampicillin and penicillin belong to the beta-
Table 7.1. Resistance (%) in Enterococcus faecium from animals and meat of Danish and imported origin,DenmarkDANMAP 2010
Antimicrobial agentTetracyclineTigecyclineChloramphenicolPenicillinAmpicillinErythromycinGentamicinKanamycinStreptomycinCiprofloxacinVancomycinQuinupristin/dalfopristinAvilamycinSalinomycinLinezolidTeicoplaninNumber of isolates
BroilersDanish%6001026001-000530-119
PigsDanish%5100322702335-12000-133
Broiler meatDanishImported%%10430000126125216300120337001019--37100010145107
Beef meatDanish%1000005000000-00020
Pork meatDanish%17003031037000-00029
DANMAP 2010
77
7.
RESISTANCE IN INDICATOR BACTERIAlactams. The reduced prevalence of tetracyclineresistance can be related to the reduced usage oftetracycline, especially after July 1st 2010 (see chapter4.3). The reduction in resistance to the beta-lactams(ampicillin and penicillin), however, can be explainedpartly by the high peak observed in 2009 and partlyby the fact that the epidemiological cut-off valuerecommended by EUCAST does not clearly separate thesensitive population from the resistant, and variationin methodology can therefore lead to large changes indetected prevalence. For streptomycin resistance, whichhas gradually increased over the last decade withoutincreased consumption, 95% of the streptomycinresistant isolates were also resistant to tetracycline,indicating co-resistance between these antimicrobialsand that the reduced consumption of tetracycline couldhave resulted in lower prevalence of streptomycinresistance. Resistance to vancomycin and quinupristin/dalfopristin still prevails at a low level amongE. faeciumisolated from pigs.Broilers
higher occurrence of resistance to salinomycin wasfound among the isolates from Danish broiler meat.Significantly lower occurrence of resistance was foundfor tetracycline, kanamycin and streptomycin inE.faeciumisolates from Danish pork compared to isolatesfrom Danish pigs. Significantly lower occurrence ofresistance to salinomycin was found in isolates fromDanish broiler meat when compared to Danish broilers.7.1.3Enterococcus faecalisin productionanimalsE. faecaliswas isolated from 23% (167/738) of thesamples from pigs and 44% (169/382) of the samplesfrom broilers. Only one isolate per farm was includedand a randomly selected subsample of 157 and 112isolates from pigs and broilers, respectively, weresusceptibility tested and reported (Table 7.2).Pigs
The highest occurrence of resistance was found forsalinomycin (53%) followed by erythromycin (23%) andtetracycline (6%) (Table 7.1). Salinomycin is widely usedas a coccidiostat in the broiler production. Presentlyno cut-off value is recommended by EUCAST. Theused value is equivalent to the one used in DANMAP2009. From 2009 to 2010, a significant decrease inprevalence of antimicrobial resistance amongE. faeciumisolated from broilers were seen for tetracycline,penicillin, ampicillin, quinupristin/dalfopristin,and avilamycin. Resistance to the growth promoteravilamycin was not detected for the first time since theban, but the significantly lower occurrence could, asfor quinupristin/dalfopristin, be a result of the very lownumber of tested isolates in 2009 (n=19) compared tothe 199 isolates tested in 2010. The reduced prevalenceof resistance to tetracycline, penicillin and ampicillinmay be explained as forE. faeciumisolated from pigs.Using a selective enrichment method, vancomycinresistantE. faeciumcould be detected in 47% of thefaecal samples even though avoparcin (glycopeptide)has been banned since 1995 (Textbox 5).7.1.2Enterococcus faeciumin meatFor Danish meat,E. faeciumwas isolated, from 16%(29/184) of the pork samples, 78% (145/187) of thebroiler meat samples and 17% (20/118) of the beefsamples. For imported meat,E. faeciumwas isolatedfrom 47% (107/226) of the broiler meat samples. Onlyone isolate per sample was susceptibility tested andreported (Table 7.1).The level of resistances in 2010 was comparable to thelevels observed in 2009 for Danish pork and broilermeat as well as imported broiler meat. When comparingE. faeciumisolates from Danish and imported broilermeat, a significantly higher occurrence of resistanceto ampicillin, erythromycin, kanamycin, penicillin,streptomycin, quinupristin/dalfopristin and tetracyclinewas found in isolates from imported broiler meat, while
The highest occurrence of resistance was found fortetracycline (78%) followed by erythromycin (44%),streptomycin (28%) and kanamycin (21%) (Table 7.2).From 2009 to 2010, a significant decrease in prevalenceof antimicrobial resistance to tetracycline was detectedas could be explained by reduced usage of tetracycline.Using a selctive enrichment method high-levelgentamicin resistant (HLGR)E. faecaliswas detectedin 11% of the faecal samples from pigs. A recent studyhas shown a possible zoonotic link between HLGRE.faecalisfrom pigs and HLGRE. faecalisisolated fromendocaditis patients (Textbox 4).Broilers
The highest occurrence of resistance was observed fortetracycline (26%) followed by erythromycin (25%)and streptomycin (4%) (Table 7.2). No resistanceto salinomycin was detected. From 2009 to 2010,significant decrease in prevalence of antimicrobialresistance was seen for tetracycline, erythromycin,streptomycin and salinomycin. Prevalence oftetracycline resistance is propably reduced as aconsequence of reduced consumption.As for streptomycin resistance amongE. faeciumisolated from pigs, high (100%) co-resistance betweenstreptomycin and tetracycline was detected (only fourisolates). No clear co-resistance between erythromycinand tetracycline could be detected. Only 55% of theerythromycin resistant isolates were tetracyclineresistant, but since only a limited number ofE. faecalis(n=19) was tested in 2009, compared to the 119 in2010. The observed statistical significant difference forerythromycin and salinomycin could be reflected in thisfact.7.1.4Enterococcus faecalisin meatE. faecaliswas isolated from 46% (84/184) of Danishpork samples, 32% (59/187) of the Danish broiler meatsamples and 23% (27/118) of the Danish beef meatsamples. For imported meat,E. faecaliswas isolated
78
DANMAP 2010
RESISTANCE IN INDICATOR BACTERIAfrom 52% (91/175) of the pork samples, 46% (104/226)of the broiler meat samples and 36% (36/99) of the beefsamples. Only one isolate per sample was susceptibilitytested and reported (Table 7.2).Compared to 2009, a significantly lower occurrenceof resistance to erythromycin was observed amongisolates from Danish pork and a significantly loweroccurrence of tetracycline resistance was found amongisolates from imported pork. Compared to Danishpork, a significantly higher occurrence of resistanceto tetracycline was found inE. faecalisfrom importedpork.The levels of resistances in 2010 was comparable to thelevels observed in 2009 for both Danish and importedbroiler meat; except for tetracycline, where loweroccurrence was found in Danish broiler meat in 2010compared to 2009. A significantly higher occurrenceof resistance to erythromycin, kanamycin andstreptomycin was observed inE. faecalisisolates fromDanish broiler meat compared to isolates from importedmeat. In imported pork, the level of tetracyclineresistance was significantly higher than among isolatesfrom Danish pork.Significantly lower occurrence of resistance was foundfor tetracycline, chloramphenicol, erythromycin,gentamicin, kanamycin and streptomycin inE. faecalisisolates from Danish pork compared to Danishpigs. Significantly higher occurrence of resistance totetracycline was found in isolates from Danish broilermeat when compared to Danish broilers (Table 7.2).Lars Bogø Jensen and Lars Stehr Larsen
7.
Table 7.2. Resistance (%) amongEnterococcus faecalisfrom animals and meat of Danish and imported origin,DenmarkDANMAP 2010
Antimicrobial agentTetracyclineTigecyclineChloramphenicolPenicillinAmpicillinErythromycinGentamicinKanamycinStreptomycinCiprofloxacinVancomycinAvilamycinSalinomycinLinezolidTeicoplaninNumber of isolates
BroilersDanish%26000025114-0000-112
PigsDanish%780160044112128-0000-157
Broiler meatDanish Imported%%4655002520201739010188240100--20000059104
BeefDanish Imported%%221900030000030043480000--0000002736
Pork meatDanish Imported%%133400130000151223040100--0000008491
DANMAP 2010
79
7.
RESISTANCE IN INDICATOR BACTERIA
Textbox 4
Danish pigs are a reservoir of High-level gentamicin resistantEnterococcus faecalisassociated with infective endocarditis in humansBackground:Infective endocarditis is a life-threatening infection that involves the endocardial surfaceor vascular structures in proximity to the heart. The intrinsic resistance to a number of antimicrobialagents makes enterococcal infective endocarditis cumbersome to treat. For decades, the mainstay oftreatment has been the combination of a cell wall-active agent (ampicillin, penicillin, or vancomycin)and gentamicin. High-level resistance to gentamicin hinders, however, the bactericidal activity of suchcombinations. High-level gentamicin resistant (HLGR)E. faecalishas been associated with the hospitalsetting and prior health care exposure, which suggests the existence of a hospital reservoir. Nevertheless,enterococci are gut commensals in humans and warm-blooded animals and it is therefore conceivablethat there may be reservoirs ofE. faecalisin the community not directly linked to hospitals. During2000–2002, the proportion of HLGRE. faecalisisolates increased from 2% to 6% in the pig population inDenmark, which coincided with the emergence of HLGRE. faecalisisolates among infective endocarditispatients in the North Denmark Region. We recently undertook a study to determine whether pigs are apotential source ofE. faecalisinfections in Denmark.Materials and methods:We compared HLGRE. faecalisisolates from Danish pigs (n = 19), Danish pork(n = 1), community-dwelling humans (n = 2) and patients with infective endocarditis (n = 2) by multi-locus sequence typing (MLST) [Larsenet al.2010. Emerg Infect Dis. 16: 682–4].Results:Twenty-three of the 24 strains belonged to MLST type ST16. The remaining isolate from pigsbelonged to MLST type ST35. The 23 isolates with MLST type ST16 were further characterised by pulsedfield gel electrophoresis (PFGE). The PFGE patterns clustered into one major clonal group.Discussion:Our study provided the first evidence of existence of a widespread community reservoir ofHLGR ST16 in Danish pigs, which coincided with the emergence of HLGR ST16 isolates among infectiveendocarditis patients. One isolate was present in pork, which supports foodborne transmission althoughdirect transmission from animals to humans is also possible.Our findings support the results of a study in the United States that identified HLGRE. faecalisisolateswith similar PFGE patterns from pork and fecal swabs of outpatients [Donabedianet al.2003. 41:1109–13]. These pig-related HLGR isolates in the study from the USA as well as our collection of HLGRST16 isolates carry theaac(6’)Ie-aph(2’’)Iagene encoding gentamicin resistance. The isolates from pigsbelonging to ST16 carried pathogenicity island (PAI) genes [Shankaret al.2006. J Clin Microbiol. 44:4200–3].These genes are more frequently detected amongE. faecalisisolates recovered from sites of infectionsuch as blood and urine or from fecal swabs of inpatients when compared with isolates from fecal swabsobtained from healthy humans.Further studies are required to better understand the human and veterinary epidemiology of thiszoonosis. Areas of study should include size of the reservoir in pigs as well as in the hospital and otherhealth care settings and whether or not other animals, immunocompromised persons, or healthy humansconstitute a community reservoir of HLGRE. faecalisST16.Since 2002, we have observed a continuous increase in the proportion of HLGRE. faecalisisolates in thepig population in Denmark (from 6% in 2002 to 20% in 2009). With an annual production of >22 millionslaughter pigs, Denmark therefore has a large potential reservoir of HLGR ST16. Additional studiesinvestigating the clinical impact of this increase are urgently needed.Jesper Larsen, Henrik C. Schønheyder, Camilla H. Lester,Stefan S. Olsen, Lone J. Porsbo, Lourdes Garcia-Migura,Lars B. Jensen, Magne Bisgaard and Anette M. HammerumFor further information: Jesper Larsen ([email protected])
80
DANMAP 2010
Textbox 5
RESISTANCE IN INDICATOR BACTERIA
7.
Detection of vancomycin resistantEnterococcus faeciumin Danish broilers15 years after the ban of avoparcinBackground:Data on the occurrence of antimicrobial resistance in animal enterococci presented inDANMAP are generated by antimicrobial susceptibility testing of one random isolate per herd. It haspreviously been shown that this approach leads to lower resistance frequencies compared toantimicrobial selective methods [Heueret al.2002. Microb. Drug Resist. 8: 133–138], but generally theseresistance frequencies are representative for the occurrence in the tested bacterial population [Vieiraetal.2008. Antimicrob Agents Chemother. 62: 535–38]. In order to quantify the differences between theresults obtained by selective and non-selective methods, a subset of the faecal samples collected from pigs,broilers and cattle in DANMAP 2010 were additionally analysed for the occurrence of ampicillin andvancomycin resistant enterococci by selective enrichment in antimicrobial-containing media.Materials and methods:Faecal samples from pigs (n = 123), broilers (n = 100) and cattle (n = 100) wereenriched in 5 ml of Enterococcus Selective Broth containing ampicillin (16 �g/ml) or vancomycin (16�g/ml). Following subculture on Slanetz agar containing the same antimicrobial concentration, coloniestypical ofE. faeciumandE. faecaliswere confirmed by species-specific PCR [Dutka-Malenet al.1995. JClin Microbiol. 33: 24–27]. Vancomycin-resistantE. faecium(VREF) was confirmed by PCR detection ofvanA.Results:Ampicillin and vancomycin resistance was only found inE. faecium.No resistance to these anti-microbial agents was detected inE. faecalisisolates from all other tested animal reservoirs (pigs,broilers and cattle).VREF was isolated at high frequency (47%) in samples from broilers, while no re-sistant isolates were detected using the non-selective method. None of the samples from pigs and cattlewere positive for VREF.E. faeciumresistant to ampicillin was found in all animal species (28% in broilers,4% in cattle and 2% in pigs).Discussion and conclusions:The study confirmed marked differences between data generated by selec-tive and non-selective methods for VREF from broilers. The lack of detection by random isolation is dueto the relatively low concentration of VREF per gram compared to the totalE. faeciumconcentration in broiler faeces. The ratio of vancomycin resistant enterococci to the total enterococcicount has previously been reported to range from 0.8% to 4.6% in Norwegian broilers 10 years after theban of avoparcin [Sørumet al.2006. Appl Environ Microbiol. 72: 516–521], which makes VREFdetection nearly impossible by the current method used in DANMAP. Ampicillin resistantE. faeciumwere isolated from nearly one third of the broiler flocks when using the selective enrichment even thoughampicillin resistance was not detected inE. faeciumisolated by the standard DANMAPprocedure (see Table 7.1). Resistance to ampicillin and vancomycin was low (≤2%) or absent in samplesfrom pigs and cattle, and no significant differences were observed between the two methods in these ani-mal species.The reasons for the long persistence of VREF in Danish broilers 15 years after the avoparcin ban areunknown.The VREF isolates in this study were not multilocus sequenced typed (MLST), but other studieshave shown thatE. faeciumisolates of poultry origin cluster together in one cluster (CC9), whereashumanE. faeciumisolates belong to another cluster (CC17) [Willemset al.2005. Emerg Infect Dis. 11:821–8]. However, as shown by a recentin vivostudy,E. faeciumof poultry origin can act as a donor ofantimicrobial resistance genes for pathogenicE. faeciumof human origin [Lester and Hammerum 2010. JAntimicrob Chemother. 65: 1534–6].Manuela Mander, Lars Bogø Jensen, Anette M. Hammerum,John Elmerdahl Olsen and Luca GuardabassiFor further information: Luca Guardabassi ([email protected])
DANMAP 2010
81
7.
RESISTANCE IN INDICATOR BACTERIA
7.2Escherichia coliE. coliisolates from healthy production animalsoriginated from faecal samples collected for theDANMAP programme at the time of slaughter.For broilers, isolation and susceptibility testing wasperformed at the National Veterinary Institute andfor cattle and pigs at the National Food Institute.E. colifrom meat originated from meat sampled atwholesale and retail outlets, collected randomly inall regions of Denmark by the Danish Veterinary andFood Administration Regional Laboratories in threecentrally coordinated programs. The susceptibilitytesting was done at the National Food Institute.Samples from healthy humans have not been collectedsince 2008. See the definition of multi-resistance inappendix 27.2.1 IndicatorEscherichia colifromproduction animalsE. coliwas isolated from 91% (199/219) of the samplesfrom pigs and from 92% (122/133) of the samplesfrom cattle. For broilers, 382 flocks were sampled,representing 153 different farms. Only one isolate wasincluded per farm and a randomly selected subsampleof 160, 106 and 118 isolates from pigs, cattle andbroilers, respectively, were susceptibility tested andreported.Among animal species, the level of resistance inindicatorE. coliwas lowest in isolates from cattle in2010 (Table 7.3). Of the susceptibility testedE. coliisolates from cattle, 90% were fully sensitive whereas6% were found to be multi-resistant. However,among theE. coliisolates from broilers and pigs
that were susceptibility tested, 57% and 43% werefully sensitive, whereas 11% and 33% were found tobe multi-resistant, respectively. Trends in resistanceto selected antimicrobial agents in isolates fromproduction animals during 2001–2010 are presented inFigure 7.1. The MIC distributions for 2010 are shownin Appendix 1 (Table AP1.22). In general, the highestresistance level was found inE. colifrom pigs, exceptfor fluoroquinolone (nalidixic acid and ciprofloxacin)resistance which was higher in isolates from broilers(8%).The low level of fluoroquinolone resistance inE.colifrom Danish pigs and cattle probably reflectsthe low consumption since 2002, when the usein production animals was restricted by law. Thehighest fluoroquinolone consumption was seen inpoultry, decreasing since 2006 however, whereas theciprofloxacin resistance reached the highest observedlevel in 2007 (14.5%). However, fluoroquinoloneresistance inE. colifrom broilers, pigs and cattle has notchanged significantly over the past decade.In indicatorE. colifrom broilers, no significant changesin resistance were observed in 2010 compared to 2009(Table 7.3). The highest occurrence of resistance wasseen for ampicillin (21%), while amoxicillin has beenthe most frequently used antibacterial agent in thebroiler production for at least a decade (Figure 4.8).RegardingE. colifrom pigs, no significant change inoccurrence of resistance was observed from 2009 to2010. For most antimicrobial agents, the consumptionwas similar in 2009 and 2010. However, importantdecreases in consumption was seen for tetracyclines(9% per pig produced) and cephalosporins (50% perpig produced) in 2010, related to the second halfyear (increase in first half year). Since a time lapseis often seen between changes in consumption andDANMAP 2010
Table 7.3. Resistance (%) inEscherichia colifrom animals and meat of Danish and imported origin, Denmark
Antimicrobial agentTetracyclineChloramphenicolFlorfenicolAmpicillinCeftiofurCefotaximeSulfonamideTrimethoprimApramycinGentamicinNeomycinSpectinomycinStreptomycinCiprofloxacinNalidixic acidColistinNumber of isolates
BroilersDanish%15312100208101514880118
CattleDanish%9114005100126000106
PigsDanish%3740231132211182547001160
Broiler meatDanish Imported%%1346121011658171715564410003110429154644143806158177
BeefDanish Imported%%3100000350303653300030003350505003239
Pork meatDanish Imported%%245638022436101019361630101034191438561414006850
82
DANMAP 2010
RESISTANCE IN INDICATOR BACTERIAFigure 7.1. Resistance (%) in indicatorEscherichia colifrom broilers, cattle and pigs, DenmarkDANMAP 201050BroilersCattlePigs
7.
40% resistant isolates
30
20
10
001 02 03 04 05 06 07 08 09 10Ampicillin01 02 03 04 05 06 07 08 09 10Sulfonamide01 02 03 04 05 06 07 08 09 10TetracyclineStreptomycin
Ciprofloxacin
a consequent change in resistance inE. coli[Jensenet al.2006. J Antimicrob Chemother. 58: 101–107],a significant decrease in resistance was not expectedin 2010. In 2010, two ceftiofur resistantE. coliwereisolated from pigs. In 2009–2010, a supplementaryinvestigation of cephalosporin resistantE. colifrom pigswas performed by use of a selective enrichment method(Textbox 7).Over the past decade, an overall increase in theproportion of resistant indicatorE. coliisolates frompigs has been observed for tetracycline and ampicillinresistance, except for an unexplained peak in 2004.In the same period, use of tetracycline increaseddramatically from 2002–2007 and again importantly in2009 and first half of 2010.In cattle, the overall occurrence of resistance totetracycline increased significantly from 2% in 2009to 9% in 2010 (Table 7.3, Figure 7.1), and in calvesthe consumption of tetracyclines increased by 10%(Table AP1.2). From 2005 to 2010, the tetracyclineconsumption in calves increased by 7% (absolutenumbers), from 28% of the total calves consumptionin 2005 to 30% in 2010; in between, a temporarydecrease in the tetracycline consumption was observedconcurrent with a decreasing trend in resistance.The steep increase in tetracycline resistance in 2010might indicate a low level presence in farms that havetemporarily stopped using tetracycline during 2006–2009.7.2.2 IndicatorEscherichia colifrom meatFor Danish meat,E. coliwere isolated from 37%(68/184) of the pork samples, 27% (32/118) of the beefsamples, and 84% (158/187) of the broiler samples. Forimported meat,E. coliwere isolated from 29% (50/175)of the pork samples, 39% (39/99) of the beef samplesand 78% (177/226) of the broiler samples. Only one
isolate per sample was susceptibility tested and reported(Table 7.3).MIC distributions and occurrence of antimicrobialresistance inE. coliisolates collected from broiler meat,pork and beef sampled at wholesale and retail outlets in2010 are presented in Appendix 1 (Table AP1.23).Among the indicatorE. coliisolates from Danish andimported broiler meat that were susceptibility tested,58% and 19% were fully sensitive, whereas 7% and60% were found to be multi-resistant, respectively. ForindicatorE. colifrom Danish broiler meat, the observedresistance to sulfonamide increased significantly from8% in 2009 to 15% in 2010. As for indicatorE. colifrombroilers, the level of resistance in isolates from broilermeat was very low-moderate for all tested agents, withthe highest level found for ampicillin (16%) (Table 7.3).In imported broiler meat, the level of resistance wassignificantly higher for 13 of the 16 tested antimicrobialagents when compared toE. colifrom Danish broilermeat, including tetracycline, chloramphenicol,ampicillin, cefoxitime, ceftiofur, colistin, sulfonamide,trimethoprim, neomycin, spectinomycin, streptomycin,ciprofloxacin and nalidixic acid (Table 7.3).In 2010, ceftiofur resistance was observed for the firsttime in one isolate from Danish broiler meat obtainedwithout selective enrichment (1%); however, this issignificantly lower than amongE. colifrom importedbroiler meat (7%). The occurrence of fluoroquinoloneresistance in imported broiler meat (41%) was tenfoldhigher than in Danish broiler meat (4%) in 2010 (as in2009) (Table 7.3).In imported pork, two isolates with MIC for nalidixicacid <32 �g/ml and for ciprofloxacin >0.06 �g/mlwere found. One of the isolates contained transferablefluoroquinolone resistance encoded byqnrS.
DANMAP 2010
83
7.
RESISTANCE IN INDICATOR BACTERIAAmong the susceptibility tested indicatorE. coliisolates from Danish and imported pork, 50% and36% were fully sensitive, whereas 24% and 38% werefound to be multi-resistant, respectively. InE. colifrom Danish pork, sulfonamide resistance decreasedsignificantly from 38% to 19%. In 2010, significantlylower resistance to tetracycline and sulfonamide wasfound in isolates from Danish pork compared toimported pork. Fluoroquinolone resistance remainedlow (one isolate) in Danish pork, probably due to thelow fluoroquinolone consumption in Danish pigs since2002. In imported pork, 4% of theE. coliisolates wereresistant to fluoroquinolone. Resistance to ceftiofur wasfound in one isolate from Danish pork in 2010, as inthe two previous years. In 2009–2010, a supplementaryinvestigation of cephalosporin resistantE. colifrommeat was performed by use of a selective enrichmentmethod (Textbox 7).The occurrence of resistance inE. coliisolates obtainedfrom Danish and imported beef remained low andat comparable levels. Among the susceptibility testedindicatorE. coliisolates from Danish and importedbeef, 94% and 87% were fully sensitive, whereas 6% and5% were found to be multi-resistant, respectively. Nosignificant changes were observed from 2009 to 2010.
7.2.3 Comparison of resistance inEscherichiacolifrom production animals and meatData on the occurrence of resistance inE. coliisolatesfrom animals and Danish meat are presented in Table7.3. For most of the tested antimicrobial agents, thelevel of resistance in Danish meat reflected the level ofresistance in the corresponding animal species withsome exceptions.The occurrence of tetracycline and sulfonamideresistance amongE. colifrom Danish pork wassignificantly lower than what was found among Danishpigs. The difference in the level of resistance betweenpork and pigs might be caused by cross contaminationat the slaughterhouse or due to some resistant isolatesbeing less fit to survive through the food productionchain than susceptible isolates.Vibeke Frøkjær Jensen and Lars Stehr Larsen
84
DANMAP 2010
Textbox 6
RESISTANCE IN INDICATOR BACTERIA
7.
Zoonotic aspects ofE. coliurinary tract infectionsBackground:Urinary tract infection (UTI) is one of the most common bacterial infections. The majoraetiological agent of UTI isEscherichia coliaccounting for 80-90% of all infections. ExtraintestinalpathogenicE. coli(ExPEC) are characterized by carrying a number of virulence genes that enable theisolates to cause infection outside the intestinal tract, e.g. by adhering to host surfaces, scavenge iron (orother micronutrients), or evade host response. Furthermore, resistance to antibiotics in ExPEC is increasingwhich complicates treatment. Especially, ExPEC belonging to phylogroup B2 and to a lesser extent D causethe majority of UTI. Likewise, clonal groups and epidemic strains causing UTI have been identified. TheE. colicausing UTI is believed to stem from the patient’s own faecal flora. However, the exterior reservoirof suchE. coliin the human intestines is poorly investigated. The food supply may transmit ExPEC fromanimals to humans. Since the start of DANMAP in 1995,E. colifrom food animals at slaughter and freshretail meat have been collected. Furthermore,E. coliisolates have been collected from healthy humans from2002 through 2006. DANMAP isolates (from 2004) have recently been compared withE. coliisolates frompatients with UTI to test the hypothesis if UTI is a zoonosis.Materials and methods:A total of 964 geographically and temporally matchedE. coliisolates from UTIpatients, community-dwelling humans, Danish and imported broiler chicken meat, healthy Danish broilerchickens, Danish and imported pork and healthy Danish pigs were included. All isolates were investigatedfor phenotypic antimicrobial resistance, for phylogroups (A, B1, B2, D) and for eight ExPEC-relatedvirulence genes (kpsM II,papAandpapC, iutA, sfaS, focG, afaandhlyD)[Jakobsenet al.2010. FoodbornePathog Dis. 7: 537–47; Jakobsenet al.2010. Int J Food Microbiol. 142: 264–72]. Despite many studiesinvestigating this hypothesis using molecular characterization,in vivostudies have been lacking. Therefore,a subset of B2E. coliisolates (n = 13) (type 1-fimbriaeted and positive for two or more of the virulence genesiutA, kpsM II, papA, papC, focG, sfaS,orhlyA)from animals and meat were investigated for their ability tocause infection in a murine model of ascending UTI [Jakobsenet al.2010. J Clin Microbiol. 48: 2978–80].The model is representative of UTI in humans. Further, D isolates from all origins (n = 158) were screenedfor Clonal group A (CgA) status. This clonal group cause invasive disease in humans, mainly UTI, but thedistribution and possible sources are poorly investigated. Identified CgA isolates were investigated for clonalrelationship and virulence in the murine UTI model [Jakobsenet al.2010. Appl Environ Microbiol. 2010 76:8281–4].
Figure 1. Distribution (%) of phylogroups and non-typeables amongEscherichia coliisolatesfrom animals, meat and humans, DenmarkDANMAP 2010Pigs (n=145)Imported pork (n=10)Danish pork (n=177)Broiler chickens (n=138)Imported broiler chicken meat (n=86)Danish broiler chicken meat (n=197)Comm. humans (n=109)Patients with UTI (n=102)0%20%40%60%80%100%
AB1B2DNon-typeable
DANMAP 2010
85
7.
RESISTANCE IN INDICATOR BACTERIA
Results and discussion:Phylogroup B2 and D isolates were detected in different frequencies amongisolates from all origins, including food animals and retail meat (except for imported pork)(Figure1).Phylogroup B2 was predominant among UTI and community-dwelling human isolates and phylogroup Awas predominant among animal and meat isolates. Animal and meat isolates were similar to UTI isolatesbased on the phenotypic antimicrobial resistance [Jakobsenet al.2010. Foodborne Pathog Dis. 7: 537–47].Although B2 and D isolates were found in low frequencies among animal and meat isolates, they may posea risk for acquiring potentially uropathogenicE. colifrom these sources. The detection of seven out of eightExPEC-related virulence genes among animal and meat isolates and clustering of animal and meat isolateswith UTI isolates based on antimicrobial resistance and virulence genes supported this finding [Jakobsenetal.2010. Int J Food Microbiol. 142: 264–72]. All 13 investigated B2 isolates from animal and meat isolateswere virulent in the murine UTI model with bacterial counts in urine, bladder and often kidneys (n = 9)providing solid evidence that UTI is at times a zoonosis [Jakobsenet al.2010. J Clin Microbiol. 48: 2978–80].This was further supported by the finding of 25 CgA isolates among isolates from broiler chickens and meat,community-dwelling humans and UTI patients. Although no CgA animal or meat isolates were clonallyrelated to any human isolate, several community-dwelling isolates were related to UTI isolates despite noknown relation. Retail meat may have been a common source. Like the B2 isolates, the CgA phylogroup Danimal and meat isolates were virulent in the murine bladder and murine kidneys [Jakobsenet al.2010. ApplEnviron Microbiol. 76: 8281–4].Conclusion:Food animals and fresh retail meat are sources of B2 and D isolates including invasive humanClonal group A isolates. Meat and animal isolates are similar to human isolates with respect to resistance andvirulence genes. Further, animal and meat isolates can cause infection in bladder and kidneys in a murinemodel providing evidence that UTI can be a zoonosis.For further information: Lotte Jakobsen ([email protected])
86
DANMAP 2010
Textbox 7
RESISTANCE IN INDICATOR BACTERIA
7.
Occurrence of Extended spectrum beta-lactamase (ESBL)-producingEscherichia coliafterselective enrichment with ceftriaxone in meat and food producing animalsBackground:Extended spectrum beta-lactamase (ESBL)-producing bacteria is one of the fastest emergingresistance problems worldwide. The resistance type seems to be related to food producing animals andmay spread to humans via food. June 2010, the use of cephalosporins in the Danish pig production wasdiscontinued, but it is still used for systemic and intramammary treatment in cattle. Cephalosporins have notbeen used in the Danish broiler production for at least a decade. The aim of this study was to investigate theoccurrence of ESBL-producingE. coliin pigs at farm level, in cattle and broilers at slaughter and in meat atretail (see Appendix 2 for definition of ESBL).Materials and methods:During June 2010 through December 2010, stool samples (n = 99) were collected inpig farms, fecal samples (n = 192) were taken from cattle at slaughter and pools of five cloacal swabs (n = 197)were taken from broiler flocks at slaughter. From January through November 2010, 990 meat samples [Danish:Pork (n = 184), broiler meat (n = 187), and beef (n = 118); imported: Pork (n = 176), broiler meat (n = 226),and beef (n = 99)] were collected in retail stores and outlets. The samples were randomly selected and for pigseach farm was sampled only once. For cattle, one animal represented one farm. For broilers, five animals perflock were included in the pooled sample. No broiler flock or cattle herd was sampled more than once in thesame month.The meat samples were collected randomly in all regions of Denmark.E. coliwas isolated from 1 g of pig stoolsample, 1 g of cattle feces, pools of five cloacal swabs or 5 g of meat after selective enrichment in McConkeymedia with ceftriaxone (1 �g/ml). The genetic background for ESBL resistance was revealed by use of PCR,array and DNA sequencing.Results:Eleven percent (11/99) of the pig stool samples contained ceftriaxone resistantE. coli(ESBL-producingincluding up-regulation of chromosomal AmpC). Among these isolates, eight (64%) contained CTX-M-1,two (18%) contained CTX-M-2, one isolate contained CMY-2 (9%) and one was AmpC up-regulated (9%).For cattle, 10% (20/192) of the faecal samples contained ceftriaxone resistantE. coli.Among these isolates, tencontained CTX-M-1 (50%), five contained CTX-M-14 (25%), one contained CTX-M-15 (5%), one containedCTX-M-8 (5%) and three were AmpC up-regulated (15%). For broilers, 27% (53/197) contained ceftriaxoneresistantE. coliand these isolates contained CMY-2 (89%) and SHV-2 (11%) (Figure 1).
Figure 1. Occurrence (%) of ESBL-genes and AmpC up-regulatedEscherichia coliin broilers,cattle and pig farms, DenmarkDANMAP 2010302520151050BroilersCattlePig farmsCTX-M-15SHV-2CTX-M-8CTX-M-14AmpC up-regulationCMY-2CTX-M-1
DANMAP 2010
87
7.
RESISTANCE IN INDICATOR BACTERIAFrom meat samples, the highest prevalence of ceftriaxone resistantE. coliwas found among imported poultry(50%). Ceftriaxone resistantE. coliwere found in 8.6% of isolates from Danish broiler meat and in 0.8 - 2.8%of isolates from the other meat catagories. Among the 113 ceftriaxone resistantE. colifrom imported broilermeat, 42 contained CMY-2 (37%), 50 contained CTX-M-1 (44%), 11 contained SHV-12 (10%), three containedCTX-M-2 (3%),fivehad other mechanisms (4%) (SHV-2a, TEM-52) and two (2%) had unknown mechanisms.Among the other meat categories, CMY-2 and CTX-M-1 were found (Figure 2).Figure 2. Occurence (%) of ESBL-genes and AmpC up-regulatedEscherichia coliin meat, DenmarkDANMAP 201050
40
% isolates
30
20
10
0200920102009201020092010200920102009201020092010
DanishPork
Import
DanishBeef
Import
DanishBroiler meat
Import
CTX-M-1
CMY-2
AmpC upregulation
CTX-M-2
CTX-M-14
TEM-20
TEM-52
SHV-2a
SHV-12
unknown
Discussion and conclusions:The use of selective enrichment with ceftriaxone revealed ESBL-producingE.coliin food producing animals, which were not found by standard monitoring of indicatorE. colias previouslydescribed [DANMAP 2009]. The highest prevalence of ESBL was found in broilers; this was surprising sincecephalosporins are not used in the Danish broiler production. The occurrence of ESBL-producingE. colifound inpigs in 2010 corresponded to the occurrence reported for pigs in 2009 [DANMAP 2009]. The occurrence of ESBLin cattle at slaughter in 2010 was similar to the occurrence of ESBL producingE. coliin pigs.The presence of ESBL-genes differed depending on animal reservoir. CMY-2 and SHV-2 seemed to be morerelated to the broiler production, whereas CTX-M-8 was found only in cattle. Even though ESBL-producingE. coliare present in Danish pig farms and in cattle at slaughter, the most important meat source seemed to beimported poultry. The presence of ESBL-producingE. coliin imported broiler meat has increased significantlyfrom 36% in 2009 to 50% in 2010, mainly due to a higher prevalence of CTX-M-1. The occurrence of ESBL-producingE. coliin the other meat categories was at the same levels as in 2009.Although it seems like the occurrence of ESBL-producingE. coliin Danish broiler meat was higher in 2010than in 2009, no statistically significant difference (p = 0.07) was observed. Since broilers and broiler meat seemto be an important reservoir for ESBL-producingE. coli,also in countries like Denmark with no consumptionof cephalosporins in the broiler production, more effort should be done to investigate factors important forselection of ESBL in the broiler production.Several of the ESBL-genes detected amongE. coliobtained from animals and meat can also be detected inE. coliof human origin; CTX-M-15 is most often detected in ESBL-producingE. colifrom both urine and bloodstreaminfections in Danish patients, whereas CTX-M-1, CTX-M-14 and CMY-2 are present to lesser extent [Leihofet al.2011. ECCMID Poster 660; Hansenet al.2011. ECCMID Poster 662]. CTX-M-14 and CMY-2 have beendetected inE. coliobtained from faecal samples from healthy Danish military recruits, indicating a human faecalreservoir of ESBL-genes in the community [Hammerumet al.2011. Clin Microbiol Infect. 17: 566–8]. Morestudies are needed to investigate the possible transfer of ESBL-producingE. colior ESBL-genes between humansand animals.For further information: Yvonne Agersø ([email protected])
88
DANMAP 2010
RESISTANCE IN HUMAN CLINICAL BACTERIA
8
DANMAP 2010
89
8.
RESISTANCE IN HUMAN CLINICAL BACTERIA
8. Resistance in human clinical bacteria8.1Escherichia coliEscherichia coliis part of the normal intestinal floraof both humans and animals but also cause infections(Textbox 6). In humans,E. colicause a variety ofintestinal and extra-intestinal infections such asdiarrhoea, urinary tract infections, meningitis, andbloodstream infections. ForE. coli,this report includesdata from 14 Departments of Clinical Microbiology(DCM), representing 95% of the Danish population.Data on antimicrobial resistance in blood and urineisolates ofE. coliin hospitals were obtained from 14 ofthe 15 Danish DCM working with hospital isolates; 13DCM of the 14 DCM working with primary health careisolates contributed data on antimicrobial resistance inurine isolates ofE. colifrom primary health care (Table8.1).E. coliblood isolates obtained from hospitalisedpatients
In 2010, cefuroxime (2nd generation cephalosporin)resistance was 8% (min. 3%, max. 15%) the sameas reported in 2009. Likewise, 7% (min. 4%, max.13%) of the isolates were resistant to 3rd generationcephalosporin (reported as ceftazidime, ceftriaxone,cefpodoxime or cefotaxime) similar to the level in 2009.Third generation cephalosporin resistance can be dueto production of ESBL or AmpC enzymes. The geneticbackground was not reported for the 3rd generationcephalosporin resistantE. coliisolates in 2010. A studyofE. colifrom bloodstream infections obtained fromthree DCM in 2009 has shown that ESBL-producingenzymes are the most frequent cause of resistance to 3rdgeneration cephalosporins, with CTX-M-15 being themost frequent enzyme. In 2009, CTX-M-15 was spreaddue to both clonal and non-clonal strains [Hansenet al.2011 ECCMID poster 660].In 2010, ciprofloxacin resistance was 14% (min. 7%, max.22% at the individual DCM) and nalidixic acid resistancewas 18% (min. 8%, max. 21%), which is the same level asin 2009.
The antimicrobial susceptibility of approximately 3,400E. coliisolates from blood was reported in 2010 (Table8.1 and Figure 8.1).
Table 8.1. Resistance (%) inEscherichia coliisolates from humans, Denmark 2010
DANMAP 2010
Antimicrobial agentAmpicillinMecillinamSulfonamideGentamicinCiprofloxacinNalidixic acidCefuroxime3rd generation cephalosporinsd)MeropenemMax. number of isolates tested
Blood isolates, hospitals(a)%469*6*14188703426
Urine isolates, hospitals(b)%41 #735 #412 #155#536149
Urine isolates, primaryhealth care(c)%40 #637 #31115 *3329421
*) An asterisk indicates a significant increase from 2009 to 2010#) A number sign indicates a significant decrease from 2009 to 2010a) 14 DCM reported data on ampicillin, gentamicin and 3rd generation cephalosporin resistance, 13 DCM reported ciprofloxacin andcefuroxime resistance, 10 DCM reported mecillinam and nalidixic acid resistance, and 8 DCM reported data on meropenem resistance. Dataon sulfonamide resistance were not reportedb) 14 DCM reported data on ampicillin and mecillinam resistance, 12 DCM reported cefuroxime resistance, 10 DCM reported gentamicinand 3rd generation cephalosporin resistance, and 9 DCM reported data on sulfonamide, ciprofloxacin and nalidixic acid resistance. Nocomparison of gentamicin resistance in 2009 and 2010 was made, since data were not reported in 2009. Since resistance to meropenem wasonly reported from one DCM, data are not shownc) 13 DCM reported data on ampicillin and mecillinam resistance, 11 DCM reported sulfonamide resistance, 9 DCM reported nalidixicacid and 3rd generation cephalosporin resistance, 8 DCM reported ciprofloxacin resistance, and 7 DCM reported data on gentamicin andcefuroxime resistance. No comparison of gentamicin resistance in 2009 and 2010 was made, since data were not reported in 2009d) Tested 3rd generation cephalosporins were ceftazidime, ceftriaxone, cefpodoxime and cefotaxime
90
DANMAP 2010
RESISTANCE IN HUMAN CLINICAL BACTERIAFigure 8.1. Resistance (%) inEscherichia coliblood isolates from humans, Denmark5040% resistant isolates% resistant isolates302010001020304050607080910Gentamicin (n=3417)Ciprofloxacin (n=3166)
8.
2018161412108642001020304050607
DANMAP 2010
08
09
10
Ampicillin (n=3426)Mecillinam (n=2520)3rd gen. cephalosporin (n=3390)
Cefuroxime (n=3256)Nalidixic acid (n=2380)
Note: The number (n) in parentheses represents the number of isolates tested for susceptibility in 2010
The level of fluoroquinolone and 3rd generationcephalosporin resistance in Denmark was again abovethe level reported to EARS-Net by the other Nordiccountries and corresponded to the occurrence reportedby other European countries in 2009 [EARS-Net 2009].A small but significant increase in aminoglycoside(gentamicin) resistance was observed from 5% in 2009to 6% in 2010. This corresponded to the level reportedto EARS-Net by the other Nordic countries in 2009[EARS-NET 2009]. Among the 10 DCM reporting datain both 2009 and 2010, mecillinam resistance increasedsignificantly from 5% to 9% (in 2010, min. 2%, max.17%).Over the last decade, resistance to cefuroxime hasincreased from 2% in 2001 to 8% in 2010. Resistance to3rd generation cephalosporins has only been reportedsince 2008. Resistance to fluoroquinolones has alsoincreased over the last ten years; ciprofloxacin resistanceincreased from 2% in 2001 to 14% in 2010, and nalidixicacid resistance from 5% in 2001 to 18% in 2010.Aminoglycoside (gentamicin) resistance has increasedfrom 1% in 2001 to 6% in 2010.In 2010, carbapenem (meropenem) resistance was notobserved inE. coliblood isolates.E. coliurine isolates obtained from hospitalisedpatients
ciprofloxacin resistance has increased from 1% in 2001to 12% in 2010, and nalidixic acid resistance from 5% in2001 to 15% in 2010.In 2010, carbapenem (meropenem) resistance wasobserved in twoE. coliurine isolates from hospitalisedpatients. The carbapenem resistant isolates were notfurther investigated. The presence of antimicrobialresistance in this species is not mandatory reportable,and no calculation of the occurrence of carbapenemresistance could be made since only one DCM reporteddata on all isolates.E. coliurine isolates obtained from primary healthcare
The antimicrobial susceptibility of approximately 29,000E. coliisolates obtained from patients with a urinarytract infection from primary health care was reported in2010 (Table 8.1 and Figure 8.3).A small but significant increase in nalidixic acidresistance was observed from 14% in 2009 to 15%in 2010. Also, over the last decade the occurrenceof resistance to fluoroquinolones has increased;ciprofloxacin resistance from 1% in 2001 to 11% in2010, and nalidixic acid resistance from 5% in 2001 to15% in 2010, respectively.From 2009 to 2010, smaller but significant decreases inresistance were observed for ampicillin (42% in 2009,40% in 2010) and sulfonamide (38% in 2009, 37% in2010).In 2010, carbapenem (meropenem) resistance wasobserved in fiveE. coliurine isolates from primaryhealth care. The carbapenem resistant isolates werenot further investigated. The presence of antimicrobialresistance in this species is not mandatory reportable,and no calculation of the occurrence of carbapenemresistance could be made since the DCM reported dataon selected isolates only.Line Skjøt-Rasmussen, Stefan S. Olsenand Anette M. HammerumDANMAP 201091
The antimicrobial susceptibility of approximately 36,000E. coliisolates obtained from hospitalised patients witha urinary tract infection was reported in 2010 (Table 8.1and Figure 8.2).From 2009 to 2010, smaller but significant decreases inresistance were observed for the following antimicrobialagents: ampicillin (42% in 2009, 41% in 2010),sulfonamide (36% in 2009, 35% in 2010), ciprofloxacin(13% in 2009, 12% in 2010) and cefuroxime (2ndgeneration cephalosporin) (6% in 2009, 5% in2010). However, over the last decade the occurrenceof resistance to fluoroquinolones has increased;
8.
RESISTANCE IN HUMAN CLINICAL BACTERIAFigure 8.2. Resistance (%) inEscherichia coliurine isolates from humans in hospitals, Denmark5040% resistant isolates302010001020304050607080910Cefuroxime (n=30709)Nalidixic acid (n=23527)
201816% resistant isolates1412108642001020304050607080910
DANMAP 2010
Ampicillin (n=36149)Ciprofloxacin (n=28630)Sulfonamide (n=21068)
Mecillinam (n=36105)3rd gen. cephalosporin (n=26452)
Note: The number (n) in parentheses represents the number of isolates tested for susceptibility in 2010
Figure 8.3. Resistance (%) inEscherichia coliurine isolates from humans in primary health care, Denmark5040% resistant isolates302010001020304050607080910Cefuroxime (n=21299)Nalidixic acid (n=18626)
201816% resistant isolates1412108642001020304050607080910
DANMAP 2010
Ampicillin (n=29421)Ciprofloxacin (n=24077)Sulfonamide (n=24824)
Mecillinam (n=29364)3rd gen. cephalosporin (n=20609)
Note: The number (n) in parentheses represents the number of isolates tested for susceptibility in 2010
8.2Klebsiella pneumoniaeKlebsiella pneumoniaeis part of the intestinal florain humans but is often the cause of extra-intestinalinfections such as urinary tract-, respiratory tract-,wound- and bloodstream infections. Many of theseinfections are hospital acquired and can be lifethreatening, especially if the strains are resistant toantimicrobial agents.K. pneumoniaeis intrinsicallyresistant to aminopenicillins (e.g. ampicillin).Therefore, infections caused byK. pneumoniaearetreated with broad spectrum antimicrobial agentssuch as ciprofloxacin, gentamicin, cephalosporinsand carbapenems. Data on antimicrobial resistance inblood and urine isolates ofK. pneumoniaein hospitalswere obtained from 14 of the 15 Danish DCM workingwith hospital isolates; 13 of the 14 DCM workingwith primary health care isolates contributed dataon antimicrobial resistance in urine isolates ofK.pneumoniae.92
K. pneumoniaeblood isolates obtainedfrom hospitalised patientsThe antimicrobial susceptibility of approximately 800K.pneumoniaeisolates from blood was reported in 2010(Table 8.2).Until 2007, the occurrence of antimicrobial resistanceinK. pneumoniaewas low and at the same level as inthe other Nordic countries (e.g. for 3rd generationcephalosporins <5%). However, since 2007 a steadyincrease in resistance has been observed until 2009.When comparing 2010 with 2009, a significant decreasewas observed for gentamicin, ciprofloxacin andcefuroxime resistance; this was mostly due to decreasedoccurrence of these resistances inK. pneumoniaeisolates from Zealand. This could in part be explainedby interventions at hospitals in the Copenhagen area(Textbox 8).
DANMAP 2010
RESISTANCE IN HUMAN CLINICAL BACTERIAIn 2010, 3rd generation cephalosporin resistance(reported as ceftazidime, ceftriaxone, cefpodoximeor cefotaxime) was 9% (min. 4%, max. 24%); thiswas at the same level as in 2009 (12%). In 2010, 3rdgeneration cephalosporin resistance was above the levelreported to EARS-Net by the other Nordic countriesand corresponded to the occurrence reported by severalother European countries in 2009 [EARS-Net 2009]. Inthe Eastern part of Denmark (Zealand), 3rd generationcephalosporin resistance inK. pneumoniae(14%) wassignificantly higher than in the Western part (Funenand Jutland) (6%). Third generation cephalosporinresistance can be due to production of ESBL or AmpCenzymes. The genetic background was not reportedfor the 3rd generation cephalosporin resistantK.pneumoniaeisolates in 2010. In a study from 2008,it was observed that 3rd generation cephalosporinresistantK. pneumoniaefrom bloodstream infectionsin Danish hospitals was mostly due to spread of twoclones (ST15 and ST16) producing the ESBL-enzymeCTX-M-15 among hospitals in Zealand. Both cloneshave been reported in other countries before, indicatinginternational spread [Lesteret al.2011, Int J AntimicrobAgents. 38(2): 180-2].The occurrence of fluoroquinolone resistance(ciprofloxacin 11%, nalidixic acid 17%) andaminoglycoside (gentamicin) resistance (6%) was abovethe level reported from the other Nordic countries andthe same as reported to EARS-Net by other Europeancountries in 2009 [EARS-Net 2009].In 2010, carbapenem (meropenem) resistance was notobserved inK. pneumoniaeblood isolates.
8.
K. pneumoniaeurine isolates obtainedfrom hospitalised patientsThe antimicrobial susceptibility of approximately 5,500K. pneumoniaeisolates obtained from hospitalisedpatients with a urinary tract infection was reported in2010 (Table 8.3).The occurrence of 3rd generation cephalosporinresistance was 12% (reported as cefpodoxime orcefotaxime) and corresponded to the occurrencereported in 2009 (13%). In the Eastern part of Denmark(Zealand), 3rd generation cephalosporin resistance inK.pneumoniae(20%) was significantly higher than in theWestern part (Jutland) (7%).Fluoroquinolone resistance decreased from 2009 to2010; ciprofloxacin resistance decreased from 17% to14%, and nalidixic acid resistance decreased from 22%to 20%. In the Eastern part of Denmark (Zealand),the occurrence of ciprofloxacin resistance (16%) wassignificantly higher than in the western part (Jutlandand Funen) (7%).In 2010, carbapenem (meropenem) resistance wasobserved in sevenK. pneumoniaeurine isolates fromhospitalised patients. The seven isolates were tested forthe presence of carbapenem resistance genes. One ofthe seven isolates produced the new carbapenemaseenzyme New Delhi metallo-β-lactamase 1 (NDM-1)and was resistant towards all tested antimicrobial agentsexcept tigecycline and colistin. This isolate was obtainedfrom urine from a colonised patient [Hammerumetal.2010, Lancet Infect Dis 10: 829-30]. The patient hadbeen travelling to Bosnia and Herzegovina; a Balkanlink has also been found in other countries with theTable 8.3. Resistance (%) inKlebsiella pneumoniaeurine isolates from humans in hospitals, DenmarkDANMAP 2010
Table 8.2. Resistance (%) inKlebsiella pneumoniaeisolates from blood, DenmarkDANMAP 2010
Antimicrobial agentGentamicinCiprofloxacinNalidixic acidCefuroxime3rd gen. cephalosporins(d)MeropenemMax. number of isolates tested
2008%7.616.122.215.29.60.2788
(a)
2009%9.018.121.817.112.00886
(b)
2010%6.011.317.412.89.20799
(c)
Antimicrobial agentMecillinamSulfonamideGentamicinCiprofloxacinNalidixic acidCefuroxime3rd gen. cephalosporins(c)Max. number of isolates tested
2009%13.327.017.321.9
(a)
a) 14 DCM reported data on gentamicin resistance, 13 DCMreported ciprofloxacin and cefuroxime resistance, 11 DCM reported3rd gen. cephalosporin resistance, 10 DCM reported nalidixic acidresistance, and 9 DCM reported data on meropenem resistanceb) 14 DCM reported data on ciprofloxacin and gentamicinresistance, 13 DCM reported cefuroxime resistance, 12 DCMreported 3rd gen. cephalosporin resistance, 10 DCM reportednalidixic acid resistance and 9 DCM reported data on meropenemresistancec) 14 DCM reported data on gentamicin and 3rd gen. cephalosporinresistance, 13 DCM reported cefuroxime resistance, 11 DCMreported ciprofloxacin resistance, 10 DCM reported nalidixic acidresistance and 8 DCM reported data on meropenem resistanced) Tested 3rd generation cephalosporins were ceftazidime,ceftriaxone, cefpodoxime and cefotaxime
12.86394
2010(b)%14.328.67.313.919.612.812.05740
a) 12 DCM reported data on mecillinam, sulfonamide andciprofloxacin resistance, 8 DCM reported nalidixic acid and 3rdgeneration cephalosporin resistance, and 1 DCM reported data onmeropenem resistance (not shown). Gentamicin and cefuroximeresistance was not reportedb) 14 DCM reported data on mecillinam resistance, 12 DCMreported cefuroxime resistance, 10 DCM reported gentamicinand 3rd generation cephalosporin resistance, 9 DCM reportedsulfonamide, ciprofloxacin and nalidixic acid resistance, and 1DCM reported data on meropenem resistance (not shown)c) Tested 3rd generation cephalosporins were cefpodoxime andcefotaxime
DANMAP 2010
93
8.
RESISTANCE IN HUMAN CLINICAL BACTERIAfirst NDM-1 isolates [Struelenset al.2010, EuroSurveill. 15 pii: 19716]. Another of the seven isolateswas positive for VIM-1, whereas the remaining fivecarbapenem resistant isolates were not positive forany of the known carbapenem resistance genes. Thepresence of antimicrobial resistance in this species isnot mandatory reportable, and no calculation of theoccurrence of carbapenem resistance could be madesince only one DCM reported data on all isolates.Sulfonamide resistance increased significantly from27% in 2009 to 29% in 2010.Fluoroquinolone resistance was 20% for nalidixicacid and 12% for ciprofloxacin, corresponding tothe occurrences observed in 2009. However, in theEastern part of Denmark (Zealand), the occurrence ofciprofloxacin resistance (21%) was significantly higherthan in the western part (Jutland and Funen) (7%).Ciprofloxacin resistance inK. pneumoniaefrom urinefrom general practice patients was significantly lowerthan the occurrence of resistance detected in isolatesfrom urine from hospitalised patients.In 2010, carbapenem (meropenem) resistance wasobserved in oneK. pneumoniaeurine isolate fromprimary health care. The carbapenem resistantisolate was not further investigated. The presenceof antimicrobial resistance in this species is notmandatory reportable, and no calculation of theoccurrence of carbapenem resistance could be madesince the DCM reported data on selected isolates only.Sulfonamide resistance increased significantly from30% in 2009 to 34% in 2010. Resistance to mecillinamwas 16% (min. 7%, max. 24%). Both resistance tosulfonamide and mecillinam was significantly higher inthe urine isolates from general practice patients than inthe urine isolates from hospitalised patients, probablyreflecting the usage of sulfonamide and mecillinam inthe treatment of urinary tract infections in primaryhealth care.Anette M. Hammerum, Stefan S. Olsenand Line Skjøt-Rasmussen
K. pneumoniaeurine isolates obtainedfrom primary health careThe antimicrobial susceptibility of approximately 3,000K. pneumoniaeisolates obtained from patients with aurinary tract infection from primary health care wasreported in 2010 (Table 8.4).The occurrence of 3rd generation cephalosporinresistance was 7% (reported as cefpodoxime orcefotaxime) and corresponded to the occurrencereported in 2009 (8%). In the Eastern part of Denmark(Zealand), 3rd generation cephalosporin resistanceinK. pneumoniae(11%) was significantly higher thanin the Western part (Jutland) (4%). Resistance to 3rdgeneration cephalosporins inK. pneumoniaefromurine from general practice patients was significantlylower than the occurrence of resistance detected inisolates from both blood and urine from hospitalisedpatients.Table 8.4. Resistance (%) inKlebsiella pneumoniaeurine isolates from humans in primary health care,DenmarkDANMAP 2010
Antimicrobial agentMecillinamSulfonamideGentamicinCiprofloxacinNalidixic acidCefuroxime3rd gen. cephalosporins(c)Max. number of isolates tested
2009(a)%15.130.213.219.98.13200
a) 11 DCM reported data on mecillinam and sulfonamideresistance, 9 DCM reported ciprofloxacin resistance, and 7DCM reported nalidixic acid and 3rd generation cephalosporinresistance. Meropenem resistance was only reported for selectedisolates and therefore not shown. Gentamicin and cefuroximeresistance was not reportedb) 13 DCM reported data on mecillinam resistance, 11 DCMreported sulfonamide resistance, 9 DCM reported nalidixic acidand 3rd generation cephalosporin resistance, 8 DCM reportedciprofloxacin resistance, and 7 DCM reported gentamicin andcefuroxime resistance. Meropenem resistance was only reportedfor selected isolates and therefore not shownc) Tested 3rd generation cephalosporins were cefpodoxime andcefotaxime
2010(b)%16.333.93.511.919.78.67.03200
94
DANMAP 2010
Textbox 8
RESISTANCE IN HUMAN CLINICAL BACTERIA
8.
Reduction in the prevalence of ESBL-producingKlebsiella pneumoniaeafterchanging the antibiotic policy and antimicrobial consumption at Bispebjerg HospitalIn 2008, an increasing prevalence of ESBL-producingKlebsiella pneumoniaeandE. coliwasobserved in the Copenhagen City area. Especially, ESBL-producingKlebsiella pneumoniaewasincreasing in two hospitals. At the end of 2009, more than 40% of theK. pneumoniaeisolates wereESBL-producing at these two hospitals. This increased level was seen in spite of numerous infectioncontrol initiatives such as reintroducing chlorine cleaning and focusing on isolation precautions.An intervention was prepared for the 600 bed University Hospital, Bispebjerg Hospital, where theusage of cephalosporins was restricted to surgical prophylaxis and to the empirical treatment ofmeningitis, and the usage of quinolones was to be decreased significantly. In Bispebjerg Hospitaland the other hospitals in the area served by the DCM Hvidovre Hospital, the use of penicillinswas preferred in all cases possible, e.g.Staphylococcus aureuswas treated with dicloxacillin, and theuse of quinolones avoided. The intervention was a multidisciplinary exercise planned by a clinicalmicrobiologist and a clinical pharmacologist and carried out in collaboration with the infectionscontrol team and the quality organisations in the hospital. Focus was set on diagnostic initiatives,isolation precautions and use of small spectrum antimicrobial agents when possible. Numerousteaching lectures were given, and written information and guidelines were distributed to all clinicalworking employees in brochures and electronically.The rate of patients at Bispebjerg Hospital with ESBL-producingK. pneumoniaedecreased from43% in January 2010 to 16% in November 2010 (p = 0.007), and the rate of patients with ESBL-producingE. coliwas unchanged at app. 12%. The number of bed-days with patients under isolationprecautions for patients with ESBL-producingK. pneumoniaeandE. coliwas reduced from morethan 260 per month to less than 50 (p < 0.001). The compliance to the new guidelines was almostcomplete; the consumption of cephalosporins decreased by 76% from 2,410 DDD/month in 2009to 581 in 2010. Likewise, for fluoroquinolones a 16% reduction from 1,477 DDD/month in 2009 to1,244 in 2010 was observed. The number of bed-days with patients under isolation precautions wasalso reduced significantly.These outstanding effects of the intervention have resulted in a permanent change in the routineguidelines for the Bispebjerg Hospital to the above described. The effect of improved antimicrobialstewardship in the other hospital in the area with similar problems with ESBL-producingK. pneumoniaealso resulted in a decrease in incidence of patients with ESBL-producingK.pneumoniae.Jenny Dahl Knudsen and Stig E. Andersenfor the Bispebjerg Intervention GroupFor further information: Jenny Dahl Knudsen([email protected])
DANMAP 2010
95
8.
RESISTANCE IN HUMAN CLINICAL BACTERIATable 8.5. Resistance (%) inPseudomonas aeruginosablood isolates from humans, DenmarkDANMAP 2010
Antimicrobial agentCiprofloxacinGentamicinCeftazidimeMeropenemPiperacillin / TazobactamMax. number of isolates tested
2007%5.71.22.42.33.4417
2008%4.5<13.4<12.3426
2009%5.3<13.62.51.8440
2010%5.81.32.83.13.9375
8.3Pseudomonas aeruginosaPseudomonas aeruginosais an opportunistic pathogenof immunocompromised individuals.P. aeruginosatypically infects the pulmonary tract, urinary tract,burns, wounds, and also causes other bloodstreaminfections. It is the most frequent coloniser of medicaldevices (e.g. catheters).P. aeruginosainfection is aserious problem in patients hospitalised with cancer,cystic fibrosis and burns. The case fatality rate in thesepatients is high.P. aeruginosablood isolates obtained fromhospitalised patients
Streptococcus pneumoniae
Streptococcus pneumoniaeis a leading cause of bacterialpneumonia, otitis media, bacteraemia and meningitis. In2010, susceptibility testing was performed on 960 non-duplicateS. pneumoniaeisolates from invasive infections(Figure 8.4).Macrolide resistance inS. pneumoniaeisolates fromblood and cerebrospinal fluid was 4.2% (n = 40) in 2010.The occurrence of macrolide resistantS. pneumoniaehas been around 6% from 2000 to 2008, but decreasedsignificantly from 6.6% in 2008 to 3.6% in 2009. Thedecrease in the number of erythromycin resistantS.pneumoniaemay be related to the introduction ofthe pneumococcal conjugated vaccine in the Danishchildhood vaccination program in October 2007. The 40macrolide resistantS. pneumoniaefrom 2010 belongedto 15 different serotypes and the most commonlyfound serotypes were type 19A (30%), 11A (15%) and14 (12.5%). In previous years, serotype 14 was thedominant erythromycin resistant serotype.As in previous years, no resistance to penicillin in groupB, C or G isolates from invasive infections was reportedin 2010.The percentage ofS. pneumoniaeinvasive isolates beingFigure 8.4. Resistance (%) inStreptococcus pneumoniaeblood and spinal fluid isolates from humans, Denmark7654321093 94 95 96 97 98 99 00 01 02 03 04 05 06 07 08 09 10Penicillin (MIC >= 0.125 ug/ml)Erythromycin (MIC > 2 ug/ml)
ForP. aeruginosa,this report includes data from14 Departments of Clinical Microbiology (DCM),representing 95% of the Danish population. Theantimicrobial susceptibility of approximately 375P.aeruginosaisolates from blood was reported in 2010.Not all DCM tested for the same antimicrobial agents(Table 8.5). The occurrence of resistance was low forall the tested antimicrobial agents and compared to theother countries reporting to the EARS-Net among thelowest.Anette M. Hammerum, Stefan S. Olsenand Line Skjøt-Rasmussen
8.4 StreptococciStreptococci are part of the normal commensal floraof the mouth, skin, intestine, and upper respiratorytract of humans, but streptococci also cause infectionssuch as otitis media, tonsillitis, bacterial pneumonia,bacteremia/sepsis, endocarditis and meningitis.In this report, data on resistance in invasive (fromblood or cerebrospinal fluid) streptococcal isolateswere obtained from the Neisseria and StreptococcusReference laboratory covering all DCM in Denmark.In Denmark, penicillins and macrolides are often usedfor treatment of infections caused by streptococci. Allinvasive non-duplicateStreptococcus pneumoniaeandgroup A, B, C and G streptococci were susceptibilitytested against erythromycin and penicillin.
DANMAP 2010
96
DANMAP 2010
% resistant isolates
RESISTANCE IN HUMAN CLINICAL BACTERIAnon-susceptible (resistant and intermediary resistant)to penicillin was 3.5% (n = 34) in 2010 comparedwith 3.2% in 2007, 3.0% in 2008, and 3.6% in 2009.The 34 penicillin non-susceptibleS. pneumoniaefrom2010 belonged to 16 different serotypes, and the mostcommonly found serotypes were type 19A (38%), 15A(8.8%) and 6C (8.8%). In previous years, serotype 19Awas present in a lower percentage whereas serotype 9Vwas a dominant type also in 2006 and 2007.The occurrence of resistance to erythromycin andpenicillin was similar to the occurrence in otherScandinavian countries but much lower than reportedin many of the other European countries reporting toEARS-Net [EARS-Net 2009].According to EUCAST, one (0.1%, MIC = 4 μg/ml) ofthe 960 tested isolates was resistant to penicillin (MIC> 2 μg/ml). However, according to the CLSI penicillinbreakpoint for susceptibility testing of isolates frompatients with invasive disease treated with intravenouspenicillin, except for patients with meningitis, (2 μg/ml < MIC < 8 μg/ml) this isolate would be reported asnon-susceptible intermediary resistant.Group A Streptococci
8.
8.5 EnterococciEnterococci are part of the normal intestinal flora ofboth humans and animals but can also cause infections.Important clinical infections caused byEnterococcusspecies include urinary tract infections, bacteremiaand bacterial endocarditis.E. faecalisandE. faeciumcan cause life-threatening infections in humans,especially in the hospital environment. The naturallyhigh level of antimicrobial resistance found inE.faecalisandE. faeciummakes infections difficult totreat. Antimicrobial therapy for serious enterococcalinfections requires the use of synergistic combinationsof a cell-wall-active agent such as penicillin (ampicillin)and an aminoglycoside (gentamicin) or a glycopeptide(vancomycin).ForE. faecalisandE. faecium,data from 14 of the 15DCM were obtained, representing 95% of the Danishpopulation.Enterococcus faeciumandEnterococcus faecalisblood isolates obtained from hospitalised patients
In 2010, 155 invasive GAS (Streptococcuspyogenes)isolates were susceptibility tested. As in previousyears, no resistance to penicillin in GAS isolates frominvasive infections was reported in 2010. Erythromycinresistance was detected in two isolates (1.3%) ascompared to six of 143 isolates (4.5%) in 2009 and twoof 136 (1.5%) in 2008.Group B, C and G Streptococci
In 2010, a maximum of 506E. faeciumisolates and535E. faecalisisolates from blood were tested forantimicrobial susceptibility.
In 2010, 110 invasive group B streptococci(Streptococcusagalactiae)isolates from invasiveinfections were tested. Erythromycin resistance wasdetected in 14 isolates (12.7%) compared with 12.8% in2009, and 11.4% in 2008.Fifty-three isolates of invasive group C streptococciwere tested in 2010. One isolate (1.9%) was resistant toerythromycin compared with three isolates (8.1%) in2009 and 4% in 2008.Seventeen (12%) of the tested 142 invasive group Gstreptococci were resistant to erythromycin comparedwith 4.8% in 2009, 10% in 2008, and 8% in 2007.Lotte M. Lambertsen
Ampicillin resistantE. faeciumincreased significantlyfrom 87% in 2009 to 92% in 2010. Treatment withfluoroquinolones, cephalosporins or carbapenems hasbeen described as a risk factor for development of anE.faeciuminfection. An increasing consumption of theseantimicrobial agents has been observed in hospitalsin Denmark during the past years. The antimicrobialpressure in a hospital environment might be a reasonfor the increasing frequency of ampicillin resistantE.faeciumas a cause of bloodstream infections.Only one of the DCM (Aalborg Hospital) tested allenterococcal blood isolates for High-level gentamicinresistance (HLGR). Among the testedE. faecalisisolatesat DCM Aalborg, 36% were HLGR, whereas 74% of thetestedE. faeciumisolates were HLGR. The occurrence ofHLGRE. faecaliswas similar to the occurrence detectedin many countries reporting to EARS-Net in 2009(including Spain, Portugal and Norway) [EARS-Net2009].Vancomycin resistance was detected in 1.8% of theE. faeciumisolates (n = 9) and 0.7% of theE. faecalisisolates (n = 3) from bloodstream infections. During2010, an outbreak of vancomycin resistant (vanA)E.faeciumwas detected at Aarhus University Hospital.This outbreak is under investigation (Brian Kristensen,personal communication).The occurrence of vancomycin resistantE. faeciumandvancomycin resistantE. faecaliswas at the same levelor lower compared to most other countries in Europe[EARS-Net 2009].Since 2005, SSI has asked all the DCM to sendpresumable vancomycin resistant enterococcal isolatesfrom both invasive and non-invasive infectionsfor national surveillance on vancomycin resistant
DANMAP 2010
97
8.
RESISTANCE IN HUMAN CLINICAL BACTERIAenterococci. Besides thevanA E. faeciumisolates fromthe outbreak at Aarhus University hospital, 19vanA E.faecium,7vanB E. faeciumand 5vanB E. faecalisisolateswere received during 2010.As described above, most of theE. faeciumisolates frombloodstream infections were resistant to ampicillin;these infections can therefore not be treated withampicillin but will often be treated with vancomycininstead. This might in part, together with the increasednumber of MRSA infections, explain the increasedconsumption of glycopeptides (vancomycin) inhospitals, which has been observed during the last years.Anette M. Hammerum, Stefan S. Olsenand Line Skjøt-Rasmussenand very low compared to most of the other countriesparticipating in EARS-Net [EARS-Net 2009]. ResistanceinS. aureusbacteremia isolates from 2005–2010 ispresented in Table 8.6.Multi-resistance defined as resistance to at least 1,2 or 3 other antimicrobials in addition to penicillinwas demonstrated in 22%, 7% and 2% of the cases,respectively. In 2010, resistance to fusidic acid andnorfloxacin increased compared with 2009. Eleven(0.8%) of the bacteremia cases belonged to CC398, thestrain type associated to livestock. None of these wereMRSA and any association to pig farming is not known.The corresponding numbers were ten in 2009, six in2008 and five in 2007.Surveillance of Methicillin ResistantS. aureus
8.6Staphylococcus aureusStaphylococcus aureusis part of the normal flora fromskin and mucosa in approximately 50% of humans.Some people only carryS. aureusintermittentlywhereas others carryS. aureusfor longer time.However,S. aureusalso cause infections ranging fromsuperficial skin infections i.e. impetigo and boils,to invasive infections such as post operative woundinfections, infections related to intravenous cathetersand prosthetic devices, arthritis, bacteremia andendocarditis.In Denmark, Methicillin ResistantS. aureus(MRSA)has been both laboratory and clinical notifiable sinceNovember 2006. In recent years,S. aureus,belongingto clonal complex 398 (CC398), has attracted specialattention as this type has been closely connected tolivestock animals, especially pigs, and has affectedpeople in direct contact with pigs.Surveillance of bacteremia
In 2010, 1,097 new MRSA cases were detected (19.8per 100,000 inhabitants). Here, a case is a patient foundpositive for the first time with a specific MRSA strainregardless whether the patient was infected or colonised.This is a large increase (34%) compared with 817 in2009 and is the highest number of cases observed inover 25 years (Figure 8.5). In 2010, five persons werefound with two different MRSA strains. At the time ofdiagnosis, 646 (59%) of the new cases had infection, thiswas at the same level as in 2009 (486 cases (60%)). Theproportion of bloodstream infections with MRSA was1.4% in 2010 (see surveillance ofS. aureusbacteremia).The incidence rate of new MRSA cases per year for eachDCM in the last four years is shown in Table 8.7. Theincidence varied from 30.9 per 100,000 inhabitants inthe greater Copenhagen area (Greater Copenhagen isserved by three DCM, and is shown as one) to 10.6 per100,000 inhabitants in Vejle.The total number of cases and the number of casespresenting with infection according to epidemiologicalclassification are shown in Table 8.8. Most of the cases(77%) were acquired in Denmark. The epidemiologicalclassification of MRSA infections 2006–2010 is shown inFigure 8.6. An increase was seen among cases classifiedas health-care associated, with community onset(HACO) from 49 cases in 2009 to 132 cases in 2010(Figure 8.6). Only 16 of the HACO infections could be
In 2010, 1,418S. aureusbacteremia cases correspondingto 24.6 per 100,000 inhabitants were reported fromthe Departments of Clinical Microbiology (DCM) inDenmark. Twenty (1.4%) of the cases were caused byMRSA. This is at the same level as in previous years
Table 8.6. Resistance (%) in isolates fromStaphylococcus aureusbacteraemia cases, Denmark
DANMAP 2010
Antimicrobial agentMethicillinPenicillinErythromycinClindamycinTetracyclineFusidic acidRifampicinNorfloxacinKanamycinMupirocinNumber of isolates98
2005%1.67854310<13201428
2006%1.48054310<12101329
2007%0.6784329<11<1<11345
2008%1.3775439<121<11344
2009%1.6777629<121<11480
2010%1.47554313<131<11418
DANMAP 2010
RESISTANCE IN HUMAN CLINICAL BACTERIA
8.
Figure 8.5. Number of MRSA cases, with a three years moving average, Denmark12001000Number of cases800600400200019941995199619971998199920002001200220032004200520062007200820092010Numberof casesMovingaverage(3 years)
DANMAP 2010
Figure 8.6. Number of MRSA cases presenting with infection according to epidemiological classification,Denmark35030025020015010050020062007200820092010Hospital-acquired(HA)Health-careassociated,community onset(HACO)Community-acquired (CA)
DANMAP 2010
Imported (IMP)
No. of infections
DANMAP 2010
99
8.
RESISTANCE IN HUMAN CLINICAL BACTERIA
Table 8.7. Incidence rate of new MRSA cases per 100,000 inhabitants per Department of ClinicalMicrobiology, Denmark
DANMAP 2010
Department of ClinicalMicrobiologyGreater Copenhagen(a)HillerødStatens Serum Institut(b)Slagelse(c)NæstvedOdenseSønderborgEsbjergVejleHerningÅrhusViborgAalborgDenmark total
200717.711.73.915.38.87.18.114.523.42.510.18.28.212.1
200823.621.817.619.312.112.911.18.820.07.76.018.510.715.5
200926.916.517.615.18.88.912.86.211.67.310.19.17.614.7
201030.927.0–17.919.816.325.811.810.615.111.611.016.619.8
a) Rigshospitalet (national referral hospital), Hvidovre and Herlevb) Statens Serum Institut is no longer serving former Roskilde Countyc) Including isolates from former Roskilde County
Table 8.8. Epidemiological classification of new MRSA cases, Denmark
DANMAP 2010
Epidemiologic classificationImported (IMP)Hospital-acquired (HA)Health-care associated,community onset (HACO)Health care workerCommunity-acquired (CA)
Exposure
with health care riskwith known exposurewithout known exposurewithout health care riskwith known exposurewithout known exposure
2009No. (%) ofNo. ofcases withcases(a)infections15697 (62)5330 (57)812512 (48)5637 (66)18491176315437 (21)265 (84)3 (75)5 (28)
No. ofcases(b)2476216940129355783312470
2010No. (%) ofcases withinfections163 (66)34 (55)16 (40)116 (90)8 (23)100 (30)210 (85)0 (0)
UnclassifiedNote: Numbers shown in bold are totalsa) Epidemiological classification missing for 5 casesb) Epidemiological classification missing for 6 cases
100
DANMAP 2010
RESISTANCE IN HUMAN CLINICAL BACTERIAassociated with a known exposition, 8 from hospitals,3 from nursing homes and the remaining 5 from othersources. The remaining 116 cases of infection classifiedas HACO were registered with a possible associationto health-care institutions without known exposition,of these were 62 cases with an association to hospitals,and 32 cases with an association to nursing homesand private home care. The increase in the number ofHACO infections without any known exposition mayreflect a better completion of the report forms whereany contact to health-care institutions within theprevious 12 months is registered.Without such information, the cases would have beencategorised as community-acquired (CA) infections.CA infections remained at the same level as in 2009despite the increase in the number of infections.In 2010, more CA cases reported known exposurecompared to 2009, both for patients with infections andcarriers, the latter representing contact screening.Molecular typing of the MRSA strains
8.
An EU funded research programme, PILGRIM,performed screening in 2010 for MRSA CC398 amongpig farmers and their family, workers on pig farms andveterinarians. The number of cases from the targetedscreening constituted 20 cases. t034 and other CC398spatypes were also seen in 15 cases without any knowncontact to pigs or other livestock, although the personslived in areas with a high density of pig productionfacilities. They may represent an adaption of CC398to the human host and the possibility of human-to-human spread. So far there are still no signs of spreadthrough the food chain.Resistance among MRSA isolates
The number of isolates belonging to the 10 dominatingspatypes isolated in 2010 is shown in Table 8.9. Theyconstituted 55% of the total number of MRSA isolates.Sevenspatypes constituted 51% of the 646 clinicalinfections with MRSA (out of 141 differentspatypesassociated with clinical infection). Most prevalentspatypes causing clinical infections were t002, t008,t019, t024, t034, t044 and t032. Of the 451 strainsisolated from asymptomatic carriers, t034 was the mostprevalentspatype (n = 61), followed by t002 (n = 43),t008 (n = 27), t024 (n = 27) and t127 (n = 22). Thenumber of CC398 isolates (the clonal complex relatedto pigs) increased from 40 in 2009 to 109 in 2010.Among the CC398 isolates, the most frequentspatype,t034, increased from 27 in 2009 to 93 in 2010. Thirty-two of the 93 t034 cases represented infections (Table8.9).Table 8.9. The ten most prevalentspatypesdemonstrated in MRSA cases, Denmark 2010
The occurrence of resistance to tetracycline andmupirocin increased when comparing all MRSAisolates in 2010 with all MRSA isolates in 2009 (Table8.10). The increase in tetracycline resistance reflectsthe increased number of t034 in 2010. The resistancepattern varied considerably betweenspatypes (Table8.10). In 2010, 100% of CC398spatype t034 isolateswere resistant to tetracycline and 100% of CC22spatype t032 were resistant to norfloxacin.In contrast, the majority of t019, a primarilycommunity-acquiredspatype, were susceptible to alltested antimicrobial agents except for beta-lactams.Even though differences in antimicrobial resistancewere demonstrated betweenspatypes, the success ofantimicrobial treatment cannot be predicted basedonspatype or epidemiological classification. Multi-resistance, defined as resistance to at least 1, 2 or 3other antimicrobials in addition to cefoxitin/penicillin,was demonstrated in 72%, 58% and 38% of the cases,respectively. In Table 8.11, the most common resistancepatterns and any frequentspatypes are shown.Andreas Petersen, Marit Sørum,Robert L. Skov and Anders Rhod Larsen
DANMAP 2010
spatypet002t034t008t024t019t032t044t127t041t437
CC group(a)CC5CC398CC8CC8CC30CC22CC80CC1CC22CC59
No. of cases110939080733934332524
No. causinginfections (%)67 (61)32 (34)63 (70)53 (66)59 (81)26 (67)27 (79)11 (33)10 (40)19 (79)
a) CC = Clonal complex
DANMAP 2010
101
8.
RESISTANCE IN HUMAN CLINICAL BACTERIATable 8.10. Resistance (%) in the six most prevalentspatypes demonstrated in MRSA cases compared withall MRSA cases, Denmark 2010DANMAP 2010
spatypeClonal complexErythromycinClindamycinTetracyclineFusidic acidRifampicinNorfloxacinKanamycinLinezolidMupirocinNumber of isolates
t002CC5%423914274342301110
t034CC398%4777100401900093
t008CC8%647106055670190
t024CC8%948801102440080
t019CC30%43001100072
t032CC22%646433010030339
All cases%4438281533130031097
Table 8.11. Resistance markers in addition to cefoxitin demonstrated in MRSA cases, Denmark 2010DANMAP 2010
No. of markers01
No. of cases306150
2
222
3
252
4567
9363101
Frequent patterns (no. of isolates) Any frequentspatype (no. of isolates)––T(41)t034(17)N(38)t032(12)F(35)t002(12), t021(10)K(30)E,C(97)t024(51), t002(16)C,T(25)t034(19)F,N(22)t002(14)E,N,K(59)t008(34), t657(14)E,C,N(52)t032(24)E,C,T(49)t034(35)T,F,K(40)t044(20)E,C,T,K(35)t437(16), t127(8)E,C,N,K(22)t002(8)E,C,N,K,M(28)t041(25)E,C,T,N,K(18)t037(6), t189(5)E,C,T,R,N,K(4)E,C,T,F,R,N,K(1)t987(1)
a) T = tetracycline, N = norfloxacin, F = fusidic acid, K = kanamycin, E = erythromycin, C = clindamycin, R = rifampicin
102
DANMAP 2010
Textbox 9
RESISTANCE IN HUMAN CLINICAL BACTERIA
8.
Methicillin resistantStaphylococcus aureus(MRSA) in Danish pig herds, broilers and cattle atslaughter, and in Danish and imported retail meatBackground:Methicillin resistantStaphylococcus aureus(MRSA), especially belonging to the clonalcomplex CC398, has since 2003 emerged in livestock worldwide. The occurrence in Danish pigs atslaughter was investigated in 2009, and 13% of the pigs were found positive [DANMAP 2009]. As MRSAcan be transmitted between animals during transportation and prior to slaughter, the occurrence foundin the slaughterhouses may not be equivalent to the occurrence of MRSA positive farms [Broenset al.VetJ. 2010 (ahead of print)]. MRSA has also been found in many other animal species and in 2009, MRSACC398 was found in a Danish beef sample. MRSA has not previously been found in cattle in Denmark. Theaim of this study was to investigate the occurrence of MRSA at the pig farm level and to see if this differedsignificantly from that found at slaughter in 2009. We also wanted to investigate whether MRSA could befound in cattle and broilers at slaughter. Meat samples were collected to follow changes in occurrence whencompared to data from 2009.Materials and methods:During June through November 2010, pools of five nasal swab samples (n =99) were taken from five slaughter pigs in five different pens in 99 farms in Denmark. Cattle, mainlyyoung bulls, were tested at slaughter by taking skin swabs between leg and udder/testis of 192 animals,representing at least 174 different farms. One hundred ninety-seven pools of five throat swabs from broilersat the same farm were tested. Meat samples of Danish origin: pork (n = 183), broiler meat (n = 186), andbeef (n = 118) as well as imported: pork (n = 176), broiler meat (n = 225), and beef (n = 99) were collectedin retail stores and outlets. The meat samples were collected randomly in all regions of Denmark. MRSAwas isolated from each pool of nasal/throat swabs, skin swabs or from 25 g of meat after pre-enrichmentin Mueller-Hinton medium with 6.5% NaCl followed by selective enrichment in tryptone soya brothsupplemented with 4 mg/L cefoxitin and 75 mg/L aztreonam. Ten �l were transferred to brilliance MRSAagar and colonies with typicalS. aureusmorphology were confirmed to be MRSA by PCR and the isolateswerespatyped.Results and discussion:Sixteen (16%) of the pig farms were positive for MRSA. All isolates except onewerespatyped and all 15 isolates hadspatypes corresponding to CC398. The occurrence of MRSA in pigfarms was not significantly different from what was found in pigs at slaughter in 2009 (13%). In 2009, 95%hadspatypes corresponding to CC398.No MRSA were found among the 192 cattle and 197 broilers at slaughter. A study of MRSA in broilersusing a similar sampling method found 6.9% MRSA positive broilers in The Netherlands [Mulderset al.Epidemiol Infect. 2010. 38: 743–55]. It can therefore be concluded that the occurrence of MRSA in Danishbroilers is lower/absent compared to the Netherlands.The absence of MRSA in cattle may be due to sampling method or that MRSA is not present. A Dutchstudy found that testing for MRSA by use of skin swabs between udder and legs of dairy cows was the mostefficient method compared to testing of nasal swabs or milk. The use of skin swabs between udder/testis asin the present study may not have been so efficient, since the slaughter cattle were mainly young bulls andthis sampling method has been tested for dairy cows (personal communication).From meat samples, the highest occurrence of MRSA was found in imported broiler meat (19%), followedby Danish pork (6.0%), imported pork (5.7%) and imported beef (4.0%). No MRSA were found in Danishbroiler meat or Danish beef. All except two isolates from meat werespatyped. From imported broiler meat,89% corresponded to CC398, one isolate corresponded to CC5, one to CC7 and three corresponded to anewspatype. From Danish pork, only CC398 was found; from imported pork, CC398 was predominant,one isolate corresponded to CC1 and three isolates had aspatype not previously found. From importedbeef, three isolates corresponded to CC398 and one isolate corresponded to CC7 (Figure 1).MRSA CC398 was found in 109 human cases in 2010, the majority in persons with close contact to pigs orbeing a household member to a person with close contact to pigs. In 15 cases no such direct contact couldbe found - the majority of these were in persons living in rural areas with known occurrence of MRSACC398 in pigs. There are still no sign of spread of CC398 to urban areas.
DANMAP 2010
103
8.
RESISTANCE IN HUMAN CLINICAL BACTERIA
Conclusions:This investigation showed that 16% of Danish pig farms were MRSA positive, thisis at approximately the same level as found in 2009 for pigs at slaughter. The occurrence of farmspositive for MRSA is therefore still much lower compared to pig farms in The Netherlands andsome other European countries. No MRSA was found in Danish broilers or cattle. In meat, MRSAwas often found in imported broiler meat (19%), but not in Danish broiler meat. In pork, MRSAwas found at the same level in Danish and imported meat (5-6%). In beef, MRSA was detected inimported but not in Danish meat. The relatively frequent occurrence of MRSA in meat combinedwith no/very few cases in urban areas makes it safe to conclude that there is very little if any risk formeat being a risk for contracting MRSA CC398. Pigs still seem to be the most important reservoirfor MRSA CC398.Yvonne Agersø, Karl Pedersen and Robert L. SkovFor further information: Yvonne Agersø([email protected])
Figure 1. Occurrence (%) of MRSA in meat, Denmark20
DANMAP 2010
15% isolates
10
5
0200920102009201020092010200920102009201020092010
DanishPorkCC398
Import
DanishBeef
Import
DanishBroiler meatCC45CC9
Import
CC5
CC7
CC1
New spa type
ND
104
DANMAP 2010
Textbox 10
RESISTANCE IN HUMAN CLINICAL BACTERIA
8.
Detection of a newmecAhomologue in methicillin resistantS. aureusfrom human sampleswith a possible link to cattleMethicillin resistance inStaphylococcus aureus(MRSA) is encoded by themecAgene located on a mobileelement called Staphylococcal Cassette Chromosome (SCC). Detection of themecAgene is therefore “the goldenstandard” for MRSA confirmation. A newmecAhomologue was however recently discovered by a group inCambridge headed by Professor Mark Holmes. It was designatedmecAlga251,according to the strain Lga251 inwhich it was found. The Lga251 isolate originated from bulk milk and a second milk isolate carrying mecAlga251was also found. Another 13 isolates withmecAlga251werefound in a collection of 940 bovine isolates and asubsequent survey in humans revealed the first identified human isolates in England.Except for betalactams, themecAlga251containing isolates are in general susceptible to other antimicrobials(gentamicin, neomycin, ciprofloxacin, tetracycline, erythromycin, clindamycin, fusidic acid, rifampicin andteicoplanin). ThemecAlga251gene is located in a novel Staphylococcal Cassette Chromosome designatedSCCmec XI and shares only 60% nucleotide homology with the conventionalmecAgene. The low homologymeans that the isolates have been unrecognised by published MRSA PCRs and genotypic detection systemsGeneOhm™ StaphSR (Becton Dickinson), GeneXpert™ MRSA (Cepheid) and NucliSENS EasyQ MRSA(bioMérieux) [Oliveiraet al.2002. Antimicrob Agents Chemother. 46: 2155–61; Kondoet al.2007. AntimicrobAgents Chemother. 51: 264–74]. Likewise, the latex agglutination assays directed against PBP2a fail to detect theprotein encoded bymecAlga251.In Denmark, we became aware of the new gene in January 2011 after searching the isolate collections at SSIto identify isolates carrying the gene. The search included isolates being phenotypically resistant to cefoxitinbutmecAnegative from the years 2004 through 2010 (n = 149). Among these strains previously determined asborderline resistant (BORSA) or modified resistant (MODSA), we found 67 isolates to carry themecAlga251gene. Furthermore, searching our bacteremia database (including data collected since 1958 on more than 40,000isolates) revealed a curiosum: amecAlga251positive strain dating back to 1975.The geographic distribution of the isolates is shown in Table 1. Five persons were detected in the sameDepartment of Clinical Microbiology (Slagelse) in 2010 and person to person transmission seems very likely.Isolates in whichmecAlga251have been found belong to four genetic lineages within clonal complex 130:spatype t847 being the predominant. CC130 isolates have not been found in humans before but have previously beenassociated with bovine samples [Sunget al.2008. Microbiology. 154: 1949–59]. We have not obtained any clinicalinformation indicating that the affected Danish patients have had any contact to cattle.Future studies should be addressed to elucidate the possible link between cattle and humans of this newmecAanalogue, since so far no isolates from Danish cows have been detected.Anders Rhod Larsen and Robert SkovFor further information: Anders Rhod Larsen ([email protected])Table 1.mecAlga251cases per Department of Clinical Microbiology, DenmarkDANMAP 2010
Department of ClinicalMicrobiologySlagelseAalborgVejleSønderborgHerlevNæstvedÅrhusHerningHillerødViborgEsbjergOdenseSSIHvidovreNykøbing F.Denmark total
20043
20051221
2006222212
200713
200811
20091112
20105231
Total1210863553432221167DANMAP 2010105
2
1
1
1
121
1
11
1
332
11265
1
1
6
10
7
121
9
RESISTANCE IN DIAGNOSTIC SUBMISSIONS FROM ANIMALS
106
DANMAP 2010
RESISTANCE IN DIAGNOSTIC SUBMISSIONS FROM ANIMALS
9.
Resistance in diagnostic submissions from animalsThe DANMAP programme monitors antimicrobialresistance inEscherichia coliO149 from diagnosticsubmissions from pigs, andE. coliF5 (K99) fromdiagnostic submissions from cattle.E. coliwas isolatedfrom faecal samples, typically from pigs or calveswith diarrhoea. The number of isolates available atthe National Veterinary Institute has been decreasingannually due to outsourcing of the diagnostic tasks. In2010, 33E. coli(O149) were isolated from pigs and thedistribution of MICs and occurrence of resistance inE.coliO149 from pigs is presented in Appendix 1(TableAP1.24).In 2010, only 14 cattle isolates ofE. coliF5 (K99)were available and therefore these were not reported.Staphylococcus hyicushas not been reported since 2008due to low number of available isolates.9.1Escherichiacoli from pigsTrends in resistance to selected antimicrobial agents inE. coliO149 isolates from pigs are presented in Figure9.1. The isolates were mainly from weaning pigs withdiarrhoea (>7.5 to 30 kg). Most isolates from diagnosticsubmissions originated from animals in antimicrobialtherapy or with a history of recent antimicrobialtherapy. For this reason, a higher frequency ofresistance is expected in bacteria from diagnosticsubmissions compared to bacteria originating fromhealthy animals sampled at slaughter. In 2010, only oneisolate (3%) was fully susceptible.As in previous years, high levels of resistance (70%–80%) were found to tetracycline, sulfonamide andstreptomycin. Sulfonamide and streptomycin are notused for weaning pig diarrhoea, and the consumptionin weaning pigs has been stable at a low level (Figure4.3); however, the resistance to these agents may be co-selected with tetracycline resistance, as tetracyclines arethe most commonly used antimicrobials for weaningpigs (Figure 4.4).In 2010, the only significant increase was seen forciprofloxacin and nalidixic acid resistance, with24% resistance to ciprofloxacin in 2010; all but twoisolates (i.e. 6/8 isolates) were also resistant to thecommonly used antimicrobials, tetracyclines andextended spectrum penicillins. The consumption offluoroquinolones has been at a very low level in the pigproduction since 2003, but the resistance persists due toco-selection.In 2010, oneE. coliO149 isolate was resistant tocefotaxime and ceftiofur.Vibeke Frøkjær Jensen and Lars Stehr Larsen
Figure 9.1. Resistance (%) inEscherichia coliO149 from diagnostic submissions from pigs, DenmarkDANMAP 2010908070605040302010001Ampicillin020304Streptomycin0506Sulfonamide0708Tetracycline0910Ciprofloxacin
% resistant isolates
Gentamicin
DANMAP 2010
107
1
APPENDIX
108
DANMAP 2010
APPENDIX
1.
Figure AP1.1. Consumption of antimicrobial agents and growth promoters in animal production andprescribed antibacterials in humans, Denmark220200180Antimicrobial (tonnes)160140120100806040200199019911992199319941995199619971998199920002001200220032004200520062007200820092010
DANMAP 2010Antimicrobial growth promotersPrescribed veterinary antimicrobialsPrescribed human antibacterials
Sources: Human therapeutics: The Danish Medicines Agency. Veterinary consumption: 1990–2000, data based on reports from thepharmaceutical industry of total annual sales. (Data 1990–1994: Use of antibiotics in the pig production. Federation of Danish pig producersand slaughterhouses. N. E. Rønn (Ed.). 1996–2000: Danish Medicines Agency and Danish Plant Directorate). 2001–2009: Data from VetStat.
Table AP1.0. Estimated total consumption (kg active compound) of prescribed antimicrobials for productionanimals 1990–2000, DenmarkDANMAP 2010
ATCvetgroup(a)QJ01AAQJ01CEQJ01C/QJ01DQJ01EWQJ01EQQJ01FQJ01G/QA07AATotal
Therapeutic groupTetracyclinesPenicillins, b-lactamasesensitiveOther penicillins,cephalosporinsSulfonamides + trimethoprimSulfonamidesMacrolides, lincosamides,pleuromutilinsAminoglycosides, colistinOthers(b)
199093005000120038008700109007700670053300
1992220006700250079005900129008500680073200
1994365009400440095005600114008600440089800
19959000880045006300180095007600210049600
19961290072005800480021007600710060048100
199713700112006100690014006600610065052800
199812100143006700770010007100780065057350
199916200147006600680010008700750035061900
20002400015100730070001000156001040030080700
Data based on reports from the pharmaceutical industry of total annual sales. 1990–1994: Data on use of antibiotics in the pigproduction. Federation of Danish pig producers and slaughterhouses. N. E. Rønn (Ed.). 1996–2000: Danish Medicines Agency. Onlyveterinary drugs are included. Veterinary drugs almost exclusively used in pets (tablets, capsules, ointment, eye/ear drops) are excludeda) Only the major contributing ATCvet groups are mentioned. Kg active compound rounded to nearest 50 for antimicrobial classes and100 for totalsb) Consumption in aquaculture was only partially included before 2001
DANMAP 2010
109
1.
APPENDIXTable AP1.1. Consumption of antimicrobial agents(a)for systemic use in pigs given as Animal DailyDANMAP 2010Doses (ADDs)(b), DenmarkAminoglycosidesQA07AA(local GI)QA07AA10Fluoroquinolones QJ01MAQJ01DCQJ01DDQJ01AAQJ01CAQJ01CRQJ01XXPleuromutilin’sTotalQJ01RAPenicillinstreptomycincombinationsQJ01BAQJ01CEQJ01FAMacrolidesQJ01FFLincosamides /spectinomycin(e)ATCvetcodeQJ01ESulfonamidestrimethoprim
Cephalosporin(d)
Amphenicols
Tetracyclines
Amino-penicillins(c)
Therapeuticgroup
Penicillin’s,b-lactamasesensitive
Sows/piglets (1000’s ADD200)104601574719388037634282911935975336886107201793894609657645552522651643498757411048203999399111669056823435237039538567113592256108011312697195802153536691027911010921023441059132136672456716735466184590061232923711056149143478054215235764795593681697102589118424415681315615101476662130011338166011264711953001635124255838570631184211814176431286514042192033135553548850685172612751162045279614621142092132044755920694128712023Weaner pigs (1000’s ADD15)200136163022497158603446 48410 13187 2732475531193315230 1557662002314764255283081473987 44195 16575 23752 3172 188215218255 154763200332349 1123015106542544185 39308 18691 22032 437717221119779 156984200439194 1414144138992635516 49768 21189 21288 45318307524984 188001200545858964258121152676192 48252 18269 19633 39945358826747 189272200656166484050100172914698 46666 15881 19464 421211351325496 19051420077670190447299144074192 54522 16203 10586 52990343922655 208481200883718 256414497304004559 51676 16597 285767270344530834 214943200998866 1494618119023584668 59205 17823 298168620378239241 250456201091435 1224775113611813939 56090 16636 216973490401841232 239305Finisher pigs (1000’s ADD50)200192230414915051617310840 31312621129296704736773200289360463017563620611027 3693220226935175683851520031149230524919955617711605 423319228642385224400820041268943650228356023711599 444712422438010371 4931320051407435748826746224712033 422323620236812121 5358220061623133770222755015910316 352421327129710846 5167320071932020791721555417210362 319410920022688065235420081882420754415475315210006 2637543015812993 5398320092000016819516513912011823 27371330012915194 5994820101958110899116712211211942 26953832021016353 61657Age group not given (1000’s ADD50)200111370556424926814715455840891398066030200280024442967202929330209222082630397520037685491305921095137614939098676407720049157557289915411254191702936998647312005874456327610184841324853208572940072006116825103151117775527914434069722418720076751254101118436918648270263952177200839811479495623590835082871368200923301107810432055622401018795820108313534312114353701085423a) Data includes sales from pharmacies and feed mills. Consumption in veterinary practice comprises less than 1% of the totalconsumption in pigs and are not included, except for the use of fluoroquinolones. Local intrauterine and intramammary use is notincluded, and comprised less than 0.1‰ of the ADDs used in sows. Topical treatment is not includedb) Animal Standard weight is an assumed average weight at treatment, used to calculate numbe of ADD (Animal Daily Doses giving anestimated number of animals treated) from number of ADDkg (mass of animal treated, measured in kg animal bodyweight)c) Includes a small proportion (< 1‰) of combinations with aminopenicillin and clavulanic acidd) 3rd and 4th generation cephalosporinse) Lincosamides and combnations between spectinomycin and lincosamides110
Year2001200220032004200520062007200820092010
DANMAP 2010
Colistin(local GI)
APPENDIXTable AP1.2. Consumption of antimicrobial agents(a)for systemic use in cattle given as Animal DailyDoses (ADDs)(b), DenmarkDANMAP 2010QA07AA10QA07AAFluoroquinolones QJ01MAQJ01DCQJ01DDQJ01AAQJ01CAQJ01CRQJ01RAQJ01BAQJ01CEQJ01FAQJ01FFATCvetcode
1.
Sulfonamides andQJ01Etrimethoprim
Cephalosporin(d)
Aminoglycosides(local GI)
Lincosamides /spectinomycin(e)
Amphenicols
Tetracyclines
Amino-penicillins(c)
Therapeuticgroup
Penicillin’s,b-lactamasesensitive
Penicillinstreptomycincombinations222228343642142136131113117120234455122000
Macrolides
Colistin(local GI)
Year200520062007200820092010200520062007200820092010200520062007200820092010200520062007200820092010
18619323525727926957453456152855661518192426262572116211
111121616796129150180001111010000
5857688084791931451311051021235365554135100
49049861070280483517018018316817316627263336373751413334
Cows and bulls (1000’s ADD600)716511221964611162979739122857565117373531270733802Calves (1000’s ADD100)33162562191273014187913108371548811692301338041377221667689952019347512100Heifers and steer (1000’s ADD300)3381033900431020439203361034500age group unknown (1000’s ADD600)12612243165221321102000010001100
0000003978111015000000010000
000000211000000000000000
1027102111891302140714102083224222902111216720186767869088862999571067
a) Data includes sales from pharmacies and use for cattle in veterinary practice, including sales to the farmer. The consumption incalves is underestimated by up to 5% and consumption in cows is underestimated by up to 17% in individual years, because the usein cattle practice was underestimated by up to 20%. This error was decreasing with time (10% underestimation in 2010). Therefore, thenumbers not fully representatrends over years, but reflects the choice of drug in individual years.b) Animal Standard weight is an assumed average weight at treatment, used to calculate numbe of ADD (Animal Daily Doses giving anestimated number of animals treated) from number of ADDkg (mass of animal treated, measured in kg animal bodyweight)c) Includes a small proportion (< 1‰) of combinations with aminopenicillin and clavulanic acidd) 3rd and 4th generation cephalosporinse) Lincomycin and lincomycin/spectinomycin combinations
DANMAP 2010
Total
111
1.
APPENDIXTable AP1.3. Consumption of antimicrobial agents for systemic use in poultry given as Animal DailyDoses (ADDkg)(a), DenmarkQJ01E /QP51AG
DANMAP 2010
QA07 /QJ01
QA07AA
QJ01MA
QJ01CA
QJ01CE
QJ01FA
ATCvetcode
QJ01A
QJ01X
2001200220032004200520062007200820092010200120022003200420052006200720082009201020012002200320042005200620072008200920102001200220032004200520062007200820092010
00010000000000000000000000000000000200150100518000
36070116320042952005469088000004002067226719285540282801271313300006015016545767117716119
27773352305246173984335617184086698813543139220251361646433486238265969137738282543467035081968037611502563147514881047726829109004873896315193678810384563300
Broilers (1000’s ADDkg)090162501306906800080270084344650752258366106400620001682891300083133200439755602060115813552200Rearing for broiler production (1000’s ADDkg)030023000960660000080000049000004000015011400432219000100322002851802894400719443300(d)Layers and layer rearing (1000’s ADDkg)01961650130171010000328000221563004243003014011000960000100000015200081710275Turkeys (1000’s ADDkg)000900000000580360456807616156000680780004501160027802547243000481119004910253800086192200
00046100636808020000000010290000023030015070488395000000728531536253
31814101339956994860402923414830134222084616522869144169543748636729147745137545888727122612181303967555139627452693246910567268291588567251002016648149418340198998680
192190181181180163178186181187
---- Included- in broiler- productionabove---
6970697269676768616213.212.811.219.617.411.314.412.311.114.0
112
DANMAP 2010
ADDkgper kg meat produced0.030.040.030.070.050.060.030.070.150.140.010.020.020.020.010.010.020.040.040.040.802.101.420.340.581.471.040.681.790.62
Therapeutic group
Fluoroquinolones
Aminoglycosides
Sulfonamides(b)
Pleuromutilins
Tetracyclines
Penicillins,b-lactamasesensitive
Amoxicillin
Macrolides
Million kgmeat oreggs(d)
Others(c)
Total
APPENDIXTable AP1.3 (Continued). Consumption of antimicrobial agents for systemic use in poultry given asAnimal Daily Doses (ADDkg)(a), DenmarkQJ01E /QP51AG
1.
DANMAP 2010
QA07 /QJ01
QA07AA
QJ01MA
QJ01CA
QJ01CE
QJ01FA
ATCvetcode
QJ01A
QJ01X
115030674.50.0130000774.90.0200002654.20.0611150305914.20.14140305424.10.13000011254.50.2500021022.40.0400002872.60.112000002342.20.1100009172.00.45Game birds(1000’s ADDkg)20010777680205146855841370--2002125177146603462891010942518--20031501289230318273193302725--200425014810030460113301802022--20051609819390403177013142803--2006110861863025839115422413--20072126142505423700732203--2008110801825025639110382360--2009027090118664461001722080--201032671083014434410251613036--(e)Production type unknown(1000’s ADDkg)200111553814044130647510185219--200229952909031527293503718--20033009123700348186391503690--20044501063654044090131344878--20050582978019231215463403--200650144305901824110003549--20070140132172518118348582267--20080374863026314833391692--20092794486018222115561557--20100142970851112314363--a) ADDkg is the dose necessary for treating 1 kg body-weightb) Includes sulfaclozin (a coccidiostat/antibacterial) and sulfonamide/trimethoprim combinationsc) Includes QA07AA10 (colistin), QJ01FF (lincosamides, including combinations with spectinomycin), QJ01B (amphenicols) andQJ01R (penicillin/streptomycin combinations)d) For layers and layer rearing, only the production of eggs for consumption is included (not the slaughter/export of hens)e) Includes prescription with erraneous farm id or farms with more than one poultry species; for 2009–2010 this was mainly pigeonsand game birds.2001200220032004200520062007200820092010000000000021281400036249140362574005251125100250000000000000100130001103
Ducks and geese(1000’s ADDkg)
DANMAP 2010
ADDkgper kg meat produced113
Therapeutic group
Fluoroquinolones
Aminoglycosides
Sulfonamides(b)
Pleuromutilins
Tetracyclines
Penicillins,b-lactamasesensitive
Amoxicillin
Macrolides
Million kgmeat oreggs(d)
Others(c)
Total
1.
APPENDIX
Table AP1.4. Consumption of antibacterial agents for systemic use in primary health care (No.packages/1000 inhabitants/year), DenmarkDANMAP 2010
ATCgroup(a)J01AAJ01CAJ01CEJ01CF
Therapeutic group
TetracyclinesPenicillins with extended spectrumBeta-lactamase sensitive penicillinsBeta-lactamase resistant penicillinsCombinations of penicillins,J01CR1.21.72.0including beta-lactamase inhibitorsCephalosporins and relatedJ01D1.31.41.3substancesJ01EATrimethoprim and derivatives8.28.89.3J01EBShort-acting sulfonamides47.8 47.6 47.9Combinations of sulfonamides andJ01EE1.41.31.0trimethoprim, including derivativesJ01FAMacrolides102.2 102.8 99.8J01FFLincosamides0.50.60.6J01GBAminoglycosides0.10.20.1J01MA Fluoroquinolones10.6 11.0 13.8J01XAGlycopeptides0.10.10.1J01XBPolymyxins2.12.02.0J01XCSteroid antibacterials (fusidic acid)0.80.80.7Nitrofuran derivativesJ01XE10.4 11.1 11.3(nitrofurantoin)J01XX05 Methenamine3.23.22.6J01XX08 Linezolid0.00.00.0Antibacterial agents for systemic useJ01604.4 618.0 622.3(total)
200122.4110.9251.030.1
200221.7111.8254.437.5
200321.6111.5254.541.9
200422.5115.3253.743.02.51.410.248.30.0
Year2005 200623.8 23.9119.9 119.7251.1 243.344.4 44.03.01.610.647.50.04.01.710.745.80.0
200724.5131.3253.045.85.81.811.541.00.0
200825.0130.0235.945.48.02.112.436.00.0
200925.9130.2223.245.212.32.110.934.60.0
201027.2140.2228.245.918.02.111.334.30.0
102.7 110.3 101.8 108.6 103.3 99.6 110.50.71.11.41.62.02.52.80.10.10.10.10.10.10.116.2 18.3 19.4 22.9 25.1 25.0 27.40.10.20.20.20.20.20.42.12.01.50.80.80.90.90.60.70.70.70.80.70.711.72.40.012.32.30.012.52.00.011.91.90.012.22.00.012.61.90.012.41.90.0
633.6 649.3 632.6 663.5 641.2 628.0 664.4
a) From the 2010 edition of the Anatomical Therapeutic Chemical (ATC) classification system
114
DANMAP 2010
APPENDIX
1.
Table AP1.5. Consumption of antibacterial agents for systemic use in primary health care (No. treatedpatients/1000 inhabitants/year), DenmarkDANMAP 2010
ATCgroup(a)J01AAJ01CAJ01CEJ01CFJ01CRJ01DJ01EAJ01EBJ01EEJ01FAJ01FFJ01GBJ01MAJ01XAJ01XBJ01XCJ01XEJ01XX05J01XX08J01(b)
Therapeutic group
2001Tetracyclines11.8Penicillins with extended spectrum 69.4Beta-lactamase sensitive penicillins 173.3Beta-lactamase resistant penicillins 19.2Combinations of penicillins,0.7including beta-lactamase inhibitorsCephalosporins and related0.4substancesTrimethoprim and derivatives4.2Short-acting sulfonamides33.2Combinations of sulfonamides and0.8trimethoprim, including derivativesMacrolides67.7Lincosamides0.2Aminoglycosides0.0Fluoroquinolones7.5Glycopeptides0.0Polymyxins0.0Steroid antibacterials (fusidic acid)0.5Nitrofuran derivatives5.7(nitrofurantoin)Methenamine0.5Linezolid-Antibacterial agents for systemic300.6use (total)
200211.569.2173.423.91.00.44.533.00.766.90.30.07.70.00.00.46.10.60.0
200311.468.8172.626.41.10.44.633.10.664.10.30.08.90.00.00.36.20.50.0
200411.670.6171.227.11.30.55.033.30.065.90.40.010.80.00.00.36.40.50.0
Year2005 200612.0 12.373.0 75.8170.2 171.327.8 29.41.50.55.432.70.070.70.40.012.20.00.00.36.70.50.02.30.55.633.00.067.00.50.013.10.00.00.47.00.40.0
200712.582.1177.129.73.60.55.929.70.071.40.60.015.20.00.00.36.50.40.0
200812.781.3164.429.95.00.55.926.30.066.90.80.017.10.00.00.36.80.40.0
200913.081.1158.829.98.00.55.825.40.064.51.00.016.90.00.00.37.00.40.0
201013.485.1162.930.011.70.56.025.00.072.71.30.018.50.00.00.36.90.40.0
301.5 301.4 302.6 308.0 310.3 320.4 308.2 303.1 315.5
a) From the 2010 edition of the Anatomical Therapeutic Chemical (ATC) classification systemb) Total no. of patients treated with an antibiotic is lower than the sum of all antibiotic classes. This is because the Danish MedicinesAgency only counts the first treatment for each patient, each year
DANMAP 2010
115
1.
APPENDIXTable AP1.6. Number of DDDs and packages per treated patient in primary health care, Denmark
DANMAP 2010
ATCTherapeutic groupgroup(a)
Indicator
Year200130.616.11.913.08.11.610.37.11.412.47.91.615.99.11.725.58.43.030.415.62.04.02.71.419.410.41.911.37.51.515.27.32.1200233.017.51.913.28.21.610.57.21.511.87.51.614.78.61.724.97.83.229.314.92.04.02.71.415.68.41.911.77.61.511.16.11.8121.718.36.78.66.01.4243.33.766.78.74.61.924.513.51.8225.638.85.816.07.82.0200334.418.11.913.48.21.610.77.31.511.87.41.616.69.11.818.35.63.330.014.92.04.02.71.418.3111.6712.17.81.611.16.11.8121.736.53.310.36.61.6243.33.766.711.15.22.124.813.61.8220.444.94.916.47.92.1200436.919.01.913.68.41.611.17.51.512.47.81.617.29.12.018.66.13.029.914.82.03.92.71.5---12.47.91.613.97.61.8156.547.03.39.56.41.5192.33.752.514.47.22.024.313.31.8221.645.24.917.08.12.1200539.019.62.013.98.51.611.37.71.512.78.01.616.89.32.021.76.23.530.215.32.03.92.71.5---12.48.01.613.44.92.8172.251.73.39.66.51.5196.73.950.016.07.62.124.313.31.8222.944.6517.58.32.1200640.921.01.914.28.91.611.58.01.413.08.61.519.310.71.820.75.83.530.615.91.93.92.81.4---12.68.31.513.84.82.9135.627.15.010.36.91.5205.65.537.515.17.62.024.113.51.8233.149.04.817.98.72.0200743.022.02.014.49.01.611.78.21.413.48.71.519.111.71.621.96.13.630.515.71.93.92.81.4---12.48.11.513.34.92.7128.026.04.910.67.01.5219.310.021.917.18.02.126.314.41.8237.550.14.717.38.91.9200844.422.72.014.79.21.611.88.21.413.79.01.519.912.41.623.85.84.130.214.52.13.82.81.4---12.58.11.512.85.02.5152.732.24.911.07.51.5202.810.020.318.57.32.525.414.21.8239.950.04.818.99.12.1200945.222.72.014.89.21.611.88.41.413.99.11.520.413.31.522.75.74.030.716.11.93.82.81.4---12.58.11.512.65.02.5157.637.84.211.27.61.5202.810.020.318.76.82.825.414.11.8227.250.04.519.29.32.1201045.922.72.014.99.01.611.88.41.414.29.31.521.113.71.524.75.84.330.716.41.93.82.81.4---12.28.11.511.45.22.2151.543.43.511.27.61.5199.410.019.918.87.72.426.815.01.8234.150.04.719.69.32.1
DDDs / patientDDDs / packageJ01AA TetracyclinesPackages / patientDDDs / patientPenicillins with extendedJ01CADDDs / packagespectrumPackages / patientDDDs / patientBeta-lactamase sensitiveJ01CEDDDs / packagepenicillinsPackages / patientDDDs / patientBeta-lactamase resistantJ01CFDDDs / packagepenicillinsPackages / patientDDDs / patientCombinations of penicillins,J01CRDDDs / packageincl. beta-lactamase inhibitorsPackages / patientDDDs / patientCephalosporins and relatedJ01DDDDs / packagesubstancesPackages / patientDDDs / patientJ01EA Trimethoprim and derivatives DDDs / packagePackages / patientDDDs / patientJ01EB Short-acting sulfonamidesDDDs / packagePackages / patientCombinations of sulfonamides DDDs / patientJ01EE and trimethoprim. incl.DDDs / packagederivativesPackages / patientDDDs / patientJ01FA MacrolidesDDDs / packagePackages / patientDDDs / patientJ01FF LincosamidesDDDs / packagePackages / patientDDDs / patientJ01GB AminoglycosidesDDDs / packagePackages / patientDDDs / patientJ01MA FluoroquinolonesDDDs / packagePackages / patientDDDs / patientJ01XB PolymyxinsDDDs / packagePackages / patientDDDs / patientSteroid antibacterialsDDDs / packageJ01XC(fusidic acid)Packages / patientDDDs / patientNitrofuran derivativesJ01XEDDDs / package(nitrofurantoin)Packages / patientDDDs / patientJ01XX05 MethenamineDDDs / packagePackages / patientDDDs / patientAntibacterial agents forDDDs / packageJ01systemic use (total)Packages / patient
8.35.91.41833.552.57.64.61.724.813.71.8227.337.66.015.67.82.0
a) From the 2010 edition of the Anatomical Therapeutic Chemical (ATC) classification system116
DANMAP 2010
APPENDIXTable AP1.7. Activity at somatic hospitals, DenmarkDANMAP 2010(a)
1.
RegionThe Capital Region of DenmarkThe Sealand RegionRegion of Southern DenmarkCentral Denmark RegionNorth Denmark RegionDenmark(b)
No. bed-days somatic hospitals15146655913648395538696364546644269882
No. admissions somatic hospitals(a)4500772104132583162781951176611314662
Source: The National Board of Health (www.sst.dk)a) Excluding private hospitals, psychiatric hospitals, specialized clinics, rehabilitation centres and hospicesb) Compared to the previous year no. bed-days have decreased by 3.4% and no. admissions have increased by 4.0%
Table AP1.8. Consumption of antibacterial agents for systemic use in hospital care (DDD/1000 inhabitant-days), DenmarkDANMAP 2010
ATCgroup(a)J01AAJ01CAJ01CEJ01CFJ01CRJ01DBJ01DCJ01DDJ01DFJ01DHJ01EAJ01EBJ01EEJ01FAJ01FFJ01GBJ01MAJ01XAJ01XBJ01XCJ01XDJ01XEJ01XXJ01
Therapeutic groupTetracyclinesPenicillins with extendedspectrumBeta-lactamase sensitivepenicillinsBeta-lactamase resistantpenicillinsCombinations of penicillins,incl. beta-lactamase inhibitorsFirst-generationcephalosporinsSecond-generationcephalosporinsThird-generationcephalosporinsMonobactamsCarbapenemsTrimethoprim and derivativesShort-acting sulfonamidesCombinations ofsulfonamides andtrimethoprim, incl. derivativesMacrolidesLincosamidesAminoglycosidesFluoroquinolonesGlycopeptidesPolymyxinsSteroid antibacterials(fusidic acid)Imidazol derivativesNitrofuran derivatives(nitrofurantoin)Other antibacterialsAntibacterial agents forsystemic use (total)
20010.010.340.320.180.010.000.150.020.000.010.010.040.040.100.010.050.080.010.000.010.060.010.001.45
20020.010.330.330.180.010.000.170.020.000.020.010.040.040.090.010.050.100.010.000.010.060.010.011.51
20030.010.330.340.180.010.000.170.020.000.020.010.030.040.090.010.050.110.010.000.010.060.010.001.51
20040.010.320.330.190.020.000.190.020.000.020.010.030.050.080.010.050.130.010.000.010.070.010.001.56
Year2005 20060.01 0.010.350.330.180.030.000.220.020.000.030.010.030.050.080.010.050.160.010.000.010.070.010.011.670.350.290.180.050.000.230.020.000.030.010.020.050.080.010.050.180.010.000.010.070.010.011.70
20070.020.350.280.180.080.000.310.030.000.050.010.010.040.080.010.050.210.020.000.010.070.010.011.81
20080.020.350.250.170.100.000.330.030.000.070.010.010.050.080.010.040.240.020.000.010.060.010.011.87
20090.030.350.230.170.130.000.370.030.000.070.010.010.050.080.010.040.240.020.000.010.050.010.011.91
20100.030.320.210.170.150.000.350.030.000.080.010.010.060.080.010.040.220.020.000.010.080.010.011.91
a) From the 2010 edition of the Anatomical Therapeutic Chemical (ATC) classification system
DANMAP 2010
117
1.
118DANMAP 2010
Table AP1.9. Distribution of MICs and resistance (%) inSalmonellaTyphimurium from cattle (n=18) and pigs (n=455), Denmark
AntimicrobialagentDistribution (%) of MICs0.015 0.03 0.06 0.125 0.25 0.51816
Animalspecies
%Resistant
APPENDIX
DANMAP 201094.493.40.410091.68.444.446.85.66.22433.3 5.649.7 2.961.10.2 62.477.80.7 80.927.8 11.1 5.639.3 10.3 1.155.6 44.449.5 44.2 6.433.327.0 1.516.710.3 2.232 64 128 256 512 1024 2048 >20485.6 55.64.4 43.15.60.4 1.5 6.85.64.2 0.4 1.355.649.25.6 27.8 11.19.5 34.1 4.0 0.71.12.61.338.9 61.152.5 43.5 2.2 0.20.488.9 11.192.7 4.2 0.2 0.277.8 22.279.8 18.5 0.40.255.65.5 46.455.653.24.288.9 11.187.7 7.910099.6 0.488.9 11.183.5 14.9 1.555.6 38.90.4 56.7 27.0 0.45.62.0 13.4
Tetracycline
CattlePigsChloramphenicol CattlePigsFlorfenicolCattlePigsAmpicillinCattlePigsCeftiofurCattlePigsCefotaximeCattlePigsTrimethoprimCattlePigsSulfonamideCattlePigsStreptomycinCattlePigsGentamicinCattlePigsNeomycinCattlePigsApramycinCattlePigsCiprofloxacinCattlePigsNalidixic acidCattlePigsColistinCattlePigsSpectinomycinCattlePigs
61.147.55.68.85.65.955.649.2000008.455.653.266.756.501.803.101.300.200005.615.8
95%Confidenceinterval[35.7-82.7][42.8-52.2][0.1-27.3][6.4-11.8][0.1-27.3][3.9-8.5][30.8-78.5][44.5-53.9][0-18.5][0-0.8][0-18.5][0-0.8][0-18.5][6.0-11.3][30.8-78.5][48.5-57.8][41.0-86.7][51.8-61.1][0-18.5][0.8-3.4][0-18.5][1.7-5.1][0-18.5][0.5-2.8][0-18.5][0.01-1.2][0-18.5][0-0.8][0-18.5][0-0.8][0.1-27.3][12.6-19.5]
Vertical solid lines indicate EUCAST epidemiological cut-off values except for apramycin, spectinomycin and sulfonamide where the cut-off values were set by DANMAP. EUCAST/CLSI clinicalbreakpoints indicated as vertical dotted lines if different from the corresponding epidemiological cut-off values. See table AP2.2 for further detailsWhite fields represent the range of dilutions tested. MIC values equal to or lower than the lowest concentration tested are presented as the lowest concentration. MIC values greater than the highestconcentration in the range are presented as one dilution step above the range
Table AP1.10. Distribution of MICs and resistance (%) inSalmonellaTyphimurium from imported broiler meat (n=18), imported turkey meat (n=41) andpork (Danish n=26; imported n=62), DenmarkDistribution (%) of MICs0.015 0.03 0.06 0.125 0.2594.473.122.65.624.426.932.32.41.69.83.88.19.79.83.89.726.83.816.15.612.2 87.83.8 23.16.5 71.00.51248163264128256512 1024 2048 >2048
DANMAP 2010
Antimicrobialagent
Food type
Origin
%Resistant
Tetracycline
Broiler meatTurkey meatPork
Chloramphenicol Broiler meatTurkey meatPork
Florfenicol
Broiler meatTurkey meatPork
Ampicillin
Broiler meatTurkey meatPork61.146.342.343.5
94.463.469.246.810063.492.374.211.168.334.672.62.41.6
Ceftiofur
Broiler meatTurkey meatPork94.487.892.391.91.65.69.87.76.5
Cefotaxime
83.3 5.67.3 24.446.2 19.222.6 4.838.929.3 22.057.748.4 8.12.4
Broiler meatTurkey meatPork
Trimethoprim
Broiler meatTurkey meatPork
Sulfonamide
Broiler meatTurkey meatPork
10073.210082.3
26.817.788.97.361.516.111.192.738.583.911.1 61.1 16.711.17.3 2.4 14.6 12.2 63.419.2 34.6 7.73.8 34.612.9 14.5 1.6 8.1 62.9
APPENDIX
DANMAP 2010
Streptomycin
Broiler meatTurkey meatPork
ImportedImportedDanishImportedImportedImportedDanishImportedImportedImportedDanishImportedImportedImportedDanishImportedImportedImportedDanishImportedImportedImportedDanishImportedImportedImportedDanishImportedImportedImportedDanishImportedImportedImportedDanishImported
5.610026.977.409.83.821.009.83.89.711.168.334.672.602.40002.400026.8017.711.192.738.583.927.892.746.287.1
95%Confidenceinterval[0.1-27.3][91.4-100.0][11.6-47.8][65.0-87.1][0-18.5][2.7-23.1][0.1-19.6][11.7-33.2][0-18.5][2.7-23.1][0.1-19.6][3.6-19.9][1.4-34.7][51.9-81.9][17.2-55.7][59.8-83.1][0-18.5][0.06-12.9][0-13.2][0-5.8][0-18.5][0.06-12.9][0-13.2][0-5.8][0-18.5][14.2-42.9][0-13.2][9.2-29.5][1.4-34.7][80.1-98.5][20.2-59.4][72.3-92.0][9.7-53.5][80.1-98.5][26.6-66.6][76.1-94.3]
1.
119
1.
120
APPENDIX
DANMAP 2010DANMAP 2010
Table AP1.10 (Continued). Distribution of MICs and resistance (%) inSalmonellaTyphimurium from imported broiler meat (n=18), imported turkey meat(n=41) and pork (Danish n=26; imported n=62), DenmarkDistribution (%) of MICs0.015 0.03 0.06 0.125 0.2555.617.157.766.126.824.43.224.422.219.526.916.10.51248163264128256
Antimicrobialagent
Food type
Origin
%Resistant
512 1024 2048 >2048
Gentamicin
Broiler meatTurkey meatPork
Neomycin
Broiler meatTurkey meatPork
Apramycin
Broiler meatTurkey meatPork5.62.41.694.468.3 29.310091.9 6.594.4 5.665.9 29.384.6 15.475.8 22.62.43.2
Ciprofloxacin
Broiler meatTurkey meatPork
33.3 11.153.7 2.438.5 3.833.994.4 5.663.4 12.296.2 3.891.9 4.877.856.173.183.9
Nalidixic acid
Broiler meatTurkey meatPork10097.610096.8
2.41.6
2.4
Colistin
Broiler meatTurkey meatPork
Spectinomycin
Broiler meatTurkey meatPork
ImportedImportedDanishImportedImportedImportedDanishImportedImportedImportedDanishImportedImportedImportedDanishImportedImportedImportedDanishImportedImportedImportedDanishImportedImportedImportedDanishImported77.841.573.143.522.219.519.232.32.43.236.67.721.0
026.800024.403.2024.40002.40002.40002.400039.07.724.2
95%Confidenceinterval[0-18.5][14.2-42.9][0-13.2][0-5.8][0-18.5][12.4-40.3][0-13.2][0.4-11.2][0-18.5][12.4-40.3][0-13.2][0-5.8][0-18.5][0.06-12.9][0-13.2][0-5.8][0-18.5][0.06-12.9][0-13.2][0-5.8][0-18.5][0.06-12.9][0-13.2][0-5.8][0-18.5][24.2-55.5][0.9-25.1][14.2-36.7]
Vertical solid lines indicate EUCAST epidemiological cut-off values except for apramycin and sulfonamide where the cut-off values were set by DANMAP. EUCAST/CLSI clinical breakpointsindicated as vertical dotted lines if different from the corresponding epidemiological cut-off values. See table AP2.2 for further detailsWhite fields represent the range of dilutions tested. MIC values equal to or lower than the lowest concentration tested are presented as the lowest concentration. MIC values greater than thehighest concentration in the range are presented as one dilution step above the range.
Table AP1.11. Distribution of MICs and resistance (%) inSalmonellaTyphimurium from human cases reported as (n=227), domestic outbreak related(n=212), assosiated with travel abroad (n=95) and of unknown origin (n=95), DenmarkDANMAP 2010
Antimicrobialagent0.015 0.03 0.06 0.125 0.250.42.11.81.13.20.92.11.34.241.977.860.057.93.21.14.24.83.87.44.24.22.170.592.566.364.29.313.711.66.37.02.812.611.63.51.44.24.232.219.852.649.50.40.90.51248163264128256
Origin
%Resistant
Distribution (%) of MICs512 1024 2048 >2048
Tetracycline
57.761.362.160.0
30.810.823.225.339.638.233.737.995.298.691.690.51.1
63.4 0.478.841.145.3 1.10.4 19.83.81.1 18.918.91.3 82.482.53.2 73.71.1 77.926.4 0.911.316.815.8 1.12.60.51.11.10.40.50.40.4
0.4
Domestic sporadicDomestic outbreakTravel abroad reportedUnknown originChloramphenicol Domestic sporadicDomestic outbreakTravel abroad reportedUnknown originFlorfenicolDomestic sporadicDomestic outbreakTravel abroad reportedUnknown originAmpicillinDomestic sporadicDomestic outbreakTravel abroad reportedUnknown originCeftiofurDomestic sporadicDomestic outbreakTravel abroad reportedUnknown originTrimethoprimDomestic sporadicDomestic outbreakTravel abroad reportedUnknown originSulfonamideDomestic sporadicDomestic outbreakTravel abroad reportedUnknown originStreptomycinDomestic sporadicDomestic outbreakTravel abroad reportedUnknown originGentamicinDomestic sporadicDomestic outbreakTravel abroad reportedUnknown origin96.094.394.797.92.25.22.10.90.40.548.910.833.735.80.48.41.97.46.31.82.12.13.22.14.40.98.48.455.512.731.635.84.43.36.37.44.21.113.228.312.617.923.355.737.930.5
36.121.258.953.77.53.812.613.76.23.811.610.541.977.860.057.9003.21.14.80.98.48.443.687.364.263.242.787.358.957.90.90.53.22.1
95%Confidenceinterval[29.9-42.7][15.9-27.4][48.4-68.9][43.2-64.0][4.4-11.7][1.6-7.3][6.7-21.0][7.5-22.3][3.4-10.1][1.6-7.3][5.9-19.8][5.2-18.5][35.4-48.6][71.6-83.2][49.4-69.9][47.3-68.0][0-1.6][0-1.7][0.7-9.0][0.03-5.7][2.4-8.5][0.1-3.4][3.7-15.9][3.7-15.9][37.1-50.3][82.0-91.4][53.7-73.8][52.6-72.8][36.2-49.4][82.0-91.4][48.4-68.9][47.3-68.0][0.1-3.1][0.01-2.6][0.7-9.0][0.3-7.4]43.287.364.263.2
APPENDIX
DANMAP 2010
1.
121
1.
122
APPENDIX
DANMAP 2010DANMAP 2010
Table AP1.11 (Continued). Distribution of MICs and resistance (%) inSalmonellaTyphimurium from human cases reported as (n=227), domestic outbreakrelated (n=212), assosiated with travel abroad (n=95) and of unknown origin (n=95), DenmarkDistribution (%) of MICs0.015 0.03 0.06 0.125 0.2596.010097.995.897.810098.998.91.11.10.90.41.10.42.13.20.40.40.90.40.91.30.51248163264128256512 1024 2048 >204895%Confidenceinterval
Antimicrobialagent
Origin
%Resistant
Neomycin
Apramycin
Ciprofloxacin3.21.11.11.13.2
Nalidixic acid
10.61.47.49.51.112.334.410.515.81.31.185.061.881.170.50.41.1
81.191.076.871.6
4.83.82.14.2
3.53.89.58.4
0.41.1
Colistin
Spectinomycin
97.810010097.9
1.10.4
2.23.88.411.6
Domestic sporadicDomestic outbreakTravel abroad reportedUnknown originDomestic sporadicDomestic outbreakTravel abroad reportedUnknown originDomestic sporadicDomestic outbreakTravel abroad reportedUnknown originDomestic sporadicDomestic outbreakTravel abroad reportedUnknown originDomestic sporadicDomestic outbreakTravel abroad reportedUnknown originDomestic sporadicDomestic outbreakTravel abroad reportedUnknown origin0.51.174.069.371.675.816.726.413.710.50.41.1
3.502.14.20.90003.53.813.714.72.23.88.412.60.9001.19.33.813.713.7
[1.5-6.8][0-1.7][0.3-7.4][1.2-10.4][0.1-3.1][0-1.7][0-3.8][0-3.8][1.5-6.8][1.6-7.3][7.5-22.3][8.3-23.5][0.7-5.1][1.6-7.3][3.7-15.9][6.7-21.0][0.1-3.1][0-1.7][0-3.8][0.03-5.7][5.8-13.8][1.6-7.3][7.5-22.3][7.5-22.3]
1.3
7.53.813.712.6
Vertical solid lines indicate EUCAST epidemiological cut-off values except for apramycin, spectinomycin and sulfonamide where the cut-off values were set by DANMAP. EUCAST/CLSIclinical breakpoints indicated as vertical dotted lines if different from the corresponding epidemiological cut-off values. See table AP2.2 for further detailsWhite fields represent the range of dilutions tested. MIC values equal to or lower than the lowest concentration tested are presented as the lowest concentration. MIC values greater than thehighest concentration in the range are presented as one dilution step above the range
Table AP1.12. Distribution of MICs and resistance (%) inSalmonellaEnteritidis from human cases reported as domestic sporadic (n=64), domesticoutbreak related (n=2), associated with travel abroad (n=217) and of unknown origin (n=81), DenmarkDistribution (%) of MICs0.015 0.03 0.06 0.125 0.2593.810089.993.85.13.71.60.90.962.550.064.572.814.14.67.40.50.93.17.83.74.71.60.51248163264128256
DANMAP 2010
Antimicrobialagent
Origin
%Resistant
512 1024 2048 >2048
Tetracycline
0.5
1.62.34.71.62.31.60.91.25.54.91.696.910097.297.50.51.41.293.810092.295.1
Domestic sporadicDomestic outbreakTravel abroad reportedUnknown originChloramphenicol Domestic sporadicDomestic outbreakTravel abroad reportedUnknown originFlorfenicolDomestic sporadicDomestic outbreakTravel abroad reportedUnknown originAmpicillinDomestic sporadicDomestic outbreakTravel abroad reportedUnknown originCeftiofurDomestic sporadicDomestic outbreakTravel abroad reportedUnknown originTrimethoprimDomestic sporadicDomestic outbreakTravel abroad reportedUnknown originSulfonamideDomestic sporadicDomestic outbreakTravel abroad reportedUnknown originStreptomycinDomestic sporadicDomestic outbreakTravel abroad reportedUnknown origin5.12.535.950.00.5 33.227.285.91000.9 93.192.628.1 67.2 1.610024.0 65.9 1.825.9 70.470.3 29.710063.6 35.9 0.570.4 29.698.410097.7100
1.605.13.71.600.90000.503.107.83.700001.602.301.602.301.601.81.2
95%Confidenceinterval[0.04-8.4][0-84.2][2.6-8.9][0.8-10.4][0.04-8.4][0-84.2][0.1-3.3][0-4.5][0-5.6][0-84.2][0.01-2.5][0-4.5][0.4-10.8][0-84.2][4.6-12.2][0.8-10.4][0-5.6][0-84.2][0-1.7][0-4.5][0.04-8.4][0-84.2][0.8-5.3][0-4.5][0.04-8.4][0-84.2][0.8-5.3][0-4.5][0.04-8.4][0-84.2][0.5-4.7][0.03-6.7]
APPENDIX
DANMAP 2010
1.
123
1.
124
APPENDIX
Table AP1.12 (Continued). Distribution of MICs and resistance (%) inSalmonellaEnteritidis from human cases reported as domestic sporadic (n=64),domestic outbreak related (n=2), associated with travel abroad (n=217) and of unknown origin (n=81), DenmarkDANMAP 2010
DANMAP 2010Distribution (%) of MICs0.015 0.03 0.06 0.125 0.251.60.598.410099.510010010099.51000.510010010098.81.20.51248163264128256512 1024 2048 >20489.47.88.689.170.569.10.91.22.82.53.22.50.53.13.71.66.92.50.59.41.42.51.20.53.150.09.714.887.550.088.581.51.41.27.810019.419.875.679.059.4 25.0 14.110047.9 23.0 21.755.6 28.4 13.682.84.710014.316.03.1000.50000000007.810020.721.07.810019.421.015.6029.016.0000.51.295%Confidenceinterval[0-5.6][0-84.2][0.01-2.5][0-4.5][0-5.6][0-84.2][0-1.7][0-4.5][0-5.6][0-84.2][0-1.7][0-4.5][2.6-17.3][15.8-100.0][15.5-26.7][12.7-31.5][2.6-17.3][15.8-100.0][14.3-25.2][12.7-31.5][7.8-26.9][0-84.2][23.1-35.6][8.8-25.9][0-5.6][0-84.2][0.01-2.5][0.03-6.7]
Antimicrobialagent
Origin
%Resistant
Gentamicin
Neomycin
Apramycin
Ciprofloxacin
Nalidixic acid
Colistin
Spectinomycin
Domestic sporadicDomestic outbreakTravel abroad reportedUnknown originDomestic sporadicDomestic outbreakTravel abroad reportedUnknown originDomestic sporadicDomestic outbreakTravel abroad reportedUnknown originDomestic sporadicDomestic outbreakTravel abroad reportedUnknown originDomestic sporadicDomestic outbreakTravel abroad reportedUnknown originDomestic sporadicDomestic outbreakTravel abroad reportedUnknown originDomestic sporadicDomestic outbreakTravel abroad reportedUnknown origin
Vertical solid lines indicate EUCAST epidemiological cut-off values except for apramycin, spectinomycin and sulfonamide where the cut-off values were set by DANMAP. EUCAST/CLSIclinical breakpoints indicated as vertical dotted lines if different from the corresponding epidemiological cut-off values. See table AP2.2 for further detailsWhite fields represent the range of dilutions tested. MIC values equal to or lower than the lowest concentration tested are presented as the lowest concentration. MIC values greater than thehighest concentration in the range are presented as one dilution step above the range
APPENDIX
1.
Table AP1.13. Distribution of MICs and resistance (%) inCampylobacter colifrom pigs (n=103), DenmarkDANMAP 2010
AntimicrobialagentTetracyclineChloramphenicolErythromycinStreptomycinGentamicinCiprofloxacinNalidixic acid
%Resistant11.7015.563.107.87.8
95%Confidenceinterval[6.2-19.5][0-3.5][9.1-24.0][53.0-72.4][0-3.5][3.4-14.7][3.4-14.7]
Distribution (%) of MICs0.06 0.125 0.250.519.7248163264128 >12852.4 24.31.9 2.9 1.0 1.0 6.820.4 59.2 18.4 1.923.3 24.3 26.2 10.715.528.2 8.73.9 59.258.3 32.020.47.87.8 35.9 33.0 15.51.9
28.2
9.743.7
5.8
Vertical solid lines indicate EUCAST epidemiological cut-off values. EUCAST/CLSI clinical breakpoints indicated as vertical dottedlines if different from the corresponding epidemiological cut-off values. See table AP2.2 for further detailsWhite fields represent the range of dilutions tested. MIC values equal to or lower than the lowest concentration tested are presented asthe lowest concentration. MIC values greater than the highest concentration in the range are presented as one dilution step above therange
Table AP1.14. Distribution of MICs and resistance (%) inCampylobacter jejunifrom broilers (n=41) andcattle (n=98), DenmarkDANMAP 2010AntimicrobialagentTetracycline95%Animal%Confidencespecies Resistant interval17.16.100002.41.00019.520.417.120.4[7.2-32.1][2.3-12.9][0-8.6][0-3.7][0-8.6][0-3.7][0.06-12.9][0.03-5.6][0-8.6][0-3.7][8.8-34.9][12.9-29.7][7.2-32.1][12.9-29.7]Distribution (%) of MICs0.06 0.125 0.25 0.51248163264128 >12861.0 17.1 4.959.2 32.7 1.02.4 14.66.136.6 4.922.4 1.07.31.02.41.0
BroilersCattleChloramphenicol BroilersCattleErythromycinBroilersCattleStreptomycinBroilersCattleGentamicinBroilersCattleCiprofloxacinBroilersCattleNalidixic acidBroilersCattle
12.210.2
46.3 46.342.9 48.046.3 19.559.2 9.2
1.058.576.546.3 26.8 19.533.7 48.0 17.397.698.0 1.04.9 2.49.22.41.07.35.1
19.520.453.7 17.1 4.959.2 13.3 2.0
17.120.4
Vertical solid lines indicate EUCAST epidemiological cut-off values. EUCAST/CLSI clinical breakpoints indicated as vertical dottedlines if different from the corresponding epidemiological cut-off values. See table AP2.2 for further detailsWhite fields represent the range of dilutions tested. MIC values equal to or lower than the lowest concentration tested are presented asthe lowest concentration. MIC values greater than the highest concentration in the range are presented as one dilution step above therange
DANMAP 2010
125
1.
APPENDIX
Table AP1.15. Distribution of MICs and resistance (%) inCampylobacter colifrom broiler meat (Danish n=20;imported n=27), DenmarkDANMAP 2010AntimicrobialagentTetracyclineOrigin%Resistant35.081.500014.820.0000085.2085.295%Distribution (%) of MICsConfidence0.06 0.125 0.25 0.51248interval[15.4-59.2]45.0 15.0 5.0[61.9-93.7]14.8 3.7[0-16.8]45.0 40.0 15.0[0-12.8]14.8 59.3 22.2[0-16.8]40.0 50.0 10.0[4.2-33.7]25.9 18.5 29.6 11.1[5.7-43.7]70.0 10.0[0-12.8]85.2 14.8[0-16.8]50.0 35.0 15.0[0-12.8]18.5 51.9 29.6[0-16.8]5.0 60.0 25.0 10.0[66.3-95.8]7.4 7.485.2[0-16.8]10.0 70.0 15.0[66.3-95.8]7.4 7.4
1635.081.53.7
32
64
>64
Vertical solid lines indicate EUCAST epidemiological cut-off values. EUCAST/CLSI clinical breakpoints indicated as vertical dotted linesif different from the corresponding epidemiological cut-off values. See table AP2.2 for further detailsWhite fields represent the range of dilutions tested. MIC values equal to or lower than the lowest concentration tested are presented as thelowest concentration. MIC values greater than the highest concentration in the range are presented as one dilution step above the range
DanishImportedChloramphenicol DanishImportedErythromycinDanishImportedStreptomycinDanishImportedGentamicinDanishImportedCiprofloxacinDanishImportedNalidixic acidDanishImported
20.0
14.8
5.0
85.2
Table AP1.16. Distribution of MICs and resistance (%) inCampylobacter jejunifrom broiler meat (Danish n=52;imported n=68), DenmarkDANMAP 2010AntimicrobialagentTetracyclineChloramphenicolErythromycinStreptomycinGentamicinCiprofloxacinNalidixic acidOriginDanishImportedDanishImportedDanishImportedDanishImportedDanishImportedDanishImportedDanishImported95%%ConfidenceResistantinterval11.541.2001.94.41.900017.350.013.550.0[4.4-23.4][29.4-53.8][0-6.8][0-5.3][0.05-10.3][0.9-12.4][0.05-10.3][0-5.3][0-6.8][0-5.3][8.2-30.3][37.6-62.4][5.6-25.8][37.6-62.4]Distribution (%) of MICs0.06 0.125 0.25 0.512481611.541.23264>6459.6 23.1 1.929.4 26.5 1.53.81.573.141.234.6 34.6 25.017.6 52.9 17.698.194.1 5.91.913.21.9 1.9 1.94.4 2.913.54.4
21.2 5.838.2 11.8 8.83.8 1.97.41.9
4.4
3.87.4
48.133.863.522.1
50.052.911.513.2
15.450.057.7 13.5 1.933.8 5.9 5.9
1.9 11.550.0
Vertical solid lines indicate EUCAST epidemiological cut-off values. EUCAST/CLSI clinical breakpoints indicated as vertical dotted linesif different from the corresponding epidemiological cut-off values. See table AP2.2 for further detailsWhite fields represent the range of dilutions tested. MIC values equal to or lower than the lowest concentration tested are presented as thelowest concentration. MIC values greater than the highest concentration in the range are presented as one dilution step above the range
126
DANMAP 2010
Table AP1.17. Distribution of MICs and resistance (%) inCampylobacter jejunifrom human cases reported asdomestic sporadic (n=52), assosiated with travel abroad (n=46) and of unknown origin (n=43), Denmark
DANMAP 2010
Antimicrobialagent
Origin
128
>128
Tetracycline
Chloramphenicol
Erythromycin
Streptomycin
Gentamicin
Ciprofloxacin
Domestically acquiredTravel abroad reportedUnknown originDomestically acquiredTravel abroad reportedUnknown originDomestically acquiredTravel abroad reportedUnknown originDomestically acquiredTravel abroad reportedUnknown originDomestically acquiredTravel abroad reportedUnknown originDomestically acquiredTravel abroad reportedUnknown origin
95%Distribution (%) of MICs%ConfidenceResistant0.06 0.125 0.25 0.5 124816 32 64interval13.5[5.6-25.8]69.2 15.4 1.913.556.5[41.1-71.1]26.1 13.0 2.2 2.256.520.9[10.0-36.0]46.5 23.3 9.320.90[0-6.8]73.1 26.90[0-7.7]45.7 30.4 21.7 2.20[0-8.2]67.4 25.6 7.00[0-6.8]44.2 48.1 7.70[0-7.7]43.5 43.5 10.9 2.20[0-8.2]41.9 46.5 7.0 4.71.9[0.05-10.3]98.11.92.2[0.06-11.5]95.7 2.22.22.3[0.06-12.3]95.3 2.3 2.30[0-6.8]69.2 28.81.90[0-7.7]63.0 34.8 2.22.3[0.06-12.3]46.5 48.8 2.32.325.0[14.0-38.9] 19.2 48.1 5.8 1.91.9 23.180.4[66.1-90.6] 6.5 10.92.280.441.9[27.0-57.9] 9.3 32.6 11.6 2.3 2.32.3 39.5
Vertical solid lines indicate EUCAST epidemiological cut-off values. EUCAST/CLSI clinical breakpoints indicated as vertical dotted lines if different from thecorresponding epidemiological cut-off values. See table AP2.2 for further detailsWhite fields represent the range of dilutions tested. MIC values equal to or lower than the lowest concentration tested are presented as the lowest concentration. MICvalues greater than the highest concentration in the range are presented as one dilution step above the range
APPENDIX
DANMAP 2010
1.
127
1.
APPENDIX
Figure AP1.2. Resistance (%) to tetracycline amongEnterococcus faeciumandEnteroccus faecalisfrompigs and the consumption of tetracyclines in pigs, DenmarkDANMAP 2010403580% resistant isolates3025204015105094959697989900010203040506070809100Tonnes active substance1210860640420209495969798990001020304050607080910Tonnes active substanceTonnes active substance100
60
20
Tetracycline consumption in pigs
E.faecium from pigs
E.faecalis from pigs
Figure AP1.3. Resistance (%) to erythromycin amongEnterococcus faeciumandEnteroccus faecalisfrompigs and the the consumption of macrolides in pigs, DenmarkDANMAP 2010807080% resistant Isolates60504040302010094959697989900010203040506070809100100
60
20
Macrolides for pigs
Pigs - E. Faecium
Pigs - E. Faecalis
Figure AP1.4. Resistance (%) to streptogramins inEnterococcus faeciumfrom broilers and theconsumption of virginiamycin, Denmark100
DANMAP 2010
80% resistant isolates
0
Virginiamycin
Broilers - E. faecium
128
DANMAP 2010
APPENDIX
1.
Figure AP1.5. Resistance (%) to avoparcin inEnterococcus faeciumandEnterococcus faecalisfrombroilers and the consumption of avoparcin, DenmarkDANMAP 20101003025Tonnes active substanceTonnes active substanceTonnes active substance206015401020509495969798990001020304050607080910
80% resistant isolates
0
Avoparcin
Broilers - E. faecium
Broilers - E. faecalis
Figure AP1.6. Resistance (%) to streptogramins inEnterococcus faeciumfrom pigs and the comsumption ofvirginiamycin, DenmarkDANMAP 20101210860640420209495969798990001020304050607080910VirginiamycinPigs - E. faecium100
80% resistant isolates
0
Figure AP1.7. Resistance (%) to avoparcin inEnterococcus faeciumandEnterococcus faecalisfrom pigsand the consumption of avoparcin, DenmarkDANMAP 20103025206015401020509495969798990001020304050607080910100
80% resistant isolates
0
Avoparcin
Pigs - E. faecium
Pigs - E. faecalis
DANMAP 2010
129
1.
130DANMAP 2010
Table AP1.18. Distribution of MICs and resistance (%) inEnterococcus faeciumfrom broilers (n=119) and pigs (n=133), DenmarkDistribution (%) of MICs0.015 0.03 0.06 0.125 0.2593.348.10.83.46.093.378.93.415.00.80.80.80.82.34.248.10.51248163264128256512 1024 2048 4096 >4096
APPENDIX
Antimicrobialagent
Animalspecies
%Resistant
95%Confidenceinterval
DANMAP 20100.80.80.83.056.326.389.151.911.8 18.5 13.412.0 6.0 34.650.4 9.2 37.021.1 5.3 52.61.72.31.50.83.031.9 66.4 0.848.9 46.6 1.518.5 13.4 10.9 0.820.3 6.0 44.4 3.010.945.9 2.330.3 2.5 6.7 10.1 6.720.3 2.324.82.518.8 0.8 0.897.563.295.0 5.097.7 2.336.1 41.2 20.225.6 31.6 15.80.82.53.814.30.815.023.360.5 37.8 1.791.7 6.0 1.53.4 84.0 12.612.8 76.7 10.597.5 0.891.7 8.34.2 42.9 52.999.2 0.81.7
BroilersPigsTigecyclineBroilersPigsChloramphenicol BroilersPigsPenicillinBroilersPigsAmpicillinBroilersPigsErythromycinBroilersPigsBroilersQuinupristin/dalfopristinPigsStreptomycinBroilersPigsGentamicinBroilersPigsKanamycinBroilersPigsVancomycinBroilersPigsLinezolidBroilersPigsAvilamycinBroilersPigsSalinomycinBroilersPigs
Tetracycline
5.951.100000.83.002.326.127.101.50.834.600023.300.8000052.90
[2.4-11.7][42.3-59.9][0-3.1][0-2.7][0-3.1][0-2.7][0.02-4.6][0.8-7.5][0-3.1][0.5-6.5][18.4-34.9][19.7-35.5][0-3.1][0.2-5.3][0.02-4.6][26.6-43.3][0-3.1][0-2.7][0-3.1][16.4-31.4][0-3.1][0.02-4.1][0-3.1][0-2.7][0-3.1][0-2.7][43.6-62.2][0-2.7]
Vertical solid lines indicate EUCAST epidemiological cut-off values except for ciprofloxacin, kanamycin, quinupristin/dalfopristin and salinomycin where the cut-off values were set byDANMAP. EUCAST/CLSI clinical breakpoints indicated as vertical dotted lines if different from the corresponding epidemiological cut-off values. See table AP2.2 for further detailsWhite fields represent the range of dilutions tested. MIC values equal to or lower than the lowest concentration tested are presented as the lowest concentration. MIC values greater than thehighest concentration in the range are presented as one dilution step above the range
Table AP1.19. Distribution of MICs and resistance (%) inEnterococcus faecalisfrom broilers (n=112) and pigs (n=157), DenmarkDistribution (%) of MICs0.015 0.03 0.06 0.125 0.2573.221.70.62.78.35.75.710.228.647.168.838.90.916.19.69.868.20.51248163264128256
DANMAP 2010
AnimalAntimicrobial agentspecies
%Resistant
512 1024 2048 4096 >4096
Tetracycline
Tigecycline
Chloramphenicol
Penicillin
Ampicillin3.617.943.9
Erythromycin
Quinupristin/dalfopristinStreptomycin93.875.8
44.6 55.438.2 45.957.1 42.925.5 74.510099.4 0.618.8 44.6 11.60.9 2.716.6 35.0 4.50.95.4 84.8 8.90.6 0.6 68.2 26.83.82.72.55.412.799.179.07.16.492.068.21.81.31.3
0.62.52.5
3.625.51.90.95.1
Gentamicin
Kanamycin
0.921.0
Vancomycin
Linezolid
40.222.347.349.0
52.771.352.751.0
Avilamycin
Salinomycin
BroilersPigsBroilersPigsBroilersPigsBroilersPigsBroilersPigsBroilersPigsBroilersPigsBroilersPigsBroilersPigsBroilersPigsBroilersPigsBroilersPigsBroilersPigsBroilersPigs10010082.1 17.9100
25.978.300015.9000025.043.993.898.73.628.00.911.50.921.000000000
95%Confidenceinterval[18.1-35.0][71.1-84.5][0-3.2][0-2.3][0-3.2][10.6-22.6][0-3.2][0-2.3][0-3.2][0-2.3][17.3-34.1][36.0-52.1][87.5-97.5][95.5-99.8][1.0-8.9][21.2-35.7][0.02-4.9][6.9-17.5][0.02-4.9][14.9-28.2][0-3.2][0-2.3][0-3.2][0-2.3][0-3.2][0-2.3][0-3.2][0-2.3]
DANMAP 2010
Vertical solid lines indicate EUCAST epidemiological cut-off values except for ciprofloxacin, kanamycin and salinomycin where the cut-off values were set by DANMAP. EUCAST/CLSI clinicalbreakpoints indicated as vertical dotted lines if different from the corresponding epidemiological cut-off values. See table AP2.2 for further detailsWhite fields represent the range of dilutions tested. MIC values equal to or lower than the lowest concentration tested are presented as the lowest concentration. MIC values greater than the highestconcentration in the range are presented as one dilution step above the range
APPENDIX1.
131
1.
132
APPENDIX
Table AP1.20. Distribution of MICs and and resistance (%) inEnterococcus faeciumfrom broiler meat (Danish n=145; imported n=107), Danish beef (n=20)and Danish pork (n=29), DenmarkDANMAP 2010
DANMAP 2010Distribution (%) of MICs0.015 0.03 0.06 0.125 0.25 0.586.9 2.1 0.756.10.990.079.3 3.40.7 2.1 7.60.9 3.7 38.310.017.21248163264 128 256 512 1024 2048 4096 >409611.7 80.0 8.32.8 67.3 29.0 0.995.0 5.06.9 93.11.44.71.46.5 19.63.43.7 13.13.4 6.90.9 54.26.9[5.9-16.5][33.5-52.9][1.2-31.7][5.8-35.8][0-2.5][0-3.4][0-16.8][0-11.9][0-2.5][0-3.4][0-16.8][0-11.9][0.2-4.9][18.1-35.6][0-16.8][0.09-17.8][0.2-4.9][17.3-34.6][0-16.8][0-11.9][15.0-29.0][52.7-71.8][0.1-24.9][15.3-50.8]19.315.020.017.215.910.310.06.92.8 55.9 37.2 2.80.9 17.8 59.8 16.840.0 60.03.4 48.3 41.4 6.962.1 24.1 9.0 3.435.5 15.0 14.0 9.350.0 45.0 5.044.8 44.86.993.1 5.5 1.463.6 11.2 5.6 2.810089.7 10.318.6 24.8 4.1 6.98.4 3.7 3.7 3.750.0 15.0 5.010.3 34.5 20.7 3.4[0.2-4.9]0.7 44.8 14.5 36.6 2.1 1.411.2 18.7 43.9 16.8 8.4 0.95.0 50.0 5.0 40.03.4 10.3 10.3 75.91.4[4.6-16.5][0-16.8][0-11.9][0.8-6.9][28.2-47.3][0-16.8][0.8-22.8]93.855.190.086.23.47.510.06.90.93.40.7 2.15.6 30.83.4
Antimicrobialagent
Food type
Origin
95%%ConfidenceResistantinterval
Tetracycline
Broiler meat DanishImportedBeefDanishPorkDanishTigecyclineBroiler meat DanishImportedBeefDanishPorkDanishChloramphenicol Broiler meat DanishImportedBeefDanishPorkDanishPenicillinBroiler meat DanishImportedBeefDanishPorkDanishAmpicillinBroiler meat DanishImportedBeefDanishPorkDanishErythromycinBroiler meat DanishImportedBeefDanishPorkDanishQuinupristin/Broiler meat DanishdalfopristinImportedBeefDanishPorkDanishStreptomycinBroiler meat DanishImportedBeefDanishPorkDanish
10.343.010.017.2000000001.426.203.41.425.20021.462.65.031.0
9.3002.837.406.9
Table AP1.20 (Continued). Distribution of MICs and and resistance (%) inEnterococcus faeciumfrom broiler meat (Danish n=145; imported n=107), Danishbeef (n=20) and Danish pork (n=29), Denmark
DANMAP 2010
Antimicrobialagent0.015 0.03 0.06 0.125 0.25 0.598.6 1.492.5 7.510010039.318.750.031.043.436.435.024.112481632
Food type
Origin
Distribution (%) of MICs64 128 256 512 1024 2048 4096 >4096
Gentamicin
Kanamycin
Ciprofloxacin
Vancomycin
5.51.915.041.4
11.7 4.120.6 4.75.0 10.041.4
1.419.63.4
Teicoplanin
Linezolid
91.793.545.037.9
Salinomycin
Broiler meat DanishImportedBeefDanishPorkDanishBroiler meat DanishImportedBeefDanishPorkDanishBroiler meat DanishImportedBeefDanishPorkDanishBroiler meat DanishImportedBeefDanishPorkDanishBroiler meat DanishImportedBeefDanishPorkDanishBroiler meat DanishImportedBeefDanishPorkDanishBroiler meat DanishImportedBeefDanishPorkDanish53.816.830.044.863.484.190.096.66.9 0.76.555.062.16.29.35.03.482.175.780.075.911.024.395.093.111.715.015.020.752.4 36.665.4 10.35.06.922.135.525.06.931.712.15.03.415.9 2.1 0.740.2 5.630.06.94.13.75.00.70.7
95%%ConfidenceResistantinterval0[0-2.5]0[0-3.4]0[0-16.8]0[0-11.9]1.4[0.2-4.9]19.6[12.6-28.4]0[0-16.8]3.4[0.09-17.8]0[0-2.5]0[0-3.4]0[0-16.8]0[0-11.9]0.7[0.02-3.8]0[0-3.4]0[0-16.8]0[0-11.9]0.7[0.02-3.8]0[0-3.4]0[0-16.8]0[0-11.9]0[0-2.5]0[0-3.4]0[0-16.8]0[0-11.9]36.6[28.7-44.9]10.3[5.2-17.7]0[0-16.8]0[0-11.9]
DANMAP 2010
Vertical solid lines indicate EUCAST epidemiological cut-off values except for ciprofloxacin, kanamycin, quinupristin/dalfopristin and salinomycin where the cut-off values were set byDANMAP. EUCAST/CLSI clinical breakpoints indicated as vertical dotted lines if different from the corresponding epidemiological cut-off values. See table AP2.2 for further detailsWhite fields represent the range of dilutions tested. MIC values equal to or lower than the lowest concentration tested are presented as the lowest concentration. MIC values greater than thehighest concentration in the range are presented as one dilution step above the range
APPENDIX1.
133
1.
134DANMAP 2010
Table AP1.21. Distribution of MICs and resistance (%) inEnterococcus faecalisfrom broiler meat (Danish n=59; imported n=104), beef (Danish n=27;imported n=36) and pork (Danish n=84; imported n=91), Denmark%Resistant0.015 0.03 0.06 0.125 0.25 0.54816Distribution (%) of MICs
APPENDIX
Antimicrobialagent
Food type
Origin
DANMAP 20101252.5 1.745.277.880.686.965.93213.61.0 11.511.15.61.29.964 128 256 512 1024 2048 4096 >409632.242.311.113.911.924.26.8 47.5 35.6 10.21.0 10.6 35.6 50.0 2.93.7 18.5 48.1 25.9 3.72.8 8.3 55.6 30.6 2.81.2 20.2 50.0 27.4 1.214.3 41.8 37.4 6.61.74.81.22.81.21.11.72.21.71.78.538.52.81.25.51.02.87.18.81.25.545.854.822.219.413.134.10000001.74.802.81.23.31.7000001.70000016.939.402.81.25.539.028.866.747.261.953.835.614.425.922.226.226.450.8 47.51.0 35.6 58.73.7 74.1 22.252.8 44.458.3 39.358.2 38.576.3 20.3 1.773.1 26.974.1 25.983.3 16.790.5 9.583.5 16.596.6 1.710096.3 3.797.2 2.897.6 2.498.9 1.16.8 1.76.817.31.07.427.810.714.395%Confidenceinterval[32.7-59.2][44.7-64.6][8.6-42.3][8.2-36.0][6.7-22.2][24.5-44.7][0-6.1][0-3.5][0-12.8][0-9.7][0-4.3][0-4.0][0.04-9.1][1.6-10.9][0-12.8][0.07-14.5][0.03-6.5][0.7-9.3][0.04-9.1][0-3.5][0-12.8][0-9.7][0-4.3][0-4.0][0.04-9.1][0-3.5][0-12.8][0-9.7][0-4.3][0-4.0][8.4-29.0][30.0-49.5][0-12.8][0.07-14.5][0.03-6.5][1.8-12.4]98.397.166.780.682.169.2[90.9-100.0][91.8-99.4][46.0-83.5][64.0-91.8][72.3-89.6][58.7-78.5]1.71.93.7 29.65.6 11.11.2 8.316.591.576.963.072.282.165.96.814.4 5.83.75.6 2.83.3
Tetracycline
Broiler meat
Beef
Pork
Tigecycline
Broiler meat
Beef
Pork
Chloramphenicol
Broiler meat
Beef
Pork
Penicillin
Broiler meat
Beef
Pork
Ampicillin
Broiler meat
Beef
Pork
Erythromycin
Broiler meat
Beef
Pork
DanishImportedDanishImportedDanishImportedDanishImportedDanishImportedDanishImportedDanishImportedDanishImportedDanishImportedDanishImportedDanishImportedDanishImportedDanishImportedDanishImportedDanishImportedDanishImportedDanishImportedDanishImported
Quinupristin/dalfopristin
Broiler meat
Beef
Pork
DanishImportedDanishImportedDanishImported
Streptomycin
Broiler meat
APPENDIX
DANMAP 2010
Danish8.5 [2.8-18.7]76.3 15.38.5Imported24.0 [16.2-33.4]1.9 58.7 14.4 1.024.0BeefDanish3.7 [0.09-19.0]14.8 77.8 3.73.7Imported8.3 [1.8-22.5]2.8 55.6 33.38.3PorkDanish0 [0-4.3]11.9 73.8 14.3Imported4.4 [1.2-10.9]19.8 71.4 4.44.4GentamicinBroiler meat Danish0 [0-6.1]89.8 10.2Imported1.0 [0.02-5.2]96.2 2.91.0BeefDanish0 [0-12.8]96.3 3.7Imported0 [0-9.7]91.7 8.3PorkDanish1.2 [0.03-6.5]96.4 2.41.2Imported2.2 [0.3-7.7]97.82.2KanamycinBroiler meat Danish0 [0-6.1]100Imported18.3 [11.4-27.1]81.718.3BeefDanish3.7 [0.09-19.0]96.33.7Imported2.8 [0.07-14.5]97.22.8PorkDanish2.4 [0.3-8.3]96.4 1.22.4Imported3.3 [0.7-9.3]96.73.3CiprofloxacinBroiler meat Danish0 [0-6.1]27.1 72.9Imported1.0 [0.02-5.2]21.2 73.1 4.81.0BeefDanish0 [0-12.8]22.2 66.7 11.1Imported0 [0-9.7]30.6 69.4PorkDanish0 [0-4.3]21.4 67.9 10.7Imported1.1 [0.03-6.0]31.9 64.8 2.21.1VancomycinBroiler meat Danish0 [0-6.1]49.2 37.3 13.6Imported0 [0-3.5]28.8 66.3 4.8BeefDanish0 [0-12.8]74.1 22.2 3.7Imported0 [0-9.7]41.7 52.8 5.6PorkDanish0 [0-4.3]42.9 48.8 8.3Imported0 [0-4.0]53.8 44.0 2.2TeicoplaninBroiler meat Danish0 [0-6.1]100Imported0 [0-3.5]100BeefDanish0 [0-12.8]100Imported0 [0-9.7]97.2 2.8PorkDanish0 [0-4.3]100Imported0 [0-4.0]97.8 2.2LinezolidBroiler meat Danish0 [0-6.1]16.9 83.1Imported0 [0-3.5]1.9 31.7 66.3BeefDanish0 [0-12.8]14.8 85.2Imported0 [0-9.7]13.9 86.1PorkDanish0 [0-4.3]28.6 69.0 2.4Imported0 [0-4.0]19.8 80.2SalinomycinBroiler meat Danish1.7 [0.04-9.1]89.8 8.5 1.7Imported0 [0-3.5]94.2 5.8BeefDanish0 [0-12.8]100Imported0 [0-9.7]100PorkDanish0 [0-4.3]100Imported0 [0-4.0]100Vertical solid lines indicate EUCAST epidemiological cut-off values except for ciprofloxacin, kanamycin and salinomycin where the cut-off values were set by DANMAP. EUCAST/CLSI clinicalbreakpoints indicated as vertical dotted lines if different from the corresponding epidemiological cut-off values. See table AP2.2 for further detailsWhite fields represent the range of dilutions tested. MIC values equal to or lower than the lowest concentration tested are presented as the lowest concentration. MIC values greater than thehighest concentration in the range are presented as one dilution step above the range
1.
135
1.
136
APPENDIX
Table AP1.22. Distribution of MICs and resistance (%) inEscherichia colifrom broilers (n=118), cattle (n=106) and pigs (n=160), DenmarkDANMAP 2010
DANMAP 2010Distribution (%) of MICs0.015 0.03 0.06 0.125 0.25 0.51.30.60.80.93.10.8 20.33.823.1181632283.974.558.14.21.95.11.34.2 28.86.6 28.33.8 28.194.1 5.999.1 0.998.80.60.60.60.60.644.964.249.450.065.158.12.55.72.540.816.04.448.334.943.843.233.037.543.255.742.564 128 256 512 1024 2048 >204815.30.9 8.50.6 35.00.8 1.70.93.11.30.80.995.8 4.210097.5 1.392.499.178.1 0.695%Confidenceinterval[9.3-23.0][4.6-16.7][29.4-44.9][0.5-7.3][0.02-5.1][1.8-8.8][0.02-4.6][0.02-5.1][0-2.3][14.2-29.7][1.0-9.4][16.8-30.4][0-3.1][0-3.4][0.2-4.4][0-3.1][0-3.4][0.2-4.4][3.5-14.0][0.02-5.1][15.2-28.4][13.5-28.7][1.5-10.7][24.7-39.7][8.6-22.1][2.1-11.9][39.0-54.9][0-3.1][0-3.4][0.02-3.4]11.9 75.4 12.751.9 45.3 2.830.0 64.4 5.07.60.921.378.895.368.161.0 24.6 2.5 2.582.1 12.31.945.0 8.1 5.0 7.50.60.83.4 5.92.8 0.910.6 23.820.34.731.9
Antimicrobialagent
Animalspecies
% Resistant
Tetracycline
BroilersCattlePigsChloramphenicol BroilersCattlePigsFlorfenicolBroilersCattlePigsAmpicillinBroilersCattlePigsCeftiofurBroilersCattlePigsCefotaximeBroilersCattlePigsTrimethoprimBroilersCattlePigsSulfonamideBroilersCattlePigsStreptomycinBroilersCattlePigsGentamicinBroilersCattlePigs
15.39.436.92.50.94.40.80.9021.23.823.1001.2001.27.60.921.220.34.731.914.45.746.9000.6
Table AP1.22 (Continued). Distribution of MICs and resistance (%) inEscherichia colifrom broilers (n=118), cattle (n=106) and pigs (n=160), DenmarkDANMAP 2010
Antimicrobialagent0.015 0.03 0.06 0.125 0.25 0.50.80.97.50.61248163264
Animalspecies
% Resistant
Distribution (%) of MICs128 256 512 1024 2048 >2048
Neomycin0.8
Apramycin44.9 46.663.2 36.871.3 28.891.51001000.61.75.90.8
Ciprofloxacin
71.2 28.097.2 1.982.5 10.029.7 66.1 3.463.2 35.8 0.952.5 43.8 3.1
Nalidixic acid10010098.8 0.6
1.7
3.4
3.4
Colistin
Spectinomycin
BroilersCattlePigsBroilersCattlePigsBroilersCattlePigsBroilersCattlePigsBroilersCattlePigsBroilersCattlePigs
0.80.97.50.800.68.5008.500000.65.11.925.0
95%Confidenceinterval[0.02-4.6][0.02-5.1][3.9-12.7][0.02-4.6][0-3.4][0.02-3.4][4.1-15.0][0-3.4][0-2.3][4.1-15.0][0-3.4][0-2.3][0-3.1][0-3.4][0.02-3.4][1.9-10.7][0.2-6.6][18.5-32.4]
68.6 24.6 1.71.7 3.484.9 9.4 3.8 0.9 0.948.1 16.3 10.6 3.1 13.8 8.1
Vertical solid lines indicate EUCAST epidemiological cut-off values except for apramycin and sulfonamide where the cut-off values were set by DANMAP. EUCAST/CLSI clinical breakpointsindicated as vertical dotted lines if different from the corresponding epidemiological cut-off values. See table AP2.2 for further detailsWhite fields represent the range of dilutions tested. MIC values equal to or lower than the lowest concentration tested are presented as the lowest concentration. MIC values greater than thehighest concentration in the range are presented as one dilution step above the range
APPENDIX
DANMAP 2010
1.
137
1.
138DANMAP 2010
Table AP1.23. Distribution of MICs and resistance (%) inEscherichia colifrom broiler meat (Danish n=158; imported n=177), beef (Danish n=32; importedn=39) and pork (Danish n=68; imported n=50), DenmarkDistribution (%) of MICs0.015 0.03 0.06 0.125 0.250.61.50.61.11.17.32.64.42.98.00.61.37.91.50.612.40.51816256512 1024 2048 >2048320.664 12812.745.23.110.322.156.0
APPENDIX
Antimicrobialagent
Food type
Origin
DANMAP 20108.91.15.94.00.62.61.51.11.71.595.659.396.997.483.870.01.10.62.81.51.10.62.82.61.52486.1 0.652.0 2.390.6 6.387.2 2.675.0 1.540.0 2.02.5 53.837.96.3 28.135.97.4 35.34.0 50.02.5 52.51.1 36.26.3 21.938.58.8 27.94.0 44.042.4 31.621.5 17.515.6 71.935.9 56.432.4 30.932.0 26.02.042.440.165.661.550.038.043.754.271.961.561.850.00.61.79.42.67.42.00.60.616.558.23.15.123.536.02.82.62.099.492.710094.997.11001.799.491.510097.497.11000.64.439.03.12.616.230.084.843.593.894.980.964.00.60.61.72.61.52.014.654.26.32.617.634.0
Broiler meat DanishImportedBeefDanishImportedPorkDanishImportedChloramphenicol Broiler meat DanishImportedBeefDanishImportedPorkDanishImportedFlorfenicolBroiler meat DanishImportedBeefDanishImportedPorkDanishImportedAmpicillinBroiler meat DanishImportedBeefDanishImportedPorkDanishImportedCeftiofurBroiler meat DanishImportedBeefDanishImportedPorkDanishImportedCefotaximeBroiler meat DanishImportedBeefDanishImportedPorkDanishImportedTrimethoprimBroiler meat DanishImportedBeefDanishImportedPorkDanishImportedSulfonamideBroiler meat DanishImportedBeefDanishImportedPorkDanishImported
Tetracycline
95%%ConfidenceResistantinterval13.3 [8.4-19.6]45.8 [38.3-53.4]3.1 [0.08-16.2]10.3 [2.9-24.2]23.5 [14.1-35.4]56.0 [41.3-70.0]0.6 [0.02-3.5]20.9 [15.2-27.6]0 [0-10.9]0 [0-9.0]2.9 [0.4-10.2]8.0 [2.2-19.2]0 [0-2.3]0.6 [0.01-3.1]0 [0-10.9]0 [0-9.0]0 [0-5.3]2.0 [0.05-10.6]16.5 [11.0-23.2]58.2 [50.6-65.5]3.1 [0.08-16.2]5.1 [0.6-17.3]23.5 [14.1-35.4]36.0 [22.9-50.8]0.6 [0.02-3.5]6.8 [3.6-11.5]0 [0-10.9]2.6 [0.06-13.5]1.5 [0.04-7.9]0 [0-7.1]0.6 [0.02-3.5]6.8 [3.6-11.5]0 [0-10.9]2.6 [0.06-13.5]1.5 [0.04-7.9]0 [0-7.1]4.4 [1.8-8.9]40.7 [33.4-48.3]3.1 [0.08-16.2]2.6 [0.06-13.5]16.2 [8.4-27.1]30.0 [17.9-44.6]15.2 [10.0-21.8]55.9 [48.3-63.4]6.2 [0.8-20.8]5.1 [0.6-17.3]19.1 [10.6-30.5]36.0 [22.9-50.8]
Streptomycin5.14.42.02.81.51.12.94.00.60.69.62.68.84.0
Gentamicin
Neomycin
24.723.225.041.032.426.0
Apramycin
66.5 8.966.1 7.971.9 3.151.3 5.158.8 7.462.0 12.079.777.496.992.380.976.03.82.85.96.01.519.611.33.15.111.818.042.442.446.959.050.042.02.64.42.053.854.853.141.042.652.04.02.62.01.75.11.11.33.41.52.82.680.446.978.184.660.352.0
67.7 17.139.5 14.781.3 15.692.3 2.652.9 8.836.0 8.0
5.17.9
3.2 7.07.9 24.93.12.6 2.616.2 8.818.0 32.0
Ciprofloxacin2.31.70.62.62.0
1.32.81.5
Nalidixic acid
66.533.362.571.863.264.0
29.726.037.523.135.332.0
2.518.6 10.7
2.534.55.14.0
Colistin
96.259.310089.798.596.010093.810097.4100100
3.4
Spectinomycin
Broiler meat DanishImportedBeefDanishImportedPorkDanishImportedBroiler meat DanishImportedBeefDanishImportedPorkDanishImportedBroiler meat DanishImportedBeefDanishImportedPorkDanishImportedBroiler meat DanishImportedBeefDanishImportedPorkDanishImportedBroiler meat DanishImportedBeefDanishImportedPorkDanishImportedBroiler meat DanishImportedBeefDanishImportedPorkDanishImportedBroiler meat DanishImportedBeefDanishImportedPorkDanishImportedBroiler meat DanishImportedBeefDanishImportedPorkDanish14.0[5.8-26.7]
APPENDIX
DANMAP 2010
Imported
15.245.83.15.138.256.002.802.61.500.610.2002.94.000001.503.840.705.11.54.03.837.905.11.54.006.200003.829.402.619.111.416.415.67.717.622.012.0
[10.0-21.8][38.3-53.4][0.08-16.2][0.6-17.3][26.7-50.8][41.3-70.0][0-2.3][0.9-6.5][0-10.9][0.06-13.5][0.04-7.9][0-7.1][0.02-3.5][6.1-15.6][0-10.9][0-9.0][0.4-10.2][0.5-13.7][0-2.3][0-2.1][0-10.9][0-9.0][0.04-7.9][0-7.1][1.4-8.1][33.4-48.3][0-10.9][0.6-17.3][0.04-7.9][0.5-13.7][1.4-8.1][30.7-45.4][0-10.9][0.6-17.3][0.04-7.9][0.5-13.7][0-2.3][3.1-10.8][0-10.9][0-9.0][0-5.3][0-7.1][1.4-8.1][22.8-36.7][0-10.9][0.06-13.5][10.6-30.5]4.47.36.35.12.90.61.72.61.51.9 1.312.4 15.311.810.0
5.94.0
Vertical solid lines indicate EUCAST epidemiological cut-off values except for apramycin and sulfonamide where the cut-off values were set by DANMAP. EUCAST/CLSI clinical breakpointsindicated as vertical dotted lines if different from the corresponding epidemiological cut-off values. See table AP2.2 for further detailsWhite fields represent the range of dilutions tested. MIC values equal to or lower than the lowest concentration tested are presented as the lowest concentration. MIC values greater than thehighest concentration in the range are presented as one dilution step above the range
1.
139
1.
140
APPENDIX
Table AP1.24. Distribution of MICs and resistance (%) inEscherichia colifrom diagnostic pigs (n=33), DenmarkDistribution (%) of MICs0.01527.372.7 18.29.112.1 33.3 12.197.097.045.53.03.051.521.221.278.8 15.272.79.190.966.79.13.012.19.178.810021.26.19.16.112.1 45.521.26.13.03.03.03.018.23.021.2 18.2 33.378.83.042.466.7 18.23.03.03.06.13.06.163.60.03 0.06 0.125 0.250.51248163264128
DANMAP 2010DANMAP 2010
Antimicrobialagent
Animalspecies
%Resistant
95%Confidenceinterval
256 512 1024 2048 >2048
Tetracycline
Pigs
69.7
[51.3-84.4]
Chloramphenicol Pigs
9.1
[1.9-24.3]
Florfenicol
Pigs
3.0
[0.08-15.8]
Ampicillin
Pigs
42.4
[25.5-60.8]
Ceftiofur
Pigs
3.0
[0.08-15.8]
Cefotaxime
Pigs
3.0
[0.08-15.8]
Trimethoprim
Pigs
51.5
[33.5-69.2]
Sulfonamide
Pigs
78.8
[61.1-91.0]
Streptomycin
Pigs
75.8
[57.7-88.9]
Gentamicin
Pigs
3.0
[0.08-15.8]
Neomycin
Pigs
18.2
[7.0-35.5]
Apramycin
Pigs
3.0
[0.08-15.8]
Ciprofloxacin
Pigs
24.2
[11.1-42.3]
Nalidixic acid
Pigs
21.2
[9.0-38.9]
Colistin
Pigs
0
[0-10.6]
Spectinomycin
Pigs
63.6
[45.1-79.6]
Vertical solid lines indicate EUCAST epidemiological cut-off values except for apramycin and sulfonamide where the cut-off values were set by DANMAP. EUCAST/CLSI clinical breakpointsindicated as vertical dotted lines if different from the corresponding epidemiological cut-off values. See table AP2.2 for further detailsWhite fields represent the range of dilutions tested. MIC values equal to or lower than the lowest concentration tested are presented as the lowest concentration. MIC values greater than thehighest concentration in the range are presented as one dilution step above the range
APPENDIX
2
DANMAP 2010
141
2.
APPENDIX
List of abbreviationsACDDefined Animal Course DoseADDDefined Animal Daily DoseADDkgDefined Animal Daily Dose per kg animalAGPAntimicrobial Growth PromoterATCAnatomical Therapeutic Chemical Classification SystemCHRCentral Husbandry RegisterCIConfidence IntervalCNSCentral Nervous SystemCPRDanish Civil RegistryDADDefined Daily Doses per 100 admissionsDBDDefined Daily Doses per 100 occupied bed-daysDCMDepartment of Clinical MicrobiologyDIDDefined Daily Doses per 1,000 inhabitants per dayDDDDefined Daily DoseDMADanish Medicines AgencyDTUTechnical University of DenmarkDVFADanish Veterinary and Food AdministrationEARS-NetThe European Antimicrobial Resistance Surveillance NetworkESBLExtended Spectrum Beta-LactamaseGIGastrointestinalGPGeneral PractitionerHLGRHigh-level gentamicin resistanceMICMinimum Inhibitory ConcentrationMRSAMethicillin-resistantStaphylococcus aureusNNumber of samplesnNumber of isolates tested for antimicrobial susceptibilityOIEWorld Organisation for Animal HealthPMWSPostweaning multisystemic wasting syndromeRFCARegional Veterinary and Food Control AuthoritiesSSIStatens Serum InstitutVetStat Danish Register of Veterinary MedicinesVREVancomycin Resistant EnterococciWHOWorld Health OrganizationWTWild type
142
DANMAP 2010
APPENDIX
2.
List of wordsAnatomical Therapeutic Chemical (ATC) classification.International classification system for drugconsumption studies. The ATC code identifies the therapeutic ingredient(s) of each drug for human useaccording to the organ or system on which it acts and its chemical, pharmacological and therapeuticproperties. Antibacterials for systemic use are known as ATC group J01. The ATC classification ismaintained by the WHO Collaborating Centre for Drug Statistics and Methodology (Oslo, Norway) (http://www.whocc.no/atcddd/indexdatabase/). The ATC classification for veterinary medicinal products, ATCvet,is based on the same main principles as the ATC classification system for medicines for human use andis also maintained by the WHO Collaborating Centre for Drug Statistics and Methodology (http://www.whocc.no/atcvet/database/).Antibacterial agents.Synthetic (chemotherapeutics) or natural (antibiotics) substances that destroybacteria or suppress bacterial growth or reproduction [Source: Dorland’s Illustrated Medical Dictionary].Antimycobacterial agents are not included. Only antibacterial agents for systemic use are included (J01 inthe ATC system) in the section on human consumption.Antimicrobial agents.The term ‘antimicrobial agents’ covers antibacterial, antiviral, coccidiostatic andantimycotic agents. In the section on veterinary consumption, the broad term ‘antimicrobial agents’ isusually used because coccidiostats are included. Antiviral substances are not used in veterinary medicine,and antimycotics are only registered for topical veterinary use and used mainly in companion animals.Antimycobacterial agents are not included. The term ’antibacterial agents’ is only used in the veterinarysection for precision, to distinguish from use of coccidiostats as feed additives (poultry only).Broiler.A type of chicken raised specifically for meat production. In Denmark, the average weight afterslaughter is 1.66 kg.Central Husbandry Register (CHR).This is a register of all Danish farms defined as geographical siteshousing production animals. It contains numerous information concerning ownership, farm size, animalspecies, age groups, number of animals and production type. Each farm has a unique farm identity number(CHR-number).Defined Daily Dose (DDD).This is the assumed average maintenance dose per day in adults. It shouldbe emphasised that the Defined Daily Dose is a unit of measurement and does not necessarily reflect therecommended or prescribed daily dose. DDDs provide a fixed unit of measurement independent of priceand formulation, enabling the assessment of trends in drug consumption and to perform comparisonsbetween population groups. The DDDs are defined and revised yearly by the WHO Collaborating Centre forDrug Statistics and Methodology (http://www.whocc.no/atcddd/indexdatabase/). DDD/1,000 inhabitant-days is called DID.Defined Animal Daily Dose (ADD and ADDkg).This is a national veterinary equivalent to the DDD.This is an assumed average daily dose per animal, defined as the daily maintenance dose for a drug usedfor its main indication in a specified species. The dose is defined for a ”standard animal”, i.e. an animal withan estimated average weight within a specified age group. In VetStat, ADDs are calculated for each agegroup. Otherwise, the general principles for standardisation of dosage for animals are similar to that usedby the WHO Collaborating Centre for Drug Statistics and Methodology to calculate Defined Daily Dose(DDD) in humans [Jensenet al.2004. Prev Vet Med. 64: 201-215]. The ADDkgis the ADD per kg animal.Consumption calculated in ADDkgallows summation of consumption across different age groups andanimal species.Defined Animal Course Dose (ACD and ACDkg).The duration of the treatment related to one applicationmay vary substantially between antimicrobial drugs. To correct for this, total course dose has beenintroduced as unit of measurement for antimicrobial usage. As a standard, the length of the course is heredefined as 6 days, if nothing else is stated. Course doses are assigned per kilogram (live weight) of theanimal species (ACDkg) or age group of the relevant species (ADCxx) and are based on the correspondingADDkgor ADDxx, respectively, for the relevant animal species and drug formulations.
DANMAP 2010
143
2.
APPENDIX
ESBL.In this DANMAP report ‘ESBL’ describes the clinically important acquired beta-lactamases withactivity against extended-spectrum cephalosporins; including the classical class A ESBLs (CTX-M, SHV,TEM), the plasmid-mediated AmpC and OXA-ESBLs [Giskeet al.2009. J Antimicrob Chemother. 63: 1-4].Finishers.Pigs from 30 kilogram live weight to time of slaughter at app. 100 kilogram live weight.Fully sensitive.See definition of multi-resistance.Heifer.A young female cow before first calving.Intramammaria.Antimicrobial agents for local application in the mammary gland (udder) to treat mastitis.Intramammary syringe.A one dose applicator for use in the udder.Layer.A hen raised to produce eggs for consumption.Minimum Inhibitory Concentration (MIC).This is the lowest concentration of antimicrobial agent in agiven culture medium, e.g. broth or agar, below which growth of the bacteria is not inhibited.Multi-resistant.ASalmonellaorE. coliisolate is assumed multi-resistant if resistant to three or more ofthe following ten antimicrobial groups: Tetracyclines (tetracycline), phenicoles (chloramphenicol and/or florfenicol), penicillins (ampicillin), cephalosporins (ceftiofur and/or cefotaxime), sulfonamides(sulfonamide), trimethoprim (trimethoprim), aminoglycosides - except streptomycin (gentamicin),streptomycin (streptomycin), quinolones (ciprofloxacin and/or nalidixic acid) and polymycins (colistin). Anisolate will be referred to as fully sensitive if susceptible to all the above listed antimicrobial groups.Pet animals.Dogs, cats, birds, mice, guinea pigs and more exotic species kept at home for pleasure, ratherthan one kept for work or food; does not include horses.Piglet.The newborn pig is called at piglet from birth till they are permanently separated from the sow at 3-4weeks of age. The weight of the piglet at weaning is approximately 7 kilogram.Poultry.The major production species are fowl -Gallus gallus(broilers, layers, including breeding andrearing) and turkey. Regarding antimicrobial consumption, ‘poultry’ also includes domesticated ducks,geese, game birds and pigeons. In DANMAP 2010, the poultry isolates originated fromGallus gallusandbroiler meat, and a minor part originated from imported turkey meat.Significant.When written in the text, significant differences imply statistically significant differences wherep<0.05 using Chi-square or Fisher’s Exact Test when the number of samples is low (<25).Sow.Any breeding female pig that has been served and is on the farm.Steer.Castrated male cattle, usually young animal.Weaner.Any pig, 7–30 kilogram live weight.Wild type.The typical form of an organism, strain, gene, or characteristic as it occurs in nature.
144
DANMAP 2010
APPENDIX
2.
Materials and methods1.General informationFrom April 2007, the monopoly was suspended andprivate companies (two in 2010) can now, on certainconditions (identical to the pharmacies), sell prescribedveterinary medical products for production animals. Inaddition, price setting was liberalised, which allowed fordiscounts corresponding to lower administration costrelated to sale of large quantities to the veterinarians. In2010, the animal owners and veterinarians purchasedthe antimicrobial agents equally from the pharmacies(49%) and the veterinary drug trading companies(49%), while only 2.4% was purchased from the feedmills.Data on all sales of veterinary prescription medicinefrom the pharmacies, private companies, feed millsand veterinarians are sent electronically to VetStat.Veterinarians are required by law to report to VetStatthe use of all prescription medicines in productionanimals on a monthly basis. For most veterinarians, theregistration of data is linked to the writing of invoices.For the DANMAP report the amount of drugs reportedby the veterinary practitioners is validated againstpharmacy data on the total sales of therapeutic drugsfor use in practice. The electronic registration of thesales at the pharmacies is linked to the billing process,which ensures a high data quality regarding amountsand identity of drugs.The VetStat database contains detailed informationabout source and consumption for each prescriptionitem: date of sale, identity of prescribing veterinarian,source ID (identity of the pharmacy, feed mill, orveterinarian reporting), package identity code andamount, animal species, age-group, disease categoryand code for farm-identity (CHR - Danish CentralHusbandry Register). The package code is a uniqueidentifier, relating to all information on the medicine,such as active ingredient, content as number of unitdoses (e.g. number of tablets), package size, and codeof the antimicrobial agent in the Veterinary AnatomicalTherapeutic Chemical (ATCvet) classification system.Knowledge of the target animal species enables thepresentation of consumption data in Defined AnimalDaily Doses (ADD). The ADD system is a nationalveterinary equivalent to the international Defined DailyDoses (DDD) system applied in the human field [www.whocc.no]. See further about the ADD system in theDANMAP 2009 report.The consumption is compared with production inkg meat or number of animals produced. Due to anincreasing number of pigs exported around 30 kg,involving 25% of pigs produced in 2010, an adjustedmeasure of consumption per pig was calculated.The adjustment is based on the assumption that pigsexported at 30 kg, on average received the same amountof antimicrobial agents before export, as other pigs fromfarrowing to 30 kg:DANMAP 2010145
For the 2010 DANMAP report, the population andgeographical data were obtained from StatisticsDenmark (www.dst.dk) and the data on generalpractitioners from the Danish Medical Association(www.laeger.dk).In this report, the epidemiological unit for pigs,cattle and broilers was defined as the individual farm,meaning that only one isolate per bacterial speciesper farm was included in the report. For humans, theepidemiological unit was defined as the individualpatient and the first isolate per patient per year wasincluded. For food, the epidemiological unit wasdefined as the individual meat sample.
2.
Data on antimicrobial consumption
Antimicrobial agents used for humans and animals inDenmark are presented in Table 3.2.2.1.Antimicrobial consumption in animals
Since 2001, consumption data presented in this reportwere obtained from the national monitoring program,VetStat. Prior to 2001, data were based on overallsales figures from the pharmaceutical industry (TableAP1.0).In Denmark, all therapeutic drugs are prescription-only and VetStat collects data on all medicinesprescribed by veterinarians for use in animals. Inaddition, data on consumption of coccidiostatics asfeed additives (non-prescription) and antimicrobialgrowth promoters (no longer in use) are collected byVetStat. Data on coccidiostatics were reported until2004, but due to problems in data transfer data werenot reported in 2005 and 2006. Data on coccidiostaticsfor 2007–2010 will be presented in later reportsfollowing validation of data.Until 2007, antimicrobial agents could only bepurchased at the pharmacy or in medicated feed fromthe feed mills. In 2010, sales from feed mills comprisedalmost entirely prescriptions for aquaculture andsales of zinc chloride for the pig production. Thepharmacy either sells the medicines to veterinariansfor own use in practice or for re-sale to farmers, orsells the medicines directly to the animal holder onpresentation of a prescription. By law, the profit thatveterinarians may make on the sale of medicine is verysmall (5%), thereby limiting the economic incentiveto sell medicine. Hence, in 2010, only 10% of theantimicrobial agents used for animals were used ordistributed by veterinarians.
2.
APPENDIXAntimicrobial use per pig produced (adjusted)=(ADDs*(Nf/Nw)+ ADDw*(Nf/Nw) + ADDf) / Nf,where ADDs= Amounts of antimicrobial used in sowherds, measured in ADDkg; ADDw= Amounts ofantimicrobial used in weaning pigs herds, measuredin ADDkg; ADDf= Amounts of antimicrobial used infinisher pigs, measured in ADDkg; Nw= Number of pigsproduced to 30 kg bodyweight, including pigs exportedat 15-50 kg (mostly at 30 kg); Nf= Number of pigsproduced to slaughter, whether exported domesticallyor exported.2.2. Antimicrobial consumptionin humansConsumption data presented in this report wereobtained from the Danish Medicines Agency (DMA)(http://www.laegemiddelstyrelsen.dk). The DMA hasthe legal responsibility for monitoring the consumptionof all human medicinal products. This is carried out bymonthly reporting of consumption from all pharmaciesin Denmark, including hospital pharmacies, to theDMA. Data from the primary health care sector havebeen collected since 1994, whereas data on consumptionin hospitals are available from 1997.Certain categories of hospitals were excluded whenthe consumption was measured by occupied bed-daysand admissions. This year, data from private hospitalsand clinics, psychiatric hospitals, specialised non-acutecare clinics, rehabilitation centres and hospices wereexcluded from DANMAP (representing approximately3% of the antimicrobial consumption at hospitals and ofthe number of bed-days).In Denmark, all antimicrobial agents for human use areprescription-only medicines and are sold by pharmaciesin defined packages. Each package is uniquely identifiedby a code which can be related to package size, contentas number of unit doses (e.g. number of tablets), contentas number of Defined Daily Doses (DDD), code of theantimicrobial agent in the Anatomical TherapeuticChemical (ATC) classification system, and producer.In addition, the following information is collectedfor each transaction: social security number (CPRnumber) of the patient, code identifying the prescribingphysician, date and place (pharmacy, hospital pharmacy,institution) of the transaction, and informationregarding reimbursement of cost, if applicable.Information on the indication for the prescription is notyet available. The data are transferred monthly to theDMA in an electronic format.The present report includes data on the consumptionof antibacterial agents for systemic use, or group J01, ofthe 2010 update of the ATC classification, in primaryhealth care and in hospitals. As recommended by theWorld Health Organization (WHO), consumption ofantibacterial agents in primary health care is expressedas a number of DDDs per 1,000 inhabitants and per day(DDD/1,000 inhabitant-days). Consumption in primaryhealth care is also reported as a number of packages per1,000 inhabitants. Consumption of antibacterial agentsin hospitals is expressed as a number of DDDs per 1,000inhabitants and per day (DDD/1000 inhabitant-days)to compare with primary health care and as a numberof DDDs per 100 occupied bed-days and per day(DDD/100 occupied bed-days). Since antimicrobialconsumption expressed as DDD/100 occupied bed-days does not necessarily reflect changes in hospitalactivity and production, consumption in hospitals isalso presented as DDD/100 admitted patients.The number of occupied bed-days is calculated asthe date of discharge minus the date of admission(minimum one day), and the number of admissionsis calculated as one admission whenever a patientis admitted to one specific ward (one patient can beregistered as admitted multiple times if transferredbetween wards during one hospital stay). Data on thenumber of occupied bed-days (or patient-days) andnumber of admissions in each hospital were obtainedfrom the National Patient Registry at the NationalBoard of Health [http://www.sst.dk].
3.3.1.
Collection of bacterial isolatesAnimals
Animal isolates included in DANMAP 2010 fromhealthy production animals at slaughter, wereEscherichia coli, Enterococcus faecium, Enterococcusfaecalis, Campylobacter coliandCampylobacter jejuni.Isolates ofE. coliO149 andE. coliF5 (K99) werecollected from diagnostic submissions andSalmonellaisolates were collected from subclinical infections aswell as from cases of clinical salmonellosis.Campylobacter,indicatorE. coliand enterococci.Samples from healthy pigs, cattle and broilers werecollected at slaughter for the DANMAP programme bymeat inspection staff or company personnel and sentfor examination to the National Food Institute. Forbroilers, cloacal swab samples were collected weeklythroughout the year representing all broiler flocksin Denmark (approximately 400 samples per year).In Denmark, a farm consists typically of more than1 flock (2–12 flocks), and even though most of theflock samples were analysed only one isolate per farmof each bacterial species was finally included in theDANMAP report.For pigs and cattle, the slaughter plants included inthe DANMAP programme accounted for 94% and90%, respectively, of the total number of animalsslaughtered in Denmark during 2010. The number ofpig and cattle samples taken at the slaughter plant wasproportional to the number of animals slaughtered ateach plant per year and samples were collected oncea month from January through November as ceacumsamples from pigs and rectum samples from cattle.As for broilers, only one isolate per farm of eachbacterial species was included in the DANMAP report.Accordingly, the bacterial isolates may be regardedas representing a stratified random sample of therespective populations, and the observed prevalenceof resistant isolates provides an estimate of the trueoccurrence in the population.An overview of the number of samples analysed, the
146
DANMAP 2010
APPENDIXnumber of isolates obtained and the number of MIC-determinations for pigs, cattle and broilers is presentedin Table AP2.1. ForCampylobacter,the isolation rate ofC. jejunifrom pigs and ofC. colifrom cattle and broilerswas low and MIC-determinations were therefore notperformed. Samples from cattle were not analysed forenterococci.Isolates from diagnostic submissionswere collectedfor the DANMAP programme at both the NationalFood Institute and at the Laboratory of Swine Diseases,the Danish Agriculture & Food Council, Kjellerup.E.coliO149 from diarrhoeic pigs andE. coliF5 (K99)from diarrhoeic cattle were included, with no morethan one isolate representing each farm. However,E.coliF5(K99) was not reported in 2010 due to the lownumber of isolates available.Staphylococcus hyicusisolates from skin infections in pigs were also collected,but not reported in 2009 and 2010 due to the lownumber of isolates. Data onS. hyicuscollected overthree years are expected to be reported in the nextDANMAP report.Salmonella.The National Food Institute is the nationalreference laboratory forSalmonellain animals, feedingstuffs and food, and therefore receives all isolates fortyping. Among all serotypedSalmonellaisolates, oneisolate per farm was selected for the DANMAP report.Only isolates ofS.Typhimurium andS.Enteritidiswere included in DANMAP. In general, isolates ofS.Typhimurium include the monophasic variants withantigenic formulas S. 4,5,12:i:- and S. 4,12:i:-.The majority of theSalmonellaisolates from pigs(95% in 2010) originated from the DanishSalmonellasurveillance programmes: The results of a serologicalsurveillance at the slaughterhouses and in all breedingherds appointed risk herds to be further examinedby analysing pen-faecal samples: 1) finisher herds atlevel 2 and level 3 farms (i.e. farms with high levelofS.Typhimurium antibodies in three successivemonths in meat juice samples taken at slaughter), 2)related (supplying) sow herds, and finally 3) breedingand multiplier herds with high serum levels in threemonthly samples. In 2010, 1,089 pig herds wereappointed as risk herds from the sero-surveillance oneor more times andS.Typhimurium was isolated from434 of these herds (including the monophasic variants).In addition,Salmonellain samples from pig herdsinvestigated due to clinical disease (not necessarilysalmonellosis) were included (21 isolates in 2010).For broilers, all flocks were sampled before slaughteras part of theSalmonellasurveillance programme;this includes flocks intended for export. Samples werecollected 15-21 days before slaughter. Since 2008, anadditional AM (ante mortem)-testing of broiler flockswas introduced 7-10 days prior to slaughter. In 2010,3,773 broiler flocks were analysed of which 43 werepositive forSalmonella.Data are not presented in tablesdue to the low number of isolates in 2010.For cattle, a total of 144 different herds were examinedbased on clinical indication. A total of 26Salmonellawere isolated, including sevenS.Dublin and 18S.Typhimurium isolates (including the monophasicvariantsS.4,5,12:i:- andS.4,12:i:- with six and oneisolate, respectively).Further details on the sampling procedures in theSalmonellasurveillance programmes are described inthe Annual Report on Zoonoses in Denmark, 2010.3.2.Meat
2.
Campylobacter,indicatorE. coliand Enterococci.The meat isolates originated from meat samplescollected at wholesale and retail outlets by the RegionalVeterinary and Food Control Authorities (RFCA) inall regions of Denmark. The samples were collectedduring the course of routine inspection carried outby the authorities or on specific request from theDanish Veterinary and Food Administration (DVFA)for the DANMAP programme. The collected materialconsisted of both Danish and imported meat. IndicatorE. coliand enterococci were collected from beef, porkand poultry meat (118, 184 and 187 Danish samples;and 99, 175 and 226 imported samples, respectively).Campylobacterwere only collected from poultrymeat (72 Danish samples and 95 imported samples).The meat samples were collected according to theguidelines for microbiological examination of foodfrom the DVFA [Vejledning nr. 9613 af 20. Dec. 2002om offentlig mikrobiologisk kontrol af fødevarer]. Onlyone isolate per bacterial species per meat sample wasselected for DANMAP.
Table AP2. 1. Number of DANMAP samples, isolates and MIC-tests from healthy production animals atslaughter, DenmarkDANMAP 2010PigsNo. of samples analysed (1 per farm)No. of isolatesNo. of isolates MIC-tested/reportedNo. of samples analysed (1 per farm)No. of isolatesNo. of isolates MIC-tested/reportedNo. of samples analysed (no. of flocks)No. of farms representedNo. of isolates MIC-tested/reportedE. coli219199160133122106382153118E. faecium738136133---382169119E. faecalis738167157---382169112C. jejuni269-0216-9838216941C. coli269-103216-03821690
Cattle
Broilers
Note: Data in this table should not be used for reportation of prevalences of the bacterial species
DANMAP 2010
147
2.
APPENDIXSalmonella.TheSalmonellaisolates from Danish porkand beef originated from theSalmonellasurveillanceprogramme, comprising swab samples of pork and beefcarcasses taken at the slaughterhouses after cooling.In Danish pork, 22,485 pooled samples (each of fivecarcasses) were analysed in 2010, and an estimated1.2% of the pig carcasses wereSalmonellapositive. Inaddition, 223 single animals were tested in smallerslaughterhouses, where 1.8% of the pig carcasses wereSalmonellapositive. In Danish beef, 7,660 pooledsamples (each of five carcasses) were analysed in 2010,and an estimated 0.3% of the cattle carcasses wereSalmonellapositive. In addition, 162 single animalswere tested in the smaller slaughterhouses, and herenone of the cattle carcasses wereSalmonellapositive[Annual Report on Zoonoses in Denmark 2010]. Allisolates ofS.Typhimurium andS.Enteritidis from apositive batch of meat were included in this report.Salmonellaisolates from imported poultry meat andother imported fresh meats originated from a case-by-case risk assessment programme (Danish Veterinaryand Food Administration). For each tested batch ofmeat, 12 pooled samples (1–60 single samples) weretested forSalmonella.All isolates ofS.TyphimuriumandS.Enteritidis within one batch of meat wereincluded in this report. In 2010, 58 of 490 batches ofimported broiler meat, 56 of 592 batches of importedturkey meat, 40 of 296 batches of imported pork, andfour of 127 batches of imported beef wereSalmonellapositive. As the sampling is risk based, the findings arenot indicative of the prevalence at retail [Annual Reporton Zoonoses in Denmark 2010].Isolates ofS.Typhimurium include the monophasicvariants with antigenic formula 4,5,12:i:- and 4,12:i:-.3.3.Humansdetermination or confirmation as well as susceptibilitytesting and typing. Group A, B, C and G streptococcalisolates are referred to SSI on a voluntary basis.E. coli, Klebsiella pneumoniae, Pseudomonasaeruginosa,invasiveEnterococcus faeciumandinvasiveEnterococcus faecalis.Data were providedon all isolates recorded from either blood samples (E.coli, Klebsiella pneumoniae, Pseudomonas aeruginosa,E. faeciumandE. faecalis)or urine samples (E.coli,Klebsiella pneumoniae)submitted for susceptibilitytesting to the participating DCM at the followinghospitals: Rigshospitalet, Hvidovre, Herlev, Hillerød,Slagelse, Næstved, Roskilde, Odense, Esbjerg, Vejle,Herning, Aarhus, Viborg, and Aalborg.In 2010, no samples were collected from healthyhumans.
4.Isolation and identification ofbacteria4.1.Animals
Salmonella entericaserovars Typhimurium andEnteritidis andCampylobacter jejuni.Antimicrobialsusceptibility was performed on human faecalisolates submitted to Statens Serum Institut (SSI).Campylobacterisolates were submitted fromDepartments of Clinical Microbiology (DCM) coveringthree geographical regions: Northern Jutland, Funenand Roskilde/Køge. Information on travel history wasobtained for these patients.Salmonellaisolates weresubmitted from all DCM in Denmark. Exact figuresof the proportion tested and the sampling strategy forthe different species can be found in the correspondingchapters of this report.Staphylococcus aureus.All blood isolates were referredto theStaphylococcusreference laboratory at SSI on avoluntary basis. In November 2006, methicillin resistantS. aureus(MRSA) became a notifiable disease inDenmark and since then it has been mandatory to sendall MRSA isolates to the reference laboratory.InvasiveStreptococcus pneumoniae, Streptococcuspyogenes(group A streptococci), group B, C andG streptococci.Invasive pneumococcal disease is anotifiable disease in Denmark, and therefore all bloodand spinal fluid isolates nationwide are sent to SSI for
Salmonella.Examination of samples was done bynon-selective pre-enrichment of 25 g material in a1:10 dilution with buffered peptone water (BPW) andincubated 16-20 hours at 37�C. A plate with ModifiedSemi-solid Rappaport-Vassiliadis (MSRV) mediumwas inoculated with 0.1 ml of BPW deposited as 3drops. After incubation overnight at 41.5�C, materialfrom MSRV swarming zones were inoculated ontoBrilliant Green Agar. Overnight incubation at 37�Cwas followed by serotyping of suspect colonies by slideagglutination. For cattle samples, in addition 1.0 mlof the BPW suspension was incubated in 9 ml selenitecystine broth overnight at 41.5�C before inoculation onMSRV agar.Campylobacter.Samples from pigs and poultry wereexamined by direct inoculation on mCCD agar (Oxoid,Denmark) followed by incubation in micro-aerophilicatmosphere for 2-4 days at 41.5�C. For cattle, selectiveenrichment in Preston broth at a ratio of 1:10incubated in microaerophilic atmosphere for 24 h at41.5�C was performed followed by inoculation of 10 �lof the enrichment broth to mCCD agar.Campylobactersuspect colonies were verified by microscopy andoxidase activity (oxidase strips, Oxoid). Species-identification was performed by catalase activity andthe ability to hydrolyse indoxyl acetate and hippurate.All isolates ofC. jejuniandC. coliwere stored (-80�C).E. colifrom healthy animals (indicatorE. coli).Thematerial was inoculated directly onto Drigalski agar(SSI Diagnostica, Denmark) and incubated at 37�Covernight. Yellow colonies were inoculated onto BBLCHROMagar Orientation Medium (Becton Dickinson,Germany) and red colonies were identified asE. coliafter incubation at 37�C overnight.
148
DANMAP 2010
APPENDIXEnterococci.One drop of material suspended in 2 mlsodium chloride (0.9%) was spread on Slanetz-Bartleyagar and incubated for two days at 42�C. Up to fourcolonies with morphology typical ofE. faecalis/E.faeciumwere sub-cultivated on blood agar. Colonieswere identified by the following criteria: Colour,motility, arginine dihydrolase testing and the abilityto ferment mannitol, sorbitol, arabinose, raffinose andmelibiose. All isolates ofE. faeciumandE. faecaliswerestored (-80�C). Like in previous years, no samples fromcattle were investigated for enterococci.Pathogens.The diagnostic submissions wereexamined according to the standard procedures at theparticipating laboratories.4.2.Meatusing a species specific PCR assay [Klenaet al.2004, JClin Microbiol. 42: 5549-5557].Staphylococcus aureus.Sequencing of theS.aureusspecificspagene was used both for speciesconformation and typing purposes. Anyspanegativeisolates were confirmed asS. aureusby MALDI-TOF.The spa typing [Harmsenet al.2003. J Clin Microbiol.41: 5442-5448] and additional typing by multi locussequence typing (MLST) was performed [Enrightet al.2000. J Clin Microbiol. 38: 1008-1015] and annotatedusing eBURST v.3 software (www.mlst.net). Based onthespaand MLST typing, each isolate was assigned toa clonal complex (CC). For MRSA isolates, presenceof themecAmethicillin resistance gene was confirmedby PCR [Larsenet al.2008. Clin Microbiol Infect. 14:611-614].
2.
Salmonellawas isolated according to the guidelines formicrobiological examination of food from the DanishVeterinary and Food Administration [NMKL No. 187,2007]. Sero- and phage-typing was performed for allisolates at the National Food Institute.Campylobacterwas isolated according to the guidelinesfor microbiological examination of food from theDVFA [NMKL No. 119, 3rd ed., 2007]. Identificationwas performed at the Regional Veterinary and FoodControl Authorities (RFCA) by microscopy or test kitDRO150M (Oxoid), and oxidase activity (except forone of the laboratories), catalase activity, and the abilityto hydrolyse indoxyl acetate and hippurate. All isolatesofC. jejuni, C. coliandC. lariwere stored (-80�C) andsent to the National Food Institute for MIC-testing ofC.jejuniandC. coli.IndicatorE. coliwas isolated by adding 5 g of thesample to 45 ml of MacConkey- or laurylsulfphate-broth, which was incubated overnight at 44�C, andsubsequently streaked onto violet red bile agar andincubated for 24h at 44�C by RFCA. PresumptiveE. coliwere further identified by CHROMagar OrientationMedium (one laboratory) or by indole- and lactosetesting in laurylsulphate-broth culture incubatedovernight at 44�C.E. coliisolates were sent to theNational Food Institute for MIC-testing. All isolateswere stored (-80�C).Enterococciwere isolated by adding 5 g of the sampleto 45 ml of azide dextrose broth, which was incubatedovernight at 44�C and subsequently streaked ontoSlanetz-Bartley agar. After incubation at 44�C for 48hours, colonies typical ofE. faeciumandE. faecaliswerefurther identified by the following criteria: Colour ofmaterial, motility, arginine dihydrolase testing and theability to ferment mannitol, sorbitol, arabinose, raffinoseand melibiose. All isolates ofE. faeciumandE. faecaliswere stored (-80�C) and sent to the National FoodInstitute for MIC-testing.4.3.Humans
5.
Susceptibility testing
MIC-testingAntimicrobial susceptibility testing ofSalmonella,Campylobacter,indicatorE. coli, Enterococcusand the veterinary pathogens was performed asmicrobroth dilution MIC with the Sensititre system(Trek Diagnostic Systems Ltd., East Grinstead, UnitedKingdom). Inoculation and incubation procedures werein accordance with the CLSI guidelines. The followingquality control strains were used for internal control:Staphylococcus aureusATCC 29213,Escherichia coliATCC 25922,Pseudomonas aeruginosaATCC 27853,Enterococcus faecalisATCC 29212 andCampylobacterjejuniATCC 33560.Table AP2.2 presents an overview of the interpretationof MIC-values used for all combinations of bacteriaand antimicrobial agents. Since 2007, MIC-data wereinterpreted using EUCAST epidemiological cut-offvalues with a few exceptions as explained by footnotesin Table AP2.2. In addition, corresponding clinicalbreakpoints are also presented in Table AP2.2 andshown in all MIC-distributions in order to visualize theimpact of using epidemiological cut-off values contraclinical breakpoints. In most cases, data from previousyears presented in this DANMAP report are notcorrected for changes in interpretation (e.g. all data arepresented with use of the interpretation applied for theyear in question).All isolates from animals and meat were MIC-testedat the National Food Institute. TheSalmonellaandCampylobacterisolates of human origin were testedat SSI. From 1998–2007, a performance test forsusceptibility testing was carried out once a year toascertain the quality and comparability of susceptibilitytesting in the laboratories providing MIC-data. In2002, MIC-testing at the National Food Institute wasaccredited by DANAK (the Danish national bodyfor accreditation), and the SSI is awaiting the sameaccreditation. Both laboratories participate in Europeanring trials to ensure MIC-data of constantly highquality.
Salmonella.isolates were serotyped according to theKauffman-White Scheme.Campylobacter.Species identification was performed
DANMAP 2010
149
2.
APPENDIXTable AP2.2. EUCAST epidemiological cut-off values (blue fields) and corresponding clinical breakpoints usedas interpretation criteriae for MIC-determinationDANMAP 2010Antimicrobial agentAmpicillinApramycinAvilamycinCefotaximeCefoxitinCeftiofurChloramphenicolCiprofloxacinColistinErythromycinFlorfenicolGentamicinKanamycinLinezolidNalidixic acidNeomycinPenicillinQuinupristin/dalfopristinSalinomycinSpectinomycinStreptomycinSulfonamideTeicoplaninTetracyclineTiamulinTigecyclineTrimethoprimVancomycinSalmonellaEpidClincut-offbreakμg/mlμg/ml>8*>16>0.5*>2*>16*>0.06 *>2*>16*>2*>8*E. coliEpidClincut-offbreakμg/mlμg/ml>8*>16>0.25*>1*>16*>0.03*>2*>16*>2*>8*E. faeciumEpidClincut-offbreakμg/mlμg/ml>4*>16*>2*>8*E. faecalisEpidClincut-offbreakμg/mlμg/ml>4*>8*>8*C. jejuniEpidClincut-offbreakμg/mlμg/mlC. coliEpidClincut-offbreakμg/mlμg/ml
>2*
>16>1*>2*
>16>1*>2*
>32*>16 b)>4*>32*>1,024>4*
>16
>32*>8 b)>4*
>16
>16*>1*>4*>1*
>1*>4*
>16*>1*>16*>2*
>1*>16
>4>512>4*
>4
>4*
>4*
>16*>4*
>16
>16*>8*
>32*>512>1,024>4*>4*
>16>16*>4 a)>8>4*>4>512*>2*>8>0.5*>4*>2*>4*>2*>8>16*>8
>16*
>32*
>64>16*>256>8*
>256>8
>64*>16*>256>8*
>4>128*>256>8>2*>4*>0.25*>4*>4*
>2*
>4*
>2*
>8
>2*
>8
>2*
>4*
>2*
>0.25*>0.5*>4*>4*
* EUCAST epidemiological cut-off value or EUCAST clinical breakpoint. Clinical breakpoints defined by CLSI (unmarked) were listed if aclinical breakpoint was not defined by EUCASTa) The EUCAST epid. value of >1 was not applied according to investigations presented in DANMAP 2006 (trade name synercid)b) The EUCAST epid. value of >4 was not applied, since the purpose was to look for high level ciprofloxacin resistance as described byWerneret al.2010 (Int J Antimicob Agents. 35: 119-125)
One isolate per bacterial species per farm, per meatsample, or per patient was tested for antimicrobialsusceptibility. For animal isolates in excess numbers(typically for indicatorE. coli,enterococci andCampylobacterfrom healthy production animals), arandom selection of 100 to 150 isolates was appointedto MIC-testing. Due to low number of isolates,C. jejunifrom pigs,C. colifrom cattle,C. colifrom broilers, andS.hyicusfrom pigs (clinical cases) were not susceptibilitytested.Staphylococcus aureusfrom humansSusceptibility testing was performed by disc diffusionaccording to EUCAST methodology using discsfrom Oxoid (Ballerup, Denmark) on Mueller-HintonAgar (SSI, Copenhagen, Denmark). The followingantimicrobials were tested: Erythromycin, clindamycin,kanamycin, rifampicin, penicillin, cefoxitin, fusidic acid,norfloxacin, linezolid, tetracycline and mupirocin. In150
addition, MRSA isolates were screened for susceptibilitytowards glycopeptides by spot test on Brain-Heartinfusion (BHI) agar (Becton Dickinson, Germany)with teicoplanin (5 mg/L) and confirmed by Etest�(AB Biodisk, Solna, Sweden) on BHI with inoculum ofMcFarland 2.0. In case of MIC ≥ 8 mg/L for vancomycinand teicoplanin or an MIC ≥12 mg/L for teicoplanin,population analysis profile against vancomycinwas performed [Woottonet al.2001. J AntimicrobChemother. 47: 399-403].InvasiveStreptococcus pneumoniafrom humansScreening for penicillin-resistantS. pneumoniaewasperformed using a 1 μg oxacillin tablet (Neo-Sensitabs�,A/S Rosco, Taastrup, Denmark) on 10% horse bloodagar (SSI Diagnostika, Hillerød, Denmark), and forerythromycin-resistantS. pneumoniaeusing a 78μg erythromycin tablet (Neo-Sensitabs�, A/S Rosco,Taastrup, Denmark) on 10% horse blood agar (SSI
DANMAP 2010
APPENDIXDiagnostika). The breakpoints used are defined bythe CLSI. Penicillin and erythromycin MICs weredetermined using STP6F plate, Sensititre (TrekDiagnostic Systems Ltd., East Grinstead, UnitedKingdom) as recommended by the manufacturer. Thebreakpoints used are defined by EUCAST. Resistantisolates were defined as both fully and intermediaryresistant isolates.InvasiveStreptococcus pyogenes(group A), group B, Cand G streptococci from humansScreening for penicillin-resistant streptococci wasperformed using a 1 μg oxacillin disk (Oxoid, Greve,Denmark) on 10% horse blood agar (SSI Diagnostika,Hillerød, Denmark), and for erythromycin-resistantstreptococci using a 78 μg erythromycin tablet (Neo-Sensitabs�, A/S Rosco, Taastrup, Denmark) on 10%horse blood agar (SSI Diagnostika). Erythromycinresistant streptococci were tested with a 15 μgerythromycin disk (Oxoid) and a 2 μg clindamycindisk (Oxoid) on Mueller-Hinton Agar (Mueller-Hintonplate, 5% blood, 20 mg beta-NAD, SSI Diagnostika).Erythromycin MICs were determined using the Etest�(AB Biodisk, Solna, Sweden) on Mueller-Hintonincubated at 36�C, 5% CO2. The breakpoints used aredefined by the EUCAST. Resistant isolates were definedas both fully and intermediary resistant isolates.E. coli, K. pneumoniae, P. aeruginosa,invasiveE.faeciumandE. faecalisfrom humansIn 2010, the DCM at hospitals in Næstved, Odenseand Viborg, and Rigshospitalet, that is the nationalreferral hospital, used the tablet diffusion method(Neo-Sensitabs�, A/S Rosco) on Danish Blood Agar(Resistensplade, SSI Diagnostika) and the breakpointsdefined for this medium by A/S Rosco.However, the DCM at Odense Hospital used Neo-Sensitabs� on Mueller-Hinton agar (SSI Diagnostica)when testing urine isolates and Columbia agar with4.5% NaCl (SSI Diagnostika) when testing staphylococcifor oxacillin resistance. The DCM at Vejle Hospitalused the Neo-Sensitabs� on Mueller-Hinton agar (SSIDiagnostica) and the breakpoints defined for thismedium by A/S Rosco. The DCM at Esbjerg Hospitalused the tablet diffusion method (Neo-Sensitabs�, A/SRosco) on Mueller-Hinton agar (SSI Diagnostika)when testingE. coli.The DCM at Aalborg Hospitalused the Neo-Sensitabs� on Mueller-Hinton agar (SSIDiagnostika) in combination with the tablet diffusionmethod (A/S Rosco) and the breakpoints defined bythe Swedish Reference Group for Antibiotics (SRGA)(available from: URL: http://www.srga.org/). The onlyexception from SRGA was that the wild type populationofE. coliwas deemed susceptible for ampicillin insteadof intermediary susceptible.In 2010, the DCM at Hillerød and Hvidovre Hospitalsused the disk diffusion method (Oxoid, Basingstoke,UK) on Iso-Sensitest (ISA) medium (Oxoid). TheDCM at Slagelse Hospital used the same disks on Iso-Sensitest (ISA) medium with or without 5% horse blood(Oxoid) according to test material and bacterial species.Laboratories performing the disk diffusion methodused the breakpoints defined by the SRGA. In 2010, theDCM at Herlev, Herning and Aarhus Hospitals changedto methods described by EUCAST (DCM at Aarhusand Herning hospitals per February and May 2010,respectively).All submitting laboratories participate in national andinternational quality assurance collaborations suchas the United Kingdom National External QualityAssessment Schemes (NEQAS).Quinupristin/dalfopristin breakpointThe epidemiological cut-off value suggested by EUCASTfor quinupristin/dalfopristin when testingE. faeciumis >1 μg/ml. In DANMAP,E. faeciumisolates withMICs >4 μg/ml are reported resistant to quinupristin/dalfopristin due to an evaluation study presented in theDANMAP 2006 report, page 49-50.
2.
6.6.1.
Data handlingAnimal
The results from the primary examination of samplesfrom slaughterhouses and primary production for thebacteria of interest - positive as well as negative findings- and of the susceptibility testing were stored in anOracle Database 8i Enterprise Edition� at the NationalFood Institute. The susceptibility data were storedas continuous values (MIC) as well as categorised assusceptible or resistant, respectively, as defined by therelevant epidemiological cut-off value. Each isolate wasidentified by the bacterial species, including subtype asapplicable and by the date of sampling and the speciesof animal. Information on the farm of origin was alsorecorded. All handling and evaluation of results wascarried out using SAS�Software, SAS Enterprise Guide3.0.6.2.Meat
Results from the analysis of food samples were reportedvia the database administrated by the Danish Veterinaryand Food Administration, except for the data onSalmonella,which were reported to and extracted fromthe laboratory database at the National Food Institute.For each bacterial isolate, information was availableon the food type, bacterial species, date and place ofsampling, date of examination of the sample, countryof slaughter, the RFCA that collected and processedthe sample, and an identification number, which makesit possible to obtain further information about theisolate from the Authority. Furthermore, more detailedinformation about the country of origin was recordedwhenever possible.6.3.Human
SalmonellaandCampylobacter.Data onSalmonellaandCampylobacterinfections are stored in theDanish Registry of Enteric Pathogens (SQL database)maintained by SSI. This register includes only oneisolate per patient within a window of six months and
DANMAP 2010
151
2.
APPENDIXincludes data on susceptibility testing of gastrointestinalpathogens.Staphylococcus aureus.For MRSA, data on thecharacteristics of the isolates and the clinical/epidemiological information were obtained from theDanish MRSA register at SSI (mandatory reportable).In this database, patients were only registered the firsttime they were diagnosed with MRSA regardless ofwhether it was colonisation or infection. Based on thereported information, MRSA cases were classified ascolonisation/active screening (i.e. surveillance samplesto detect nasal, throat, gut or skin colonisation),imported infection (i.e. acquired outside Denmark),infection acquired in a Danish hospital, defined asdiagnosed >48 hours after hospitalisation with no signof infection at admittance (HA-MRSA) or infectiondiagnosed outside hospitals (community onset).MRSA cases with community onset were furtherclassified according to risk factors during the previous12 months as either health-care associated withcommunity onset (HACO) or community-acquired(CA). Health-care associated risk factors includedprior hospitalisations or stay in long-term care facilitieswithin 12 months prior to MRSA isolation and being ahealth-care worker. Community risk factors includedknown MRSA positive household members or otherclose contacts. Non-Danish origin defined as the personor one of the parents being born outside Denmark wasinvestigated through the Danish Civil Registry.Streptococcus pneumoniae, Streptococcus pyogenes(group A streptococci), group B, C and Gstreptococci.Data on susceptibility testing of isolateswere stored as MICs in a Microsoft� Access databaseplaced at a SQL server at SSI. Analysis includingselection of isolates from blood and spinal fluid samplesand removal of duplicate isolates was performed inMicrosoft� Access.E. coli, K. pneumoniae, P. aeruginosa,invasiveE.faeciumand invasiveE. faecalis.Fourteen DCMprovided data on resistance levels inE. coli, Klebsiellapneumoniae, Pseudomonas aeruginosa,invasiveE.faeciumand invasiveE. faecalisisolates. Data wereextracted from the following laboratory informationsystems:- ADBakt (Autonik AB, Skoldinge, Sweden) for theDCM at Hvidovre, Herlev and Aalborg Hospitals.- MADS (DCM, Skejby Hospital, Aarhus, Denmark)for the DCM at Rigshospitalet and Slagelse, Næstved,Roskilde, Odense, Esbjerg, Vejle, Herning, Aarhus(Skejby) and Viborg Hospitals.- SafirLIS Microbiology (Profdoc Lab AB, Borlänge,Sweden) for the DCM at Hillerød Hospital.Resistance data on the first isolate per patient per yearwere included. Generally, resistance data were excludedif susceptibility to a certain antimicrobial agent wastested on only a selected number of isolates.
7.
Calculation of confidence limits
Estimation of exact 95% (two-sided) confidenceintervals for proportions were based on binomialprobability distributions as described in Armitage &Berry [Statistical Methods in Medical Research, 4thed. 2001, Oxford: Blackwell Scientific Publications].Significance tests of differences between proportions ofresistant isolates were calculated using SAS�Software,SAS Enterprise Guide 3.0 or StatCalc in EpiInfo™ v. 6.In the text, significant differences imply statisticallysignificant differences where p<0.05 using Chi-square,or Fisher’s Exact Test when the number of samples islow (<25).Anne Mette Seyfarth (animal and meat data)and Line Skjøt-Rasmussen (human data)
152
DANMAP 2010
APPENDIX
3
DANMAP 2010
153
3.
APPENDIX
Danmap Publications 2010Aarestrup FM, Cavaco L, Hasman H. Decreasedsusceptibility to zinc chloride is associated withmethicillin resistantStaphylococcus aureusCC398in Danish swine. Vet Microbiol. 2010 May 19;142(3-4):455-7.Aarestrup FM, Hasman H, Veldman K, Mevius D.Evaluation of eight different cephalosporins fordetection of cephalosporin resistance inSalmonellaentericaandEscherichia coli.Microb Drug Resist. 2010Dec;16(4):253-61.Aarestrup FM, Jensen VF, Emborg HD, Jacobsen E,Wegener HC. Changes in the use of antimicrobials andthe effects on productivity of swine farms in Denmark.Am J Vet Res. 2010 Jul;71(7):726-33.Aarestrup FM, Skov RL. Evaluation of ceftiofur andcefquinome for phenotypic detection of methicillinresistance inStaphylococcus aureususing disk diffusiontesting and MIC-determinations. Vet Microbiol. 2010Jan 6;140(1-2):176-9.Adriaenssens N, Coenen S, Muller A, VankerckhovenV, Goossens H; ESAC Project Group. EuropeanSurveillance of Antimicrobial Consumption (ESAC):outpatient systemic antimycotic and antifungal use inEurope. J Antimicrob Chemother. 2010 Apr;65(4):769-74.Battisti A, Franco A, Merialdi G, HasmanH, Iurescia M, Lorenzetti R, Feltrin F, Zini M,Aarestrup FM. Heterogeneity among methicillin-resistantStaphylococcus aureusfrom Italian pigfinishing holdings. Vet Microbiol. 2010 May 19;142(3-4):361-6.Böcher S, Middendorf B, Westh H, Mellmann A,Becker K, Skov R, Friedrich AW. Semi-selectivebroth improves screening for methicillin-resistantStaphylococcus aureus.J Antimicrob Chemother. 2010Apr;65(4):717-20.Böcher S, Skov RL, Knudsen MA, Guardabassi L,Mølbak K, Schouenborg P, Sørum M, Westh H. Thesearch and destroy strategy prevents spread and long-term carriage of methicillin-resistantStaphylococcusaureus:results from the follow-up screening of alarge ST22 (E-MRSA 15) outbreak in Denmark. ClinMicrobiol Infect. 2010 Sep;16(9):1427-34.Brinch KS, Tulkens PM, Van Bambeke F, Frimodt-Møller N, Høiby N, Kristensen HH. Intracellularactivity of the peptide antibiotic NZ2114: studies withStaphylococcus aureusand human THP-1 monocytes,and comparison with daptomycin and vancomycin. JAntimicrob Chemother. 2010 Aug;65(8):1720-4.Cavaco LM, Hasman H, Stegger M, Andersen PS,Skov R, Fluit AC, Ito T, Aarestrup FM. Cloning andoccurrence ofczrC,a gene conferring cadmium andzinc resistance in methicillin-resistantStaphylococcusaureusCC398 isolates. Antimicrob Agents Chemother.2010 Sep;54(9):3605-8.EURL-AR 2010. Status Report for the European UnionReference Laboratory on Antimicrobial Resistance.Technical report 2010.Fashae K, Ogunsola F, Aarestrup FM, Hendriksen RS.Antimicrobial susceptibility and serovars ofSalmonellafrom chickens and humans in Ibadan, Nigeria. J InfectDev Ctries. 2010 Sep 3;4(8):484-94.Grundmann H, Aanensen DM, van den WijngaardCC, Spratt BG, Harmsen D, Friedrich AW; EuropeanStaphylococcal Reference Laboratory Working Group.Geographic distribution ofStaphylococcus aureuscausing invasive infections in Europe: a molecular-epidemiological analysis. PLoS Med. 2010 Jan12;7(1):e1000215.Grundmann H, Livermore DM, Giske CG, Canton R,Rossolini GM, Campos J, Vatopoulos A, GniadkowskiM, Toth A, Pfeifer Y, Jarlier V, Carmeli Y; CNSEWorking Group. Carbapenem-non-susceptibleEnterobacteriaceaein Europe: conclusions from ameeting of national experts. Euro Surveill. 2010 Nov18;15(46). pii: 19711.Guardabassi L, Larsen J, Skov R, Schønheyder HC.Gentamicin-resistantEnterococcus faecalissequencetype 6 with reduced penicillin susceptibility: diagnosticand therapeutic implications. J Clin Microbiol. 2010Oct;48(10):3820-1.Hammerum AM, Hansen F, Lester CH, Jensen KT,Hansen DS, Dessau RB. Detection of the first twoKlebsiella pneumoniaeisolates with sequence type 258producing KPC-2 carbapenemase in Denmark. Int JAntimicrob Agents. 2010 Jun;35(6):610-2.Hammerum AM, Lester CH, Heuer OE. Antimicrobial-resistant enterococci in animals and meat: a humanhealth hazard? Foodborne Pathog Dis. 2010Oct;7(10):1137-46.Hammerum AM, Toleman MA, Hansen F, KristensenB, Lester CH, Walsh TR, Fuursted K. Global spread ofNew Delhi metallo-β-lactamase 1. Lancet Infect Dis.2010 Dec;10(12):829-30.Hartmeyer GN, Gahrn-Hansen B, Skov RL, KolmosHJ. Pig-associated methicillin-resistantStaphylococcusaureus:family transmission and severe pneumonia in anewborn. Scand J Infect Dis. 2010 Apr;42(4):318-20.
154
DANMAP 2010
APPENDIX
3.
Hasman H, Moodley A, Guardabassi L, Stegger M,Skov RL, Aarestrup FM.Spatype distribution inStaphylococcus aureusoriginating from pigs, cattle andpoultry. Vet Microbiol. 2010 Mar 24;141(3-4):326-31.Jakobsen L, Hammerum AM, Frimodt-MøllerN. Detection of clonal group AEscherichia coliisolates from broiler chickens, broiler chicken meat,community-dwelling humans, and urinary tractinfection (UTI) patients and their virulence in amouse UTI model. Appl Environ Microbiol. 2010Dec;76(24):8281-4.Jakobsen L, Hammerum AM, Frimodt-Møller N.Virulence ofEscherichia coliB2 isolates from meat andanimals in a murine model of ascending urinary tractinfection (UTI): evidence that UTI is a zoonosis. J ClinMicrobiol. 2010 Aug;48(8):2978-80.Jakobsen L, Kurbasic A, Skjøt-Rasmussen L, EjrnaesK, Porsbo LJ, Pedersen K, Jensen LB, Emborg HD,Agersø Y, Olsen KE, Aarestrup FM, Frimodt-MøllerN, Hammerum AM.Escherichia coliisolates frombroiler chicken meat, broiler chickens, pork, andpigs share phylogroups and antimicrobial resistancewith community-dwelling humans and patients withurinary tract infection. Foodborne Pathog Dis. 2010May;7(5):537-47.Jakobsen L, Spangholm DJ, Pedersen K, Jensen LB,Emborg HD, Agersø Y, Aarestrup FM, HammerumAM, Frimodt-Møller N. Broiler chickens, broilerchicken meat, pigs and pork as sources of ExPECrelated virulence genes and resistance inEscherichiacoliisolates from community-dwelling humans andUTI patients. Int J Food Microbiol. 2010 Aug 15;142(1-2):264-72.Jensen LB, Garcia-Migura L, Valenzuela AJ, Løhr M,Hasman H, Aarestrup FM. A classification system forplasmids from enterococci and other Gram-positivebacteria. J Microbiol Methods. 2010 Jan;80(1):25-43.Jensen US, Knudsen JD, Ostergaard C, Gradel KO,Frimodt-Møller N, Schønheyder HC. Recurrentbacteraemia: A 10-year regional population-basedstudy of clinical and microbiological risk factors. JInfect. 2010 Mar;60(3):191-9.Jensen US, Muller A, Brandt CT, Frimodt-MøllerN, Hammerum AM, Monnet DL; DANRES studygroup. Effect of generics on price and consumption ofciprofloxacin in primary healthcare: the relationship toincreasing resistance. J Antimicrob Chemother. 2010Jun;65(6):1286-91.Jensen VF, Enøe C, Wachmann H, Nielsen EO.Antimicrobial use in Danish pig herds with and withoutpostweaning multisystemic wasting syndrome. Prev VetMed. 2010 Jul 1;95(3-4):239-47.
Karczmarczyk M, Martins M, McCusker M, MattarS, Amaral L, Leonard N, Aarestrup FM, FanningS. Characterization of antimicrobial resistance inSalmonella entericafood and animal isolates fromColombia: identification of aqnrB19-mediatedquinolone resistance marker in two novel serovars.FEMS Microbiol Lett. 2010 Dec;313(1):10-9.Köck R, Becker K, Cookson B, van Gemert-PijnenJE, Harbarth S, Kluytmans J, Mielke M, Peters G,Skov RL, Struelens MJ, Tacconelli E, Navarro TornéA, Witte W, Friedrich AW. Methicillin-resistantStaphylococcus aureus(MRSA): burden of disease andcontrol challenges in Europe. Euro Surveill. 2010 Oct14;15(41):19688.Lambertsen LM, Harboe ZB, Konradsen HB,Christensen JJ, Hammerum AM. Non-invasiveerythromycin-resistant pneumococcal isolates are moreoften non-susceptible to more antimicrobial agentsthan invasive isolates. Int J Antimicrob Agents. 2010Jan;35(1):72-5.Larsen J, Schønheyder HC, Lester CH, Olsen SS,Porsbo LJ, Garcia-Migura L, Jensen LB, Bisgaard M,Hammerum AM. Porcine-origin gentamicin-resistantEnterococcus faecalisin humans, Denmark. EmergInfect Dis. 2010 Apr;16(4):682-4.Lester CH, Hammerum AM. Transfer of vanA fromanEnterococcus faeciumisolate of chicken originto a CC17E. faeciumisolate in the intestine ofcephalosporin-treated mice. J Antimicrob Chemother.2010 Jul;65(7):1534-6.Lester CH, Olsen SS, Schønheyder HC, Hansen DS,Tvede M, Holm A, Arpi M, Friis-Møller A, Jensen KT,Kemp M, Hammerum AM. Typing of vancomycin-resistant enterococci obtained from patients at Danishhospitals and detection of a genomic island specific toCC17Enterococcus faecium.Int J Antimicrob Agents.2010 Mar;35(3):312-4.Literak I, Dolejska M, Radimersky T, Klimes J,Friedman M, Aarestrup FM, Hasman H, Cizek A.Antimicrobial-resistant faecalEscherichia coliin wildmammals in central Europe: multiresistantEscherichiacoliproducing extended-spectrum beta-lactamases inwild boars. J Appl Microbiol. 2010 May;108(5):1702-11.Litrup E, Christensen H, Nordentoft S, NielsenEM, Davies RH, Helmuth R, Bisgaard M. Use ofmultiple-locus variable-number tandem-repeatsanalysis (MLVA) typing to characterizeSalmonellaTyphimuriumDT41 broiler breeder infections. J ApplMicrobiol. 2010 Dec;109(6):2032-8.Nielsen KL, Hammerum AM, Lambertsen LM, LesterCH, Arpi M, Knudsen JD, Stegger M, Tolker-NielsenT, Frimodt-Møller N. Characterization and transferstudies of macrolide resistance genes inStreptococcuspneumoniaefrom Denmark. Scand J Infect Dis. 2010Aug;42(8):586-93.
DANMAP 2010
155
3.
APPENDIXOlsen CA, Ziegler HL, Nielsen HM, Frimodt-Møller N,Jaroszewski JW, Franzyk H. Antimicrobial, hemolytic,and cytotoxic activities of beta-peptoid-peptide hybridoligomers: improved properties compared to naturalAMPs. Chembiochem. 2010 Jul 5;11(10):1356-60.Rasmussen AK, Skov RL, Venezia RA, Johnson JK,Stender H. Evaluation of mupA EVIGENE assay fordetermination of high-level mupirocin resistanceinStaphylococcus aureus.J Clin Microbiol. 2010Nov;48(11):4253-5.Rosvoll TC, Pedersen T, Sletvold H, Johnsen PJ, SollidJE, Simonsen GS, Jensen LB, Nielsen KM, SundsfjordA. PCR-based plasmid typing inEnterococcus faeciumstrains reveals widely distributed pRE25-, pRUM-,pIP501- and pHTbeta-related replicons associatedwith glycopeptide resistance and stabilizing toxin-antitoxin systems. FEMS Immunol Med Microbiol. 2010Mar;58(2):254-68.Sandberg A, Jensen KS, Baudoux P, Van Bambeke F,Tulkens PM, Frimodt-Møller N. Intra- and extracellularactivity of linezolid againstStaphylococcus aureusin vivoandin vitro.J Antimicrob Chemother. 2010May;65(5):962-73.Sandberg A, Jensen KS, Baudoux P, Van Bambeke F,Tulkens PM, Frimodt-Møller N. Intra- and extracellularactivities of dicloxacillin againstStaphylococcus aureusin vivoandin vitro.Antimicrob Agents Chemother.2010 Jun;54(6):2391-400.Sirichote P, Bangtrakulnonth A, Tianmanee K,Unahalekhaka A, Oulai A, ChittaphithakchaiP, Kheowrod W, Hendriksen RS. Serotypes andantimicrobial resistance ofSalmonella entericassp incentral Thailand, 2001-2006. Southeast Asian J TropMed Public Health. 2010 Nov;41(6):1405-15.Sirichote P, Hasman H, Pulsrikarn C, SchønheyderHC, Samulioniené J, Pornruangmong S,Bangtrakulnonth A, Aarestrup FM, Hendriksen RS.Molecular characterization of extended-spectrumcephalosporinase-producingSalmonella entericaserovarCholeraesuis isolates from patients in Thailand andDenmark. J Clin Microbiol. 2010 Mar;48(3):883-8.Stegger M, Lindsay JA, Sørum M, Gould KA, SkovR. Genetic diversity in CC398 methicillin-resistantStaphylococcus aureusisolates of different geographicalorigin. Clin Microbiol Infect. 2010 Jul;16(7):1017-9.Struelens MJ, Monnet DL, Magiorakos AP, SantosO’Connor F, Giesecke J; European NDM-1 SurveyParticipants. New Delhi metallo-beta-lactamase1-producingEnterobacteriaceae:emergence andresponse in Europe. Euro Surveill. 2010 Nov 18;15(46).pii: 19716.Targant H, Doublet B, Aarestrup FM, Cloeckaert A,Madec JY. IS6100-mediated genetic rearrangementwithin the complex class 1 integron In104 of theSalmonellagenomic island 1. J Antimicrob Chemother.2010 Jul;65(7):1543-5.Vaara M, Siikanen O, Apajalahti J, Fox J, Frimodt-Møller N, He H, Poudyal A, Li J, Nation RL, Vaara T.A novel polymyxin derivative that lacks the fatty acidtail and carries only three positive charges has strongsynergism with agents excluded by the intact outermembrane. Antimicrob Agents Chemother. 2010Aug;54(8):3341-6.Vaara M, Siikanen O, Apajalahti J, Frimodt-Møller N,Vaara T. Susceptibility of carbapenemase-producingstrains ofKlebsiella pneumoniaeandEscherichia colito the direct antibacterial activity of NAB739 and tothe synergistic activity of NAB7061 with rifampicinand clarithromycin. J Antimicrob Chemother. 2010May;65(5):942-5.Vandenberg O, Nyarukweba DZ, Ndeba PM,Hendriksen RS, Barzilay EJ, Schirvel C, BisimwaBB, Collard JM, Aidara Kane A, Aarestrup FM.Microbiologic and clinical features ofSalmonellaspecies isolated from bacteremic children in easternDemocratic Republic of Congo. Pediatr Infect Dis J.2010 Jun;29(6):504-10.Vigre H, Dohoo IR, Stryhn H, Jensen VF. Use ofregister data to assess the association between useof antimicrobials and outbreak of PostweaningMultisystemic Wasting Syndrome (PMWS) in Danishpig herds. Prev Vet Med. 2010 Feb 1;93(2-3):98-109.Vingsbo Lundberg C, Vaara T, Frimodt-Møller N, VaaraM. Novel polymyxin derivatives are effective in treatingexperimentalEscherichia coliperitoneal infection inmice. J Antimicrob Chemother. 2010 May;65(5):981-5.Wu S, Dalsgaard A, Hammerum AM, Porsbo LJ,Jensen LB. Prevalence and characterization ofplasmids carrying sulfonamide resistance genes amongEscherichia colifrom pigs, pig carcasses and human.Acta Vet Scand. 2010 Jul 30;52:47.
156
DANMAP 2010
DANMAP 2010
