Sundhedsudvalget 2010-11 (1. samling), Udvalget for Fødevarer, Landbrug og Fiskeri 2010-11 (1. samling)
SUU Alm.del Bilag 16, FLF Alm.del Bilag 14
Offentligt
DANMAP 2009
DANMAP2009DANMAP 2009 - Use of antimicrobial agents andoccurrence of antimicrobial resistance in bacteriafrom food animals, foods and humans in Denmark
Statens Serum InstitutDanish Veterinary and Food AdministrationDanish Medicines AgencyNational Veterinary Institute, Technical University of DenmarkNational Food Institute, Technical University of Denmark
Editors:Vibeke Frøkjær JensenNational Food Institute,Technical University of DenmarkMørkhøj Bygade 19DK - 2860 SøborgAnette M. HammerumDepartment of Microbiological Surveillance andResearchStatens Serum InstitutArtillerivej 5DK - 2300 CopenhagenCo-editors:Statens Serum Institut:Line Skjøt-RasmussenNational Food Institute,Technical University of Denmark:Yvonne AgersøDANMAP board:National Food Institute,Technical University of Denmark:Frank M. AarestrupVibeke Frøkjær JensenYvonne AgersøNational Veterinary Institute,Technical University of Denmark:Flemming BagerStatens Serum Institut:Niels Frimodt-MøllerAnette M. HammerumRobert SkovDanish Medicines Agency:Jan PoulsenLayout:Susanne CarlssonNational Food InstitutePrinting: Rosendahls-Schultz Grafisk A/SDANMAP 2009 - September 2010ISSN 1600-2032Text and tables may be cited and reprinted onlywith reference to this report:DANMAP 2009. Use of antimicrobial agentsand occurrence of antimicrobial resistance inbacteria from food animals, foods and humansin Denmark. ISSN 1600-2032Reprints can be ordered from:National Food InstituteTechnical University of DenmarkDanish Zoonosis CentreMørkhøj Bygade 19DK - 2860 SøborgPhone: +45 35 88 - 7000Fax:+45 35 88 - 7001E. mail: [email protected]The report is also available fromhttp://www.danmap.orgThis report is issued by DANMAP - The DanishIntegrated Antimicrobial Resistance Monitoringand Research Programme. It presents theresults of monitoring of antimicrobial use andantimicrobial resistance in food animals, foodsand humans in 2009. The report is producedin collaboration between the National FoodInstitute, Technical University of Denmark,the National Veterinary Institute, TechnicalUniversity of Denmark, the Danish Veterinaryand Food Administration, the Danish MedicinesAgency and Statens Serum Institut. TheDANMAP programme is funded jointly by theMinistry of Science, Technology and Innovationand the Ministry of Health and Prevention.
DANMAP2009DANMAP 2009 - Use of antimicrobial agentsand occurrence of antimicrobial resistance inbacteria from food animals, foods andhumans in Denmark
ContentsContributors to the 2009 DANMAP ReportIntroductionAcknowledgementsList of abbreviationsSammendragSummaryFocus areaExtended spectrum beta-lactamase (ESBL) producing bacteria inDanish pigs, Danish and imported retail meat and human patients1968891115
Demographic dataAntimicrobial consumption in animals
2225
-Antimicrobial consumption in pigs- Antimicrobial consumption in cattle- Antimicrobial consumption in poultry- Antimicrobial consumption in fur animals, aquaculture and pet animals
27303235
Antimicrobial consumption in humans
-Antimicrobial consumption in Primary health care- Antimicrobial consumption in Hospitals
41
4451
Resistance in zoonostic bacteria-Salmonella-Campylobacter
58
5864
Resistance in indicator bacteria- Enterococci-Escherichia coli
67
6771
Resistance in human clinical bacteria-Escherichia coli-Klebsiella pneumoniae-Pseudomonas aeruginosa-Streptococcus- Enterococci-Staphylococcus aureus
76
767981828485
Resistance in diagnostic submissions from animals
92
Textboxes1. The assignment of the National Defined Daily Doses for animals (ADD)2. Antimicrobial resistance and antimicrobial consumption in conventional andalternative pig production systems3. Female patients in primary health care consume more antimicrobial agentsthan male patients4. European report on antimicrobial resistance in zoonotic and indicator bacteriafrom animals and food5. Possible association between usage of zinc compounds in pig production andemergence of methicillin resistantStaphylococcus aureusCC398 in pigs6. Surveillance ofClostridium difficile0277. Prevalence of methicillin resistantStaphylococcus aureus(MRSA) amongDanish pigs at slaughter and in meat at retail.36
38
54
74
899091
Appendix 1
- Antimicrobial consumption in animals- Antimicrobial consumption in humans- Salmonella-Campylobacter- Enterococci- IndicatorEscherichia coli
9598100108110118
95
Appendix 2Appendix 3
Materials and methods
123132
123
DANMAP publications
132
76
DANMAP 2009
Authors of DANMAP 2009Vibeke Frøkjær JensenLars Stehr LarsenAnne Mette SeyfarthYvonne AgersøLars Bogø JensenTina StruvePia ChristiansenNational Food InstituteTechnical University of DenmarkMørkhøj Bygade 19DK-2860 SøborgDENMARKUlrich Stab JensenStefan Schytte OlsenCamilla Hagemann LesterAnette M. HammerumLine Skjøt-RasmussenAndreas PetersenLotte Munch LambertsenRobert L. SkovNiels Frimodt-MøllerStatens Serum InstitutArtillerivej 5DK-2300 Copenhagen SDENMARK
The following persons were involved in providing data for the report:National Food Institute,Technical University of Denmark:Frank Møller AarestrupHenrik HasmanThe staff in the Zoonosis LaboratoryNational Veterinary Institute,Technical University of Denmark:Anita Fogh HansenAnnie Rosendahl MøllerCharlotte ChristensenDorte JensenErik JacobsenEva Haarup SørensenSteen NordentoftStatens Serum Institut:Asger Kjærgaard MortensenEva Møller NielsenIda-Maj IversenIngrid B. JensenJeppe Nørgaard RasmussenJulie Hindsberg NielsenKatharina E. P. OlsenLone Ryste HansenMarit SørumMette MallingMia TorpdalSteen EthelbergSteen HoffmannStine Frese-MadsenSøren A. UldumTune Øst-JacobsenDanish Medicines Agency:Anna S.T. NielsenJan PoulsenKarin HovgaardMaja LaursenSøren Ilsøe-KristensenDanish National Board of Health:Erik Villadsen
This DANMAP report is also available at www.danmap.orgA similar report from Norway is available at www.vetinst.noA similar report from Sweden is available at www.sva.se (SWARM, Veterinary) and at www.strama.se (SWEDRES, Human)
DANMAP 2009
7
DANRES - Danish Study Group for Antimicrobial Resistance Surveillance(provides data from the Departments of Clinical Microbiology in Denmark)KMA,Skejby Hospital:
KMA, Hvidovre Hospital:Alice Friis-MøllerElly KristensenHenrik WesthJenny Dahl KnudsenKristian SchønningPia LittauerKMA, Rigshospitalet:Anna Marie AastrupMaria Kristin BjõrnsdottirMichael TvedeLeif P. AndersenKMA, Herlev Hospital:Christian Østergaard AndersenHanne Wiese HallbergMagnus ArpiKMA, Hillerød Hospital:Dennis Schrøder HansenLisbeth NielsenKMA, Slagelse Hospital:Bent RøderKMA, Næstved Hospital:Ole HeltbergRam DessauKMA, Odense University Hospital:Anette HolmBente Gahrn-HansenThøger Gorm JensenKMA, Esbjerg Hospital:Kjeld Truberg JensenKMA,Vejle Hospital:
Brian KristensenJens K. MøllerKurt FuurstedSvend Ellermann-EriksenKMA,Viborg Hospital:
Birgitte TønningJørgen PragMarianne K. Thomsen
KMA,Aalborg Hospital:
Henrik C. SchønheyderLena MortensenTove Højbjerg
KMA,Statens Serum Institut:
Jens Jørgen ChristensenMichael Kemp
Department of Clinical Biochemistry,
Roskilde Hospital:Inge Kolle
Per Schouenborg
Ulrik Stenz JustesenKMA,Herning Hospital:
Helga SchumacherMarianne Hedegaard Søndergård
98
DANMAP 2009
IntroductionThis report, DANMAP 2009, describes the annualconsumption of antimicrobial agents and the occur-rence of resistance in different reservoirs. This yearsreport starts with a focus area on ESBL-producingbacteria in pigs, retail meat and human patients.MIC tables and some trend figures are presented inAppendix 1. In addition to the monitoring of antimi-crobial resistance and consumption of antimicrobialagents, includes considerable research activities isassociated with the DANMAP programme. A few se-lected research projects are presented as textboxes.Appendix 3 provides a more comprehensive list ofDANMAP publications in the international scientificliterature.The Danish Integrated Antimicrobial ResistanceMonitoring and Research Programme, DANMAP,was established in 1995 on the initiative of the Dan-ish Ministry of Health and the Danish Ministry ofFood, Agriculture and Fisheries, as a coordinatednational surveillance and research programme forantimicrobial consumption and antimicrobial resist-ance in bacteria from animals, food and humans.The participants in the programme are StatensSerum Institut, the National Veterinary Institute DTU,the National Food Institute DTU, and the DanishMedicines Agency.The objectives of DANMAP are:••To monitor the consumption of antimicrobial agentsfor food animals and humansTo monitor the occurrence of antimicrobialresistance in bacteria isolated from food animals,food of animal origin and humansTo study associations between antimicrobialconsumption and antimicrobial resistanceTo identify routes of transmission and areas forfurther research studies
••
The monitoring of antimicrobial resistance is basedon three categories of bacteria: human and animalpathogens, zoonotic bacteria and indicator bacteria.Human and animal pathogens are included becausethese cause infections and they primarily reflect re-sistance caused by use of antimicrobial agents in therespective reservoirs. Zoonotic bacteria are includedbecause they can develop resistance in the animalreservoir, which may subsequently compromisetreatment effect when causing infection in humans.Indicator bacteria are included due to their ubiqui-tous nature in animals, foods and humans and theirability to readily develop antimicrobial resistance inresponse to selective pressure in both reservoirs.
AcknowledgementsThe National Veterinary Institute, Technical Universi-ty of Denmark and the National Food Institute, Tech-nical University of Denmark would like to thank themeat inspection staff and the company personnel atthe slaughter houses for collecting samples from ani-mals at slaughter. Without their careful recording ofthe animals’ farm of origin the results would be lessuseful. We are grateful to the Laboratory of SwineDiseases, Danish Meat Association at Kjellerup formaking isolates of animal pathogens available to theprogramme. The National Veterinary Institute DTUand the National Food Institute DTU would like tothank the Danish Medicines Agency for collectingand transmitting data on veterinary consumptionof antimicrobial agents from the pharmacies. TheNational Veterinary Institute, Technical University ofDenmark and the National Food Institute, TechnicalUniversity of Denmark would also like to acknow-ledge the staff of the Regional Veterinary and FoodControl Authorities for collection of food samples andisolation of bacteria.Statens Serum Institut would like to thank the DanishMedicines Agency for providing data on consumptionof antimicrobials in humans, and the clinical micro-biology laboratories in the DANRES group - DanishStudy Group for Antimicrobial Resistance Surveil-lance - for providing data on resistance in bacteriafrom human clinical samples.
DANMAP 2009
9
List of abbreviations and terminologyList of abbreviationsACDADDADDkgAGPATCCHRCICNSCPRDBDDCMDIDDDDDMADVFAEARSSDefined Animal Course DoseDefined Animal Daily DoseDefined Animal Daily Dose per kganimalAntimicrobial Growth PromoterAnatomical Therapeutic ChemicalCentral Husbandry RegisterConfidence IntervalCentral Nervous SystemDanish Civil RegistryDefined Daily Doses per 1,000occupied bed-daysDepartment of Clinical MicrobiologyDefined Daily Doses per 1,000inhabitants per dayDefined Daily DoseDanish Medicines AgencyDanish Veterinary and FoodAdministrationThe European AntimicrobialResistance Surveillance SystemESBLGASGIGPMICMRSANnOIEPMWSRFCASSIVetStatVREWHOWTExtended spectrum Beta LactamasesGroup A StreptococcusGastrointestinalGeneral PractitionerMinimum Inhibitory ConcentrationMethicillin-resistantStaphylococcusaureusNumber of samplesNumber of isolates tested forantimicrobial susceptibilityWorld organisation for animal healthPostweaning multisystemic wastingsyndromeRegional Veterinary and Food ControlAuthoritiesStatens Serum InstitutDanish Register of VeterinaryMedicinesVancomycin Resistant EnterococciWorld Health OrganizationWild type
List of wordsAnatomical Therapeutic Chemical (ATC)classification.International classification system fordrug consumption studies. The ATC code identifiesthe therapeutic ingredient(s) of each drug for humanuse according to the organ or system on which it actsand its chemical, pharmacological and therapeuticproperties. Antibacterials for systemic use are knownas ATC group J01. The ATC classification is maintainedby the WHO Collaborating Centre for Drug Statisticsand Methodology (Oslo, Norway) (http://www.whocc.no/atcddd/indexdatabase/). The ATC classification forveterinary medicinal products, ATCvet, is based on thesame main principles as the ATC classification systemfor medicines for human use and is also maintained bythe WHO Collaborating Centre for Drug Statistics andMethodology (http://www.whocc.no/atcvet/database/).Antibacterial agents.Synthetic (chemotherapeutics)or natural (antibiotics) substances that destroy bacteriaor suppresses bacterial growth or reproduction(Source: Dorland’s Illustrated Medical Dictionary).Antimycobacterial agents are not included. Onlyantibacterial agents for systemic use are included(J01 in the ATC system) in the section on humanconsumption.Antimicrobial agents.The term ”antimicrobialagents” covers antibacterial, antiviral, coccidiostaticand antimycotic agents. In the section on veterinaryconsumption, the broad term “antimicrobial agents”is usually used because coccidiostats are included.Antiviral substancess are not used in veterinarymedicine, and antimycotics are only registered fortopical veterinary use, and used mainly in companionanimals. Antimycobacterial agents are not included.The term “antibacterial agents” is only used in theveterinary section for precision, to distinguish from useof coccidiostats as feed additives (poultry only).Broiler.A type of chicken raised specifically for meatproduction. In Denmark, the average weight afterslaughter is 1.66 kg.Central Husbandry Register (CHR).This is a registerof all Danish farms defined as geographical siteshousing production animals. It contains numerousinformation concerning ownership, farm size, animalspecies, age groups, number of animals and productiontype. Each farm has a unique farm identity number(CHR-number).
1110
DANMAP 2009
Defined Daily Dose (DDD).This is the assumedaverage maintenance dose per day in adults. It shouldbe emphasized that the Defined Daily Dose is a unitof measurement and does not necessarily reflect therecommended or prescribed daily dose. DDDs providea fixed unit of measurement independent of price andformulation, enabling the assessment of trends in drugconsumption and to perform comparisons betweenpopulation groups. The DDDs are defined and revisedyearly by the WHO Collaborating Centre for DrugStatistics and Methodology (http://www.whocc.no/atcddd/indexdatabase/). DDD/1,000 inhabitant-days iscalled DID.Defined Animal Daily Dose (ADD and ADDkg).Thisis a national veterinary equevalent to the DDD. This isan assumed average daily dose per animal, definedas the daily maintenance dose for a drug used for itsmain indication in a specified species. The dose isdefined for a „standard animal”, i.e. an animal with anestimated average weight within a specified age group.In VetStat, ADDs are calculated for each age group.Otherwise, the general principles for standardisationof dosage for animals are similar to that used by theWHO Collaborating Centre for Drug Statistics andMethodology to calculate Defined Daily Dose (DDD)in humans [Jensen VFet al.,2004. Prev. Vet. Med.64:201-215]. The ADDkg is the ADD per kg animal.Consumption calculated in ADDkg allows summationof consumption across different age groups and animalspecies.ESBL.In this DANMAP report “ESBL” describes theclinically important acquired beta-lactamases withactivity against extended-spectrum cephalosporins;including the classical class A ESBLs (CTX-M, SHV,TEM), the plasmid-mediated AmpC and OXA-ESBLs.[Giskeet al.JAC 63:1-4].
Finishers.Pigs from 30 kilogram live weight to time ofslaughter at app.100 kilogram live weight.Heifer.A young female cow before first calving.Intramammaria.Antimicrobial agents for localapplication in the mammary gland (udder for thetreatment of mastitis.Intramammary syringe.A one dose applicator for usein the udder.Layer.A hen raised to produce eggs for consumption.Minimum Inhibitory Concentration (MIC).This is thelowest concentration of antimicrobial in a given culturemedium, e.g. broth or agar, below which growth of thebacteria is not inhibited.Pet animals.Dogs, cats, birds, mice, guinea pigsand more exotic species kept at home for pleasure,rather than one kept for work or food; does not includehorses.Piglet.The newborn pig is called at piglet from birth tillthey are permanently separated from the sow at 3–4weeks of age. The weigh of the piglet at weaning is 7kilogram.Poultry.In the DANMAP reports poultry is used whenantimicrobial resistance among bacteria from broilersand layers are reported together.Rearing broilers.Parent flocks producing chickens forbroiler productionSows.Any breeding female pig, that has been servedand is on the farm.Steer.Castrated male cattle.Weaners.Any pig 7–30 kilogram live weight.Wild type.The typical form of an organism, strain,gene, or characteristic as it occurs in nature.
DANMAP 2009
11
SammendragDette er den fjortende DANMAP rapport. DANMAP2009 beskriver det årlige forbrug af antibiotika ogforekomsten af resistens i forskellige reservoirs. Denkontinuerlige overvågning af antibiotikaresistens og-forbrug gør det muligt at analysere tendenserne iantibiotikaforbrug og -resistens over tid.Fokusområde: Extended spectrum beta-lactamaseproducerende bakterier i danske svin, dansk ogimporteret kød samt patienter (side 19-22)ESBL-producerende bakterier er resistente overforbred-spektrede penicilliner, der ofte bruges tilbehandling, derfor er forekomsten af disse - selv på etlavt niveau - bekymrende. I 2009 blev prævalensen ofdisse bakterier undersøgt i kød fra svin og patienter.Svin og kød:Ved slagtning havde 11 % afslagtesvinene ESBL-producerendeEscherichia coli.Ikød-prøverne var prævalensen lav, 0,7 – 3,4 %. I 36% af det undersøgte importerede fjerkrækød blev derfundet ESBL-producerendeE. coli.CTX-M-1 (66 %)var det oftest forekommmende gen blandt de ESBL-producerendeE. colifra svin, mens CMY-2 (48 %) vardet oftest forekommende blandtE. colifra importeretfjerkrækød. CTX-M-15, som ofte findes iE. coliframennesker, forekom i 2 % af svineisolaterne.Patienter:Fra 2007 til 2009 steg prævalencen afESBL-producerendeE. coliogKlebsiella pneumoniasignifikant (undtagen forE. colifra blodinfektioner).ESBL-prævalencen hosK. pneumoniefrablodinfektioner steg til 14,6 %.Den parallelle stigning i prævalensen af ESBL-producerende bakterier hos både dyr og menneskerindikerer, at antibiotika selektion finder sted i beggereservoirs og at fødevarebåret spredning af ESBL-producerendeE. colikan være årsag til nogle af dehumane infektioner.
Antibiotikaforbrug til dyr (side 25-35)
Antibiotikaforbrug
DANMAP præsenterer antibiotikaforbrug til menneskerog dyr på årsbasis. Lægemiddelstyrelsen harovervåget forbruget af receptordineret medicinpå patientniveau siden begyndelsen af 1990erne.Siden 2001 er al anvendelse af receptordineretmedicin til dyr registreret på dyreart, aldersgruppeog besætningsniveau i VetStat databasen påVeterinærinstituttet, Danmarks Tekniske Universitet.
I 2009 nåede antibiotikaforbruget til dyr i Danmarkop på 129,7 ton som følge af en stigning på 10,4% sammenlignet med 2008. Stigningen skyldteshovedsagligt et øget forbrug til svin.Svin.De senere år er sket en stærk stigning iantallet af svin, der eksporteres ved ca. 30 kglegemsvægt, samtidig med et fald i antal slagtesvin,der bliver i DK indtil slagtevægt. Korrigeres for denneproduktionsændring, er der i 2009 sket en stigning iantal antibiotika doser per svin produceret på 12.7 %.Antibiotikaforbruget til svin nåede i 2009 op på 4.9ADDkg/ kg svinekød produceret. Stigningen skete isæri forbruget af tetracykliner (12 %), makrolider (16 %)og pleuromutiliner. Disse antibiotika bruges mest tilmasse-medicinering i foder eller drikkevand. Brugen afbredspektrede cephalosporiner til svin faldt med 25 % i2009 sammenlignet med 2008.Kvæg.Antibiotikaforbruget til kvæg nåede i 2009ca. 15 ton og har været relativt stabilt på omkring14-15 ton siden 2005. Mælkeproduktionen har væretsvagt stigende, mens kødproduktionen har væretsvagt faldende. Beta-laktamase følsomme penicillinerudgjorde 57 % af forbruget til systemisk behandlingaf køer. Penicilliner udgjorde også størstedelen afantibiotikaforbruget til behandling af yverbetændelse. I2009 faldt forbruget af bredspektrede cephalosporinertil yverbehandling med 32 % og udgjorde hermed13 % af yverbehandlingerne. Også brugen afcephalosporiner til systemisk behandling af kvæg faldtmed 14,7 % i 2009.Fjerkræ.I 2009 blev brugt 1070 kg antibiotika tilfjerkræ mod 556 kg i 2008. Selv med en fordobling afantibiotikaforbruget i kyllingeproduktionen, er forbrugetpå 0.15 ADDkgper kg kyllingekød produceret imidlertidfortsat lavt i forhold til andre dyrearter. Dette er ogsåmeget lavt i forhold til forbruget i kyllingeproduktioneni ikke-skandinaviske lande. For kalkuner stegantibiotikaforbruget med 165 % og nåede hermed 1.8ADDkgper kg kød produceret, hvilket er det højesteniveau siden 2002.I akvakultur faldt forbruget med 4 % til 3300 kg i 2009som følge af et fald i forbruget i havbrug, der generelthar et højt antibiotikaforbrug per kg kød produceretsammenlignet med andre produktionsdyr.
1312
DANMAP 2009
Antibiotikaforbrug til mennesker (side 41-51)
Resistens i zoonotiske bakterier (side 58-64)
Primærsektor og hospitaler:Samlet set var det totaleforbrug af antibiotika til systemisk brug i mennesker17,9 DDD pr. 1000 indbyggere pr. dag (DID) i 2009,mod 17,8 DID i 2008. Siden 2000 er forbruget stegetmed 4,2 DID (31,1 %). Forbruget i primærsektorenudgør ca. 90 % af det totale forbrug.Primærsektor:I 2009 var det totale antibiotikaforbrug(J01) 15,95 DID sammenlignet med 15,91 DID i 2008.Det lader til, at den kontinuerte stigning i forbruget iprimærsektoren er aftaget. Bag denne aftagning liggerdog et faldende forbrug af beta-laktamase følsommepenicilliner (0,18 DID) og makrolider (0,08 DID), dermodsvares af en stigning i forbruget af kombinationeraf penicilliner/beta-laktamase hæmmere (0,18DID) samt tetracykliner (0,07 DID). Beta-laktamasefølsomme penicilliner (smalspektret) udgør stadig denstørste gruppe (32 % af det totale forbrug), efterfulgt afpenicilliner med udvidet spektrum (21 %) og makrolider(14 %). Det totale antibiotikaforbrug, udtrykt i DID, stegmed 31 % i årene 2000-2009.Hospitaler:Det totale forbrug (J01) udtrykt i DDDpr. 100 sengedage (DBD) steg med 4,8 % (fra 74,56i 2008 til 78,13 i 2009). Udtrykt som DDD pr. 100udskrevne patienter steg det med 1,6 % fra 2007-2009 (fra 288,7 i 2007 til 293,3 i 2009). Forskellenafspejler kortere indlæggelser pr. patient men flereindlæggelser på hospitalerne. Med undtagelse af beta-laktamase følsomme penicilliner, aminoglykosider ogimidazole derivater steg forbruget af alle betydendeantibiotika stofgrupper. Cefalosporiner, hovedsageligt2. generation, udgjorde 21 % af det totale forbrugi hospitalssektoren. Andre betydningsfuldeantibiotikagrupper var penicilliner med udvidetspektrum (18 %), fluorkinoloner (13 %) og beta-laktamase følsomme penicilliner (12 %). Over de sidste10 år (2000-2009) er det totale forbrug steget med 31,2DBD (66,4 %).Antibiotikaforbruget til mennesker var på sammeniveau som de to foregående år, men der var en fortsatstigning i forbruget af de bredspektrede antibiotika (såsom cefalosporiner, fluorkinoloner).Den modsatte situation gjorde sig gældende ilandbruget, hvor brugen af cefalosporiner faldt ogbrugen af fluorkinoloner var meget lav. Derimod var deren stigning i det totale veterinære forbrug – specielt tilsvin – blandt andet i forbruget af makrolider.
Fra 2008 til 2009 blev der ikke observeret signifikanteændringer i antibiotikaresistens blandtSalmonellaTyphimuriumisolater fra danske svin. BlandtS.Typhimurium fra svinekød var resistensforekomstenhøjere i importeret svinekød sammenlignet med dansk.Der var adskillige udbrud afS.Typhimurium blandtmennesker i Danmark i 2009, de to største bestodaf hhv. 212 og 83 tilfælde. Resistensforekomsten ihumaneS.Typhimurium tilfælde erhvervet i Danmarkvar generelt lavere end forekomsten i både danskog importeret svinekød, hvilket delvist kan forklaresaf udbruddene. Der blev observeret en signifikanthøjere forekomst af nalidixan syre- og ciprofloxacinresistens i rejseassocierede tilfælde, sammenlignet medhjemmeerhvervede tilfælde.SalmonellaEnteritidiser relativt sjælden i danskfjerkræproduktion og blev i 2009 kun isoleret fraimporteret kyllingekød. Blandt de testede isolater varspecielt resistensen mod nalidixan syre og ciprofloxacinsteget, og 49 % af isolaterne var resistente overfornalidixan syre og ciprofloxacin. Resistensen overforampicillin, ciprofloxacin og nalidixan syre var signifikanthøjere i rejseassocierede tilfælde sammenlignet medtilfælde erhvervet i Danmark.Fra 2008 til 2009 sås ingen signifikante ændringeri resistensforekomsten blandtC. jejunifra danskekyllinger,C. jejunifra kvæg eller blandtCampylobactercolifra svin. Ciprofloxacin og nalidixan syre resistenseniC. jejunifra danske kyllinger faldt signifikant i 2009 ognåede 0 %. Importeret kyllingekød indeholdtC. jejunimed signifikant højere resistens overfor ciprofloxacin(56 %) og nalidixan syre (56 %) og tetracyklin (52 %)sammenlignet med dansk kyllingekød.Resistensforekomsten for ciprofloxacin, nalidixansyre ogtetracyklin var signifikant højere blandt rejserelateredeC. jejuniisolater sammenlignet medC. jejuniisolater frainfektioner erhvervet i Danmark.Resistensovervågningen af de zoonotiske bakterierviser, at selvom det er fornuftigt at overvåge ogbegrænse resistensudviklingen i Danmark, er resistens-niveauet i dansk kød bedre end i kødet fra mange andrelande indenfor og udenfor Europa, som vi importerer fra.Slagtesvin og kød (svine-, okse- og kyllingekød) blevundersøgt for forekomst af MRSA. Tretten % af svineneved slagtning var positive for MRSA og af disse var 93 %CC398. I dansk kød blev der fundet MRSA i 4,6 %, 1,4% og 0 % af henholdsvis svine-, okse- og kyllingekød.I importeret kød var forekomsten 7,5 %, 0 % og 18 % ihenholdsvis svine- okse- og kyllingekød. Humane datatyder indtil videre ikke på, at kød udgør en væsentligsmittekilde.
DANMAP 2009
13
Resistens i indikator bakterier (side 67-71)
Indikatorbakterier er inkluderet iovervågningsprogrammet for at give informationom de generelle resistensniveauer i sunde ograske produktionsdyr, idet resistens fra ikkesygdomsvoldende bakterier kan overføres til andrereservoirer.Fra 2008 til 2009 var der en signifikant stigning iampicillinresistensen i bådeEnterococcus faeciumogEnterococcus faecalisfra svin, antageligt somresultat af et øget penicillinforbrug. Forekomsten isvinekød var dog signifikant lavere for nogle antibiotikaend forekomsten i de levende dyr.I enterokokker fra kyllinger var der stigninger ibestemte typer resistensfænotyper fra 2008 til 2009.Sammenlignet med kyllinger var resistensforekomstensignifikant lavere i kyllingekød for salinomycin,ampicillin og avilamycin blandtE. faeciumsamttetracyklin blandtE. faecalis.Sammenlignet medimporteret kyllingekød var resistensforekomstensignifikant lavere i dansk produceret kylllingekød for enrække antibiotika.IE. colifra svin fandt vi stigende resistensforekomsteroverfor en række antibiotika. Nogle resistenstendenservar tilsyneladende relateret til tendenserne i forbrugetaf de pågældende antibiotika. Tilsvarende stigningerkunne ses for nogle antibiotika iE. colifra svinekød.I modsætning til hvad vi så for de zoonotiskebakterier, var der ingen signifikant forskel påresistensforekomsten iE. colifra dansk og importeretsvinekød.IE. colifra kyllinger sås for første gang et tilfældeaf resistens mod cefalosporinet ceftiofur. IE. colifraimporteret kyllingekød var resistensniveauet signifikanthøjere end i dansk produceret kyllingekød.BlandtE. coliisolater fra kvæg og fra dansk ogimporteret oksekød var resistensen lav.Resistensforekomsten var generelt lavere ibakterier fra det danske kyllingekød sammenlignetmed det importerede kyllingekød. I de senesteår har resistensforekomsten været stigende iindikatorbakterier fra dansk svinekød og er ikkelængere lavere end i det importerede kød.Dog er forekomsten af ciprofloxacin resistens lav iE. colifra dansk svinekød.
Resistens i bakterier fra diagnostiskeindsendelser fra mennesker (side 76-85)
Rapporteringen af antibiotikaresistens i bakterier fradiagnostiske prøver fra mennesker er baseret på frivilligindsendelse af data fra DANRES gruppen, som dækkerde klinisk mikrobiologiske afdelinger i Danmark. Deeneste undtagelser omfatter methicillin resistenteStaphylococcus aureusog invasiveStreptococcuspneumoniae,som er anmeldepligtige. Data vedr. dissebakterier kommer fra referencelaboratorierne på SSI.BlandtE. coliisolater fra blodstegresistensforekomsten signifikant for fluorkinoloner(ciprofloxacin 16 %) og cefalosporiner (3. generationscefalosporiner 7 %) fra 2008 til 2009 og nåederesistensniveau som i andre europæiske lande.Stigningen i resistens ses samtidig med stigningen iforbruget af disse antibiotika observeret i de senereår. IngenE. coliisolater fra blodinfektioner varcarbapenem resistente.BlandtE. coliisolater fra urin,både fraprimærsektoren og fra hospitalerne, stegresistensforekomsten i 2009 signifikant for ampicillin,ciprofloxacin, nalidixan syre og cefuroxim. Resistens for3. generations cefalosporiner nåede 6 % i isolater frabåde hospitaler og primærsektor.BlandtKlebsiella pneumoniaeisolater fra blodvarresistensforekomsten for 3. generations cefalosporiner(12 %) (rapporteret som ceftazidim, ceftriaxon,cefpodoxim eller cefotaxim) og gentamicin (9 %)over niveauet for de andre nordiske lande i 2008.Resistensforekomsten for ciprofloxacin var 18 %;forekomsten var signifikant højere i den østlige del afDanmark (23 %) end i den vestlige del (9 %). IngenK. pneumoniaeisolater fra blod var carbapenemresistente. Forekomsten af multiresistente isolater (3.generations cefalosporiner, kinoloner og gentamicin)steg fra 1 % i 2006 til 8 % i 2009. Der kunneogså observeres en 24 % stigning i antallet afK.pneumoniaeblodisolater siden 2006.I denne DANMAP rapport blev der for førstegang medtaget data om resistens iKlebsiellapneumoniaeurinisolaterfra hospitaler ogprimærsektor. Forekomsten af ciprofloxacin resistensvar 17 % i isolater fra hospitaler og 13 % i isolaterfra primærsektor, resistens for 3. generationscefalosporiner (rapporteret som ceftazidim, cefpodoximeller cefotaxim) var 13 % i isolater fra hospitaler og8 % i isolater fra primærsektor. Der blev observeret
1514
DANMAP 2009
carbapenem (meropenem) resistente isolater, men daforekomsten af antibiotikaresistens iK. pneumoniaeikke er anmeldepligtig, kunne en frekvens forcarbapenem resistens ikke beregnes.Resistensforekomsten iPseudomonas aeruginosaisolater fra blod var lav for alle de testede antibiotika.I 2009 var penicillin og erythromycinresistensforekomsten stadig lav blandtStreptococcuspneumoniaeog gruppeA, B, CogG streptokokker.IS. pneumoniaeisolater faldt makrolid resistensen (4%)signifikant i 2009.Forekomsten af ampicillin resistens var høj (87%)blandtEnterococcus faeciumisolater fra blod.Forekomsten af vancomycin resistens var 1.6 % iE.faeciumog mindre end 1 % iE. faecalisblodisolater.Høj niveau gentamicin resistens (HLGR) i alleenterokokker fra blodinfektioner blev kun testet påén afdeling for klinisk mikrobiologi. Her var 34 % afde testedeE. faecalisisolater HLGR og 56 % af detestedeE. faeciumisolater HLGR. Behandling medfluorkinoloner, cefalosporiner eller carbapenemerer beskrevet som risikofaktorer for udvikling af enE. faeciuminfektion. I de senere år er der netopobserveret en stigning i forbruget af disse antibiotika påhospitaler i Danmark, og dette kan muligvis forklare detstigende antalE. faeciuminfektioner.Der blev indrapporteret 1466 tilfælde afStaphylococcus aureusbakteriæmi i 2009 svarendetil en incidens på 26,6 per 100.000 indbyggere.Antallet af methicillin-resistenteS. aureus(MRSA)bakteriæmier var 23 (1,6 %). Frekvensen er megetlav sammenlignet med landene i det øvrige Europa.
Frekvensen af resistens mod øvrige antibiotika lå påsamme niveau som de foregående år.I 2009 var antallet af nye tilfælde afMRSApåsamme niveau som i 2008. Nitten procent aftilfældene var erhvervet i udlandet, 7% på hospitaler,10 % af tilfældene blev fundet hos personer medhospitals-/plejehjemskontakt, mens 61% tilfælde varsamfundserhvervede. Tres procent havde en infektionpå diagnosetidspunktet. Tendensen set siden 2006, athovedparten af tilfældene erhverves i samfundet, ersåledes fortsat, mens antallet af hospitalserhvervedetilfælde er uændret. Der blev fundet 39 nye tilfældeaf MRSA CC398, som har relation til svin. Detteudgør fortsat en relativt lille del af det samlede antal,og der er ingen tegn til, at der ses spredning tilbefolkningen i almindelighed. Bekæmpelsen af MRSApå hospitalerne er således effektiv, mens forekomstaf samfundserhvervet MRSA udgør en stadig størreudfordring.Forekomsten af multiresistente bakterier fra blod-og urinvejsinfektioner steg, specielt var der enøget forekomst af ESBL-producerendeE. coliogK. pneumoniae.Dette kan til dels forklares ved detstigende forbrug af cefalosporiner og flurokinoloner.Det stigende forbrug af disse antibiotika kan ogsåvære en forklaring på den stigende forekomst afampicillin resistente Enterokok blodinfektioner.Resistentsforekomsten var stadig lav hosP. auroginosaand streptokokker. Antallet af hospitals erhvervedeMRSA var uændret, mens stigningen i MRSAinfektioner generelt skyldes en spredning i samfundetuden for hospitalerne.
DANMAP 2009
15
SummaryThis report is the 14th DANMAP report. DANMAP 2009describes the annual consumption of antimicrobialagents and the occurrence of resistance in differentreservoirs. The continuous monitoring of antimicrobialresistance and consumption makes it possible toanalyse the trends in antimicrobial consumption andresistance over time.
Antimicrobial consumption
Focus Area: Extended spectrumbeta-lactamase (ESBL) producing bacteria inDanish pigs, Danish and imported retail meatand human patients (main report pp 19-22)
DANMAP presents the use of antimicrobial agents inhumans and animals. In humans, the use of prescriptionmedicines has been monitored by the Danish MedicinesAgency at the level of the individual patient since theearly 1990s. In animals, data on all medicines prescribedby veterinarians for use in animals have been registeredat farm and species level by the VetStat programme atthe Veterinary Institute (Technical University of Denmark)since 2001.
Bacteria that produce extended spectrum beta-lactamase (ESBL) are resistant to the wide-spectrumpenicillins normally used for treatment and theiroccurrence – even at low levels - is therefore a matterof concern. In 2009, we examined the prevalence ofthese bacteria in meat and pigs as well as amonghuman patients.Pigs and meat:Eleven percent of pigs carried ESBLproducingEscherichia coliat slaughter. In samplesfrom meat, the prevalence was low, 0.7 – 3.4%;however, in 36% of the imported broiler meat, ESBLproducingE. coliwere detected. The most commonlydetected gene among ESBL positive isolates from pigswas CTX-M-1 (66%) and among isolates from importedbroiler meat CMY-2 (48%) was most commonly found.CTX-M-15 a gene often found among human isolateswas found among 2% of the isolates from pigs.Humans:The prevalences of ESBL-producingE.coliandKlebsiella pneumoniafrom blood and urineinfections increased significantly (except forE. colifrom blood) from 2007 to 2009. ESBL resistance inK. pneumoniaefrom bloodstream infections reached14.6%.The parallel increase in prevalence of ESBL-producingbacteria in both humans and animals indicate thatantimicrobial selection takes place in both reservoirs,and food derived spread of ESBL-producingE. colimaybe the origin in at least part of the human cases.
Antimicrobial consumption in animals (mainreport pp 25-35)
In 2009, the total consumption of antimicrobial agents inanimals amounted to 129.7 tonnes. This was a 10.4%increase compared with 2008. The increase could mainlybe attributed to consumption in pigs.An increasing number of pigs were exported at 30 kg liveweight. When we adjust the statistic for this, we find thatantimicrobial consumption in pigs increased by 12.7%from 2008 to 2009. The consumption in pigs reached 4.9ADDkg/kg pork produced.The increase could largely be attributed to tetracyclines(12%), macrolides (16%) and pleuromutilins; theseantimicrobial agents are commonly used for massmedication in feed or drinking water in pig herdswith disease problems. The use of wide-spectrumcephalosporins in pigs decreased by 25% compared to2008.The consumption of antimicrobial agents in cattle,increased to 15 tonnes, but has been relatively stableat around 14-15 tonnes since 2005. Narrow spectrumpenicillins comprised 57% of the systemic treatmentin cows. Penicillins were also the most frequentlyused agents for intramammary use. In 2009, the useof wide-spectrum cephalosporins for intramammaryuse decreased by 32%, and comprised 13% ofthe intramammary consumption in 2009. Also, theconsumtpion of cephalosporins for systemic use in cattledecreased by 14.7%.The consumption of antimicrobial agents in poultryincreased from 556 kg in 2008 to 1070 kg in 2009.However, even with a doubling of, the consumption ofantimicrobial agents in Danish broilers, the consumptionremains at a very low level, equivalent to 0.15 ADDkgperkg meat produced.In turkeys, the consumption increased by 165%,reaching 1.8 ADDkgper kg meat produced, the highestlevel since 2002.In aquaculture, the antimicrobial consumption decreasedby 4% to 3300 kg in 2009 compared with 2008, due to areduction in consumption in salt water fish.
1716
DANMAP 2009
Antimicrobial consumption in humans (mainreport pp 41-51)
Primary health care and hospitals:The totalconsumption of antibacterial agents for systemic use inhumans amounted to 17.9 DDDs per 1000 inhabitantsper day (DID) compared with 17.8 DID in 2008. Since2000, consumption has increased by 4.2 DID (31.1%).Consumption in primary health care comprises app.90% of the total consumption.Primary health care:In 2009, the total antibacterialconsumption (J01) amounted to 15.95 DID comparedwith 15.91 DID in 2008. It seems that the continuingincrease in consumption in primary healthcare haslevelled off. However, the levelling in total consumptionwas mainly due to a reduction in beta-lactamasesensitive penicillins (0.18 DID) and macrolides (0.08DID) counterbalanced by an increase in combinationsof penicillins/beta-lactamase inhibitors (0.18 DID) andtetracyclines (0.07 DID). Beta-lactamase sensitivepenicillins (narrow spectrum) still represented thelargest group of antibacterial agents consumed (32%of the total consumption) followed by penicillins withextended spectrum (21%) and macrolides (14%).Total consumption expressed in DID increased by 31%during 2000–2009.Hospitals:The total consumption (J01) expressed inDDDs per 100 occupied bed-days (DBD) increasedby 4.8% (from 74.56 in 2008 to 78.13 in 2009). Whenexpressed as the number of DDDs per 100 dischargedpatients it increased by 1.6% during 2007–2009 (from288.7 in 2007 to 293.3 in 2009). The difference reflectsshorter duration of hospitalisation per patient, butmore admissions to hospitals. The consumption of allthe major antibacterial groups (>1.0 DBD) increasedwith the exception of beta-lactamase sensitivepenicillins, aminoglycosides and imidazole derivates.Cephalosporins, mainly 2nd generation, accountedfor 21% of the total consumption in the hospitalsector. Penicillins with extended spectrum (18%),fluoroquinolones (13%) and beta-lactamase sensitivepenicillins (12%) were other major contributingantibacterial groups. Over the last decade (2000–2009), total consumption has increased by 31.2 DBD(66.4%).
Overall, the antimicrobial consumption in humanshas been at a steady level the past two years, butthe use of broad spectrum antimicrobial agents (e.g.cephalosporins, fluoroquinolones) has increased.The opposite situation is seen in the veterinary sector,where the consumption of the most critically importantantimicrobial agents is decreasing (cephalosporins) orthe use is very low (fluoroquinolones). Concurrently,a steep increase in overall antimicrobial consumption– particularly in pigs – occurred in 2009, includingincreasing consumption of macrolides (criticallyimportant).
Resistance in zoonotic bacteria (main reportpp 58-64)
AmongSalmonellaTyphimuriumisolates fromDanish pigs, no significant change in occurrence ofantimicrobial resistance was observed from 2008 to2009, although significant increasing trends throughoutthe decade continued for sulfonamide, ampicillinand streptomycin. InS.Typhimurium from pork theoccurrence of resistance to four antimicrobial agentswas significantly higher in imported pork (22% forciprofloxacin) compared to domestic products (0 %for ciprofloxacin). Several humanS.Typhimuriumoutbreaks occurred in 2009; the two largest consistedof 212 and 83 cases, respectively. The occurrenceof resistance in human domestically acquiredS.Typhimurium cases was in general lower than theoccurrence in both Danish and imported pork andmight at least in part be explain by the outbreaks.A significantly higher occurrence of nalidixic acidand ciprofloxacin resistance was observed in travelassociated cases when compared with domesticallyacquired cases.SalmonellaEnteritidisis relatively rare in the Danishpoultry production; in 2009, it was isolated only fromimported broiler meat. Among the isolates tested,notably the occurrence of resistance to ciprofloxacinand nalidixic acid increased, with 49% of the isolatesresistant to nalidixic acid and ciprofloxacin. Resistanceto ampicillin, ciprofloxacin and nalidixic acid wassignificantly more frequent in travel associated casescompared to those acquired in Denmark.From 2008 to 2009, no significant changes inoccurrence of resistance were observed amongCampylobacter jejunifrom Danish broilers and cattleorCampylobacter colifrom pigs. In Danish chickenmeat, ciprofloxacin and nalidixic acid resistance inC.jejunidecreased significantly, with no resistant isolates
DANMAP 2009
17
in 2009. Imported chicken meat containedC. jejuniwithsignificantly higher levels of resistance to ciprofloxacin(56%), nalidixic acid (56%) and tetracycline (52%)compared to Danish broiler meat. In humancampylobacter cases, resistance to ciprofloxacin,nalidixic acid and tetracycline was significantly higher incases associated with travel than in cases acquired inDenmark.Overall, the monitoring programme for the food bornezoonoses shows that even though there is reason tokeep an eye on the development within the country, theDanish status with regard to antimicrobial resistance isbetter than in many other countries within and outsideEurope.Pigs at slaughter and retail meat (pork, beef and broilermeat) was investigated for the prevalence of MRSA.Thirteen % of the pigs at slaughter were positive forMRSA and 93% of these were CC398. In Danish meatMRSA was found in 4.6%, 1.4% and 0% of pork, beefand broiler meat, respectively. In imported meat theoccurrence was 7.5%, 0% and 18% in pork, beef andbroiler meat, respectively. Based on human data, meatare not suspected as a source of infection.
temporally related to trends in consumption ofantimicrobial agents. Similar increases were seenfor some antimicrobial agents inE. colifrom pork.In contrast to what we found for Salmonella, therewere no significant differences in resistance inE. colibetween Danish and imported pork.InE. colifrom broilers, for the first time one case ofresistance to ceftiofur (a cephalosporin), possiblyESBL-producing, was detected. The occurrence ofresistance to at least 14 antimicrobial agents wassignificantly higher in imported chicken meat that inchicken meat produced in Denmark.AmongE. coliisolates from cattle and from Danish andimported beef, occurrence of resistance was low.Overall, the occurrence of resistance was significantlylower within the indicator bacteria found in Danishbroiler meat compared with imported broiler meat.The occurrence of resistance in Danish pork hasbeen increasing in past years and is not significantlylower than in imported pork. However, resistance tociprofloxacin was very low inE. colifrom Danish pork(1%), in contrast to imported pork (6%).
Resistance in indicator bacteria (main reportpp 67-71)
Resistance in human clinical bacteria (mainreport pp 76-85)
Indicator bacteria were included in the programmeto provide information about the general levels ofresistance in healthy food animals.From 2008 to 2009, a significant increase in occurrenceof ampicillin resistance was detected in bothEnterococcus faeciumandEnterococcus faecalisfrom pigs, presumable as a result of increased usageof penicillins. For some antimicriobials, the occurrenceof resistance in pork was lower than that found in thelive pigs.In Enterococci from broilers, the occurrence ofresistance to four antimicrobials increased significantlyfrom 2008 to 2009. Compared to isolates from broilers,significantly lower occurrence of resistance was foundin the broiler meat regarding salinomycin, ampicillinand avilamycin resistance amongE. faecium,andtetracycline resistance amongE. faecalis.Comparedto imported broiler meat, resistance was significantlylower in Danish produced broiler meat for erythromycin,kanamycin, tetracycline and others.InEscherichia colifrom pigs we found increasingoccurrence of resistance to a number of antimicrobialagents, with some of the trends in resistance
Data on antimicrobial resistance in bacteria from diag-nostic submissions are gathered by voluntary reportingfrom the DANRES group which covers the departmentsof clinical microbiology (DCM) in Denmark. The onlyexceptions are methicillin resistantStaphylococcusaureusand invasiveStreptococcus pneumoniaethatare notifiable. Data on these bacteria are obtained fromthe reference laboratories at SSI.AmongE. coliblood isolates,the occurrence ofresistance to fluoroquinolones (ciprofloxacin) andcephalosporins (3rd generation cephalosporins)increased significantly from 2008 to 2009, reachinglevels seen in several other European countries. Theincrease in resistance corresponds to the increase inthe consumption of these antimicrobial agents seenover the years. NoE. coliisolates from blood werecarbapenem resistant.InE. coliurine isolatesobtained from hospitalsand primary health care, resistance to ampicillin,ciprofloxacin, nalidixic acid and cefuroxime increasedsignificantly in 2009. InE. coliurine isolates obtainedfrom hospitalized patients, resistance to mecillinam andsulfonamide also increased significantly. Resistance to3rd generation cephalosporins reached 6% in isolatesfrom both hospitals and primary health care.
18
DANMAP 2009cephalosporins or carbapenems has been describedas risk factors for development of anE. faeciuminfection. An increasing consumption of theseantimicrobial agents has also been observed inhospitals in Denmark during the past years and thismight explain the increasing numbers ofE. faeciumbloodstream infections.In 2009, 1466 cases ofStaphylococcus aureusbacteraemia were reported, corresponding to 26.6cases per 100,000 inhabitants. The number ofmethicillin resistantS. aureus(MRSA) was 23 (1.6%).This frequency is very low compared to the incidencein most other European countries. Resistancefrequencies to other antimicrobials were at the samelevel as in previous years.In 2009, the number of new cases ofMRSAwascomparable to the number in 2008. Nineteen percentof the cases were acquired abroad, 7% in hospitalsand 10% of the cases were persons with recentcontact to hospitals or nursing homes while 61% ofthe cases were community acquired. Sixty percentof all cases presented with infections at the time ofdiagnosis. The trend observed since 2006 that mostcases are acquired in the community thus continueswhile the number of hospital acquired cases remainsthe same. The clonal complex CC398 which isassociated with swine and other livestock animalsconstitutes a minor proportion of all MRSA cases(39 cases) and so far no signs of transmission to thegeneral population are seen. The control of MRSAin hospitals was effective while the prevalence ofcommunity acquired MRSA represents an increasingchallenge.Regarding blood and urine infections in humanpatients, the occurrence of multiresistance isincreasing, particularly occurrence of ESBL-producingE. coliandKlebsiella pneumoniae.This may in part bedriven by increasing consumption of fluoroquinolonesand cephalosporins. The increased consumption offluoroquinolones and cephalosporins may also drivethe increasing occurrence of the ampicillin resistantEnterococcusbloodstream infections. However,the occurrence of resistance inPseudomonasandStreptococci is still generally low. Also, the hospitalacquired infections with MRSA remain the same, butan overall increase in MRSA infections is driven byspread in the community.
InKlebsiella pneumoniaeblood isolates,3rdgeneration cephalosporin (12%) (reported asceftazidime, ceftriaxone, cefpodoxime or cefotaxime)and gentamicin resistance (9%) was above the 2008level in the other Nordic countries. Resistance tociprofloxacin was 18%; however, a significantly largeroccurrence was seen in Eastern Denmark (23%)than in Western Denmark (9%). NoK. pneumoniaeisolates from blood were carbapenem resistant. Theoccurrence of multi-resistant isolates (3rd generationcephalosporins, quinolones and gentamicin) increasedfrom 1% in 2006 to 8% in 2009. Also, a 24% increasein the number ofK. pneumoniaeblood isolates since2006 was observed.In this DANMAP report, resistance inK. pneumoniaeurine isolatesobtained from hospitals and primaryhealth care was reported for the first time. Ciprofloxacinresistance was 17% in isolates from hospitals and 13%in isolates from primary health care, 3rd generationcephalosporin resistance (reported as ceftazidime,cefpodoxime or cefotaxime) was13% in isolates fromhospitals and 8% in isolates from PHC. Carbapenem(meropenem) resistance was present in these isolates;however, the occurrence of antimicrobial resistancein this species in not mandatory reportable and nocalculation of the frequency of carbepenem resistancecould be made.The occurrence of resistance inPseudomonasaeruginosaisolates obtained from blood was low forall the tested antimicrobial agents.Resistance to penicillins and erythromycin inStreptococcus pneumoniae,GroupA, B, CandGstreptococciremained low in 2009. InS. pneumoniaeisolates, macrolide resistance (4%) decreasedsignificantly in 2009.Resistance to ampicillin was high (87%) inEnterococcus faeciumisolates from blood. Theoccurrence of vancomycin resistance was 1.6% in theE. faeciumand less than 1% in theE. faecalisbloodisolates. Only one of the DCMs tested all enterococcifrom bloodstream infections for high level gentamicinresistance (HLGR). Here, 34% of the testedE. faecalisisolates were HLGR, as were 56% of the testedE.faeciumisolates. Treatment with fluoroquinolones,
DANMAP 2009
Focus area
19
Extended spectrum beta-lactamase producing bacteria in Danish pigs, Danishand imported retail meat and human patientsBackground:Extended spectrum beta-lactamase (ESBL) producing bacteria are one of the fastest emergingresistance problems worldwide. ESBL-producingE. colihave been observed in animals, healthy humans andpatients, whereas ESBL-producingKlebsiella pneumoniaewas found in patients. There is a strong relationshipwith consumption of broad spectrum antimicrobial agents such as third generation cephalosporins andfluoroquinolones and the emergence of ESBL-producing bacteria. ESBL-producingK. pneumoniaehave had atendency to spread as epidemics in hospitals [Lesteret al.2010. ECCMID. Poster 1251]. The origin of ESBL-producing bacteria is as far unknown, but food producing animals has recently been discussed as a reservoir.The use of cephalosporins in pig production in Denmark has increased during 2001–2007 and may selectfor ESBL-producingE. coliin pigs. However, consumption of ciprofloxacin and second and third generationcephalosporins has also been on constant increase in Danish hospitals for the last 10 years, causing increasedselection pressure further promoting ESBL-producing bacteria in the hospitals. In 2009, investigations havebeen undertaken both in the veterinary field (i.e. to investigate the prevalence of ESBL-producingE. coliin pigsat slaughter and in meat at retail), as well as among patients (i.e. a country-wide prevalence study of ESBL-producingE. coliandK. pneumoniaefrom clinical samples) [EPI-NEWS 15/2010].
Animals and food:During 2009, fecal samples from pigs (n=786) were taken at slaughter and 866 meat samples(Danish pork (153), Danish broiler meat (121), Danish beef (142), imported pork (173), imported broiler meat(193), and imported beef (84)) were collected in retail stores and outlets. The fecal samples were randomly se-lected and only one pig from each farm was included each month (one to three pigs were sampled per farm in theentire sampling period). The meat samples were collected randomly in all regions of Denmark.E. coliwas isolatedfrom 1 g of feces or 5 g of meat after selective enrichment in McConkey media with ceftriaxone (1 �g/ml). Thegenetic background for ESBL resistance was revealed by use of PCR, array and DNA sequencing.Humans:In October 2009, 14 of the 15 Danish departments of clinical microbiology tested allE. coliandK.pneumoniaeisolates obtained from urine and blood for ESBL-production. Screening for ESBL-production wasdone using a cephalosporin-disc/tablet on the primary plate, and confirmation was done by demonstratinginhibition with clavulanic acid in combination with cefotaxime and/or ceftazidime using the disc-combinationmethod or by Etests. Further confirmatory tests were carried out, e.g. at SSI. Prevalences of ESBL-producingbacteria were calculated with the total number of the same species tested at each site as the denominator.
Results:
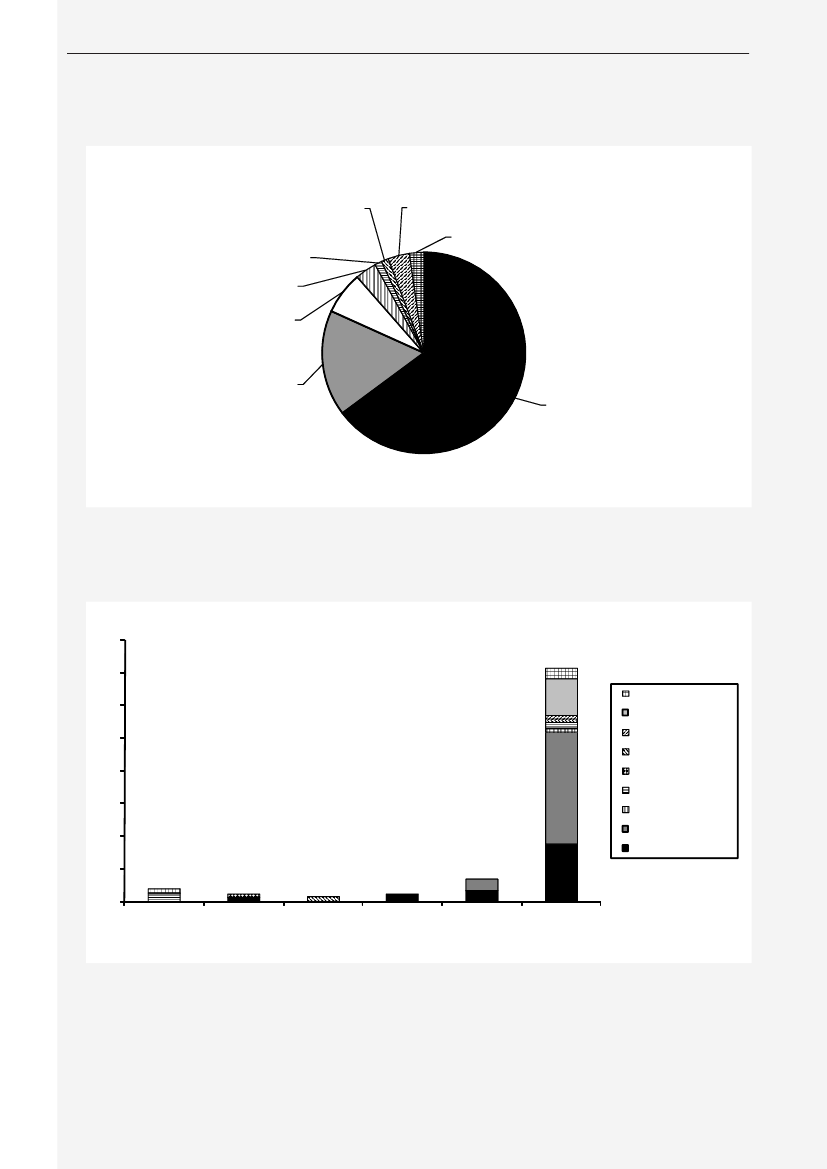
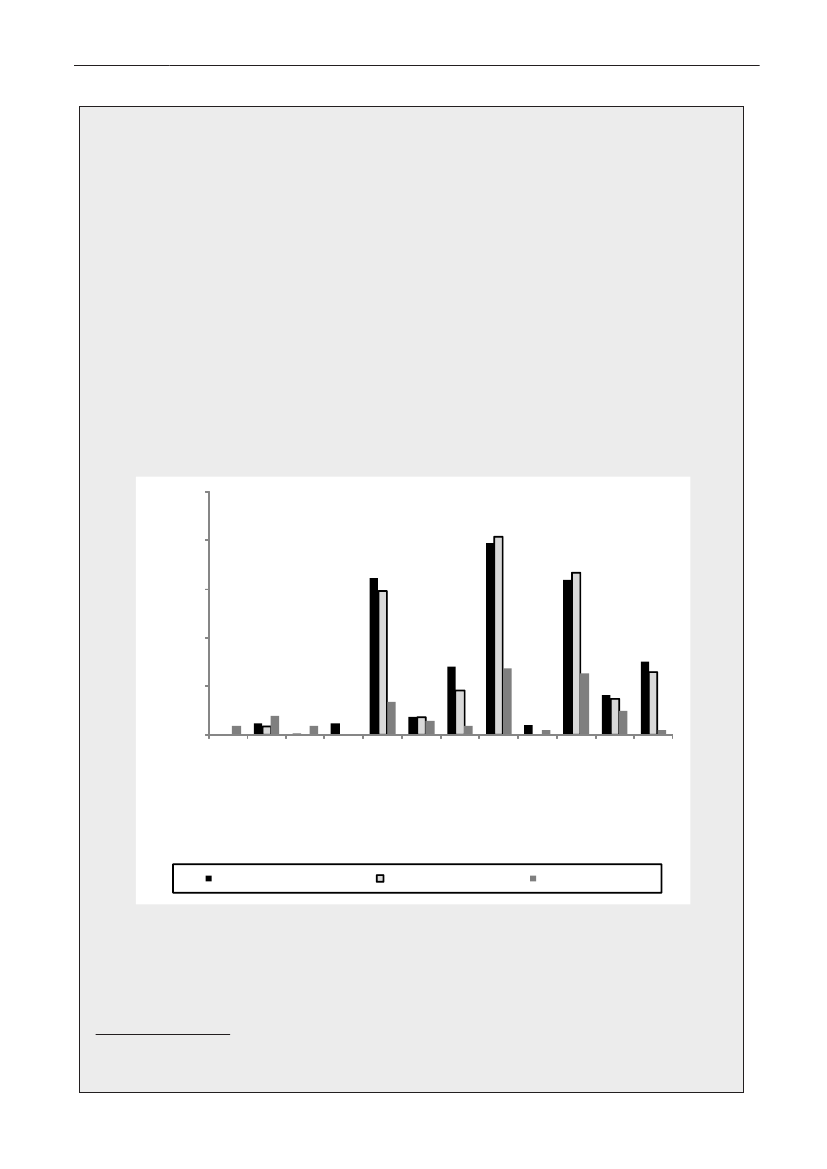
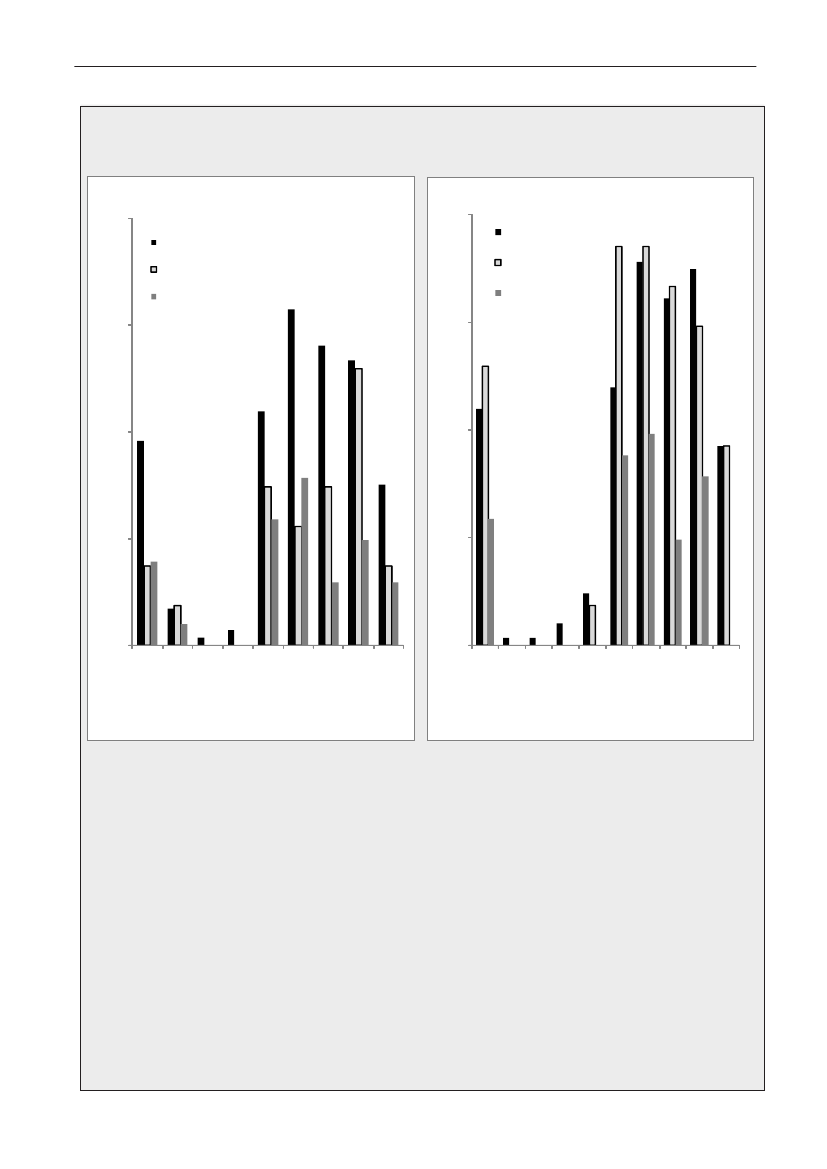
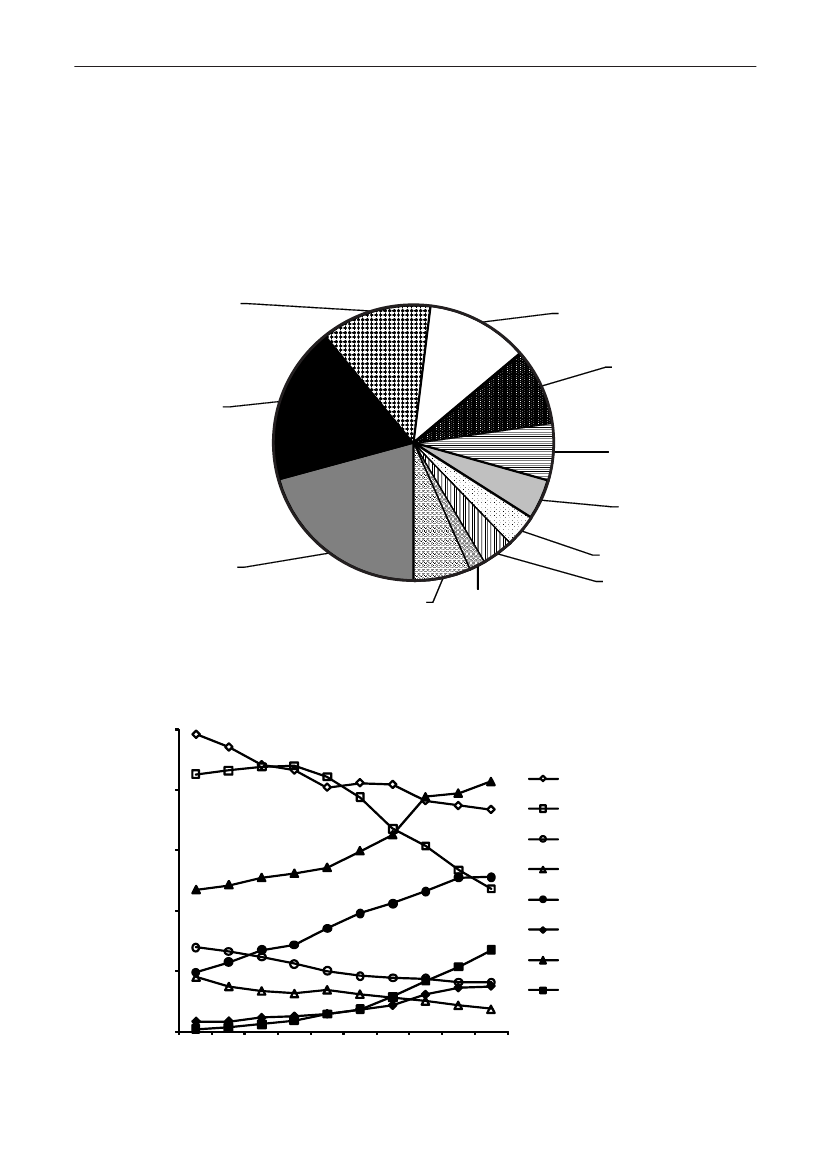
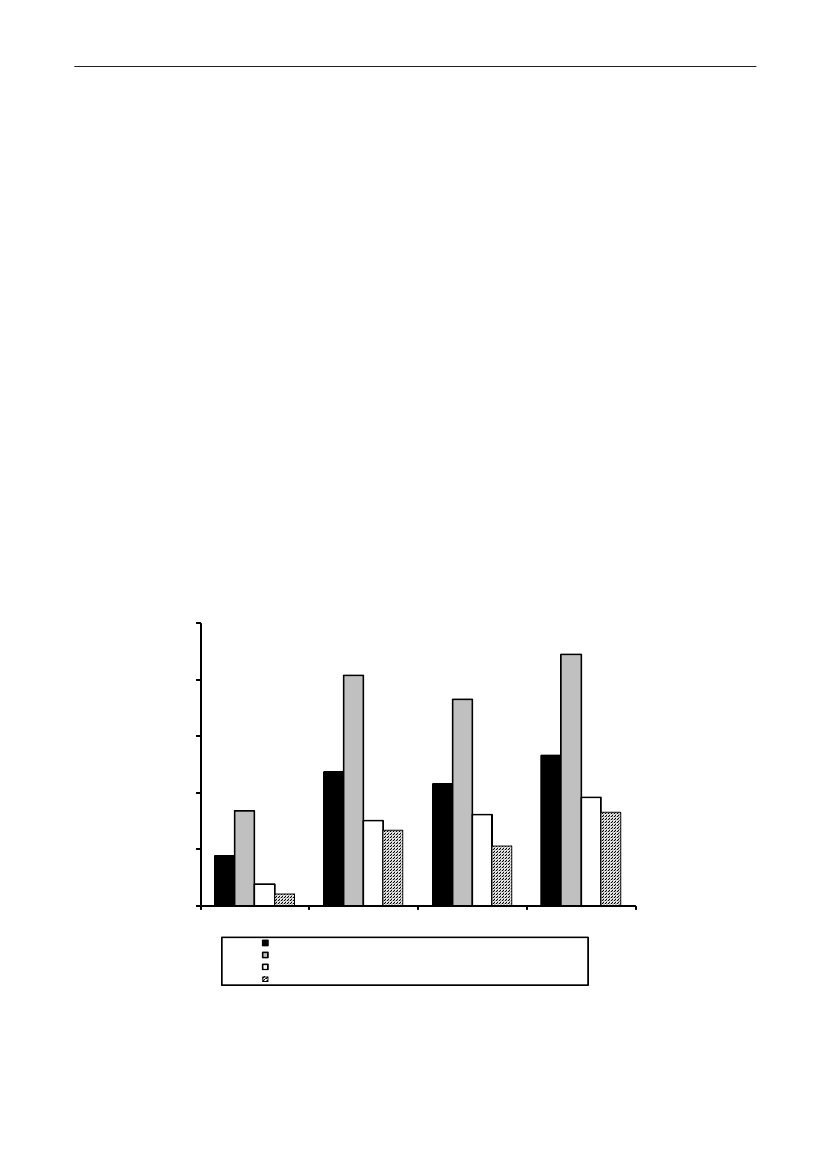
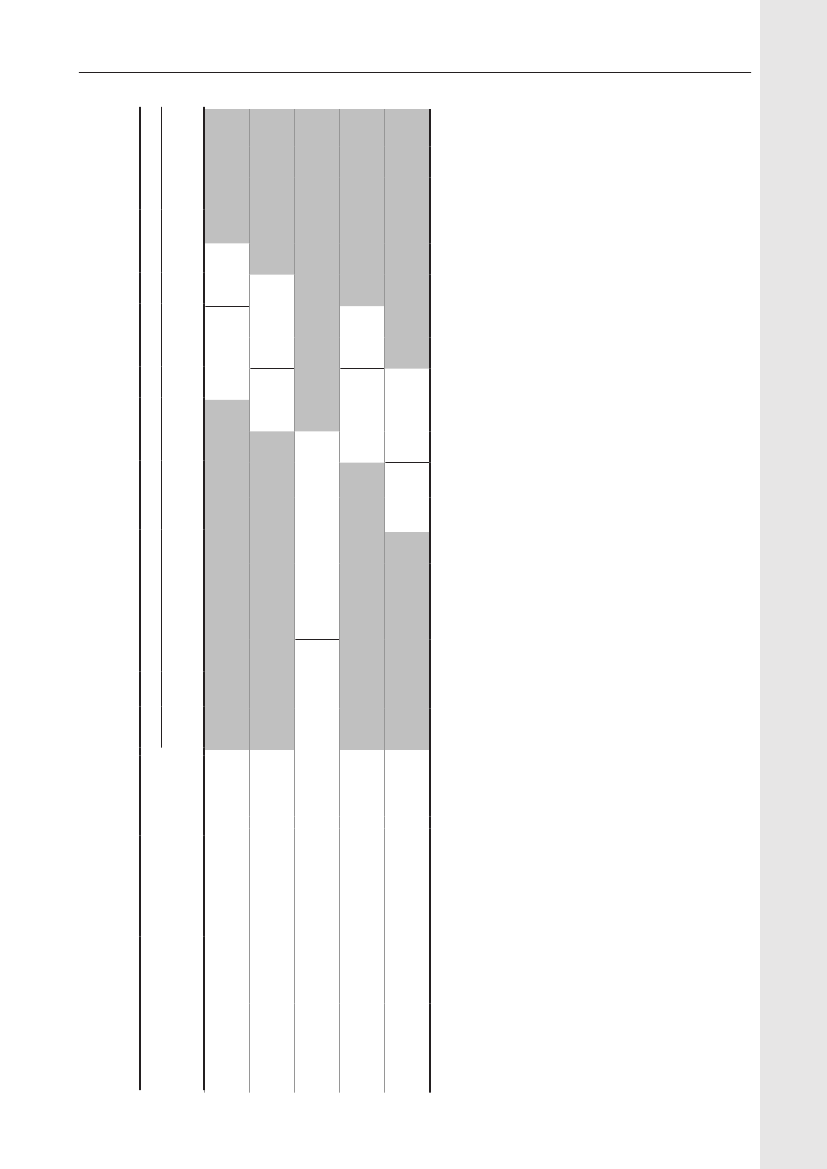
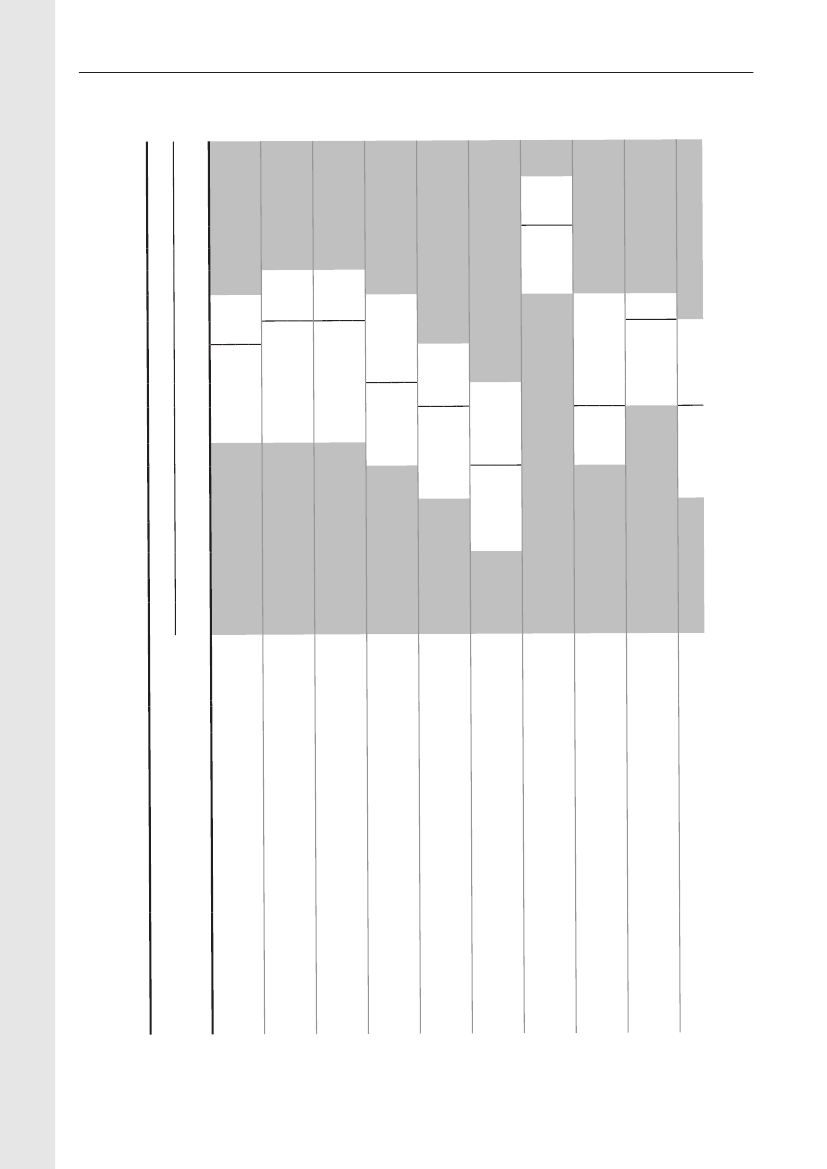
Animals and food:Eleven percent (86/786) of the pig fecal samples contained ceftriaxone resistantE. coli.Among these isolates, 66% contained CTX-M-1 but other genotypes were found as well (ampC up-regulation(17%), CTX-M-14 (7%), CTX-M-15 (2%), CTX-M-2 (2%), SHV-12 (1%), TEM-20 (1%) and unknown (3%))(Figure1).From meat samples, the highest prevalence of ceftriaxone resistantE. coliwas found among imported broilermeat (36%), in the other meat categories 0.7-3.3% ceftriaxone resistance was observed. The ceftriaxone resistantE. colifrom imported broiler meat (69 isolates) contained CMY-2 (48%), CTX-M-1 (25%), SHV-12 (16%), CTX-M-2(3%) and other mechanisms (TEM-20, TEM-52, ampC up-regulation) (3%). Among the other meat categories,CMY-2, CTX-M-1, CTX-M-2, CTX-M-14, TEM-52 and ampC up-regulation were found(Figure 2).Humans:The prevalence of ESBL-producingE. coliandK. pneumoniaeisolated from blood or urine, the latterdivided into hospital or community derived urine cultures, is shown inTable 1,where the ESBL-prevalencesobtained in 2009 are compared with data from a similar study performed in 2007. The prevalences of ESBL-producing bacteria increased significantly for all categories (except forE. colifrom blood). The increase seen inK.pneumoniaein blood to14.6% producing ESBL is highly significant.
Focus area
Materials and Methods:
202120
DANMAP 2009DANMAP 2009
DANMAP 2009
TEM-20, 1.2%SHV-12, 1.2%CTX-M-2, 3.5%CTX-M-14, 7.0%
unknowns, 3.5%CTX-M-15, 2.3%
AmpC up-regulation,17.4%
CTX-M-1, 66.3%
Focus area
Figure 1. ESBL gene distribution in pigs
DANMAP 2009
4035302520151050Danish pork Imported pork Danish beef Imported beef Danish broiler Importedmeatbroiler meatunknownSHV-12TEM-20TEM-52CTX-M-14CTX-M-2AmpC upregulationCMY-2CTX-M-1
Figure 2. Frequency of ESBL types in various types of meat products
DANMAP 2009DANMAP 2009
2121
Table 1. Prevalence of Extended Spectrum Beta-Lactamase (ESBL) inE. coliandK. pneumoniaeisolated from bloodand urine cultures, September-October 2007 and October 2009DANMAP 2009Sample typePeriodTotal no. ofcultures1825911532*16536*12574E. colifindingsOf these,ESBL (%)26 (4.2)25 (7.0)157 (2.3)152 (3.8)74 (1.5)74 (2.3)K. pneumoniaefindings160891078675513385Of these, ESBL (%)
BloodUrine, hosp.Urine, GP
200720092007200920072009
6253566791400449663392
8 (5.0)13 (14.6)71 (6.6)78 (11.1)14 (2.7)26 (6.8)
*) For the 2007-study, no information was provided on the distribution of the in all 47,504 urine cultures performed in hospitals andgeneral practices
Discussion and conclusions:For animals and food, the use of selective enrichment with ceftriaxone revealedESBL-producingE. coliin pigs which were not found by standard monitoring of indicatorE. coliin pigs. Theoccurrence of ESBL-producingE. colimay increase due to the increased consumption of cephalosporins inthe pig production. Even though ESBLE. coliare present in Danish pigs at slaughter, the meat source with theparamount highest fraction of ESBLE. coliwas imported broiler meat. As certain genotypes were dominant inE.colifrom certain sources the genotype may be valuable for source attribution.For humans, there was a 40-50% increase in the prevalence of ESBL-producingE. coliandK. pneumoniaeinboth urine and blood from 2007 to 2009.The isolates from 2009 have not been genotyped for ESBL type yet, but in 2007 roughly 70% of the ESBL-producingE. colibelonged to CTX-M-15, while the CTX-M-1 type comprised around 5% [Hansenet al.2010.ECCMID. Poster 1617]. The most common ESBL-type among pig isolates was CTX-M-1 (66%) and only 2%belonged to CTX-M-15. Among the isolates from imported broiler meat, CMY-2 was most often present. Thedistribution in ESBL types is therefore not congruent among animals and humans. However, the parallel increasein prevalence of ESBL-producing bacteria in both humans and animals indicate that antimicrobial selection takesplace in both reservoirs, and food derived spread of ESBL-producing bacteria may be the origin in at least part ofthe human cases.Infection with ESBL-producing bacteria frequently entails prolonged admission periods at hospitals with ensuinghuman and financial costs. The mortality for septicaemia caused byE. coliandK. pneumoniaesusceptibleto antibiotics is approx. 20%, but this figure may increase in case of ESBL-producing bacteria. Alternatively,empirical treatment on suspicion of septicaemia should be changed to a carbapenem (meropenem).Carbapenem is the last resort antibiotic to very resistant Gram-negative bacteria, and we should not expectnew and more effective antibiotics to be introduced in the next decade. Furthermore, patients colonized withcarbepenem resistantK. pneumoniaehave already been observed in Denmark. The two patients had beenhospitalised in Greece and were both carrier ofK. pneumoniaewith the transferable KPC-2 gene [Hammerumet al.Int. J. Antimicrob.Agents 2010. 35: 610-612]. Consequently, infections may occur in Denmark for which notreatment options exist.Animal/food data:Yvonne Agersø, Frank M. Aarestrup, Henrik HasmanFor further information: Yvonne Agersø, [email protected]Human data:Dennis S. Hansen, Niels Frimodt-Møller on behalf of the DANRES groupFor further information: Dennis Schrøder Hansen, [email protected]
Focus area
2322
DANMAP 2009
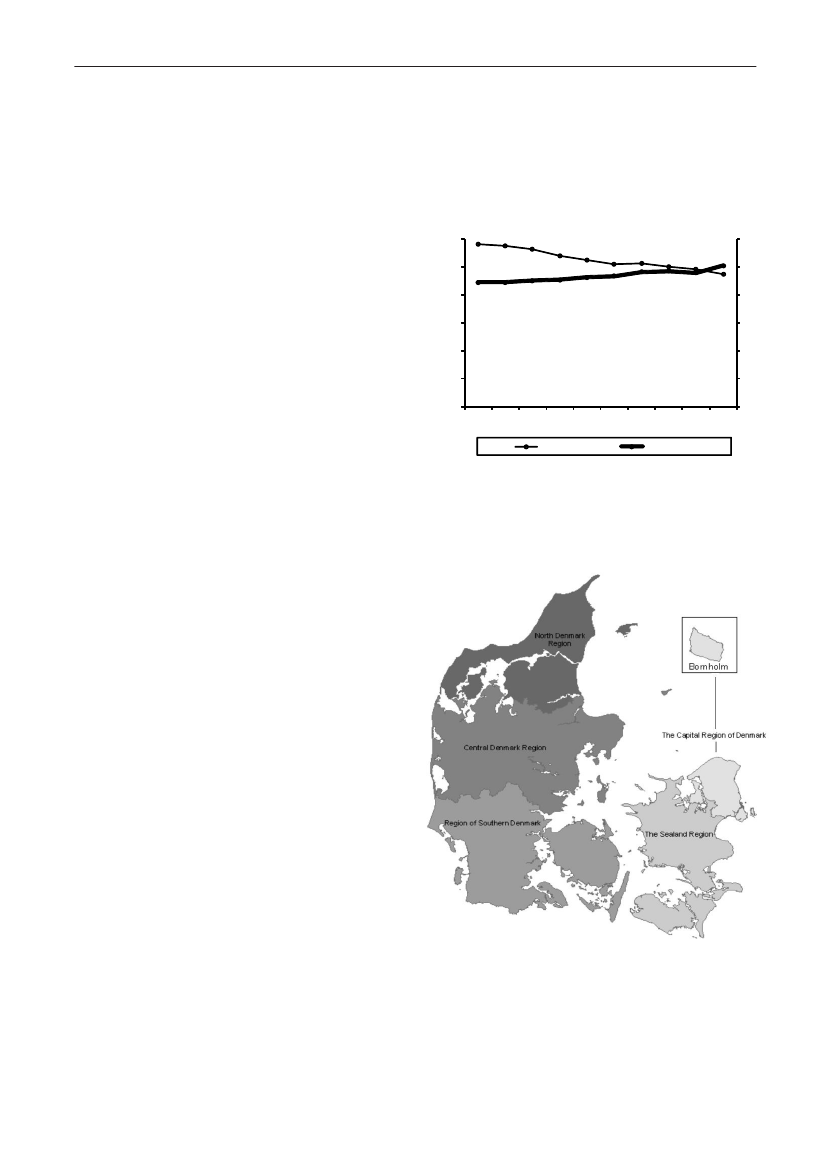
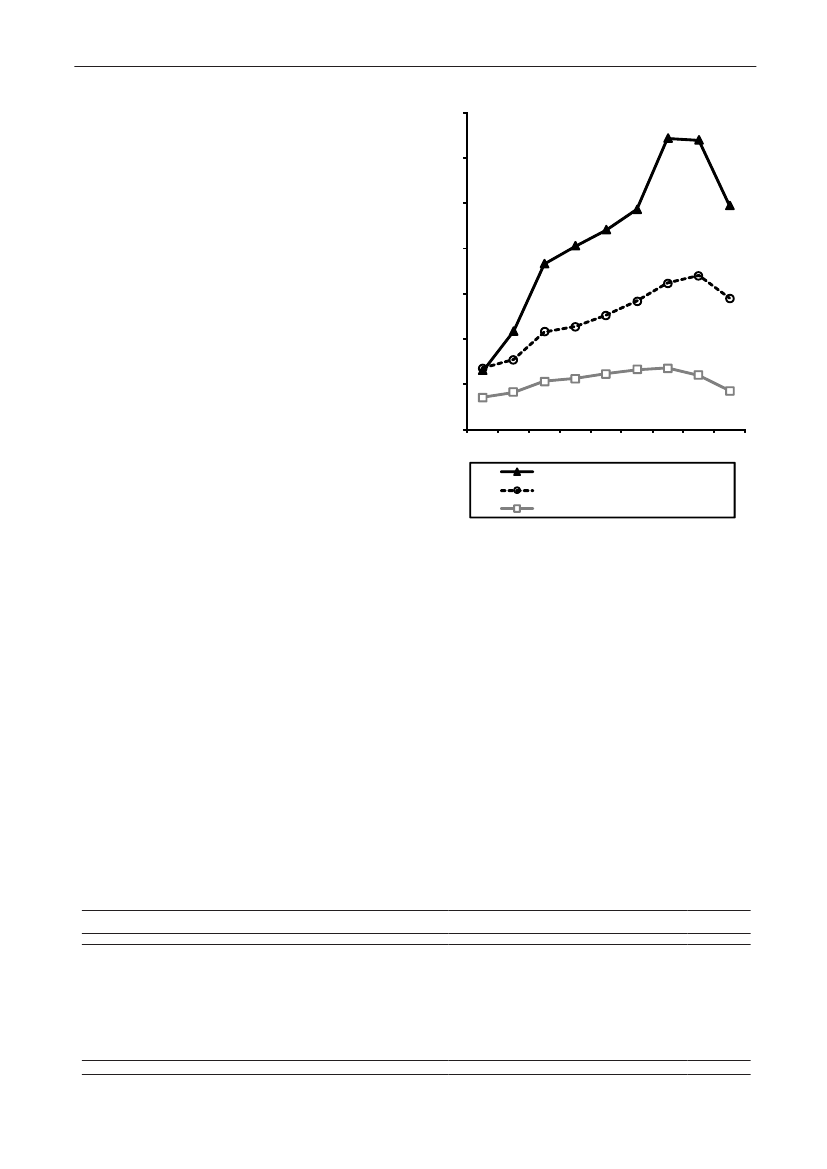
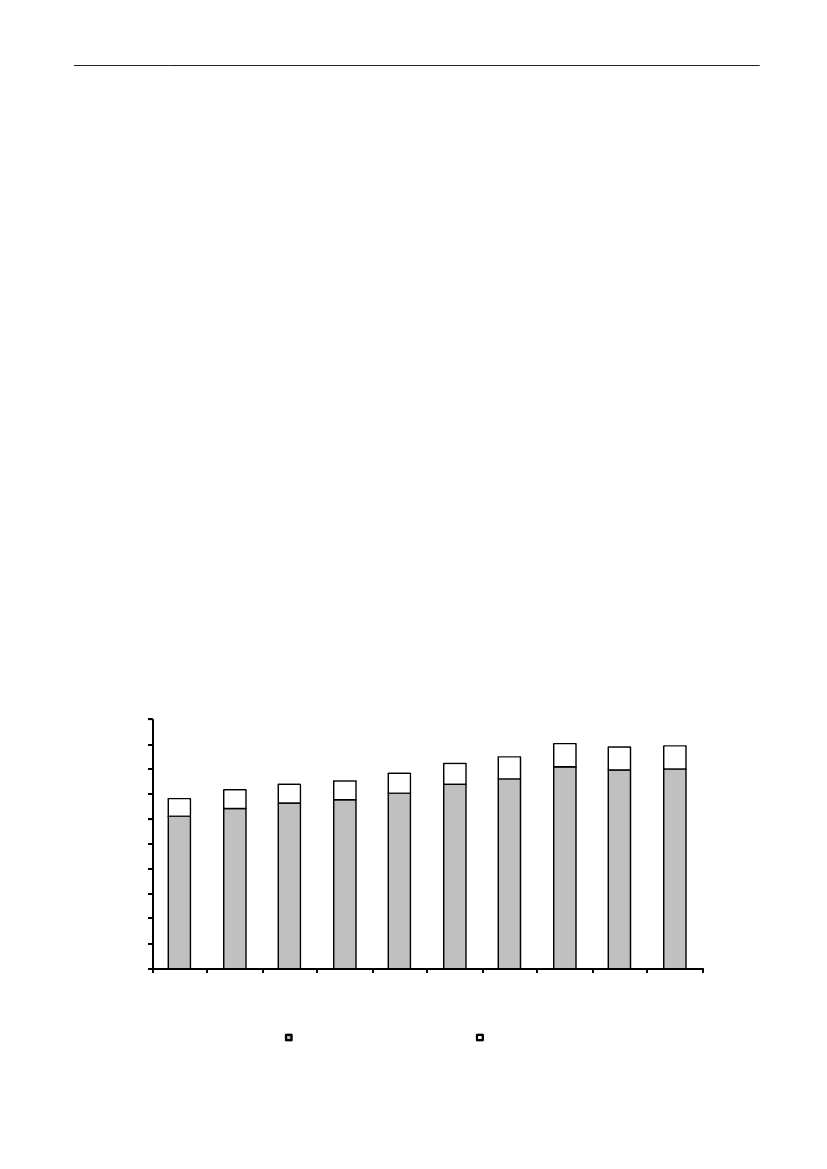
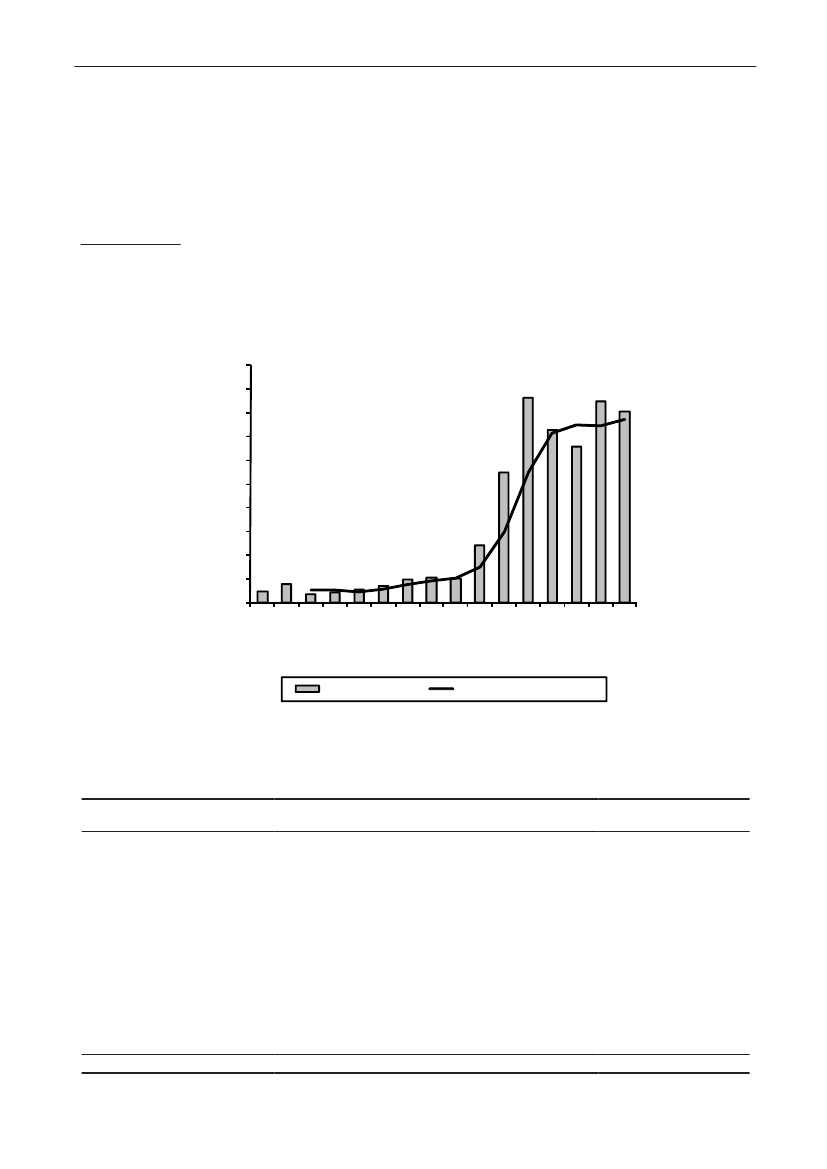
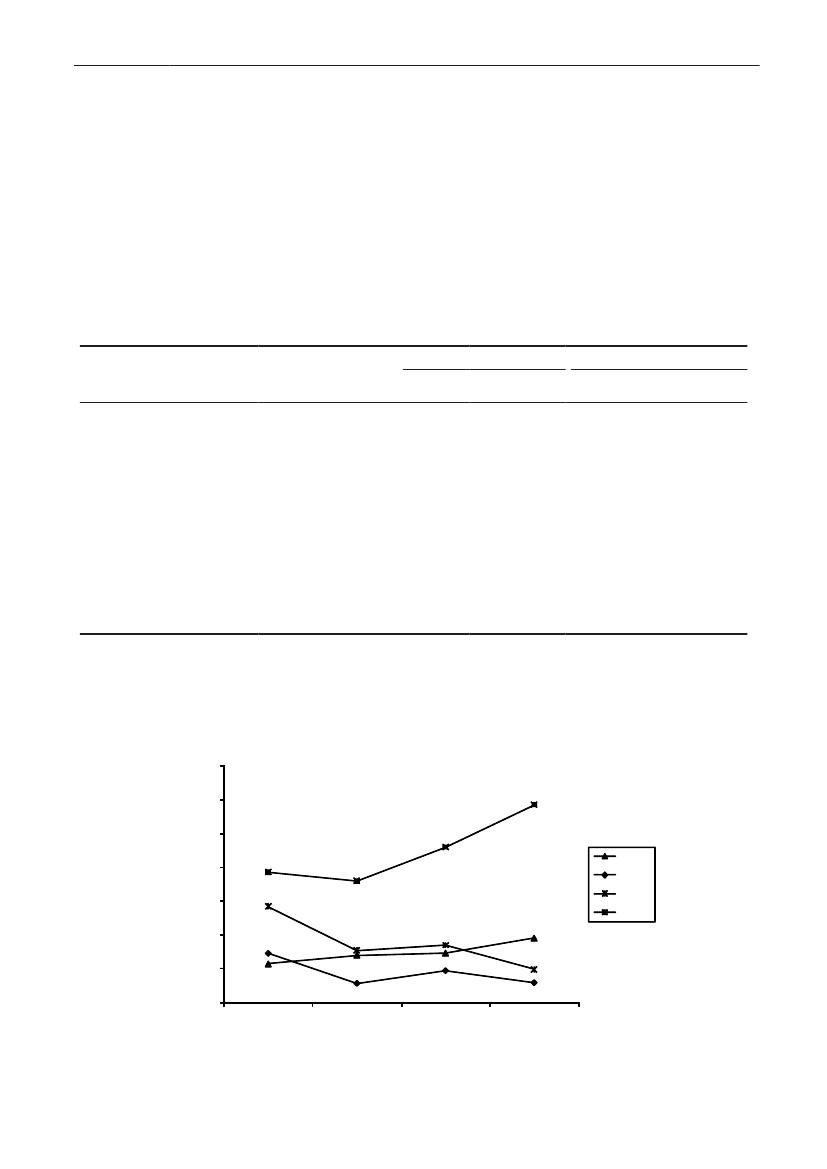
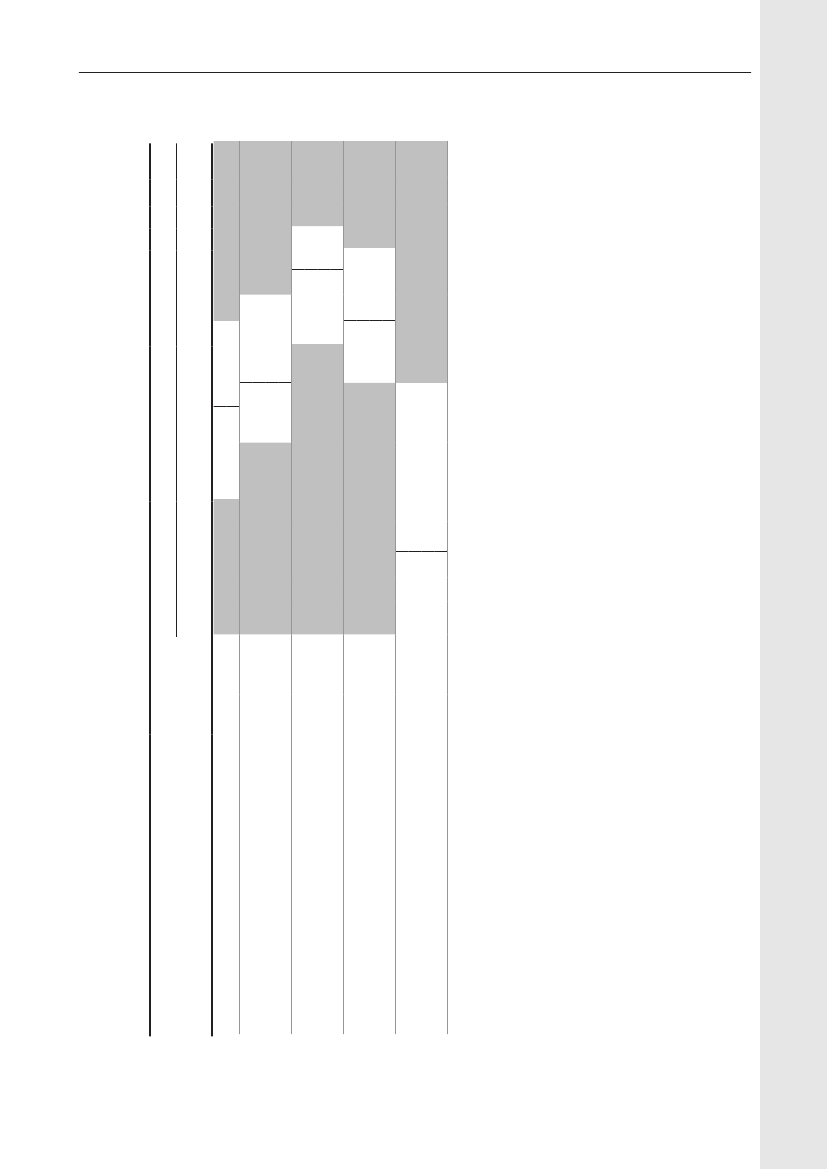
Demographic data - general informationDemographic dataDemographic information is presented in order to showthe magnitude of animal and human populations inwhich antimicrobial agents were used during 2009.The production of food animals (including animals forlive export), meat, and the population of dairy cattleis shown in Table 1. Regarding pigs, the export offattening pigs (15-50 kg) is shown; pigs at this age haveused a large amount of antimicrobial agents relative totheir bodyweight at export, while treatment after exportis not included in this statistics.Table 2 provides information on the distribution ofthe human population in Denmark and on the Danishhealth care system by region. The trends in numbersof occupied bed-days and discharges from somatichospitals 2000–2009 are shown in Figure3.The fiveDanish health care regions are displayed in Figure 4.65
DANMAP 2009
1.51.25
No. discharges (mill.)
No. bed-days (mill.)
432102000 2001 2002 2003 2004 2005 2006 2007 2008 2009
10.750.50.250
Bed-days
Discharges
Figure 3. Number of beddays and discharges in somatichospitals, Denmark
DANMAP 2009
Table 4 shows the antimicrobial agents which areregistered for use to treatment of bacterial infections inanimals and humans. Antimicrobial agents used for bothhumans and animals are shown in italic; furthermore,the growth promoters, which are no longer used foranimals in Denmark, are shown in parentheses. Mostof the antimicrobial agents used for growth promotionin Denmark had effects on Gram-positive bacteria. Theindicator enterococci from animals and meat (and insome years from healthy humans) have been used asa measure of resistance to the growth promoters since1995.
Antimicrobial agents in Denmark
Figure 4. The five health care regions of Denmark
DANMAP 2009
23
Table 2. Production of food animals and the production of meat and milk, DenmarkYearBroilersTurkeysCattle(slaughtered)1,000mill. kgheads7898628137897326916536686256325495095125095070219236210198179171169169161165145140141138137-1Dairy cowsPigsa)Export b)1,0001,000 headsheads16,425-18,442-20,651-20,424-22,738-22,414-23,199-24,203-24,434-25,1411,71225,7582,72025,7633,20426,3113,52227,0784,94327,6036,642234
DANMAP 2009Farmed fishFreshwatermill. kg1,2601,4421,6041,5921,7701,7481,8361,8921,8981,9671,9881,9572,0461,9851,898-4mill. kg-35353232323132343431293130--Saltwatermill. kg-778778889881010--
1,000heads199019921994199619982000200120022003200420052006200720082009Increasec)(%)94,560107,188116,036107,895126,063133,987136,603136,350129,861130,674122,179106,182107,952107,595108,8511
mill. kg116137152149168181192190181181180163178186181-3
1,000mill. kgheads5717611,0919611,1241,0421,0861,0737771,0861,2377851,0091,0681,175102.55.48.69.311.610.313.212.811.219.617.411.314.412.311.1-10
1,000heads7537127007016696366236115965695595565455595692
mill. kgmilk4,5424,4054,4424,4944,4684,5204,4184,4554,5404,4344,4494,4924,5154,5754,7333
Source: Statistics Denmark (www.dst.dk) and The Danish Directorate for Fisheries. All data include export of live animals for slaughtera) Including export of all age groups (not only for slaughter)b) Export of 15-50 kg pigs. These are included in total number of heads, but antimicrobial use after export until slaughter is notregistered as it takes place outside Denmarkc) Increase from 2008 to 2009
Table 3. Distribution of the human population and health care structure by region, DenmarkRegion nameThe Capital Region of DenmarkThe Sealand RegionRegion of Southern DenmarkCentral Denmark RegionNorth Denmark RegionDenmark c)No. inhabitants1,662,285821,2521,199,6671,247,732580,5155,511,451No. inh./km2649113989573128No. inh./GP a)151915821487149816131525GP contacts/1000inhabitant-days18.820.720.820.120.019.9No. bed-days b)1,679,240679,626936,100939,846492,4364,727,248
DANMAP 2009No. dischargesb)428,690189,106256,289266,619118,6521,259,356
a) GP, general practitionerb) Excluding private hospitals, psychiatric hospitals, specialised clinics, rehabilitation centres and hospicesc) Compared to the previous year no. inhabitants have increased by 0.7%, no. bed-days have decreased by 3.5% and no. dischargeshave increased by 5.3% (the number of discharges was affectedly low in 2008 due to a major hospital strike)
2524
DANMAP 2009
Table 4. Systemic antimicrobial agents marketed for the use in animals (incl. intrammamary) and humans, DenmarkDANMAP 2009ATC / ATCvet codesa)Therapeutic groupAntimicrobial agents within the therapeutic groupsb)AnimalsJ01AA / QJ01AA,QJ51AAJ01BA / QJ01BAJ01CA / QJ01CATetracyclinesAmphenicolsPenicillins with extended spectrumChlortetracycline,doxycycline,oxytetracycline, tetracyclineFlorfenicolAmpicillin, amoxicillinBenzylpenicillin,phenoxymethylpenicillin,procaine penicillin, penethamatehydroiodideCloxacillin, nafcillinAmoxicillin/clavulanateCefalexin,cefadroxil, cefapirinCefoperazone, ceftiofur,cefovecinCefquinomeAztreonamMeropenem, ertapenem,doripenemTrimethoprimSulfadimidine, sulfathiazoleSulfadiazine/trimethoprim,sulfadoxine/trimethoprimSpiramycin, tylosin, tilmicosin,acetylisovaleryltylosin,tulathromycinClindamycin,lincomycin(Virginiamycin)c)Streptomycin,dihydrostreptomycin,gentamicin,neomycin, apramycinEnrofloxacin, danofloxacin,marbofloxacin, difloxacin,ibafloxacinOxolinic acid(Carbadox, olaquindox)(Avoparcin)Colistin,(bacitracin)MetronidazoleNitrofurantoinSpectinomycinTiamulin, valnemulin(Monensin, salinomycin)(Avilamycin)(Flavomycin)Vancomycin, teicoplaninColistinFusidic acidMetronidazoleNitrofurantoinMethenamine, linezolid,daptomycinTobramycin,gentamicinOfloxacin, ciprofloxacin,moxifloxacinSulfamethizoleSulfamethoxazole/trimethoprimErythromycin, roxithromycin,clarithromycin, azithromycinClindamycinHumansDoxycycline,lymecycline,oxytetracycline, tetracycline,tigecyclineAmpicillin,pivampicillin,amoxicillin,pivmecillinam,mecillinamBenzylpenicillin,phenoxymethylpenicillinDicloxacillin, flucloxacillinAmoxicillin/clavulanate,piperacillin/tazobactamCefalexinCefuroximeCefotaxime, ceftazidime,ceftriaxone
J01CE / QJ01CEJ01CF / QJ51CFJ01CR / QJ01CRJ01DB / QJ01DB,QJ51DAJ01DCJ01DD / QJ01DD,QJ51DAJ01DE / QJ51DAJ01DFJ01DHJ01EAJ01EB / QJ01EQ,QJ51RJ01EE / QJ01EWJ01FA / QJ01FAJ01FF / QJ01FFJ01FG / QJ01XX
Beta-lactamase sensitive penicillinsBeta-lactamase resistant penicillinsComb. of penicillins, incl. beta-lactamase inhibitorsFirst-generation cephalosporinsSecond-generation cephalosporinsThird-generation cephalosporinsFourth-generation cephalosporinsMonobactamsCarbapenemsTrimethoprim and derivativesShort-acting sulfonamidesComb.of sulfonamides andtrimethoprim, incl. derivativesMacrolidesLincosamidesStreptogramins
J01G,A07AA / QJ01G,QA07AAd)Aminoglycosides
J01MA / QJ01MAQJ01MBQJ01MQJ01XAJ01XB,A07AA / QA07AAd)J01XCJ01XD,P01AB / QJ01XDd)J01XE / QJ01XEJ01XX / QJ01XX,QJ01FFQJ01XX9QP51AHNot in ATCvetNot in ATCvet
FluoroquinolonesOther quinolonesQuinoxalinesGlycopeptidesPolypeptides (incl. polymyxins)Steroid antibacterialsImidazole derivativesNitrofurane derivativesOther antibacterialsPleuromutilinsPyranes and hydropyranes(ionophores)OligosaccharidesFlavofosfolipols
a) ATCvet codes starts with a Qb) Antimicrobial agents that are used in both humans and animals are listed in italics, animal growth promoters used before 1999 are listedin parenthesesc) Pristinamycin and quinupristin/dalfopristin (for humans) are not used in Denmarkd) Although intestinal antiinfectives (A07AA) and nitroimidazole derivatives for protozoal diseases (P01AB) are used to treat human patients,they are not reported by DANMAP
DANMAP 2009
25
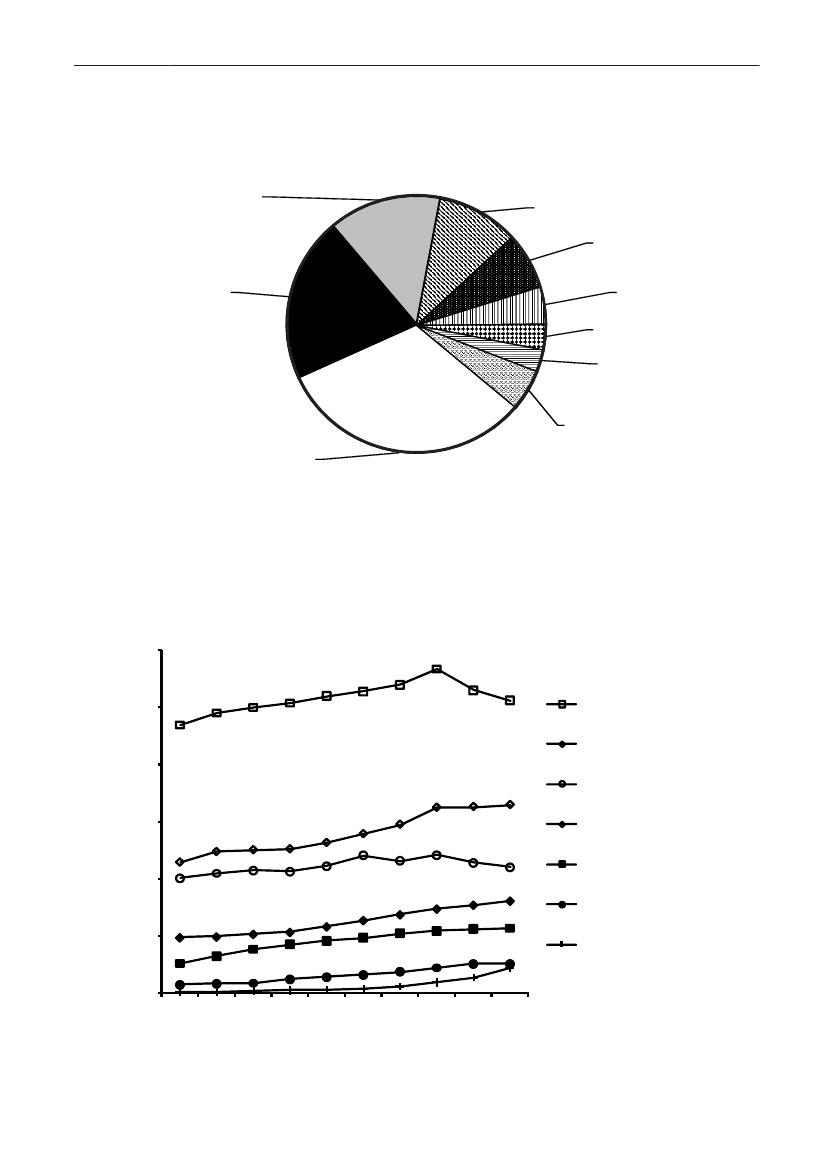
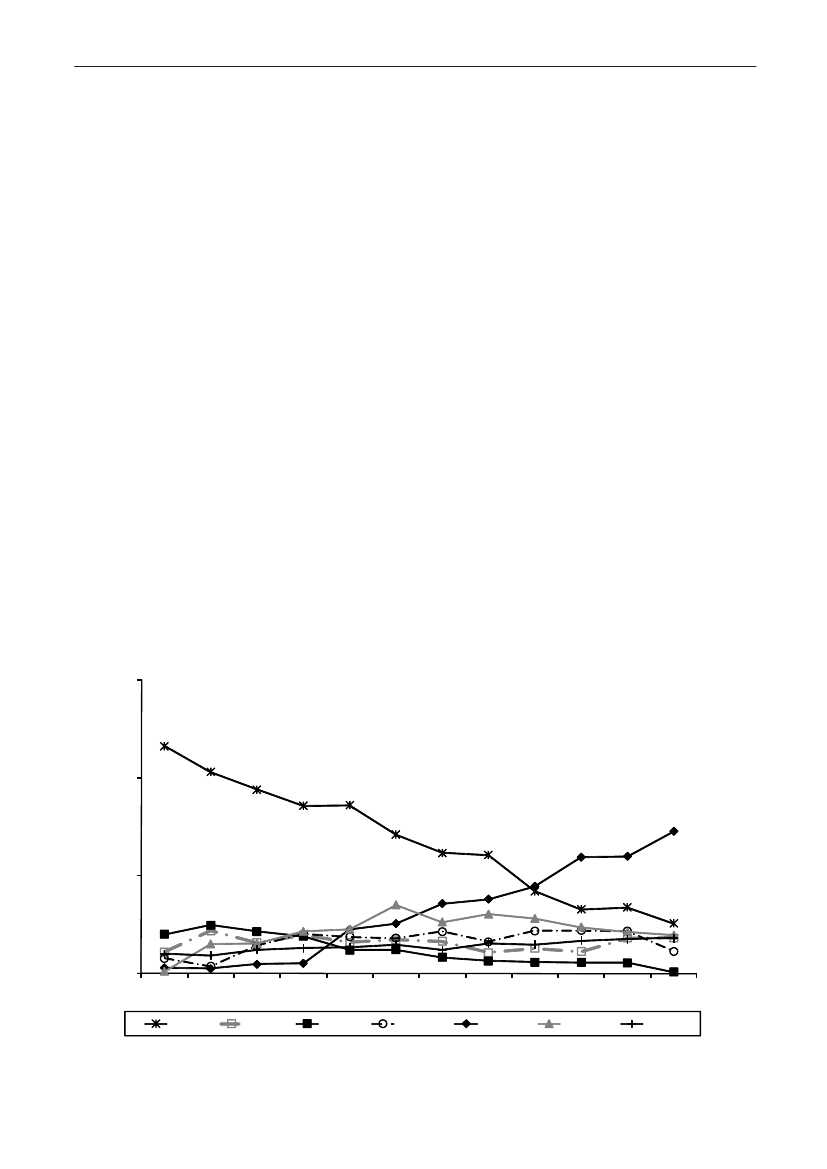
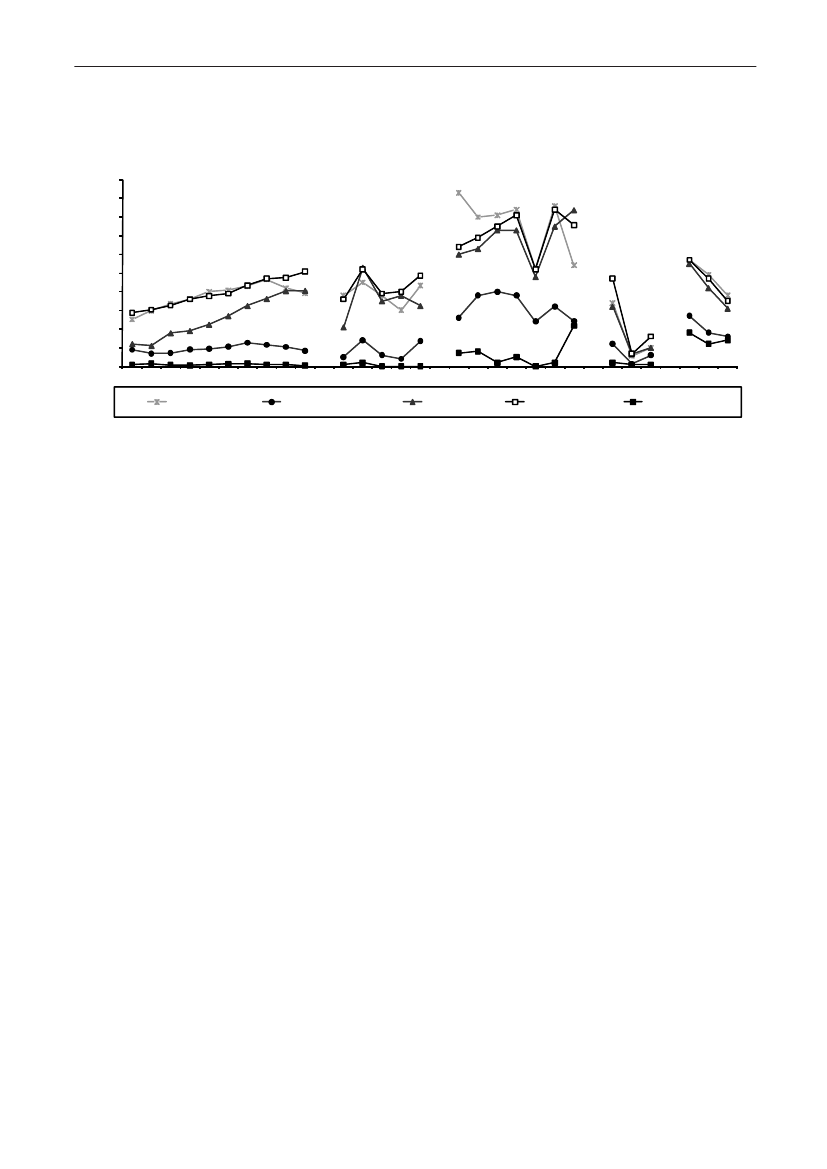
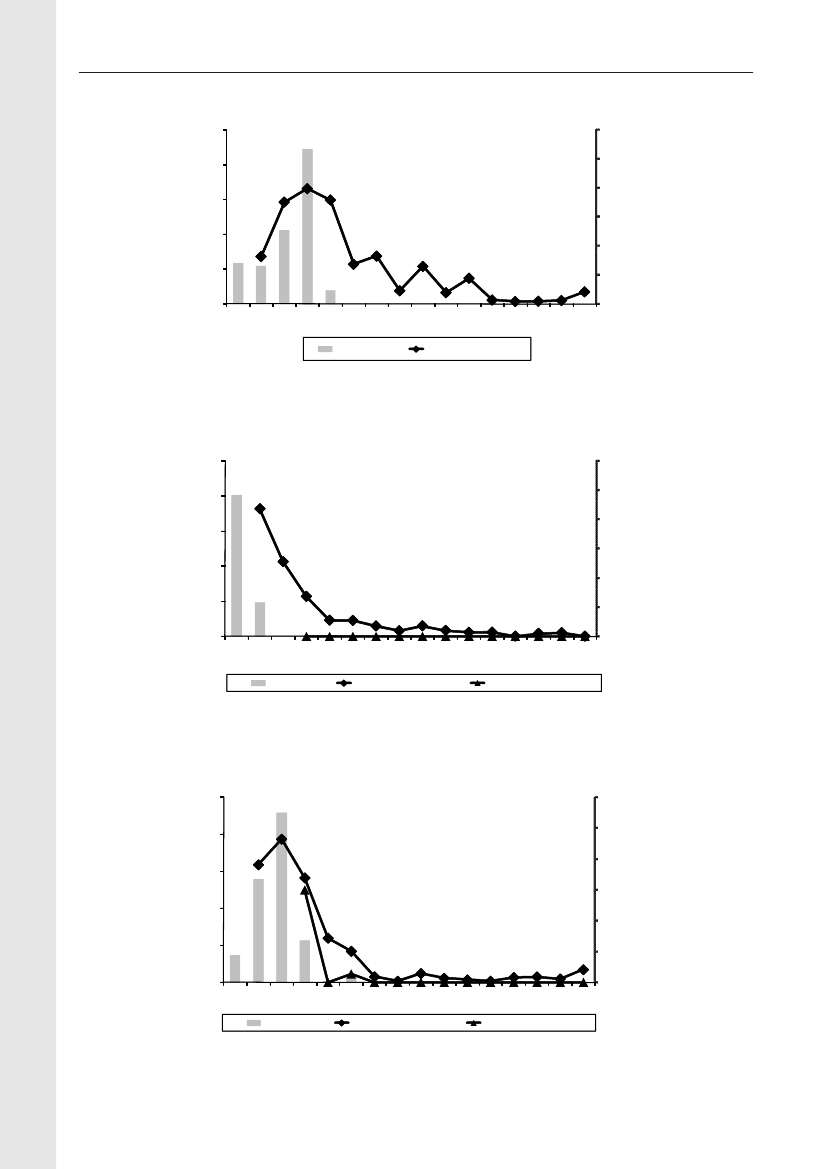
Antimicrobial consumptionAntimicrobial consumption in animalsSince 2001, detailed data on all prescriptionmedicines for animals have been registered in theVetStat database. VetStat is a relational database,meaning that information on e.g. a given item, animalspecies or the defined daily dose is registeredon separate tables in the database. Some of therecorded codes refer to other relational databases,e.g. the Central Husbandry Register and the registerof authorized veterinarians. In 2009, a thoroughrevision of the data on medicinal products andthe defined animal daily doses (ADD) in VetStatwas performed. In addition, the principles for theADD calculation was changed regarding medicinalproducts with prolonged effect (>24 hours) (Forfurther information seeText Box 1).At the sametime it was decided that active ingredients shouldconsistently be calculated as the molecular weightof the base; this reduced the amounts measuredof tetracyclines and pleuromutilins in 2005-2008.Therefore, in this report all data back to 2001 wereupdated.In DANMAP, overall antimicrobial consumption ismeasured in kg active substance, while analyses oftrends within species are measured in Defined AnimalDaily Doses compared to the animal production (Table2). Production is measured in kg-meat-produced (pork,poultry, cattle) and number of animals slaughtered orexported (pigs).In 2009, the total veterinary consumption ofantimicrobial substance amounted to 129.7 tonnes(see details in 6), representing a 10.4% increaserelative to 2008. This increase was mainly attributableto increase in consumption in pigs. The distribution ofantimicrobial agents among the major species has notchanged importantly from previous years. In 2009, theantimicrobial consumption in pigs and cattle comprised80% (103.7 tonnes) and 12% (15 tonnes) of the totalveterinary consumption, respectively. The consumptionof antimicrobial agents in poultry increasedsubstantially, but still comprised only 0.5% of the totalconsumption in 2009. The consumption of antimicrobialagents in companion animals (pet animals and horses)was unchanged at an estimated 2.2 tonnes.For production animals in general, the consumptionof antimicrobial agents has increased gradually by59% from 2000–2009 (see details in Table 5), mainlydue to an increasing consumption in pigs. During thesame period, the meat production from all species hasincreased by 5.5%, from 2.1 billion kg to 2.2 billionkg meat, including export; the milk production hasincreased by 4.7% in the same period (Table 2).
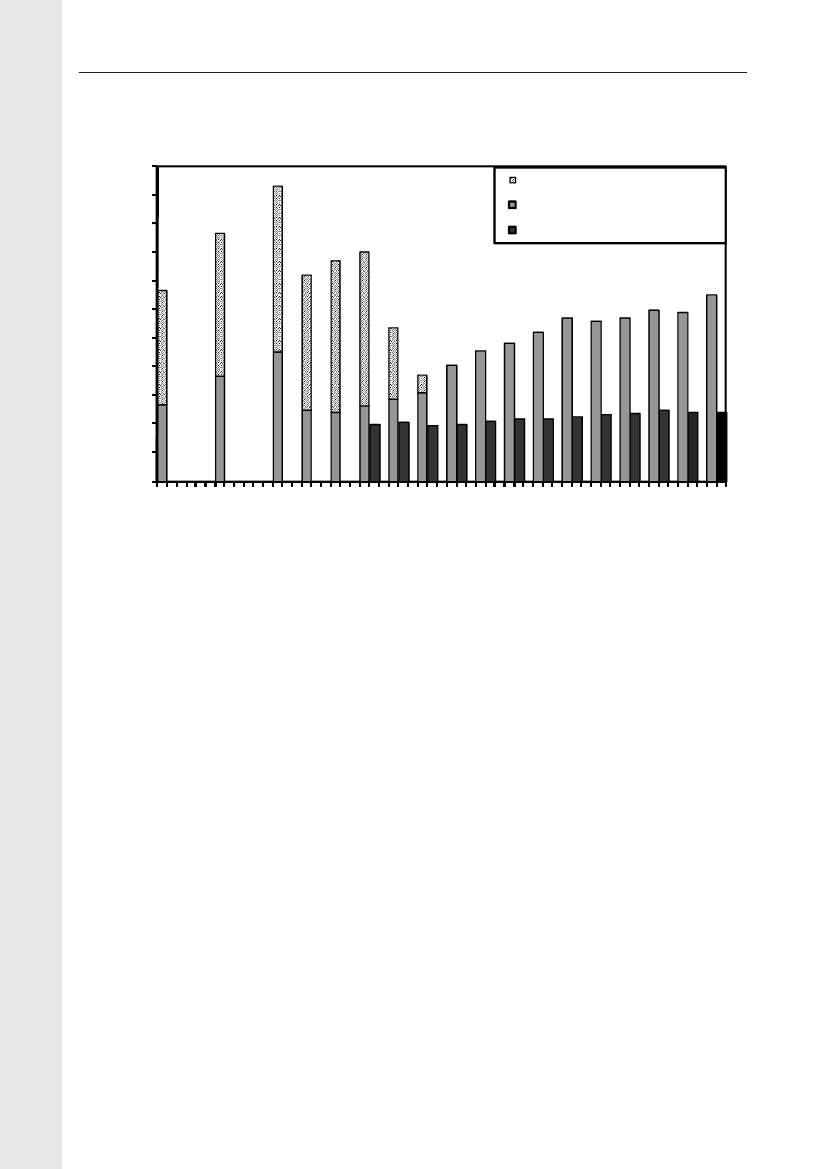
Table 5. Trends in the estimated total consumption (kg active compoundb) of prescribed antimicrobials for productionanimals, DenmarkDANMAP 2009ATCvetgroup a)QJ01AAQJ01CEQJ01C/QJ01DQJ01EWQJ01EQQJ01FQJ01XQQJ01G/QA07AATotalTherapeutic groupTetracyclinesPenicillins, b-lactamasesensitiveOther penicillins,cephalosporinsSulfonamides +trimethoprim c)Sulfonamides199019921994199619982000200220042005200620072008200938,40025,95012,25014,95044517,35010,6506,3501,900
9,300 22,000 36,500 12,900 12,100 24,000 23,950 29,350 29,550 31,800 36,600 35,4005,000 6,700 9,400 7,200 14,300 15,100 17,500 20,900 22,250 22,650 23,850 23,9501,200 2,500 4,400 5,800 6,700 7,300 9,750 12,500 11,900 11,200 11,200 10,8503,800 7,900 9,500 4,800 7,700 7,000 7,800 11,500 11,950 13,400 13,800 13,3008,700 5,900 5,600 2,100 1,000 1,000900850750750700600
Macrolides, lincosamides 10,900 12,900 11,400 7,600 7,100 15,600 13,200 16,150 15,300 14,350 16,500 15,250Pleuromutilins d)AminoglycosidesOthers c)4,4506,6006,5006,3506,1008,1001,1509,2006,0001,650
7,700 8,500 8,600 7,100 7,800 10,400 11,700 11,600 10,750 10,5506,700 6,800 4,4006006503007009501,2001,200
53,400 73,200 89,900 48,000 57,300 80,700 90,000 110,400 110,100112,300 118,000 116,100 128,300
1990–2000: Data based on reports from the pharmaceutical industry of total annual sales. (Data 1990–1994: Use of antibiotics in the pigproduction. Federation of Danish pig producers and slaughterhouses. N. E. Rønn (Ed.). 1996–2000: Danish Medicines Agency). Data2001–2006: VetStat. For comparability between VetStat data and previous data, see DANMAP 2000. Only veterinary drugs are included.Veterinary drugs almost exclusively used in pets (tablets, capsules, ointment, eye/ear drops) are excluded. Dermal spray with tetracycline,extensively used in production animals, is the only topical drug included.a) Only the major contributing ATCvet groups are mentionedb) Kg active compound rounded to nearest 50 for antimicrobial classes and 100 for totalsc) Consumption in aquaculture was not included before 2001d) Pleuromutilins included in macrolide-group before 2001
2726
DANMAP 2009
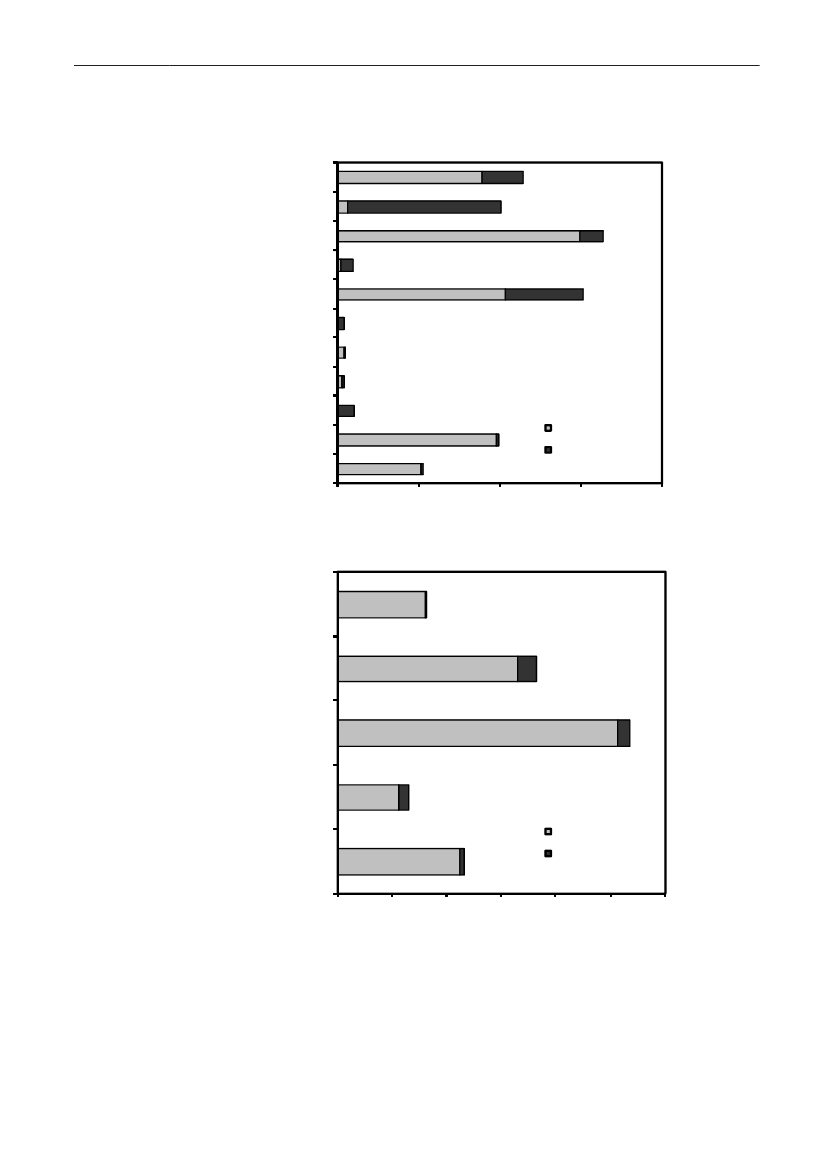
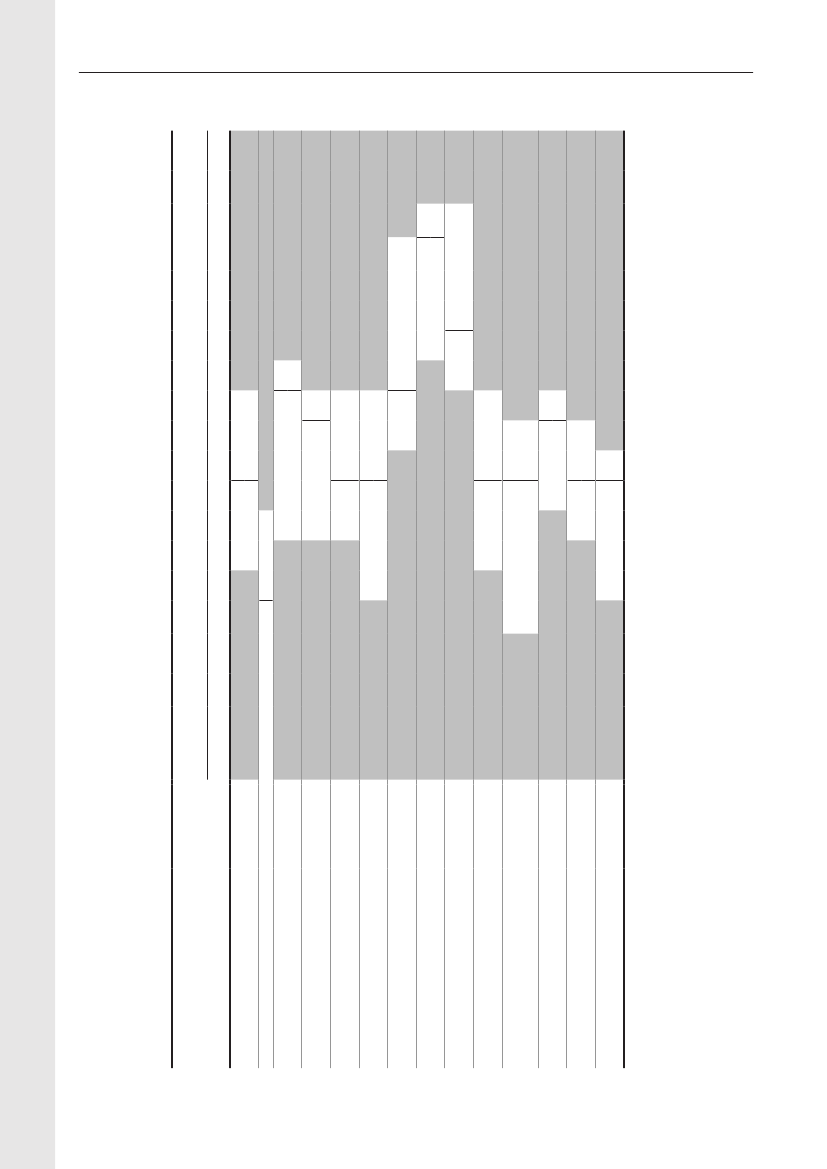
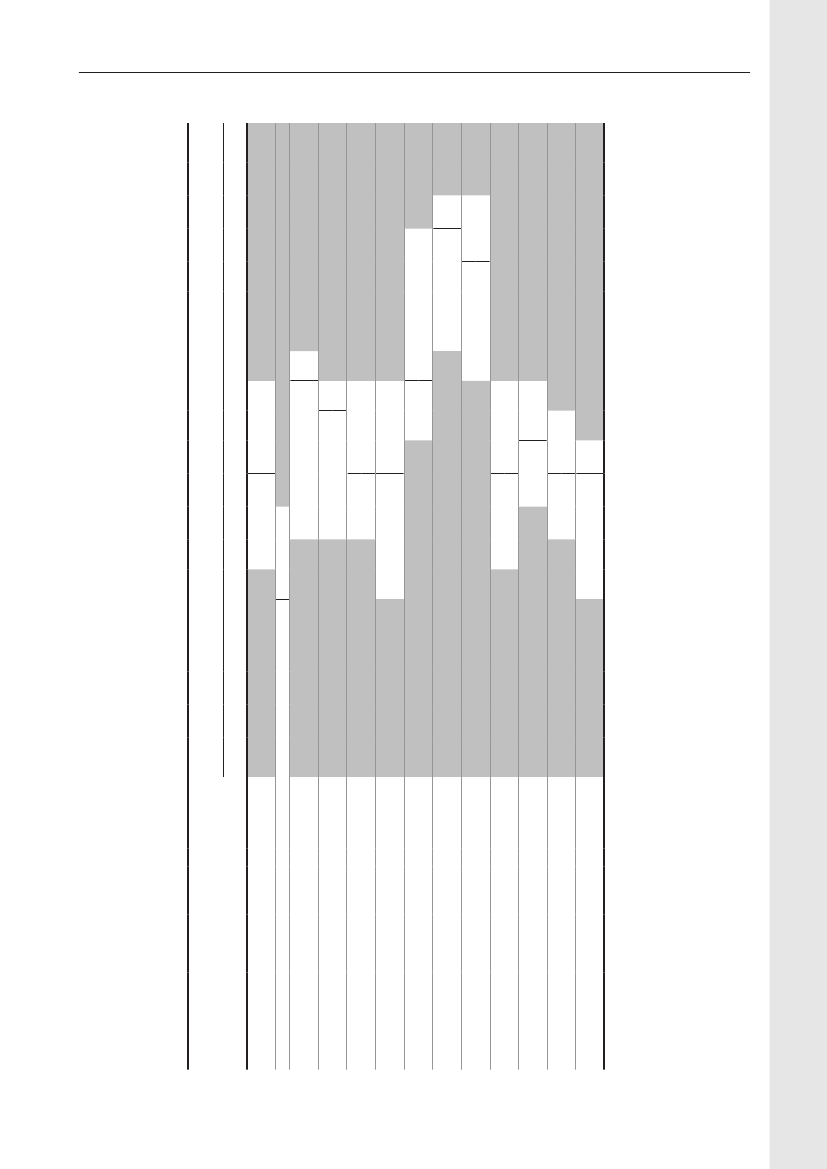
Table 6. Antimicrobials sold (kg active compound) from pharmacies and feedmills by animal species and age group,DenmarkDANMAP 2009Therapeutic groupATCvet groupsa)Pigs- Sows and piglets- Weaners- Finishers- Age not givenCattle b)- Cows and bulls- Calves<12 months- Heifers, Steers- Age not givenPoultry- Broilers- Rearing, broilers- Layers, primatilyrearing- Turkeys- Geese and ducks- Gamebirds- species unknownOther species-Small ruminants- Fur animals- Aquaculture- Other productionanimals- Horses- Pet animals- Farm identified c)<0.10.2197<0.1<0.10.30.50.4202<0.12160.3<0.1<0.1<0.110.497<0.101<0.10.20.15<0.1007580010098<0.10.90.216<0.1338200.9160.20000.1010110.78111948161000.80.40100.4041000000000.24000.10.1000000000.300.2020.60.2422218515320000000.20451800.302110010564013704944-167316498022202<0.1<0.1<0.1<0.10.114<0.1242,8003,3003810448980.95500.6401111783217919170.300000<0.14123122444717733852455270219133810.21000000000.44<0.1<0.124390.4101002,01328711248324120.22,1922,58327923841041<0.100<0.100007888911,102171,0627,5514,710772,0023,7324,823589,9191,6056,185874,425 7,1271,427670.00981101534356442283671150.64<0.1<0.12,5121,63335463,577573415431,31540,78831,0545403,058 1,845 19,148146 12,36137168Amcol AmglcCephFQQuinolLincoMacroPleuroPen-b-sensPen- Sulfa-other TMPTet OthersTotal
QJ01B QJ01G QJ01D QJ01MAQJ01MB QJ01FF QJ01FA QJ01XX QJ01CE QJ01CA QJ01E QJ01AA QJ01X
3 2,342311170.520871870.2
For use in vet. practice d)- Pet animals- Horses or petanimals- Pigs- Cattle- Small ruminants- Fur animalsSpecies unknown- Topical drugs- Intramammaries- Micellaneous d)Total101690431636,3360524585<0.100.12300076804123,048005006088276012096<0.1940651052720.262308923200870.10311225911102510.4<0.139<0.1090.1<0.12<0.10000900460.30.160<0.145<0.102590.100.104190025854115,0773053846325203113234070531,5376172200.53<0.1014371892910,9041796
1,269 1,953
14,395 10,647 26,007
12,633 15,652 38,475
460 129,718
Amcol=amphenicols; Amglc=aminoglycosides; Ceph=cephalosporins; FQ=fluoroquinolones; Quinol=other quinolones; Linco=lincosamides;Macro=macrolides; Pleuro=Pleuromutilins; Pen-b-sens=beta-lactamase sensitive penicillins; Pen-other=penicillins with extended spectrum,cloxacillin and amoxicillin/clavulanic acid; Sulfa-TMP=sulfonamides+trimethoprim; Tet=tetracyclines. Sulfaclozin (a prescription coccidiostat) isincluded in the sulfonamide/trimethoprim groupa) Only the ATC group contributing mostly to the antimicrobial group are mentioned. Combination drugs are divided into active compoundsb) Only 20% of the prescribed antimicrobials for cattle are purchased at pharmacies. The remaining 80% are either administered or handedout by veterinary practitioners. The proportions used in various species in practice is estimated from identification of practice type, andinformation from the repoting from large animal practice. The consumption in poultry practice and aquaculture is more precise, and includedtogether with the consumption from the pharmaciesc) Sales to farmers (valid farm ID code), animal species not identifiabled) This group contains drugs purchased mainly by veterinarians working in mixed practice
DANMAP 2009
27
Antimicrobial consumption in pigs
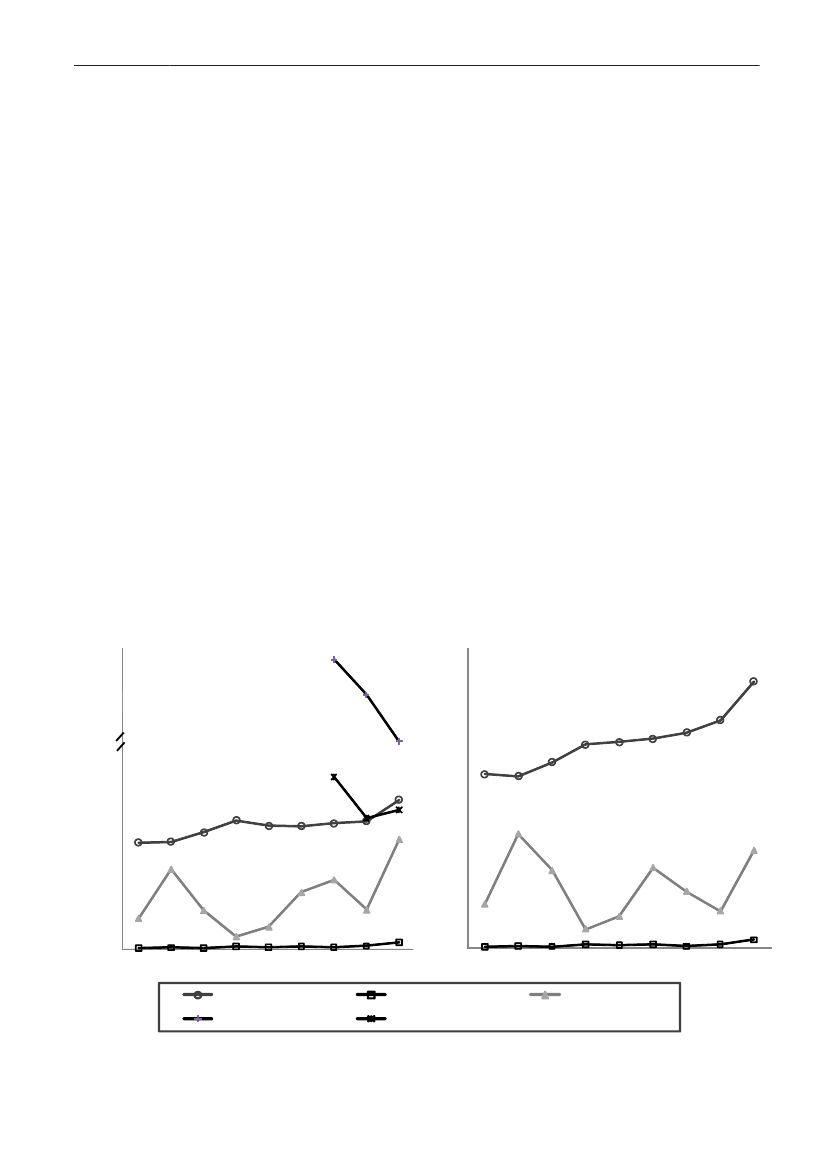
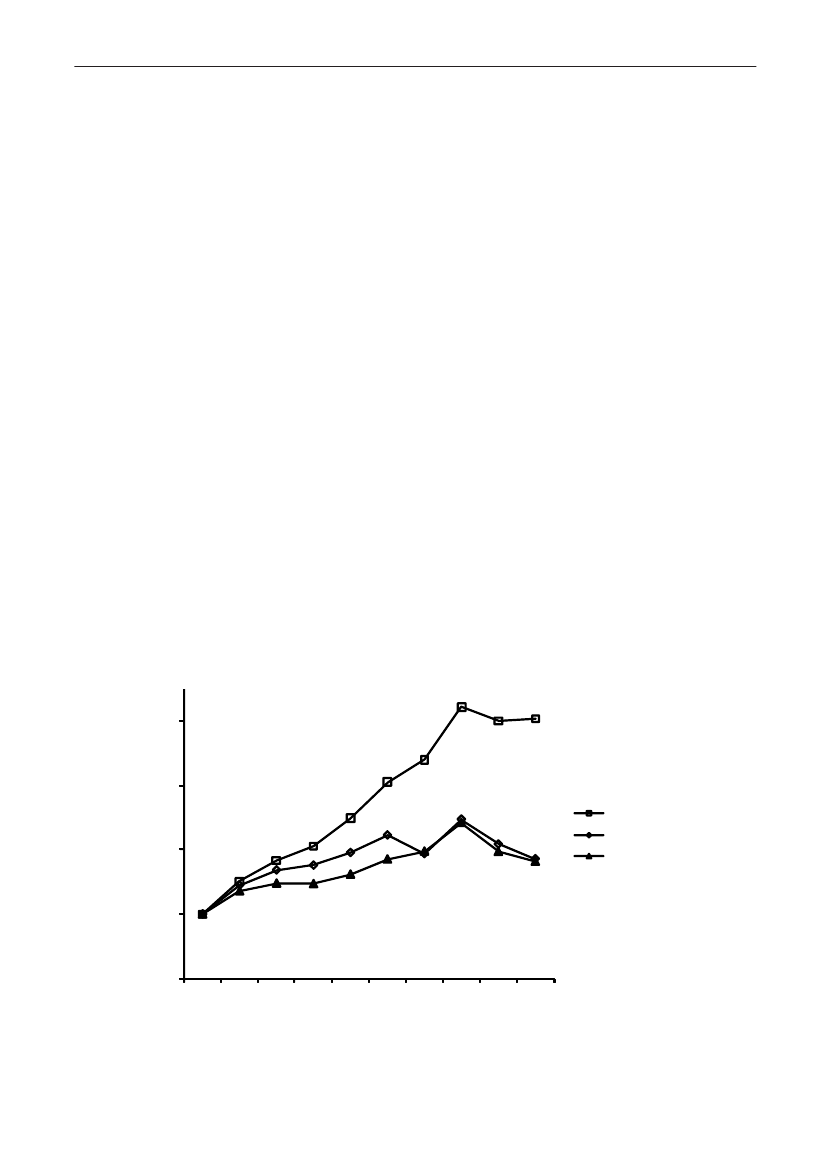
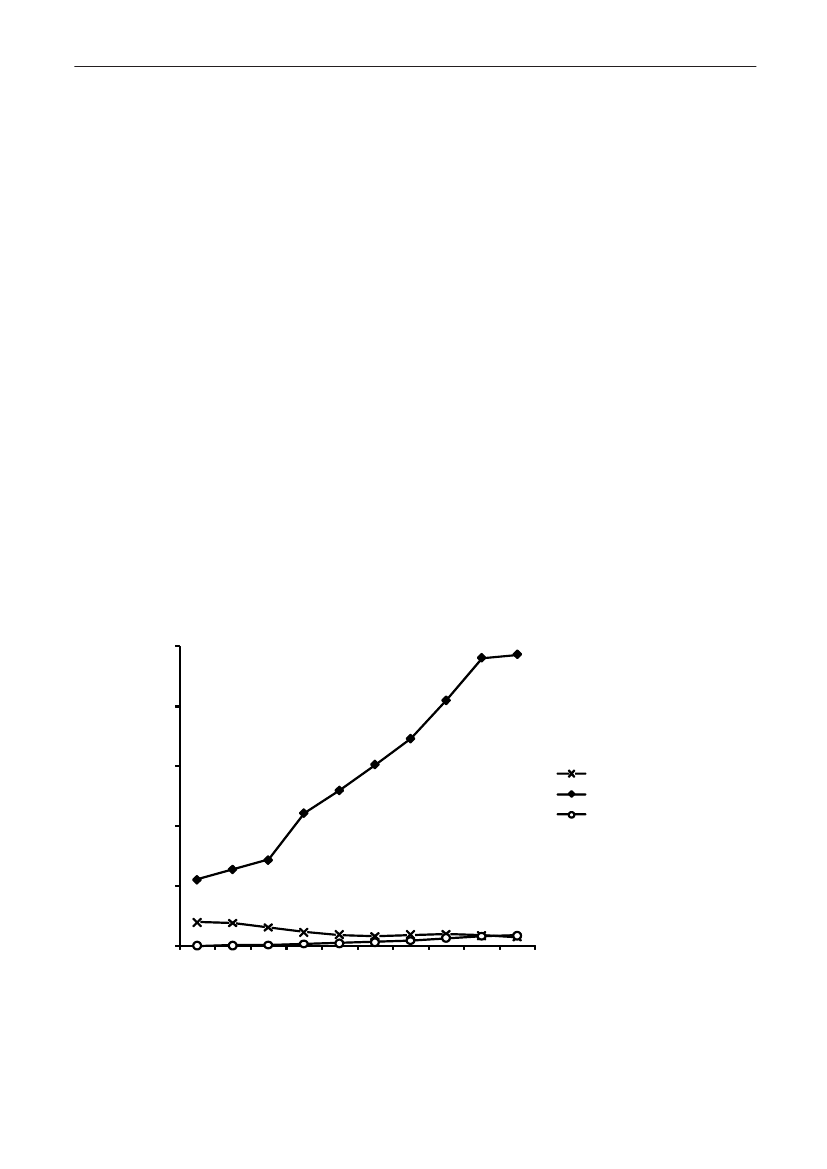
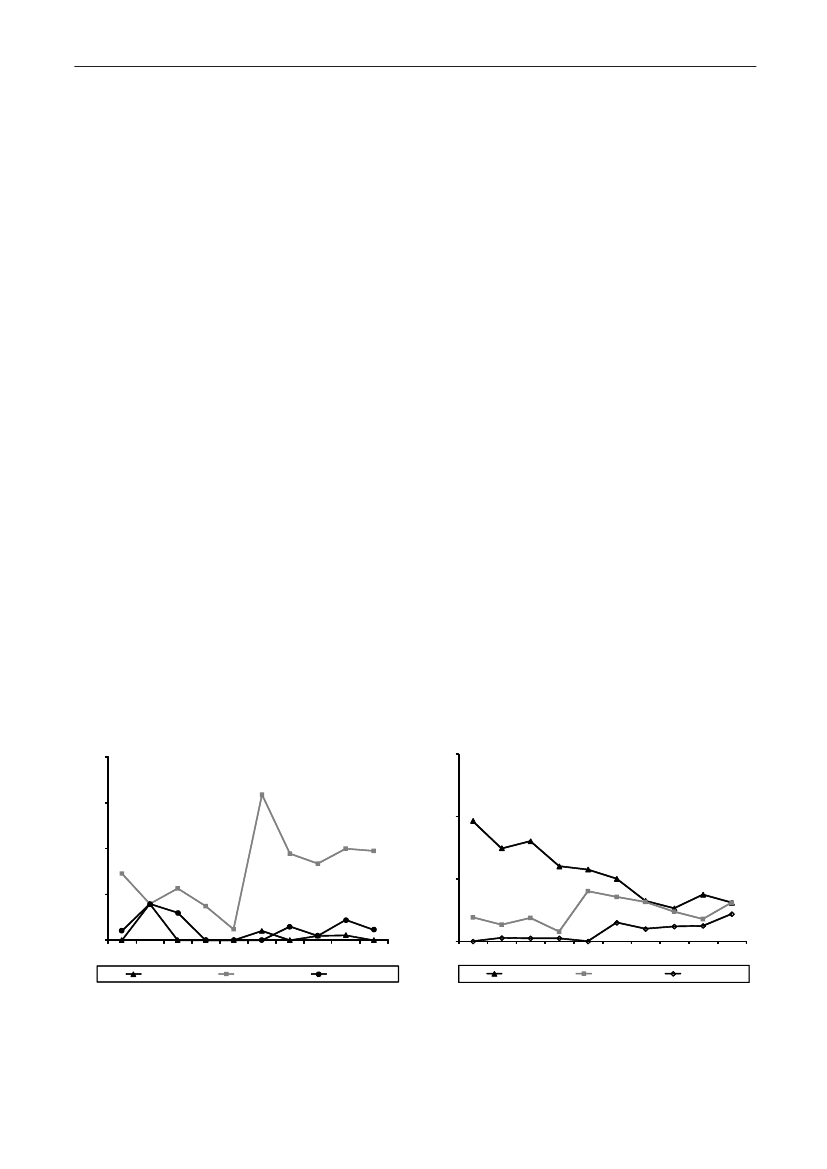
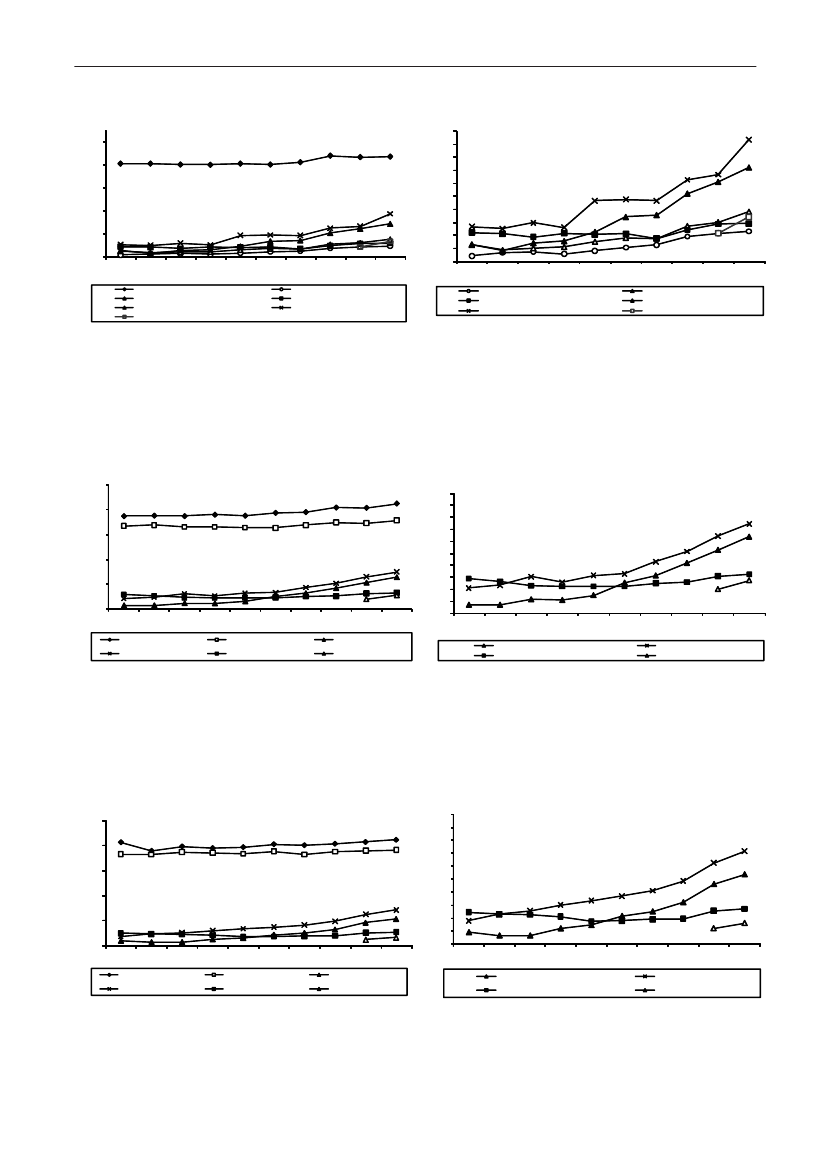
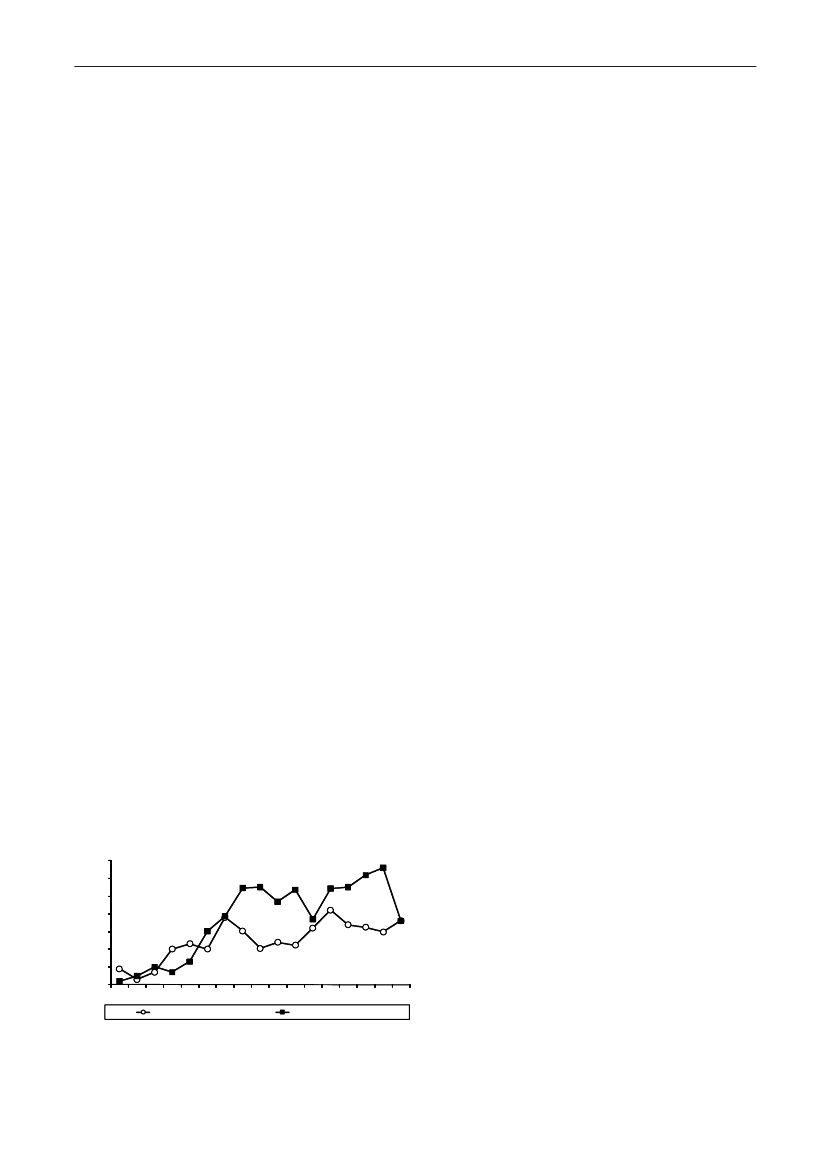
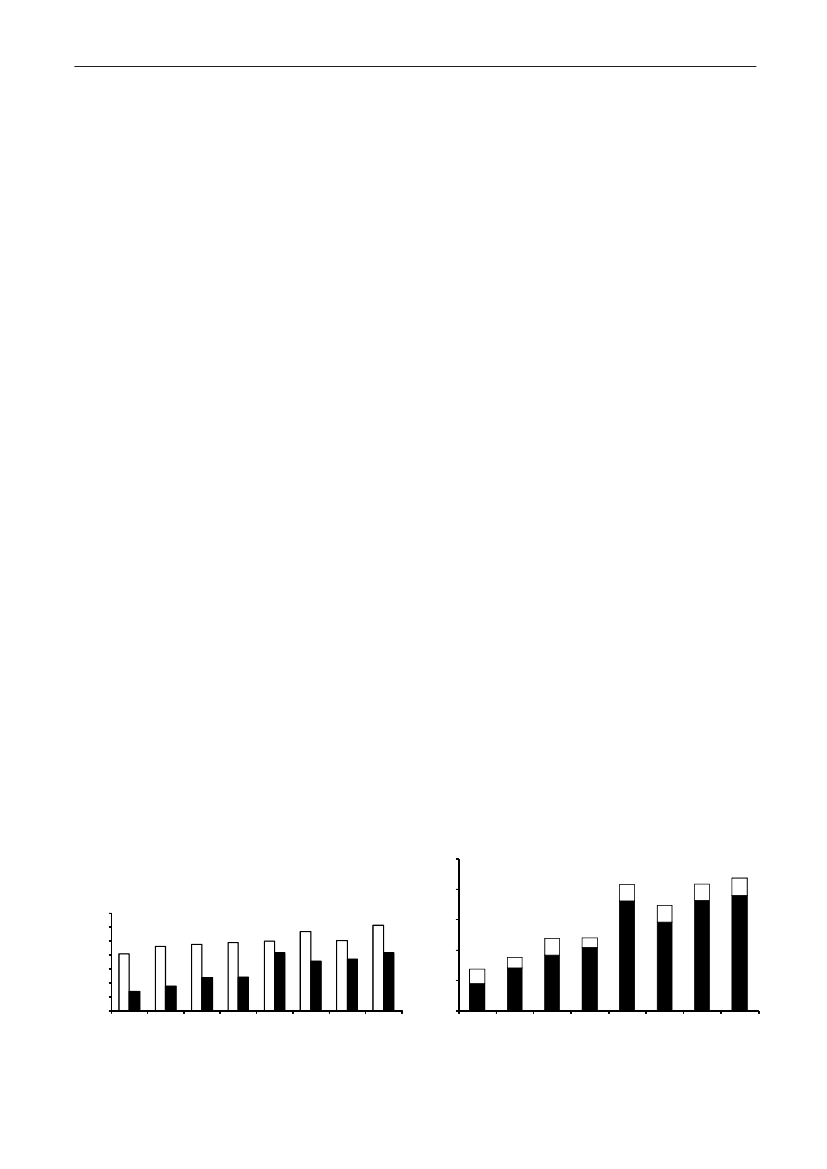
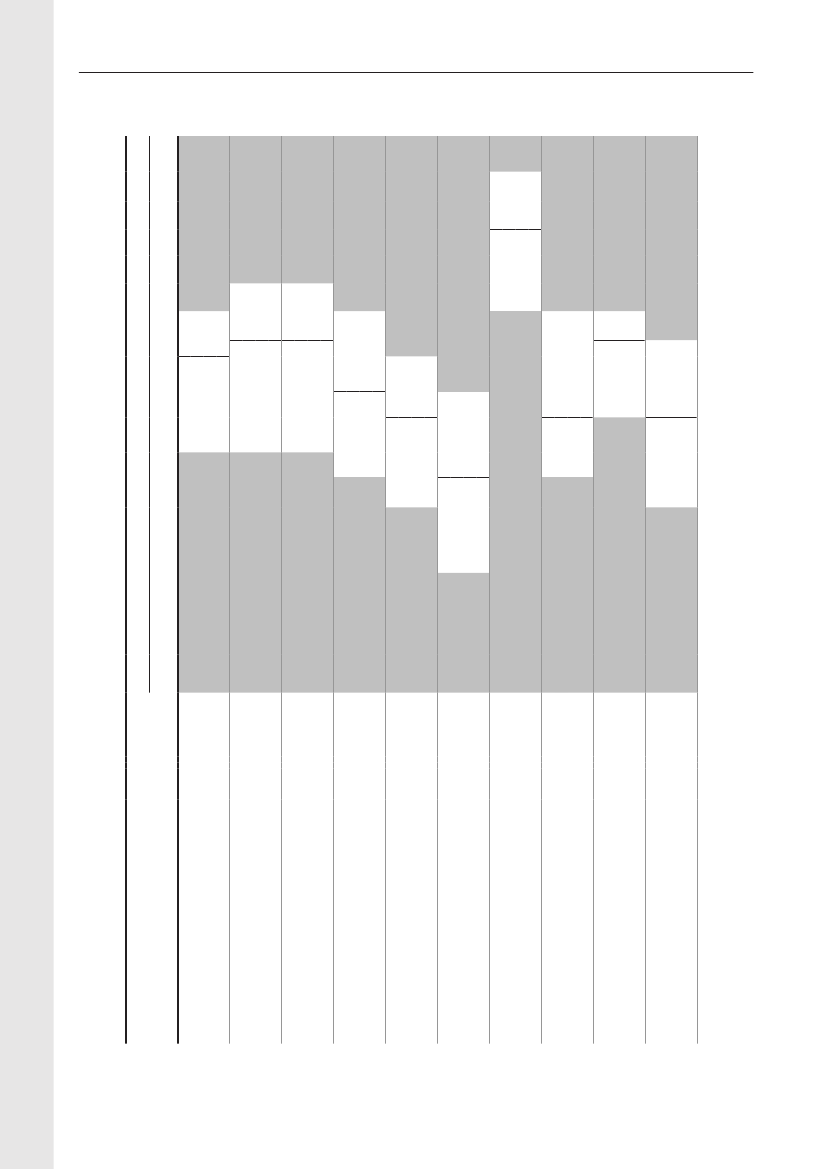
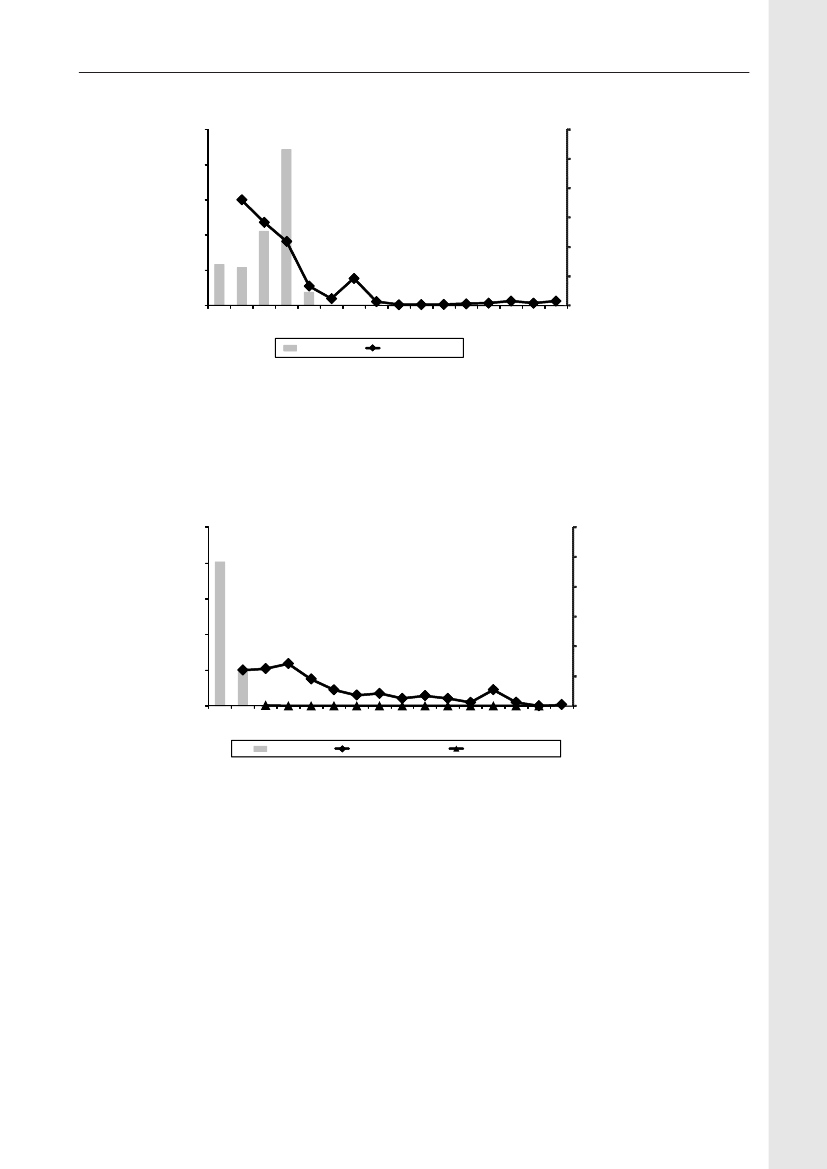
In 2009, the total antimicrobial consumption in pigswas 103.7 tonnes active substance (See Table 6 fordetails), representing an 11% increase from 2008, whilethe consumption increased by 12% when measuredin doses, ADDkg(calculated from figures in Table 34 inAppendix 1). Relative to production, the consumptionincreased to 54.6 mg/kg pork produced or 4.9 ADDkg/kgpork produced, which is high compared to consumptionin poultry, but low compared to consumption inaquaculture (Figure 5).Number of heads produced (slaughtered or exported)increased by 2%, while the production decreased by4% measured in kg meat produced, i.e. slaughteredin Denmark (Table 2). This apparent divergence ismainly due to an increasing number of pigs exportedaround 30 kg, involving 24% of pigs produced in2009. As a consequence, measuring antimicrobialuse against kg-pork-produced tends to overestimatethe increase in treatment frequency, while measuringconsumption against number of pigs produced tendsto underestimate the treatment incidence. This isillustrated in Figure 6, showing the development in theantimicrobial use per pig produced and per kg porkproduced (including export of finishers for slaughter).In between these two graphs is a line showing an
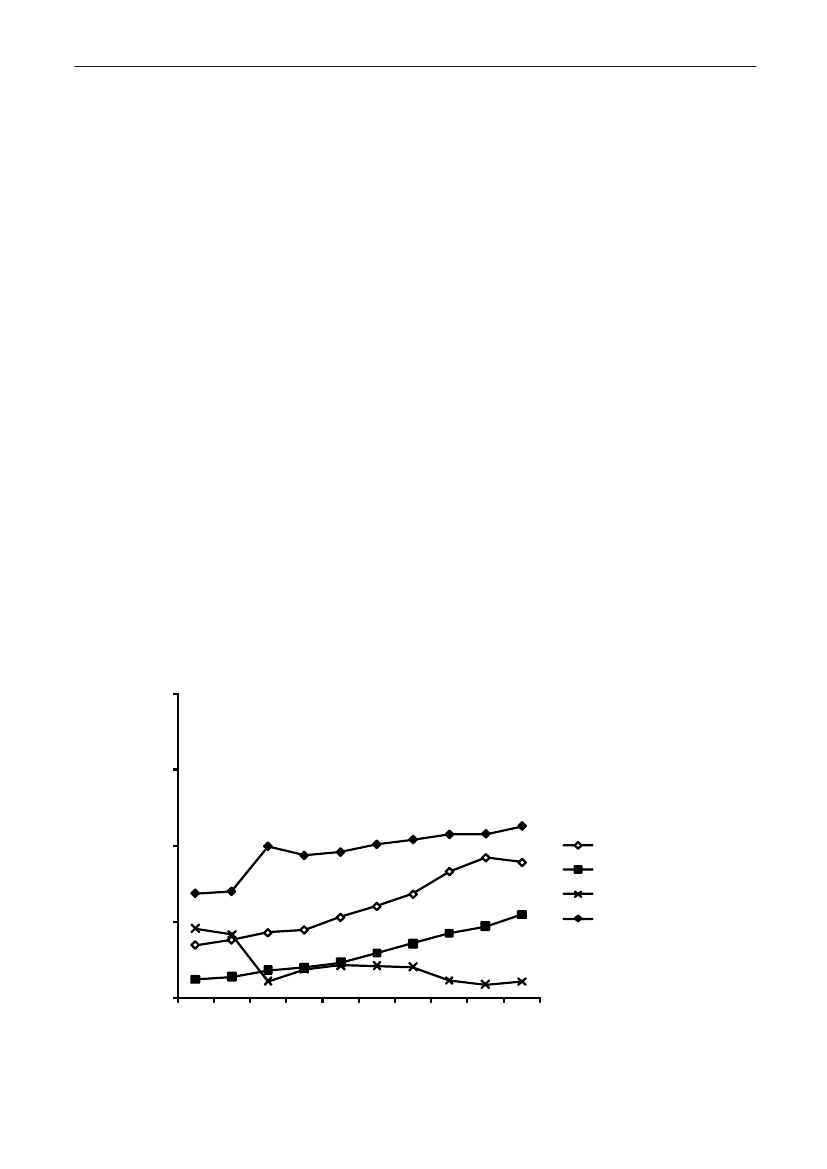
adjusted measure of consumption per pig, takinginto account the export of 30 kg pigs; the adjustmentis based on the assumption that pigs exported at30 kg compared to those not exported, on averagereceived the same amount of antimicrobial agentsbefore export, as other pigs from farrowing to 30 kg(see Appendix 2).This measure appears to be morestable (independent of changes in trade pattern), anda more reliable measure of trends in antimicrobialconsumption per pig. The antimicrobial use per pigproduced increased in 2009 by 9.7% compared with2008 and 33% compared with 2001, ignoring thechanges in production with increasing export at 30kg. Using the adjusted total, the consumption in pigsincreased 12.7% per pig produced in 2009, comparedwith 2008, and 45% compared with 2001. Relativeto meat production, the increase in 2009 was 17%compared with 2008, and 53% compared with 2001.During 2001–2009, the consumption increased in allage groups, but more in finishers (by 71%), and less inweaning pigs (by 34%) and sow herds (by 55%) (Figure6).Below, the non-adjusted figures will be given unlessotherwise mentioned.The increasing consumption in 2009 could largelybe attributed to tetracyclines, macrolides and
180110170100
DANMAP 2009
5.55.0
DANMAP 2009
mg antimicrobial agent per kg meat produced
15080706050403020100
ADDkg per kg meat produced
16090
4.54.03.53.02.52.01.51.00.50.0
2001 2002 2003 2004 2005 2006 2007 2008 2009
2001 2002 2003 2004 2005 2006 2007 2008 2009
Pig productionFish, Salt water
Broiler productionFish, fresh water
Turkey production
Figure 5. Trends in antimicrobial consumption per kg meat produced from pigs, broilers and turkeyExport of animals for rearing or slaughter is included. However, data for pig production is not adjusted for the increasing export of pigsat 30 kg body weight, although the body mass is included in the production (see text). Thus, the figures overestimate the increasingconsumption in the pig production in particular the last three years.
2928DANMAP 2009
DANMAP 20091614124ADDkg / kg pork produced
5
ADD25/ pig produced
10864202001SowsFinisher pigsTotal, adjusted20022003200420052006200720082009Weaner pigsTotal
3
2
1
0
ADDkg/kg meat produced (right axis)
Figure 6. Trends in consumption of antimicrobials in the pigs, given as Animal Daily Doses (ADDs) relative todifferent measures of production, DenmarkConsumption in sows and weaners are given as ADD25 divided by number of weaning pigs producedConsumption in finishers is given as ADD25 divided by number of finisher pigs producedThe adjusted total is given with same units as the total, but adjusted forthe in creasing export of pigs at 30 kg (see text)Consumption per kg meat produced is given as ADDkg divided by meat production including live export
pleuromutilins, which continued to be the mostcommonly used antimicrobial agents in pigs(Figure7a). These agents are mainly used for oral therapy inpigs. Since 2005, tetracyclines have been the mostcommon antimicrobial class used in pigs, and theconsumption has been increasing in particular since2005. This change was likely related to new treatmentguidelines launched by the veterinary authoritiesthat year in an attempt to reduce the consumption ofmacrolides, because this class was defined as criticallyimportant by the WHO. The macrolide consumption inADDkg/pig produced decreased by 3.4% from 2005–2008, but increased by 12.4% in 2009 compared with2008 (16% when adjusted for export pattern).The consumption of tetracyclines per pig producedincreased by 9.5% (12% adjusted) from 2008 to 2009,mainly due to a 15% increase in consumption inweaning pigs (Figures 7). From 2001–2009, the use oftetracyclines in ADDkgper pig produced increased by83% (100%, adjusted), a trend which has mainly beendriven by increasing use in weaning pigs (Figure 7).From 2007–2009, the consumption of pleuromutilinsper pig produced increased by 53%, mainly driven byreduced prices for tiamulin in 2007, making it price
competitive with macrolides and tetracyclines1andalmost as commonly used as macrolides (Figure 7a).The use of aminoglycosides (neomycin, apramycin andgentamicin) has remained at a low level since 2007,when the most commonly used aminoglycoside product(neomycin) was redrawn from the market (Figure 7a,7b). The major aminoglycoside for oral use in weanerschanged from neomycin in 2006 to apramycin in 2008.In 2009, the consumption of 3rdand 4thgenerationcephalosporins in pigs decreased by 25% to 99 kgin 2009; this is the first important decrease since2001 when this class was approved for use in pigs(Figure 8). As in previous years, the majority (87%)was used in sow herds (Table 6). The decrease ismainly associated with herds receiving occasionalprescription. As discussed in DANMAP 2007, a pilotstudy has shown that cephalosporins were commonlyused for prophylactic treatment of umbilical infectionin piglets as one injection within the 1stor 2ndday afterbirth. Prophylactic treatment is not generally allowedin Denmark. However, if a herd is known to haverecurrent problems with specific diseases, it is allowedto treat before an expected outbreak.1) Development in antibiotic consumption, expenses and
prices for prescription veterinary medicine for productionanimals from April 1st2005 to April 1st2008, Report ofDecember 15th2008 to the Ministry of Health; The DanishMedicines Agency, the Danish Veterinary and FoodAdministration and the Technical University of Denmark,2008
DANMAP 2009
29
4.54.03.5
DANMAP 2009
4.03.53.0
DANMAP 2009
ADD25/ pig produced
2.52.01.51.00.50.02001 2002 2003 2004 2005 2006 2007 2008 2009
ADD15/ pig produced
3.0
2.52.01.51.00.50.0
Figure 7a. Trends in antimicrobial consumption (inADD25a)) in pigs, 2001–2008, Denmark1.0
Figure 7b. Trends in antimicrobial consumption (in ADD15a))in weaners, Denmark2220
2001 2002 2003 2004 2005 2006 2007 2008 2009
DANMAP 2009
DANMAP 2009
0.8
1816
ADD50/finisher pig produced
0.6
ADDkg/pig produced
14121086
0.4
0.2
42
0.0
02001 2002 2003 2004 2005 2006 2007 2008 2009
Figure 7c. Trends in antimicrobial consumption (inADD50a))in finishers, DenmarkMacrolidesPenicillins, b-lact. sen. c)TetracyclinesPenicillins, other
Figure 7d. Trends in antimicrobial consumption (in ADDkg)in sows and piglets, DenmarkPleuromutilins b)CephalosporinsLincosamides d)Aminoglycosides
2001 2002 2003 2004 2005 2006 2007 2008 2009
20181614121086420Sulfonam./trimeth.
22
Penicillin/streptomycin
Amphenicols, colistin, fluoroquinolones, intramammaries and gynecologicals are not included in the figure. Data from veterinary practiceare not included (<1% of the consumption in pigs). In Figure V11, number of pigs produced is exclusive pigs exported at 15–50 kg. In allother figures, pigs exported at 15–50 kg are includeda) ADD25: doses for treatment of 25 kg pigs, to compare treatment across age groups.doses for treatment of 15 kg pigsADD15: An assumed average dose for treatment of weaners (7.5–30 kg)ADD50:Doses for treatment of 50 kg pigs. An assumed average dose for treatment of finishers (30–110 kg). Number of pigs producedexcluding pigs exported at 15–50 kgADDkg, doses for treatment of one kg pigs: unit used to measure antimicrobial use in sow herds; the drugs are used either in sows(bodyweight>200 kg) or in piglets (<2kg–7.5 kg)b) Pleuromutilins comprise primarily tiamulinc) b-lactamase sensitive penicillinsd) Lincosamide/spectinomycin combinations comprise 65% of this group
3130
DANMAP 2009DANMAP 2009
Antimicrobial consumption in cattleIn 2009, approximately 15 tonnes of antimicrobialsubstance was prescribed for cattle, as compared to14.4 tonnes in 2008. While data on pigs and poultryhave a high degree of certainty, this is not the casefor cattle: For cows, a major part of the medicine isreported from veterinarian practices; in early years upto 20% of some of the antimicrobials used in practiceare missing, possibly due to technical errors in thedata transmission; this bias affected mainly dataon cows, and lesser the data on calves, as a largerproportion of medicines for calves are handed outfrom the pharmacies. Based on the type of technicalerrors, it can be assumed that the missing data arerandom, and thus that the data from the veterinariansare representative for the choice of drugs.The quality of data has been improving the last years,but trends in total consumption in cattle cannot befollowed with high degree of certainty. However, fromthe pharmacy sales data, it can be concluded that theantimicrobial consumption in cattle has been stabile,between 14–15 tonnes during 2004–2009. Duringthis period, the beef production has decreased by17% and the milk production has increased by 6.7%(Table 2).Table 35 in Appendix 1 shows the registeredconsumption of antimicrobials for systemic use; thenumbers indicate a stable consumption in calves; theapparent increase in cows was at least in part due tothe bias mentioned above. The numbers also showthe changes in choice of drugs; these are depictedin Figure 9 and 10. The major drug of choice forcows was benzylpenicillin, increasing to 57% of theconsumption in 2009, while tetracyclines comprised20%. The major indication for treatment of cows wasmastitis. In calves, the major drugs of choice werelong-acting oxytetracycline medicines-, and since2006, also macrolides. The major indication in calveswas respiratory disease. In 2009, the consumptionof cephalosporins decreased both in cows andin calves. Overall, the consumption of 3rdand 4thgeneration cephalosporins decreased by 10 kg forsystemic use to 58 kg in 2009; for intramammary use,
140
120
Kg active compound
100
80
60
40
20
02001 2002 2003 2004 2005 2006 2007 2008 2009Systemic treatment of pigsSystemic treatment of cattleIntramammary treatment of cattle
Figure 8. Trends in consumption of 3rd and 4th generationcephalosporins in pigs and cattle, Denmark
a 7 kg decrease to 17 kg occurred (Figure 8).The consumption of penicillins for intramammaryapplication increased by 18% from 2008 to 2009,comprising 51% of the intramammary use in2009 (Table 7). Furthermore, combinations ofbenzylpenicillins (mainly dihydrostreptomycin),comprised additional19% of the consumption in2009. From 2008 to 2009, the intramammary useof 3rdand 4thgeneration cephalosporins decreasedby 32%, measured in ADD. This was mainlyencountered by the increase in use of penicillins.These trends in choice of antimcronial agents forintramammary treatment probably reflect a sensitiveresponse to debate, guidelines and information inrecent years, about the consequences regardingdevelopment of ESBL.DANMAP 2009% change20092008–2009
Table 7. Consumption in cattle of antimicrobial agents for intramammary application, DenmarkAntimicrobial agentsb)
ATCvetclasses
2005
2006
2007
2008a)
PenicillinsQJ51CE, QJ51CF, QJ51CR45446459918Aminoglycoside-benzylpenicillinQJ51RC2312032022012209combinationsc)Cephalosporins,QJ51DA20619717716917851st generationCephalosporins,QJ51DC, QJ51DD229255262231156-323rd and 4th generationOthersd)4235313027-11Total116311531126113811804a) For intramammary treatment, 1 ADD is defined as the dose to treat one teat for 24 hoursb) Includes benzylpenicillin, cloxacillin, and cloxacillin-ampicillin combinationsc) Mainly dihydrostreptomycin- benzyl benicillin combinations; also combinations of penicillin/aminoglycoside with bacitracin or nafcillind) Lincosamides, neomycin- lincomycin combinations and trimethoprim-sulfonamide combinations
ADD (1000's)454506
DANMAP 2009100908070Sulfonamide/trimethoprim
31DANMAP 2009Penicillin/streptomycin
Macrolides
60
Percent
5040
Cephalosporins (3rd and 4th gen.)
Penicillins, other
302010020052006200720082009Penicillins, b-lactamase sensitive)
Tetracyclines
Figure 9. Relative consumption of systemic antimicrobial drugs in cows and bulls, measured in ADD; 2005–2009,DenmarkThe antimicrobials not shown (amphenicols, fluoroquionolones, lincosamides, aminoglycosides, colistin and pleuromutilins ), eachaccounts for less than 1 percent of the consumption.DANMAP 2009Penicillin/streptomycin
10090Colistin (local GI)
80Aminoglycosides
70Macrolides
60
Percent
Sulfonamide/trimethoprim
50Cephalosporins (3rd and 4th gen.)
40Penicillins, other
30Penicillins, b-lactamase sensitive)
20Amphenicols
10Tetracyclines
020052006200720082009
Figure 10. Relative consumption of systemic antimicrobial drugs in calves, measured in ADD, 2005–2009,Denmark
The antimicrobials not shown (fluoroquionolones, lincosamides, and pleuromutilins ), each accounts for less than 1 percent of theconsumption.
3332
DANMAP 2009
Antimicrobial consumption in poultryThe consumption of antimicrobial agents in poultryalmost doubled, from 556 kg active substance in2008 to 1070 kg in 2009 (Table 6). This increasewas not as dramatic as it may seem because theantimicrobial consumption in poultry, particularlyin domestic fowl, is generally at a very low levelcompared to other species (Figure 5). Therefore,disease outbreaks in a few farms affect importantlythe national consumption in poultry, causingconsiderable fluctuations in annual consumption,between 400–1070 kg active substances per year,2001–2009.In the broiler production, the consumption perbroiler produced increased from 0.07 ADDkgin2008 to 0.15 ADDkgin 2009 (Table 8). Similarstatistics are published in the Netherlands, wherethe consumption per broiler was 5 ADDkgper broilerproduced in 2008 (MARAN 2008), or 70 timesmore than in Denmark. In 2009, the increase inconsumption in the broiler production was related touse of amoxicillin and tetracyclines; according to thepoultry practitioners, the increase was mainly dueto femoral head necrosis (bacterial chondronecrosiswith osteomyelitis) in the chickens, butE.coliinfections (septicaemia) have also been a problem;in addition, botulism (Clostridiumbotulinum)in somerearing and parent flocks in 2009, has contributedto increasing antimicrobial consumption in thebroiler production. In the broiler production, theconsumption of fluoroquinolones was reducedby 97% in 2008 compared with the level in 2006.However, in 2009, the fluoroquinolone consumptionin the broiler production increased to 63% of the2006 level, for treatment of multi resistant infectionsin the chickens from a specific parent flock,according to the major poultry practitioners.In 2009, the consumption in turkeys increased to 1.8ADDkgper kg turkey, the highest level since 2002(Figure 5). According to the poultry practitioners,the increase was due to respiratory infections(Pasteurella) and diarrhoea; a vaccination programhas been introduced, to combat the problems withPasteurellainfections. The increase was relatedto an increase in the usage of the three majorantimicrobial classes in turkeys: tetracyclines,amoxicillin, and macrolides. In turkeys, theconsumption of fluoroquinolones decreased in 2008to 17% of the 2006 level, and further to zero in 2009(Table 8).
Table 8 shows considerable changes in choice ofdrug in the poultry production since 2006. Until 2007,amoxicillin comprised approximately 90% of theantimicrobial used in poultry, and fluoroquinoloneswere the second most used antimicrobial group.The major cause for this consumption pattern wasthat only fluoroquinolone and amoxicillin productshad been approved for use in poultry. In 2008,a tetracycline product was approved for poultry,causing a steep increase in use of tetracyclines, inparticular for turkeys and in the broiler productionin 2008–2009. Also, other antimicrobial classeswere approved for use in poultry in 2007–2008.Also, the changes in choice of drugs were partlyattributed to guidelines from the supervision team(from The Veterinary and Food Administration) totake into consideration national restriction in use offluoroquinolone together with the “cascade rule”. Theuse of fluoroquinolones has been low during 2007–2009, except for the consumption in turkeys in 2007and in the broiler production flocks in 2009.Measured on ADDkgper kg poultry produced,the consumption in ducks and geese was similarto the consumption in the broiler production.Annual production data are not available for gamebirds. The population was estimated at 1 millionpheasants, 0.5 million ducks and 0.1 million otherbirds in 2004. Assuming a constant population, theantimicrobial consumption in game birds has beenstable around 1.1 ADDkg/kg meat produced during2002—2009 (Table 8).
DANMAP 2009
33
Table 8. Consumption of prescribed antimicrobials in poultry given as Animal Daily Doses (ADDkg), DenmarkDANMAP 2009Aminoglycosides QA07AAQJ01E /QP51AGQA07 /QJ01QJ01AQJ01XPleuromutilinsATCvetgroupFluoroquinolones QJ01MAQJ01CAQJ01CEQJ01FAMacrolides
Sulfonamides a)
Tetracyclines
Antimicrobialgroup
Penicillins,b-lactamasesensitive
ADDkg (1000's)
millionADDkgperkg meatkg meator eggs d)produced1300750000600000000001300030000004,568000000000461006368080000000010290000230300150704880000007285315363,1814,1013,3995,6994,8604,0292,3414,83013,4221,6522,8691,4416,9543,7486,3672,9147,74513,7547271,2261,2181,3039675551,3962,7452,69310,56726,82915,8856,72510,02016,64814,9418,34019,899192190181181180163178186181---------69706972696767686113.212.811.219.617.411.314.412.311.10.030.040.030.070.050.060.030.070.15
Broilers20012002200320042005200620072008200920012002200320042005200620072008200920012002200320042005200620072008200920012002200320042005200620072008200900010000000000000000000000000000200150100518003607011632004295,200088000004002,0671928554028280127130000601501,6545,76711,7712,7773,3523,0524,6173,9843,3561,7184,0866,9881,3922,0251,3616,4643,3486,2382,6596,9137,7384346703508196803761,1502,5631,47510,47726,82910,9004,8738,96315,1936,7881,0384,563000822600439000000002,851000240000000000278049190698435840168837530960001543100801961713282152431409610015005876684504016004430289133560000000223222891600601100200016002,5478112,538250680270650661620130202023066080490400114190044050100030000009003601,5607801,1602,4301900
Rearing for broiler production
ProductionIncludedin broilerproductionabove
Amoxicillin
Others c)
Layers and layer rearing0.010.020.020.020.010.010.020.040.040.802.101.420.340.581.471.040.681.79
Turkeys
Total
3534
DANMAP 2009
Table 8. Consumption of prescribed antimicrobials in poultry given as Animal Daily Doses (ADDkg), Denmark(Continued)DANMAP 2009Aminoglycosides QA07AAQJ01E /QP51AGQA07 /QJ01QJ01AQJ01XPleuromutilinsATCvetgroupFluoroquinolones QJ01MAQJ01CAQJ01CEQJ01FAMacrolides
Sulfonamides a)
Tetracyclines
Antimicrobialgroup
Penicillins,b-lactamasesensitive
ADDkg (1000's)
millionADDkgperkg meatkg meator eggs d)produced300330000510933181350001055350835000000200849400144273381721800446058395667772655915421,1251022872341,3702,5182,7252,0222,8032,4132,2032,3602,0805,2193,7183,6904,8783,4033,5492,2671,6921,5574.54.94.24.24.14.52.42.62.2------------------0.010.020.060.140.130.250.040.110.11------------------
Ducks and geese2001200220032004200520062007200820092001200220032004200520062007200820092001200220032004200520062007200820090000000000125150250160110211001293004500500022128140003624771771281489886126802701559591106581441403747940362574005251,12510025007681,4669231,0031,9391,8631,4251,8259013,8142,9092,3703,6542,9783,0591,3218634860000000000000000018000000720010013000110205346318460403258542256664441315348440192182518263182113001114000200146289273113177393739463062721869034118148225000150000008510130011011104759339113112111034311
Game birds
Production type unknowne)
ADDkg: the dose necessary for treating 1 kg body-weighta) Includes sulfaclozin (a coccidiostat/antibacterial) and sulfonamide/trimethoprim combinationsb) Lincomycin, including combinations with spectinomycinc) Includes QA07AA10 (colistin), QJ01FF (lincosamides), QJ01B (amphenicols) and QJ01R (penicillin/streptomycin combinations)d) For layers and layer rearing, only the production of egg for consumption is includede) includes prescription with erraneaus farm id or farms with more than one poultry species
Production
Amoxicillin
Others c)
Total
DANMAP 2009
35
Antimicrobial consumption in fur animals,aquaculture and pet animals
In 2009, the production of fur animals included14 million mink, 34,000 chinchillas and a minorproduction of foxes, as in 2008, except for a smallincrease in chinchilla production. The consumption ofantimicrobial agents in fur animals increased by 28%- from 2,270 kg in 2008 to 2,896 kg in 2009. In 2009,aminopenicillins remained the most commonly usedantimicrobial class in fur animals, comprising 33% ofthe antimicrobial consumption (kg active compound)in 2009; macrolides, tetracyclines and sulfonamide-trimethoprim combinations comprised another 56%.Fluoroquinolones and cephalosporins comprised lessthan 0.1% (1.4 kg) of the consumption in fur animals.The antimicrobial consumption in aquaculturedecreased by 4% to 3,300 kg in 2009 comparedwith 2008. The decrease was possibly related to theintroduction of a recent vaccine against furunculosis.The antimicrobial consumption for fish in salt waterdecreased by 11% from 2008 to 146 mg/kg fish in2009, possibly due to marketing of a vaccine againstfurunculosis (Figure 5). Regarding fish produced infresh water, the consumption increased by 3% from2008 to 51 mg/kg in 2009; (both changes, assumingan unchanged production in 2009 compared with2008, Table 2). Unusually warm summers are themost likely reason why the use of antimicrobial agentsin aquaculture was importantly higher in 2007 and2008 as compared with previous years, and still at a
high relatively high level in 2009. The major class ofantimicrobial was sulfonamide/trimethoprim, comprising71% of the consumption in aquaculture. Theconsumption of quinolones (oxolinic acid) comprised23% of the consumption in aquaculture in 2009, andhas increased importantly (by 131%) since 2007.In companion animals, an estimated 2.2 tonnes ofantimicrobial substance was used in 2009, whichis similar to 2008 (Table 6). The majority was usedin pet animals. The major antimicrobial agent usedin pet animals, amoxicillin in combination withclavulanic acid, increased by 6% to 525 kg in 2009,as part of a continuous increase, at least since 2004.Other frequently used drugs were cephalosporins(348 kg), mainly first generation for oral use; andsulfonamide/trimethoprim (estimated 400 kg), andnarrow spectrum penicillin (estimated 300 kg), bothmainly for parenteral use. Cephalosporins used in petanimals are predominantly first generation (cefadroxiland cefalexin), while 4thgeneration cephalosporincomprised an estimated 3.5 kg active compound,corresponding to 1% of the cephalosporins used inpet animals in 2009, a 25% increase compared with2008. In pet animals, the consumption of 3rdand 4thgeneration cephalosporin was an estimated 2.4 kg,corresponding to 1.4% of the veterinary consumptionof these antimicrobials. The use of fluoroquinolonesin pet animals was estimated 14 kg in 2009 and thiscorresponded to 61% of the total veterinary use offluoroquinolones in Denmark, 2009.
3736
DANMAP 2009
Textbox 1The assignment of the National Defined Daily Doses for animals (ADD)Over time and between populations large variability may occur in choice of drug group (ATCvet3rdor 4thlevel), but also of active compound within antimicrobial group. The dosages of various antibacterial drugsmay vary considerably depending on e.g. potency, pharmacokinetic characteristics, formulation, MIC-values and disease. Accordingly, shifts in choice of drugs (without change in disease occurrence andtreatment frequency), may be misinterpreted as a change in total consumption when measured in kg-active-compound on group level.The Defined Animal Daily Dose (ADD) is a quantitative measure, solving the above mentioned problems.Neither the kg-active-compound nor the ADD is a measure of treatment frequency, as the applied dailydose and the prescribed daily dose may vary both within country and between countries. These limitationsshould be taken into account for the interpretation of data both when using the kg-active compound or theADD as the chosen metric.Based on an EU expert recommendation, the Danish government decided in 1998 to establish a nationalprogram for monitoring use of veterinary medicines (VetStat). Valid data were available from 2001, anda National defined daily doses system was developed in 2002. Fundamentally, the ADD is defined as aNational veterinary parallel to the international Defined Daily Dose in human pharmaco-epidemiology. TheAnimal Daily Dose was defined for the specific domestic species (i.e. cattle, swine, poultry, sheep, goats,dogs/cats). In 2009, the definition of the Animal Daily Dose was changed regarding formulations withprolonged effect.
Definition of ADDkgand ADD••ADDkgis defined as the assumed average maintenance dose per day for treatment of one kg animal forthe main indication in a specified species.The ADD is defined as the assumed average maintenance dose per day for the main indication in aspecified species and “standard” body weight for the species and age group.
The ADDkgis used as the basis for calculating the exposure in a specified species by multiplying with”standard” body weights and for measuring the consumption in populations comprising various age groupsand large variation of body weights.An ADDkgwas assigned for each veterinary medicinal product (VMP) for each relevant species, both thespecies for which the approval is given, and for other species for which the drug is prescribed. The ADDkgisalso set for human drugs and for commonly used extemporaneously prepared medicinal products, identifiedin VetStat as prescribed for animals. The ADDkghas been assigned for all systemic antibacterial drugsidentified as prescribed for animals, drug for local gastrointestinal, intramammary or intra uterine use. Formost topical preparations, general and local analgesics, anesthetics, neuroleptics, and contrast media, anADDkgis not feasible.
Assigning ADDkgand calculating ADDs
The daily dose is initially defined per kg bodyweight (ADDkg) and species, and subsequently an ADD peranimal species and age class is calculated by multiplication with a defined standard animal bodyweight forthe age-group within species.An ADDkgis principally calculated as the mean-range value of the recommended maintenance dosageper day for the active ingredient of the VMP. The range and treatment frequency are taken from therecommendations approved by the Danish Medicines Agency (the SPC’s). Where synonymous VMPs havebeen marketed but with differing dosage recommendations, a common ADDkgfor the active ingredient isdefined and applied for these VMPs. In such cases, the ADDkgis set as the most frequent maintenancedose recommended among these drugs, i.e taking into consideration which VMPs are used more.Regarding drugs for which only one administration is required (i.e. long acting drugs), the ADDkgwas
DANMAP 2009
37
initially set as the (initial) recommended dose, although the concentration maintains at a therapeutic level forseveral days. Thus, special attention had to be directed towards the use of long-acting drugs in consumptionstatistics as described in DANMAP 2007. However, this definition was not logical, considering that for drugsapplied more than once daily, the ADDkgis defined as the sum of doses applied per 24 h. Therefore, in 2009the definition of the ADDkgfor long-acting drugs was changed accordingly: An ADDkgis defined as the initialdose divided by the minimum duration of therapeutic effect (hours) and multiplied by 24 (hours). When thetherapeutic duration is uncertain, the drugs are assigned the same ADDs (mg active compound) as theordinary dosage forms. Accordingly changes affected of the ADDkgincluded drugs within the macrolide- andcephalosporin classes, oxytetracycline and benzylpenicillin. The dose for long acting ampicillin formulationswas identical to the dose set for the ordinary formulations and therefore not changed.The “standard body-weight”, used to calculate the ADD from the ADDkg, was set as the assumed averageweight at treatment for each age-group. The standard body-weights for pigs and cattle were defined followingconsultations with a group of specialized practitioners for each species. For goats and sheep, researchersin close contact with the producers of these species were consulted. For poultry a standard weight was notdefined i.e. only the ADDkgis applied, because the growth rate is extremely high compared to other foodanimals and because in these food production systems, dosing is based on the total population biomass. Forsingle-dose formulations, usually formulated for a specific age-group but independent of bodyweight, onlythe ADD — and not the ADDkg— is defined.The defined animal standard weight will only give an estimate of the true average of the animal weight attreatment in the subpopulation. However, measuring drug usage in ADDs for “standard animal weight”,always leaves an opportunity for recalculating the figures to the more precise quantitative measure, theADDkg,(when the age-group or weight is not known), or using other defined body weights when relevant forspecific purposes and populations.
Vibeke Frøkjær JensenFor further information: Vibeke Frøkjær Jensen ([email protected])
3938
DANMAP 2009
Textbox 2Antimicrobial resistance and antimicrobial consumption in conventional andalternative pig production systemsMore than 95.5% of close to 19 million finisher pigs slaughtered in Denmark are produced in conventionalindoor production systems, yet a couple of alternative animal production concepts do exist. The majoralternative systems are the organic finisher pig production and the production of non-organic free range pigsboth with access to outdoor pens. The free-range and organic systems respectively produced approximately86.000 and 80.000 finisher pigs yearly in 2008–2009.According to the legislation (2007-2008, when the described study was conducted) the use of antimicrobialsin the husbandry production in Denmark must be based on a veterinary diagnosis in the herd. Preventiveantibiotic treatment is prohibited, but it is allowed to treat animals before onset of disease if infection withwell-defined illness is suspected. If the herd has a Health Agreement Contract (HAC) with a veterinarian,prescription of antimicrobials for expected disease treatments the following 35 days is allowed. In herdswithout a HAC, antibiotics may only be prescribed for the following five days. The HAC comprise aveterinary advisory visit (incl. relevant examinations and diagnostic work) in the herd approx. monthly (12times annually). HAC was optional for conventional herds until July 2010 and in general larger conventionalpig herds have a HAC. According to the EU-legislation the use of antibiotic growth promoters is prohibited.
Specific regulation of the use of antimicrobials inOrganic pig production• Pigs receiving antimicrobial treatment more than once loose the organic status• Each antimicrobial treatment must be based on a veterinary diagnosis and prescription is specifiedfor the actually diseased pigs – contact with the veterinarian is needed in each case• In the herd, only antimicrobials for ongoing treatments may be stored• The withdrawal period from treatment with antimicrobial agents to slaughter is twice the length inconventional herdsNon-organic outdoor pig production• A Health Agreement Contract (HAC) with a veterinarian is mandatory.• Continuous use of antibiotics is not allowed in any part of the production• The withdrawal period from treatment with antimicrobial agents to slaughter is twice the length inconventional herds
In the project QUALYSAFE, conducted 2007–2008, the antimicrobial resistance and the antimicrobialconsumption on herd level was studied for finisher pigs (pigs from 30 kg to slaughter at app. 107 kg) in146 conventional herds, 51 organic herds and 27 non-organic free range herds. Data on consumption ofantimicrobial agents was obtained from the Vetstat data base, and resistance inE. colito 16 antimicrobials(DANMAP standard panel) was tested by use of sensititre.Overall, there was a marked difference in the use of antimicrobial agents (Figure 11); only about half of theorganic herds used antimicrobials, as compared to more than 90% of free range herds and conventionalherds. Both consumption of antimicrobial agents and occurrence of antimicrobial resistance (Figure 12)were higher in conventional herds and lower in organic herds. As an example, out of the total of 868isolates available from all 224 farms, 205 isolates were resistant to tetracycline (organic: 8%, free range:25% conventional: 32%). The organic farms had the lowest average consumption of tetracycline with 0.04doses per slaughter pig followed by conventional farms and free range farms with 1.3 and 1.6 doses perslaughter pig, respectively. Thirty-three percent of the free range farms, 38% of the conventional farms and76% of the organic farms had no tetracycline consumption in the year 2007. A strong significant association
DANMAP 2009
39
between resistance to tetracycline inE. coliisolates and the use of tetracycline to finisher pigs in the herd(increased risk of resistance from use of tetracycline) as well as the herd type (increased risk of resistanceinE. coliisolates from conventional and non-organic free range herds compared to organic herds) wasdemonstrated (using the procedure NLMIXED in SAS. Significance of variables were tested using the thelikelihood ratio test with a significance level of 5%). The antimicrobial resistance was higher in winter/springwhen the antimicrobial consumption is known to increase1than in summer/autumn, and the resistancepattern in free range herds resembled the pattern in organic herds in summer and the pattern in conventionalherds in winter (Figure 12). The results indicate that consumption of antimicrobial agents is a major drivingfactor for the occurrence of antimicrobial resistance, although other herd characteristics may be involved.Further studies into the reason for differences in antimicrobial consumption may reveal new ways to limit theantimicrobial consumption and resistance in the pig production. The report may be accessed at http://www.bioethics.kvl.dk/tekster/0911koedsikkerhed.pdf, [in Danish]Anne Wingstrand,Tina Struve, Anna Irene Vedel Sørensen, Vibeke Frøkjær Jensen, Kathrine Lundsby,Håkan Vigre, Hanne-Dorthe EmborgFor further information: Tina Struve (tstr @food.dtu.dk)
100
DANMAP 2009
%herds with regisred consumption
80
60
40
20
0Combination-antibioticsLincosamidesSimple penicillinsAminoglycosidesMacrolidesSulfonamide/trimetoprimCephalosporinesTetracyclinesPenicillins with extendedspectrumOther antimicrobialsLincospectinColistin
146 Conventional herds
27 Free range herds
51 Organic herds
Figure 11: Proportion of finisher pig herds within study herd type with registered consumptionof different types of antimicrobial agents in 2007 (Source: Vetstat). Only antimicrobial agentsprescribed for finishers is included.
1
Jensen VF, Enøe C, Wachmann H, Nielsen EO. Antimicrobial use in Danish pig herds with and without postweaningmultisystemic wasting syndrome. Prev Vet Med. 2010 May 12. [Epub ahead of print]
4140
DANMAP 2009
DANMAP 2009Summer/autumn 200740146 Conventional herds27 Free range herds51 Organic herds
DANMAP 2009
Winter/spring2007-200840146 Conventional herds27 Free range herds51 Organic herds30
30
% resistantE. coli
%resistant E. coli
20
20
10
10
0SulphamethoxazoleChloramphenicolSpectinomycinFlorfenicolStreptomycinNeomycinTrimethoprimTetracyclineAmpicillin
0SulphamethoxazoleChloramphenicolStreptomycinNeomycinCeftiofurSpectinomycinTrimethoprimCefotaximeAmpicillinTetracycline
Figure 12: Resistance to antimicrobial agents inE.colifrom 224 caecal samples from finisher pigsconventional , organic and non-organic free range herds in summer/autumn 2007 (firstE. coliisolated fromeach herd) and winter/spring 2008 (lastE. coliisolated from each herd) . Among these isolates none wereresistant to Axoxicillin+Clavulansyre, Apramycin, Ciprofloxacin, Colistin, Gentamicin and Nalidixan. (Source:the QUALYSAFE project)
DANMAP 2009
41
Antimicrobial consumption in humansIntroduction and definitionsThe consumption of 2009 is compared with theconsumption of 2008 and of 2000, respectively.Antibacterial agents used for systemic treatment inhumans (and in animals) are listed in Table 4.Defined Daily Dose (DDD) is the unit for measuringantibacterial consumption. The DDD is the assumedaverage maintenance dose per day for a drug used forits main indication in adults. It should be emphasisedthat DDD is a unit of measurement and does notnecessarily reflect the recommended or prescribeddaily dose [http://www.whocc.no].Primary health care:consumption should preferablybe presented as numbers of DDD per 1000 inhabitantsper day (DID). Data presented in DDD per 1000inhabitants per day provide a rough estimate of theproportion of the population within a defined areatreated daily with certain drugs. For example, 10 DDDsper 1000 inhabitants per day indicates that 1% of thepopulation on average gets a certain treatment daily.Consumption measures at treated patient level areachievable, using DDDs/patient or DDDs/package.Also, consumption measured by the number ofpackages per 1000 inhabitants and by the number oftreated patients per 1000 inhabitants is displayed in theappendix (Tables 36, 37).Hospitals:consumption should preferably bepresented as both DDD per 100 occupied bed-days(DBD) and DDD per 100 discharges to include theactivity in hospitals, and as the number of DID whencomparing to primary health care.Due to procedural rearrangements of certainchemical substances for infusion, the reporting ofsales (consumption) by the hospital pharmacies tothe Danish Medicines Agency has been inaccuratefor some groups. Consumption of cephalosporins,carbapenems and combinations of sulfonamides andtrimethoprim incl. derivatives has been corrected, as in2005–2008. In 2009, national data were not accessiblefor the consumption of combinations of sulfonamidesand trimethoprim, incl. derivatives. Instead, data fromeighteen hospitals within three regions are reported(The capital region of Denmark, Region of SouthernDenmark and Central Denmark region).The number of occupied bed-days and discharges of2008 obtained from the National Board of Health hasbeen updated. This update has led to minor changes inthe reported consumption.
DANMAP 2009
1.81
DDD/1000 inhabitant-days
141210864
12.21
1.41
12.85
1.45
16
13.26
1.51
13.53
1.51
14.06
1.56
14.75
1.67
18
15.23
1.70
16.17
15.91
1.87
20
2000
2001
2002
2003
2004
2005
2006
2007
2008
2009
Primary health care
Hospitals
Figure 13. Total consumption of antibacterial agents (J01) in humans, Denmark
15.95
1.91
20
4342
DANMAP 2009Figure 14 shows the distribution of the total number ofDIDs of antibacterial agents between primary healthcare and hospitals. For example, penicillins withextended spectrum (J01CA) and fluoroquinolones(J01MA) had a ratio of consumption in primary healthcare vs. consumption in hospitals of around 9/1 and2/1, respectively.To allow comparison with consumption of antibacterialagents in animals, total human consumption is alsopresented in kilograms (Table 9). In 2009, 48.5 tonnesof antibacterial agents for systemic use were used inhumans in Denmark representing a decrease of 0.1tonnes (0.1%) compared with 2008, but an increase of8.4 tonnes (20.8%) compared with 2000.
Total consumption in both primary health careand hospitalsIn 2009, the total consumption of antibacterial agentsfor systemic use (primary health care and hospitals)amounted to 17.9 DDDs per 1000 inhabitants per day(DID) compared with 17.8 DID in 2008. Consumptionhas increased by 4.2 DID (31.1%) since 2000 (Figure9). To view the detailed distribution of DIDs amongantibacterial groups in primary health care andhospitals, please refer to Table 10 and Table 38 inAppendix 1), respectively. The percentage of DDDsprescribed in primary health care represented 89% ofthe total human consumption. In all previous years,2000–2008, the percentage of DDDs prescribed inprimary health care represented 90% of the totalhuman consumption.
Table 9. Consumption of antibacterial agents for systemic use in humans (kg active substance), Denmark. Includesdata from both primary health care and hospitals and has been recalculated from original data expressed as DDDs.For monitoring in human primary health care and hospitals, the recommended way of expressing consumption isDDDs per 1000 inhabitant-days and DDDs per 100 occupied bed-days (see Tables 10, 12 and 13)DANMAP 2009ATC group a) Therapeutic group2000J01AAJ01BJ01CAJ01CEJ01CFJ01CRJ01DJ01EAJ01EBJ01EEJ01FAJ01FFJ01GJ01MAJ01XAJ01XCJ01XDJ01XEJ01XX05TetracyclinesAmphenicolsPenicillins with extended spectrumBeta-lactamase sensitive penicillinsBeta-lactamase resistant penicillinsComb. of penicillins, including beta-lactamase inhibitorsCephalosporins and related substances d)Trimethoprim and derivativesShort-acting sulfonamidesComb. of sulfonamides and trimethoprim,including derivativesMacrolides b)Lincosamides d)AminoglycosidesFluoroquinolones d)GlycopeptidesSteroid antibacterials (fusidic acid)ImidazolesNitrofuran derivatives (nitrofurantoin)Methenamine d)Antibacterial agents for systemic use(total) c)148605141265593692262314229140402932344377015515117880200114751538532301467392803113289408937303983659168155163702002150105356373824981129330922884150403145142591791631662320031542052954075336830307306427338764528611435819116615904Year20041636053464377480894334306718537435331722465219517114735200517480556145655341582359298720837755231866516220618011071020061835057224842724177838228652083542662797956651981851076142007185506188503710122285402256514834347827116261672021901060122008188406061518313482530402227318331649425135164641911921087142009203906076525018362740399220019329661132313718662160201104714
19,749 20,730 21,263 21,630 22,230 22,520 22,760 24,003 22,466 21,744
J01XX08+09 Linezolid, daptomycinJ01
40,157 41,997 43,371 43,964 45,040 46,404 47,324 49,788 48,579 48,518
a) From the 2009 edition of the ATC classification systemb) When two different DDDs of an antimicrobial agent existed for different presentations an average DDD was used. Estimates using thelowest and the highest calculated limit are 2363–3568 for 2009c) Does not include polymyxinsd) Since 2005, the kg active substance was estimated taking into account the DDD for each route of administration, e.g. cefuroximeparenteral DDD=3 g and cefuroxime oral DDD=0.5 g. From 1997 to 2004, it was estimated with a DDD corresponding to an average forthe various routes, e.g. for cefuroxime: 1.75 g
DANMAP 2009
43
DANMAP 2009
J01CR Penicillins, incl. beta-lactamase inhibitorsJ01D Cephalosporins and related substancesJ01E Sulfonamides and trimethoprimJ01G AminoglycosidesJ01MA FluoroquinolonesJ01XA GlycopeptidesJ01XB PolymyxinsJ01XC Steroid antibacterials (fusidic acid)J01XD Imidazol derivativesJ01XE Nitrofuran derivatives (nitrofurantoin)J01XX Other antibacterials0.000.250.500.751.00Primary health careHospitals
DDD/1000 inhabitant-daysDANMAP 2009
J01AA Tetracyclines
J01CA Penicillins with extended spectrum
J01CE Beta-lactamase sensitive penicillins
J01CF Beta-lactamase resistant penicillinsPrimary health care
J01F Macrolides, lincosamides andstreptogramins0123
Hospitals
4
5
6
DDD/1000 inhabitant-days
Figure 14. Distribution of DIDs between primary health care and somatic hospitals, Denmark
4544
DANMAP 2009
Primary health careTotal consumptionIn 2009, the total consumption of antibacterial agentsfor systemic use (J01) in primary health care to15.95 DID compared with 15.91 DID in 2008 (TableHuAB_P1). Consumption increased in six groups:tetracyclines 0.07 DID (4.5%); penicillins withextended spectrum 0.03 DID (1.0%); beta-lactamaseresistant penicillins 0.01 DID (1.1%); combinationsof penicillins, including beta-lactamase inhibitors0.18 DID (65.9%); fluoroquinolones 0.01 DID (0.8%);and nitrofuran derivatives 0.02 DID (3.7%). In fivegroups consumption decreased: beta-lactamasesensitive penicillins 0.18 DID (3.4%); trimethoprim andderivatives 0.01 DID (1.4%); short-acting sulfonamides0.01 DID (3.7%); macrolides 0.07 DID (3.4%); andmethenamine 0.01 DID (4.0%).Beta-lactamase sensitive penicillins still representedthe largest group of antibacterial agents consumed(32%) followed by penicillins with extended spectrum(21%) and macrolides (14%) (Figure 15).Antibacterial consumption (J01) increased by 31%(p<0.0001) during 2000–2009 (Table 10). For allleading groups of antibacterial agents, consumptionwas higher in 2009 than 10 years before and for mostgroups the trend in consumption has been a steadyincrease year by year (Figure 16). Only short-actingsulfonamides (J01EB) and ‘other antibiotics’ (J01XX)were at a lower reported level in 2009 compared with2000.
Table 10. Consumption of leading antibacterial agents for systemic use in primary health care (DDD/1000 inhabitant-days), DenmarkDANMAP 2009ATC group a) Therapeutic groupJ01AAJ01CAJ01CEJ01CFJ01CRJ01DJ01EAJ01EBJ01EEJ01FAJ01FFJ01GBJ01MAJ01XAJ01XBJ01XCJ01XEJ01XX05J01XX08J01TetracyclinesPenicillins with extended spectrumBeta-lactamase sensitive penicillinsBeta-lactamase resistant penicillinsCombinations of penicillins, including beta-lactamaseinhibitorsCephalosporins and related substancesTrimethoprim and derivativesShort-acting sulfonamidesCombinations of sulfonamides and trimethoprim,including derivativesMacrolidesLincosamidesAminoglycosidesFluoroquinolonesGlycopeptidesPolymyxinsSteroid antibacterials (fusidic acid)Nitrofuran derivatives (nitrofurantoin)MethenamineLinezolidAntibacterial agents for systemic use (total)0.982.294.690.520.020.020.330.370.032.020.010.000.150.000.030.020.380.360.000.992.474.910.650.030.030.350.360.042.100.010.010.170.000.020.010.390.330.001.042.515.000.770.040.030.360.360.032.150.010.010.180.000.020.010.410.340.001.072.525.070.850.050.020.380.360.032.130.010.010.250.000.020.010.420.320.00Year2000 2001 2002 2003 2004 2005 2006 2007 2008 20091.172.635.200.920.060.020.410.360.002.230.010.010.280.000.020.010.430.300.001.282.795.280.970.080.030.440.350.002.410.010.010.330.000.020.010.450.280.001.382.955.401.050.120.030.470.350.002.310.020.010.370.000.020.010.460.270.001.483.255.671.090.190.030.490.310.002.420.020.010.440.000.020.020.470.260.001.543.265.301.120.270.030.490.280.002.280.030.010.510.000.020.020.470.270.001.613.295.121.130.450.030.480.270.002.210.030.010.520.000.020.010.490.260.00
12.21 12.85 13.26 13.53 14.06 14.75 15.23 16.17 15.91 15.95
a) From the 2009 edition of the Anatomical Therapeutic Chemical (ATC) classification system
DANMAP 2009
45
DANMAP 2009
Macrolides,lincosamides andstreptogramins(J01F), 14%
Tetracyclines(J01AA), 10%Beta-lactamaseresistant penicillins(J01CF), 7%Sulfonamides andtrimethoprim (J01E),5%Fluoroquinolones(J01MA), 3%Comb. of penicillins,incl. beta-lactamaseinhib. (J01CR), 3%Other antibacterials(J01D,G,X), 5%
Penicillins withextended spectrum(J01CA), 21%
Beta-lactamasesensitive penicillins(J01CE), 32%
Figure 15. Distribution of the total consumption of antibacterial agents in primary health care, Denmark
6
DANMAP 2009
5
Beta-lactam. sens. penicillins(J01CE)Penicillins with extend.spectrum (J01CA)Macrolides (J01FA)
DDD/1000 inhabitant-days
4
3
Tetracyclines (J01AA)Beta-lactam. resis. penicillins(J01CF)Fluoroquinolones (J01MA)
2
1
Combinations of penicillins,including beta-lactamaseinhibitors (J01CR)
02000 2001 2002 2003 2004 2005 2006 2007 2008 2009
Figure 16. Consumption of leading antibacterial groups for systemic use in primary health care, Denmark
4746
DANMAP 2009Beta-lactamase resistant penicillins:no changesin packages have occurred over the last decade, butnational guidelines have introduced new indicationsof treatment for certain infections over the last decade[DANMAP 2008].Combinations of penicillins, including beta-lactamase inhibitors:the proportion of children (<15years) receiving these substances have decreased andbeen replaced by adults as pointed out in the DANMAP2007 report. As a consequence, low-strength packageshave presumably been replaced by packages withhigher strength.Macrolides:the packages have not changes over thelast decade, but national guidelines have increased therecommended treatment dosage for certain indicationsover the last decade [DANMAP 2008].Fluoroquinolones:no changes in packages haveoccurred over the last decade, and national guidelinesonly recommend these substances as second linechoices for a limited number of indications.Trends in indicators—measures of antibacterialconsumption in primary health care—showed DDD asthe indicator that increased the most during the last10 years (Figure 17). Because codes of indication areincomplete, as pointed out in DANMAP 2008, makingassumptions of the nature of these changes in trendsare difficult. Consumption measured as the numberof packages per 1000 inhabitants and the number oftreated patients per 1000 inhabitants is displayed inTables 36, 37 in Appendix 1.DANMAP 2009
Measures at treated patient level
The total number (J01) of DDDs per treated patientincreased from 18.9–19.2 compared with 2008. For allleading substances, DDDs per treated patient rangedfrom 11–21 in 2009 with the exception of tetracyclines(45.2) (Table 11). During 2000–2009, trends displayedan increasing number of DDDs per treated patient andDDDs per prescribed package. Tetracyclines; comb.of penicillins, including beta-lactamase inhibitors; andfluoroquinolones showed the largest increases.Tetracyclines:the available packages (size andstrength) have not been altered over the last decade;prescriptions of packages with higher numbers oftablets could be explanatory for this trend as pointedout in DANMAP 2008.Penicillins with extended spectrum:a few low-strength packages (for children) are no longermarketed and national guidelines have increased therecommended dosage of certain substances over thelast decade [DANMAP 2008].Beta-lactamase sensitive penicillins:some low-strength packages (for children) are no longermarketed while packages with higher strength havebeen introduced; recommended dosage has increasedfor certain indications over the last decade [DANMAP2008].
130%
Index: 2000 = 100%
120%DDD/1000 inh-daysPackages/1000 inh.
110%
Treated pat./1000 inh. a)
100%
90%2000 2001 2002 2003 2004 2005 2006 2007 2008 2009
Figure 17. Trends in indicators of antibacterial consumption (J01) in primary health care, Denmarka) Cumulated number of patients treated with anbacterials (ATC-4 level). The Danish Medicines Agency counts the first treatmentwithin each ATC-group for each patient, each year
DANMAP 2009
47
Table 11. Number of DDDs per treated patient and per package among leading groups of antibacterial agents inprimary health care, DenmarkDANMAP 2009ATC group a) Therapeutic groupIndicator2000DDDs / patientJ01AATetracyclinesPackages / patientDDDs / packageJ01CAPenicillins with extendedspectrumBeta-lactamase sensitivepenicillinsBeta-lactamase resistantpenicillinsDDDs / patientPackages / patientDDDs / packageDDDs / patientPackages / patientDDDs / packageDDDs / patientPackages / patientDDDs / package29.81.915.712.81.68.110.21.47.112.21.57.911.81.86.711.31.57.67.81.45.715.32.07.7200130.61.916.113.01.68.110.31.47.112.41.67.915.91.79.111.31.57.58.31.45.915.62.07.8200233.01.917.513.21.68.210.51.57.211.81.67.514.71.78.611.71.57.68.61.46.016.02.07.8200334.41.918.113.41.68.210.71.57.311.81.67.416.61.89.112.11.67.810.31.66.616.42.17.9Year2004 2005 200636.91.919.013.61.68.411.11.57.512.41.67.817.22.09.112.41.67.99.51.56.417.02.18.139.02.019.613.91.68.511.31.57.712.71.68.016.82.09.312.41.68.09.61.56.517.52.18.340.91.921.014.21.68.911.51.48.013.01.58.619.31.810.712.61.58.310.31.56.917.92.08.72007 200843.02.022.014.41.69.011.71.48.213.41.58.719.11.611.712.41.58.110.61.57.017.31.98.944.42.022.714.71.69.211.81.48.213.71.59.019.91.612.412.51.58.111.01.57.518.92.19.1200945.22.022.714.81.69.211.81.48.413.91.59.120.41.513.312.51.58.111.21.57.619.22.19.3
J01CE
J01CF
J01CR
Combinations of penicillins, DDDs / patientincl. beta-lactamasePackages / patientinhibitorsDDDs / packageDDDs / patientMacrolidesPackages / patientDDDs / packageDDDs / patient
J01FA
J01MA
Fluoroquinolones
Packages / patientDDDs / packageDDDs / patientPackages / patientDDDs / package
J01
Antibacterial agents forsystemic use (total)
a) From the 2009 edition of the Anatomical Therapeutic Chemical (ATC) classification system
4948
DANMAP 2009
Tetracyclines (J01AA) – drug names listed inTable 4
In 2009, consumption of tetracyclines increased by0.07 DID (4.5%) compared with 2008 (Table 10).Tetracycline (0.68 DID (43%)) was the most usedof the tetracyclines in 2009 followed by doxycycline(0.54 DID (33%)), lymecycline (0.33 DID (21%)) andoxytetracycline (0.07 DID (4.2%)), respectively (Figure18). Within the group, the only substance to decreasein 2009 was doxycycline.Since 2000, an extensive increase in the consumptionof tetracyclines (0.63 DID (65%)) has been observed(Table 10). As previously pointed out in the DANMAP2007 report, a large part of the consumption oftetracyclines are prescribed for teenagers and youngadults, and a binary pattern of consumption has beenobserved (tetracycline and lymecycline with peakvalues in the spring and autumn, doxycycline with peakvalues in January and June).
Penicillins (J01C) – drug names listed inTable 4
In 2009, consumption of beta-lactamase sensitivepenicillins decreased by 0.18 DID (3.4%) comparedwith 2008. Nonetheless, an equal increase inpenicillins, including beta-lactamase inhibitors of0.18 DID (66%) balanced the total consumption ofpenicillins between 2008 and 2009 (Table HuAB_P1).
In both the group of penicillins with extended spectrumand the group of beta-lactamase resistant penicillinsconsumption increased slightly.The decreasing consumption of phenoxy-methylpenicillinand amoxicillin in 2009 (and 2008) could be the result ofa decreased disease burden after the introduction of aheptavalent conjugate pneumococcal vaccination in theDanish Childhood Immunization Programme in October2007 (Figure 19). However, without accurate indicationcodes on the prescriptions this connection is difficult todemonstrate [DANMAP 2008].Within the group of penicillins with extended spectrum,the increase in consumption was due to an increasingconsumption of pivmecillinam; the only substance toincrease in 2009 (Figure 19). Since 2007, pivmecillinamhas been a first-line antibiotic for the treatment of urinarytract infections as has sulfamethizole [DANMAP 2008].Over the last decade (2000–2009), the consumptionof penicillins with extended spectrum has increased by1.01 DID (44%), beta-lactamase sensitive penicillins hasincreased by 0.43 DID (9.2%), beta-lactamase resistantpenicillins has increased by 0.61 DID (117%) andcombinations of penicillins, including beta-lactamaseinhibitors has increased by 0.42 DID (1711%),respectively (Table 10). Phenoxymethylpenicillin is stillby far the most consumed penicillin, but among the otherpenicillins the order has changed during the last decade(Figure 19).
1.2
DANMAP 2009
0.9
DDD/1000 inhabitant-days
0.6
Doxycycline (J01AA02)Lymecycline (J01AA04)Oxytetracycline (J01AA06)
0.3
Tetracycline (J01AA07)
0.02000 2001 2002 2003 2004 2005 2006 2007 2008 2009
Figure 18. Consumption of tetracyclines in primary health care, Denmark
DANMAP 2009
49
6.03.53.05.5
DANMAP 2009
DDD/1000 inhabitant-days
5.02.54.52.01.51.00.50.02000 2001 2002 2003 2004 2005 2006 2007 2008 2009
Pivampicillin (J01CA02)Amoxicillin (J01CA04)Pivmecillinam (J01CA08)Phenoxymethylpenicillin(J01CE02)Dicloxacillin (J01CF01)Amoxicillin and enzymeinhibitor (J01CR02)
Figure 19. Consumption of leading penicillins in primary health care, Denmark
1.2
DANMAP 2009
0.9
DDD/1000 inhabitant-days
Erythromycin (J0FA01)
0.6
Roxithromycin (J01FA06)Clarithromycin (J01FA09)Azithromycin (J01FA10)
0.3
0.02000 2001 2002 2003 2004 2005 2006 2007 2008 2009
Figure 20. Consumption of macrolides in primary health care, Denmark
5150
DANMAP 2009last decade, azithromycin has been recommended forurethritis/cervicitis and epididymitis. In 2004 and 2005,part of the increase in roxithromycin consumption waslikely due to an outbreak ofMycoplasma pneumoniae[DANMAP 2005].
Macrolides (J01FA) – drug names listed inTable 4
A decrease of 0.07 DID (3.4%) occurred in theconsumption of macrolides 2008–2009 (Table 10).Within the group of macrolides, the only substanceto increase in 2009 was roxithromycin (Figure 20).Theoretically, a decreased disease burden after theintroduction of a heptavalent conjugate pneumococcalvaccination in the Danish Childhood ImmunizationProgramme in October 2007 could influence theconsumption of macrolides in 2008 and 2009. However,such a trend has not become evident.Over the last decade (2000–2009), roxithromycin(0.6 DID) consumption, and to some extendclarithromycin (0.1 DID) and azithromycin (<0.1 DID)consumption, has increased while erythromycin (0.5DID) consumption has decreased (Figure 20). Thesechanges are not in complete agreement with changesin national guidelines for primary health care fromerythromycin towards first roxithromycin (2004 version),and subsequently clarithromycin (2007 version) asfirst-choice macrolide [DANMAP 2008]. Throughout the
Fluoroquinolones (J01MA) – drug names listedin Table 4Consumption of fluoroquinolones increased by0.01 DID (0.8%) compared with 2008 (Table10). Ciprofloxacin accounted for 94% of the totalfluoroquinolone consumption in 2009; ofloxacin andmoxifloxacin each accounted for 3% (Figure 21). Thus,the trend of increasing fluoroquinolone consumptionseems to have ceased. Nevertheless, the consumptionof fluoroquinolones has increased by 0.37 DID (243%)during 2000–2009 (Table 10). The continuouslyincreasing consumption of ciprofloxacin began whenthe price of ciprofloxacin dropped markedly followingthe introduction of generics onto the Danish markedin December 2001 [Jensenet al.2010 Antimicrob.Chemother. 65: 1286-91].
DANMAP 2009
0.5
0.4
DDD/1000 inhabitant-days
0.3
Ofloxacin (J01MA01)Ciprofloxacin (J01MA02)Moxifloxacin (J01MA14)
0.2
0.1
0.02000 2001 2002 2003 2004 2005 2006 2007 2008 2009
Figure 21. Consumption of leading fluoroquinolones in primary health care, Denmark
DANMAP 2009
51
HospitalsDue to a major hospital strike during spring 2008that particularly affected the number of dischargesand to a lesser extent the number of bed-days, thereported hospital consumption (DDD/100 dischargesand to some extent DDD/100 bed-days) of 2008 waspresumably higher than expected [DANMAP 2008].Therefore, comparing the hospital consumption to 2008using DDD/100 discharges is misleading. Instead, theconsumption of 2009 is compared with 2007 as well as2000.
DDD per 100 occupied bed-days
Total consumption (J01) in somatic hospitals increasedby 3.57 (4.8%) DDD/100 bed-days (DBD) from 2008 to2009(Table 12). Two groups dominated the increasein consumption: second-generation cephalosporins1.43 DBD (11%) and combination of penicillins,
including beta-lactamase inhibitors 1.28 DBD (32%),but the consumption of all the major antibacterialgroups increased with the exception of beta-lactamasesensitive penicillins, aminoglycosides and imidazolederivates.During 2000–2009, the total consumption (J01) insomatic hospitals increased by 31.2 DBD (66%)(Table12). This increase was due to a 40% increase in thenumber of DDDs, and a concurrent 19% decreasein the total number of hospital bed-days (trends inhospitalisation patterns have changed towards morepatients being hospitalised with shorter length of stay).Cephalosporins accounted for 21% of the totalconsumption in somatic hospitals. Penicillins withextended spectrum (18%), fluoroquinolones (13%) andbeta-lactamase sensitive penicillins (12%) were theother major contributing antibacterial groups in 2009(Figure 22).
Table 12. Consumption of antibacterial agents for systemic use in somatic hospitals (DDD/100 occupied bed-days),DenmarkPrivate hospitals, psychiatric hospitals, specialised clinics, rehabilitation centres and hospices were exluded.DANMAP 2009ATC group a) Therapeutic group2000J01AAJ01CAJ01CEJ01CFJ01CRJ01DBJ01DCJ01DDJ01DFJ01DHJ01EAJ01EBJ01EEJ01FAJ01FFJ01GBJ01MAJ01XAJ01XBJ01XCJ01XDJ01XEJ01XX05J01XX08J01XX09J01TetracyclinesPenicillins with extended spectrumBeta-lactamase sensitive penicillinsBeta-lactamase resistant penicillinsCombinations of penicillins. incl. beta-lactamase inhibitorsFirst-generation cephalosporinsSecond-generation cephalosporinsThird-generation cephalosporinsMonobactamsCarbapenemsTrimethoprim and derivativesShort-acting sulfonamidesCombinations of sulfonamides andtrimethoprim. incl. derivativesMacrolidesLincosamidesAminoglycosidesFluoroquinolonesGlycopeptidesPolymyxinsSteroid antibacterials (fusidic acid)Imidazole derivativesNitrofuran derivatives (nitrofurantoin)MethenamineLinezolidDaptomycinAntibacterial agents for systemic use(total)0.2911.5710.035.350.090.104.740.670.020.390.371.231.403.280.162.132.310.330.040.231.790.290.140.000.0046.9520010.2811.6110.656.020.170.125.210.650.010.420.431.251.343.260.171.852.840.320.030.201.960.290.130.000.0049.2120020.3211.5211.436.280.310.145.850.650.000.600.421.241.463.230.191.773.520.370.030.192.110.280.120.040.0052.1020030.3111.9212.126.680.500.146.390.670.000.690.441.181.543.090.191.743.960.420.030.222.370.280.080.040.0055.00Year20040.3511.7912.316.990.850.177.060.680.010.860.421.081.832.940.232.034.980.470.060.222.470.280.100.070.0058.2420050.3413.0112.266.761.170.158.460.830.001.160.410.992.122.910.241.976.190.520.120.262.640.300.080.110.0063.0820060.4013.0910.746.551.850.149.440.840.001.390.420.762.132.850.311.826.780.560.120.282.800.290.110.200.0063.9020070.6313.4210.796.702.950.1312.311.030.042.130.440.341.523.080.351.798.160.630.050.282.620.280.090.160.0169.9420080.7813.969.986.814.000.1813.321.250.072.700.440.351.953.060.411.649.530.680.050.262.550.290.100.210.0274.5620090.9714.389.266.925.280.1214.721.330.062.940.420.322.133.200.471.4610.020.930.060.292.200.340.080.200.0278.13
a) From the 2009 edition of the Anatomical Therapeutic Chemical (ATC) classification system
5352
DANMAP 2009
Figure 23 illustrates the steady shift towardsincreasing consumption of newer, ‘broad-spectrum’antibacterial agents - defined as: combinations ofpenicillins, including beta-lactamase inhibitor (J01CR),cephalosporins (J01DB, DC, DD), carbapenems(J01DH) and fluoroquinolones (J01MA) - in Danish
somatic hospitals. In 2000, consumption of penicillinswith extended spectrum and beta-lactamase sensitivepenicillins represented 25% and 21% of total somatichospital antibacterial consumption in Denmark,respectively. These shares had decreased to 18%and 12% in 2009. In the penicillins with extendedDANMAP 2009
Fluoroquinolones(J01MA), 13%
Beta-lactamasesensitive penicillins(J01CE), 12%Beta-lactamaseresistant penicillins(J01CF), 9%
Penicillins withextended spectrum(J01CA), 18%
Comb. of penicillins,incl. beta-lactamaseinhib. (J01CR), 7%Macrolides,lincosamides andstreptogramins(J01F), 5%Cephalosporins(J01DB,DC,DD), 21%Other antibacterials(J01A,DF,X), 7%Aminoglycosides(J01G), 2%Carbapenems(J01DH), 4%Sulfonamides andtrimethoprim (J01E),4%
Figure 22. Distribution of the total consumption of antibacterial agents in somatic hospitals, Denmark
25%
DANMAP 2009
Percentage of total consumption (%)
20%
Penicillins with extendedspectrum (J01CA)Beta-lactamase sensitivepenicillins (J01CE)
15%
Macrolides (J01FA)Aminoglycosides (J01GB)
10%
Fluoroquinolones (J01MA)Carbapenems (J01DH)
5%
Cephalosporins (J01DB,J01DC, J01DD)Comb. of penicillins, incl. beta-lactamase inhib. (J01CR)
0%2000 2001 2002 2003 2004 2005 2006 2007 2008 2009
Figure 23. Percentages of total somatic hospital consumption by leading groups of antibacterial agents forsystemic use (J01), Denmark
DANMAP 2009
53
spectrum group, the decrease mainly concernedampicillin/pivampicillin whereas consumption ofmecillinam/pivmecillinam has increased. Consumptionof cephalosporins represented 12% of total somatichospital antibacterial consumption in 2000, rising to21% in 2009. The consequences of these changes inthe pattern of antibacterial consumption could be anempirical treatment with a wider coverage of pathogensresponsible for infection. Nevertheless, this potentialgain seems to be rapidly counterbalanced by theemergence of resistance towards newer classes ofantibacterial agents.
DDDper 100discharged patients
The total consumption (J01) in somatic hospitalsincreased by 4.59 (1.6%) from 2007–2009 whenexpressed as the number of DDD/100 discharges,and by 45.5 (18.4%) during 2000–2009 (Table 13). Asthis increase was partly due to a 40% increase in thenumber of DDDs, it also illustrates that the number
of discharges has increased by 13% during the lastdecade as a consequence of changes in hospitalisationpatterns (trends in hospitalisation patterns havechanged towards more patients being hospitalised withshorter length of stay). When expressed in DDD per100 discharges, second-generation cephalosporins andcombination of penicillins, including beta-lactamaseinhibitors dominated the increase in consumptionfrom 2007–2009. However, six groups presented witha decrease in consumption, 2007–2009: penicillinswith extended spectrum, beta-lactamase sensitivepenicillins, beta-lactamase resistant penicillins,macrolides, aminoglycosides and imidazole derivates.This difference between trends in consumptionmeasured by DBD or DDD per 100 dischargesillustrates that the interpretation of the measures ofconsumption is highly dependent on the denominatoras well as the nominator (DDD) and that one indicatoris not enough to express hospital consumption.
Table 13. Consumption of antibacterial agents for systemic use in somatic hospitals (DDD/100 discharged patients),DenmarkPrivate hospitals, psychiatric hospitals, specialised clinics, rehabilitation centres and hospices were excluded.ATC group a) Therapeutic group2000J01AAJ01CAJ01CEJ01CFJ01CRJ01DBJ01DCJ01DDJ01DFJ01DHJ01EAJ01EBJ01EEJ01FAJ01FFJ01GBJ01MAJ01XAJ01XBJ01XCJ01XDJ01XEJ01XX05J01XX08J01XX09J01TetracyclinesPenicillins with extended spectrumBeta-lactamase sensitive penicillinsBeta-lactamase resistant penicillinsComb. of penicillins. incl. beta-lactamase inhibitorsFirst-generation cephalosporinsSecond-generation cephalosporinsThird-generation cephalosporinsMonobactamsCarbapenemsTrimethoprim and derivativesShort-acting sulfonamidesComb. of sulfonamides andtrimethoprim. incl. derivativesMacrolidesLincosamidesAminoglycosidesFluoroquinolonesGlycopeptidesPolymyxinsSteroid antibacterials (fusidic acid)Imidazole derivativesNitrofuran derivatives (nitrofurantoin)MethenamineLinezolidDaptomycinAntibacterial agents for systemic use(total)1.5461.0552.9128.250.490.5225.023.560.092.061.956.497.3617.310.8511.2512.181.720.211.219.451.550.750.000.0020011.4860.4955.5031.370.890.6127.153.400.052.192.266.497.0017.010.909.6414.811.660.151.0210.201.500.670.000.0020021.6357.8057.3531.491.560.7229.363.250.022.992.106.227.3216.190.958.8617.671.880.170.9710.601.420.610.220.0020031.4856.6257.5931.732.360.6830.363.200.023.272.105.587.3114.670.908.2818.801.990.151.0511.251.310.390.210.00Year20041.5853.5255.8531.703.850.7732.053.090.023.881.904.928.3213.331.049.1922.602.120.271.0211.211.280.460.330.0020051.4656.7153.4629.485.110.6736.883.640.025.081.794.349.2612.701.058.5927.002.290.541.1111.531.290.360.640.0020061.6855.2245.3327.657.790.6039.833.540.005.871.783.198.9912.031.317.6928.632.380.531.2011.831.240.460.860.0020072008 b)2.5955.3944.5527.6412.170.5550.814.240.188.781.811.416.2812.701.467.3933.662.610.221.1710.831.170.380.680.033.1957.1840.9027.8916.370.7254.555.100.2711.081.801.437.9812.531.696.7139.042.770.211.0510.461.190.430.840.06
DANMAP 200920093.6453.9734.7525.9719.820.4655.335.000.2111.051.561.217.9912.011.755.4737.603.490.241.098.261.270.310.770.06
247.76 256.46 261.33 261.30 264.28 275.00 269.65 288.70305.46293.29
a) From the 2009 edition of the Anatomical Therapeutic Chemical (ATC) classification systemb) The number of discharges was affectedly low in 2008 due to a major hospital strike
5554
DANMAP 2009
Textbox 3Female patients in primary health care consume more antimicrobial agentsthan male patientsA few reports have documented women more likely to receive antibacterial agents than men andreceiving higher doses (DID) [Vaccheri Aet al.2002. J. Antimicrob. Chemother. 50: 989–997; Straand Jet al.1998.Scand. J. Prim. Health Care. 16: 121–7.]From statistical data of 2008 (Statistics Denmark) it is known that women consult practitioners more oftenthan men, regardless of the purpose of their visit (Figure 24). The fact that women consult practitionersmore frequently has also been demonstrated in other European countries [Fleming DM. 1989. J. R. Coll.Gen. Pract. 39: 68–72; André Met al.2008. Scand J Infect Dis. 40: 648–54; Akkerman AEet al.2004. J.Antimicrob. Chemother. 54: 1116–21].The aim of the present study was to investigate if antimicrobial consumption in primary healthcare washigher in female patients compared to male patients.We obtained prevalence data of antibacterial agents from the Danish Medicines Agency. Firstly, datawere classified by sex and antibacterial groups (ATC-4 level). Secondly, we classified data by sex andage (1-year groups) for the leading antibacterial agents (ATC-5 level).Women had a higher prevalence of consumption in all antibacterial groups (ATC-4 level) except for beta-lactamase resistant penicillins (J01CF) compared with men. Penicillins with extended spectrum (J01CA),with a difference in prevalence of 52 treated patients/1000 inhabitants/year between the sexes, showedthe largest difference followed by short-acting sulfonamides (J01EB), beta-lactamase sensitive penicillins(J01CE) and macrolides (J01FA). Not surprisingly, the antibacterial groups with the largest relativedifference were those including substances used for the treatment of urinary tract infections - Penicillinswith extended spectrum including pivmecillinam (J01CA), Trimethroprim and other derivatives (J01EA),Short-acting sulfonamides (J01EB) and Nitrofuran derivates (J01XE) (Figure 25).Among the antibacterial agents that - besides other indications - are used in the treatment and preventionof urinary tract infections (sulfamethizole, pivmecillinam, trimethoprim, nitrofurantoin, pivampicillin, andciprofloxacin), the prevalence was highest in older ages for both sexes. Consumption of sulfamethizoleand pivmecillinam - the first line drugs of uncomplicated urinary tract infection in Denmark - displayeda higher prevalence in women compared with men of all ages with a crest in adolescent and in youngwomen. A similar crest was seen in the prevalence of both ciprofloxacin and pivmecillinam, but the higherprevalence in women did not sustain to the older ages (Figure 26b).The macrolides displayed very different trends in prevalence. Azithromycin had the highest prevalenceamong adolescent and young adults (women higher than men), clarithromycin had a more equallydistributed prevalence (both ages and sexes), erythromycin showed the highest prevalence in theyoungest ages (0–2 years) and no striking difference between men and women, whereas withroxithromycin the prevalence increased with age and markedly more adolescent and adult women thanmen were treated. Since indication codes are incomplete the reasons for these differences are not wellunderstood [DANMAP 2008].The tetracyclines (doxycycline and tetracycline) showed some interesting trends. Both had the highestprevalence among adolescents and young adults (women with a higher prevalence than men – overall),but where young men (15–20 years) were more frequently given tetracycline, more young womenreceived doxycycline (Figure 26a).Among the penicillins, dicloxacillin was most prevalent among men and the prevalence increased withage, whereas amoxicillin was by far the most prevalent antimicrobial agent among the youngest ages(0–2 years). Amoxicillin/clavulanic acid displayed a bimodal distribution with peaks among the youngestages (0–2 years) and the older ages (>70 years), both dominated by men. Phenoxymethylpenicillinshowed peaks among the youngest ages (0–2 years), among women aged 15–40 years and amongpersons older than 80 years. Men were more prevalent from age 0–7 years and again from age >70
DANMAP 2009
55
years (Figure 26). Interestingly, the phenoxymethylpenicillin curve resembles the curve of doctor visitsper 1000 inhabitants per year (Figure 24).To conclude, women consult practitioners more often and receive more antibacterial agents, but theprevalence of antibacterial consumption in primary health care is highly dependent on the antibacterialagent prescribed and the sex and age of the patients.Ulrich Stab JensenFor further information: Ulrich Stab Jensen ([email protected])DANMAP 2009
No. doctor visits/1000 inhabitants/year
14,00012,00010,0008,0006,0004,0002,00000y10 y20 y30 y40 y50 yAge
60 y
70 y
80 y
90 y
WomenMenFigure 24. Age and gender specific prevalence’s of visits to general practitioners in 2008, DenmarkData source: Statistics Denmark
No. treated patients/1000 inhabitants/year
200150100500
DANMAP 2009
WomenMen
Nitrofuran derivates(J01XE)
Short-acting sulfonamides(J01EB)
Fluoroquinolones (J01MA)
Penicillins with extendedspectrum (J01CA)
Beta-lactamase sensitivepenicillines (J01CE)
Comb. of penicillins incl.beta-lactamase inhibitors(J01CR)
Macrolides (J01FA)
Trimethoprim andderivatives (J01EA)
Beta-lactamase resistantpenicillins (J01CF)
Figure 25. Prevalence of leading antibacterial groups by sex in primary health care, Denmark
Tetracyclines (J01AA)
5756
DANMAP 2009
No. treated/1000
No. treated/1000
1007550250
Clarithromycin
DANMAP 2009
1007550250
Roxithromycin
DANMAP 2009
0 y 10 y 20 y 30 y 40 y 50 y 60 y 70 y 80 y 90 yWomenMen
0 y 10 y 20 y 30 y 40 y 50 y 60 y 70 y 80 y 90 yWomenMen
No. treated/1000
1007550250
Erythromycin
DANMAP 2009No. treated/1000
1007550250
Azithromycin
DANMAP 2009
0 y 10 y 20 y 30 y 40 y 50 y 60 y 70 y 80 y 90 yWomenMen
0 y 10 y 20 y 30 y 40 y 50 y 60 y 70 y 80 y 90 yWomenMen
50
No. treated/1000
Doxycycline
DANMAP 2009
50
Tetracycline
DANMAP 2009
4030201000 y 10 y 20 y 30 y 40 y 50 y 60 y 70 y 80 y 90 yWomenMen
No. treated/1000
4030201000 y 10 y 20 y 30 y 40 y 50 y 60 y 70 y 80 y 90 yWomenMen
50
Amoxicillin/Clavulanic acid
DANMAP 2009
150
Dicloxacillin
DANMAP 2009
No. treated/1000
4030201000 y 10 y 20 y 30 y 40 y 50 y 60 y 70 y 80 y 90 yWomenMen
No. treated/1000
1005000 y 10 y 20 y 30 y 40 y 50 y 60 y 70 y 80 y 90 yWomenMen
Figure 26a. Sex and age specific prevalence (no. persons treated/1000 inhabitants) of the consumption ofleading antibacterial agents in primary health care, Denmark. Age is depicted on the X-axis and prevalenceon the Y-axis
DANMAP 2009
57
400
Phenoxymethylpenicillin
DANMAP 2009No. treated/1000
4003002001000
Amoxicillin
DANMAP 2009
No. treated/1000
30020010000 y 10 y 20 y 30 y 40 y 50 y 60 y 70 y 80 y 90 yWomenMen
0 y 10 y 20 y 30 y 40 y 50 y 60 y 70 y 80 y 90 yWomenMen
20010000 y 10 y 20 y 30 y 40 y 50 y 60 y 70 y 80 y 90 yWomenMen
No. treated/1000
No. treated/1000
300
Sulfamethizol
DANMAP 2009
3002001000
Pivmecillinam
DANMAP 2009
0 y 10 y 20 y 30 y 40 y 50 y 60 y 70 y 80 y 90 yWomenMen
No. treated/1000
1005000 y 10 y 20 y 30 y 40 y 50 y 60 y 70 y 80 y 90 yWomenMen
No. treated/1000
150
Trimethoprim
DANMAP 2009
150100500
Nitrofurantoin
DANMAP 2009
0 y 10 y 20 y 30 y 40 y 50 y 60 y 70 y 80 y 90 yWomenMen
No. treated/1000
No. treated/1000
150100500
DANMAP 2009Ciprofloxacin
150100500
Pivampicillin
DANMAP 2009
0 y 10 y 20 y 30 y 40 y 50 y 60 y 70 y 80 y 90 yWomenMen
0 y 10 y 20 y 30 y 40 y 50 y 60 y 70 y 80 y 90 yWomenMen
Figure 26b. Sex and age specific prevalence (no. persons treated/1000 inhabitants) of the consumption ofleading antibacterial agents in primary health care, Denmark. Age is depicted on the X-axis and prevalenceon the Y-axis
5958
DANMAP 2009
Resistance in zoonotic bacteriaSalmonellaIn 2009, the total number of human cases ofsalmonellosis decreased to 2129 (39 per 100,000inhabitants) compared to 3654 human cases in 2008.SalmonellaTyphimurium accounted for 767 cases andSalmonellaEnteritidis for 600 cases in 2009 [EPI-NEWS 2010, no. 12: http://www.ssi.dk/sw64290.asp].The remaining 762 cases were caused by 129 otherserotypes. In 2009, SSI collected travel informationby phone interviews from allSalmonellapatients.The patients were asked about the date of diseaseonset and whether they had travelled abroad withina seven-day period prior to disease onset. Patientswho had travelled were furthermore asked abouttheir destinations. The case was categorised as“domestically acquired” if the patient had not travelledone week prior to the onset of infection whereas thecase was categorised as “travel abroad reported” ifthe patient had travelled one week prior to the onsetof infection. Cases who had not reported travel to thegeneral practitioners or not been interviewed by phonewere categorised as “unknown origin”. Information wasobtained from 80% of theSalmonellacases.In total, 352 of the 594 (59%)S.Enteritidis isolates and739 of the 762 (97%)S.Typhimurium isolates wereanalysed for antimicrobial resistance (Table 42 and 43)in Appendix 1.Salmonellasurveillance programmes are running onbroiler flocks, pigs (at herd level), Danish pork, andDanish beef. Details of the programmes are describedin the Annual Report on Zoonoses in Denmark. In 2009,a total of 4991 pooled samples (estimated 14,733 singlesamples) were collected from pork, andSalmonellawas isolated from 157 samples. From beef, a total of1606 pooled samples (estimated 4438 single samples)were tested andSalmonellawas isolated from 13 (onlyoneS.Typhimurium) beef samples. For pigs, highrisk herds were appointed based onS.Typhimuriumserosurveillance at the slaughterhouses and in allbreeding herds. In 2009,S.Typhimurium was isolatedfrom 351 of these herds. In addition, 21S.Typhimuriumfrom clinical porcine samples were included in thereport. In Denmark, all broiler flocks are sampled, andin 2009, 7081 samples (3707 flocks) were analysed,of which 33 were positive forSalmonella.None ofthese isolates wereS.Enteritidis and only a fewS.Typhimurium isolates were observed.Data on Danish broiler meat and imported meatsoriginate from the so-called case-by-case riskassessment program (at the Danish Veterinary andFood Administration), referring to risk assessment ofindividual batches; for each tested batch, 12 pooledsamples (each 1–60 single samples) from each batchare tested forSalmonella.In 2009, 100 batches ofDanish broiler meat were sampled with no positivebatches found. Regarding imported meats, 736 batchesof broiler meat (30 positive), 342 batches of turkeymeat (62 positive), 301 batches of pork (37 positive)and 125 batches of beef were tested (5 positive).Results of resistance testing for animals and foodisolates with MIC values are shown in table 39 and 40in Appendix 1.
Phage types and outbreaks
In pigs and pork, the most common serotype isS.Typhimurium (See Annual Report on Zoonoses inDenmark). The most prevalentS.Typhimurium phagetype in pigs and Danish pork in 2009 was DT120 (29%and 24%, respectively). The second most commonphage type was DT12 in pigs (10%) and DT170 inDanish pork (18%) (Table 14). The most commonserotype in imported pork was alsoS.Typhimuriumwith the most common phagetype DT193 followed byDT120, U302 and DT104 (24%, 19%, 19% and 16%,respectively). As observed in the previous years, thedecrease in phage type DT12 and increase in DT120continued for pigs and Danish pork (Figure 27);furthermore, the imported pork showed a tendency ofdecrease in DT104 and increase in DT120. In 2009, anincrease in phage type DT170 was seen in the Danishpork, while phage type DT170 was not detected in theimported pork. In imported turkey meat, phage typeDT193 was the most commonS.Typhimurium phagetype, as in imported pork.AllSalmonellaTyphimurium and Enteritidis isolatesfrom human patients were routinely real-time typedfor surveillance using MLVA (multiple locus variablenumber tandem repeat analysis). When clusters weredetected and epidemiological investigations initiated,a cluster was defined as an outbreak. Using thisdefinition, 406 of the 560 cases of the domesticallyacquired humanS.Typhimurium infections were part ofoutbreaks. The 406 cases were distributed among eightdifferent outbreaks. The two major outbreaks detectedin 2008 with phage types U292 and DT135 also
DANMAP 2009
59
Table 14. Distribution (%) ofSalmonellaTyphimurium phage types from food animals, pork of Danish and importedorigin and human cases categorized as acquired domestically, reported as associated with travel abroad orunknown origin among the isolates selected for susceptibility testing, DenmarkDANMAP 2009Phage typeBroilersDanish%CattleDanish%PigsDanish%PorkBroiler meat Turkey meatHumans a)Danish ImportedImportedImportedDomesticallyTravel%%%%acquiredabroad%reported%17-5-724-1888-41177403-0-1619-0240-1901937--------------1004-----1933--38----10215402<1381643036161155950005954011016404257Unknownorigin%4902291461092<14228118
31215a1741104/104b/104c120135170193U288U292U302U312Others includingnon-typeableNumber ofisolates
----100----------1
--14--2914-------437
<11027-529<1874<13<122372
a) The isolate was categorized as ‘domestically acquired’ if the patient did not travel one week prior to the infection, and it wascharacterized as ‘travel abroad reported’ if the patient travelled one week prior to the infection. Isolates from patients which had notreported travel to the GP or was not interviewed by phone was characterized as ‘unknown origin’
Table 15. Distribution (%) ofSalmonellaEnteritidisphage types from imported broiler meat and humancases categorized as acquired domestically, reported asassociated with travel abroad or unknown origin amongthe isolates selected for susceptibility testing, Denmarkrepresent the two largest outbreaks in 2009 consistingof 212 and 83 cases, respectively. Outbreak-relatedphage types inS.Typhimurium were U292, DT135,U312, DT3, DT120, DT170, and DT17(Table14),of which U292, DT135 and DT17 isolates were fullysusceptible to all tested antimicrobial agents.In 2009, all cases ofS.Enteritidis were MLVA typed. Ofthe 173 domestically acquiredS.enteritidis cases, 123were part of outbreaks. The largest outbreak consistedof 80 cases. Outbreak-related phage types forS.Enteritidis were PT13a, PT8, PT6a, and PT11 (Table15).Data with and without the outbreaks are presented inTable 42 and 43 in Appendix 1. All isolates are includedin Figure 28 and Table 16. A large part of the outbreaksin recent years consisted of fully sensitive phagetypes,the inclusion of the outbreaks giving an importantlylower occurrence of resistance in human cases inrecent years, concurrent with increased prevalence ofSalmonella.Phage typeBroiler meatImported%
DANMAP 2009Humans a) b)DomesticallyTravelUnknownacquiredabroadorigin%reported%%202<112542523831214<1111861027112919313051742311192575
1244b66a813a14b21/21bOthersincludingnon-typeableNumber ofisolates
30-37--73--32030
a) Not all isolates selected for phage typing were susceptibility testedb) The isolate was categorized as ‘domestically acquired’ if the patientdid not travel one week prior to the infection, and it was characterizedas ‘travel abroad reported’ if the patient travelled one week prior to theinfection. Isolates from patients which had not reported travel to theGP or was not interviewed by phone was characterized as ‘unknownorigin’
6160
DANMAP 2009
Comparison of resistance inSalmonellaTyphimurium isolates from pigs, pork andhuman domestically acquired infections
No significant changes were observed in theoccurrence of resistance in the Danish pigs in 2009compared with 2008. Since 2001, a continuoussignificant increasing trend was observed inoccurrence of resistance to sulfonamide, ampicillinand streptomycin, related to a shift in phage types(Figures 27, 28, see also DANMAP 2007). Anincreasing trend was also observed in occurrence oftetracycline resistance during 2001–2007; however,a significant decrease occurred from 2007–2009,despite a continuous increase in consumption oftetracylines throughout the decade. This decreasingtrend in tetracycline resistance can not be explainedby changes in the sampling procedure as no changeswere introduced in that period 2007-2009. Thenumber of farms appointed for sampling based on theserotype surveillance was about 900 in 2007, about500 in 2008 and 466 farms in 2009 resulting in 575,497 and 372S.Typhimurium isolates, respectively.The decrease in occurrence of tetracycline resistanceseem to be caused by a shift in phage types fromresistant ones to more tetracycline sensitive phagetypes, (incl. a decrease in DT104, an increase inU288 and new occurrence of phage types sensitive to
tetracycline) and partly by a decrease in the proportionof tetracycline resistance within certain phage types(including DT120, DT170, DT104). At this stage, ithas not bee ruled out that the decrease in tetracyclineresistance may be related to a lower consumption oftetracyclines in the sampled herds.From 2008 to 2009, the occurrence of neomycin andchloramphenicol resistance in Danish pork showed asignificant increase. Chloramphenicol is not used forpigs in Denmark but the resistance can be co-selectedwith other antimicrobials. The resistance in the Danishpork was very similar to the resistance in the pigs;the only significant difference was the occurrence ofneomycin resistance which was 12% among isolatesfrom Danish pork and 4% in isolates from pigs.A significantly higher occurrence of resistance toampicillin, ciprofloxacin, nalidixic acid and sulfonamidewas seen inS.Typhimurium in imported pork comparedto Danish pork. The use of fluoroquinolones has beenvery low in the Danish pig production since 2003 (Table34 in Appendix 1), explaining the low occurrence ofresistance compared toSalmonellafrom imported pork.No isolates with phenotype of transferable quinoloneresistance (ciprofloxacin MIC>0.06 and naldixicacid MIC<32) or resistance to 3rd or 4th generationcephalosporins were observed in pigs and pork.
60
DANMAP 2009
40
% isolates200199819992000DT17
2001
2002DT66
2003
2004
2005DT120
2006
2007DT170
2008
2009DT193
DT12
DT104
Figure 27. Changes in the distribution of the most prevalentSalmonellaTyphimurium phage types isolatedfrom Danish pig farms from 1998 to 2009. Source: DanishSalmonellasurveillance programme in pigs 1998-2009
DANMAP 2009
61
The occurrence of resistance in human domesticallyacquired infections was generally lower than theoccurrence in both Danish and imported pork. Thismight in part be explained by the outbreaks of phagetype U292 and DT135, which were fully sensitiveS.Typhimurium strains. Also, various types of meatcontribute to the domestically acquiredS.Typhimuriuminfections, even though these are most often relatedto pork [Annual report on Zoonoses in Denmark 2008,http://www.food.dtu.dk/Default.aspx?ID=9606].
resistance (ciprofloxacin MIC>0.06 and naldixicacid MIC<32) or resistance to 3rd or 4rd generationcephalosporins were observed in imported turkey meat.
Comparison of resistance inS.Typhimuriumisolates from patients with travel associatedinfections and domestically acquiredinfections
Occurrence of resistance inSalmonellaTyphimurium isolates from imported turkeymeat
The vast majority of Danish turkeys are exported forslaughter; therefore noS.Typhimurium isolates wereavailable for susceptibility testing from turkeys orDanish turkey meat in 2009. Twenty-one isolates ofS.Typhimurium were obtained from imported turkeymeat (Table 16). InS.Typhimurium isolates from turkeymeat, a significantly lower occurrence of resistancewas found to chloramphenicol and florfenicol,ciprofloxacin and nalidixic acid, spectinomycin andsulphonamide in 2009 compared to 2008. In 2008, 34%of the isolates were resistant to ciprofloxacin. In 2009,no isolates with phenotype of transferable quionolone
The occurrence of resistance to ampicillin,chloramphenicol, tetracycline, sulfonamides,spectinomycin, and streptomycin, was significantlyhigher inS.Typhimurium isolates from patientswith travel associated infections compared toisolates from all domestically acquired infections.The difference could in part be explained by theoutbreaks with sensitiveS.Typhimurium (Table 16and Figure 28). A significantly higher occurrenceof nalidixic acid and ciprofloxacin resistance wasobserved in travel associated isolates compared withdomestically acquired isolates, even without inclusionof the outbreaks (Tabel 16). Thus, the differencesin resistance problably reflects differencies in theconsumption of veterinary antimicrobial agentsbetween Denmark and the countries to which thepatients have travelled.
Table 16. Comparison of resistance (%) amongSalmonellaTyphimurium from food animals, pork of Danish andimported origin and human cases acquired domestically a), reported as associated with travel abroad or with anunknown origin, DenmarkDANMAP 2009SubstancePigs%Danish%4314532004980012164900074PorkImported%542424840076500027572222037Turkey meatImported%90191976008129000245700021Domesticallyacquired b)%106310<1<11660<116121<1<1560Humans a)Travel abroadreported% b)3816331003570251728149058Unknown origin%3612933<1<14170231536770121
TetracyclineChloramphenicolFlorfenicolAmpicillinCeftiofurCefotaximeSulfonamideTrimethoprimApramycinGentamicinNeomycinSpectinomycinStreptomycinCiprofloxacinNalidixic acidColistinNumber of isolates
398441005192241346000372
a) The isolate was categorized as ‘domestically acquired’ if the patient did not travel one week prior to the infection, and it wascharacterized as ‘travel abroad reported’ if the patient travelled one week prior to the infection. Isolates from patients which had notreported travel to the GP or was not interviewed by phone was characterized as ‘unknown origin’b) The higher occurrence of resistance to ciprofloxacin compared to resistance to nalidixic acid was in part due to qnr genes.
6362
DANMAP 2009DANMAP 2009
Pigs
Danish
Pork
Imported
Pork
Domesticallyacquireda)
Humans
Travel abroadreported
Humans
10090
% resistant isolates
8070605040302010000010203040506070809050607080903040506070809070809070809
Tetracycline
Chloramphenicol
Ampicillin
Sulfonamide
Ciprofloxacin
The number of isolates varies between years and between source. For pigs, the annual number of isolates were between 216 and 736.For Danish pork, number of isolates was between 64 and 99, 2005-2009; data before 2005 not shown due to low number of isolates. Forimported pork, the number of isolates varied between 21 and 56, except in 2007 when only 21 isolates were availablea) Until 2007, includes cases where origin of infection is not documented; therefore only data from and after 2007 are included
Figure 28. Trends in resistance to selected antimicrobial agents amongSalmonellaTyphimurium isolated from pigs,pork and from human cases, Denmark
The occurrence of resistance to ciprofloxacin washigher than the occurrence of resistance to nalidixicacid among the human isolates due to the occurrenceof the plasmid-borneqnrSgene, which confersresistance to ciprofloxacin only.In 2009, two of the tested humanS.Typhimuriumisolates were resistant to cefotaxime, one from apatient with a domestically acquired infection andanother from a patient with an unknown origin ofinfection. Both isolates had an ESBL and AmpCphenotype.
Occurrence of resistance inSalmonellaEnteritidis from imported broiler meat andhuman clinical infections
broiler meat. However, 30 isolates ofS.Enteritidis wereobtained from imported broiler meat (Table 17). Themost prevalent serotype among these isolates wasphage type 4 followed by phage type 1. In 2009, theoccurrence of resistance inS.Enteritidis from importedbroiler meat was significantly lower for ampicillin,ceftiofur (from two to zero isolates) and cefotaximecompared to 2008, while it has been increasing forstreptomycin, ciprofloxacin and nalidixic acid. Almosthalf of the isolates were resistant to nalidixic acid andciprofloxacin, compared to 37% in 2008. No isolateswith phenotype of transferable quinolone resistance(ciprofloxacin MIC>0.06 and naldixic acid MIC<32) orresistance to 3rd or 4th generation cephalosporins wasobserved in broiler meat.The occurrence of resistance to ampicillin, ciprofloxacinand nalidixic acid was significantly higher in travelassociated humanS.Enteritidis isolates compared todomestically acquired isolates(Table17).As forS.Typhimurium, the higher occurrence ofresistance in travel associatedS.Enteritidis isolatescompared to domestically acquired isolates, probablyreflects differences in the use of veterinary antimicrobialagents, such as fluoroquinolones in broilers and layers,between Denmark and the countries to which thepatients have travelled.
Consumption of eggs is generally considered tobe the most common source of humanSalmonellaEnteritidis infections [Mølbak and Neiman. 2002. Am.J. Epidemiol. 156: 654-61; Greig and Ravel. 2009.Int. J. Food Microbiol. 130: 77-87; Annual Reporton Zoonoses in Denmark, 2007 (http://www.food.dtu.dk/Default.aspx?ID=9202). In 2008, 0.2% of theDanish layer flocks were positive forSalmonellain thesurveillance program and eggs from these flocks werepasteurised. No information was available on importedeggs (Annual Report on Zoonoses in Denmark, 2008).In 2009, noS.Enteritidis was isolated neither from7081 samples from Danish broilers (3707 flocks) norfrom 100 batches (1200 pooled samples) of Danish
DANMAP 2009
63
Table 17. Comparison of resistance (%) amongSalmonellaEnteritidis from imported poultry meat and humancases categorized as acquired domesticallya), reported as associated with travel abroad or unknown origin,DenmarkDANMAP 2009SubstanceBroiler meatImported%00000000000074747030Domesticallyacquired%000<1000<100000443173HumansTravel abroad reported%100014<1<1330<10<1<118198121Unknown origin%200200220000016161458
TetracyclineChloramphenicolFlorfenicolAmpicillinCeftiofurCefotaximeSulfonamideTrimethoprimApramycinGentamicinNeomycinSpectinomycinStreptomycinCiprofloxacinNalidixic acidColistinNumber of isolates
a) The isolate was categorized as ‘domestically acquired’ if the patient did not travel one week prior to the infection, and it wascharacterized as ‘travel abroad reported’ if the patient travelled one week prior to the infection. Isolates from patients which had notreported travel to the GP or was not interviewed by phone was characterized as ‘unknown origin’
6564
DANMAP 2009
CampylobacterIn 2009, 3352 human laboratory confirmed cases ofcampylobacteriosis were reported (61 per 100,000inhabitants). This was at the same level as in 2008[EPI-NEWS 2009, no. 12: http://www.ssi.dk/sw73796.asp]. For the surveillance of antimicrobial resistance,the former counties of North Jutland, Funen andRoskilde were selected, representing 2.8% of all casesin Denmark in 2009.Since 2007, SSI collected travelling information byphone interviews from allCampylobacterpatientsresiding in the former counties of North Jutland, Funenand Roskilde. The patients were asked about thedate of disease onset and whether they had travelledabroad within a seven-day period prior to diseaseonset. Patients who had travelled were asked abouttheir destinations. The case was categorised as“domestically acquired” if the patient had not beentravelling one week prior to the onset of infection.In 2009, information was obtained from 78% ofCampylobactercases in the three former counties.Among the responding patients, 26% ofCampylobactercases were considered acquired abroad [EPI-NEWS2009, no. 12: http://www.ssi.dk/sw73796.asp].In 2009, 93Campylobacter jejuniisolates weresubmitted to SSI for susceptibility testing from threeformer countries (North Jutland, Funen, and Roskilde),continuously over the year. The isolates were randomlyselected from allCampylobacterisolated from stoolsamples in the three former counties. Among the93 analysed isolates, 31 were from known travel-associated cases and 62 were domestically acquired.The Danish Veterinary and Food Administration (DVFA)collected samples from meat sold at wholesale andretail outlets forCampylobactertesting. The totalnumber of samples tested forCampylobacterincluded196 samples of Danish pork and 199 of imported pork;246 of Danish broiler meat and 159 of imported broilermeat; 152 of Danish beef and 92 of imported beef.From broiler meat, all isolates verified asC. jejuni(26Danish, 62 imported) were susceptibility tested.In 2009, isolates from food were species identified inthe regional laboratories of DVFA and susceptibilitytested at the National Food Institute, DTU. Samplesfrom animals were collected at slaughter for theDANMAP program and species identified andsusceptibility tested at the National Food Institute, DTU.No more than one isolate was included per positivefarm. For broilers, 93 isolates ofC. jejuniwere isolatedfrom 398 samples and 75 isolates were susceptibilitytested and reported. For cattle, 107 isolates ofC.jejuniand 20 isolates ofC. coliwere isolated froma total of 188 samples; 87 isolates ofC. jejuniweresusceptibility tested and reported,C. colifrom cattlewere not included. For pigs, 137 isolates ofC. coliand23 isolates ofC. jejuniwere isolated from a total of160 samples; 113 isolates ofC. coliwere susceptibilitytested and reported.C. jejunifrom pigs were notincluded.Comparison of resistance inCampylobacter jejuniisolates from broilers, broiler meat and humanclinical infectionsFresh broiler meat is the primary source of humanC.jejunidiarrhoea infections in Denmark [Wingstrandetal.2006. Emerg. Infect. Dis. 12: 280–285]. From 2008to 2009, ciprofloxacin and nalidixic acid resistancedecreased significantly (19%) inC. jejunifrom Danishbroiler meat (Figure 29). Significant differences inoccurence of ciprofloxacin and nalidixic acid resistancewere observed betweenC. jejunifrom Danish broilersand Danish broiler meat in 2009, with higher resistancelevels found in broilers (Table 18 and Figure 29). InDanish broilers, the highest occurrence of resistancewas found for ciprofloxacin and nalidixic acid (13%in 2009 compared to 12% in 2008) and tetracycline
Table 18. Comparison of resistance (%) amongCampylobacter jejunifrom food animals, food of Danish or importedorigin and human cases categorized as acquired domestically or reported as associated with travelDANMAP 2009SubstanceCattle%TetracyclineChloramphenicolErythromycinGentamicinStreptomycinCiprofloxacinNalidixic acidNumber of isolates20005202087BroilersDanish%120001131375Broiler meatHumansDanishDanish%400000026Imported%520000565662Domestically acquired%110002242462Travel abroad reported%390037616131
DANMAP 2009DANMAP 2009
65
8070
Danishbroilers
Danish broilermeat
Imported broilermeat
Domesticallyacquireda)
Travelabroad
% resistant isolates
6050403020100000102030405060708090102030405060708090102030405060708090001020304050607080906070809
Erythromycin
Ciprofloxacin
Tetracycline
Figure 29. Trends in resistance to selected antimicrobial agents amongCampylobacter jejuniisolates from broilers,broiler meat and human cases, Denmarka) Until 2007, including cases where origin of infection was not documented and may therefore include isolates acquired abroad but notdocumented as such
(12% in 2009 compared to 10% in 2008). Among thetested antimicrobial agents, fluoroquinolones were themost commonly used antimicrobial class for broilersuntil 2006, but this consumption decreased by 97%from 2006–2008 which might explain the decreasingresistance in broiler meat. In 2009, the consumption offluoroquinolones increased in chickens from specificparent flocks. The consumption of tetracyclines hasincreased considerable in 2008 and 2009 and was thesecond most used antimicrobial class next to amoxicillinin Danish broilers; this is a potential explanation forthe increasing tetracycline resistance inC. jejunifromDanish broilers.ForC. jejunifrom imported broiler meat, erythromycinresistance decreased significantly in 2009 to the levelin Danish broiler meat. As in previous years, resistanceto ciprofloxacin, nalidixic acid and tetracycline wassignificantly higher inC. jejunifrom imported broilermeat compared to Danish broiler meat (Figure 29).In 2009, the level of resistance to ciprofloxacin, nalidixicacid and tetracycline fromC. jejuniisolates fromdomestically acquired human infections was in betweenthe level of resistance for isolates obtained from Danishbroiler meat and imported broiler meat, as observed inprevious years. The consumption of imported broilermeat continued to increase in Denmark, from 17% in2003 to 37% in 2009 [Annual report on zoonoses inDenmark 2009]. It is likely that imported broiler meat
contributes to the high occurrence of ciprofloxacinand nalidixic acid resistance inC. jejuniisolates fromdomestically acquired human infections.The occurrence of resistance to ciprofloxacin,nalidixic acid, and tetracycline continued tobe significantly higher in travel associatedC.jejuniisolates compared to isolates acquireddomestically. For the other antimicrobial agentstested, no significant differences in the resistancelevel could be detected. Ciprofloxacin or otherfluoroquinolones are often used for empirictreatment of adults with bacterial gastroenteritisbecause of the activity against enteric bacterialpathogens. Fluoroquinolones are also used in animalhusbandry; however, in Denmark the consumptionof fluoroquinolones in animal husbandry has beenrestricted since 2002. Travelling to or consumingmeat from countries where fluoroquinolonerestrictions are not implemented can be associatedwith a higher risk of acquiring infection withciprofloxacin resistantC. jejuni.MIC distributions and the occurrence of antimicrobialresistance amongC. jejunifrom broilers, broiler meatof Danish and imported origin, domestically acquiredhuman cases, and human cases associated withtravel are shown in Tables 45, 46, 47 in Appendix 1.
6766
DANMAP 2009
Campylobacter jejunifrom cattleResistance to ciprofloxacin and nalidixic acid amongC.jejunifrom cattle was unchanged from 2008 to 2009, ata level around 20% (Figure 30). A significant increasein the level of fluoroquinolone resistance occurred in2005, despite a low consumption of fluoroquinolones incattle since 2003. Few of the fluoroquinolone resistantisolates were also resistant to tetracycline, indicatingthat co-selection by tetracycline (one of the major drugsfor treatment of calves) was not the explanation forthe high occurrence of fluoroquinolone resistance. Asdiscussed in DANMAP 2007, clonal spread particularlybetween farms - initially in the Southern part ofJutland, or other risk factors in this area - might be anexplanation. The occurrence has been moving northduring 2007–2009; thus in 2009, all the ciprofloxacinand nalidixic acid resistantC. jejuniisolates originatedfrom farms in Jutland, with a high prevalence inNorthern Jutland.MIC distributions amongC. jejunifrom cattle in 2009are shown in Table 45 in Appendix 1.Campylobacter coliAmong the humanCampylobacterisolates selectedfor susceptibility testing, only a fewCampylobacter
coliisolates from domestically acquired infections andtravel associated infections were detected (data notshown). Due to uncertainty about the identification ofC.colifrom imported broiler meat, these are not reported.The number ofC. coliisolates from Danish broilers,Danish broiler meat and cattle were less or equal to 20.Therefore, only antimicrobial resistance amongC. coliisolates from pigs is reported in this DANMAP report.MIC distributions and the occurrence of antimicrobialresistance amongC. colifrom pigs are shown in Table44 in Appendix 1.From 2008 to 2009, no significant changes inresistance were observed amongC. colifrom pigs.Fluoroquinolone resistance was detected in 12% of thetested isolates (Figure 31) despite low consumptionof fluoroquinolones in pigs since 2003 (Table 34 inAppendix 1). In 2009, the erythromycin resistance inC. colifrom pigs was 12%. A continuous decrease inerythromycin resistance inC. coliwas observed afterwithdrawal of the growth promoter tylosin from theDanish pig production in 1998–1999, but in the pastyears the prevalence of resistance has not changedsignificantly; since 2006, the level of resistance toerothromycin has been 10–15% (Figure 31).
40
DANMAP 2009
60
DANMAP 2009
% resistant isolates
% resistant isolates00010203040506070809
30
40
20
20
10
0
0000102030405060708Tetracycline
09
Erythromycin
Ciprofloxacin
Tetracycline
Erythromycin
Ciprof loxacin
Figure 30. Trends in resistance to selected antimicrobialagents amongCampylobacter jejuniisolates from cattle,Denmark
Figure 31 Trends in resistance to selected antimicrobialagents amongCampylobacter coliisolates from pigs,Denmark
DANMAP 2009
67
Resistance in indicator bacteriaEnterococciEnterococcus faeciumandEnterococcus faecaliswereisolated from faecal samples from pigs and broilers.Enterococci were not collected from cattle. All samplesfor the DANMAP program were collected at the timeof slaughter. Isolation and susceptibility testing wasperformed at the National Veterinary Institute forbroilers and at the National Food Institute for pigs.Enterococci from food originated from meat sold atwholesale and retail outlets, collected randomly inall regions of Denmark by the Danish Veterinary andFood Administration Regional laboratories in twocentrally coordinated programs. The identification andsusceptibility testing was done at the National FoodInstitute. In 2009, no samples were collected fromhealthy humans. The results of susceptibility testingwith MIC values are presented in Tables 48, 49, 50, 51in Appendix 1.Enterococci from food animalsA total of 169E. faeciumand 136E. faecaliswereisolated from 772 faecal samples obtained from pigs;of these isolates, 151E. faeciumand 133E. faecalisisolates were susceptibility tested and reported. Forbroilers, enterococci were isolated from 141 of 398samples. AllE. faecium(43 isolates) andE. faecalis(19isolates) were susceptibility tested and reported. Nomore than one isolate was included per positive herd orflock.Before 1995, half of all antimicrobial agents used forproduction animals in Denmark were used for growthpromotion. Among the antimicrobials used wereavoparcin (a glycopeptide) with cross-resistance tovancomycin, tylosin (a macrolide) with cross-resistanceto erythromycin, virginiamycin (a streptogramin)with cross-resistance to quinupristin/dalfopristin andavilamycin (an oligosaccharide). In 1995, the Danishgovernment banned the usage of avoparcin as agrowth promoter. Further research prompted a banof all use of avoparcin in the European Union (EU)in December 1997. Virginiamycin was banned inDenmark in 1998, and all antimicrobial agents phasedout as growth promoters in Denmark in 1998. In theEU, virginiamycin was banned in July 1999 along withtylosin, spiramycin and bacitracin. In September 1999,olaquindox and carbadox were banned in EU and allantimicrobial agents used for growth promotion werephased out in EU by the beginning of 2006. Most ofthe antimicrobial agents used for growth promotionin Denmark had effects on Gram-positive bacteria.Therefore, since 1995 the occurrence of resistanceto these compounds and the antimicrobial group theybelong to have been monitored using enterococci asindicator bacteria (Figures 32, 32; Figures 47-51 inAppendix 1.
Table 19. Occurrence of resistance (%) amongEnterococcus faeciumfrom food animals, food of Danish andimported origin, DenmarkDANMAP 2009SubstanceBroilersDanish%TetracyclineTigecyclineChloramphenicolPenicillinAmpicillinErythromycinGentamicinKanamycinStreptomycinVancomycinQuinupristin/dalfopristinAvilamycinSalinomycinLinezolidNumber of isolates16-014142302507763043PigsDanish%66003529380304723000151Broiler meatDanish%1400211600103138098Imported%52002324610133418314090BeefImported%70077130770000015%18006635012120600017Pork meatDanishImported%140099320990555022
6968
DANMAP 2009
Table 20 Occurrence of resistance (%) amongEnterococcus faecalisfrom food animals, food of Danish andimported origin, DenmarkDANMAP 2009SubstanceBroilersDanish%TetracyclineTigecyclineChloramphenicolPenicillinAmpicillinErythromycinGentamicinKanamycinStreptomycinVancomycinAvilamycinSalinomycinLinezolidNumber of isolates53-0004705210011019PigsDanish%8801900492031380000133Broiler meatDanish Imported%260300260313000039%5809005032028000088BeefDanish Imported%1804007077000028%1500003003000033Pork meatDanishImported%20050012344000096%49010082640000109
AmongE. faeciumisolates from production animals,the highest prevalence of antimicrobial resistancewas found among isolates from pigs(Table19). Theoccurrence of resistance was highest for tetracycline(66%), followed by streptomycin (48%), erythromycin(36%) and penicillin (36%) (Figures 32, 33).From 2008 to 2009, significant increases in theoccurrence of resistance was detected for ampicillinand penicillin inE. faeciumisolates from pigs, mostlikely as a result of the increased usage of beta-lactams(Figure 7a). The increase in occurrence of resistanceto penicillin amongE. faeciumisolates from pigs hasbeen observed since 2000, while the consumptionhas been increasing. For streptomycin, a gradualincrease in occurrence in resistance was observedfrom 2003 (19%) to 2009 (48%) despite a constantlow consumption of streptomycin in pigs. Resistancetowards vancomycin and quinupristin/dalfopristinstill prevails amongE. faeciumisolates more than adecade after banning the usage of streptogramins andavoparcin for growth promotion (Table 19) (Figures50, 51 in Appendix 1).The persistence of vancomycinresistance in isolates from pigs has previously beenassociated with prevalence of resistant clones andplasmids [Hasmanet al.,2005. Microb. Drug Res. 11:178-84].AmongE. faeciumisolates from broilers the highestoccurrence of resistance was found for salinomycin(63%), erythromycin (23%) and tetracycline (16%).Salinomycin is widely used as a coccidiostat in thebroiler production (data not shown. See DANMAP2004). From 2008 to 2009, significant increase in the
occurrence of resistance was detected for ampicillininE. faeciumisolates from broilers, most likely as aresult of the increased usage of beta-lactams in 2009.Resistance to the growth promoter avilamycin was stillpresent inE. faeciumisolates from broilers (Table 19,Figure 49).AmongE. faecalisisolates from pigs, the highestoccurrence of resistance was found for tetracycline(88%), erythromycin (49%) and streptomycin (38%)(Table 20; Figures 32, 33). A gradual increase inprevalence among isolates of porcine origin has beenobserved for chloramphenicol (3% in 2003 to 20%in 2009) and for erythromycin (28% in 2000 to 49%in 2009) (Figure 33). A concurrent increasing use ofamfenicols in pigs has occurred since 2003 (Table 34in Appendix 1). Macrolides has been one of the twomajor drugs for pigs throughout the past decade, andincreased significantly in 2009, (Figure 7b-7d).ForE. faecalisisolates from broilers, the highestoccurrence of resistance was observed for tetracycline(53%), erythromycin (47%) and streptomycin(21%) (Table 20). From 2008 to 2009, significantlyhigher occurrence of resistance was detected forerythromycin, streptomycin and tetracycline inisolates from broilers. An increasing consumption oftetracyclines occurred in 2008–2009, while macrolidesand aminoglycosides were rarely used in the broilerproduction (Table 8).Enterococci from foodFor Danish meats,E. faeciumwere isolated from 8.5%(17/200) of the pork samples and 62% (98/159) of the
DANMAP 2009
69
broiler meat samples. For imported meats,E. faeciumwere isolated from 11% (22/195) of the pork samples,15% (15/98) of the beef samples and 37% (90/246) ofthe broiler meat samples.E. faecaliswere isolated from 48% (96/200) of Danishpork samples, 18% (28/158) of Danish beef samples,and 25% (39/159) of Danish broiler meat samples.For imported meats,E. faecaliswere isolated from56% (109/195) of the pork samples, 34% (33/98) ofthe beef samples, and 36% (88/246) of the broiler
meat samples. All these isolates from meat weresusceptibility tested.Compared to Danish produced broiler meat, asignificantly higher occurrence of resistance was foundin imported broiler meat for ampicillin, erythromycin,kanamycin, penicillin, streptomycin and tetracycline.For salinomycin, a higher prevalence was found inDanish produced broiler meat when compared toimported broiler meat. The occurrence of resistance
DANMAP 2009
100806040200
DANMAP 2009
40,00035,00030,00025,00020,00015,00010,0005,0000
1994199519961997199819992000200120022003200420052006200720082009
Tetracycline consumption in pigs
E. faecium from pigs
E. faecalis from pigs
Figure 32 Trends in tetracycline resistance amongEnterococcus faeciumandEnteroccus faecalisfrom pigs andthe consumption of tetracycline in pigs, Denmark, 1994-2009
DANMAP 2009
1008060402001994199519961997199819992000200120022003200420052006200720082009
80,00070,00060,00050,00040,00030,00020,00010,0000
Macrolides for pigs
Pigs - E. faecium
Pigs - E. faecalis
Figure 33. Trend in occurrence of resistance to erythromycin amongEnterococcus faeciumandEnterococcusfaecalisfrom pigs and the consumption of macrolides for pigs, Denmark, 1994-2009
Kg active compound
% resistant Isolates
Kg active compound
% resistant isolates
7170
DANMAP 2009
was the same inE. faeciumisolates from Danish porkand imported pork (Table 19).Significantly higher occurrence of resistance totetracycline was found in isolates from imported porkcompared to isolates from Danish pork, while higheroccurrence of resistance to chloramphenicol was foundin isolates from Danish pork, compared with isolatesfrom imported pork (Table 20).Compared with isolates from Danish broiler meat,significantly higher occurrence of resistance toerythromycin, kanamycin and tetracycline was found inimported broiler meat.Comparison of occurrence of resistance inE. faeciumfrom food animals and foodA comparison of resistance amongE. faeciumisolatesfrom food animals and foods is presented in Table19. Significantly lower occurrence of resistance wasfound for ampicillin, streptomycin and tetracycline inisolates from pork compared with pigs. Significantlylower occurrence of resistance was found for ampicillin,avilamycin and salinomycin in isolates from Danishbroiler meat compared with broilers.Comparison of resistance inE. faecalisfrom foodanimals and foodA comparison of resistance amongE. faecalisfromDanish food animals and foods is presented in Table20. Significantly higher occurrence of resistance forchloramphenicol, erythromycin, gentamicin, kanamycin,streptomycin and tetracycline was detected in isolatesfrom pigs compared to isolates from Danish pork.Higher occurrence of resistance to salinomycin andtetracycline was detected among isolates from broilerscompared with isolates obtained from Danish broilermeat.
DANMAP 2009
71
Escherichia coliE. coliisolates from healthy food producing animalsoriginated from samples collected for the DANMAPprogram at the time of slaughter. For broilers, isolationand susceptibility testing was performed at the NationalVeterinary Institute and for cattle and pigs at theNational Food Institute.E.colifrom food originatedfrom meat sampled at wholesale and retail outlets,collected randomly in all regions of Denmark by theDanish Veterinary and Food Administration Regionallaboratories in two centrally coordinated programs. Thesusceptibility testing was done at the National FoodInstitute. In 2009, no samples were collected fromhealthy humans.
Escherichia colifrom food animals
E. coliwas isolated from 279 out of 284 samples frompigs, 156 out of 161 samples from cattle, and 257 outof 398 samples from broilers. Not more than one isolatewas included per positive farm. A randomly selectedsubsample of 150, 94 and 152 isolates from pigs, cattleand broilers, respectively, were susceptibility tested andreported.Among animal species, the level of resistance inindicatorE. coliwas lowest in isolates from cattle,with 95% of the isolates being fully susceptible to alltested antimicrobial agents. Among the tested broilerisolates, 57% were fully susceptible and 8% were
multi resistant (resistant to three or more antimicrobialclasses). Among isolates from pigs the proportion offully susceptible isolates decreased from 57% fullysusceptible in 2008 to 43% in 2009; 37% of the isolatesfrom pigs were multi resistant.The occurence of resistance in 2009 is shown in Table21.Trends in resistance to selected antimicrobialagents in isolates from production animals (2000–2009)are presented in Figure 34. The MIC distributions for2009 are shown in Table 52 in Appendix 1. In general,the highest resistance level was found inE. colifrompigs, except for fluoroquinolone (nalidixic acid andciprofloxacin) resistance, which was higher inE. colifrom broilers throughout the whole study period (2000–2009). The low level of fluoroquinolone resistance inE. colifrom Danish pigs and cattle probably reflectsthe low consumption since 2002, where the use inproduction animals was restricted; since 2002, thehighest fluoroquinolone consumption was seen inpoultry, as reflected in the higher resistance level.However, the fluoroquinolone consumption in thebroiler production (including rearing) has decreasedby 98% from 2004–2008, but increased again in 2009.Fluoroquinolone resistance inE. colifrom broilers, pigsand cattle has not increased through the past decade.In 2009, one ceftiofur resistantE. coliwas isolatedfrom broilers. This is to our knowledge the firstcephalosporin resistantE. coliisolated from broilers inDenmark. Cephalosporins have not been used in the
Table 21. Occurrence of resistance (%) amongEscherichia colifrom food animals, food of Danish and importedorigin, DenmarkDANMAP 2009SubstanceBroilersDanish%TetracyclineChloramphenicolFlorfenicolAmpicillinCephalothinCeftiofurCefpodoximeCefotaximeSulfonamideTrimethoprimApramycinGentamicinNeomycinSpectinomycinStreptomycinCiprofloxacinNalidixic acidColistinNumber of isolates121118-1-01460003912110152CattleDanish%2112-0-0300000300094PigsDanish%355126-0-033190062543110150Broiler meatDanish%111020-0-083121210440143Imported%5521055-4-454382514284541404221BeefDanish Imported%%3003-0-03000003000325005-0-0550050500039Pork meatDanish Imported%%321029-1-138250061642110106488228-0-03431000183562065
7372
DANMAP 2009
DANMAP 2009
100806040200
Broilers
Cattle
Pigs
% resistant isolates
00 01 02 03 04 05 06 07 08 09 00 01 02 03 04 05 06 07 08 09 00 01 02 03 04 05 06 07 08 09
Ampicillin
Ciprofloxacin
Sulfonamide
Tetracycline
Streptomycin
Figure 34. Trends in resistance to selected antimicrobial agents amongEscherichia colifrom food animals,Denmark
broiler production in Denmark in 2001–2009, but mayhave been used in day-old chicks imported for rearingof parents flocks, or in grand parent floxk abroad.Findings consistent with vertical – not horizontal –transmission of ampicillin- and nalidixic acid-resistantE. colithrough the broiler production system has beendemonstrated [Bortolaiaet al.,2010. Vet.Microbiol. P379-386]. In the same study, cephalosporin resistancewas not found in 20 broiler parent farms and 350 broilerfarms in 2007, although selective methods were used.RegardingE. colifrom pigs, the occurrence ofampicillin, chloramphenicol, sulfonamide, streptomycinand spectinomycin resistance increased significantlyfrom 2008 to 2009. For ampicillin, this was part of anincreasing trend from 8% in 2000 to 26% in 2009,probably related to an increasing consumption in thesame period (Figure). For spectinomycin, a decreasingtrend was observed both in resistantE. coliandconsumption since 2004, while both resistance andconsumption increased in 2009. Since 2000, the trendsin occurrence of sulfonamide resistantE. colihavebeen similar to the trend in spectinomycin resistantE.coli,probably as a consequence of co-selection. Fortetracycline, an increasing trend (p=0.058) was seenfor tetracycline resistance from 2008 to 2009, as part of
a significant increasing trend from 24% in 2000 to 35%in 2009; tetracycline consumption in the pig productionhas been increasing since 2002, in particular from2005 to 2007. In 2009 a supplementary investigation ofcephalosporin resistantE. colifrom pigs was performedby use of a selective enrichment method (see focusarea).In cattle, no statistically significant changes in the levelof resistance were observed from 2008–2009. (Table52 in Appendix 1, Figure 34, see also DANMAP 2007).Resistance to tetracycline, ampicillin, and sulfonamidehas been decreasing since 2004, with a non-significantincrease in ampicillin resistance in 2009. Concurrently,the use of the corresponding antimicrobial groups incalves has been decreasing until 2008. In cows, theuse of tetracyclines, sulfonamide, streptomycin andaminopenicillin increased during the same period.
Escherichia colifrom food
For Danish meats,E. coli wereisolated from 53%(106/200) of the pork samples, 21% (32/156) ofthe beef samples, and 55% (143/259) of the broilersamples. For imported meats,E. coliwere isolatedfrom 33% (65/196) of the pork samples, 40% (39/98)
DANMAP 2009
73
of the beef samples and 87% (222/254) of thebroiler samples. AllE. coliisolated from meat weresusceptibility tested.Table 53 in Appendix 1 present the MIC distributionsand occurrence of antimicrobial resistance inE. coliisolates collected from broiler meat, pork and beefsampled at wholesale and retail outlets in 2009.Compared to Danish broiler meat, the level ofresistance was significantly higher for 14 of thetested antimicrobial agents inE. colifrom importedbroiler meat, including tetracycline, chloramphenicol,ampicillin, cefoxitime, ceftiofur, colistin, sulfonamide,trimethoprim, neomycin, spectinomycin, streptomycin,ciprofloxacin and nalidixic acid (Table 21).Cephalosporin resistance was observed amongE.colifrom imported broiler meat (3.6%) where alsothe highest prevalence of fluoroquinolone resistancewas found (41% ciprofloxacin resistance); in Danishbroiler meat, no cephalosporin resistance and 4.1%ciprofloxacin resistance was found. In imported pork,two isolates with MIC for nalidixic acid < 32 and forciprofloxacin > 0.06 were found. The isolates containedtransferable fluoroquinolone resistance encodedbyqnrBandqnrS,respectively. The occurrence ofresistance inE. coliisolates obtained from importedbeef was low and not statistically higher compared toisolates from Danish beef.InE. colifrom Danish pork, resistance to ampicillin(from 15% to 29%), streptomycin (28% to 42%), andsulfonamide (18% to 38%) has increased significantlyfrom 2004 to 2009. Resistance to ceftiofur was found
in one isolate from Danish pork in 2009, and was foundfor the first time in Danish pork in 2008. In 2009, nostatistically significant differences were observed bycomparison of resistance inE. coliisolates obtainedfrom imported pork and Danish pork. However,the resistance to fluoroquinolone remained low inDanish pork, probably due to the low fluoroquinoloneconsumption in Danish pigs since 2002; in importedpork, 10% of theE. coliisolates were resistant tofluoroquinolone in 2009.In 2009, a supplementary investigation ofcephalosporin resistantE. colifrom meat wasperformed by use of a selective enrichment method(see focus area).
Comparison of resistance inEscherichia colifrom animals and food
Data on the occurrence of resistance in food animalsand Danish foods are presented inTable Icoli5.Formost of the tested antimicrobial agents, the levelof resistance in Danish meat reflected the level ofresistance in the corresponding animal specieswith some exceptions. The occurrence of nalidixicacid, sulfonamide and trimethoprim resistance wassignificantly lower in Danish broiler meat as comparedto isolates from broilers. The differences in the levelof resistance between broiler meat and broilers mightbe caused by cross contamination at the slaughterhouse or due to some resistant isolates being lessfit to survive through the food production chain thansusceptible isolates.
7574
DANMAP 2009
Textbox 4European report on antimicrobial resistance in zoonotic and indicator bacteriafrom animals and foodContinuous monitoring of antimicrobial resistance in different food animal reservoirs is a prerequisite forunderstanding the dissemination of resistance, for planning targeted interventions and as a guide forauthorities and scientists. For that purpose, European legislation on the monitoring of zoonoses and zoonoticagents lays down that European Member States (MSs) are obliged to monitor and report on the antimicrobialresistance inSalmonellaandCampylobacterisolates from animals and food while reporting of resistance datafrom the indicator organisms (E.coliandEnterococci)is voluntary.From 2004 through 2007, 26 MSs and two non-MSs reported antimicrobial susceptibility data on zoonotic andindicator bacteria originating from animals and food. During that period, some countries used inhibitions diskdiffusion to test for resistance while others used MIC determination and not all breakpoints were harmonisedbetween countries. In order to be able to compare susceptibility data between countries and over time, all MICdata were reinterpreted using standardised epidemiological cut-off values [EUCAST, Kahlmeteret al.2003].For inhibition zones there are currently no available harmonised epidemiological cut-off values. Therefore,cut-off values for inhibition zones were set for use in this report in collaboration with the European UnionReference laboratory for Antimicrobial Resistance (EU-RL-AR) where possible and meaningful, based onEUCAST guidelines. Although these reinterpretations of data enables better comparison of data betweencountries, the monitoring and reporting of data performed by each Member State was not harmonised whichmight contribute to some differences between countries.In general, resistance to antimicrobial agents was commonly found amongSalmonella, Campylobacterandthe indicatorE. coliand enterococci isolates from animals and food in the EU. At MS level, the occurrence ofantimicrobial resistance remained in most cases relatively stable over time; however, for most of these testedantimicrobial agents, large differences in the occurrence of resistance were observed between countries(Figures 35, 36). There was a tendency that countries reporting high occurrence of resistance in one bacterialspecies were also among the countries reporting high occurrence in other bacterial species. Since manyresearch studies indicates that the most important risk factor for occurrence of antimicrobial resistance is theconsumption of antimicrobial agents, these large differences in resistance observed between countries mightindicate that the consumption of antimicrobial agents varies between countries. High occurrence of resistanceto ciprofloxacin inSalmonellaisolates from fowl (Gallusgallus)was reported by some MSs and resistance tofluoroquinolone was commonly reported amongC. jejuniandC. coliisolates from animals and broiler meatin several MSs. Denmark restricted the consumption of fluoroquinolones in animals in 2002 because theyare critically important in human medicine and compared to other MSs, Denmark were among the countriesreporting the lowest occurrence of fluoroquinolone resistance. In addition, Denmark was among the countriesreporting the lowest occurrence of resistance within the EU.When comparing antimicrobial resistance inCampylobacter jejuniandC. colifromGallus gallusand broilermeat, the same levels of resistance were observed within each country, although the levels of resistancevaried between countries (Table 22). This indicates that the level of resistance observed in animal isolates is agood indicator for the levels of resistance humans are exposed to through food.The full report ”The community Summary Report on antimicrobial resistance in zoonotic and indicator bacteriafrom animals and food in the European Union in 2004-2007” is available at the webpage of the European FoodSafety Authority (www.efsa.europa.eu).Hanne-Dorthe Emborg and Antonio Vieira, on behalf of the National Food Institute, Technical University ofDenmarkFor further information: Antonio Vieira ([email protected])References:-Kahlmeter G.et al.,2003.European harmonization of MIC breakpoints for antimicrobial susceptibility testingof bacteria. Journal of Antimicrobial Chemotherapy, 52, 145-148.- EUCAST(European Committee on Antimicrobial Susceptibility Testing), definitions. Available at: http://www.srga.org/Eucastwt/eucastdefinitions.htm
DANMAP 2009
75
DANMAP 2009
1008060402002004Czech RepublicItaly2005DenmarkNetherlands2006FranceSpain2007GermanySwitzerland
Figure 35. Trends in ciprofloxacin resistance inCampylobacter jejunifromGallus gallusinreporting Member States, 2004-2007DANMAP 2009
% resistant isolates
1008060402002004AustriaFrancePoland2005DenmarkHungarySpain2006EstoniaItalyNorway2007FinlandNetherlandsSwitzerland
Figure 36. Trends in tetracycline resistance inEscherichia colifrom pigs in reportingMember States, 2004-2007Table 22. Comparison of resistance (%) amongCampylobacter jejunifromGallus gallusand broiler meat(Gallusgallus)in 2007DANMAP 2009CompoundAustriaGalllus Broilergallusmeat270000585026160000666680DenmarkGalllus Broilergallusmeat10010299942041111114004305633323114741006499137860021199000002910FranceGalllus Broilergallusmeat5057GermanyGalllus Broilergallus meat5454NorwayGalllus Broilergallusmeat10SwitzerlandGalllus Broilergallusmeat20033515181223200023030109
TetracyclineChloramphenicolErythromycinGentamicinStreptomycinCiprofloxacinNalidixic acidNumber ofisolates
% resistant isolates
7776
DANMAP 2009
Resistance in human clinical bacteriaEscherichia coliEscherichia coliis part of the normal intestinal floraof both humans and animals but can also causeinfections. In humans,E. colican cause a varietyof intestinal and extra-intestinal infections such asdiarrhoea, urinary tract infections, meningitis, andbloodstream infections. ForE. coli,this report includesdata from 14 Departments of Clinical Microbiology(DCM), representing 95% of the Danish population.Results from blood and urine isolates ofE. coliinhospitals were obtained from all 14 DCM; 12 DCMcontributed data on urine isolates in primary health care(Table 23).resistance increased significantly from 12% to 16%(min. 5%, max. 26% at the individual DCM) andnalidixic acid resistance increased significantly from13% to 19% (min. 10%, max. 26%) (Figure 37b). Thesignificant increase in occurrence of fluoroquinoloneresistance corresponds to the steady increase over theyears in the consumption of fluoroquinolones (Table12, Figure 23). The occurrence of fluoroquinoloneresistance was the same as reported to EARSS bymany other European countries in 2008 [EARSS 2008,http://www.rivm.nl/earss/result/Monitoring_reports/].A significant increase was also observed in theresistance to cephalosporins. Cefuroxime (2ndgeneration cephalosporin) resistance reached 8% (min.3%, max. 14%), and 7% (min. 2%, max. 14%) of theisolates were resistant to 3rd generation cephalosporin(reported as ceftazidime, ceftriaxone, cefpodoximeor cefotaxime) (Table 23). This corresponds to theprevalence of ESBL inE. coliblood isolates (7%) asobserved in a nation-wide prevalence study of ESBL-producing bacteria performed in October 2009 (SeeFocus Area 1). Also, the occurrence of cephalosporinresistance corresponds to the increase over the
E. coliblood isolates obtained fromhospitalized patients
The antimicrobial susceptibility of approximately 4000E. coliisolates from blood was reported in 2009. Not allDCM tested for the same antimicrobial agents (Table23, Figure 37a, b).The occurrence of resistance to fluoroquinolonesincreased significantly from 2008 to 2009. Ciprofloxacin
Table 23. Resistance (%) to ampicillin, mecillinam, sulfonamide, gentamicin, ciprofloxacin, nalidixic acid, cefuroxime,3rd generation cephalosporins and carbapenems inEscherichia coliisolates from humans, Denmark 2009DANMAP 2009
SubstanceAmpicillinMecillinamSulfonamideGentamicinCiprofloxacinNalidixic acidCefuroxime3rd generation cephalosporins d)Carbapenems e)Max. number of isolates tested
Blood isolates, hospitals a)%446#
Urine isolates, hospitals b)%42 *7*36 *
Urine isolates, primary health care c)%42 *53811 *14 *3*630,909
516 *19 *8*7*0401743,54813 *15 *6*6
*) An asterisk indicates a significant increase from 2008 to 2009#) A number sign indicates a significant decrease from 2008 to 2009a) All 14 DCM reported data on ampicillin, gentamicin and ciprofloxacin resistance; 13 DCM reported cefuroxime, mecillinam and 3rdgeneration cephalosporin resistance; 10 DCM reported nalidixic acid resistance; and 8 DCM reported data on carbapenem resistanceb) All 14 DCM reported data on ampicillin resistance, 12 DCM reported mecillinam resistance, 11 DCM reported ciprofloxacin resistance,10 DCM reported sulfonamide resistance, 9 DCM reported 3rd generation cephalosporin resistance, and 8 DCM reported data oncefuroxime and nalidixic acid resistance. No comparison on 3rd generation cephalosporin resistance in 2008 and 2009 was made, sinceonly one DCM reported data in 2008c) All 12 contributing DCM reported data on ampicillin and mecillinam resistance, 11 DCM reported sulfonamide resistance, 10 DCMreported ciprofloxacin resistance, 8 DCM reported 3rd generation cephalosporin resistance, 7 DCM reported nalidixic acid resistance, and6 DCM reported data on cefuroxime resistance. No comparison on 3rd generation cephalosporin resistance in 2008 and 2009 was made,since only one DCM reported data in 2008d) Tested 3rd generation cephalosporins were ceftazidime, ceftriaxone, cefpodoxime and cefotaximee) Tested carbapenem was meropenem
DANMAP 2009
77
years in the consumption of 2nd and 3rd generationcephalosporins (Table 12, Figure 23). The occurrenceof 3rd generation cephalosporin resistance in Denmarkwas above the level reported to EARSS by the otherNordic countries and corresponded to the occurrencereported by several southern European countries in2008 [EARSS 2008].In 2009, noE. coliisolates from blood werecarbapenem resistant.A significant decrease in the resistance to mecillinamwas observed (Table 23, Figure 37b). Among thesame 10 DCM reporting data in both 2008 and 2009,resistance decreased significantly from 6% to 4%.
E. coliurine isolates obtained fromhospitalised patients
The antimicrobial susceptibility of approximately 43,000E. coliisolates obtained from hospitalized patients witha urinary tract infection was reported in 2009. Not allDCM tested for the same antimicrobial agents (Table23). From 2008 to 2009, a significant increase in theoccurrence of resistance was detected for ampicillin,mecillinam, sulfonamide, ciprofloxacin, nalidixic acidand cefuroxime (2nd generation cephalosporin)(Table 23, Figure 38a, b). In 2008, only one DCM(Aalborg Hospital) reported data on 3rd generationcephalosporin resistance in all tested isolates makinga comparison from 2008 to 2009 uncorrect. Theincreased occurrence in resistance correspondsto the increasing consumption of penicillins withextended spectrum, fluoroquinolones, and 2nd and 3rdgeneration cephalosporins seen the last decade (Table12, Figure 23).The occurrence of 3rd generation cephalosporinresistance (6%) (Table 23) was higher than theprevalence of ESBL inE. coliurine isolates fromhospitalized patients (4%) as observed in a nation-wide prevalence study of ESBL-producing bacteriaperformed in October 2009 (See Focus Area).
cephalosporin resistance in all tested isolates makinga comparison from 2008 to 2009 uncorrect (Table 23,Figure 39a, b.The continuously increasing occurrence offluoroquinolone resistance was cincurrent with theincreasing consumption of fluoroquinolones in primaryhealth care (Table 10). The increased consumptionof ciprofloxacin in primary health care, most likelyexplained by reduced price per DDD due to theintroduction of generic ciprofloxacin on the Danishmarket, has been shown to result in an increasein ciprofloxacin resistance inE. coliobtained fromurine isolates [Jensen USet al.2010. J. Antimicrob.Chemother. 65: 1286-1291].The occurrence of 3rd generation cephalosporinresistance (6%) (Table 23) was higher than theprevalence of ESBL inE. coliurine isolates fromgeneral practice patients (2%), as observed in a nation-wide prevalence study of ESBL-producing bacteriaperformed in October 2009 (See Focus Area).The high occurrence of resistance to ampicillin (42%)and sulfonamides (38%) inE. colifrom urine suggeststhese antimicrobial agents obsolete for the empirictreatment of urinary tract infections. However, thereported resistance levels may be biased due to asignificant proportion of urine samples submitted formicrobiological diagnosis following failure of empiricaltreatment.Recently, a study on resistance in urinary coliformstrains isolated from both hospitalized and generalpractice patients was conducted in the Sønderborgarea, the only area not included in DANMAP [Cybulskiand Kjaeldgaard. 2010. Int. J. Antimicrob. Agents.35: 511-518]. This study showed the same trendsof increasing resistance to ampicillin, sulfonamide,ciprofloxacin and cefuroxime in urinaryE. colias shownby DANMAP. This indicates that the DANMAP resultsapply for the whole of Denmark. In the Sønderborgstudy, a significant decrease in resistance to mecillinamin urinaryE. coliisolates was observed. This is inaccordance with the observed significant decreasein mecillinam resistance inE. coliblood isolatesmentioned above (Table 23, Figure 37b).
E. coliurine isolates obtained from primaryhealth care
The antimicrobial susceptibility of approximately31,000E. coliisolates obtained from patients with aurinary tract infection from primary health care wasreported in 2009. Not all DCM tested for the sameantimicrobial agents (Table 23). A significant increasein resistance from 2008 to 2009 was detected forampicillin, cefuroxime (2nd generation cephalosporin),ciprofloxacin and nalidixic acid, whereas theoccurrence of resistance to mecillinam and sulfonamidewas the same as in 2008. In 2008, only one DCM(Aalborg Hospital) reported data on 3rd generation
7978DANMAP 2009Denmark - Hospital blood isolates50
DANMAP 2009DANMAP 2009Denmark - Hospital blood isolates201816141210864202000200120022003200420052006200720082009Gentamicin (n=4014)Mecillinam (n=3659)Nalidixic acid (n=2790)Cefuroxime (n=3820)Ciprofloxacin (n=3213)3rd gen. cephalosporin (n=2157)
30201002000200120022003200420052006200720082009
Ampicillin (n=4017)Cefuroxime (n=3820)Ciprofloxacin (n=3933)3rd gen. cephalosporin (n=2157)
Gentamicin (n=4014)Mecillinam (n=3659)Nalidixic acid (n=2975)
% resistant isolates
% resistant isolates
40
Figure 37a. Resistance (%) to ampicillin, gentamicin,cefuroxime, mecillinam, ciprofloxacin, nalidixic acid and3rd generation cephalosporins inEscherichia colibloodisolates from humans, DenmarkThe number (n) in parentheses represents the number of isolatestested for susceptibility in 2009
Figure 37b. Resistance (%) to gentamicin, cefuroxime,mecillinam, ciprofloxacin, nalidixic acid and 3rd generationcephalosporins inEscherichia coliblood isolates fromhumans, Denmark.The number (n) in parentheses represents the number of isolatestested for susceptibility in 2009
DANMAP 2009504030201002000200120022003200420052006200720082009Ampicillin (n=43548)Nalidixic acid (n=26598)Sulfonamide (n=26015)Mecillinam (n=37927)Ciprofloxacin (n=36720)Cefuroxime (n=31295)
DANMAP 2009Denmark - Hospital urine isolates201816141210864202000200120022003200420052006200720082009
Denmark - Hospital urine isolates
% resistant isolates
% resistant isolates
Ciprofloxacin (n=36720)Mecillinam (n=37927)
Nalidixic acid (n=26598)Cefuroxime (n=31295)
Figure 38a. Resistance (%) to ampicillin, sulfonamides,ciprofloxacin, nalidixic acid, mecillinam and cefuroxime inEscherichia coliurine isolates from humans in hospitals,Denmark. The number (n) in parentheses represents thenumber of isolates tested for susceptibility in 2009.The number (n) in parentheses represents the number of isolatestested for susceptibility in 2009DANMAP 2009Denmark - Primary Health Care urine isolates50
The number (n) in parentheses represents the number of isolatestested for susceptibility in 2009DANMAP 2009Denmark - Primary Health Care urine isolates201816
Figure 38b. Resistance (%) to ciprofloxacin, nalidixicacid, mecillinam and cefuroxime inEscherichia coliurineisolates from humans in hospitals, Denmark. The number(n) in parentheses represents the number of isolates testedfor susceptibility in 2009.
% resistant isolates
% resistantisolates
4030201002000200120022003200420052006200720082009Ampicillin (n=30909)Nalidixic acid (n=17359)Sulfonamide (n=28536)Mecillinam (n=30865)Ciprofloxacin (n=26680)Cefuroxime (n=20121)
141210864202000200120022003200420052006200720082009
Ciprofloxacin (n=26680)Mecillinam (n=30865)
Nalidixic acid (n=17359)Cefuroxime (n=20121)
Figure 39a. Resistance (%) to ampicillin, sulfonamides,ciprofloxacin, nalidixic acid, mecillinam and cefuroximeinEscherichia coliurine isolates from humans inprimary health care, Denmark. The number (n) inparentheses represents the number of isolates testedfor susceptibility in 2009.The number (n) in parentheses represents the number ofisolates tested for susceptibility in 2009
Figure 39b. Resistance (%) to ciprofloxacin, nalidixic acid,mecillinam and cefuroxime inEscherichia coliurine isolatesfrom humans in primary health care, Denmark. The number(n) in parentheses represents the number of isolates testedfor susceptibility in 2009.The number (n) in parentheses represents the number ofisolates tested for susceptibility in 2009
DANMAP 2009
79
Klebsiella pneumoniaeKlebsiella pneumoniaeis part of the intestinal florain humans but is often the cause of extra-intestinalinfections such as urinary tract-, respiratory tract-,wound- and bloodstream infections. Many of theseinfections are hospital acquired and can be lifethreatening, especially if the strains are resistant toantimicrobial agents.K. pneumoniaeis intrinsicallyresistant to aminopenicillins (e.g. ampicillin). Therefore,infections caused byK. pneumoniaeare treatedwith broad spectrum antimicrobial agents suchas ciprofloxacin, gentamicin, cephalosporins andcarbapenems. Data on antimicrobial resistance inblood and urine isolates ofK. pneumoniaein hospitalswere obtained from 14 DCM (Table 24).
K. pneumoniaeblood isolates obtained fromhospitalized patients
The antimicrobial susceptibility of approximately 800K. pneumoniaeisolates from blood was reported in2009 (Table 24). Not all DCM tested for the sameantimicrobial agents. Until 2007, the occurrence ofantimicrobial resistance inK. pneumoniaewas lowand at the same level as in the other Nordic countries.However, since 2007 an increase in resistance hasbeen observed (Figure 40).The occurrence of 3rd generation cephalosporinresistance in Denmark (12%) (reported as ceftazidime,ceftriaxone, cefpodoxime or cefotaxime) (Table 24)
Table 24. Resistance (%) to ciprofloxacin, nalidixic acid,gentamicin, cefuroxime, 3rd generation cephalosporinsand meropenem inKlebsiella pneumoniaeisolatesfrom blood, DenmarkDANMAP 2009SubstanceGentamicinCiprofloxacinNalidixic acidCefuroxime3rd gen. cephalosporinsMeropenemMax. number of isolates tested2008a%7.616.122.215.29.60.27882009b%9.018.121.817.112.00886
a) All 14 DCM reported data on gentamicin resistance, 13 DCMreported ciprofloxacin and cefuroxime resistance, 11 DCM reported3rd gen. cephalosporin resistance, 10 DCM reported nalidixic acidresistance, and 9 DCM reported data on meropenem resistanceb) All 14 DCM reported data on ciprofloxacin and gentamicinresistance, 13 DCM reported cefuroxime resistance, 12 DCMreported 3rd gen. cephalosporin resistance, 10 DCM reportednalidixic acid resistance, and 9 DCM reported data on meropenemresistance
was above the level reported to EARSS by the otherNordic countries and corresponded to the occurrencereported by several other European countries in 2008[EARSS 2008]; also, the occurrence of 3rd generationresistance reported from the DCM corresponded tothe prevalence of ESBL in 89K. pneumoniaebloodisolates from hospitalized patients (15%), as observedin a nation-wide prevalence study of ESBL-producingbacteria performed in October 2009 (See FocusArea 1). Thus, the emergence of 3rd generationcephalosporin resistance amongK. pneumoniaeinDenmark is mostly due to ESBL-producing isolates.In a study on the spread of 3rd generationcephalosporin resistantK. pneumoniaeblood isolatesin Danish hospitals in 2008, clonal spread of primarilytwo clones of ESBL-producing isolates within hospitalsin the Zealand region was shown [Lesteret al.2010.ECCMID. Poster 1251].The occurrence of fluoroquinolone resistance(ciprofloxacin 18%, nalidixic acid 22%) was the sameas reported to EARSS by other European countries in2008 [EARSS 2008]. In the Eastern part of Denmark(Zealand and Funen), the occurrence of ciprofloxacinresistance (23%) was significantly higher than in thewestern part (Jutland) (9%).Aminoglycoside (gentamicin) resistance (9%) wasabove the level reported to EARSS by the other Nordiccountries and corresponded to the occurrence reportedby several other European countries in 2008 [EARSS2008].In 2009, carbapenem (meropenem) resistance wasabsent inK. pneumoniaeblood isolates, but the firsttwoK. pneumoniaeisolates producing carbapenemase(KPC-2) were obtained from colonized patients. Thesetwo patients had been travelling to Greece wherecarbapenem resistance is commonly seen [Hammerumet al.Int. J. Antimicrob.Agents. 2010. 35: 610-612].Multi-resistance in theK. pneumoniaeisolates wascompared among the eight DCM reporting data on 3rdgeneration cephalosporin, quinolone and gentamicinresistance from 2006–2009. The occurrence of multi-resistant isolates increased significantly from 1% in2006 to 8% in 2009 (Figure 40). The occurrence ofresistance differed among the different DCM, onelaboratory reported 16% of the isolates multi-resistant.The increased occurrence of resistance inK.pneumoniaeblood isolates corresponds to theincreased consumption of broad spectrum antimicrobialagents (e.g. ciprofloxacin, and 2nd and 3rd generationcephalosporins). The emergence of ESBL-producingbacteria has led to an increase in the consumption ofcarbapenems (Table 12, Figure 23).
8180An increase in the total number of isolates per yearcan also be observed. Among the same eight DCM, a24% increase in the number ofK. pneumoniaebloodisolates was seen (from 478 isolates in 2006 to 594isolates in 2009) (Figure 40).
DANMAP 2009cefpodoxime or cefotaxime) and corresponded tothe prevalence of ESBL in 675K. pneumoniaeurineisolates from hospitalized patients (11%) as observedin a nation-wide prevalence study of ESBL-producingbacteria performed in October 2009 (See Focus Area).In 2009, carbapenem (meropenem) resistance waspresent in theK. pneumoniaeurine isolates fromhospitalised patients. The carbapenem resistantisolates were not further investigated. The presence ofantimicrobial resistance in this species is not mandatoryreportable, and no calculation of the frequency ofoccurrence could be made since only one DCM reporteddata on all isolates.The occurrence of resistance to sulfonamide was 27%(min. 12%, max. 51%), and resistance to mecillinam was13% (min. 8%, max. 24%).
K. pneumoniaeurine isolates obtained fromhospitalized patients
The antimicrobial susceptibility of approximately 6000K. pneumoniaeisolates from hospitalized patients witha urinary tract infection was reported for the first timein 2009. Not all DCM tested for the same antimicrobialagents.Fluoroquinolone resistance was 22% for nalidixic acidand 17% for ciprofloxacin. However, in the Easternpart of Denmark (Zealand and Funen), the occurrenceof ciprofloxacin resistance (21%) was significantlyhigher than in the western part (Jutland) (10%).Fluoroquinolone resistance inK. pneumoniaefromurine from hospitalised patients corresponds to theoccurrence of resistance detected in isolates fromblood.The occurrence of 3rd generation cephalosporinresistance was 13% (reported as ceftazidime,
K. pneumoniaeurine isolates obtained fromprimary health care
The antimicrobial susceptibility of approximately 3000K. pneumoniaeisolates obtained from patients witha urinary tract infection from primary health care wasreported for the first time in 2009. Not all DCM tested forthe same antimicrobial agents.
25%
DANMAP 2009
20%
% resistant isolates
15%
10%
5%
0%2006 (n=478 )2007 (n=583 )2008 (n=548 )2009 (n=594 )3rd generation cephalosporins - RQuinolones - RGentamicin - R3rd generation cephalosporins, quinolones and gentamicin - R
Figure 40. Resistance (%) to 3rd generation cephalosporins, quinolones, gentamicin and multi-resistance (3rdgeneration cephalosporins, quinolones and gentamicin) inKlebsiella pneumoniaeblood isolates from humans2006-2009, DenmarkData were reported from 8 of 14 departments of clinical microbiology, covering 57.6% of the Danish population
DANMAP 2009Fluoroquinolone resistance was 20% for nalidixic acidand 13% for ciprofloxacin. However, in the Eastern partof Denmark (Zealand and Funen), the occurrence ofciprofloxacin resistance (16%) was significantly higherthan in the western part (Jutland) (8%). Ciprofloxacinresistance inK. pneumoniaefrom urine from generalpractice patients was significantly lower than theoccurrence of resistance detected in isolates from bothblood and urine from hospitalised patients.The occurrence of 3rd generation cephalosporinresistance was 8% (reported as cefpodoxime orcefotaxime) and corresponded to the prevalenceof ESBL in 385K. pneumoniaeurine isolates fromgeneral practice patients (7%) as observed in anation-wide prevalence study of ESBL-producingbacteria performed in October 2009 (See FocusArea). Resistance to 3rd generation cephalosporinsinK. pneumoniaefrom urine from general practicepatients was significantly lower than the occurrenceof resistance detected in isolates from both blood andurine from hospitalised patients.In 2009, carbapenem (meropenem) resistance wasobserved in oneK. pneumoniaeurine isolate fromprimary health care. The carbapenem resistantisolate was not further investigated. The presenceof antimicrobial resistance in this species is notmandatory reportable, and no calculation of thefrequency of occurrence could be made since the DCMreported data on selected isolates only.The occurrence of resistance to sulfonamide was 30%(min. 22%, max. 43%), and resistance to mecillinamwas 15% (min. 11%, max. 33%). Both resistance tosulfonamide and mecillinam was significantly higher inthe urine isolates from general practice patients thanthe urine isolates from hospitalised patients, probablyreflecting the usage of sulfonamide and mecillinamin the treatment of urinary tract infections in primaryhealth care.
81
Pseudomonas aeruginosaP. aeruginosais an opportunistic pathogen ofimmunocompromised individuals.P. aeruginosatypically infects the pulmonary tract, urinary tract, burns,wounds, and also causes other bloodstream infections.It is the most frequent colonizer of medical devices (e.g.catheters).P. aeruginosainfection is a serious problemin patients hospitalized with cancer, cystic fibrosis andburns. The case fatality rate in these patients is high.
P. aeruginosablood isolates obtained fromhospital patients
ForP. aeruginosa,this report includes data from14 Departments of Clinical Microbiology (DCM),representing 95% of the Danish population. Theantimicrobial susceptibility of approximately 440P.aeruginosaisolates from blood was reported in 2009.Not all DCM tested for the same antimicrobial agents(Table 25). The occurrence of resistance was low forall the tested antimicrobial agents and compared to theother countries reporting to the EARSS report amongthe lowest.
Table 25. Resistance (%) to ciprofloxacin, gentamicin, 3rd generation cephalosporin, carbapenem and piperacillin-tazobactam inPseudomonas aeruginosaisolates obtained from human blood, DenmarkDANMAP 2009CompoundCiprofloxacinGentamicinCeftazidimeMeropenemPiperacillin/ TazobactamMax. number of isolates tested2007%5.71.22.42.33.44172008%4.5<13.4<12.34262009%5.3<13.62.51.8440
8382
DANMAP 2009
StreptococcusStreptococci are part of the normal commensal flora ofthe mouth, skin, intestine, and upper respiratory tractof humans, but streptococci can also cause infectionssuch as otitis media, tonsillitis, bacterial pneumonia,bacteraemia / sepsis, endocarditis and menigitis.In this report, data on occurrence of resistancein invasive (from blood or cerebrospinal fluid)streptococcal isolates were obtained from the Neisseriaand Streptococcus Reference laboratory covering allthe DCMs in Denmark. In Denmark, penicillins andmacrolides are often used for treatment of infectionscaused by streptococci. All invasive non-duplicateStreptococcus pneumoniaeand group A, B, C and Gstreptococci were susceptibility tested to erythromycinand penicillin.
The percentage ofS. pneumoniaeinvasive isolatesbeing non-susceptible (resistant and intermediateresistant) to penicillin was 3.4% in 2006, 3.2% in 2007,3.0% in 2008 and 3.6% in 2009 (Figure 41). In 2009,27% (10 of 37 isolates) of the penicillin non-susceptibleisolates was serotype 19A and 16.2% (6 of 37) wasserotype 9V. In the previous years, serotype 19A waspresent in a lower percentage whereas serotype 9Vwas a dominant type in 2006 and 2007 (Table 26).The occurrence of resistance to erythromycin andpenicillin was similar to the occurrence in otherScandinavian countries but much lower than reportedin many of the other European countries reporting toEARSS [EARSS 2007, http://www.rivm.nl/earss/result/Monitoring_reports/].Using the new penicillin breakpoint (launched January2008 by CLSI) for susceptibility testing of isolates frompatients with invasive disease (except meningitis)treated with intravenous penicillin, three of the 1024tested isolates (0.3%) in 2009 were non-susceptibleintermediate resistant (2 μg/ml<MIC<8 μg/ml) and nonewere resistant (MIC ≥ 8 μg/ml).
Streptococcus pneumoniae
Streptococcus pneumoniaeis a leading cause ofbacterial pneumonia, otitis media, bacteraemiaand meningitis. In 2009, susceptibility testing wasperformed on 1024 non-duplicateS. pneumoniaeisolates from invasive infections.The occurrence of macrolide resistantS. pneumoniaedecreased significantly from 6.6% in 2008 to 3.6%in 2009 (Figure 41). Macrolide resistance inS.pneumoniaeisolates from blood and cerebrospinal fluidhas been around 6% from 2000 to 2008. The decreasein the number of erythromycin resistantS. pneumoniaemay be related to the introduction of the pneumococcalconjugated vaccine in the Danish childhood vaccinationprogram in October 2007, but this hypothesis needsto be further tested. In 2009, 35.1% (13 of 37 isolates)of the erythromycin resistant isolates was serotype14. This was also the dominant erythromycin resistantserotype in the previous years (Table 26).
Group A Streptococci
In 2009, 143 invasive GAS (Streptococcuspyogenes)isolates were susceptibility tested. As in previousyears, no resistance to penicillin in GAS isolates frominvasive infections was reported in 2009. Erythromycinresistance was detected in six isolates (4.5%) ascompared to two of 136 (1.5%) in 2008 and four of 107isolates (3.7%) in 2007.
Group B, C and G Streptococci
In 2009, 125 invasive group B streptococci(Streptococcusagalactiae)isolates from invasiveinfections were tested. Erythromycin resistance wasdetected in 16 isolates (12.8%) compared to 11.4% in2008 and 8.2% in 2007.Thirty-seven isolates of invasive group C streptococciwere tested in 2009. Three isolates (8.1%) wereresistant to erythromycin compared to 4% in 2008 and5% in 2007.Nine (4.8%) of the 188 invasive group G streptococciwere resistant to erythromycin compared to 10% in2008 and 8% in 2007.
DANMAP 2009765432109394959697989900010203040506070809
% resistant isolates
Penicillin (MIC >= 0.125 ug/ml)
Erythromycin (MIC > 2 ug/ml)
Figure 41. Resistance (%) to penicillin and macrolides inStreptococcus pneumoniaeblood and spinal fluid isolatesfrom humans, Denmark
As in previous years, no resistance to penicillin in groupB, C or G isolates from invasive infections was reportedin 2009.
DANMAP 2009
83
Table 26. Serotype distribution (%) of invasive penicillin non-susceptible and erythromycin resistant human isolatesofStreptococcus pneumoniae2006-2009, DenmarkDANMAP 2009SerotypeNSP%149V19F6B6A/6C19A11A33F23F15A35B7F18C9N4Otherserotypes*Number ofisolates12.5324.2483.13.115.631.36.33.112.59.43.14.2a
2006ERPb%68.86.34.28.34.2
Alltestedisolates%10.97.03.14.34.02.71.61.75.20.50.36.82.04.08.038.0884
NSP%16.736.111.18.35.68.3
a
2007ERPb%69.18.84.44.41.51.52.91.5
All testedisolates%13.07.74.03.43.53.21.91.45.70.2
PNSP%22.214.814.83.77.411.1
a
2008ERPb%60.33.24.81.64.84.84.81.61.6
All testedisolates%7.95.52.72.54.42.91.82.53.70.20.312.52.33.86.4
PNSP%8.116.22.75.427.02.72.75.45.42.78.1
a
2009ERPbAll testedisolates%35.18.15.45.45.410.85.48.18.1%3.12.71.92.14.04.52.42.31.70.90.113.01.63.9
5.62.81.5
3.73.77.4
1.61.61.63.2
0.69.02.73.18.2
5.48.1378.137
6.849.01024
5.636
4.468
32.41079
14.827
4.863
40.6937
*Serotypes with only one non-susceptible or resistant isolate per year and a maximum of two non-susceptible or resistant isolates 2006-2009a) PNSP: Penicillin non-susceptibleStreptococcus pneumoniaeb) ERP: Erythromycin resistantStreptococcus pneumoniae
8584
DANMAP 2009
EnterococciImportant clinical infections caused byEnterococcusspecies include urinary tract infections, bacteremia andbacterial endocarditis.E. faecalisandE. faeciumcancause life-threatening infections in humans, especiallyin the hospital environment. The naturally high levelof antimicrobial resistance found inE. faecalisandE.faeciummakes infections difficult to treat. Antimicrobialtherapy for serious enterococcal infections requiresthe use of synergistic combinations of a cell-wall-activeagents such as penicillin (ampicillin) or a glycopeptide(vancomycin), and an aminoglycoside (gentamicin).ForE. faecalisandE. faecium,this report includesdata from 14 Departments of Clinical Microbiology(DCM), representing 95% of the Danish population.
Enterococcus faeciumandEnterococcusfaecalisblood isolates obtained fromhospitalized patients
In 2009, a maximum of 432E. faeciumisolates and723E. faecalisisolates from blood were tested forantimicrobial susceptibility. Not all laboratories testedfor susceptibility to the same antimicrobial agents.From 2002 through 2009, data onE. faeciumandE. faecalisblood isolates covered 11 DCMs yearly.During these years, the number ofE. faecalisisolatesobtained from blood has increased from 405 isolatesin 2002 to 612 isolates in 2009 (a 51% increase),whereas the numbers ofE. faeciumisolates haveincreased from 137 in 2002 to 413 isolates in 2009(a 201% increase) (Figure 42a). In the period 2001-2009, most of theE. faeciumisolates were resistantto ampicillin (Figure 42b). From the 14 DCM reportingdata onE. faeciumin 2009, 87% of the testedE.faeciumisolates were ampicillin resistant, as in 2008.Treatment with fluoroquinolones, cephalosporins orcarbapenems has been described as a risk factor for
development of anE. faeciuminfection. An increasingconsumption of these antimicrobial agents has alsobeen observed in hospitals in Denmark during thepast years (Figure23). The antimicrobial pressurein a hospital environment might be a reason for theincreasing frequency ofE. faeciumas a cause ofbloodstream infections.Only one of the DCM (Aalborg Hospital) tested allenterococcal blood isolates for high-level gentamicinresistance (HLGR). Among the testedE. faecalisisolates in DCM Aalborg, 34% were HLGR, whereas56% of the testedE. faeciumisolates were HLGR in2009. The occurrence of HLGR was at the same levelas reported in 2008 and forE. faecaliswas similar tothe occurrence detected in many countries reporting toEARSS in 2008 (including the UK, Spain and Norway)[EARSS 2008].Vancomycin resistance was detected in 1.6% of theE. faecium(n=6) and less than 1% of theE. faecalis(n=1) isolates from bloodstream infections. Asdescribed above, most of theE. faeciumisolates frombloodstream infections were resistant to ampicillin. Thismay necessitate a change of treatment of enterococcalinfections from ampicillin to vancomycin, which in turnwill increase the risk of spread of vancomycin resistantenterococci in Danish hospitals. This might alreadyhave happened since the consumption of glycopeptidesin hospitals has increased from 0.28 DDD/100occupied bed-days in 1999 to 0.68 DDD/100 occupiedbed-days in 2008 and further to 0.93 DDD/100occupied bed-days in 2009.Since 2005, SSI has asked all the DCM to sendpresumeable vancomycin resistant enterococcalisolates from both invasive and non-invasive infectionsfor national surveillance on VRE. In 2009, 18vanA E.faecium,5vanB E. faeciumand 7vanB E. faecalisisolates were received.
DANMAP 2009
500400
B
DANMAP 200953545357
700
Number of isolates
6005004003002001000200220032004137175405458475
485
497414
564
612503369413
Number of isolates
A
300200355531361
352
363292
380
238
239
1000
4889140
183
208
2005
2006
2007
2008
2009
2002
2003
2004
2005
2006
2007
2008
2009
Figure 42a and 42b. Data on enterococcal blood culture isolates from 11 Danish Departments of Clinical Microbiology.(A) The number of enterococcal bacteraemias from 2002 through 2009. The white bars representE. faecalisand theblack bars representE. faecium.(B) The number of ampicillin resistant and sensitiveE. faeciumblood culture isolates.The black bars represent the ampicillin resistant isolates and the white bars represent the ampicillin sensitive isolates.
DANMAP 2009
85
Staphylococcus aureusStaphylococcus aureusis part of the normal flora fromskin and mucosa in approximately 50% of humans.Some people only carryS. aureusintermittentlywhereas others carryS. aureusfor longer time.However,S. aureusalso cause infections rangingfrom superficial skin infections i.e. impetigo and boils,to invasive infections such as post operative woundinfections, infections related to intravenous cathetersand prosthetic devices, arthritis, bacteraemia andendocarditis. Methicillin resistantS. aureus(MRSA)has been both laboratory and clinical reportable sinceNovember 2006. In recent yearsS. aureus,especiallyMRSA belonging to clonal complex 398 (CC398), hasattracted special attention as this type has been closelyconnected to livestock animals, especially pigs andhas affected people in direct contact with live pigs. Allisolates of this type, both human and veterinary withknown association to livestock has been resistantto tetracycline and the extensive consumption oftetracyclines in the pig production may serve as a
selective factor for this strain type. Other factors suchas increased tolerance to heavy metals among theCC398 isolates may also contribute to selection ofCC398 (See Textbox 5).
Surveillance of bacteraemia
In 2009, 1466S. aureusbacteraemia casescorresponding to 26.6 per 100,000 inhabitants werereported from all departments of clinical microbiology(DCM) in Denmark. Twenty-three (1.6%) of the caseswere caused by MRSA. This is very low comparedto most of the other countries participating in theEuropean Antimicrobial Resistance SurveillanceSystem (EARSS). Resistance amongS. aureusbacteraemia isolates from 2005 - 2009 is presented inTable 27. No significant changes have been observedduring this period. Ten (0.7%) of the bacteraemia casesbelonged to CC398, the strain type associated tolivestock. None of these were MRSA - any associationto pig farming is not known. The correspondingnumbers were six in 2008 and five in 2007.
Table 27. Occurrence of resistance (%) among isolates from Staphylococcus aureus bacteraemia cases in Denmark2005 - 2009DANMAP 2009SubstanceMethicillinPenicillinErythromycinClindamycinTetracyclineFusidic acidRifampicinNorfloxacinStreptomycinKanamycinMupirocinNumber of isolates2005%1.67854310<13<12014282006%1.48054310<12<11013292007%0.6784329<11<1<1<113452008%1.3775439<12<11<113442009%1.6757628<12<11<11466
8786
DANMAP 2009(60%) had infection compared to 447 (52%) in 2008.The proportion of bloodstream infections with MRSAwas 1.6% in 2009 (see surveillance ofS. aureusbacteraemia). The incidence rate of new MRSA casesper year for each DCM in the last three years is shownin Table 28 (Greater Copenhagen is served by threedepartments of clinical microbiology, and is shownas one). The incidence varied from 26.9 per 100,000inhabitants in the greater Copenhagen area to 6.2 per100,000 inhabitants in Esbjerg.
Surveillance of Methicillin ResistantS. aureus1
The total number of new MRSA cases was 808 in2009 (14.7 per 100,000 inhabitants) compared with851 in 2008. In Figure 43 the numbers of annual casesfrom 1994 - 2009 are shown with three years movingaverage. In 2009, two persons were found with twodifferent MRSA strains. At the time of diagnosis, 4861
Case = patient found positive for the first time with a specificMRSA strain - regardless whether the patient was infected orcolonized
DANMAP 2009
10009008007006005004003002001000
Number of cases
1994
1995
1996
1997
1998
1999
2000
2001
2002
2003
2004
2005
2006
2007
2008
YearNumber of casesMoving average (3 years)
Figure 43. MRSA cases in Denmark 1994 – 2009, with three years movingaverageTable 28. Incidence rate of new MRSA cases per 100,000 inhabitants per department of clinical microbiology2007 - 2009, DenmarkDANMAP 2009Department of clinical microbiologyGreater Copenhagen*HillerødStatens Serum Institut**SlagelseNæstvedOdenseSønderborgEsbjergVejleHerningÅrhusViborgAalborgDenmark total200717.711.73.915.38.87.18.114.523.42.510.18.28.212.1200823.621.817.619.312.112.911.18.820.07.76.018.510.715.5200926.916.517.615.18.88.912.86.211.67.310.19.17.614.7
* Rigshospitalet (national referral hospital), Hvidovre and Herlev** Isolates from Roskilde County
2009
DANMAP 2009
87
The total number of cases and the number of casespresenting with infection according to epidemiologicalclassification are shown in Table 29. Most of the cases(81%) were acquired in Denmark. The epidemiologicalclassification of MRSA infections 2006 – 2009 is shownin Figure 44. Infections classified as hospital acquired(HA) decreased from 47 cases in 2008 to 30 casesin 2009. Community-acquired infections (CA) are
increasing and constitute more than imported (IMP), HAand hospital associated, with community onset (HACO)infections, together (Figure 44). This indicates that theDanish guidelines for prevention of MRSA institutedin 2006 serves its purpose of minimizing health careassociated MRSA infections.
Table 29. Epidemiological classification of new MRSA cases 2009, with data from 2008 for comparisonEpidemiologic classificationExposureNo. ofcasesAcquired outside Denmark (IMP)Detected in Hospitals (HA)Hospital associated, communityonset (HACO)137141with health care riskwith known exposurewithout known exposureHealth care workerCommunity acquired (CA)without health care riskwith known exposurewithout known exposureUnclassifieda) Epidemiological classification missing for 5 cases1141797264161712451733 (19)197 (80)6 (35)9 (53)76 (78)5 (19)2008No. (%) of caseswith infections73 (53)47 (33)No. of casesa)156538125561849117631542009
DANMAP 2009
No. (%) of caseswith infections97 (62)30 (57)
12 (48)37 (66)5 (28)
37 (21)265 (84)3 (75)
DANMAP 2009
350300250
No. of infections
20015010050020062007Year20082009
IMPHAHACOCA
Figure 44. Number of MRSA cases presenting with infection according toepidemiological classification 2006 - 2009
8988
DANMAP 2009
Molecular typing of the MRSA strains
The number of isolates belonging to the 10 dominatingspatypes isolated in 2009 is shown in Table 30. Theyconstituted 55% of the total number of MRSA isolates.Sixspatypes constituted 51% of the 486 clinicalinfections with MRSA (out of 116 differentspatypesassociated with clinical infection). Most prevalentspatypes causing clinical infections were t008 (n=64), t002(n=54), t044 (n=49), t024 (n=37), t019 (n=29) and t032(n=14). Of the 216 strains isolated from asymptomaticcarriers, t002 was the most prevalentspatype (n=25),followed by t024 (n=20), t008 (n=19) and t034 (n=11).An increase inspatype t024 from 45 to 66 caseswas observed in 2009. Thisspatype has previouslycaused outbreaks in nursing homes in the GreaterCopenhagen area, but 24 (36%) of the cases in 2009were classified as community acquired with no knownexposure.spatypes t127 and t189, both involved inoutbreaks in neonatal wards in 2008, decreased from73 and 28 in 2008 to 13 and 9 in 2009, respectively.spatype t015, which was among the 10 most prevalentspatypes in 2008 (n=20), decreased to 10 in 2009.
In 2009, no targeted screening for CC398 types wasperformed and the number of CC398spatype t034decreased from 61 in 2008 to 27 in 2009. Thirteen ofthe 27 t034 cases represented infections(Table30).
Resistance among MRSA isolates
When comparing all MRSA in 2009 with all MRSAisolates in 2008, the occurrence of resistance toerythromycin, clindamycin and rifampicin increased,whereas the occurrence of fusidic acid andstreptomycin resistance decreased(Table31). Theresistance pattern varied considerably betweenspatypes (Table 31). In 2009, 100% of CC398spatype t034 isolates were resistant to tetracycline. Incontrast, the majority of t019, a primarily communityacquiredspatype, were susceptible to all testedantimicrobial agents except for beta-lactams. Eventhough differences in antimicrobial resistance weredemonstrated betweenspatypes, the success ofantimicrobial treatment cannot be predicted based onspatype or epidemiological classification.
Table 30. The 10 most prevalentspatypes demonstrated in MRSA cases, Denmark 2009spatypet008t002t024t044t019t034t032t223t005t127CC group a)CC8CC5CC8CC80CC30CC398CC22CC22CC22CC1No. of cases90876661432724161513
DANMAP 2009
No. causing infections (%)64 (71)54 (62)37 (56)49 (80)29 (67)13 (48)14 (58)5 (31)5 (33)7 (54)
a) CC = Clonal complexTable 31. Occurence of resistance (%) in the six most prevalentspatypes demonstrated in MRSA cases, Denmark2009, compared with all MRSA casesDANMAP 2009spatypeClonal complexErythromycinClindamycinTetracyclineFusidic acidRifampicinNorfloxacinStreptomycinKanamycinLinezolidMupirocinNumber of isolatest008CC8%661310130530590090t002CC5%38337220390250087t024CC8%898300211060066t044CC80%161656890361820061t019CC30%000200220043t034CC398%566710000193770027%46372316328133402808All cases
DANMAP 2009
89
Textbox 5Possible association between usage of zinc compounds in pig productionand emergence of methicillin resistantStaphylococcus aureusCC398 in pigsMethicillin resistantStaphylococcus aureus(MRSA) of clonal complex 398 (CC398) were first identified in 2003 in theNetherlands [Huijsdenset al.2006. Ann Clin Microbiol Antimicrob. 5: 26]. Since then, this clonal complex has beenfound associated with pigs and other food animal species and as a cause of colonization and infection in humans inseveral countries in the world. However, the origin of this clonal complex and the factors contributing to its successare yet to be explained.MRSA and methicillin susceptibleS. aureus(MSSA) strains isolated from pigs in Denmark were compared andcharacterized, to find possible factors that could have favoured the selection of MRSA CC398 in the Danish pig farms.A total of 31 MRSA and 60 MSSA isolated from pig farms in Denmark were submitted tospatyping and antimicrobialsusceptibility testing towards penicillin, tetracycline and erythromycin using broth microdilution for MIC determination.MRSA isolates were additionally subjected to SCCmec typing. In addition, all isolates were tested for susceptibilityto zinc chloride by agar dilution. All MRSA isolates belonged tospatypes previously assigned to CC398 (spa-typest011, t034, t108), and carried either SCCmec type V or IV in one isolate. The MSSA were more diverse and belongedtospatypes assigned to several clonal complexes (CC5, CC9, CC30, CC97 and CC398). Resistance to tetracyclinewas observed in all 31 MRSA and all (N=30) MSSA belonging to CC398 and 5 out of 30 non-CC398 MSSA. Penicillinand erythromycin resistance was observed among 100% and 42% of the MRSA and among 80% and 43% of theMSSA of this clonal complex, whereas lower prevalences of resistance were found in other CC-types. Resistanceto zinc (MIC 4-12mM) was observed in 74% (N=23/31) of MRSA CC398 whereas all MSSA were susceptible to zincchloride (MIC 0.5-2mM) (Table 32) [Aarestrupet al.,2010. Vet Microbiol.142: 455-7].It has previously been suggested that the use of antimicrobial agents and particularly tetracycline, might be relatedto the emergence of MRSA CC398 [de Neelinget al.2007. Vet Microbiol. 122: 366-72]. Our observations showedthat also the MSSA belonging to CC398 displayed tetracycline resistance, indicating that the association betweentetracycline resistance and CC398 is not exclusive of MRSA. Therefore, tetracycline might have selected for ST398 ingeneral, but cannot by itself explain why MRSA ST398 has been emerging among production animals.Interestingly, a very strong association between methicillin resistance and reduced susceptibility to zinc (p<0,001, OR40,388) was observed. Furthermore, we have identified a gene suspected to cause this resistance (czrC) which hasbeen cloned and found to increase the MIC of zinc chloride and cadmium acetate, but not of other metals such ascopper sulphate, silver nitrate or sodium arsenate. This gene was found among the zinc resistant MRSA from humansand animals in Denmark [Cavacoet al.,personal communication] and found located in a type V SCCmec cassette ina ST398 isolate from the Netherlands which was subjected to full genome sequencing (accession number AM990992)and also found in other SCCmec elements such as type VIII [Zhanget al.2009. Antimicrob. Agents Chemother. 53:531-540.] which explain the linkage between methicillin resistance and the metal resistance phenotype observed.Zinc compounds are used very frequently in feed for production animals (especially in pig production) as a feedadditive or for control of diarrhoea. Thus, our finding of a strong association between reduced zinc susceptibility andMRSA CC398 could indicate that the use of zinc has contributed to the emergence of MRSA CC398 and/or to itsfurther spread. Future studies on strains from diverse origins and data from experimental and epidemiological studieswill help to understand the selection and spread of CC398 and establish adequate control measures.Lina Cavaco, Henrik Hasman and Frank Møller AarestrupFor further information: Lina Cavaco ([email protected])
Table 32. Susceptibility to zinc chloride, penicillin, erythromycin and tetracycline among mecA positive andmecA negativeStaphylococcus aureusisolated from swine in DenmarkDANMAP 2009IsolatesmecApositivemecAnegativeClonal complexCC398AllCC5CC9CC30CC97CC398No. of isolates316021215130Number of isolates with resistance towards (%):Zinc chloride23 (74%)000000Penicillin31 (100%)36 (60%)07 (58%)4 (27%)1 (100%)24 (80%)Erythromycin13 (42%)15 (25%)01 (8%)1 (7%)013 (43%)Tetracycline31 (100%)35 (58%)03 (25%)2 (13%)030 (100%)
9190
DANMAP 2009
Textbox 6
Surveillance ofClostridium difficile027In 2009, the Danish National board of Health reinforced the submission ofClostridium difficileisolatesto Statens Serum Institut (SSI) for further typing in order to intensify the surveillance of the epidemichypervirulentC. difficilePCR ribotype 027 (CD027). In recent years this epidemic variant has been describedin North America and in Europe as the cause of outbreaks of increased severity and mortality, longerhospital stay and frequent relapses. CD027 are most often detected in patients who has been treated withantimicrobial agents such as clindamycin, cephalosporins, broad-spectrum penicillins and fluoroquinolones.The emergence of CD027 in Denmark might be related to the increased consumption of these antimicrobialagents.The criteria used for the selection of the referred isolates were: 1) moxifloxacin resistance, 2) cases withsevere clinical manifestations, or 3) cases suspected to be part of an outbreak.In 2009, SSI received 1847C. difficileisolates in total from 1225 different patients. Genotypic toxin profilingwas performed on all isolates, resulting in 728 (59%) different patients infected withC. difficilepossessing fulltoxin profile (i.e. genes for toxin A, toxin BTable 33. Geographical distribution ofClostridiumand binary toxin). Of these, 596 (82%) weredifficilePCR ribotype 027 (CD027), Denmarkidentified with the PCR ribotype 027 (TableDANMAP 200933). Strains harbouring only the genes forRegionntoxin A and toxin B - but not for binary toxinThe Capital Region of Denmark482- were 431 (35%), and 66 (5%) strains wereThe Sealand Region106non-toxigenic.Region of Southern Denmark4Preliminary results indicate that the 30-dayNorth Denmark Region1mortality of patients infected by strainsDenmark596with full toxin profile (i.e. genes for toxinA, toxin B and binary toxin) was higher -irrespective of the PCR ribotype - compared with patients infected by strains with genes for toxin A and toxinB only, underlining the importance of including other PCR ribotypes than 027 in the national surveillanceprogramme in future.Central Denmark Region3
Katharina E. P. OlsenFor further information: Katharina E. P. Olsen ([email protected])
DANMAP 2009
91
Textbox 7Methicillin resistantStaphylococcus aureus(MRSA) in Danish pigs at slaughter,and in Danish and imported retail meatBackground:Methicillin resistantStaphylococcus aureus(MRSA), especially belonging to the clonal complexCC398, has since 2003 emerged in livestock worldwide. MRSA was isolated in a Danish pig farm for thefirst time in 2006 and MRSA CC398 was retrospectively found in a Danish patient in 2003. The emergenceof MRSA in livestock is probably related to the use of antimicrobial agents most likely antibiotics such ascephalosporins, other beta-lactams and tetracycline, but other factors seem to be of importance as well(see textbox on usage of zinc compounds in the pig production). The aim of this study was to investigate theprevalence of MRSA in pigs at slaughter, and in Danish and imported retail meat.Materials and Methods:During 2009, nasal swab samples (n=789) were taken from pigs at theslaughterhouse before scalding and 865 meat samples (Danish pork (153), broiler meat (121), and beef (143)as well as imported pork (173), broiler meat (191), and beef (84)) were collected in retail stores and outlets.The samples were randomly selected and only one pig from each farm was included each month (maximumof three from the same farm). The meat samples were collected randomly in all regions of Denmark. MRSAwas isolated from one nasal swab or from 25 g of meat after selective enrichment in tryptone soya brothsupplemented with 4 mg/L cefoxitin and 75 mg/L aztreonam on brilliance MRSA agar. MRSA was confirmedby PCR and the isolates werespatyped by PCR followed by sequencing.Results:One hundred and one (13%) of the pigs at slaughter were positive for MRSA, representing 100farms. Among the 101 isolates, 81 isolates werespatyped. On the basis of thespatypes, 93% correspondedto CC398, 5 % corresponded to CC30 and one isolate corresponding to CC1 was found.From meat samples the highest prevalence of MRSA was found among imported broiler meat (18%), followedby imported pork (7.5%), Danish pork (4.6%) and Danish beef (1.4%). No MRSA was found among Danishbroiler meat or imported beef. Fifty-two isolates from meat werespatyped. From imported broiler meat 63%corresponded to CC398, 28% corresponded to CC9, one isolate corresponded to CC45 and one ofspatypet002 and t2576, respectively was found. From Danish beef, Danish pork and imported pork only CC398 wasfound.Discussion and conclusions:The prevalence of MRSA in pigs at slaughter was higher than what was foundin dust samples from production farms and breeding farms in 2008 in Denmark (3.5% and 0%, respectively)[http://www.efsa.europa.eu/en/scdocs/scdoc/1376.htm]. The most common type was CC398 as foundpreviously in a European study where the prevalence in production farms in Europe was 26.9% (varyingfrom 0% to 51.2%) CC398 counted for 92.5% of the CC types found [http://www.efsa.europa.eu/en/scdocs/scdoc/1376.htm]. In our study, MRSA withspatype corresponding to CC30 was detected for the first time inDanish pigs. In a previous study, CC30 was found to be the second most common type (26%) among MSSAfrom pigs in Denmark [Hasmanet al.2010. Vet Microbiol. 141:326-31] the finding of CC30 MRSA may bedue to horizontal gene transfer. CC1 has not previously been associated with MRSA in animals. The findingof CC398 in Danish beef (1 sample) is interesting as MRSA CC398 has not previously been reported fromDanish cattle and cattle farmers in Denmark. The relevance of these findings should be further investigated.Even though MRSA were present in Danish pigs at slaughter, the most important meat source seemed to beimported broiler meat.The finding of MRSA in imported broiler meat and also the high prevalence of ESBL (see focus area) may bedue to a high consumption of cephalosporins in the broiler production in other countries.In 2009, 39 persons were newly diagnosed with MRSA CC398 in Denmark. Since 2003, a total of 138 personshave been found positive with MRSA CC398. The far majority of humans found positive for CC398 have haddirect or indirect contact to pigs. There has been no sign of meat being a significant route for transmission ofMRSA CC398 to humans neither in Denmark nor in other countries.Yvonne Agersø, Karl Pedersen, Robert Skov, Frank M. Aarestrup and Henrik HasmanFor further information: Yvonne Agersø, E-mail: [email protected]
9392
DANMAP 2009
Resistance in diagnostic submissions from animalsThe DANMAP programme monitors antimicrobialresistance inEscherichia coliO149 andStaphylococcushyicusfrom diagnostic submissions from pigs, andE.coliF5 (K99) from diagnostic submissions from cattle.E.coliwas isolated from faecal samples, typically frompigs or calves with diarrhoea, whileS. hyicuswereisolated from pigs with dermatitis. In 2009,S.hyicuswere not reported because only 14 isolates wereavailable. Most isolates from diagnostic submissionsoriginate from animals in antimicrobial therapy, or witha history of recent antimicrobial therapy. For this reasona higher frequency of resistance is expected in bacteriafrom diagnostic submissions compared to bacteriaoriginating from healthy animals sampled at slaughter.In 2009, 49E. coli(O149) were isolated from pigs and48E. coliF5(K99) strains were isolated from cattle.Table 54 in Appendix 1 presents the distribution of MICsand occurrence of resistance inE.coliO149 andE. coliF5 (K99) from pigs and cattle, respectively.2000 level (Figure 45). A high level of resistanceto tetracycline, sulphonamide and streptomycincontinued in 2009, throughout the past decade. Thehigh tetracycline resistance is likely linked to the highconsumption of tetracyclines in weaning pigs; theisolates mostly originate from weaning pig diarrhoea.Sulfonamide and streptomycin resistance are notused for weaning pig diarrhoea, and the consumptionin weaning pigs has been stable at a low level (seefigure V10); however, the resistance to these agentsmay be co-selected with tetracycline resistance, andthus possibly related to the use of these agents insow herds. A large proportion (80%) of the tetracyclineresistant isolates were resistant to three or more of thetested antimicrobial agents, among which 24% of theisolates were AMP-SUL-STREP-TET, and additional27% were SUL-TET-STREP resistant.Ampicillin resistance was stable around 40% during2005–2007. The level of resistance to ampicillinseemed to reach a maximum in 2004 with 49% of theisolates being resistant. A maximum for consumptionof aminopenicillins in pigs also occurred in 2004, with adecrease in consumption from 2004 through 2008.The occurrence of ciprofloxacin resistance decreased(non-significant) to 6% in 2009, as part of a continuedsignificantly decreasing trend since 2007. Theoccurrence in 2009 was the lowest level since 2003–
Escherichiacoli from pigs
Figure 45 presents trends in resistance to selectedantimicrobial agents inE. coliO149 isolates frompigs from 1999 to 2009. The isolates are mainly fromweaning pigs with diarrhoea (>7.5 to 30 kg).In 2009, 67% of theE. coliO149 isolates wereresistant to tetracycline, corresponding to the 1999-
100
Cattle
Pigs
DANMAP 2009
80
% resistant isolates
60
40
20
0000102030405080900010203040506070809Tetracycline
Ampicillin
Gentamicin
Ciprofloxacin
Neomycin
Streptomycin
Sulfonamide
Figure 45. Trends in resistance to selected antimicrobial agents amongEscherichia colifrom diagnosticsubmissions from animals, Denmark
DANMAP 2009
93
2004 (29%) when the highest measured level wasreached; 2003 was the first year after the restriction offluoroquinolone use in production animals. In 2009, noresistance to ceftiofur was observed forE.coliO149
Escherichiacoli from cattleIn cattle,E.coliF5 (K99) were almost entirelyisolated from diagnostic submissions from calves.No isolates with gentamicin or apramycin resistancewhere observed in 2009, representing a significantdecrease from 11% in 2008 (Figure 45). A significantdecrease in occurrence of sulphonamide andstreptomycin resistance since 2004, continued in2009. A weak decreasing consumption in theseagents in calves was also observed 2005-2009(Figure 10; Table 35 in Appendix 1). However,as most of the isolates were also resistant totetracycline and/or other agents, the decrease may
also in part be due to reduced co-selection.In 2005, the most important antimicrobialgroup used in calves was tetracyclines, andduring 2006–2008, it has been the second mostused drug (Figure 10). The use of tetracycline,sulphonamides, streptomycin and aminopenicillinsin calves increased in 2009, after a decreasing trendduring 2005-2008. Resistance to three or moreantimicrobials was observed for 73% of the isolates,most frequently combinations of these agents (27%AMP-SUL-STREP-TET and further 29% resistantto three of these agents) often in combination withother types of resistance, and 6% being AMP-CIP-NAL-TET resistant.In 2009, noE. coliF5 (K99) isolates were resistantto ceftiofur, and 1 (2%) isolates were resistant tocefotaxime.
94
DANMAP 2009
APPENDIX 1APPENDIX 2APPENDIX 3
DANMAP 2009 - Appendix 1Table 34. Consumption of antimicrobials in pigs given as Animal Daily Doses (ADDs), DenmarkATCvet codeQA07AA10QJ01DC,QJ01DDQJ01CA,QJ01CRQA07AAQJ01MAQJ01CEQJ01RAQJ01AAQJ01BAQJ01FAQJ01FFQJ01E
95DANMAP 2009QJ01XXPleuromutilin's
Sulfonamides andtrimethoprim
Colistin (local GI)
Lincosamides /spectinomycin d)
Aminoglycosides(local GI)
Cephalosporin'sc)
Aminopenicillinsb)
Antimicrobialclass
Fluoroquinolones
Penicillin-streptomycincombinations
Tetracyclines
Amphenicols
Penicillin's,b-lactamasesensitive
Macrolides
200120022003200420052006200720082009200120022003200420052006200720082009200120022003200420052006200720082009
36,16331,47632,34939,19445,85856,16676,70183,71898,8669,2238,93611,49212,68914,07416,23119,32018,82420,0001,1378007689158741,168675398233
041121419648902561490030433533202016025742110
2,2492,5523,0154,1444,2584,0504,4724,1444,6184,1494,6305,2496,5027,4887,7027,9177,5448,195556444491557563510254147110
7,1588,30810,65413,89912,11510,0179,9149,73011,9021,5051,7561,9952,8352,6742,2752,1551,5471,6514242963052892763151019478
601472542632672914074003581636566062505453399799101111910
Weaner pigs (1000's ADD15)3,446 48,410 13,187 27,3243,987 44,195 16,575 23,7524,185 39,308 18,691 22,0325,516 49,768 21,189 21,2886,192 48,252 18,269 19,6334,698 46,666 15,881 19,4644,192 54,522 16,203 10,5864,559 51,676 16,5972,8574,668 59,205 17,8232,981Finisher pigs (1000's ADD50)17310,840 3,13126220611,027 3,69322017711,605 4,23319223711,599 4,44712424712,033 4,22323615910,316 3,52421317210,362 3,19410915210,006 2,637512011,823 2,73713Age group not given (1000's ADD50)2681,4715455842029293302092109513761491541,1254191701848413248517775527914484369186485623590843205562
753,1724,3774,5313,9944,2125,2996,7276,8621222822202720433002239293234273524
53118817851100012969642100089200300000
1,9332,1522,2113,0753,5883,5133,4393,4453,782296351423380368297226158129139829869856926810
15,23018,25519,77924,98426,74725,49622,65530,83439,2417,0477,5688,52210,37112,12110,8468,80612,99315,194806630676986729722395287187
155,766154,763156,984188,001189,272190,514208,481214,943250,45636,77338,51544,00849,31353,58251,67352,35453,98359,9486,0303,9754,0774,7314,0074,1872,1771,368958
Data includes sales from pharmacies and feed mills. Consumption in veterinary practice comprises less than 1% of the total consumption inpigs and are not included, except for the use of fluoroquinolonesa) Animal Standard weight is an assumed average weight at treatment, used to calculate numbe of ADD (Animal Daily Doses giving anestimated number of animals treated) from number of ADDkg (mass of animal treated, measured in kg animal bodyweight)b) Includes a small proportion (< 1‰) of combinations with aminopenicillin and clavulanic acidc) 3rd and 4th generation cephalosporinsd) Lincosamides and combnations between spectinomycin and lincosamides
Antimicrobial consumption in animals
Year200120022003200420052006200720082009
1,0461,0721,1041,1351,0921,2321,6971,6601,764
0089109101131
1,5741,7932,0392,2562,3442,3712,5892,6472,865
7198949931,0801,0591,0561,1841,1951,404
386099113132149244300219
Sows/piglets (1000's ADD200)8037634282919657645552521,1166905682341,2697195802151,3667245671671,4347805421521,568 1,3156151011,635 1,242558382,033 1,35553548
12635353535475785
935123347600
597643703669661647662631685
5334989531,0278459551,3001,8421,726
6,8867,5748,5679,1109,0069,36811,33811,81412,751
Total
96
DANMAP 2009 - Appendix 1
220200
DANMAP 2009
Antimicrobial growth promotersPrescribed veterinary antimicrobialsPrescribed human antibacterials
Antimicrobial(tonnes)
180160140120100806040200
Antimicrobial consumption in animals
Figure 46. Consumption of prescribed antimicrobials and growth promoters in animal production and prescribedantibacterials in humans, DenmarkSources: Human therapeutics: The Danish Medicines Agency. Veterinary consumption: 1990–2000, data based on reports from thepharmaceutical industry of total annual sales. (Data 1990–1994: Use of antibiotics in the pig production. Federation of Danish pigproducers and slaughterhouses. N. E. Rønn (Ed.). 1996–2000: Danish Medicines Agency and Danish Plant Directorate). 2001–2009:Data from VetStat.
1990
1991
1992
1993
1994
1995
1996
1997
1998
1999
2000
2001
2002
2003
2004
2005
2006
2007
2008
2009
DANMAP 2009 - Appendix 1
97
Table 35. Choice of antimicrobialsa) for systemic use in cattle given as Animal Daily Doses (ADDs), DenmarkDANMAP 2009ATCvet codeQA07AA10QJ01DC,QJ01DDQJ01CA,QJ01CRQA07AAQJ01MAFluoroquinolonesQJ01CEQJ01RAPenicillin-streptomycincombinations2222283436142136131113117QJ01AAQJ01BAQJ01FAQJ01FFQJ01ESulfonamides andtrimethoprim
Antimicrobialtherapeutic group
Aminopenicillins c)
Cephalosporin's d)
Colistin (local GI)
Lincosamides /spectinomycin e)
Aminoglycosides(local GI)
Tetracyclines
Amphenicols
Penicillin's,b-lactamasesensitive
Macrolides
20052006200720082009
574534561528556
616796129150
193145131105102
170180183168173
39781110
21100
2,0832,2422,2902,1112,167
Heifers and steer (1000's ADD300)b)20051805273381000267200619032633900003672007241633431020004862008261536439200049026153733610005882009b)Cows and bulls (1000's ADD600)200570451261200129200621113142431651029920071605132213210025720082013102000001020091003001000006a) Data includes sales from pharmacies and use for cattle in veterinary practice, including sales to the farmer. The consumption incalves is underestimated by up to 5% and consumption in cows is underestimated by up to 17% in individual years, because theuse in cattle practice was underestimated by up to 20%. This error was decreasing with time. Therefore, the numbers are not fullyrepresentative descriptive for trends over years, but reflects the choice of drug in individual years.b) Animal Standard weight is an assumed average weight at treatment, used to calculate numbe of ADD (Animal Daily Dosesgiving an estimated number of animals treated) from number of ADDkg (mass of animal treated, measured in kg animalbodyweight)c) Includes a small proportion (< 1‰) of combinations with aminopenicillin and clavulanic acidd) 3rd and 4th generation cephalosporinse) Lincomycin and lincomycin/spectinomycin combinations
Antimicrobial consumption in animals
Year20052006200720082009
186193235257279
11112
5857688084
490498610702804
Cows and bulls (1000's ADD600)b)7165112219646111629797391228575651173735312b)Calves (1000's ADD100)3316256219127301418791310837154881169230133804137722166768995
00000
00000
Total1,0271,0211,1891,3021,407
98
DANMAP 2009 - Appendix 1
Table 36. Consumption of antibacterial agents for systemic use in primary health care (No. packages/1000inhabitants/year), DenmarkDANMAP 2009ATC group a) Therapeutic group2000J01AAJ01CAJ01CEJ01CFJ01CRJ01DJ01EAJ01EBJ01EETetracyclinesPenicillins with extended spectrumBeta-lactamase sensitive penicillinsBeta-lactamase resistant penicillinsCombinations of penicillins, including beta-lactamase inhibitorsCephalosporins and related substancesTrimethoprim and derivativesShort-acting sulfonamidesCombinations of sulfonamides andtrimethoprim, including derivativesMacrolidesLincosamidesAminoglycosidesFluoroquinolonesGlycopeptidesPolymyxinsSteroid antibacterials (fusidic acid)Nitrofuran derivatives (nitrofurantoin)MethenamineLinezolidAntibacterial agents for systemic use (total)22.8200122.4200221.7200321.6200422.5200523.8200623.9200724.5200825.0200925.9
103.7 110.9 111.8 111.5 115.3 119.9 119.7 131.3 130.0 130.2243.7 251.0 254.4 254.5 253.7 251.1 243.3 253.0 235.9 223.224.01.11.07.947.81.40.40.19.70.12.80.910.43.50.030.11.21.38.247.81.40.50.110.60.12.10.810.43.20.037.51.71.48.847.61.30.60.211.00.12.00.811.13.20.041.92.01.39.347.91.00.60.113.80.12.00.711.32.60.043.02.51.410.248.30.00.70.116.20.12.10.611.72.40.044.43.01.610.647.50.01.10.118.30.22.00.712.32.30.044.04.01.710.745.80.01.40.119.40.21.50.712.52.00.045.85.81.811.541.00.01.60.122.90.20.80.711.91.90.045.48.02.112.436.00.02.00.125.10.20.80.812.22.00.045.212.32.110.934.60.099.62.50.125.00.20.90.712.61.90.0
Antimicrobial consumption in humans
J01FAJ01FFJ01GBJ01MAJ01XAJ01XBJ01XCJ01XEJ01XX05J01XX08J01
97.3 102.2 102.8
99.8 102.7 110.3 101.8 108.6 103.3
578.5 604.4 618.0 622.3 633.6 649.3 632.6 663.5 641.2 628.0
a) From the 2009 edition of the Anatomical Therapeutic Chemical (ATC) classification system
Table 37.Consumption of antibacterial agents for systemic use in primary health care (No. treated patients/1000inhabitants/year), DenmarkDANMAP 2009ATC group a)J01AAJ01CAJ01CEJ01CFJ01CRJ01DJ01EAJ01EBJ01EEJ01FAJ01FFJ01GBJ01MAJ01XAJ01XBJ01XCJ01XEJ01XX05J01XX08J01 b)Therapeutic group2000TetracyclinesPenicillins with extended spectrumBeta-lactamase sensitive penicillinsBeta-lactamase resistant penicillinsCombinations of penicillins, including beta-lactamase inhibitorsCephalosporins and related substancesTrimethoprim and derivativesShort-acting sulfonamidesCombinations of sulfonamides andtrimethoprim, including derivativesMacrolidesLincosamidesAminoglycosidesFluoroquinolonesGlycopeptidesPolymyxinsSteroid antibacterials (fusidic acid)Nitrofuran derivatives (nitrofurantoin)MethenamineLinezolidAntibacterial agents for systemic use (total)12.065.615.60.60.44.133.50.865.70.20.07.00.00.00.55.80.6-200111.869.419.20.70.44.233.20.867.70.20.07.50.00.00.55.70.5-200211.569.223.91.00.44.533.00.766.90.30.07.70.00.00.46.10.60.0200311.468.826.41.10.44.633.10.664.10.30.08.90.00.00.36.20.50.0200411.670.627.11.30.55.033.30.065.90.40.010.80.00.00.36.40.50.0200512.073.027.81.50.55.432.70.070.70.40.012.20.00.00.36.70.50.0200612.375.829.42.30.55.633.00.067.00.50.013.10.00.00.47.00.40.02007 2008 200912.582.129.73.60.55.929.70.071.40.60.015.20.00.00.36.50.40.012.781.329.95.00.55.926.30.066.90.80.017.10.00.00.36.80.40.013.081.129.98.00.55.825.40.064.51.00.016.90.00.00.37.00.40.0
168.9 173.3 173.4 172.6 171.2 170.2 171.3 177.1 164.4 158.8
292.0 300.6 301.5 301.4 302.6 308.0 310.3 320.4 308.2 303.1
a) From the 2009 edition of the Anatomical Therapeutic Chemical (ATC) classification systemb) Total no. of patients treated with an antibiotic is lower than the sum of all antibiotic classes. This is because the DanishMedicines Agency only counts the first treatment for each patient, each year
DANMAP 2009 - Appendix 1
99
Table 38. Consumption of antibacterial agents for systemic use in hospitals (DDD/1000 inhabitant-days),DenmarkDANMAP 2009ATC group a) Therapeutic group2000 2001 2002 2003 2004 2005 2006 2007 2008 2009J01AAJ01CAJ01CEJ01CFJ01CRJ01DBJ01DCJ01DDJ01DFJ01DHJ01EAJ01EBJ01EEJ01FAJ01FFJ01GBJ01MAJ01XAJ01XBJ01XCJ01XDJ01XEJ01XXJ01TetracyclinesPenicillins with extended spectrumBeta-lactamase sensitive penicillinsBeta-lactamase resistant penicillinsCombinations of penicillins, incl. beta-lactamaseinhibitorsFirst-generation cephalosporinsSecond-generation cephalosporinsThird-generation cephalosporinsMonobactamsCarbapenemsTrimethoprim and derivativesShort-acting sulfonamidesCombinations of sulfonamides and trimethoprim,incl. derivativesMacrolidesLincosamidesAminoglycosidesFluoroquinolonesGlycopeptidesPolymyxinsSteroid antibacterials (fusidic acid)Imidazol derivativesNitrofuran derivatives (nitrofurantoin)Other antibacterialsAntibacterial agents for systemic use (total)0.010.350.300.160.000.000.140.020.000.010.010.040.040.100.000.060.070.010.000.010.050.010.011.410.010.340.320.180.010.000.150.020.000.010.010.040.040.100.010.050.080.010.000.010.060.010.001.450.010.330.330.180.010.000.170.020.000.020.010.040.040.090.010.050.100.010.000.010.060.010.011.510.010.330.340.180.010.000.170.020.000.020.010.030.040.090.010.050.110.010.000.010.060.010.001.510.010.320.330.190.020.000.190.020.000.020.010.030.050.080.010.050.130.010.000.010.070.010.001.560.010.350.330.180.030.000.220.020.000.030.010.030.050.080.010.050.160.010.000.010.070.010.011.670.010.350.290.180.050.000.230.020.000.030.010.020.050.080.010.050.180.010.000.010.070.010.011.700.020.350.280.180.080.000.310.030.000.050.010.010.040.080.010.050.210.020.000.010.070.010.011.810.020.350.250.170.100.000.330.030.000.070.010.010.050.080.010.040.240.020.000.010.060.010.011.870.030.350.230.170.130.000.370.030.000.010.010.050.080.010.040.240.020.000.010.050.010.011.91
a) From the 2009 edition of the Anatomical Therapeutic Chemical (ATC) classification system
Antimicrobial consumption in humans
0.07
Salmonella100
Table 39. Distribution of MICs and occurrence of resistance inSalmonellaTyphimurium from pigs (n=372), DenmarkDANMAP 2009Distribution (%) of MICs0.015 0.03 0.06 0.125 0.25 0.52.70.33.86.50.540.336.61.61248163264128 256 512 1024 2048 >2048
Substance
90.190.694.4 3.50.893.82.21.391.7 5.4
51.9 8.90.3 42.2 47.3 1.91.1 79.6 12.9 2.237.1 19.6 2.7 0.339.5 55.6 4.89.4 0.548.99.42.20.3 0.3
50.5
0.80.3 3.82.4 71.5 13.244.6 9.4 1.6 2.7
0.3 2.2 10.59.9 31.70.3
25.3 68.899.50.5
5.6
0.371.5 26.1 2.2
%95%Resistant ConfidenceintervalTetracycline39.2 [34.3-44.4]Chloramphenicol8.3 [5.7-11.6]Florfenicol4.3 [2.5-6.9]Ampicillin40.6 [35.6-45.8]Ceftiofur0 [0-1.0]Cefotaxime0 [0-1.0]Sulfonamide50.5 [45.3-55.7]Trimethoprim9.4 [6.6-12.8]Apramycin2.2 [0.9-4.2]Gentamicin2.2 [0.9-4.2]Neomycin4.0 [2.3-6.6]Spectinomycin12.9 [9.7-16.7]Streptomycin46.0 [40.8-51.2]Ciprofloxacin0.3 [0.01-1.5]Nalidixic acid0.3 [0.01-1.5]Colistin0 [0-1.0]
DANMAP 2009 - Appendix 1
Vertical solid lines indicate EUCAST epidemiological cut-off values. Exceptions and further details can be found in appendix 2.White fields represent the range of dilutions tested. MIC values equal to or lower than the lowest concentration tested are presented as the lowestconcentration. MIC values greater than the highest concentration in the range are presented as one dilution step above the range.
DANMAP 2009 - Appendix 1
101
Table 40. Distribution of MICs and occurrence of resistance inSalmonellaEnteritidis from imported broiler meat(n=30), DenmarkDANMAP 2009Substance%Resistant0000000000006.746.746.7095%Confidenceinterval 0.015 0.03 0.06 0.125 0.25 0.5[0-11.6][0-11.6][0-11.6][0-11.6][0-11.6][0-11.6][0-11.6][0-11.6][0-11.6][0-11.6][0-11.6][0-11.6][0.8-22.1][28.3-65.7] 3.3 50.0[28.3-65.7][0-11.6]Distribution (%) of MICs1248163264 128 256 512 1024 >1024
TetracyclineChloramphenicolFlorfenicolAmpicillinCeftiofurCefotaximeSulfonamideTrimethoprimApramycinGentamicinNeomycinSpectinomycinStreptomycinCiprofloxacinNalidixic acidColistin
93.3 6.7
80.0 20.073.3 26.73.3 96.723.3 73.3 3.320.0 80.093.3 6.710010093.346.7 6.7
10093.3 6.7
56.7 43.3
13.3 13.3 20.073.3 26.7
6.746.7
Vertical solid lines indicate EUCAST epidemiological cut-off values. Exceptions and further details can be found in appendix 2.White fields represent the range of dilutions tested. MIC values equal to or lower than the lowest concentration tested are presentedas the lowest concentration. MIC values greater than the highest concentration in the range are presented as one dilution step abovethe range.
Salmonella
Salmonella102
Table 41. Distribution of MICs and occurrence of resistance inSalmonellaTyphimurium from imported turkey meat (n=21) and pork (Danish n=74; imported n=37),DenmarkDANMAP 2009Distribution (%) of MICs0.0159.544.643.21.41.41.42.719.09.524.31.419.0 71.44.1 39.224.3 29.70.030.060.1250.250.512481632641282565121024 2048 >204895%Confidenceinterval
Substance
Food type
Origin
%Resistant
Tetracycline
12.22.719.037.813.571.479.773.061.945.962.29.510.82.74.119.02.721.61.42.776.232.483.8
28.643.227.010098.691.91.48.1
4.836.58.171.456.873.0
19.031.18.1
1.4
81.048.675.71.419.050.024.328.68.15.4
71.490.594.6
90.595.989.295.291.997.34.88.12.710085.197.32.72.7
9.52.78.1
1.42.7
Turkey meat ImportedDanishPorkImportedChloramphenicol Turkey meat ImportedDanishPorkImportedTurkey meat ImportedFlorfenicolDanishPorkImportedTurkey meat ImportedAmpicillinDanishPorkImportedTurkey meat ImportedCeftiofurDanishPorkImportedTurkey meat ImportedCefotaximeDanishPorkImportedTurkey meat ImportedSulfonamideDanishPorkImportedTurkey meat ImportedTrimethoprimDanishPorkImportedTurkey meat ImportedApramycinDanishPorkImportedTurkey meat ImportedGentamicinDanishPorkImportedTurkey meat ImportedNeomycinDanishPorkImported12.2
90.543.254.119.013.524.319.05.424.376.232.483.800000081.048.675.728.68.15.4000000012.20
[69.6-98.8][31.8-55.3][36.9-70.5][5.4-41.9][6.7-23.5][11.8-41.2][5.4-41.9][1.5-13.3][11.8-41.2][52.8-91.8][22.0-44.3][68.0-93.8][0-16.1][0-4.9][0-9.5][0-16.1][0-4.9][0-9.5][58.1-94.6][36.9-60.6][58.8-88.2][11.3-52.2][3.0-16.8][0.7-18.2][0-16.1][0-4.9][0-9.5][0-16.1][0-4.9][0-9.5][0-16.1][5.7-21.8][0-9.5]
DANMAP 2009 - Appendix 1
Substance0.0150.030.060.1250.250.51248163264128256512
Food type
Origin
%Resistant
Distribution (%) of MICs1024 2048 >2048
95%Confidenceinterval1.4
DANMAP 2009 - Appendix 1
Spectinomycin
Streptomycin
66.7 9.523.863.5 18.91.4 14.954.1 18.927.028.6 14.314.342.945.9 5.45.4 12.2 31.127.0 16.2 10.8 16.2 10.8 18.99.531.18.12.72.761.9 38.178.4 21.651.4 27.010098.697.31.42.718.990.566.270.3
Ciprofloxacin
Nalidixic acid
21.6
Colistin
Turkey meat ImportedPorkDanishImportedTurkey meat ImportedPorkDanishImportedTurkey meat ImportedPorkDanishImportedTurkey meat ImportedPorkDanishImportedTurkey meat ImportedPorkDanishImported
23.816.227.057.148.656.80021.60021.6000
[8.2-47.2][8.7-26.6][13.8-44.1][34.0-78.2][36.9-60.6][39.5-72.9][0-16.1][0-4.9][9.8-38.2][0-16.1][0-4.9][9.8-38.2][0-16.1][0-4.9][0-9.5]
Vertical solid lines indicate EUCAST epidemiological cut-off values. Exceptions and further details can be found in appendix 2.White fields represent the range of dilutions tested. MIC values equal to or lower than the lowest concentration tested are presented as the lowest concentration.MIC values greater than the highest concentration in the range are presented as one dilution step above the range.
103
Salmonella
Salmonella104
Table 42. Distribution of MICs and occurrence of resistance amongSalmonellaEnteritidis from human cases, acquired domestically with (n=173)a) and without (n=55) b) outbreaks included, reported as associated with travel abroad (n=121) or with an unknown origin (n=58), DenmarkDANMAP 2009Distribution (%) of MICs1248163264 128 256 512 1024 >1024% Resistant[95% Confidence0.015 0.03 0.06 0.125 0.25 0.5interval]
Substance
Origin a) b)
Tetracycline9.91.70.81.70.61.70.61.814.01.70.8
Chloramphenicol
Florfenicol
32.427.315.720.71.23.61.71.7
Ampicillin
100.0100.090.196.6 1.767.672.783.577.60.6 97.796.42.5 94.20.0 98.323.1 0.623.6 1.820.727.6 1.7
Ceftiofur
82.183.675.263.8
75.772.765.369.017.916.424.036.2
Cefotaxime
99.4 0.6100.097.5 1.796.6 3.4
0.898.8 1.22.51.798.8 0.696.4 1.896.7 0.898.396.7 0.896.6 1.70.61.82.51.799.498.299.298.399.4 0.6100.00.61.80.81.7
Sulfonamide
Trimethoprim
Apramycin
DANMAP 2009 - Appendix 1
Gentamicin
Domestically acquired a)Domestically acquired b)Travel abroad reportedUnknown originDomestically acquired a)Domestically acquired b)Travel abroad reportedUnknown originDomestically acquired a)Domestically acquired b)Travel abroad reportedUnknown originDomestically acquired a)Domestically acquired b)Travel abroad reportedUnknown originDomestically acquired a)Domestically acquired b)Travel abroad reportedUnknown originDomestically acquired a)Domestically acquired b)Travel abroad reportedUnknown originDomestically acquired a)Domestically acquired b)Travel abroad reportedUnknown originDomestically acquired a)Domestically acquired b)Travel abroad reportedUnknown originDomestically acquired a)Domestically acquired b)Travel abroad reportedUnknown originDomestically acquired a)Domestically acquired b)
009.91.7000000000.61.814.01.7000.80000.80002.51.70.61.82.51.7000000
[0-2.1][0-6.5][5.2-16.7][0.04-9.2][0-2.1][0-6.5][0-3.0][0-6.2][0-2.1][0-6.5][0-3.0][0-6.2][0.01-3.2][0.05-9.9][8.4-21.5][0.04-9.2][0-2.1][0-6.5][0.02-4.5][0-6.2][0-2.1][0-6.5][0.02-4.5][0-6.2][0-2.1][0-6.5][0.5-7.1][0.04-9.2][0.01-3.2][0.05-9.7][0.5-7.1][0.04-9.2][0-2.1][0-6.5][0-3.0][0-6.2][0-2.1][0-6.5]
Substance% Resistant[95% Confidence0.015 0.03 0.06 0.125 0.25 0.5interval]10.8100100.010010042.8 55.5 1.743.6 50.9 3.066.1 33.156.9 43.10.8248163299.2100
Origin a) b)
Distribution (%) of MICs64 128 256 512 1024 >1024
DANMAP 2009 - Appendix 1
Neomycin
Spectinomycin
0.8
Streptomycin
Ciprofloxacin1.7
Travel abroad reportedUnknown originDomestically acquired a)Domestically acquired b)Travel abroad reportedUnknown originDomestically acquired a)Domestically acquired b)Travel abroad reportedUnknown originDomestically acquired a)Domestically acquired b)Travel abroad reportedUnknown originDomestically acquired a)Domestically acquired b)Travel abroad reportedUnknown origin41.030.930.632.855.558.248.8 2.550.0 1.73.510.95.0 12.4 0.88.6 5.2100100.099.2 1.0100.0
0.800000000.80000.803.510.918.215.5
[0-4.5][0-6.2][0-2.1][0-6.5][0-3.0][0-6.2][0-2.1][0-6.5][0.02-4.5][0-6.2][0-21][0-6.5][0.02-4.5][0-6.2][1,3-7,4][4.1-22.2][12,4-27,1][7,3-27,4]
Vertical solid lines indicate EUCAST epidemiological cut-off values and vertical dotted lines indicate EUCAST clinical breakpoints or if not present, CLSI clinical breakpoints.Exceptions and further details can be found in appendix 2.White fields represent the range of dilutions tested. MIC values equal to or lower than the lowest concentration tested are presented as the lowest concentration. MIC values greaterthan the highest concentration in the range are presented as one dilution step above the range.a) In 2009, 118 of the 173 domestically acquired isolates were part of outbreaks. These isolates were excluded from this category.b) The isolate was categorized as ‘domestically acquired’ if the patient did not travel one week prior to the infection, and it was characterized as ‘travel abroad reported’ if the patienttravelled one week prior to the infection. Isolates from patients which had not reported travel to the GP or was not interviewed by phone was characterized as ‘unknown origin’
105
Salmonella
Salmonella106
Table 43. Distribution of MICs and occurrence of resistance amongSalmonellaTyphimurium from human cases, acquired domestically with (n=560) a) andwithout (n=154) b) outbreaks included, reported as associated with travel abroad (n=58) or with an unknown origin (n=121), DenmarkDANMAP 2009Distribution (%) of MICs0.0151.30.20.030.060.125 0.25 0.5124816 3264128 256 512 1024 >1024% Resistant[95% Confidenceinterval]
Substance
Origin a) b)
Tetracycline
Chloramphenicol
Florfenicol
Ampicillin0.8
64.350.646.645.583.679.981.072.70.9
Ceftiofur0.8
Cefotaxime4.11.7
Sulfonamide
97.796.8100.093.4
2.12.6
80.472.770.775.2
81.658.453.452.918.926.629.323.1 0.80.20.60.8
88.972.762.164.51.33.93.40.88.25.85.28.37.19.715.513.20.5
1.6 8.05.8 21.41.7 5.2 31.09.1 26.428.2 0.5 0.4 2.7 2.733.81.9 9.734.55.2 5.2 5.241.3 0.84.1 7.44.3 1.4 0.9 0.7 0.93.9 1.3 3.2 2.6 3.25.2 5.2 3.47.4 2.5 6.6 0.8 1.70.2 10.031.831.033.10.20.6
Trimethoprim
Apramycin
93.0 0.590.9 1.393.192.6 0.8
0.20.698.298.198.396.797.9 1.397.4 0.698.395.0 2.50.40.81.6 0.51.3 0.61.73.3
83.2 1.367.565.556.2 2.56.37.16.90.8 5.8
15.532.534.541.3
DANMAP 2009 - Appendix 1
Gentamicin
Domestically acquired a)Domestically acquired b)Travel abroad reportedUnknown originDomestically acquired a)Domestically acquired b)Travel abroad reportedUnknown originDomestically acquired a)Domestically acquired b)Travel abroad reportedUnknown originDomestically acquired a)Domestically acquired b)Travel abroad reportedUnknown originDomestically acquired a)Domestically acquired b)Travel abroad reportedUnknown originDomestically acquired a)Domestically acquired b)Travel abroad reportedUnknown originDomestically acquired a)Domestically acquired b)Travel abroad reportedUnknown originDomestically acquired a)Domestically acquired b)Travel abroad reportedUnknown originDomestically acquired a)Domestically acquired b)Travel abroad reportedUnknown originDomestically acquired a)Domestically acquired b)Travel abroad reportedUnknown origin0.51.91.71.7
9.627.337.935.55.711.715.511.62.59.13.49.110.231.831.033.10.20.600.80.20.600.815.532.534.541.36.47.86.96.600000.51.91.71.7
[7.4-12.5][20.4-35][25.5-51.6][27-44.8][4.0-8.1][7.1-17.8][7.3-27.4][6.5-18.7][1.4-4.3][5.1-14.8][0.4-11.9][4.6-15.7][7.9-13.1][24.6-39.8][19.5-44.5][24.8-42.2][0-1.2][0.02-3.6][0-6.2][0.02-4.6][0-1.2][0.02-3.6][0-6.2][0-4.5][12.7-18.9][25.2-40.5][22.5-48.1][32.4-50.6][4.6-8.9][4.1-13.2][1.9-16.7][2.9-12.6][0-0.7][0.02-3.6][0-6.2][0-3.0][0.1-1.7][0.4-5.6][0-9.2][0.2-5.8]
Substance% Resistant[95% Confidenceinterval]0.01598.094.894.897.50.70.60.20.61.70.030.060.125 0.25 0.5124816 3264
Origin a) b)
Distribution (%) of MICs128 256 512 1024 >1024
DANMAP 2009 - Appendix 1
Neomycin
Spectinomycin
Streptomycin
Ciprofloxacin2.51.70.80.85.20.8
Nalidixic acid
25.732.534.519.895.590.982.886.899.3 0.598.1 1.398.3 1.7
71.160.451.770.2
1.83.2
0.4
0.93.26.94.1
0.20.6
79.867.567.262.0
0.20.63.41.78.24.55.22.50.8
89.683.175.978.52.34.5
1.13.93.42.53.9 0.5 0.23.2 1.3 0.63.4 3.45.0 0.81.6 1.6 6.45.8 4.5 13.08.6 10.3 8.69.1 7.4 18.2
5.511.013.814.0
Colistin
Domestically acquired a)Domestically acquired b)Travel abroad reportedUnknown originDomestically acquired a)Domestically acquired b)Travel abroad reportedUnknown originDomestically acquired a)Domestically acquired b)Travel abroad reportedUnknown originDomestically acquired a)Domestically acquired b)Travel abroad reportedUnknown originDomestically acquired a)Domestically acquired b)Travel abroad reportedUnknown originDomestically acquired a)Domestically acquired b)Travel abroad reportedUnknown origin0.83.25.26.95.80.20.60.40.61.70.80.93.28.66.6
1.34.55.22.56.313.017.214.912.027.927.635.51.43.913.87.40.93.28.66.60.20.600
[0.-2.7][1.8-9.1][1.1-14.4][0.5-7.1][4.5-8.7][8.1-19.3][8.6-29.4][9.1-22.5][9.5-15][21-35.7][16.7-40.9][27-44.8][0.7-2.9][1.4-8.3][6.1-25.4][3.5-13.7][0.3-2.2][1.1-7.4][2.9-19.0][2.9-12.6][0-1.2][0.02-3.6][0-6.2][0-3.0]
Vertical solid lines indicate EUCAST epidemiological cut-off values and vertical dotted lines indicate EUCAST clinical breakpoints or if not present, CLSI clinical breakpoints. Exceptionsand further details can be found in appendix 2.White fields represent the range of dilutions tested. MIC values equal to or lower than the lowest concentration tested are presented as the lowest concentration. MIC values greaterthan the highest concentration in the range are presented as one dilution step above the range.a) In 2009, 406 of the 560 domestically acquired isolates were part of outbreaks. These isolates were excluded from this categoryb) The isolate was categorized as ‘domestically acquired’ if the patient did not travel one week prior to the infection, and it was characterized as ‘travel abroad reported’ if the patienttravelled one week prior to the infection. Isolates from patients which had not reported travel to the GP or was not interviewed by phone was characterized as ‘unknown origin’
107
Salmonella
108
DANMAP 2009 - Appendix 1
Table 44. Distribution of MICs and occurrence of resistance inCampylobacter colifrom pigs (n=113),DenmarkDANMAP 2009Substance%Resistant95%ConfidenceintervalDistribution (%) of MICs0.060.1250.250.51248163264128>128
Tetracycline8.8[4.3-15.7]46.9 25.7 15.0 3.50.9 0.9 7.1Chloramphenicol0[0-3.2]14.2 50.4 30.1 5.3Erythromycin12.4[6.9-19.9]27.4 22.1 29.2 8.0 0.912.4Gentamicin0[0-3.2]15.0 44.2 38.1 2.7Streptomycin47.8[38.3-57.4]44.2 8.01.8 1.8 44.2Ciprofloxacin12.4[6.9-19.9]24.8 34.5 24.8 3.51.8 10.6Nalidixic acid12.4[6.9-19.9]1.8 12.4 46.9 19.5 7.1 0.9 11.5Vertical solid lines indicate EUCAST epidemiological cut-off values. Exceptions and further details can be found in appendix 2.White fields represent the range of dilutions tested. MIC values equal to or lower than the lowest concentration tested are presented asthe lowest concentration. MIC values greater than the highest concentration in the range are presented as one dilution step above therange.
Table 45. Distribution of MICs and occurrence of resistance inCampylobacter jejunifrom broilers (n=75) andcattle (n=87), DenmarkDANMAP 2009Substance
Campylobacter
AnimalspeciesBroilersCattleBroilersCattleBroilersCattleBroilersCattleBroilersCattleBroilersCattleBroilersCattle
%Resistant12.02.30000001.34.613.319.513.319.5
95%Confidenceinterval[5.6-21.6][0.3-8.1][0-4.8][0-4.2][0-4.8][0-4.2][0-4.8][0-4.2][0.03-7.2][1.3-11.4][6.6-23.2][11.8-29.4][6.6-23.2][11.8-29.4]
Distribution (%) of MICs0.06 0.125 0.25 0.5121.386.7 5.3 1.334.54.01.148163212.02.364 128 >128
TetracyclineChloramphenicolErythromycinGentamicinStreptomycinCiprofloxacinNalidixic acid
38.7 42.7 5.381.6 16.1
10.727.6
72.060.9
8.013.8
48.062.1
28.03.4
6.765.51.3 14.7 80.043.7 41.4 13.817.311.594.7 4.092.0 3.42.71.14.03.4
1.31.1 3.413.319.549.3 33.363.2 12.6 1.1
1.3 12.019.5
Vertical solid lines indicate EUCAST epidemiological cut-off values. Exceptions and further details can be found in appendix 2.White fields represent the range of dilutions tested. MIC values equal to or lower than the lowest concentration tested are presented asthe lowest concentration. MIC values greater than the highest concentration in the range are presented as one dilution step above therange.
DANMAP 2009 - Appendix 1
109
Table 46. Distribution of MICs and occurrence of resistance inCampylobacter jejunifrom broiler meat (Danishn=26; imported n=62), DenmarkDANMAP 2009SubstanceOrigin%Resistant3.851.600000000056.5056.595%Confidenceinterval[0.1-19.6][38.6-64.5][0-13.2][0-5.8][0-13.2][0-5.8][0-13.2][0-5.8][0-13.2][0-5.8][0-13.2][43.3-69.0][0-13.2][43.3-69.0]Distribution (%) of MICs0.060.1250.2584.638.70.511.51.613.2248163.850.09.73264>64
Tetracycline
DanishImportedChloramphenicol DanishImportedErythromycinDanishImportedGentamicinDanishImportedStreptomycinDanishImportedCiprofloxacinDanishImportedNalidixic acidDanishImported
30.835.5
15.48.1
57.722.6
4.81.676.9 19.2 3.833.9 46.8 9.738.5 46.2 15.417.7 50.0 32.361.5 7.751.6 12.910010026.96.56.556.511.5 46.2 42.33.2 25.8 12.9
1.6
1.6 54.8
Vertical solid lines indicate EUCAST epidemiological cut-off values. Exceptions and further details can be found in appendix 2.White fields represent the range of dilutions tested. MIC values equal to or lower than the lowest concentration tested are presented asthe lowest concentration. MIC values greater than the highest concentration in the range are presented as one dilution step above therange.
Table 47. Distribution of MICs and occurrence of resistance amongCampylobacter jejunifrom human casescategorized as acquired domestically (n=62) or reported as associated with travel abroad (n=31), DenmarkSubstanceOrigin%95%Confidenceinterval[4.7-21.9][21.8-57.8][0-5.8][0-11.2][0-5.8][0-11.2][0-5.8][0.1-16.7][0.04-8.7][0.8-21.4][14.2-36.7][42.2-78.2][14.2-36.7][42.2-78.2]37.1 33.912.9 19.44.83.23.2Distribution (%) of MICs0.03 0.06 0.125 0.25 0.51248163211.338.779.0 17.7 3.235.5 58.1 6.533.9 59.7 6.522.6 58.1 12.9 6.533.9 62.9 3.222.6 64.5 9.796.8 1.693.51.6 22.661.39.7 59.7 6.535.5 3.23.20.53.21.63.23.2
DANMAP 2009
64
>64
DomesticallyacquiredTravel abroadreportedDomesticallyChloramphenicolacquiredTravel abroadreportedDomesticallyErythromycinacquiredTravel abroadreportedDomesticallyGentamicinacquiredTravel abroadreportedDomesticallyStreptomycinacquiredTravel abroadreportedDomesticallyCiprofloxacinacquiredTravel abroadreportedDomesticallyNalidixic acidacquiredTravel abroadreportedTetracycline
11.338.7000003.21.66.524.261.324.261.3
67.7 16.1 4.845.2 9.76.5
24.258.1
Vertical solid lines indicate EUCAST epidemiological cut-off values and vertical dotted lines indicate EUCAST clinical breakpoints or if notpresent, CLSI clinical breakpoints. Exceptions and further details can be found in appendix 2.White fields represent the range of dilutions tested. MIC values equal to or lower than the lowest concentration tested are presented as thelowest concentration. MIC values greater than the highest concentration in the range are presented as one dilution step above the range.
Campylobacter
110
DANMAP 2009 - Appendix 1
10080
DANMAP 2009
12,00010,0008,0006,000
60402001994199519961997199819992000200120022003200420052006200720082009
4,0002,0000
Virginiamycin
Broilers - E. faecium
Figure 47. Trend in occurrence of resistance to streptogramins amongEnterococcus faeciumfrom broilersand the consumption of virginiamycin, Denmark, 1994-2009
100806040200
DANMAP 2009
30,000
Enterococci
20,00015,00010,0005,00001994199519961997199819992000200120022003200420052006200720082009
Avoparcin
Broilers - E. faecium
Broilers - E. faecalis
Figure 48. Trend in occurrence of resistance to avoparcin amongEnterococcus faeciumandEnterococcusfaecalisfrom broilers and the consumption of avoparcin, Denmark, 1994-2009
100806040200
DANMAP 2009
3,0002,5002,0001,5001,0005000
1994 1995 1996 1997 1998 1999 2000 2001 2002 2003 2004 2005 2006 2007 2008 2009
Avilamycin
Broilers - E. faecium
Broilers - E. faecalis
Figure 49. Trend in occurrence of resistance to avilamycin amongEnterococcus faeciumandEnteroccusfaecalisfrom broilers and the consumption of avilamycin, Denmark 1994-2009
Kg active compound
% resistant isolates
Kg active compound
% resistant isolates
25,000
Kg active compound
% resistant isolates
DANMAP 2009 - Appendix 1
111
100806040200
DANMAP 2009
12,00010,0008,0006,0004,0002,0000
1994199519961997199819992000200120022003200420052006200720082009
Virginiamycin
Pigs - E. faecium
Figure 50. Trend in occurrence of resistance to streptogramins amongEnterococcus faeciumfrompigs and the comsumption of virginiamycin, Denmark, 1994-2009
100806040200
30,00025,00020,00015,00010,0005,0000
1994199519961997199819992000200120022003200420052006200720082009
Avoparcin
Pigs - E. faecium
Pigs - E. faecalis
Figure 51. Trend in occurrence of resistance to avoparcin amongEnterococcus faeciumandEnterococcusfaecalisfrom pigs and the consumption of avoparcin, Denmark, 1994-2009
Kg active compound
% resistant isolates
Enterococci
DANMAP 2009
Kg active compound
% resistant isolates
Enterococci112
Table 48. Distribution of MICs and occurrence of resistance inEnterococcus faeciumfrom broilers (n=43) and pigs (n=151), DenmarkDistribution (%) of MICs0.01583.733.10.74.73.311.662.90.030.060.1250.250.51248163264128256
DANMAP 2009
Substance
Animalspecies
%Resistant
95%Confidenceinterval
512 1024 2048 4096 >4096
Tetracycline2.062.933.12.0
TigecyclineChloramphenicol
Penicillin
Ampicillin23.335.895.396.74.73.3
58.1 2.3 2.367.5 1.3 0.720.9 11.6 9.37.3 28.5 35.111.629.10.74.70.72.3
Erythromycin
2.034.915.279.135.830.2 18.6 25.69.3 2.0 30.5
37.228.518.613.27.034.42.322.5
Gentamicin
Kanamycin
32.6 41.9 23.317.9 40.4 9.395.351.083.7 16.388.7 6.64.07.02.32.37.09.94.723.3 32.6 25.6 11.68.66.60.70.71.31.3
2.07.918.5
Streptomycin
2.330.54.719.2
Vancomycin
BroilersPigsPigsBroilersPigsBroilersPigsBroilersPigsBroilersPigsBroilersPigsBroilersPigsBroilersPigsBroilersPigs
16.366.200014.035.814.029.823.335.8002.330.54.748.300.7
[6.8-30.7][58.1-73.7][0-2.4][0-8.2][0-2.4][5.3-27.9][28.1-44.0][5.3-27.9][22.6-37.8][11.8-38.6][28.1-44.0][0-8.2][0-2.4][0.06-12.3][23.2-38.5][0.6-15.8][40.1-56.6][0-8.2][0.02-3.6]
Quinupristin/dalfopristin
Broilers
7.0
[1.5-19.1]
Avilamycin
Salinomycin
Linezolid
PigsBroilersPigsBroilersPigsBroilersPigs
2.67.0062.8000
[0.7-6.6][1.5-19.1][0-2.4][46.7-77.0][0-2.4][0-8.2][0-2.4]
51.0 31.1 2.683.7 7.0 2.398.7 1.323.3 14.0 55.8 4.799.3 0.790.7 2.388.1 2.0
DANMAP 2009 - Appendix 1
Vertical solid lines indicate EUCAST epidemiological cut-off values. Exceptions and further details can be found in appendix 2.White fields represent the range of dilutions tested. MIC values equal to or lower than the lowest concentration tested are presented as the lowest concentration. MIC values greater than thehighest concentration in the range are presented as one dilution step above the range.
Table 49. Distribution of MICs and occurrence of resistance inEnterococcus faecalisfrom broilers (n=19) and pigs (n=133), DenmarkDistribution (%) of MICs0.0150.030.060.1250.250.51248163264128256
DANMAP 2009
Substance
DANMAP 2009 - Appendix 1
Animalspecies
%Resistant
95%Confidenceinterval
512 1024 2048 4096 >4096
Broilers52.6[28.9-75.6]47.426.3 26.3Pigs88.0[81.2-93.0]12.07.5 80.5TigecyclinePigs0[0-2.7]0.80.89.066.2 23.3Chloramphenicol Broilers0[0-17.6]100Pigs19.5[13.2-27.3]17.3 62.40.8 7.5 12.0PenicillinBroilers0[0-17.6]31.6 47.4 15.8 5.3Pigs0[0-2.7]14.3 84.2 1.5AmpicillinBroilers0[0-17.6]100Pigs0[0-2.7]100ErythromycinBroilers47.4[24.4-71.1]10.5 15.8 15.8 10.5 15.8 5.3 5.3 21.1Pigs48.9[40.1-57.7]35.3 12.8 3.048.9GentamicinBroilers0[0-17.6]94.7 5.3Pigs19.5[13.2-27.3]79.7 0.83.0 6.8 6.03.8KanamycinBroilers5.3[0.1-26.0]68.4 10.5 15.85.3Pigs30.8[23.1-39.4]69.20.8 30.1StreptomycinBroilers21.1[6.1-45.6]52.6 15.8 5.3 5.321.1Pigs37.6[29.3-46.4]14.3 48.10.81.5 35.3VancomycinBroilers0[0-17.6]42.1 57.9Pigs0[0-2.7]22.6 63.2 14.3AvilamycinBroilers0[0-17.6]100Pigs0[0-2.7]100SalinomycinBroilers10.5[1.3-33.1]42.1 47.4 10.5Pigs0[0-2.7]100LinezolidBroilers0[0-17.6]26.3 73.7Pigs0[0-2.7]30.1 69.9Vertical solid lines indicate EUCAST epidemiological cut-off values. Exceptions and further details can be found in appendix 2.White fields represent the range of dilutions tested. MIC values equal to or lower than the lowest concentration tested are presented as the lowest concentration. MIC values greater than thehighest concentration in the range are presented as one dilution step above the range.
Tetracycline
113
Enterococci
Enterococci114
Table 50 Distribution of MICs and occurrence of resistance inEnterococcus faeciumfrom broiler meat (Danish n=98; imported n=90), imported beef (n=15)and pork (Danish n=17; imported n=22), DenmarkDANMAP 2009%resistantDistribution (%) of MICs0.015 0.03 0.06 0.125 0.25 0.51.085.747.893.382.486.42.0 11.22.2 50.06.717.613.61248163264128 256 512 1024 2048 4096 >409695%Confidenceinterval
Substance
Food type
Origin
Tetracycline
Broiler meat
BeefPork1.03.36.74.53.17.85.95.91.02.2
Tigecycline
Broiler meat
BeefPork
Chloramphenicol
Broiler meat
1.0 77.654.46.7 73.317.6 70.681.8
20.442.213.311.813.6
BeefPork
Penicillin
Broiler meat
BeefPork
69.473.373.347.168.26.17.8
Ampicillin
Broiler meat
BeefPork9.27.823.54.5
Erythromycin
Broiler meat
BeefPork
Gentamicin
Broiler meat
14.314.420.05.94.5
1.0 25.516.726.741.24.5 27.369.4 18.424.4 30.060.0 33.323.5 58.845.5 36.493.9 5.162.2 13.393.388.2 5.986.4 4.518.4 41.88.9 7.833.3 33.311.8 23.540.9 18.24.1 1.0 1.014.4 7.8 15.66.75.9 5.9 5.94.5 4.5 4.5 4.51.08.9 1.1 2.2 12.26.75.94.54.57.1 1.0 2.0 6.15.6 3.3 1.1 51.16.76.717.6 5.911.822.79.199.0 1.010010010095.5 4.5
BeefPork
Kanamycin
Broiler meat
BeefPork
Streptomycin
Broiler meat
34.745.646.723.527.3
DANMAP 2009 - Appendix 1
BeefPork
14.3 4.123.3 7.813.3 6.723.522.71.02.2 6.75.9
DanishImportedImportedDanishImportedDanishImportedImportedDanishImportedDanishImportedImportedDanishImportedDanishImportedImportedDanishImportedDanishImportedImportedDanishImportedDanishImportedImportedDanishImportedDanishImportedImportedDanishImportedDanishImportedImportedDanishImportedDanishImportedImportedDanishImported46.910.026.741.240.998.0 1.064.4 1.193.388.290.9
14.352.26.717.613.600000000002.023.36.75.99.11.024.46.75.99.116.361.113.335.331.800000013.36.711.89.11.034.46.711.89.1
[8.0-22.8][41.4-62.9][0.2-31.9][3.8-43.4][2.9-34.9][0-3.7][0-4.0][0-21.8][0-19.5][0-15.4][0-3.7][0-4.0][0-21.8][0-19.5][0-15.4][0.2-7.2][15.1-33.4][0.2-31.9][0.1-28.7][1.1-29.2][0.03-5.6][16.0-34.6][0.2-31.9][0.1-28.7][1.1-29.2][9.6-25.2][50.3-71.2][1.7-40.5][14.2-61.7][13.9-54.9][0-3.7][0-4.0][0-21.8][0-19.5][0-15.4][0-3.7][7.1-22.1][0.2-31.9][1.5-36.4][1.1-29.2][0.03-5.6][24.7-45.2][0.2-31.9][1.5-36.4][1.1-29.2]
1.1 12.26.75.9 5.99.18.9 16.76.75.94.5 4.5
Substance0.015 0.03 0.06 0.125 0.25 0.550.075.673.394.11001.143.9 6.113.3 10.020.0 6.75.91248163264
Food type
Origin
%resistantDistribution (%) of MICs
95%Confidenceinterval
128 256 512 1024 2048 4096 >4096
DANMAP 2009 - Appendix 1
Vancomycin
Broiler meat
BeefPork
DanishImportedImportedDanishImported
01.1000
[0-3.7][0.03-6.0][0-21.8][0-19.5][0-15.4]
Quinupristin/dalfopristin
Danish3.1[0.6-8.7]1.0 50.0 6.1 34.7 5.1 2.0 1.0Imported7.8[3.2-15.4]23.3 12.2 36.7 20.0 6.7 1.1BeefImported0[0-21.8]46.7 13.3 40.0PorkDanish5.9[0.1-28.7]29.458.8 5.9 5.9Imported4.5[0.1-22.8]22.7 4.5 63.6 4.5 4.5AvilamycinBroiler meat Danish1.0[0.03-5.6]95.9 1.0 2.0 1.0Imported3.3[0.7-9.4]93.3 2.2 1.1 2.2 1.1BeefImported0[0-21.8]93.36.7PorkDanish0[0-19.5]94.1 5.9Imported4.5[0.1-22.8]95.54.5SalinomycinBroiler meat Danish37.8[28.2-48.1]14.3 48.0 37.8Imported14.4[7.9-23.4]26.7 58.9 14.4BeefImported0[0-21.8]100PorkDanish0[0-19.5]100Imported4.5[0.1-22.8]95.54.5LinezolidBroiler meat Danish0[0-3.7]2.0 93.9 4.1Imported0[0-4.0]12.2 84.4 3.3BeefImported0[0-21.8]100PorkDanish0[0-19.5]100Imported0[0-15.4]9.1 86.4 4.5Vertical solid lines indicate EUCAST epidemiological cut-off values. Exceptions and further details can be found in appendix 2.White fields represent the range of dilutions tested. MIC values equal to or lower than the lowest concentration tested are presented as the lowest concentration. MIC values greater thanthe highest concentration in the range are presented as one dilution step above the range.
Broiler meat
115
Enterococci
Enterococci116
Table 51. Distribution of MICs and occurrence of resistance inEnterococcus faecalisfrom broiler meat (Danish n=39; imported n=88), beef (Danish n=28;imported n=33) and pork (Danish n=96; imported n=109), DenmarkDANMAP 2009%Resistant0.015 0.03 0.06 0.125 0.25 0.55.11.13.01.00.9124816326495%ConfidenceintervalDistribution (%) of MICs128 256 512 1024 2048 4096 >4096
Substance
Food type
Origin
Tetracycline
Broiler meat
Beef
Pork
Tigecycline
Broiler meat
69.240.982.181.879.250.5
7.7 17.920.5 37.517.915.21.0 18.85.5 43.1
Beef1.0
Pork
Chloramphenicol Broiler meat
17.9 74.4 7.71.1 26.1 59.1 13.63.6 42.9 53.636.4 60.6 3.01.0 29.2 65.6 3.13.7 26.6 58.7 11.02.69.13.65.20.9
Beef
Pork1.11.01.8
Penicillin
Broiler meat
82.173.9 1.164.372.783.365.1
Beef
Pork
Ampicillin
Broiler meat
Beef
15.415.932.127.311.533.974.468.260.754.570.845.92.61.17.1
Pork
Erythromycin
Broiler meat
Beef
1.1
2.65.72.1
Pork
Gentamicin
Broiler meat
41.034.157.136.440.645.0
20.511.428.645.527.139.4
25.630.739.345.528.152.397.498.992.910099.0 1.095.4 4.612.84.57.115.219.86.4 0.9
23.11.1 42.07.13.010.48.31.11.00.92.32.10.9
Beef
DANMAP 2009 - Appendix 1
Pork
DanishImportedDanishImportedDanishImportedDanishImportedDanishImportedDanishImportedDanishImportedDanishImportedDanishImportedDanishImportedDanishImportedDanishImportedDanishImportedDanishImportedDanishImportedDanishImportedDanishImportedDanishImportedDanishImportedDanishImportedDanishImported10095.5 1.110097.0 3.095.8 1.098.2
25.658.017.915.219.848.60000002.69.13.605.20.900000000000025.650.07.13.012.58.303.4003.11.8
[13.0-42.1][47.0-68.4][6.1-36.9][5.1-31.9][12.4-29.2][38.9-58.4][0-9.0][0-4.1][0-12.3][0-10.6][0-3.8][0-3.3][0.06-13.5][4.0-17.1][0.09-18.3][0-10.6][1.7-11.7][0.02-5.0][0-9.0][0-4.1][0-12.3][0-10.6][0-3.8][0-3.3][0-9.0][0-4.1][0-12.3][0-10.6][0-3.8][0-3.3][13.0-42.1][39.1-60.9][0.9-23.5][0.08-15.8][6.6-20.8][3.8-15.1][0-9.0][0.7-9.6][0-12.3][0-10.6][0.6-8.9][0.2-6.5]
Substance0.015 0.03 0.06 0.125 0.25 0.51.11.00.91248163264
Food type
Origin
%Resistant
95%Confidenceinterval
Distribution (%) of MICs128 256 512 1024 2048 4096 >4096
Kanamycin
Broiler meat
Beef
2.620.57.1
DANMAP 2009 - Appendix 1
Pork
Streptomycin
Broiler meat
Beef
Pork10.318.2
Vancomycin
Broiler meat
15.417.042.945.549.059.66.11.00.9
97.478.492.910094.893.671.854.550.045.545.835.8
4.25.512.81.1 27.37.13.04.20.9 2.8
Beef
Pork
Avilamycin
Broiler meat
28.221.632.124.240.631.2
61.560.267.975.854.262.4
Beef
Pork
Salinomycin
Broiler meat
Beef
Pork
Linezolid
Broiler meat
Beef
Pork
DanishImportedDanishImportedDanishImportedDanishImportedDanishImportedDanishImportedDanishImportedDanishImportedDanishImportedDanishImportedDanishImportedDanishImportedDanishImportedDanishImportedDanishImportedDanishImportedDanishImportedDanishImported17.927.314.318.23.117.45.26.410097.7 2.310010010010082.1 17.992.0 8.010010010010079.5 2.670.5 2.382.1 3.681.896.981.7 0.9
2.620.57.104.25.512.828.47.13.04.23.7000000000000000000000000
[0.06-13.5][12.6-30.4][0.9-23.5][0-10.6][1.1-10.3][2.0-11.6][4.3-27.4][19.3-39.0][0.9-23.5][0.08-15.8][1.1-10.3][1.0-9.1][0-9.0][0-4.1][0-12.3][0-10.6][0-3.8][0-3.3][0-9.0][0-4.1][0-12.3][0-10.6][0-3.8][0-3.3][0-9.0][0-4.1][0-12.3][0-10.6][0-3.8][0-3.3][0-9.0][0-4.1][0-12.3][0-10.6][0-3.8][0-3.3]
Vertical solid lines indicate EUCAST epidemiological cut-off values. Exceptions and further details can be found in appendix 2.White fields represent the range of dilutions tested. MIC values equal to or lower than the lowest concentration tested are presented as the lowest concentration. MIC values greater than thehighest concentration in the range are presented as one dilution step above the range.
117
Enterococci
IndicatorEscherichia coli118
Table 52. Distribution of MICs and occurrence of resistance inEscherichia colifrom broilers (n=152), cattle (n=94) and pigs (n=150), DenmarkDANMAP 2009Distribution (%) of MICs0.015 0.03 0.06 0.125 0.25 0.50.71.32.6 9.21.1 1.11.3 32.71248163264 128 256 512 1024 2048 >204895%Confidenceinterval
Substance
Animal species
% Resistant
Tetracycline
Chloramphenicol
Florfenicol
Ampicillin
14.92.063.840.452.765.843.653.327.661.738.025.756.440.0 0.721.750.0 3.241.3 2.70.78.56.00.71.12.0 0.7 2.00.71.10.70.7 17.82.126.0
Ceftiofur
11.22.16.096.1 2.610099.3 0.796.798.999.33.31.10.7
87.583.062.79.92.12.011.82.12.042.125.524.01.3
Cefotaxime
Sulfonamide
0.7
13.83.233.394.110081.30.70.7
Trimethoprim
85.596.866.74.618.768.4 31.692.6 5.3 2.180.7 17.3 2.0
Apramycin
DANMAP 2009 - Appendix 1
Gentamicin
BroilersCattlePigsBroilersCattlePigsBroilersCattlePigsBroilersCattlePigsBroilersCattlePigsBroilersCattlePigsBroilersCattlePigsBroilersCattlePigsBroilersCattlePigsBroilersCattlePigs71.7 27.6 0.788.3 8.5 3.284.0 14.7 1.3
12.52.135.30.71.14.70.71.10.718.42.126.01.30000013.83.233.35.9018.7000000
[7.7-18.8][0.3-7.5][27.7-43.5][0.02-3.6][0.03-5.8][1.9-9.4][0.02-3.6][0.03-5.8][0.02-3.7][12.6-25.5][0.3-7.5][19.2-33.8][0.2-4.7][0-3.8][0-2.4][0-2.4][0-3.8][0-2.4][8.8-20.3][0.7-9.0][25.9-41.5][2.7-10.9][0-3.8][12.8-25.8][0-2.4][0-3.8][0-2.4][0-2.4][0-3.8][0-2.4]
Substance0.015 0.03 0.06 0.125 0.25 0.599.3 0.795.7 3.289.3 4.01.10.712481632
Animal species
% Resistant
Distribution (%) of MICs64 128 256 512 1024 2048 >2048
DANMAP 2009 - Appendix 1
95%Confidenceinterval
Neomycin
Spectinomycin
Streptomycin
0.775.093.659.384.9 5.994.7 2.152.7 4.7
2.721.15.311.32.01.15.3
2.71.3 1.3 1.31.14.7 4.7 12.7 7.33.3 2.0 2.02.116.0 9.3 12.0
Ciprofloxacin0.788.8 0.795.7 4.397.3 1.398.0 2.0100100
77.071.376.0
11.228.723.3
3.9
7.2
0.7
Nalidixic acid
1.30.7
3.9 5.30.7
Colistin
BroilersCattlePigsBroilersCattlePigsBroilersCattlePigsBroilersCattlePigsBroilersCattlePigsBroilersCattlePigs
006.02.6024.79.23.242.711.800.710.500.7000
[0-2.4][0-3.8][2.8-11.1][0.7-6.6][0-3.8][18.0-32.4][5.1-15.0][0.7-9.0][34.6-51.0][7.2-18.1][0-3.8][0.02-3.7][6.1-16.5][0-3.8][0.02-3.7][0-2.4][0-3.8][0-2.4]
Vertical solid lines indicate EUCAST epidemiological cut-off values. Exceptions and further details can be found in appendix 2.White fields represent the range of dilutions tested. MIC values equal to or lower than the lowest concentration tested are presented as the lowest concentration. MIC values greater than thehighest concentration in the range are presented as one dilution step above the range.
119
IndicatorEscherichia coli
IndicatorEscherichia coli120
Table 53. Distribution of MICs and occurrence of resistance inEscherichia colifrom broiler meat (Danish n=143; imported n=221), beef (Danish n=32; importedn=39) and pork (Danish n=106; imported n=65), DenmarkDANMAP 200995%Confidenceinterval0.015 0.03 0.06 0.125 0.25 0.51248163264128 256 512 1024 2048 >2048Distribution (%) of MICs
Substance
Food type
Origin
%Resistant
Tetracycline
Broiler meat
Beef1.51.80.93.11.53.10.57.24.10.79.5
Pork
Chloramphenicol Broiler meat
Beef
79.741.281.384.663.250.82.10.9
0.7 10.51.8 52.93.15.11.9 30.21.5 44.6
Pork
Florfenicol
Broiler meat
Beef
6.63.11.41.810.43.12.60.91.5 1.53.15.11.94.61.8
Pork
Ampicillin
Broiler meat
Beef
56.649.881.384.658.549.255.251.675.082.154.743.12.12.719.654.85.10.9 28.33.1 24.61.40.9
Pork
Ceftiofur
Broiler meat
9.14.115.610.34.71.540.626.718.815.434.040.043.435.721.915.437.750.839.928.578.171.842.529.2
Beef
Pork
Cefotaxime
Broiler meat
6.63.14.9 33.614.018.82.6 15.42.8 23.638.598.6 1.494.6 1.80.510097.4 2.699.198.5 1.50.50.53.20.9
Beef
2.12.33.11.91.5
Pork
Sulfonamide
Broiler meat
97.993.796.910097.298.5
Beef
Pork
Trimethoprim
Broiler meat
Beef
92.346.296.994.962.366.23.538.096.561.1 0.910094.973.6 0.969.25.125.530.8
7.753.83.15.137.733.8
DANMAP 2009 - Appendix 1
Pork
DanishImportedDanishImportedDanishImportedDanishImportedDanishImportedDanishImportedDanishImportedDanishImportedDanishImportedDanishImportedDanishImportedDanishImportedDanishImportedDanishImportedDanishImportedDanishImportedDanishImportedDanishImportedDanishImportedDanishImportedDanishImportedDanishImportedDanishImportedDanishImported
11.254.83.15.132.147.70.720.8000.97.700.50001.519.654.83.15.129.227.703.6000.9004.1000.907.753.83.15.137.733.83.538.005.125.530.8
[6.5-17.5][47.9-61.4][0.08-16.2][0.6-17.3][23.3-41.8][35.1-60.5][0.02-3.8][15.7-26.8][0-10.9][0-9.0][0.02-5.1][2.5-17.0][0-2.5][0.01-2.5][0-10.9][0-9.0][0-3.4][0.04-8.3][13.4-27.0][47.9-61.4][0.08-16.2][0.6-17.3][20.8-38.9][17.3-40.2][0-2.5][1.6-7.0][0-10.9][0-9.0][0.02-5.1][0-5.5][0-2.5][1.9-7.6][0-10.9][0-9.0][0.02-5.1][0-5.5][3.9-13.3][47.0-60.6][0.08-16.2][0.6-17.3][28.5-47.7][22.6-46.6][1.1-8.0][31.6-44.8][0-10.9][0.6-17.3][17.5-34.9][19.9-43.4]
Substance0.015 0.03 0.06 0.125 0.25 0.51.41.81248163264128 256 512 1024 2048 >2048
Food type
Origin
%Resistant
95%Confidenceinterval
Distribution (%) of MICs
Apramycin
Broiler meat
Beef
1.43.23.1
Pork3.54.10.70.50.72.7
Gentamicin
Broiler meat
74.170.153.179.583.080.0
DANMAP 2009 - Appendix 1
Beef
23.124.943.820.517.020.00.71.4
Pork4.23.60.55.11.93.80.76.310.32.8 1.99.20.7 0.74.1 10.0
Neomycin
Broiler meat
75.564.771.971.878.376.9
18.926.728.125.618.921.5
Beef
Pork
Spectinomycin
Broiler meat
2.62.81.594.481.910084.689.690.8
Beef
1.4 0.73.6 10.9 13.6
Pork
Streptomycin
Broiler meat
Beef
14.018.19.412.89.418.52.15.484.643.493.887.251.956.93.83.1
2.63.84.61.48.63.1
2.8 9.4 3.84.6 4.6 9.24.2 2.88.6 22.65.14.7 16.0 17.99.2 12.3 10.8
Pork4.10.91.53.50.713.6 10.9 2.3
Ciprofloxacin
Broiler meat
83.247.590.684.670.858.54.911.33.17.75.77.71.40.97.7
Beef
Pork
Nalidixic acid
Broiler meat
54.527.650.051.355.770.81.5
41.331.2 0.550.048.743.423.1 1.5
Beef
1.52.10.93.193.758.496.910098.192.33.60.94.6
0.5
0.9
4.23.6 35.7
Pork
Colistin
Broiler meat
1.5
0.91.5
Beef
Pork
DanishImportedDanishImportedDanishImportedDanishImportedDanishImportedDanishImportedDanishImportedDanishImportedDanishImportedDanishImportedDanishImportedDanishImportedDanishImportedDanishImportedDanishImportedDanishImportedDanishImportedDanishImportedDanishImportedDanishImportedDanishImportedDanishImportedDanishImportedDanishImported99.3 0.794.6 1.8100100100100
1.41.800002.14.500001.414.005.15.702.128.10016.018.510.545.23.15.142.535.44.241.2000.96.24.240.3000.91.503.60000
[0.2-5.0][0.5-4.6][0-10.9][0-9.0][0-3.4][0-5.5][0.4-6.0][2.2-8.2][0-10.9][0-9.0][0-3.4][0-5.5][0.2-5.0][9.7-19.3][0-10.9][0.6-17.3][2.1-11.9][0-5.5][0.4-6.0][22.2-34.5][0-10.9][0-9.0][9.6-24.4][9.9-30.0][6.0-16.7][38.6-52.1][0.08-16.2][0.6-17.3][32.9-52.4][23.9-48.2][1.6-8.9][34.6-48.0][0-10.9][0-9.0][0.02-5.1][1.7-15.0][1.6-8.9][33.7-47.1][0-10.9][0-9.0][0.02-5.1][0.04-8.3][0-2.5][1.6-7.0][0-10.9][0-9.0][0-3.4][0-5.5]
Vertical solid lines indicate EUCAST epidemiological cut-off values. Exceptions and further details can be found in appendix 2.White fields represent the range of dilutions tested. MIC values equal to or lower than the lowest concentration tested are presented as the lowest concentration. MIC values greater than thehighest concentration in the range are presented as one dilution step above the range.
121
IndicatorEscherichia coli
122
DANMAP 2009 - Appendix 1
Table 54. Distribution of MICs and occurrence of resistance inEscherichia colifrom cattle (n=48) and pigs(n=48), DenmarkDANMAP 2009SubstanceTetracycline
Animal%95%Distribution (%) of MICsspecies Resistant Confidenceinterval 0.015 0.03 0.06 0.125 0.25 0.5 1 2 4 8 16 32 64 128 256 512 1024 2048 >2048CattlePigs83.366.716.714.62.1091.735.4002.1052.166.733.345.806.206.212.529.216.756.252.175.031.26.231.26.200[69.8-92.5][51.6-79.6][7.5-30.2][6.1-27.8][0.05-11.1][0-7.4][80.0-97.7][22.2-50.5][0-7.4][0-7.4][0.05-11.1][0-7.4][37.2-66.7][51.6-79.6][20.4-48.4][31.4-60.8][0-7.4][1.3-17.2][0-7.4][1.3-17.2][4.7-25.2][17.0-44.1][7.5-30.2][41.2-70.5][37.2-66.7][60.4-86.4][18.7-46.3][1.3-17.2][18.7-46.3][1.3-17.2][0-7.4][0-7.4]10097.9 2.154.2 14.679.2 14.625.0 4.24.2 2.166.7 33.377.1 16.775.0 10.4 2.166.7 2.1 2.1 2.166.754.275.0 22.9 2.183.3 10.46.312.527.195.81002.116.733.310.4 70.8 2.172.9 12.518.8 72.9 6.32.1 72.9 20.8 4.24.2 4.26.3 50.0 8.391.7 8.31002.147.933.333.345.86.352.164.691.735.483.36.3 60.48.32.1 14.64.2 2.12.1
ChloramphenicolCattlePigsFlorfenicolAmpicillinCeftiofurCattlePigsCattlePigsCattlePigsCattlePigsCattlePigsCattlePigsCattlePigsCattlePigsCattlePigsCattlePigsCattlePigsCattlePigsCattlePigsCattlePigs
Diagnostic submissions from animals
CefotaximeSulfonamideTrimethoprimApramycinGentamicinNeomycinSpectinomycinStreptomycinCiprofloxacinNalidixic acidColistin
2.1
50.0 29.2 4.2 2.1 10.4 4.229.2 4.2 10.4 8.3 2.1 45.843.8 4.2 10.4 16.7 16.7 8.320.8 4.2 12.5 12.5 14.6 35.42.168.891.7 2.131.36.3
Vertical solid lines indicate EUCAST epidemiological cut-off values. Exceptions and further details can be found in appendix 2.White fields represent the range of dilutions tested. MIC values equal to or lower than the lowest concentration tested are presented as thelowest concentration. MIC values greater than the highest concentration in the range are presented as one dilution step above the range.
DANMAP 2009 - Appendix 2
123
Materials and MethodsDemographicsHospitals in DenmarkThe reported number of hospitals in each Regionof Denmark corresponds to the number ofadministratively distinct public hospitals, which do notspecialise in psychiatric care (somatic hospitals) andreport data to the Danish Medicines Agency and theNational Board of Health. This number is lower thanthe actual number of geographically distinct hospitalsin Denmark due to grouping of the hospitals under thesame administration and name.Certain categories of hospitals were excluded. Thisyear, data from private hospitals and clinics, psychiatrichospitals, specialised non-acute care clinics,rehabilitation centres and hospices were excludedfrom DANMAP (representing approximately 3% ofthe antimicrobial consumption at hospitals and of thenumber of bed-days).From April 2nd2007, the monopoly of the pharmacy wassuspended and private companies (two in 2009) cannow on certain conditions (identical to the pharmacies)sell veterinary specialities for production animals onprescription. In addition, price setting was liberalised,which allowed for discounts corresponding to loweradministration cost related to sale of large quantitiesto the veterinarians. In 2009, the animal owners andveterinarians purchased the antimicrobial agentsequally from the pharmacies (49%), and the veterinarydrug trading companies (49%), while only 2.4% waspurchased from the feed mills. The veterinarianspurchase the veterinary medicines at the pharmacies,and in 2009, they used or distributed 11 % of theantimicrobial agents.Data on all sales of veterinary prescription medicinefrom the pharmacies, private companies, feed millsand veterinarians are sent electronically to VetStat.Veterinarians are required by law to report to VetStat theuse of all prescription medicines in production animals ona monthly basis. For most veterinarians, the registrationof data is linked to the writing of invoices. The amount ofdrugs reported by the veterinary practitioners is validatedagainst pharmacy data on the total sales of therapeuticdrugs for use in practice. The electronic registrationof the sales at the pharmacies is linked to the billingprocess, ensuring a high data quality regarding amountsan identity of drugs.The VetStat database contains detailed information aboutsource and consumption for each prescription item:date of sale, identity of prescribing veterinarian, sourceID (identity of the pharmacy, feed mill, or veterinarianreporting), package identity code and amount, animalspecies, age-group, disease category and code for farm-identity (CHR – Danish Central Husbandry Register).The package code is a unique identifier, relating to allinformation on the medicine, such as active ingredient,content as number of unit doses (e.g. number of tablets),package size, and code of the antimicrobial agent in theVeterinary Anatomical Therapeutic Chemical (ATCvet)classification system.Knowledge of the target animal species enables thepresentation of consumption data in Defined Animal DailyDoses (ADD). The ADD system is a national veterinaryequivalent to the international Defined Daily Doses(DDD) system applied in the human field (www.whocc.no). See further on the ADD system in Textbox 1.
Data on consumption of antimicrobialsConsumption of antimicrobial agents inanimals
Consumption data presented in this report wereobtained from the national monitoring program, VetStatsince 2001. Prior to 2001, data were based on overallsales figures from the pharmaceutical industry (seeTable 5).In Denmark, all therapeutic drugs are prescription-onlyand Vet Stat collects data on all medicines prescribedby veterinarians for use in animals. In addition, dataon consumption of coccidiostatics as feed additives(non-prescription) and antimicrobial growth promotersare collected by VetStat. Data on coccidiostaticswere reported until 2004, but due to problems indata transfer, data were not reported in 2005 and2006. Data on coccidiostatics for 2007–2009 will bepresented in later reports after validation of data.Until 2007, antimicrobial agents could only bepurchased at the pharmacy or in medicated feedfrom the feed mills. The pharmacy either sells themedicines to vetenarians for use in practice or for re-sale to farmers, or sells directly to the animal holderon presentation of a prescription. By law, the profit thatveterinarians can make on the sale of medicines isvery limited and there is no economic encouragementfor the veterinarian to sell drugs.
124
DANMAP 2009 - Appendix 2
The consumption is compared with production inkg meat or number of animals produced. Due to anincreasing number of pigs exported around 30 kg,involving 24% of pigs produced in 2009, an adjustedmeasure of consumption per pig was calculated.The adjustment is based on the assumption that pigsexported at 30 kg, on average received the sameamount of antimicrobial agents before export, as otherpigs from farrowing to 30 kg:Antimicrobial use per pig produced (adjusted)=(ADDs*(Nf/Nw)+ ADDw*(Nf/Nw) + ADDf) / Nf,where ADDs= Amounts of antimicrobial used insow herds, measured in ADDkg; ADDw= Amounts ofantimicrobial used in weaning pigs herds, measuredin ADDkg; ADDf= Amounts of antimicrobial used infinisher pigs, measured in ADDkg; Nw =Number of pigsproduced to 30 kg bodyweight, including pigs exportedat 15-50 kg (mostly at 30 kg); Nf =Number of pigsproduced to slaughter, whether exported domesticallyor exported.Antimicrobial agents used in humans and animals arepresented in Table 4.
for the prescription is not yet available. The data aretransferred monthly to the DMA in an electronic format.The present report includes data on the consumptionof antibacterial agents for systemic use, or group J01of the 2009 update of ATC classification, in primaryhealth care and in hospitals. As recommended by theWorld Health Organization (WHO), consumption ofantibacterial agents in primary health care is expressedas a number of DDDs per 1000 inhabitants and perday (DDD/1000 inhabitant-days). Consumption inprimary health care is also reported as a numberof packages per 1000 inhabitants. Consumption ofantibacterial agents in hospitals is expressed as anumber of DDDs per 1000 inhabitants and per day(DDD/1000 inhabitant-days) to compare with primaryhealth care and as a number of DDDs per 100occupied bed-days and per day (DDD/100 occupiedbed-days). Since antimicrobial consumption expressedas DDD/100 occupied bed-days does not necessarilyreflect changes in hospital activity and production,consumption in hospitals is also presented as DDD/100discharged patients. Data on the number of occupiedbed-days (or patient-days) and number of discharges ineach hospital were obtained from the National Board ofHealth (http://www.sundhedsdata.dk).
Consumption of antimicrobial agents inhumans
Consumption data presented in this report wereobtained from the Danish Medicines Agency (DMA)(http://www.laegemiddelstyrelsen.dk). The DMA hasthe legal responsibility for monitoring the consumptionof all human medicinal products. This is carried out bymonthly reporting of consumption from all pharmaciesin Denmark, including hospital pharmacies, to the DMA.Data from the primary health care sector have beencollected since 1994, whereas data on consumption inhospitals are available from 1997.In Denmark, all antimicrobial agents for human useare prescription-only medicines and are sold bypharmacies in defined packages. Each package isuniquely identified by a code which can be related topackage size, content as number of unit doses (e.g.number of tablets), content as number of DefinedDaily Doses (DDD), code of the antimicrobial agentin the Anatomical Therapeutic Chemical (ATC)classification system, and producer. In addition, thefollowing information is collected for each transaction:social security number (CPR number) of the patient,code identifying the prescribing physician, date andplace (pharmacy, hospital pharmacy, institution) of thetransaction, and information regarding reimbursementof cost, if applicable. Information on the indication
Collection of bacterial isolatesAnimalsAnimal isolates included in this DANMAP report areEscherischia coli, Enterococcus faecium, Enterococcusfaecalis, Campylobacter coliandCampylobacterjejunicollected from healthy production animalsat slaughter;E. coliO149 andE. coliF5 (K99)collected from diagnostic submissions; and finally,SalmonellaTyphimurium isolates collected from sub-clinical infections as well as from cases of clinicalsalmonellosis:Campylobacter,indicatorE. coliand Enterococci.Samples from healthy pigs, cattle and broilers arecollected at slaughter for the DANMAP programme bymeat inspection staff or company personnel and sentfor examination to the National Food Institute, DTU orthe National Veterinary Institute, DTU (for broilers). Theslaughter plants included in the DANMAP programmeaccount for 88-95% of the total number of animalsslaughtered in Denmark per year. The number ofsamples taken at the slaughter plant is proportionalto the number of animals slaughtered at each plantper year. Each sample represents one herd or flock.
DANMAP 2009 - Appendix 2
125
For broilers, samples are collected weekly throughoutthe year (approximately 400 samples per year)representing all broiler houses in Denmark. For cattleand pigs, samples are collected once a month fromJanuary through November (approximately 80 and 30samples per month from pigs and cattle, respectively).Accordingly, the bacterial isolates may be regardedas representing a stratified random sample of therespective populations, and the observed prevalenceof resistant isolates provides an estimate of the trueoccurrence in the populations. An overview of thenumber of samples analysed, the number of isolatesobtained and the number of MIC-determinationsperformed for pigs, cattle and broilers is presented inTable 55. Only one isolate per herd (of each bacterialspecies) is finally included in the DANMAP report.Samples from cattle are not analyzed for enterococcidue to increasingly low findings in previous years. ForCampylobacter,the isolation rate ofC. colifrom cattleand broilers and ofC. jejunifrom pigs is low, and MIC-determinations are not performed because of the lownumber of isolates.Isolates from diagnostic submissions.Isolates fromdiagnostic submissions are collected for the DANMAPprogramme at both the National Food Institute, DTUand at the Laboratory of Swine Diseases, DanishMeat Association, Kjellerup. BothE. coliO149 fromdiarrhoeic pigs andE. coliF5 (K99) from diarrhoeiccattle are included, with no more than one isolaterepresenting each herd.Staphylococcus hyicusisolatesfrom skin infections in pigs were also collected, but notreported due to a low number of isolates in 2009.
Salmonella.The National Food Institute, DTU is thenational reference laboratory forSalmonellain animals,feeding stuffs and food and receives all such isolatesfor typing. Among allSalmonellaisolates serotypedat the National Food Institute and at the NationalVeterinary Institute, DTU, one isolate per serotype perfarm is selected for the DANMAP report.The majority of theSalmonellaisolates frompigs (95% in 2009) originates from the DanishSalmonellasurveillance programmes: The resultsof a serosurveillance at the slaughterhouses and inall breeding herds appoint risk herds to be furtherexamined by analysing pen-faecal samples 1) fromfinisher herds at level 2 and level 3 farms (i.e. farmswith high level ofS.Typhimurium antibodies in serumsamples taken at slaughter), 2) from related (supplying)sow herds, and finally 3) from breeding and multiplierherds with high serum levels in three monthly samples.In 2009, 977 herds were appointed as risk herds fromthe serosurveillance andS.Typhimurium was isolatedfrom 351 of these herds. In addition,Salmonellainsamples from pig herds investigated due to clinicaldisease (not necessarily salmonellosis) were included(21 isolates in 2009).For broilers, all flocks are sampled due to theSalmonellasurveillance programme including flocksintended for export before slaughter. Samples arecollected 2-3 weeks before slaughter. Since 2008, anadditional AM (ante mortem)-testing of broiler flockswas introduced 7-10 days prior to slaughter. In 2009,3707 flocks (7081 samples) were analysed, of which 33were positive forSalmonella.In 2009, noS.Enteritidisand only a fewS.Typhimurium isolates were observed.
Table 55. Number of samples analysed and number of isolates obtained and MIC-tested from healthy productionanimals at slaughter.DANMAP 2009E. coliPigsNo. of samples analysedNo. of isolates obtainedNo. of isolates MIC-tested/reportedNo. of samples analysedNo. of isolates obtainedNo. of isolates MIC-tested/reported28427915016115694E. faecium772169151000E. faecalis772136133000C. jejuni160230188107873989375C. coli160137113188200398120
Cattle
No. of samples analysed398398398No. of isolates obtained2575720No. of isolates MIC-tested/reported1524319Data in this table should not be used for reportation of prevalences of the bacterial specie.
Broilers
126
DANMAP 2009 - Appendix 2
For cattle, a total of 390 herds were examined basedon clinical indication, 29Salmonellawere isolatedincluding 16S.Dublin and 8S.Typhimurium isolates.Due to the low number ofS.Typhimurium isolatesfrom broilers and cattle, these are not presented in thisreport.Further details on the sampling procedures in theSalmonellasurveillance programmes are described inthe Annual Report on Zoonoses in Denmark, 2009.
broiler meat, 736 batches were tested and 30 batcheswere positive forSalmonella.For imported turkey, 62batches of 342 batches were positive forSalmonella.For imported pork, 37 of 301 tested batches werepositive. For imported beef, only 5 batches werepositive of 125 batches and the estimated prevalencein positive batches was 5.7%. As the sampling is riskbased, the findings are not indicative of the prevalenceat retail.
Food
Humans
Campylobacter,indicatorE. coliand Enterococci.The food isolates originated from food samplescollected at wholesale and retail outlets by theRegional Veterinary and Food Control Authorities(RFCA) in all regions of Denmark during the courseof routine inspection carried out by the authorities,or on specific request from the Danish Veterinaryand Food Administration (DVFA) for the DANMAPprogramme. The collected material consists of bothDanish and imported foods. The food samples arecollected according to the guidelines for microbiologicalexamination of foods from the DVFA [Vejledning nr.9613 af 20. Dec. 2002 om offentlig mikrobiologiskkontrol af fødevarer].Salmonella.TheSalmonellaisolates from Danish porkand beef originate from theSalmonellasurveillanceprogramme, comprising swab samples of pork and beefcarcasses taken at the slaughterhouses after cooling.In 2009, a total of 24,385 samples where pooled into4,991 tested samples. Due to loss of sensitivity frompooling, this method corresponds to the testing of14,377 single samples (Annual report on Zoonoses inDenmark, 2001).Salmonellawas isolated from 157pooled samples, (est. prevalence =1.1%), of which36% wereS.Typhimurium (n=57). From own control atthe slaughterhouses, 19 isolates were submitted to theNational Food Institute, DTU, susceptibility tested andincluded in the DANMAP report.From beef, a total of 1,606 pooled samples weretested, corresponding to an estimated 4,438 singlesamples.Salmonellawas isolated from 13 beefsamples, of which only one wasS.Typhimurium.Salmonellaisolates from Danish broiler meat, importedpoultry meat and other imported fresh meats originatefrom the case-by-case risk assessment programme;for each tested batch of meat, 12 pooled samples(each 1-60 single samples) are tested forSalmonella.In 2009, 100 batches of Danish broiler meat weresampled, with no positive batches. For imported
Salmonella entericaserovars Typhimurium andEnteritidis andCampylobacter jejuni.Antimicrobialsusceptibility was performed on a sample of humanfaecal isolates submitted to Statens Serum Institut(SSI).Campylobacterspp. isolates were submittedfrom clinical microbiological laboratories coveringthree geographical regions: Northern Jutland, Funenand Roskilde/Køge. Information on travel historywas obtained for these patients. Exact figures of theproportion tested and the sampling strategy for thedifferent species can be found in the correspondingchapters of this report.Staphylococcus aureus.All blood isolates werereferred to the Staphylococcus reference laboratoryat SSI on a voluntary basis. In November 2006,methicillin resistantS. aureus(MRSA) became anotifiable disease in Denmark and since then it hasbeen mandatory to send all MRSA isolates to theStaphylococcus reference laboratory.InvasiveStreptococcus pneumoniae,Streptococcus pyogenes(group A streptococci),group B, C and G streptococci.All blood andspinal fluid isolates nationwide are sent to SSI fordetermination or confirmation of susceptibility testingand typing.Escherichia coli, Klebsiella pneumoniae,Pseudomonas aeruginosa,non-invasiveStreptococcus pneumoniae,non-invasiveStreptococcus pyogenes,invasiveE. faeciumand invasiveE. faecalis.Data were provided on allisolates recorded from either blood samples (E.coli,Klebsiella pneumoniae, Pseudomonas aeruginosa,E. faeciumandE. faecalis),urine samples (E.coli,Klebsiella pneumoniae)or all non-invasive samples (S.pyogenesandStreptococcus pneumoniae)submittedfor susceptibility testing to the participating DCM atStatens Serum Institut or the following hospitals:Rigshospitalet, Hvidovre, Herlev, Hillerød, Slagelse,Næstved, Odense, Esbjerg, Vejle, Herning, Århus,Viborg and Aalborg.
DANMAP 2009 - Appendix 2
127criteria: Colour, motility, arginine dihydrolase testingand the ability to ferment mannitol, sorbitol, arabinose,raffinose and melibiose. For broilers, cloacal swabswere incubated overnight at 42�C in EnterococcusSelective Broth. Cultures were inoculated on Slanetz-Bartley agar and incubated for 48 h at 37�C followed bythe same identification criteria as for pigs. All isolatesofE. faeciumandE. faecaliswere stored (at -80�C).Like in previous years, no samples from cattle wereinvestigated for enterococci.Pathogens.The diagnostic submissions wereexamined according to the standard procedures at theparticipating laboratories.
In 2009, no samples were collected from healthyhumans.
Isolation and identification of bacteriaAnimalsSalmonellaspp.Examination of samples was doneby non-selective pre-enrichment of 25 g material in a1:10 dilution with buffered peptone water (BPW) andincubated 16-20 hours at 37�C. A plate with ModifiedSemi-solid Rappaport-Vassiliadis (MSRV) medium wasinoculated with 0.1 ml of BPW deposited as 3 drops.After incubation overnight at 41.5�C material fromMSRV swarming zones were inoculated onto BrilliantGreen Agar (samples from cattle and pigs) or RambachAgar (samples from poultry). Overnight incubation at37�C was followed by serotyping of suspect coloniesby slide agglutination. For cattle samples, in addition1.0 ml of the BPW suspension was incubated in 9ml selenite cystein broth overnight at 41.5�C beforeinoculation on MSRV agar.Campylobacterspp.Samples from pigs and poultrywere examined by direct inoculation on selective agar(mCCD) followed by incubation in micro-aerophilicatmosphere for 1-2 days at 41.5�C. For cattle, selectiveenrichment in Preston broth at a ratio of 1:10 incubatedin microaerophilic atmosphere for 24 h at 41.5�Cwas performed followed by inoculation of 10�l of theenrichment broth to mCCD agar.Campylobactersuspect colonies were verified by microscopy andoxidase activity. Species-identification was performedby catalase activity and the ability to hydrolyse indoxylacetate and hippurate. All isolates ofC. jejuniandC.coliwere stored (at -80�C).Escherichia colifrom healthy animals (indicatorE. coli).The material was inoculated directly ontoDrigalski agar and incubated at 37�C overnight. Forcattle and pigs, yellow colonies were inoculated ontoCHROM Orientation agar and red colonies wereidentified asE. coliafter incubation at 37�C overnight.For poultry, yellow colonies were identified by catalaseand oxidase activity, indole, citrate, methyl red andVoges-Proskauer reaction.Enterococci.For pigs, one drop of faecal materialsuspended in 2 ml sodium chloride (0.9%) was spreadon Slanetz-Bartley agar and incubated for 2 daysat 42�C. Three colonies with morphology typical ofE. faecalisandE. faeciumwere sub-cultivated onblood agar. Colonies were identified by the following
Food
Salmonellaspp.was isolated according to theguidelines for microbiological examination of foodsfrom the DVFA [NMKL No. 71, 5th ed., 1999]. Sero-and phage-typing was performed at the National FoodInstitute, DTU.Campylobacterspp.was isolated according to theguidelines for microbiological examination of foods fromthe DVFA [NMKL No. 119, 3rd ed., 2007]. Identificationwas performed at the Regional Veterinary and FoodControl Authorities (RFCA) by microscopy, oxidaseactivity, catalase activity and the ability to hydrolyseindoxyl acetate and hippurate. All isolates ofC. jejuni,C. coliandC. lariwere stored (at -80�C), and sent tothe National Food Institute, DTU, for MIC-testing ofC.jejuniandC. coli.IndicatorE. coliwas isolated by adding 5 g of thesample to 45 ml of MacConkey- or laurylsulfphate-broth, which was incubated overnight at 44�C, andsubsequently streaked onto violet red bile agar andincubated for 24h at 44�C by RFCA. PresumptiveE.coliwere further identified by CHROM Orientation agarand sent to the National Food Institute, DTU for MIC-testing. All isolates were stored (at -80�C.)Enterococciwere isolated by adding 5 g of the sampleto 45 ml of azide dextrose broth, which was incubatedovernight at 44�C and subsequently streaked ontoSlanetz-Bartley agar. After incubation at 44�C for 48hours, colonies typical ofE. faeciumandE. faecaliswere sent to the National Food Institute, DTU forfurther identification by the following criteria: Colour ofmaterial, motility, arginine dihydrolase testing and theability to ferment mannitol, sorbitol, arabinose, raffinoseand melibiose. All isolates ofE. faeciumandE. faecaliswere stored (at -80�C.)
128
DANMAP 2009 - Appendix 2
Humans
Salmonellaspp.isolates were serotyped according tothe Kauffman-White Scheme.Campylobacterspp.Species identification wasperformed using a species specific PCR assay [KlenaJDet al.,J. Clin. Microbiol. 2004; 42: 5549-5557].Staphylococcus aureus.Sequencing of theS.aureusspecificspagene was used both for speciesconformation and typing purposes. Anyspanegativeisolates were confirmed asS. aureusby coagulasetest. Thespatyping [Harmsenet al.2003. J. Clin.Microbiol. 41: 5442-5448] and additional typing by multilocus sequence typing (MLST) was performed [Enrightet al.2000. J. Clin. Microbiol. 38: 1008-1015] andannotated using eBURST v.3 software (www.mlst.net).Based on thespaand MLST typing, each isolate wasassigned to a clonal complex (CC). For MRSA isolates,presence of themecAmethicillin resistance gene wasconfirmed by PCR [Larsenet al.2008. Clin. Microbiol.Infect. 14: 611-614].
All isolates from animals and foods were susceptibilitytested at the National Food Institute, DTU, exceptfor broilers, where the testing was performed at theNational Veterinary Institute, DTU. TheSalmonellaspp. andCampylobacterspp. of human origin weresusceptibility tested at the SSI.From 1998–2007, a performance test for susceptibilitytesting was carried out almost once a year to ascertainthe quality and comparability of susceptibility testingin the laboratories providing MIC-data. Today, thelaboratories are accreditated by DANAK (the Danishnational body for accreditation) or awaiting anaccreditation, ensuring MIC-data of high quality.One isolate per bacterial species per herd, per foodsample, or per patient was tested for antimicrobialsusceptibility. For animal isolates in excess numbers(indicatorE.coli,enterococci andCampylobacterspp.from healthy production animals), a random selectionof 100 or 150 isolates was appointed for susceptibilitytesting. Due to a relatively low number of isolates,C.jejunifrom pigs andC. colifrom cattle and broilers werenot susceptibility tested.
Susceptibility testingMIC-testingAntimicrobial susceptibility testing ofSalmonellaspp.,Campylobacterspp., indicatorE. coli, Enterococcusspp. and the veterinary pathogens was performedas microbroth dilution MIC with the Sensititre system(Trek Diagnostic Systems Ltd., UK). Inoculationand incubation procedures were in accordance withthe CLSI guidelines. The following quality controlstrains were used for internal control:StaphylococcusaureusATCC 29213,Escherichia coliATCC 25922,Pseudomonas aeruginosaATCC 27853,EnterococcusfaecalisATCC 29212 andCampylobacter jejuniATCC33560.An overview of the interpretation of MIC-valuesis presented in Table 56. Since 2007, data wereinterpreted using EUCAST epidemiological cut-offvalues, and if not available, EUCAST or CLSI clinicalbreakpoints were applied. Exceptions and furtherdetails are described in Table 56. Data from previousyears presented in this DANMAP report are notcorrected for the change in interpretation (e.g. all dataare presented with use of the interpretation applied forthe year in question). All MIC-distributions for humanisolates are presented with both epidemiological cut-offvalues and clinical breakpoints in order to visualize theimpact of changing the interpretation criteria.
Staphylococcus aureusfrom humans
Susceptibility testing was performed using the tabletdiffusion method (Neo-Sensitabs�, A/S Rosco,Denmark) on Danish Blood Agar (SSI Diagnostika,Denmark) towards penicillin, cefoxitin, streptomycin,kanamycin, erythromycin, clindamycin (only when anisolate was resistant to erythromycin), tetracycline,fusidic acid, rifampicin, norfloxacin, mupirocin andlinezolid. A cefoxitin 60 �g tablet was used forscreening for methicillin susceptibility. Isolates withan inhibition zone <29 mm were further tested forthe presence of themecAgene by PCR. In addition,MRSA isolates were screened for susceptibility towardsglycopeptides by spot test on Brain-Heart infusion (BHI)agar (Becton Dickinson, Germany) with teicoplanin(5 mg/L) and confirmed using Etest� (AB Biodisk,Sweden) on BHI with inoculum of McFarland 2.0. Incase of MIC≥8 mg/L for vancomycin and teicoplanin oran MIC≥12 mg/L for teicoplanin, population analysisprofile against vancomycin was performed [Woottonetal.2001.J. Antimicrob. Chemother. 47: 399-403].
InvasiveStreptococcus pneumoniafromhumans
Screening for penicillin-resistantS. pneumoniaewas performed using a 1 μg oxacillin tablet (Neo-Sensitabs�, A/S Rosco, Taastrup, Denmark) on 10%horse blood agar (SSI Diagnostika, Hillerød, Denmark),
DANMAP 2009 - Appendix 2
129
Table 56. Interpretation used for MIC-determination on bacterial isolates from animals, food and humans.Antimicrobial agentSalmonellaEpidcut-offmg/ml>4>16Clinbreakmg/ml>8E. coliEpidcut-offmg/ml>8>16Clinbreakmg/ml>8E.faeciumEpidClincut-off breakmg/ml mg/ml>4>8E. faecalisEpidcut-offmg/ml>4Clinbreakmg/ml>8C. jejuniEpid Clincut-off breakmg/ml mg/ml
DANMAP 2009
C. coliEpidcut-offmg/mlClinbreakmg/ml
AmpicillinApramycinAvilamycin>16>8Cefotaxime>0.5>2>0.25>2CefoxitinCeftiofur>2>1Chloramphenicol>16>16*>16>16*>32>16*>32>16*>16>16Ciprofloxacin>0.06>1>0.03>1>1>1>1>1Colistin>2>2>2>2Erythromycin>4>4*>4>4*>4>4>16>16*Florfenicol>16>16Gentamicin>2>4>2>4>32 >512*>32>512*>1>2Kanamycin>1,024>1,024Linezolid>4>4>4>4Nalidixic acid>16>16*>16>16*>16>32Neomycin>4>8Penicillin>16>8*>16>8*Quinupristin/>4b)>4dalfopristina)Salinomycin>4>4Spectinomycin>64>64Streptomycin>16>16>128>512>2>4Sulfonamide>256 b)>256*>256 b) >256*Tetracycline>8>8*>8>8*>4>8*>4>8*>2>8*>2>8*TiamulinTigecycline>0.25 >0.5>0.25>0.5Trimethoprim>2>4>2>4Vancomycin>4>4>4>4Epidemiological cut-off values and clinical breakpoints recommended by EUCAST are marked in grey.EUCAST epidemiological cut-off values were used for interpretation. If not available, interpretation criteria were applied by DANMAP.a) Trade name synercid. EUCAST epid. cut-off value (>1) was not applied according to investigations presented in DANMAP 2006.b) CLSI clinical breakpoint was applied.* CLSI clinical breakpoint (presented if EUCAST clinical breakpoints are not available).
and for erythromycin-resistantS. pneumoniaeusinga 78 μg erythromycin tablet (Neo-Sensitabs�, A/SRosco, Taastrup, Denmark) on 10% horse blood agar(SSI Diagnostika). The breakpoints used are thosedefined by the CLSI. Penicillin and erythromycin MICsare determined using the Etest (AB Biodisk, Solna,Sweden) on Danish Blood Agar (Resistensplade,SSI Diagnostika) incubated at 36�C, 5% CO2. Thebreakpoints used are those defined by Etest.
InvasiveStreptococcus pyogenes(group A),group B, C and G streptococci from humans
resistant streptococci are tested with 15 μgerythromycin disk (Oxoid) and 15 μg clindamycindisk (Oxoid, Greve, Denmark) on Danish Blood Agar(Resistensplade, SSI Diagnostika). Erythromycin MICsare determined using the Etest (AB Biodisk, Solna,Sweden) on Danish Blood Agar (Resistensplade,SSI Diagnostika) incubated at 36�C, 5% CO2. Thebreakpoints used are those defined by the CLSI.Resistant isolates are defined as both fully andintermediary resistant isolates.
Screening for penicillin-resistant streptococci wasperformed using a 1 μg oxacillin disk (Oxoid, Greve,Denmark) on 10% horse blood agar (SSI Diagnostika,Hillerød, Denmark), and for erythromycin-resistantstreptococci using a 78 μg erythromycin tablet (Neo-Sensitabs�, A/S Rosco, Taastrup, Denmark) on 10%horse blood agar (SSI Diagnostika). Erythromycin
E.coli, Klebsiella pneumoniae, Pseudomo-nas aeruginosa,non-invasiveStreptococcuspneumoniae,non-invasiveStreptococcuspyogenes,invasiveE. faeciumandE. faecalisfrom humansIn 2008, the DCM at Statens Serum Institut, thehospitals in Næstved, Odense and Viborg, andRigshospitalet, which is the national referral hospital,
130used the tablet diffusion method (Neo-Sensitabs�,A/S Rosco) on Danish Blood Agar (Resistensplade,SSI Diagnostika) and the breakpoints defined for thismedium by A/S Rosco.However, the DCM at Odense Hospital used Neo-Sensitabs�on Müeller-Hinton II agar (SSI Diagnostica)when testing urine isolates and Columbia agar with4.5% NaCl (SSI Diagnostika) for oxacillin-susceptibilityof staphylococci. The DCM at Vejle Hospital usedthe Neo-Sensitabs�on Müeller-Hinton II agar (SSIDiagnostica) and the breakpoints defined for thismedium by A/S Rosco. The DCM at Esbjerg Hospitalused the tablet diffusion method (Neo-Sensitabs�, A/SRosco) on Müeller-Hinton II agar (SSI Diagnostika)when testingE. coli.The DCM at Aalborg Hospital alsoused the Neo-Sensitabs�on Mueller-Hinton II agar (SSIDiagnostika) in combination with the tablet diffusionmethod (A/S Rosco) and the breakpoints defined bythe Swedish Reference Group for Antibiotics (SRGA).The only material exception from SRGA was that thewildtype population ofE. coliwas deemed susceptiblefor ampicillin (and not intermediary susceptible).In 2008, the DCM at Hillerød, Hvidovre, Herlev,Herning and Århus Hospitals used the disk diffusionmethod (Oxoid, Basingstoke, UK) on Iso-Sensitest(ISA) medium (Oxoid). The DCM at Slagelse Hospitalused the same disks on Iso-Sensitest (ISA) mediumwith or without 5% horse blood (Oxoid) according totest material and bacterial species. All laboratoriesperforming the disk diffusion method used thebreakpoints defined by the Swedish Reference Groupfor Antibiotics (Available from: URL: http://www.srga.org/). However, the DCM at Århus Hospital changed toEUCAST breakpoints for urine samples continuouslyduring 2009 and for enterobacteria in blood perNovember 2009.All submitting laboratories participate in national andinternational quality assurance collaborations suchas the United Kingdom National External QualityAssessment Schemes (NEQAS).
DANMAP 2009 - Appendix 2
Data handlingAnimal isolatesThe results from the primary examination of samplesfrom slaughterhouses and primary production forthe bacteria of interest – positive as well as negativefindings – and of the susceptibility testing were storedin an Oracle Database 8i Enterprise Edition�at theNational Food Institute, DTU. The susceptibility datawere stored as continuous values (MIC) as well ascategorised as susceptible or resistant, respectively, asdefined by the relevant epidemiological cut-off value.Each isolate was identified by the bacterial species,including subtype as applicable and by the date ofsampling and the species of animal. Information onthe farm of origin was also recorded. All handlingand evaluation of results was carried out usingSAS�Software, SAS Enterprise Guide 3.0.
Food isolates
Results from the analysis of food samples werereported via the database administrated by the DanishVeterinary and Food Administration, except for the dataon Salmonella, which were reported to and extractedfrom the laboratory database at the National FoodInstitute, DTU. For each bacterial isolate, information isavailable on the food type, bacterial species, date andplace of sampling, date of examination of the sample,country of slaugther, the RFCA that collected andprocessed the sample, and an identification number,which makes it possible to obtain further informationabout the isolate from the Authority. Furthermore, moredetailed information about the country of origin wasrecorded whenever possible.
Human isolates
Quinupristin/dalfopristin breakpoint
Salmonellaspp. andCampylobacterspp.Data onSalmonella spp. and Campylobacter spp. infectionsare stored in the Danish Registry of Enteric Pathogens(SQL database) maintained by SSI. This registerincludes only one isolate per patient within a window ofsix months and includes data on susceptibility testing ofgastrointestinal pathogens.Staphylococcus aureus.For MRSA, data onthe characteristics of the isolates and the clinical/epidemiological information were obtained from theDanish MRSA register at SSI (mandatory reportable).In this database, patients were only registered the firsttime they were diagnosed with MRSA regardless ofwhether it was colonisation or infection. Based on thereported information, MRSA cases were classified ascolonisation/active screening (i.e. surveillance samplesto detect nasal, throat, gut or skin colonisation),
The epidemiological cut-off value suggested byEUCAST for quinupristin/dalfopristin when testingE. faeciumis >1 μg/ml. In DANMAP,E. faeciumisolates with MICs >4 μg/ml are reported resistant toquinupristin/dalfopristin due to an evaluation studypresented in the DANMAP 2006 report, page 49-50.
DANMAP 2009 - Appendix 2imported infection (i.e. acquired outside Denmark),infection acquired in a Danish hospital, defined asdiagnosed >48 hours after hospitalization with no signof infection at admittance (HA-MRSA) or infectiondiagnosed outside hospitals (community onset). MRSAcases with community onset were further classifiedaccording to risk factors during the previous 12 monthsas either health care associated with community onset(HACO) or community acquired (CA). Health careassociated risk factors included prior hospitalisationsor stay in long-term care facilities within 12 monthsprior to MRSA isolation and being a health careworker. Community risk factors included known MRSApositive household members or other close contacts.Non-Danish origin defined as the person or one of theparents being born outside Denmark were investigatedthrough the Danish civil registry.Streptococcus pneumoniae, Streptococcuspyogenes(group A streptococci), group B, C and Gstreptococci.Data on susceptibility testing of isolatesare stored as MICs in a Microsoft� Access databaseat SSI. Analysis including selection of isolates fromblood and spinal fluid samples and removal of duplicateisolates was performed with Microsoft� Excel.Escherichia coli, Klebsiella pneumoniae,Pseudomonas aeruginosa,non-invasiveStreptococcus pneumoniae,non-invasiveStreptococcus pyogenes,invasiveE. faeciumandinvasiveE. faecalis.Fourteen DCM provided dataon resistance levels inE. coli, Klebsiella pneumoniae,Pseudomonas aeruginosa,non-invasiveStreptococcuspneumoniae,non-invasiveStreptococcus pyogenes,invasiveE. faeciumand invasiveE. faecalisisolates.Data were extracted from the following laboratoryinformation systems:•
131- ADBakt (Autonik AB, Skoldinge, Sweden) for theDCM at Hvidovre, Herlev, Slagelse, and AalborgHospitals.- MADS (DCM, Skejby Hospital, Århus, Denmark)for the DCM at Rigshospitalet and Næstved,Odense, Esbjerg, Vejle, Herning, Århus (Skejby)and Viborg Hospitals.- SafirLIS Microbiology (Profdoc Lab AB, Borlänge,Sweden) for the DCM at Hillerød Hospital.
•
•
For the former Roskilde County, resistance data onE.colifrom blood samples were obtained from the DCMat SSI, and resistance data onE. colifrom hospitalurine samples from the chemical laboratory at RoskildeHospital.Generally, resistance data were excluded ifsusceptibility to a certain antimicrobial agent was testedon only a selected number of isolates.
Calculation of confidence limits anddifferences between proportions
Estimation of exact 95% (two-sided) confidenceintervals for proportions were based on binomialprobability distributions as described in Armitage &Berry (2001), Statistical Methods in Medical Research,4th ed. 2001, Oxford: Blackwell Scientific Publications.Significance tests of differences between proportions ofresistant isolates were calculated using SAS�Software,SAS Enterprise Guide 3.0 or StatCalc in EpiInfo™v. 6. Fishers exact test (2-tailed) was applied whenappropriate. P-values were reported to the firstsignificant figure except P-values smaller than 0.0001,these were reported asP<0.0001.
132
DANMAP 2009 - Appendix 3
DANMAP publications 2009Aarestrup, F. M. and S. M. Pires. 2009. Comment on:Causal regulations vs. political will: why human zoonoticinfections increase despite precautionary bans onanimal antibiotics. Environ.Int. 35:760-761.Abatih, E. N., H. D. Emborg, V. F. Jensen, D. M. Lo FoWong, and A. K. Ersbøll. 2009. Regional, seasonal, andtemporal variations in the prevalence of antimicrobial-resistantEscherichia coliisolated from pigs at slaughterin Denmark (1997-2005). Foodborne.Pathog.Dis. 6:305-319.Abatih, E. N., A. K. Ersbøll, D. M. Lo Fo Wong, and H.D. Emborg. 2009. Space-time clustering of ampicillinresistantEscherichia coliisolated from Danish pigsat slaughter between 1997 and 2005. Prev.Vet.Med.89:90-101.Bartels, M. D., K. Boye, S. M. Rohde, A. R. Larsen,H. Torfs, P. Bouchy, R. Skov, and H. Westh. 2009.A common variant of staphylococcal cassettechromosomemectype IVa in isolates fromCopenhagen, Denmark, is not detected by the BDGeneOhm methicillin-resistantStaphylococcus aureusassay. J.Clin.Microbiol. 47:1524-1527.Bergenholtz, R. D., M. S. Jørgensen, L. H. Hansen,L. B. Jensen, and H. Hasman. 2009. Characterizationof genetic determinants of extended-spectrumcephalosporinases (ESCs) inEscherichia coliisolatesfrom Danish and imported poultry meat. J.Antimicrob.Chemother. 64:207-209.Bøcher, S., R. L. Skov, M. A. Knudsen, L. Guardabassi,K. Mølbak, P. Schouenborg, M. Sørum, and H. Westh.2009. The Search and Destroy Strategy PreventsSpread and Long-term Carriage of MRSA; Results fromFollow-up Screening of a Large ST22 (E-MRSA 15)Outbreak in Denmark. Clin.Microbiol.Infect. [Ahead ofprint].Brinch, K. S., N. Frimodt-Møller, N. Høiby, and H. H.Kristensen. 2009. Influence of antidrug antibodies onplectasin efficacy and pharmacokinetics. Antimicrob.Agents Chemother. 53:4794-4800.Brinch, K. S., A. Sandberg, P. Baudoux, F. VanBambeke, P. M. Tulkens, N. Frimodt-Møller, N.Høiby, and H. H. Kristensen. 2009. Plectasin showsintracellular activity againstStaphylococcus aureusinhuman THP-1 monocytes and in a mouse peritonitismodel. Antimicrob.Agents Chemother. 53:4801-4808.Cavaco, L. M. and F. M. Aarestrup. 2009. Evaluationof quinolones for use in detection of determinantsof acquired quinolone resistance, including the newtransmissible resistance mechanismsqnrA, qnrB, qnrS,andaac(6’)Ib-cr,inEscherichia coliandSalmonellaentericaand determinations of wild-type distributions.J.Clin.Microbiol. 47:2751-2758.Cavaco, L. M., H. Hasman, S. Xia, and F. M. Aarestrup.2009.qnrD,a novel gene conferring transferablequinolone resistance inSalmonella entericaserovarKentucky and Bovismorbificans strains of human origin.Antimicrob.Agents Chemother. 53:603-608.Collignon, P., J. H. Powers, T. M. Chiller, A. Aidara-Kane, and F. M. Aarestrup. 2009. World HealthOrganization ranking of antimicrobials according totheir importance in human medicine: A critical step fordeveloping risk management strategies for the use ofantimicrobials in food production animals. Clin.Infect.Dis. 49:132-141.Conde, S. A., M. G. Bastos, B. J. Vieira, and F. M.Aarestrup. 2009. Down-regulation of transforminggrowth factor beta-2 expression is associated with thereduction of cyclosporin induced gingival overgrowth inrats treated with roxithromycin: an experimental study.BMC.Oral Health 9:33.de Vries, L. E., H. Christensen, R. L. Skov, F. M.Aarestrup, and Y. Agersø. 2009. Diversity of thetetracycline resistance genetet(M)and identificationof Tn916- and Tn5801-like (Tn6014) transposons inStaphylococcus aureusfrom humans and animals.J.Antimicrob.Chemother. 64:490-500.Goering, R. V., A. R. Larsen, R. Skov, F. C.Tenover, K. L. Anderson, and P. M. Dunman. 2009.Comparative genomic analysis of European and MiddleEastern community-associated methicillin-resistantStaphylococcus aureus(CC80:ST80-IV) isolates byhigh-density microarray. Clin.Microbiol.Infect. 15:748-755.Hammerum, A. M., Y. Agersø, L. Garcia-Migura, A.M. Seyfarth, L. J. Porsbo, H. D. Emborg, and L. B.Jensen. 2009. Evaluation of the quinupristin/dalfopristinbreakpoints forEnterococcus faecium.Int.J.Antimicrob.Agents 34:288-290.
DANMAP 2009 - Appendix 3
133
Hammerum, A. M. and O. E. Heuer. 2009. Humanhealth hazards from antimicrobial-resistantEscherichiacoliof animal origin. Clin.Infect.Dis. 48:916-921.Hancock, V., E. M. Nielsen, L. Krag, J. Engberg, andP. Klemm. 2009. Comparative analysis of antibioticresistance and phylogenetic group patterns in humanand porcine urinary tract infectiousEscherichia coli.APMIS 117:786-790.Hendriksen, R. S., M. Mikoleit, C. Kornschober, R.L. Rickert, S. V. Duyne, C. Kjelsø, H. Hasman, M.Cormican, D. Mevius, J. Threlfall, F. J. Angulo, and F.M. Aarestrup. 2009. Emergence of multidrug-resistantSalmonellaConcord infections in Europe and theUnited States in children adopted from Ethiopia, 2003-2007. Pediatr.Infect.Dis.J. 28:814-818.Hendriksen, R. S., A. M. Seyfarth, A. B. Jensen, J.Whichard, S. Karlsmose, K. Joyce, M. Mikoleit, S. M.DeLong, F. X. Weill, A. Aidara-Kane, D. M. Lo Fo Wong,F. J. Angulo, H. C. Wegener, and F. M. Aarestrup. 2009.Results of use of WHO Global Salm-Surv externalquality assurance system for antimicrobial susceptibilitytesting ofSalmonellaisolates from 2000 to 2007.J.Clin.Microbiol. 47:79-85.Heuer, O. E., H. Kruse, K. Grave, P. Collignon, I.Karunasagar, and F. J. Angulo. 2009. Human healthconsequences of use of antimicrobial agents inaquaculture. Clin.Infect.Dis. 49:1248-1253.Humphreys, H., H. Grundmann, R. Skov, J. C.Lucet, and R. Cauda. 2009. Prevention and controlof methicillin-resistantStaphylococcus aureus.Clin.Microbiol.Infect. 15:120-124.Jensen, U. S., L. Skjøt-Rasmussen, S. S. Olsen,N. Frimodt-Møller, and A. M. Hammerum. 2009.Consequences of increased antibacterial consumptionand change in pattern of antibacterial use in Danishhospitals. J.Antimicrob.Chemother. 63:812-815.Kalender, H., S. Sen, H. Hasman, R. S. Hendriksen,and F. M. Aarestrup. 2009. Antimicrobial susceptibilities,phage types, and molecular characterization ofSalmonella entericaserovar Enteritidis from chickensand chicken meat in turkey. Foodborne.Pathog.Dis.6:265-271.
Larsen, A. R., R. Goering, M. Stegger, J. A. Lindsay,K. A. Gould, J. Hinds, M. Sørum, H. Westh, K. Boye,and R. Skov. 2009. Two distinct clones of methicillin-resistant Staphylococcus aureus (MRSA) with thesame USA300 pulsed-field gel electrophoresis profile: apotential pitfall for identification of USA300 community-associated MRSA. J.Clin.Microbiol. 47:3765-3768.Larsen, A. R., M. Stegger, S. Bøcher, M. Sørum, D.L. Monnet, and R. L. Skov. 2009. Emergence andcharacterization of community-associated methicillin-resistantStaphyloccocus aureusinfections in Denmark,1999 to 2006. J.Clin.Microbiol. 47:73-78.Marcusson, L. L., N. Frimodt-Møller, and D. Hughes.2009. Interplay in the selection of fluoroquinoloneresistance and bacterial fitness. PLoS.Pathog.5:e1000541.Nielsen, E. M., M. Torpdahl, S. Ethelberg, and A. M.Hammerum. 2009. Variation in antimicrobial resistancein sporadic and outbreak-relatedSalmonella entericaserovar Typhimurium. Emerg.Infect.Dis. 15:101-103.Nielsen, S. L., N. Frimodt-Møller, and P. R. Hansen.2009. Fallaxin analogues with improved antibacterialactivity. Adv.Exp.Med.Biol. 611:531-532.Pedersen, K., A. S. Hammer, C. M. Sørensen, andO. E. Heuer. 2009. Usage of antimicrobials andoccurrence of antimicrobial resistance among bacteriafrom mink. Vet.Microbiol. 133:115-122.Petersen, A., F. M. Aarestrup, and J. E. Olsen. 2009.The in vitro fitness cost of antimicrobial resistanceinEscherichia colivaries with the growth conditions.FEMS Microbiol.Lett. 299:53-59.Pomba, C., H. Hasman, L. M. Cavaco, J. D. daFonseca, and F. M. Aarestrup. 2009. First descriptionof meticillin-resistant Staphylococcus aureus(MRSA) CC30 and CC398 from swine in Portugal.Int.J.Antimicrob.Agents 34:193-194.Sandberg, A., J. H. Hessler, R. L. Skov, J. Blom, and N.Frimodt-Møller. 2009. Intracellular activity of antibioticsagainstStaphylococcus aureusin a mouse peritonitismodel. Antimicrob.Agents Chemother. 53:1874-1883.
134
DANMAP 2009 - Appendix 3
Skjøt-Rasmussen, L., S. Ethelberg, H. D. Emborg, Y.Agersø, L. S. Larsen, S. Nordentoft, S. S. Olsen, T.Ejlertsen, H. Holt, E. M. Nielsen, and A. M. Hammerum.2009. Trends in occurrence of antimicrobial resistanceinCampylobacter jejuniisolates from broiler chickens,broiler chicken meat, and human domestically acquiredcases and travel associated cases in Denmark.Int.J.Food Microbiol. 131:277-279.Skov, R., R. Smyth, A. Yusof, A. Karlsson, K. Mills, N.Frimodt-Møller, and G. Kahlmeter. 2009. Effects oftemperature on the detection of methicillin resistanceinStaphylococcus aureususing cefoxitin discdiffusion testing with Iso-Sensitest agar. J.Antimicrob.Chemother. 63:699-703.Skov, R. L. and K. S. Jensen. 2009. Community-associated meticillin-resistantStaphylococcus aureusas a cause of hospital-acquired infections. J.Hosp.Infect. 73:364-370.Søes, L., K. Mølbak, S. Strøbaek, J. K. Truberg, M.Torpdahl, S. Persson, M. Kemp, and K. E. Olsen. 2009.The emergence ofClostridium difficilePCR ribotype027 in Denmark--a possible link with the increasedconsumption of fluoroquinolones and cephalosporins?Euro.Surveill. 14.Stegger, M., J. A. Lindsay, M. Sørum, K. A. Gould, andR. Skov. 2009. Genetic diversity in CC398 methicillin-resistantStaphylococcus aureusisolates of differentgeographical origin. Clin.Microbiol.Infect. 16: 1017-1019.Swenson, J. M., W. B. Brasso, M. J. Ferraro, D. J.Hardy, C. C. Knapp, D. Lonsway, S. McAllister, L.B. Reller, H. S. Sader, D. Shortridge, R. Skov, M.P. Weinstein, B. L. Zimmer, and J. B. Patel. 2009.Correlation of cefoxitin MICs with the presence ofmecAinStaphylococcusspp. J.Clin.Microbiol. 47:1902-1905.Torpdahl, M., A. M. Hammerum, C. Zachariasen, and E.M. Nielsen. 2009. Detection ofqnrgenes inSalmonellaisolated from humans in Denmark. J.Antimicrob.Chemother. 63:406-408.Trobos, M., H. Christensen, M. Sunde, S. Nordentoft,Y. Agersø, G. S. Simonsen, A. M. Hammerum, and J.E. Olsen. 2009. Characterization of sulphonamide-resistantEscherichia coliusing comparison ofsul2gene sequences and multilocus sequence typing.Microbiology 155:831-836.
Trobos, M., C. H. Lester, J. E. Olsen, N. Frimodt-Møller, and A. M. Hammerum. 2009. Natural transferof sulphonamide and ampicillin resistance betweenEscherichia coliresiding in the human intestine.J.Antimicrob.Chemother. 63:80-86.Vieira, A. R., H. Houe, H. C. Wegener, D. M. Wong, R.Bødker, and H. D. Emborg. 2009. Spatial scan statisticsto assess sampling strategy of antimicrobial resistancemonitoring program. Foodborne.Pathog.Dis. 6:15-21.Vieira, A. R., H. Houe, H. C. Wegener, D. M. Wong, andH. D. Emborg. 2009. Association between tetracyclineconsumption and tetracycline resistance inEscherichiacolifrom healthy Danish slaughter pigs. Foodborne.Pathog.Dis. 6:99-109.Wu, S., A. Dalsgaard, A. R. Vieira, H. D. Emborg,and L. B. Jensen. 2009. Prevalence of tetracyclineresistance and genotypic analysis of populationsofEscherichia colifrom animals, carcasses andcuts processed at a pig slaughterhouse. Int.J.FoodMicrobiol. 135:254-259.Xia, S., R. S. Hendriksen, Z. Xie, L. Huang, J.Zhang, W. Guo, B. Xu, L. Ran, and F. M. Aarestrup.2009. Molecular characterization and antimicrobialsusceptibility ofSalmonellaisolates from infections inhumans in Henan Province, China. J.Clin.Microbiol.47:401-409.
DANMAP 2009