Socialudvalget 2010-11 (1. samling)
SOU Alm.del Bilag 110
Offentligt
UNICEF DanmarkPakhus 48Sundkaj 9, 1.2100 København 0Tlf. +45 35 27 38 00Fax+45 35 27 38 10[email protected]www.unicef.dkProtektor: Alexandra,grevinde af Frederiksborg
Til:Socialudvalget ogstedfortrædere
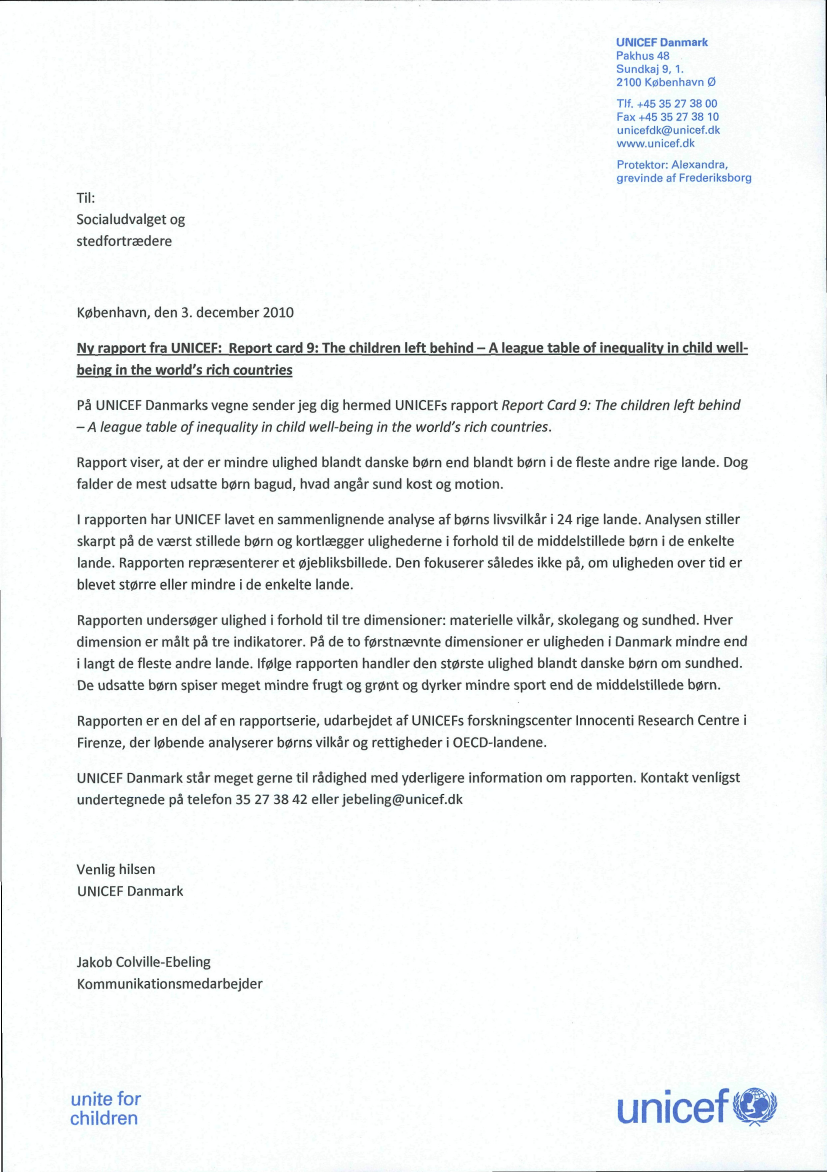
København, den 3. december 2010Ny rapport fra UNICEF: Report card 9: The children left behind - A league table of inequalitv in child well-being in the world's rich countriesPå UNICEF Danmarksvegne sender jeg dig hermed UNICEFs rapport Report Card 9: The children left behind- A league table of inequality in child well-being in the world's rich countries.Rapport viser, at der er mindre ulighed blandt danske børn end blandt børn i de fleste andre rige lande. Dogfalder de mest udsatte børn bagud, hvad angår sund kost og motion.I rapporten har UNICEF lavet en sammenlignende analyse af børns livsvilkår i 24 rige lande. Analysen stillerskarpt på de værst stillede børn og kortlægger ulighederne i forhold til de middelstillede børn i de enkeltelande. Rapporten repræsenterer et øjebliksbillede. Den fokuserer således ikke på, om uligheden overtid erblevet større eller mindre i de enkelte lande.Rapporten undersøger ulighed i forhold til tre dimensioner: materielle vilkår, skolegang og sundhed. Hverdimension er målt på tre indikatorer. På de to førstnævnte dimensioner er uligheden i Danmark mindre endi langt de fleste andre lande. Ifølge rapporten handler den største ulighed blandt danske børn om sundhed.De udsatte børn spiser meget mindre frugt og grønt og dyrker mindre sport end de middelstillede børn.Rapporten er en del af en rapportserie, udarbejdet af UNICEFs forskningscenter Innocenti Research Centre iFirenze, der løbende analyserer børns vilkår og rettigheder i OECD-landene.UNICEF Danmark står meget gerne til rådighed med yderligere information om rapporten. Kontakt venligstundertegnede på telefon 35 27 38 42 [email protected]
Venlig hilsenUNICEF Danmark
Jakob Colville-EbelingKommunikationsmedarbejder
unicef#
A league table of inequality in childwell-being in the world's rich countries
Innocenti Report Card 9 was written by Peter Adamson.Part 1 of the Report draws on the analysis carried out by Candace Currie,Dorothy Currie, Leonardo Menchini, Dominic Richardson andChris Roberts, and presented in the Innocenti Working Paper 2010-19(available on the UNICEF Innocenti Research Centre (IRC) website:www.unicef-irc.org).for Repon Card9 the Health Behaviour in School-aged Children (HBSC)International Coordinating Centre provided the statistical results for theanalysis of inequality in children's health, The Organisation for EconomicCo-operation and Development (OECD) provided distributional analysis ofchild well-being indicators for material well-being and educationaloutcomes. HBSC and the OECD are not responsible for the interpretationof these results or other analysis in this report, The project wascoordinated by the UNICEF IRC.The UNICEF Innocenti Research Centre would like to acknowledgethe generous support for Repon Card 9 provided by the Andorran,Australian, Belgian, German, Swiss and United Kingdom NationalCommittees for UNICEF.Any part of this Innocenti Report Card may be freely reproduced usingthe following reference:UNICEF (2010), The Children Left Behind: A league table of inequalityin child well-being in the world's rich countries', Innocenti Repon Card 9,UNICEF Innocenti Research Centre, Florence.The Report Card series is designed to monitor and compare theperformance of economically advanced countries in securing the rightsof their children.
The UNICEF Innocenti Research Centre in Florence, Italy, wasestablished in 1988 to strengthen the research capability of theUnited Nations Children's Fund (UNICEF) and to support its advocacyfor children worldwide.The Centre helps to identify and research current and future areas ofUNICEF's work. Its prime objectives are to improve internationalunderstanding of issues relating to children's rights and to help facilitatethefull implementation ofthe United Nations Convention on the Rights ofthe Child in all countries.The Centre's publications are contributions to a global debate on childrights issues and include a wide range of opinions. The views expressedare those of the author and researchers and do not necessarily reflect thepolicies or views of UNICEF.
� United Nations Children's Fund (UNICEF), November 2010UNICEF Innocenti Research CentrePiazza SS. Annunziata-, 1250122 Florence, Italy
I N N O C E N T I
R E P O R T
C A R D
9
THE
CHILDREN
LEFT
BEHIND
A league table of inequality in child well-beingin the world's rich countries
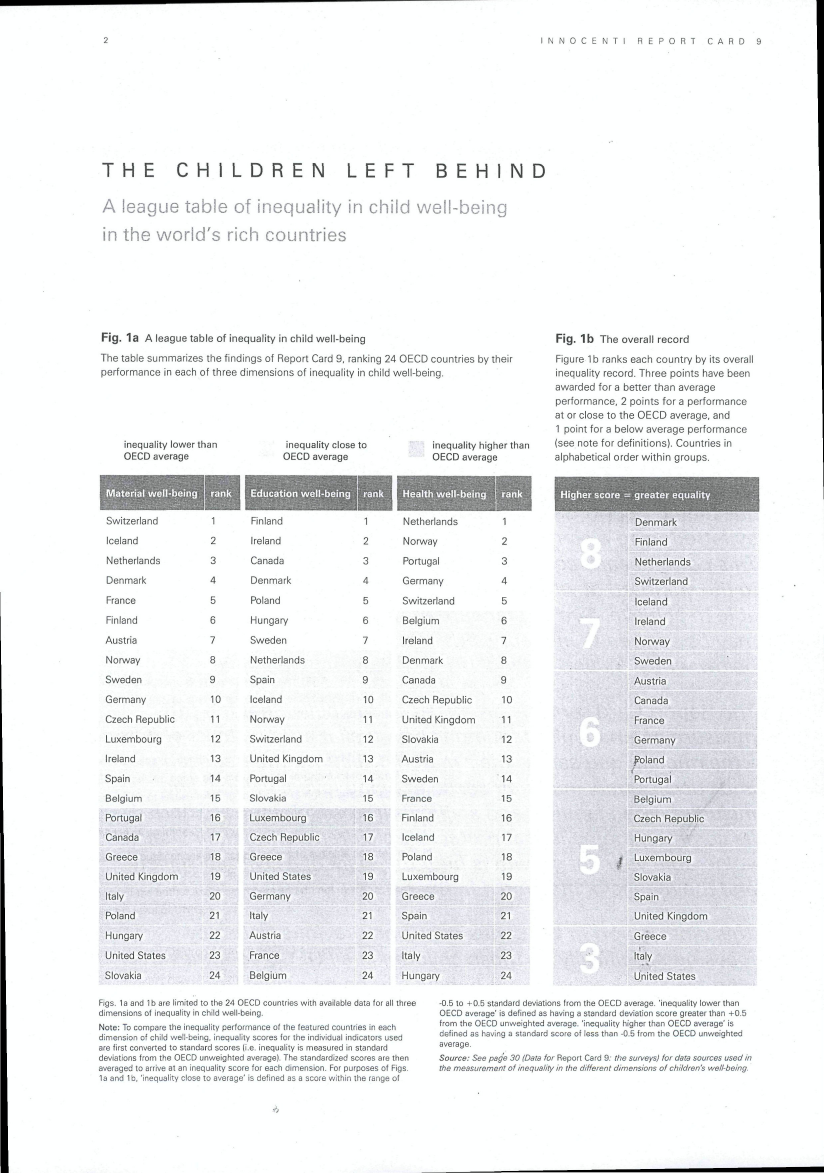
F i g . l a A league table of inequality in child well-beingThe table summarizes the tindings of Report Card 9, ranking 24 OECD countries by theirperformance in each of three dimensions of inequality in child well-being.
F i g . I b The overall recordFigure I b ranks each country by its overallinequality record. Three points have beenawarded for a better than averageperformance, 2 points for a performanceat or close to the OECD average, and1 point for a below average performance(see note for definitions). Countries inalphabetical order within groups.
inequality lower thanOECD average
inequality close toOECD average
inequality higher thanOECD average
Material well-beingSwitzerlandIcelandNetherlandsDenmarkFranceFinlandAustriaNorwaySwedenGermanyCzech RepublicLuxembourgIrelandSpainBelgiumPortugalCanadaGreeceUnited KingdomItaiyPolandHungaryUnited StatesSlovakia
rank I Education well-being123456789101112131415161718192021222324FinlandIrelandCanadaDenmarkPolandHungarySwedenNetherlandsSpainIcelandNorwaySwitzerlandUnited KingdomPortugalSlovakiaLuxembourgCzech RepublicGreeceUnited StatesGermanyItalyAustriaFranceBelgium
rank I Health well-being123456789101112131415161718192021222324NetherlandsNorwayPortugalGermanySwitzerlandBelgiumIrelandDenmarkCanadaCzech RepublicUnited KingdomSlovakiaAustriaSwedenFranceFinlandIcelandPolandLuxembourgGreeceSpainUnited StatesItalyHungary
rank123456789101112131415161718192021222324
Higher score == greater equalityDenmarkFinlandNetherlandsSwitzerlandIcelandIrelandNorwaySwedenAustriaCanadaFranceGermanyfolandPortugalBelgiumCzech RepublicHungary
/
LuxembourgSlovakiaSpainUnited KingdomGreeceItalyUnited States
Figs. la and Ib are limited to the 24 OECD countries with available data for all threedimensions of inequality in chiid well-being.Note; To compare the inequality performance of the featured countries in eachdimension of child well-being, inequality scores for the individual indicators usedare first converted to standard scores (i.e. inequality is measured in standarddeviations from the OECD unweighted average). The standardized scores are thenaveraged to arrive at an inequality score for each dimension. For purposes of Figs.la and 1 b, 'inequality close to average' is defined as a score within the range of
-0.5 to +0.5 standard deviations from the OECD average. 'inequality lower thanOECD average' is defined as having a standard deviation score greater than +0.5trom the OECD unweighted average. 'inequality higher than OECD average' isdefined as having a standard score of less than -0.5 from the OECD unweightedaverage.Source: See page 30 (Data for Report Card 9; the surveys) for data sources used inthe measurement of inequality in the different dimensions of children's well-being.
