Udvalget for Fødevarer, Landbrug og Fiskeri 2010-11 (1. samling)
FLF Alm.del Bilag 23
Offentligt
Annual Report on Zoonosesin Denmark 2009
Annual Report on Zoonoses in Denmark 2009Edited by:Birgitte Helwigh and Anne Louise KroghDanish Zoonosis CentreNational Food InstituteTechnical University of DenmarkSteen EthelbergStatens Serum InstitutThis is an official publication from theNational Food Institute, TechnicalUniversity of Denmark, the DanishVeterinary and Food Administration andStatens Serum Institut.Text and tables may be cited and reprintedonly with reference to this report.Suggested citation:Anonymous, 2010. Annual Report onZoonoses in Denmark 2009, National FoodInstitute, Technical University of Denmark.Reprints can be ordered from:Danish Zoonosis CentreNational Food InstituteTechnical University of DenmarkMørkhøj Bygade 19DK - 2860 SøborgDenmarkPhone: +45 40 21 53 77Fax:+45 35 88 70 28E-mail: [email protected]Layout: Susanne CarlssonPhotos: Colourbox and Mikkel AdsbølPrinting: Rosendahls Schultz Grafisk A/SISSN 0909-3837The report is also available at:www.food.dtu.dk
ContentsIntroduction12 1.1 Salmonella source account 2009
461012
Trends and sources in human salmonellosisOutbreaks of special interestListeriain Denmark
3
3.1 Human cases 3.2 Food and consumption3.3 Conclusion
4.Salmonellain conventional and alternativeslaughter pig production5.Campylobacterin meat from organic and conventionalbroilers6.EU related topics7.6.1 Trichinella - special status 6.2 Control of zoonoses in animal populations
16182022
7.1 Surveillance of human disease 7.2 Outbreaks of zoonotic gastrointestinal infections 7.3 Surveillance and control of animals and animal products 7.4 Official testing of zoonotic pathogens in foodstuffs
Surveillance and control programmes
Appendix
Appendix A. Trends and sources in human salmonellosis Appendix B. Human disease and outbreak data Appendix C. Monitoring and surveillance data Appendix D. Surveillance and control programmes Appendix E. Population and slaughter data Appendix F. List of Figures and Tables
262732465355
IntroductionHumansDenmark has for several years had one of the highest hu-man incidences of listeriosis in EU and 2009 will probablybe no different since the number of human cases increasedwith 90%; 51 cases in 2008 and 97 cases in 2009. A part ofthe increase was caused by a small outbreak encompassingeight cases. A working group with experts from the Natio-nal Food Institute, Statens Serum Institut and the NationalFood and Veterinary Administration collected all availabledata and found no conclusive explanations for the increase.The fact that the Danish consumption surveys have shownthat elderly people have increased their consumption ofproducts with a higher risk ofListeria(e.g. soft cheeses,delimeats) during the last 5-10 years, may explain someof the observed increase during the later years. This can,however, not explain the large increase in 2009.TheSalmonellasource account estimated table eggsand Danish produced pork as the most important sourcesof salmonellosis in 2009, although the estimated numberof cases due to pork decreased by 50% compared with2008, where several pork-related outbreaks resulted in anincrease compared with previous years. Two large generaloutbreaks related to Danish produced table eggs were re-ported in 2009. One of them encompassed both a generalincrease in human cases as well as a confined outbreak ata large swimming competition. The estimated number ofhuman cases due to table eggs increased two fold due tothese outbreaks. The estimated number of sporadic casesdue to table eggs decreased compared with 2008. Importedmeat was estimated to have caused five times as many casesas in 2008. Only few human cases were estimated to haveDanish and imported broiler meat as a source in 2009.The number of reported outbreaks decreased from 66in 2008 to 50 in 2009, however there were several largeoutbreaks with more than 100 cases resulting in the totalnumber of outbreak related cases to increase in 2009; e.g.outbreaks related to egg, water or buffet meals. The largeS.Typhimurium U292 outbreak and theS.TyphimuriumDT 135 and DT 3 outbreaks described in the AnnualReport 2008 continued in 2009 with lowered incidence;unfortunately the sources remained unknown.The distributions of human cases withSalmonella(divi-ded into Typhimurium, Enteritidis and ‘other serotypes’),Campylobacter,VTEC andYersiniasplit into groups by sexand age are presented for the first time in appendix B. Forall pathogens, very little difference between the numberof male and female cases were observed, except forCam-pylobacterwhere 20% more male cases were reported in2009. For human salmonellellosis, with the exception ofinfections caused byS.Enteritidis, the reported incidencewas highest among children less than five years. ForS.Typhimurium infections, this age distribution was mainlydue to three large outbreaks that started in 2008 and conti-nued in 2009, as all three outbreaks had an overweight ofchildren less than five years. VTEC andYersiniainfectionshad a higher incidence among the very small children aswell. The age distribution ofS.Enteritidis andCampylo-bactercases was more evenly spread out.Broiler productionIn the broiler production, the number ofSalmonellapositive flocks has been decreasing for many years and 0.9%of the flocks slaughtered in Denmark were positive in 2009.The surveillance programme was tightened in 2008 withone additional sampling at the farm before slaughter and astricter biosecurity scheme at the farm. The 1% EU targetset out in the Regulation (EC) 646/2007 forS.Typhimu-rium andS.Enteritidis in broiler flocks must be reached
The annual Report on Zoonoses presents a summary of the trends and sources of zoonotic infections inhumans and animals, as well as the occurrence of zoonotic agents in food and feeding stuffs in Denmark in2009. Greenland and the Faeroe Islands are not represented. The report is based on data collected accordingto the Zoonoses Directive 2003/99/EC, supplemented by data obtained from national surveillance and con-trol programmes as well as data from relevant research projects. Occasionally corrections to the data mayoccur after publication resulting in minor changes in the presentation of the report is also available at www.food.dtu.dk.
4
Annual Report on Zoonoses in Denmark 2009
Introduction
by all Member States by December 31st2012. In 2009, theprevalence ofS.Typhimurium in Danish broiler flocks was0.3%, and there was no positive findings ofS.Enteritidisin the flocks. In the EU baseline study onSalmonellaonbroiler carcasses carried out in all Member States in 2008,no positive batches were found in Denmark. At the EUlevel, the prevalence was 16%.Campylobacterin Danish broiler meat from conventio-nal and organic production systems has been investigatedas part of the Danish action plan againstCampylobacter.Results showed that organic broiler meat was more oftencontaminated withCampylobacterthan conventionalbroiler meat.Pig productionThe level ofSalmonellapositive breeder and multiplierpig herds decreased in 2009 compared with the previous ye-ars; from 2001 to 2008 the prevalence has been increasing.In 2002, the ban of trade of animals from herds with ahigh serological reaction againstSalmonella(theSalmo-nellaindex) was replaced by a duty to provide informationabout theSalmonellastatus in the herd. In April 2008, a newcontingency plan started where the industry introduceda penalty for live trade from breeder and multiplier herdswith a highSalmonellaindex (index>10). At the end of2009, the prevalence had decreased to the same level as in2002. Some of the decrease is probably due to these newactions, as a decrease in the seroprevalence in breeder andmultiplier pig herds was observed immediately after theintroduction of the penalty. Additionally, the proportionof positive slaughter pig herds decreased during the sameperiod indicating that tightening of the surveillance pro-gramme at the breeding level has an effect throughout thebreeding pyramid.
Possible differences in theSalmonellainfection levelbetween conventional and alternative production systemsfor slaugter pigs has been investigated. The results showeda higherSalmonellaprevalence in conventional productioncompared with organic and non-organic free range produc-tion. However, for all three production systems severalSalmonellareducing measures could be implemented to afurther extend; e.g. purchase of pigs fromSalmonellafreeherds, use of barley and more structured feed.The EU baseline survey carried out in 2008 onSalmo-nellain breeder, multiplier and sow herds showed that 41%of the Danish breeder and multiplier herds as well as sowherds were positive, which was above EU average (29%for breeder and multiplier herds and 33% for sow herds).Of the six EU baseline surveys conducted onSalmonella,this was the only one, where Denmark was found to havea higher prevalence than the EU average.MiscellaneousIn November 2009, a 14 year old slaughter cow wastested positive with classical BSE. This was the first casefound since 2005. The cow was probably infected by aBSE positive feed batch distributed in Denmark in themid-nineties, which gave rise to a peak of incidence in the1996-cohort. New cases of BSE in cattle might appear aslong as animals from this cohort are still alive, althoughat a very low risk. There have been no cases in Danishcattle born after the EU-wide feed-ban was introduced inJanuary 2001. Denmark continues to test all slaughter andrisk animals (fallen stock, emergency slaughters, etc.) over48 months according the EU regulation.
Annual Report on Zoonoses in Denmark 2009
5
1. Trends and sources in humansalmonellosisBy Sara Monteiro Pires ([email protected]) andTine Hald
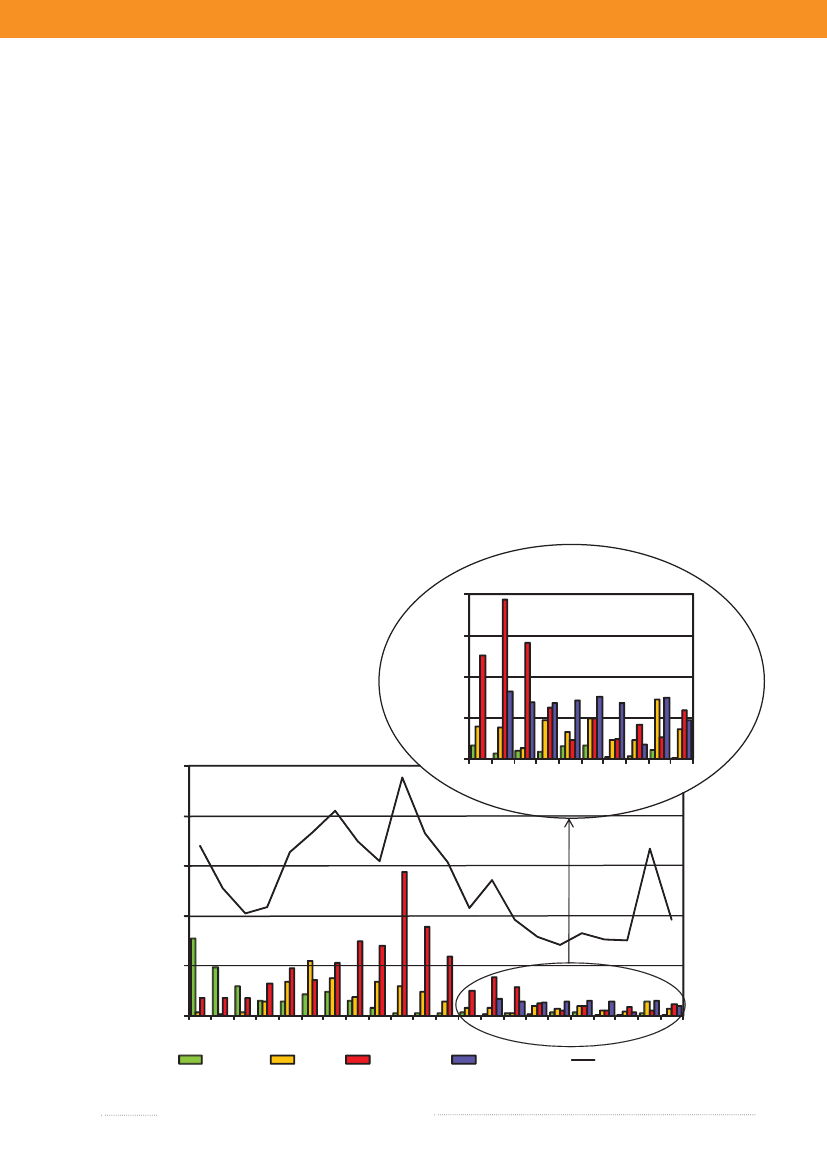
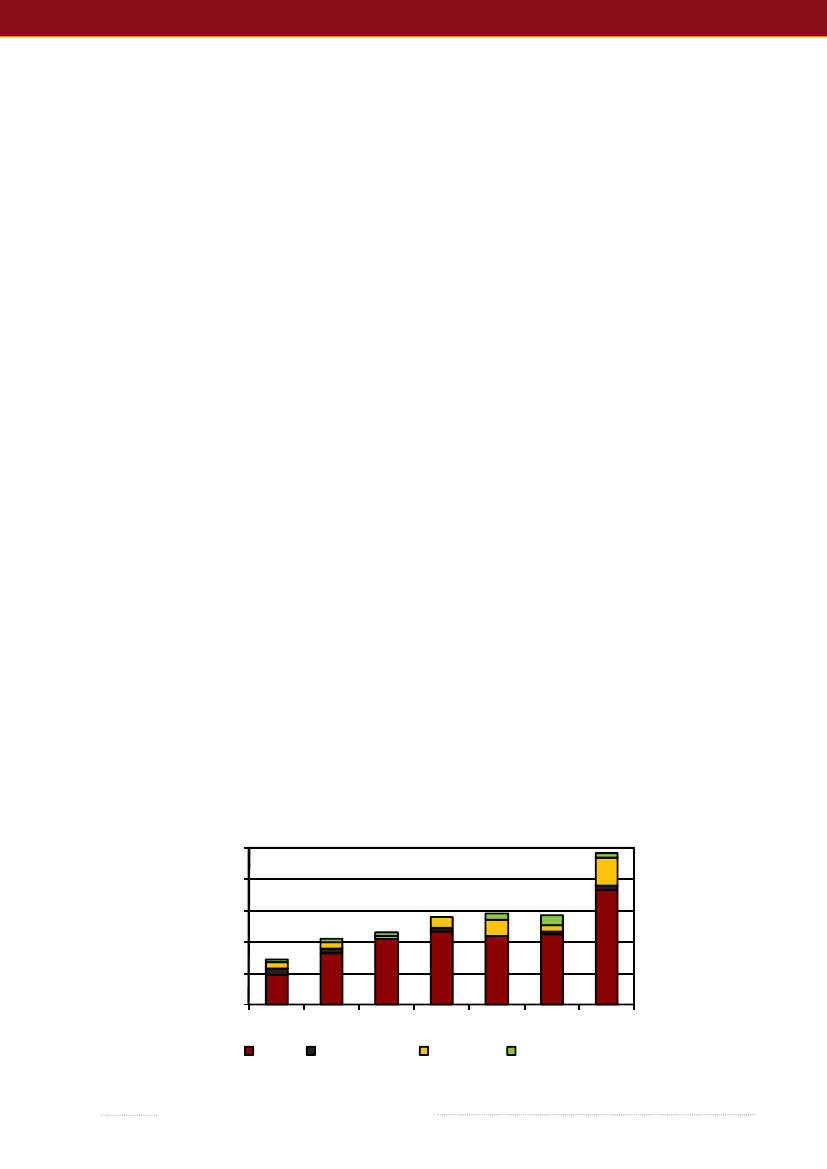
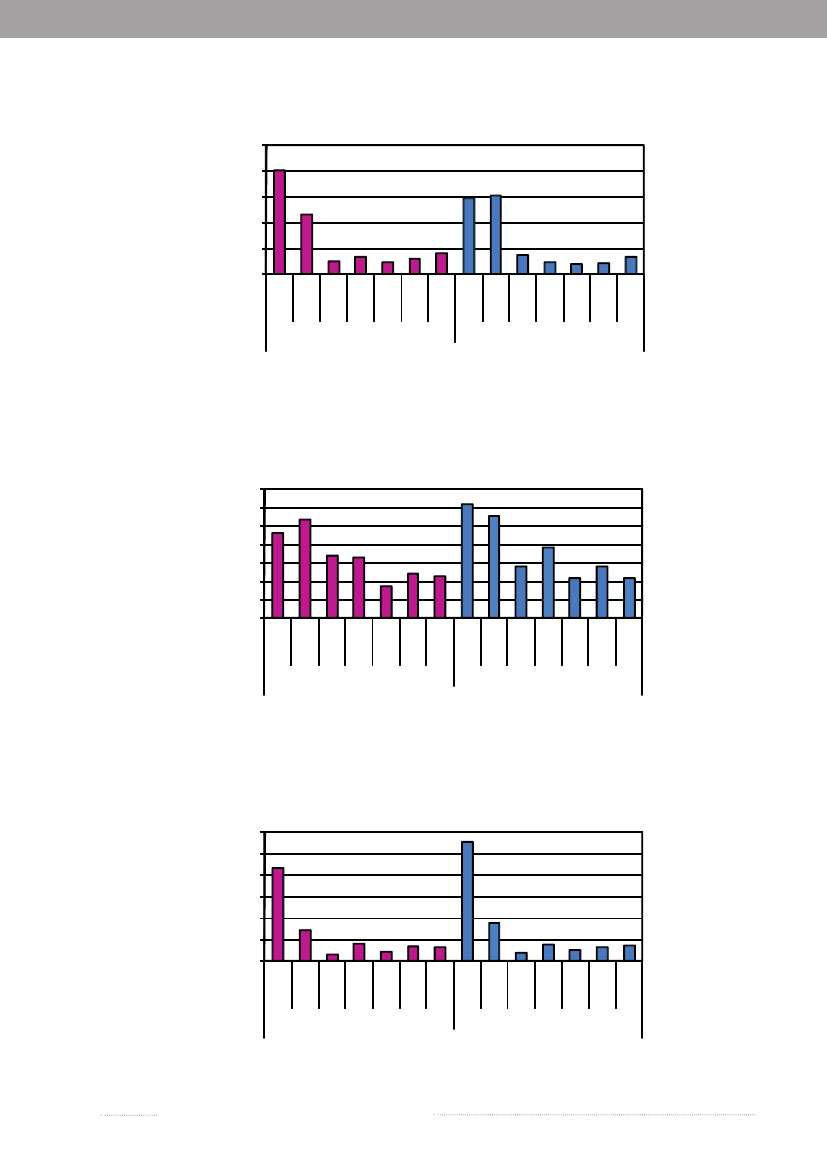
1.1Salmonellasource account 2009The Danish Zoonosis Centre routinely applies asource attribution model to estimate the contribution ofthe major animal-food sources to human infections ofSalmonella.The principle of the method is to compare thenumber of human cases caused by differentSalmonellasero- and phage types with the distribution of the samesubtypes isolated from the various animal-food sources.Antimicrobial resistance profiles ofS.Typhimuriumisolates are also included to further distinguish betweensimilar phage types found in animals, food and humans.Since the model was first implemented in 1995, it hasevolved from being purely deterministic to becoming astochastic model, built under a Bayesian framework. In2008, a new methodological development was introducedin the model (1), which applies data from multiple yearsFigure 1.1. Total incidence of humansalmonellosis and estimated human incidencedue to broilers, pork, table eggs and importedfoods in Denmark, 1988 to 2009
thereby improving the robustness and accurateness of theresults. Results have been instrumental to evaluate trendson the most important sources of human salmonellosisand prioritize interventions in Denmark. The propor-tion of cases that were attributable to the major foodsources in the last two decades is presented in Figure 1.1.The incidence of human salmonellosis was 38.5 casesper 100,000 inhabitants in 2009 (10.8 forS.Enteritidisand 13.9 forS.Typhimurium) (appendix B, Table A2).This represents a substantial decrease when comparedwith 2008, particularly in the incidence of infections byS.Typhimurium, a reflection of a large and long-lastingoutbreak that occurred in Denmark in 2008 (see chapter 2for more information), although the outbreak continued ata lower level in 2009. However, due to this continued out-break the human incidence reported in 2009 was still hig-her than what was observed in the six years prior to 2008.
16.0
Incidence per 100,000
12.08.04.00.000 01 02 03 04 05 06 07 08 09
100.0
Incidence per 100,000
60.040.020.00.088 89 90 91 92 93 94 95 96 97 98 99 00 01 02 03 04 05 06 07 08 09BroilersPorkTable eggsTotal ImportTotal cases
Source: Danish Zoonosis Centre, National Food Institute
6
Annual Report on Zoonoses in Denmark 2009
Trends and sources in human salmonellosis
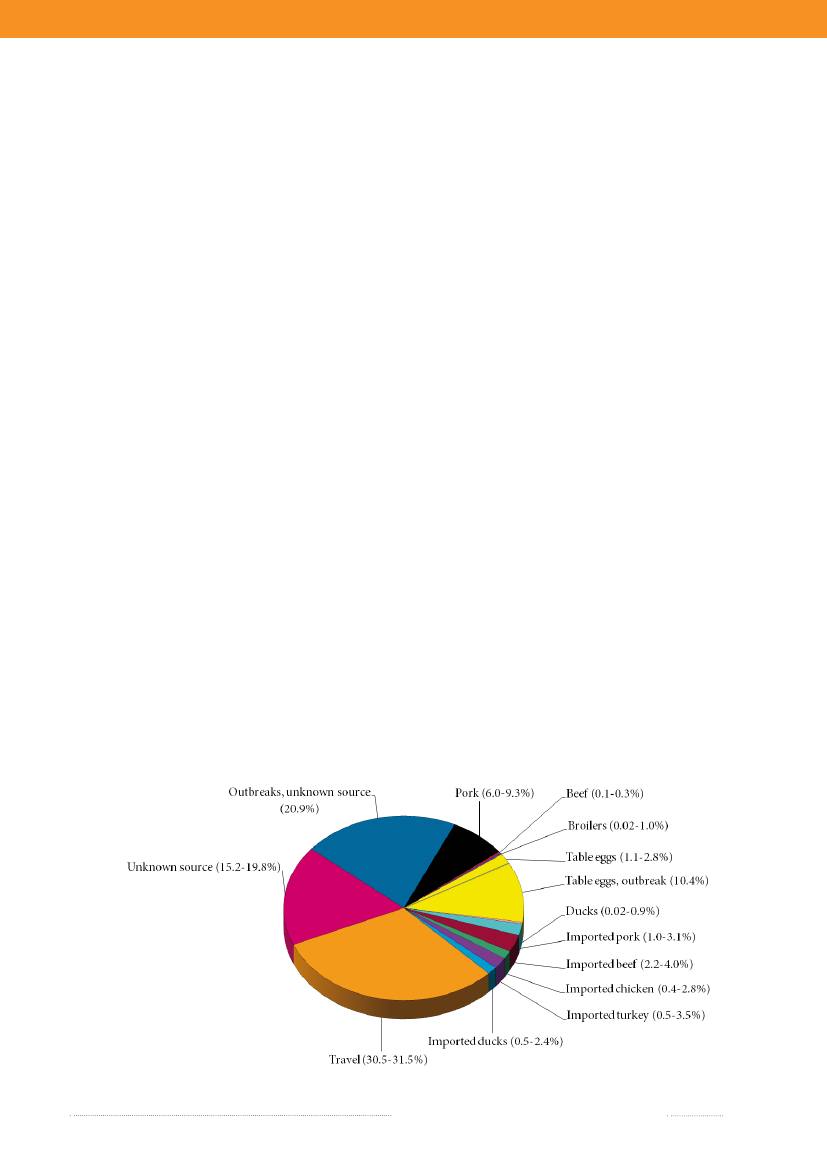
In 2009, the main sources to humanSalmonellain-fections were table eggs (12.3%), pork (7.6%), importedbeef (3.1%), imported pork (2.0%) and imported turkey(2.0%) (appendix A, Table A1). The remaining sourcescontributed to a minor proportion of human cases, and17.6% of human cases could not be attributed to anysource. The total estimated number of travel related caseswas 658 (30.9%) in 2009, which represents a decrease inthe number of cases compared with 2008 and 2007. Onepossible explanation for this decrease might be that Danestravelled less in 2009 compared with previous years (2).As in 2008, a relatively large proportion of the cases (445cases) was related to outbreaks with unknown source in2009, although it decreased more than three-fold compa-red with 2008 (1,447 cases). The number of cases relatedto outbreaks with unknown source was still very highin 2009 (appendix A, Table A1). The outbreak relatedcases were primarily due to sources of domestic origin.The relatively high importance of table eggs to humansalmonellosis this year is explained by the occurrence oftwo outbreaks, where eggs were identified as the causa-tive source (Figure 1.2 and chapter 2). Among sporadiccases, only 1.9% cases were attributed to table eggs, whichsuggests that this source is of relatively low importancefor sporadic salmonellosis when compared with otherfood sources. Pork was estimated to be an importantsource ofSalmonellain 2009 (7.6%), but the number ofcases attributed to this source decreased two-fold whencompared with 2008 (appendix A, Table A1). The highnumber of pork related cases in 2008 was partly due tofour outbreaks where pork was the source. There were noreported pork-related outbreaks in 2009. Around 10% ofallSalmonellainfections were attributed to imported pro-
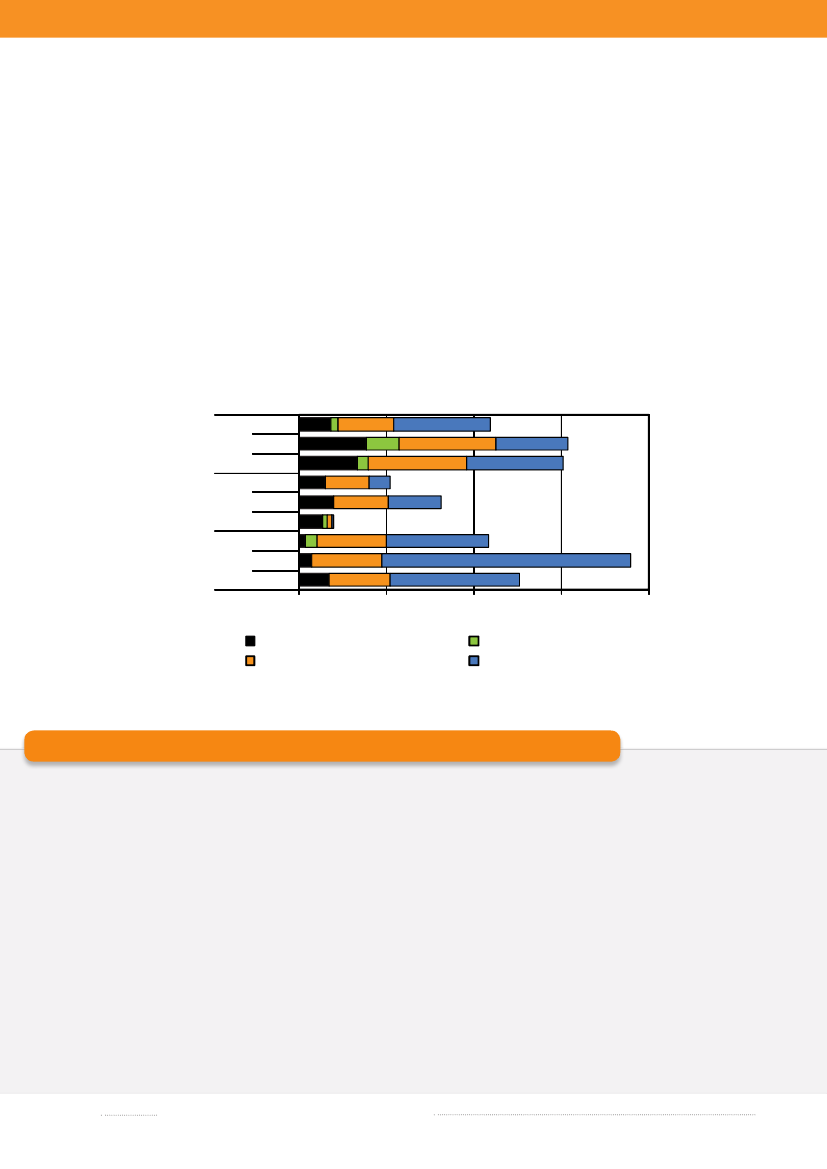
ducts with imported beef (3.1%) being the most importantimported source in 2009. The estimated number of casesattributed to this source increased by a factor five whencompared with 2008, whereas the contribution of otherimported sources was either unchanged or decreased.Surveillance data of imported duck meat was included inthe 2009 source account model, but this source had notbeen accounted for in the past two years, and thus esti-mates are not compared. The number of cases attributedto an unknown source decreased when compared withthe previous year. These cases may be caused by foods notincluded in the national surveillance (e.g. imported ordomestically produced fruits and vegetables), or by non-food sources of infection such as contact with pet animals.Of the 600S.Enteritidis cases, 43.8% were estimatedto be related to international travel and 38.1% of the caseswere associated with outbreaks. The number ofS.Ente-ritidis infections acquired abroad markedly decreasedwhen compared with 2008 (see box) and the number ofoutbreak-related cases increased 30 times due to the twolarge egg-related outbreaks (appendix B, Table A3). Amongthe 767S.Typhimurium cases, 55.8% were part of outb-reaks and 12.0% were estimated to be acquired abroad.Of theS.Typhimurium cases attributable to dome-stic products, the majority (53.6%) was caused by typessusceptible to all tested antimicrobials, 36.3% by typesresistant to one to three antimicrobial drugs, 6.3% by ty-pes resistant to quinolones, and 3.7% by types resistant tofour or more antimicrobial drugs (multi-resistant) (Figure1.3). 2009 was the third year in a row where the number ofcases with multi-resistant types has decreased. In contrast,there were several domestic cases with quinolone-resistanttypes in 2009. The majority ofS.Typhimurium infections
Figure 1.2. Estimated sources of 2,129 cases of human salmonellosis in Denmark, 2009(See also Appendix A, Table A1)
Source: Danish Zoonosis Centre, National Food Institute
Annual Report on Zoonoses in Denmark 2009
7
Trends and sources in human salmonellosis
attributed to imported food products was caused by resi-stant (48.2%) or multi-resistant (29.0%) types, no caseswas caused by quinolone-resistant types from importedproducts. Of travel relatedS.Typhimurium cases, 50.1%were caused by types susceptible to all tested antimicro-bials, 29.0% were caused by resistant types, 16.7% bymulti-resistant types, and 4.2% by types resistant to qui-nolones. This is different from 2008, where 73.2% of thetravel related cases were either resistant, multi-resistant orquinolones-resistant and only 26.8% were fully susceptible.In 2009, the total number of reportedSalmonellaca-ses was 2,129, corresponding to a decrease of nearly 60%compared with 2008, where the number of cases reacheda level not observed since the late 90’s, which was mainly
due to the very largeS.Typhimurium U292 outbreak.This outbreak and several other outbreaks continuedthroughout 2009, although at a lower level (see chapter2), but still resulting in a 16.6-27.8% increase in the to-tal number of cases compared with the year 2003-2007.References(1) Pires SM, Hald T (2009). Assessing the differen-ces in public-health impact of Salmonella subtypes usinga Bayesian microbial subtyping approach for sourceattribution. Foodborne Pathogens and Diseases, 7(2).(2) Pers. comm., Managing Director Lars Thykier,The Association of Danish Travel Agents and TourOperators.
Figure 1.3. Estimated sources of antimicrobial resistantaS.Typhimurium infections in humans, 2007-2009
200920082007200920082007200920082007040No. of cases80120Quinolone-resistant S. TmSusceptible S. Tm160
DK
Import
Travel
Multi-resistant S. TmResistant S. Tm
a) Resistant: Resistant to one to three antimicrobial drugs; Multi-resistant: Resistant to four or more antimicrobial drugs.Source: Danish Zoonosis Centre, National Food Institute
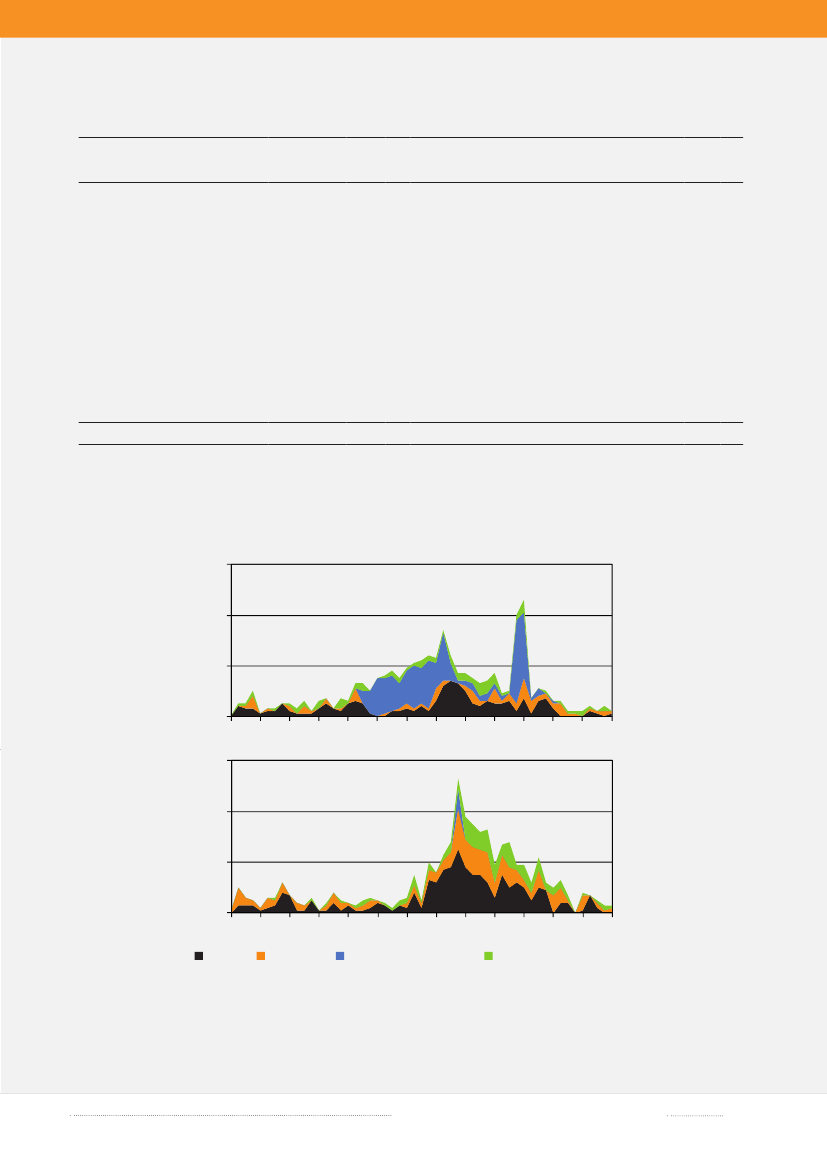
Where do we acquireSalmonellainfections?In 2009, as in 2008, Statens Serum Institut attempted to interview all registeredSalmonellacases where no travel in-formation was reported by the general practitioner. The patients were asked about the date of disease onset and whetherthey had travelled abroad within a seven-day period prior to disease onset. In 2009, information was obtained from atotal of 75% of theSalmonellacases. Among the cases with known travel history, 46% of theS.Enteritidis cases, 11%of theS.Typhimurium cases and 40% of cases with other serotypes were infected abroad. The group of other serotypescomprises considerable variation in terms of serotypes.In 2009, the distribution pattern of travel related and domestically acquiredSalmonellainfections was comparableto that of 2008 for most serotypes. However, forS.Enteritidis the percentage of cases acquired abroad decreased from61% in 2008 to 45% in 2009 (Table 1.1).During the summer months, a peak in the number ofS.Enteritidis cases is normally observed in Denmark. OtherEuropean countries also report a summer peak (2). However, in 2009 a summer peak was not seen and the large numberof cases in early summer and a peak in the autumn was mainly due to two outbreaks related to eggs (Figure 1.4 andchapter 2). FewerS.Enteritidis cases were acquired abroad during the summer months in 2009 compared with 2008(Figure 1.4). In 2009, Danes travelled to a lesser extend to destinations outside of Europe compared with previous yearsaccording to the travel industry (1). Within the EU, harmonizedSalmonellasurveillance programmes for the poultryproduction has been introduced and a decrease in the level ofSalmonellain the breeding and laying hen flocks wasobserved already in 2008. Hence, it must be expected that the general exposure toSalmonellais decreasing in the EU (2).
8
Annual Report on Zoonoses in Denmark 2009
Trends and sources in human salmonellosisTrends and sources in human salmonellosis
Table 1.1 Top 10Salmonellaserotypes in humans and place of infection, 2008-20092008S.TyphimuriumS.EnteritidisS. AgonaS.NewportS.O:4,5,12;H:i:-S.StanleyS.JavaS.InfantisS.SaintpaulS.VirchowOther serotypesTotalNumber ofpatients (%)2,002 (55)638 (17)71 (2)59 (2)57 (2)44 (1)40 (1)38 (1)36 (1)33 (1)638 (18)3,656 (100)% patients infectedaAbroad Domestically6.360.612.726.229.384.417.253.818.582.132.521.993.739.487.373.870.715.682.846.281.517.967.578.12009S.TyphimuriumS.EnteritidisS.O:4,5,12;H:i:-S.DublinS.NewportS.VirchowS.AgonaS.infantisS.SaintpaulS.MuenchenOther serotypesTotalNumber ofpatients (%)767 (36)600 (28)77 (4)46 (2)42 (2)36 (2)27 (1)25 (1)23 (1)20 (1)466 (22)2,129 (100)% patients infectedaAbroad Domestically10.645.741.96.945.579.313.338.123.58.342.331.189.454.358.193.154.520.786.761.976.591.757.768.9
a) Patients with unknown travel information (26.4% of all patients in 2009 and 13.9% of all patients in 2008) were excluded from thepercent calculations.Source: Statens Serum Institut
Figure 1.4. Weekly distribution ofS.Enteritidis cases, 2008-200960No. of human cases
2009
40200160591317212529333741454953
No. of human cases
2008
402001Travel59 13Domestic17 21 25 29 33Outbreak related cases37 41 45 49 53Travel status unknown
Source: Statens Serum Institut
References(1) Pers. comm., Managing Director Lars Thykier, The Association of Danish Travel Agents and Tour Operators .(2) The Community Summary Report on Trends and Sources of Zoonoses, Zoonotic Agents and foodborne out-breaks in the European Union in 2008, EFSA Journal; 2010 8(1):1496.Annual Report on Zoonoses in Denmark 2009
9
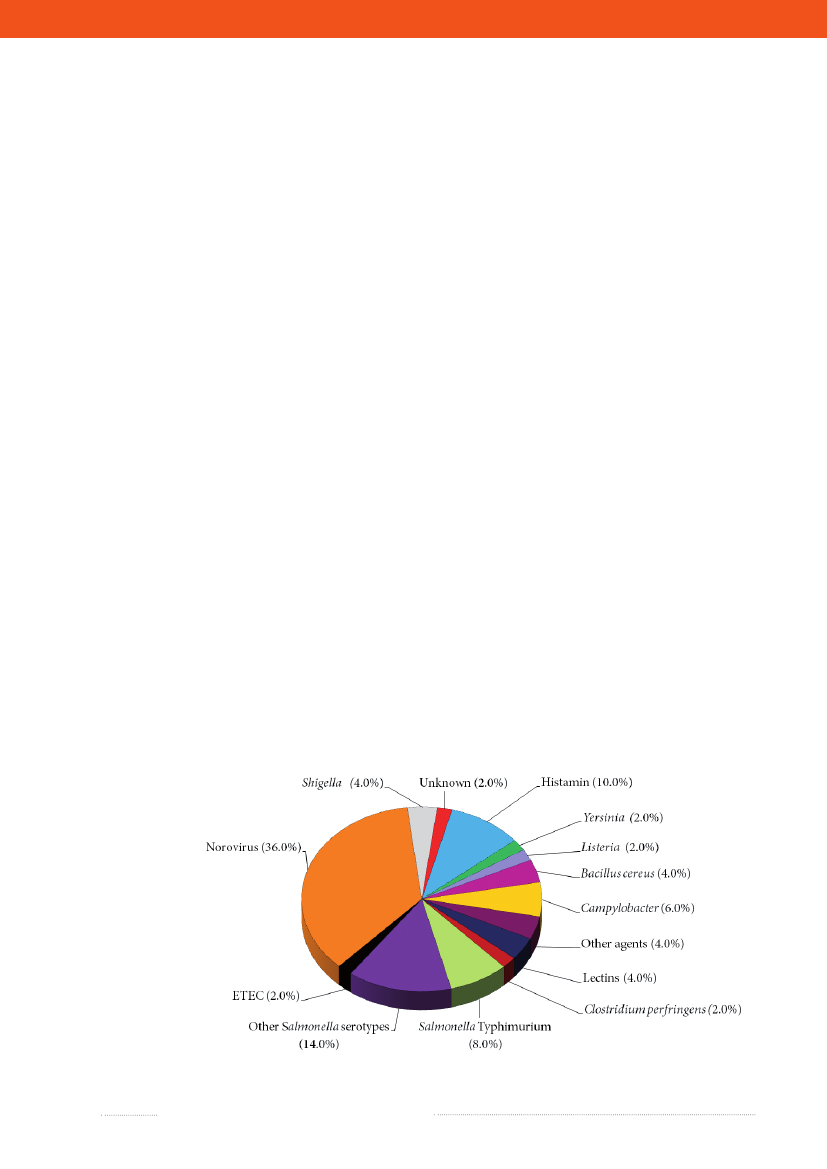
2. Outbreaks of special interestBy Steen Ethelberg ([email protected])In Denmark, foodborne outbreaks are investigatedby a number of different institutions, depending on thenature of the outbreak. Small local foodborne outbreaksare primarily handled by the Regional Veterinary andFood Control Authority. For larger local outbreaks, adhoc outbreak groups are formed in collaboration withthe medical officer and the relevant local laboratory.Large, cross-regional foodborne outbreaks are typicallyinvestigated by Statens Serum Institut, the National FoodInstitute, Technical University of Denmark and the DanishVeterinary and Food Administration. These institutionshave for several years been conducting weekly outbreak-response coordination meetings.Outbreaks are reported in the Food- and waterborneOutbreak Database (FUD). Outbreaks that occurred in2009 are presented in appendix B, Table A3. Householdoutbreaks and clusters that could not be verified as com-mon source outbreaks are not included in the table. Figure2.1 shows the relative distribution of these outbreaks bythe different pathogens that caused them. The reportingand outbreak investigation systems are described in furtherdetail in chapter 7.2. Some of the more notable outbreaksare outlined below.Outbreaks withS.Enteritidis have become rare inrecent years as a result of the successfulSalmonellacon-trol programs targeting the Danish egg layer and broilerproduction. Nevertheless, in 2009 two outbreaks causedby eggs occurred. One outbreak comprising 150 laboratoryconfirmed cases withS.Enteritidis phage type 8 occuredin the early summer (FUD no. 891, appendix B, Table A3).Interviews with cases revealed that several of the caseshad become ill after eating in small groups at differentrestaurants, and trace-back of the suppliers of eggs to theserestaurants pointed to one specific egg producer. Uponinvestigation,S.Enteritidis phage type 8 with a matchingMLVA type was recovered from the egg producer. Fol-lowing withdrawal of the eggs, the outbreak stopped (1).The second outbreak was caused by eggs contaminatedwithS.Enteritidis phage type 13a, originating from a singleproducer. The eggs gave rise to a general outbreak, whichwas detected as an increase in human cases in the period(FUD no. 917) and to an outbreak confined to participantsin a large swimming competition during a weekend inSeptember (FUD no. 928). In the latter outbreak, 86 caseswere identified from a cohort study and 42 cases werelaboratory confirmed. A trace-back investigation of eggsused by caterers at the swimming competition helped tolocate the producer. PositiveSalmonellatest results from
Figure 2.1. Aetiology of foodborne disease outbreaks reported with a causative agent in the Food- andwaterborne Outbreak Database (FUD), 2009. Percentage of total outbreaks indicated in brackets
Source: Statens Serum Institut
10
Annual Report on Zoonoses in Denmark 2009
Outbreaks of special interest
the premises resulted in a recall of all eggs that were po-tentially delivered by this producer.An outbreak withListeria monocytogenesoccurred inthe beginning of the year (FUD no. 887). The outbreak wasdetected by use of PFGE typing of patient isolates referredto Statens Serum Institut. It comprised eight cases; all wereelderly, two died. All cases received food from a meals-on-wheels service catering for senior citizens and the sourcewas found to be a specific dish containing beef, which wasmeant to receive final heat treatment by microwave ovenin the homes of the costumers (2).A large waterborne outbreak took place in June in atown with approx 5,000 inhabitants south of Copenhagen(FUD no. 900). A total of 39 cases ofCampylobacter jejuniwere laboratory confirmed and there was an estimated500 cases in total based on results from a questionnairestudy performed by Statens Serum Institut in which alittle more than 1,000 inhabitants participated. The studyshowed a dose-response relationship between intake of tapwater and the risk of becoming ill. The likely cause of thecontamination was identified as a malfunctioning waterpipe installation which became contaminated followingheavy rainfalls.Two large and one smaller outbreak ofS.Typhimuriumwhich began in 2008 continued into 2009. The unusuallylarge outbreak withS.Typhimurium phage type U292(FUD no. 788, see Annual Report on Zoonoses 2008 formore imformation) gave rise to 228 laboratory confirmedcases in 2009 and an outbreak with another rare phagetype,S.Typhimurium DT 135 (FUD no. 854), accountedfor 90 laboratory confirmed cases. TheS.TyphimuriumDT 3 outbreak resulted in 30 cases in 2009 (FUD no.883). These outbreaks, in particular the U292 outbreak,was the subject of intense investigations in both 2008 and2009 (3), however, the sources of the outbreaks were notfound and only a very small number of new cases wereseen towards the end of 2009. The U292 outbreak gave riseto 1,452 cases over both 2008 and 2009 and appeared tobe largely confined to Denmark. The epidemiology of the
outbreak was complex and towards the end of the outbreakperiod, the main hypothesis remained that the outbreakwas caused by a series of different foods and originatedfrom a pig reservoir.Finally, it should also be mentioned that foodborneoutbreaks also occurred as a result of infections withnon-zoonotic agents. As in previous years, norovirus wasthe single most frequent disease agent in the registeredout-breaks (appendix B, Table A3). Of the 52 reportedfoodborne outbreaks in 2009, norovirus accounted for 18with a total of 626 registered cases. These outbreaks weregenerally a result of contamination events associated withworkplace lunch buffets, restaurants and private parties.Several of these outbreaks followed gastrointestinal symp-toms in persons preparing the food. Another non-zoonoticdisease outbreak was caused byShigella sonnei.A total often laboratory confirmed cases were caused by consump-tion of contaminated sugar peas imported from Africaand cases also occurred in other European countries (4).References(1) Statens Serum Institut (2009): EPI-NEWS, week36.(2) Smith B, Larsson JT, Lisby M, Müller L, MadsenSB, Engberg J, Bangsborg J, Ethelberg S, Kemp M. 2010.Outbreak ofListeria monocytogenescaused by Beefmeat from a Meals-on-Wheel’s delivery, Denmark 2009.Clin. Microbiol. Infect. In press, doi: 10.1111/j.1469-0691.2010.03200.x(3) Ethelberg S, Wingstrand A, Jensen T, Sørensen G,Müller L, Nielsen EM, Mølbak K (2008). Large ongoingoutbreak of infection withSalmonellaTyphimuriumU292 in Denmark, February-July 2008. Euro Surveill13(28).(4) Muller L, Jensen T, Petersen RF, Molbak K, Ethel-bergS.Imported fresh sugar peas as suspected source ofan outbreak ofShigella sonneiin Denmark, April-May2009. Euro Surveill 2009;14(24).Annual Report on Zoonoses in Denmark 2009
11
Outbreaks of special interest
3.Listeriain DenmarkBy Annette Perge ([email protected]), Steen Ethel-berg, Eva Møller Nielsen and Hanne RosenquistListeriosis is a serious, food borne infection caused byListeria monocytogenes.It is a ubiquitous bacterium thatcan be transmitted via food. Exposure may lead to invasivelisteriosis in predisposed individuals. Classical risk factorsfor invasive listeriosis include pregnancy, old age, malig-nancies, diabetes, alcoholism and diseases or treatmentsleading to an impaired immune response. The diseaseprimarily manifests as sepsis, meningitis or materno-fetalinfections. The population at risk is in particular elderly,immune-suppressed individuals and the case-fatality rateis 20-30%.In 2009, the number of listeriosis cases almost doubledin Denmark compared with 2008, from 57 cases in 2008 to97 cases in 2009 (1). However, even before this increase,Denmark had one of the highest listeriosis incidences inEurope (2,3). To seek explanations for the increase in 2009,a working group was formed to study the Danish surveil-lance and monitoring data. A summary of this work ispresented below. Scientists from Statens Serum Institut,the Danish Veterinary and Food Administration, and theNational Food Institute, Technical University of Denmarkwere part of the working group.In 2009, the number of cases increased by 90% comparedwith the previous year (Figure 3.1). There were 97 notifiedcases of invasive listeriosis, which corresponds to an over-all incidence of 1.8 per 100,000 inhabitants. This is muchhigher than the incidences of 0-1.3 per 100,000 inhabitantsfrom other EU Member States in previous years (2,3,4).PFGE-typing revealed 51 different PFGE-types amongthe 97 isolates. The most common type, with 16 isolatesscattered over the year, was also commonly reported inprevious years, representing 21% of the isolates in 2006-9.In the spring of 2009, a verified outbreak included eight ca-ses with a PFGE-type not previously reported in Denmark(see chapter 2). In the autumn of 2009, a cluster of sevencases was identified, but it was not possible to establish thiscluster as an outbreak. The PFGE-type of this cluster is afairly common type represented by 2 to 5 cases per year inprevious years. Disregarding these 15 possible outbreak-related cases, the incidence was still comparatively high,at 1.5 per 100,000 inhabitants.Of the 97 cases, 55% was female, 85% was 60 years orolder and 32% was 80 years or older. There were threematerno-fetal cases (3%), 18 cases (19%) presented withmeningitis, 73 cases (75%) presented with sepsis and threecases (3%) had other kinds of infections. The relative di-stribution of the manifestations is not markedly differentfrom previous years (Figure 3.1). The fact that the increasein cases is seen both for sepsis and meningitis cases mayindicate that the rise is not solely due to an increased rateof analyses or notifications.As can be seen from Figure 3.1, there has been a gene-rally increasing trend in listeriosis since 2003.
3.1 Human casesIn Denmark, culture-confirmed cases of listeriosis arenotifiable by clinical laboratories to Statens Serum Institut.The isolates are send to Statens Serum Institut for PFGEtyping as part of the outbreak surveillance.
Figure 3.1. Number of notified cases of invasive listeriosis 2003-2009, divided into the major manifestations100
Number of cases
8060402002003Sepsis200420052006200720082009Maternal-foetalMeningitisOther/unknown
Source: Statens Serum Institut
12
Annual Report on Zoonoses in Denmark 2009
Listeria in DenmarkOutbreaks of special interest
Table 3.1. Presence ofListeria monocytogenesin foodstuffs (Centrally coordinated projects 2003-2010)YearProduct categoryAnalysisNumber ofsamples997Number ofpositivesamples14Quantitative level(L.monocytogenes(L.m.) per g)All positive samp-les had less than 50L.m. per g
2003
Meat products, heattreated, long shelflife,- at start and at endof shelflifeSmoked/gravad fish,- at start and at endof shelflifeRTE green saladswith fish/shellfish ormeat1Pasteurized cheesea
Qualitative andquantitative
2004
QualitativeQuantitativeQuantitative
1,3441,311130
137131
1 positive samplehad more than 100L.m. per g1 positive samplehad more than 100L.m. per g
2005
20052005
Qualitative
269 (50 batches)624140 (14 batches)
0023 (4 batches)All positive samp-les had less than 10L.m. per gAll samples hadless than 10 L.m.per gAll positive samp-les had less than100 L.m. per g
Milk, cream, conven- Qualitativetional and organic
2009-2010 Smoked/gravad fishb, Qualitative and- at start and at endquantitativeof shelflife2009-2010 Prepared dishesbQualitative andquantitativeQuantitative
12192389 (79 batches)
0126 (3 batches)
2009-2010 Fermented sausagesb
a) EU coordinated projects.b) Preliminary results. The projects are ongoing.Source: National Food and Veterinary Administration and National Food Institute
3.2 Food and consumptionSince 2006, the EU Regulation on microbiologicalcriteria1has been in force. The Regulation distinguishesbetween products supporting growth ofL. monocytogenesand products not supporting growth. All ready-to-eat(RTE) products are covered and the maximum limit valueat the end of shelflife is 100 colony forming units (cfu)L.monocytogenesper gram.According to the EU Hygiene Regulation2, food busi-ness operators shall implement and maintain proceduresbased on HACCP principles3in order to ensure the safetyof their products. The microbiological criteria forL. mo-nocytogenesshould be used for validation and verification1. Regulation (EC) No 2073/2005 of the Commission of 15November 2005 on Microbiological criteria for foodstuffs withamendments2. Regulation (EC) No 852/2004 of the European Parliamentand of the Council of 29 April 2004 on the hygiene of food-stuffs with amendments3. HACCP: Hazard analysis and critical control point
purposes, and the food business operators must decidethe necessary sampling and testing frequencies as part oftheir HACCP based procedures. Food business operatorsproducing products in whichL. monocytogenescan growshould also carry out environmental testing forL. mono-cytogenesand perform shelflife studies.The competent authority is obliged to control the foodbusiness operator’s compliance with the criteria laid downin the legislation. Official sampling forL. monocytogenesis carried out either in the form of centrally coordinatedlaboratory projects or as part of the regional food inspec-tors’ control of individual establishments (see chapter 7 formore details about the sampling). Centrally coordinatedprojects are planned for one year at a time and the inve-stigated products change between years in order to sampleall risk products over the years. Table 3.1 shows the resultsof these projects for the period 2003-2010. In total, morethan 4,000 samples have been tested and only two sampleswere above 100 cfuL. monocytogenesper g.
Annual Report on Zoonoses in Denmark 2009
13
Listeriain Denmark
Table 3.2.Listeria monocytogenesin RTE-productsa,2005-2009No. ofPositive10-100> 100samples samplesCFUb/g CFUb/g200520062007200820091,0181,2281,5771,84424413351312531877039220
a) Samples taken as part of the control of individual food pro-ducing establishments (qualitative and quantitative tests).b) CFU: Colony forming unitsSource: National Food and Veterinary Administration andNational Food Institute
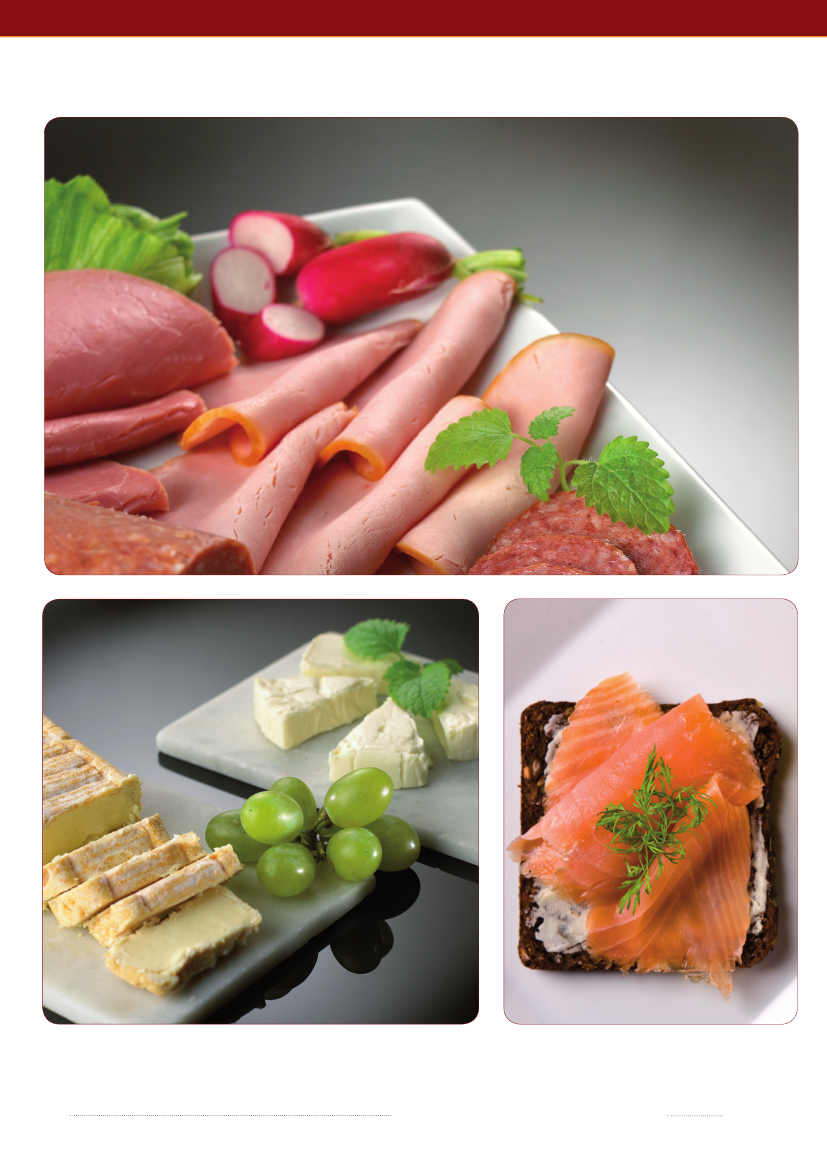
increased in the elderly population, this age group hasbecome more exposed toL. monocytogenes.The dietarysurveys conducted at the National Food Institute show thatelderly above 65 years of age have had a steadily increasedconsumption of cold-smoked fish, semi-soft cheeses andcooked, smoked ham within the period 2000-2007. Hence,the elderly are increasingly exposed to RTE products andtherebyL. monocytogenesand this may in theory explainpart of the increasing trend in human listeriosis 2003-2007.However, the data from the dietary survey cannot explainthe increase in human listeriosis from 2008 to 2009.
3.3 ConclusionWith reference to the available data, the substantialincrease in human listeriosis from 2008 to 2009 cannotbe explained. A number of possible explanations can beput forward; changes in the susceptibility in the elderlypopulation, changes in the exposure toL.monocytogenesinfood, but there is no evidence to explain why this increasehas occurred.References(1) Jensen AK, Ethelberg S, Smith B, Nielsen EM, Lars-son J, Mølbak K, Christensen JJ, Kemp M (2010) Substan-tial increase in listeriosis, Denmark 2009. Eurosurveillance15 (12) article 4.(2) European Centre for Disease Prevention and Con-trol: Annual Epidemiological Report on CommunicalDiseases in Europe 2009.(3) European Centre for Disease Prevention and Con-trol: Annual Epidemiological Report on CommunicalDiseases in Europe 2008.(4) The Community Summary Report on Trends andSources of Zoonoses, Zoonotic Agents and food-borneoutbreaks in the European Union in 2008, EFSA Journal;2010 8(1):1496..
The Regional Veterinary and Food Administration maydecide to sample and analyze forL. monocytogenesas partof the official control of individual food establishments, e.g.for products not covered by centrally coordinated projectsor in case of suspicion of contamination, consumer com-plaints or foodborne diseases. The results of the officialcontrol of RTE products for the period 2005-2009 aresummarized in Table 3.2. The investigated RTE productswere primarily milk and milk products, meat products, fishproducts, vegetables including sprouts, prepared dishesand dressings. A smaller number of samples was analysedin 2009, partly because a relatively higher portion of thesamples were collected as part of centrally coordinatedprojects. All samples with more than 100 cfuL. monocyto-genesper gram were meat products. In 2006, 8 of 9 sampleswith more than 100 cfuL. monocytogenesper gram wereunripened spreadable sausages.Additional information about the occurrence ofL. mo-nocytogenesin Danish RTE products can also be collectedfrom the EU rapid alert system for food and feed (RASFF).In total, four notifications, where the numbers ofL. mo-nocytogenesexceeded the limit for the microbiologicalcriteria, were announced for smoked salmon produced inDenmark during 2008 and 2009.The results of the official testing show thatL. monocy-togenescan be found in low levels in RTE products. Levelsabove 100L. monocytogenesper gram are only found in-frequently and only in meat products and in smoked fish.Within the last couple of years, there has been no increasingtrend in the number of official samples exceeding the ac-ceptable level ofL. monocytogenes.Nor has there been anincrease in withdrawal of foods by food business operatorsdue to findings of unacceptable levels ofL. monocytogenesin their products as part of their own control procedures.The occurrence of high numbers ofL. monocytogenesin RTE products may not have increased over the last 5years, but if the consumption of this type of products has
14
Annual Report on Zoonoses in Denmark 2009
Listeria in DenmarkTyping methods
Annual Report on Zoonoses in Denmark 2009
15
Typing methods
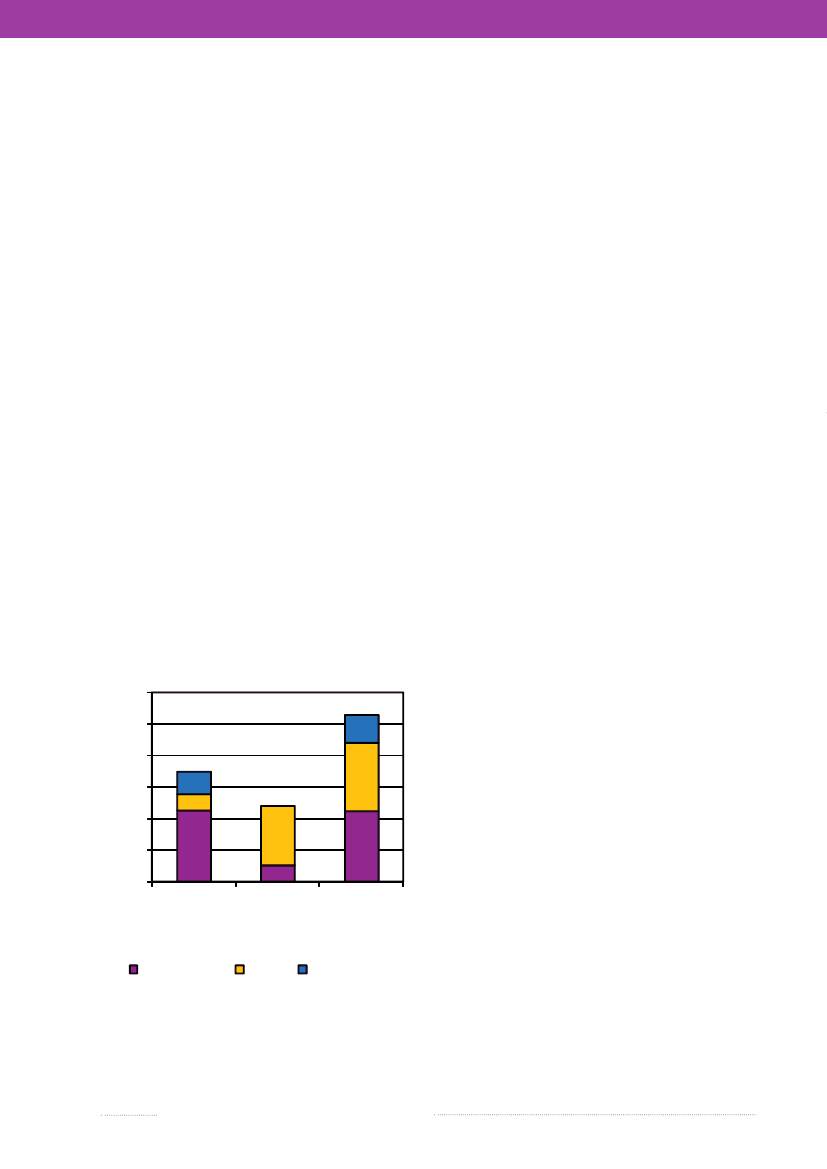
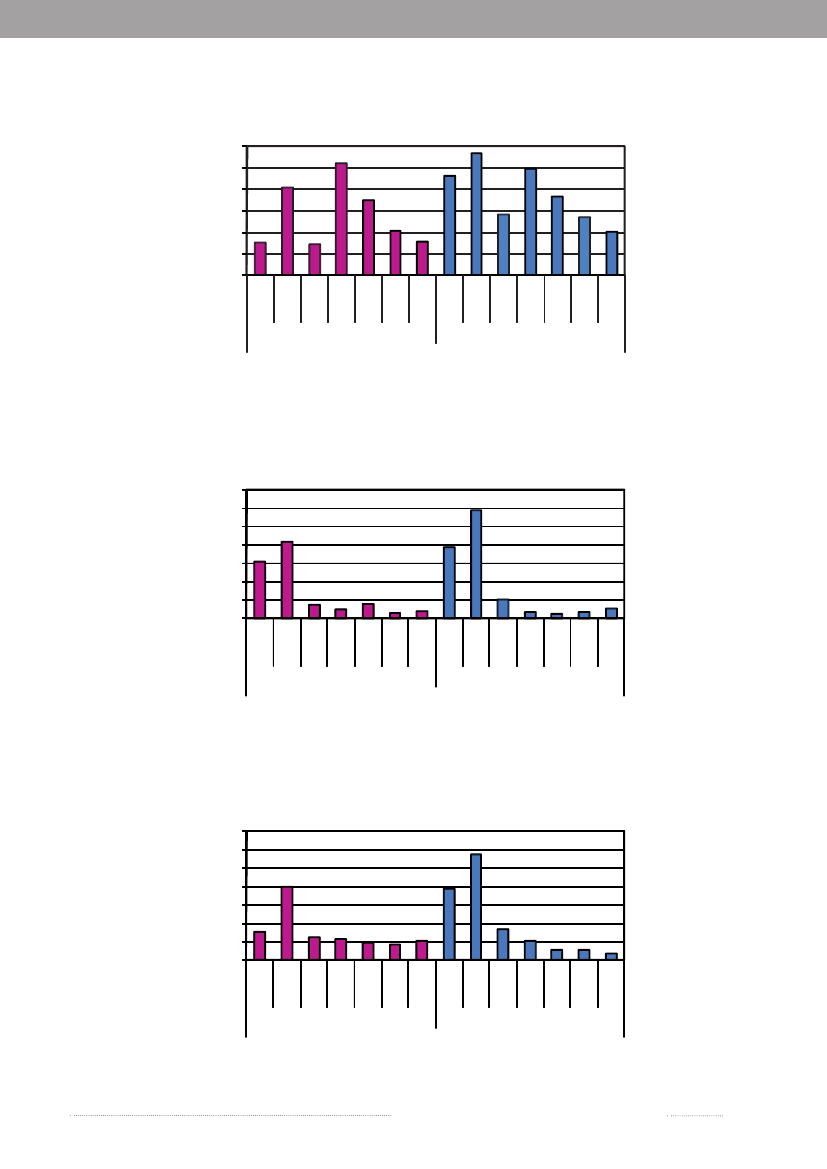
4.Salmonellain conventional andalternative slaughter pig productionBy Anne Wingstrand ([email protected]), AnnaI.V. Sørensen, Katrine Lundsby and Lars S. LarsenThe majority of all slaughter pigs in Denmark are pro-duced in conventional indoor production systems, howe-ver a couple of alternative pig production concepts exist,among which the organic slaughter pig production andthe production of non-organic free range pigs, both withaccess to outdoor pens, are the larger. The most importantrisk factors forSalmonellain the Danish conventional pigproduction are known to be:• Purchase of infected pigs• Feeding finely grinded pelleted feed• Feeding dry feed (vs. wet fermented feed)• Increasing herd size• Continuous production (vs. strict batch productionwith cleaning, desiccation and disinfection of thepens).In the alternative pig productions, the increased contactwith wildlife and the challenges associated with thoroughcleaning and disinfection of outdoor pens or pastures, areexpected to increase the exposure toSalmonella.However,very little research has been carried out within this fieldand only few comparisons between occurrence of zoonosesin the different Danish pig production systems have beendone. Therefore, a project (QUALYSAFE) was carried outin 2007-2008 to examine the difference inSalmonellapre-valence in conventional and non-conventional productionsystems and to identify common or specific risk factors fordifferent production systems.In total, 1,402 caecal samples collected from slaughterpigs from 52 organic herds, 27 non-organic free rangeherds and 145 conventional herds were examined bacterio-logically forSalmonella.Contrary to the expectations, theSalmonellaprevalence was found to be higher in samplesfrom conventional herds (10.7%) compared with samplesfrom non-organic free range herds (4.8%) (borderlinesignificant difference). The prevalence in samples fromorganic herds (7.0%) did not differ significantly from anyof these (Figure 4.1).Interviews were conducted with owners of the studiedherds, and the collected herd information was used for arisk factor study onSalmonellain slaughter pigs. It wasfound that use of well-knownSalmonella-reducingfeedingand management strategies in conventional herds hasincreased markedly over the last 10 years and was foundto be more commonly applied than in the alternative pigproductions. However, in all three production systemsimplementation of these strategies in more herds willprobably lead to a significant reduction in the occurrenceofSalmonellain slaughter pigs.In conventional herds, purchase of a large numberof pigs, larger herd size, the choice of feed components,use of feed containing finely ground grain and change offeed type from growers to finishers may partly explain thehigher prevalence ofSalmonella.In order to obtain a lowerprevalence, conventional herds should consider purchasingpigs fromSalmonellanegative herds, to increase the useof structure feed, to add organic acids to feed, to use feedwith a higher content of barley and to avoid change offeed during the growing and finishing period. The resultsfrom this study further indicate that the reduced risk ofSalmonellain the largest conventional herds is probablydue to the more common use of home mixed feed andfermented wet feed in these herds.
Figure 4.1.Salmonellaculture resultsain slaughterpigs from 52 organic herds, 27 free range herds and147 conventional herds.121086420Organic(N=485)S. TyphimuriumNon-organic Conventionalfree range(N=444)(N=476)S. DerbyOther Salmonella
a) A proportion ofS.Typhimurium in organic herds andS.Derby in non-organic free range herds were from few high-shedding herds.Source: National Food Institute
16
% culture positive caecal samples
Annual Report on Zoonoses in Denmark 2009
Salmonella in the slaughter pig production
Non-organic free range herds are relatively large andpurchase pigs almost to the same extent as conventionalherds. Despite their less frequent use ofSalmonella-reducing feeding and management strategies, the lowestSalmonellaprevalence was detected in the non-organicfree range herds. This may partly be explained by the useof more barley in the feed, use of coarse feed structure incommercial feed and fewer herds changing feed betweenthe growing and the finishing period.Organic herds are considerably smaller and more oftenfarrow-to-finisher productions compared with non-orga-nic free range herds and conventional herds. In particularpurchase of fewer pigs, along with a more frequent useof organic acids in the feed and coarser grinding of grain
for home mixed feed, could be part of the explanationfor the lower occurrence ofSalmonellain organic herdscompared with conventional herds. Compared with thenon-organic free range herds, a larger proportion of theorganic herds changed the feed from growers to finishers,and their use of barley and high structure in commercialfeed was more limited.Some of these measures are new and need further in-vestigation prior to implementation in herds, but overallthere seems to be a potential for further reduction ofSal-monellain slaughter pigs in all three herd types. Importantbarriers are the direct or indirect expenses associated withimplementation of the suggested control measures.
Annual Report on Zoonoses in Denmark 2009
17
5.Campylobacterin meat fromorganic and conventional broilersBy Anne Louise Krogh ([email protected]),Louise Boysen and Hanne RosenquistThe Danish action plan againstCampylobacterinitiatedin 2008, requested information on theCampylobacterlevelin free range and organic broiler meat as an addition tothe existing surveillance ofCampylobacterin conventionalbroiler meat (for more information, see Annual Report2007, Chapter 2). A project financed by the special gua-rantees forSalmonellaandCampylobacterinvestigated thelevel of thermotolerantCampylobacterin organic broilermeat produced in Denmark in 2009-2010.In Denmark, free range and organic broilers constituted0.025% of the broiler production in 2009. Around 10,000organic birds are slaughtered on a yearly basis. Free rangebroilers are only produced by a small number of pro-ducers of non-commercial size. Therefore, only organicbroiler meat was included in the investigation as it wouldbe impossible to collect enough free range samples forstatistical analysis.Previously, it was shown that the prevalence ofCam-pylobacterwas higher in organic broilers compared withconventional broilers; 100% and 37%, respectively (1).However, in relation to estimating the risk of illness fromdifferent meat types and deciding upon risk managementinitiatives for specific branches of production, informationon the percentage of positive meat samples as well as thelevel of contamination will have to be available. The higherprevalence in organic broilers compared with conventionalbroilers may be due to the fact that organic broiler flocks arerequired to have access to outdoor premises and thereforeFigure 5.1. PercentCampylobacterpositiveorganic and conventional broiler meat samplesa,April 2009-March 2010% samples > 10 cfu/g100%80%60%40%20%0%12OrganicQuarter34Conventional
are exposed to natural sources ofCampylobacter.Further-more, organic broilers are older than conventional broilersat slaughter, which is a risk factor; the longer the exposuretoCampylobacter,the higher the risk of colonization.Danish produced organic fresh chilled meat was ana-lysed for the number of thermotolerantCampylobacterby the National Food Institute. The investigation was car-ried out from April 1st2009 to March 31st2010. Duringthis period, four carcasses from each slaughtered organiccommercial broiler flock were collected by the industry. Intotal, 208 carcasses, representing 52 organic broiler flocks,were collected and analysed quantitatively according to theNMKL method (draft August 2004) used in the currentsurveillance of broiler meat at slaughterhouses. Figure 5.1shows the percentage of organic and conventional meatsamples with more than 10Campylobacterper gram. Theconventional broiler meat included was part of the currentsurveillance ofCampylobacterat two large slaghter housesin Denmark. It was chilled meat with skin collected duringthe same period as the organic meat.On average, 66% of chilled organic broiler meat sampleswereCampylobacterpositive compared with 30% of thechilled conventional broiler meat samples (adjusted forseason). Seasonal variation in the percentage ofCampy-lobacterpositive samples was seen from both productionsystems (Figure 5.1). As regards the average numbers ofCampylobacterin the samples from positive flocks, no dif-ference was observed between organic and conventionalbroiler meat. For the organic samples the averageCampy-lobacterconcentration was 1.9 � 0.7 log cfu/g and for theconventional broiler meat it was 1.9 � 0.8 log cfu/g.Isolates from 84% of the positive flocks were speciatedusing PCR; 74.2% of the isolates wereC. jejuni,6.5% wereC. coli,and 19.3% were a mixture of the two species. This isvery similar to results from the surveillance of conventionalbroiler meat (appendix C, Table A13).In conclusion, the survey showed that Danish producedchilled organic broiler meat was more often contaminatedwithCampylobacterthan Danish produced chilled con-ventional broiler meat. However, there was no statisticallysignificant difference in the average number ofCampylo-bacterin meat produced by the two production systems.References1) Heuer, O.E., K. Pedersen, J.S. Andersen & M. Mad-sen, 2001. Prevalence and antimicrobial susceptibility ofthermophilicCampylobacterin organic and conventionalbroiler flocks. Letter in Applied Microbiology 33: 269-274.
a) The lines indicate the standard deviation.Source: National Food Institute
18
Annual Report on Zoonoses in Denmark 2009
Campylobacter in the broiler production
Annual Report on Zoonoses in Denmark 2009
19
6. EU related topics6.1Trichinella- special statusIn July 2007, the European Commission and theother Member States assigned Denmark status as aregion where the risk ofTrichinellain domestic swine isofficially recognised as negligible (EU Regulation (EC)No 2075/2005).As a result of this status, the future monitoringprogramme forTrichinellamay be risk based. Slaugh-ter pigs reared under controlled housing conditions inintegrated production systems do not have to be testedforTrichinella.All other categories of pigs and otherspecies (domestic or game) which can become infectedwithTrichinellawill be examined in accordance with themethods laid down in Regulation (EC) No 2075/2005.Further, pork exported to third market countries will betested forTrichinellaunless the importing country ac-cepts the new monitoring programme.In order to fulfill the requirements set out by theRegulation, a monitoring programme forTrichinellainwildlife must be in place. Such a programme was initi-ated in 2008. In total, approximately 300 foxes and 50other carnivores will be examined annually. In 2009, noTrichinellawas found in Denmark.Salmonellaprevalence in laying hens, broilers, broilercarcasses, turkeys, breeding pigs and slaughter pigs, oftheCampylobacterprevalence in broilers and broilercarcasses and of methicillin-resistantStaphylococcusaureus(MRSA) in breeding pigs. The objectives of thestudies are to generate comparable prevalence data fromall Member States with the purpose of setting commonEU targets for the reduction of the pathogen in question.The sampling schemes and methods used in the studiesare harmonized, and in 2008 two baseline studies werecarried out. No baseline studies were carried out in 2009.The prevalence results from the 2008 studies arepublished on the EFSA website (www.efsa.europa.eu)and analysis of the risk factors will be published at thesame site in 2010.Baseline study on the prevalence ofSalmonellainbreeding, multiplying and sow herds at the farmIn 2008, a study on theSalmonellaprevalence wasperformed where pen faecal samples were collectedfrom 95 breeding and multiplier herds and from 198sow herds. A total of 10 pen samples were collected fromeach herd. One sample represented at least 10 pigs.In breeding and multiplier herds, the prevalence ofSalmonellain Danish herds was 41%, while the EU pre-valence was 29% ranging from 0% to 64% positive herdsin Member States.In sow herds, 41% of the Danish herds were positivecompared with an EU prevalence of 33%. The prevalencein the Member States ranged from 0% to 56%.The most frequent serotypes in Danish herds wereS.Derby (39% of isolates and 29% of positive herds),S.Typhimurium (21% of isolates and 29% of positiveherds) andS.Infantis (13% of isolates and 14% of posi-tive herds).Baseline study on the prevalence ofSalmonellaandCampylobacterin broilers and on broilercarcasses at slaughterFor the study onCampylobacterandSalmonellainbroilers at slaughter, each Member State was required tosample 384 batches at slaughter. From each randomly se-lected batch, intact caecums with content from 10 rand-omly selected broilers were collected for the detectionofCampylobacter.In addition, one whole carcass wascollected from each of the 384 batches for the detectionand enumeration ofCampylobacterand for the detectionofSalmonella.
6.2 Control of zoonoses in animalpopulations - EU baseline studiesBased on the Zoonosis Directive 2003/99/EC andRegulation (EC) 2160/2003 the Commission has so farinitiated eight EU-studies – the baseline studies - of the
20
Annual Report on Zoonoses in Denmark 2009
EU related topics
In total, 396 Danish flocks were tested andSalmonellawas not detected in any of the flocks. The EU prevalencewas 16%, ranging from 0% to 86% in Member States.Campylobacterwas detected in 76 of 396 Danishbroiler flocks corresponding to a prevalence of 19%. Inthe EU, the prevalence in broiler flocks ranged from 4%to 100%, with an average of 71%. Further, 31% of theDanish broiler carcasses were positive forCampylobacter.The prevalence ofCampylobacteron broiler carcassesin Member States ranged from 5% to 100% with an EUprevalence of 76%.EU harmonised surveillance programmesIn 2009, Member States were for the first time obligedto report the prevalence in broiler flocks according tothe Regulation (EC) 2160/2003. The EU target of 1% forflocks positive withS.Typhimurium andS.Enteritidis isbased on the results of the EU baseline study carried outin 2005-2006 and decided by the Commission in 2007(Regulation (EC) No 646/2007) (See Annual Report 2007for an overview of Danish results). This target has to bereached by December 31st2011. Denmark has had inten-siveSalmonellacontrol programmes for many years andthe target of 1% has already been reached. In 2009, 0.3%of the broiler flocks were positive withS.Typhimuriumand no flocks were positive withS.Enteritidis.For all breeding flocks ofGallus gallus,the target of1% positive adult flocks for the fiveSalmonellaserotypesTyphimurium, Enteritidis, Infantis, Virchow and Hadarhad to be reached by December 31st2009 (Regulation(EC) 1003/2005). The Regulation does not differentiatebetween the table egg and broiler production lines andthree (1.2%) adult breeding flocks were positive with oneof the five serovars in 2009 (appendix C, Table A8 andA10).The EU baseline survey on table egg laying flocksshowed very large differences in the prevalence betweenMember States. Therefore, a yearly reduction target hasbeen set dependant on the prevalence of positive flocksin the member state the previous year (Regulation (EC)1168/2006). Member States with high prevalences havethe highest reduction requirements. The target is set forS.Typhimurium andS.Enteritidis, only. For MemberStates with a prevalence below 10% the prevalence shouldbe reduced by 10% annually or to a maximum of 2%flocks positive withS.Typhimurium andS.Enteritidis. InDenmark, a target of maximum 2% table egg layer flockspositive forS.Typhimurium andS.Enteritidis has to bereached by December 31st 2011. Since 2004, Denmarkhas had 1% or less positive flocks, however in 2009, 1.7%of the flocks were positive (appendix C, Table A8).
Annual Report on Zoonoses in Denmark 2009
21
7. Surveillance and controlprogrammes7.1 Surveillance of human diseasePresented in this report is the occurrence of zoonoticenteric pathogens in Denmark:• Notifiable through the laboratory surveillance system:Salmonella, Campylobacter, Yersinia,Verocytotoxin-producingE. coli(VTEC) andListeria• Individually notifiable zoonotic pathogens:Chlamydiapsittacci(ornithosis),Leptospira, Mycobacterium,Bo-vine Spongieform Encephalopathy (BSE) prions (var.Creutzfeldt-Jakob Disease), Verocytotoxin-producingE. coli(VTEC) andLyssavirus(rabies)• Non-notifiable zoonotic pathogens:Brucella, Crypto-sporidium, Echinococcus, ToxoplasmaandTrichinella.An overview of these notifiable and non-notifiablehuman diseases is provided in appendix D, Table A29.In Denmark, the physicians report individually noti-fiable zoonotic diseases to the medical officers and the De-partment of Epidemiology at Statens Serum Institut (Figure7.1). Positive cases diagnosed by a clinical microbiologicallaboratory are reported through the laboratory surveil-lance system to the Unit of Gastrointestinal Infections atStatens Serum Institut. Physicians send specimens fromsuspect cases to one of 15 clinical microbiology laborato-ries depending on county of residence of the requestingphysician. The laboratories must report positive results toStatens Serum Institut within one week. Furthermore, allSalmonellaand VTEC isolates are sent to the referencelaboratory at Statens Serum Institut for further sero- andgenotyping. TheSalmonellapositive isolates are sent to theNational Food Institute, Technical University of Denmarkfor phage typing (see appendix D, table 37 for more detailedinformation on typing methods). The results are recorded
Figure 7.1. Overview of the monitoring and outbreak investigation network for reporting infectious patho-gens in humans, animals, foodstuffs and feedstuffs in DenmarkMinistry of Food,Agriculture and FisheriesDanish Veterinary and Food AdministrationDanish AlertUnit for Food
Ministry of the Interior and HealthNational Board of Health &5 Regional Medical Officers of HealthGeneral Practitioners & Hospitals
&
3 Regional Veterinary & Food Control Authorities
Statens Serum Institut (SSI)
Clinical Microbiology Laboratories
Danish Plant Directorate
Ministry of Science,Technology and InnovationTecnical University of Denmark
Ministry of theEnvironmentDanish Environmental Protection Agency
Industry
National Food InstituteDanish Zoonosis Centre
Non-governmental Organisation
Source: Danish Zoonosis Centre, National Food Institute
22
Annual Report on Zoonoses in Denmark 2009
Surveillance and control programmes
Highlights from the critical review of the DanishSalmonellainitiativesThe human incidence of salmonellosis in Denmark increased markedly in 2008 to more than twice the level reportedin previous years. The majority of the rise was caused by an unusual largeSalmonellaTyphimurium U292 outbreak (seeAnnual Report 2008 for more information) and other large outbreaks, but there was also an increase in the number ofsporadic cases.Due to this unusual situation, The Danish Veterinary and Food Administration performed a critical review of all theDanishSalmonellacontrol programmes as well as other initiatives. The review was prepared by a working group withparticipants from Statens Serum Institut, The Danish National Board of Health, Danish Agriculture and Food Council,Copenhagen University Faculty of Life Science, The National Food Institute, Dianova and The Danish Veterinary andFood Administration.The review resulted in a report which contained 14 recommendations for future initiatives. It was concluded thatthe ongoing programmes in the poultry and cattle sectors were efficient as well as sufficient. The proposed initiativesinclude among others:•New measures in the control programme for pigs and pork•Stronger focus on non-animal sources ofSalmonella•Improvements of theSalmonellasource account model and preparation of two source accounts annually•Mandatory typing ofSalmonellaisolates from own check programmes•Improvement of relevant measures, e.g. need for monitoring, guidance documents at meat productionplants and at retail.The report was published in October 2009 and is available in Danish at www.fvst.dk.
in the Register of Enteric Pathogens maintained by StatensSerum Institut. Positive cases are reported as episodes, i.e.each patient-infectious agent combination is only recordedonce in any six-month period. Overviews of results fromthe Register of Enteric Pathogens are presented as follows:• All laboratory confirmed human cases are presented inappendix B, Table A2• Incidence of human infections withSalmonellais pre-sented in appendix B, Figures A1-A3• Incidence of human infections withCampylobacterispresented in appendix B, Figure A4• Incidence of human infections with VTEC is presentedin appendix B, Figure A5• Incidence of human infections withYersiniais presentedin appendix B, Figure A6.Further, additional information on human infectionsare presented as follows:• TheSalmonellasero- and phage type distributions arepresented in appendix C, Tables A5-A7• VTEC O-group distribution in humans is presented inappendix B, Table A4.7.2 Outbreaks of zoonotic gastrointestinal infec-tionsIn Denmark, local foodborne outbreaks are typicallyinvestigated by the Regional Veterinary and Food ControlAuthority in collaboration with the medical officer; oftenwith the participation of the regional clinical microbiologylaboratory. Larger outbreaks involving more than one re-
gion are typically investigated by Statens Serum Institut,the National Food Institute and the Danish Veterinary andFood Administration. These institutions may also aid in theinvestigation of local outbreaks. Representatives from theseinstitutions meet regularly to discuss surveillance results,compare the reported occurrence of zoonotic agents in ani-mals, food and feedstuffs with that in humans, and reviewmajor outbreaks. The formal responsibility of investigatingfood- or waterborne outbreaks is currently divided betweenthree ministries based on the outbreak source: the Ministryfor the Interior and Health for infectious diseases; the Mini-stry of Food, Agriculture and Fisheries for food and animalrelated diseases; and the Ministry of the Environment (alongwith the municipalities) for water related diseases.Outbreaks may be detected in various ways. Individualswho experience illness related to food intake in settings suchas restaurants or work place cantinas may report these inci-dents directly to the Regional Veterinary and Food ControlAuthorities. Physicians are obligated to report all suspectedwater- and foodborne infections to the regional medical of-ficer, who then reports to Statens Serum Institut. Clusters ofcases may be noted in the laboratory or identified at StatensSerum Institut through the laboratory surveillance systemof gastrointestinal bacterial infections or through subtypingof bacterial isolates from patients.A list of verified outbreaks (not including householdoutbreaks) reported to the Food- and waterborne OutbreakDatabase (FUD) are presented in appendix B, Table A3 andsome of the more notable outbreaks are outlined in chapter 2.
Annual Report on Zoonoses in Denmark 2009
23
Surveillance and control programmes
Changes to theSalmonellacontrol programme for pigs and porkA new control programme forSalmonellain pigs and pork was adopted in the summer 2009. The programme isthe fourth in line and covers the period 2009 -2013. It outlines new initiatives in herds as well as a new target for theSalmonellaprevalence at the slaughterhouse level. The programme is based on previous programmes and consists ofthe following new elements:• Duty of information ofSalmonellastatus when trading live animals• Targets for reduction in herds will follow EU initiatives• Penalty on live trade from breeder and multiplier herds with high serology (index >10)• Surveillance of sow herds* First step is a categorization based on results of samples from the herd and from herds that receive piglets fromthe herd in question* Reduction of pen samples in sow herds with high serology, as herds positive withS.Typhimurium,S.Infantis andS.Derby are considered positive for the following five years, unless they are able to prove themselves negative.* Development of surveillance system for sow herds (long term)• Target for the prevalence ofSalmonellaon chilled carcasses at or below 1,0%• New policy on antimicrobial resistance. Focus will be on resistance against critical important antimicrobialsinstead of multiresistantS.Typhimurium DT104 only. As a consequence of this, pen samples from slaughter pigherds with high serology will be replaced by a more general surveillance of antimicrobial resistance in the slaughterpig production.
7.3 Surveillance and control of animals and animalproductsSalmonellasurveillance and control programmes forpoultry, pigs and cattle are presented in appendix D, Tab-les A31-A36. Sample analysis is performed at authorisedprivate laboratories, the Regional Veterinary and FoodControl Authorities, the National Food Institute or theNational Veterinary Institute. Isolates positive withSal-monellaare forwarded to the National Food Institute forsubtyping (sero-, phage and genotyping as well as antimi-crobial susceptibility testing). An overview of the methodsused for subtyping is presented in appendix D, Table A37.Overviews of results from surveillance and control ofSalmonellaare presented as follows:• Results from the table egg production are presented inappendix C, Tables A5-A9• Results from the broiler production are presented inappendix C, Tables A5-A6 and A10• Results from the duck and turkey productions are pre-sented in appendix C, Table A14• Results from the pig production are presented in ap-pendix C, Tables A5-A7, A15 and Figures A7-A9• Results from the cattle production are presented in ap-pendix C, Tables A5-A6, A16-17 and Figure A10• Results from the feeding stuff production are presentedin appendix C, Tables A20-A21• Results from the rendering plants are presented in ap-pendix C, Table A22• Results from pets, zoo animals and wild life are pre-sented in appendix C, Table A23.
Cattle herds with confirmed infections of multiresistantS.Typhimurium DT 104 (MR DT 104) or herds that havebeen in contact with herds infected with MR DT 104 areplaced under official veterinary supervision. Cattle herdswith confirmed infection ofS.Dublin are subject to hy-gienic slaughter.Overviews of results from monitoring ofCampylobac-terare presented as follows:• Results from the poultry production are presented inappendix C, Tables A11 and A13• Results from pig and cattle herds are presented in ap-pendix C, Tables A18• Results from pets, zoo animals and wild life are pre-sented in appendix C, Table A23.Pig and cattle carcasses are screened forMycobacteriumandEchinococcusduring meat inspection at the slaughter-house. Although Denmark is assigned as a region wherethe risk ofTrichinellain domestic swine is negligible (seeparagraph 6.1), all slaughter pigs slaughtered at export ap-proved slaughterhouses are still examined forTrichinellaaswell as all horses slaughtered for human consumption andall wild boars. In addition, boars and bulls are tested forBrucellaand bulls are tested forMycobacteriumat semencollection centres. All positive results for notifiable infec-tious diseases are reported to the Danish Veterinary andFood Administration. Results are presented in appendixC, Table A15-A16.Results from the surveillance for Bovine SpongiformEncephalopathy (BSE) in cattle, Transmissible SpongiformEncephalopathy (TSE) in sheep/goat are presented in ap-pendix C, Tables A24-A26.
24
Annual Report on Zoonoses in Denmark 2009
Surveillance and control programmes
Results from the monitoring ofCoxiella brunetii(Qfever) in cattle are presented in appendix C, Table A16.Appendix D, Table A30 gives an overview of notifiableand non-notifiable zoonoses presented in this report alongwith the relevant legislation.7.4 Official testing of zoonotic pathogens infoodstuffsIn Denmark, control of pathogens in foodstuffs iscoordinated both at the regional and at the central levelof administration. Each Regional Veterinary and FoodControl Authority is responsible for the control carriedout within its own region, and the Danish Veterinary andFood Administration is responsible for the regulation,control strategy and the surveillance at the national level.The main purpose of the regional microbiologicalcontrol system is to verify that the own-check programmesimplemented at food establishments are functioning effec-tively and to verify the compliance with the microbiologicalcriteria laid down in the legislation.Regional microbiological control is carried out asfollows:• Targeted survey sampling primarily at the retail level.These surveys are focused on collecting samples fromhigh risk products, specific types of production proces-ses or specific types of food establishments• Other types of sampling at the food wholesale and retaillevel include:* Sampling based on suspicion to support findings frominspection of food establishments* Sampling at the wholesale level to verify compliancewith microbiological criteria in the legislation* Sampling in relation to the investigation of food-borne outbreaks* Sampling in response to consumer complaints.
Centrally coordinated control is carried out as nationalprojects or surveys. The purposes of these projects are to:• Verify compliance with microbiological criteria laiddown in the legislation• Discover emerging problems with microbiologicalcontaminants• Generate data for the preparation of risk profiles andrisk assessments to support microbial risk management• Monitor the effect of established risk management pro-cedures in order to evaluate if these provide the desiredresults or if they need to be reconsidered.Appendix C, Table A27 provides information on thecentrally coordinated projects conducted in 2009. Infor-mation on the following projects is presented:• The intensified control ofSalmonellaandCampylobacterin Danish and imported meat are presented in appendixC, Table A19• The findings ofCampylobacterin non-heat treated meatcuts from broilers are presented in appendix C, TablesA11 and A12• Findings ofListeria monocytogenesin ready-to-eat pro-ducts are presented in appendix C, Table A28.For further information consult the webpage of theDanish Veterinary and Food Administration, www.fvst.dk (in Danish).
Annual Report on Zoonoses in Denmark 2009
25
Appendix ATrends and sources in human salmonellosisTable A1. Estimated no. of reported human cases and percentage of cases per major food source, travel oroutbreaks, 2007-2009200920082007SourceEstimated no. ofreported cases(95% credibilityintervala)162 (127-198)4 (3-6)262 (245-280)7 (0-21)7 (0-19)43 (22-66)65 (47-86)30 (8-60)42 (11-74)29 (10-50)658 (647-669)375 (322-422)4452,129Percen-tage ofreportedcases7.60.212.30.30.32.03.11.42.01.430.917.620.9Estimated no. ofreported cases(95% credibilityintervala)320 (277-367)26 (16-36)116 (91-143)47 (25-133)38 (2-99)39 (12-70)12 (3-25)191 (120-250)87 (8-151)-853 (843-864)480 (413-547)1,4473,656Percen-tage ofreportedcases8.80.73.21.31.01.10.35.22.4-23.313.139.6Estimated no. ofreported cases(95% credibilityintervala)107 (59-159)12 (2-27)181 (147-217)12 (2-30)-21 (4-46)20 (10-29)61 (34-87)12 (2-29)-762 (731-794)386 (329-441)731,647Percen-tage ofreportedcases6.50.811.00.8-1.31.23.70.7-46.323.44.4
PorkBeefTable eggsBroilersDucksImported porkImported beefImported broilersImported turkeyImported duckTravelsUnknown sourceOutbreaks,unknown sourceTOTAL
a) The model is based on a Bayesian framework which gives 95% credibility intervals.Source: Danish Zoonosis Centre, National Food Institute
26
Annual Report on Zoonoses in Denmark 2009
Appendix BHuman disease and outbreak dataTable A2. Zoonoses in humans, number of laboratory-confirmed cases, 2000-2009Incidenceper 100,000inhabitantsZoonotic pathogenBacteriaBrucella abortus/melitensisa,cCampylobacter coli/jejunibChlamydia psittacibLeptospiraspp.bListeria monocytogenesbMycobacterium bovisbSalmonellatotalbS.EnteritidisbS.TyphimuriumbOther serotypesbVTEC totalbO157other or non-typeableYersinia enterocoliticabParasitesCryptosporidiumspp.a,cEchinococcus multilocularisa,dEchinococcus granulosusa,dToxoplasma gondiia,eTrichinellaspp.a,c,dVirusesLyssavirusb-000000a) Not notifiable hence the incidence cannot be calculated.b) Notifiable.c) Data presented are from one laboratory (Statens Serum Institut) only, representing a proportion of the Danish population (ap-proximately 1/3 in 2009). The proportion of the population represented varies from year to year, thus results from different yearsare not comparable. Testing for these pathogens is carried out only if specifically requested on the submission form.d) The cases were imported.e) The nation-wide neonatal screening for congenital toxoplasmosis stopped in 2007.f) Not including 8 reported probable cases with no microbiological findings.Source: Statens Serum Institut
Reported no. of cases200973,35214129702,129600767762165f2414123835011-0200883,4546135113,6566382,0021,016161151433309205-02007203,86811105811,647566343740161251362704939-1200693,2427155631,65856241168714619127215---14-2005153,67122244601,77564256556815425129241---9-13-2000-4,388312139122,3391,212437690602040266--
2009-60.60.30.21.8-38.510.813.913.83.00.42.64.3-----
Annual Report on Zoonoses in Denmark 2009
27
Appendix B
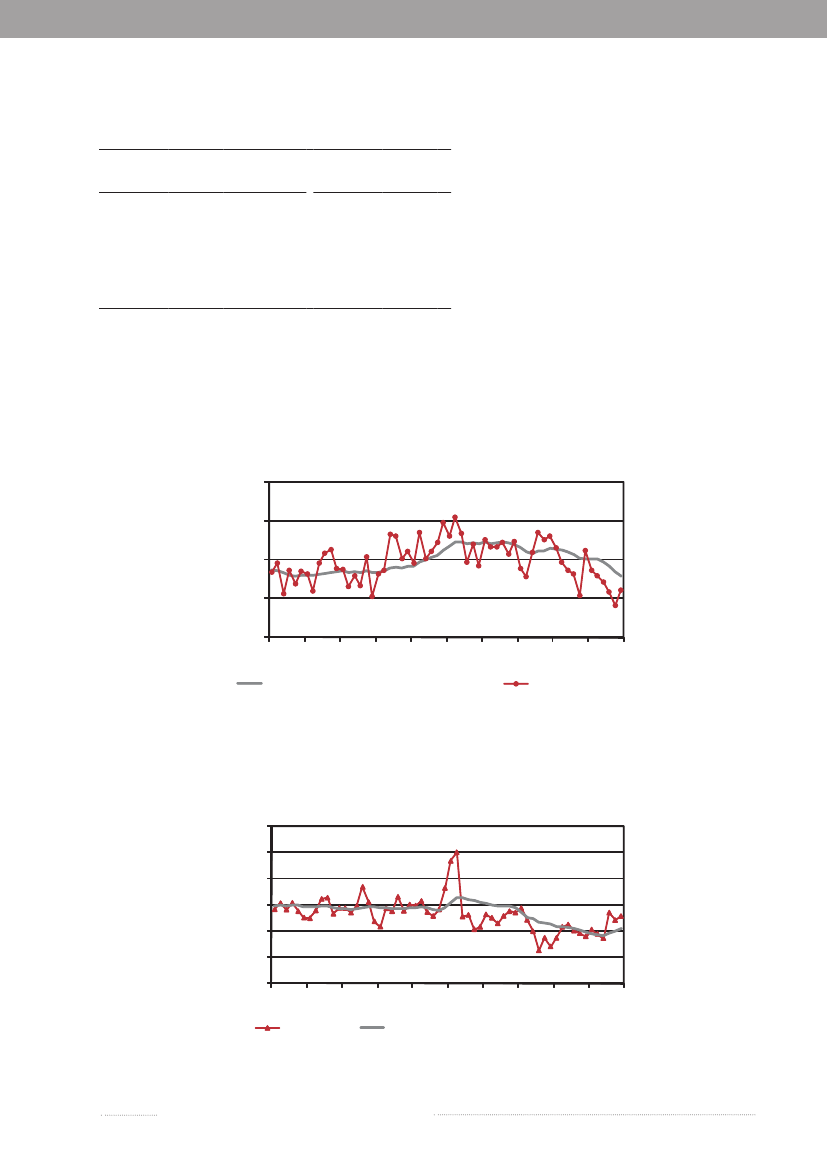
Figure A1. Incidence of human infections withS.Typhimurium by age and sex, 20095040
Incidence per100,000 inhabitants
3020100
5-14
15-24
25-44
45-64
5-14
<1
1-4
<1
1-4
15-24
25-44
45-6445-6445-64
65+
FemalesSource:Statens Serum Institut
Age
Males
Figure A2. Incidence of human infections withS.Enteritidis by age and sex, 200914121086420
Incidence per100,000 inhabitants
5-14
15-24
25-44
45-64
5-14
<1
1-4
<1
1-4
15-24
25-44
65+
FemalesSource:Statens Serum Institut
Age
Males
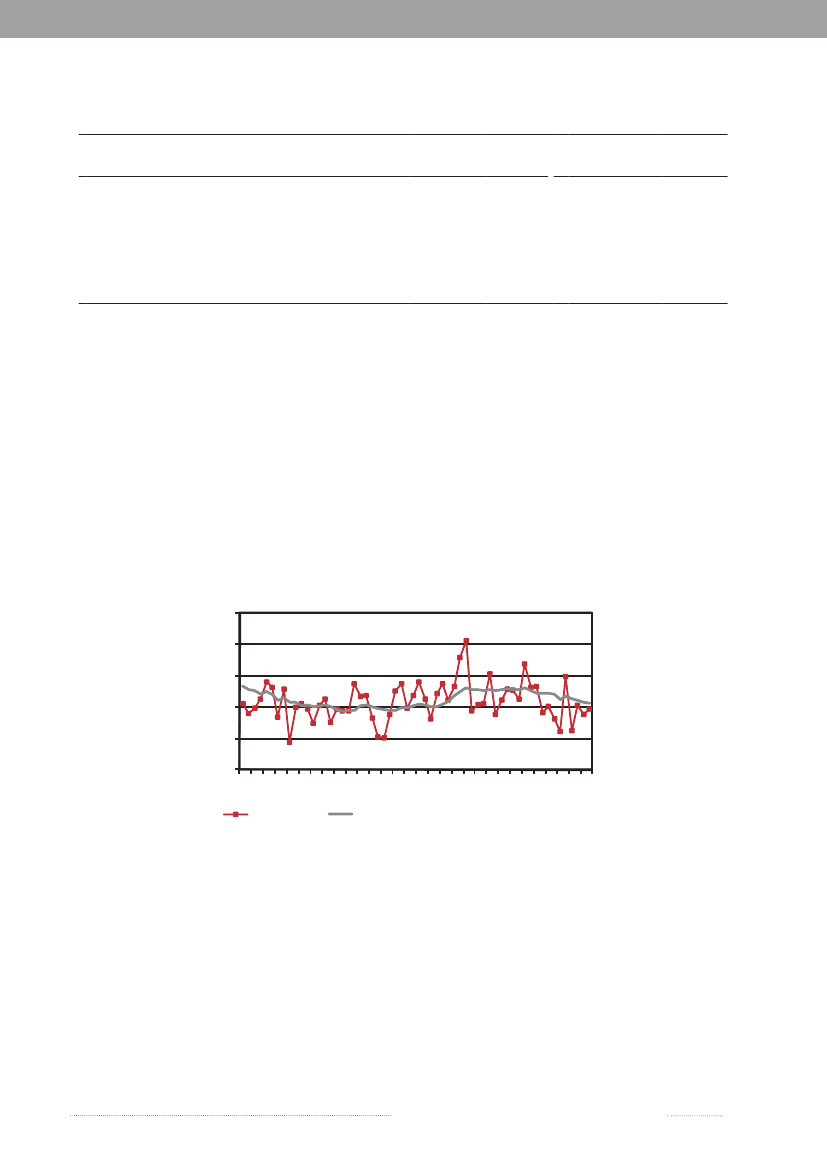
Figure A3. Incidence of human infections withSalmonellaother thanS.Typhimurium andS.Enteritidis byage and sex, 20096050
Incidence per100,000 inhabitants
403020100
5-14
15-24
25-44
45-64
5-14
<1
1-4
<1
1-4
15-24
25-44
65+
FemalesSource:Statens Serum Institut
Age
Males
28
Annual Report on Zoonoses in Denmark 2009
65+
65+
65+
Appendix B
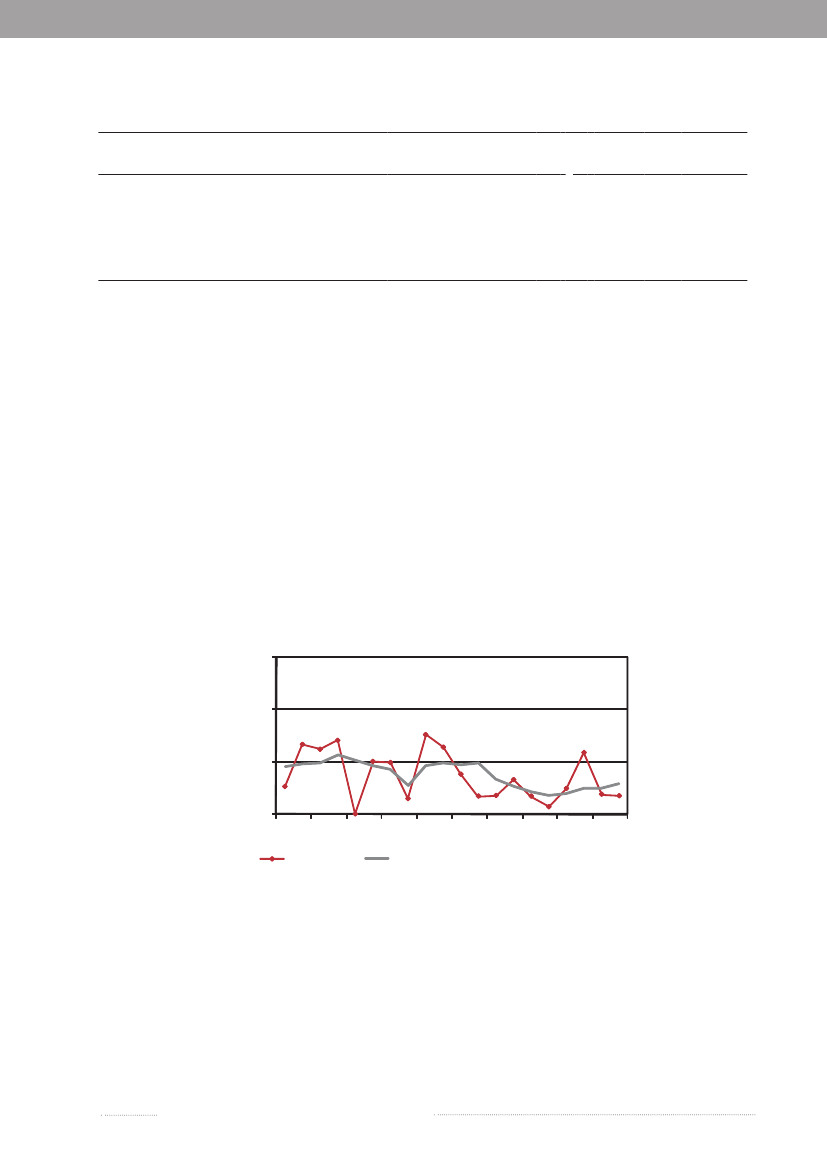
Figure A4. Incidence of human infections withCampylobacterby age and sex, 20096050
Incidence per100,000 inhabitants
403020100
5-14
15-24
25-44
45-64
5-14
<1
1-4
<1
1-4
15-24
25-44
45-6445-6445-64
65+
FemalesSource:Statens Serum Institut
Age
Males
Figure A5. Incidence of human infections with VTEC by age and sex, 200914121086420
Incidence per100,000 inhabitants
5-14
15-24
25-44
45-64
5-14
<1
1-4
<1
1-4
15-24
25-44
65+
FemalesSource:Statens Serum Institut
Age
Males
Figure A6. Incidence of human infections withYersiniaby age and sex, 200914121086420
Incidence per100,000 inhabitants
5-14
15-24
25-44
45-64
5-14
<1
1-4
<1
1-4
15-24
25-44
65+
FemalesSource:Statens Serum Institut
Age
Males
65+
65+
65+
Annual Report on Zoonoses in Denmark 2009
29
Appendix B
Table A3. Foodborne disease outbreaks reported in the Food- and waterborne Outbreak Database (FUD),2009PathogenNo. ofPatients labora- SettingSourceFUDpatientstory confirmedno.Bacillus cereusBacillus cereusCampylobacter jejuniCampylobacterspp.Campylobacter jejuniClostridium perfringensETECListeria monocytogenesS.EnteritidisS.Enteritidis PT 13aS.Enteritidis PT 13aS.Enteritidis PT 6aS.Enteritidis PT 11S.Enteritidis PT 8S.TyphimuriumS.Typhimurium DT 17S.Typhimurium DT 135aS.Typhimurium U292aS. Typhimurium DT 3aS.GoldcoastS.ReadingShigella sonneiShigella sonneiYersiniaNorovirusNorovirusNorovirusNorovirusNorovirusNorovirusNorovirusNorovirusNorovirusNorovirusNorovirusNorovirusNorovirusNorovirusNorovirusNorovirusNorovirusNorovirus134824500666384.86..........4.301111516712064234068519213439631223..2239..8332421315150538902283068110607..12.31....5.320Private partyRestaurant/cateringSchoolRestaurant/cateringUnknownCanteenSchoolRestaurant/cateringOtherGeneral outbreakSwimming meetAbroadRegionel outbreakGeneral outbreakRegionel outbreakGeneral outbreakGeneral outbreakGeneral outbreakGeneral outbreakAbroadGeneral outbreakPrivate partyGeneral outbreakFood producerRestaurant/cateringRestaurant/cateringRestaurant/cateringCanteenHotelCanteenPrivate partyCanteenPrivate partyRestaurant/cateringCanteenPrivate homePrivate partyCanteenRestaurant/cateringCanteenUnknownCanteenChickenComposite mealChickenChickenWaterChickenComposite mealBeefUnknownEggsEggsUnknownUnknownEggsUnknownUnknownUnknownUnknownUnknownUnknownUnknownMolluscs/ShellfishFresh vegetablesUnknownComposite mealBuffet mealsPerson to personBuffet mealsPerson to personBuffet mealsBuffet mealsBuffet mealsFresh fruitComposite mealBuffet mealsBuffet mealsBuffet mealsBuffet mealsBuffet mealsPerson to personPerson to personPerson to person921889916919900865886887871917928906892891945902854788883941914894888885880884851947877940939938936924922897895869868901935862
Continued on the next page
30
Annual Report on Zoonoses in Denmark 2009
Appendix B
Table A3. Foodborne disease outbreaks reported in the Food- and waterborne Outbreak Database (FUD),2009 (Continued from page 30)PathogenSapo virusHistaminHistaminHistaminHistaminHistaminLectinsLectinsOther chemical substancesUnknown agentTotalNo. ofpatients21641210245193228151,819Patients labora-tory confirmed13.........783SettingCanteenShopCanteenCanteenCanteenRestaurant/cateringCanteenRestaurant/cateringCanteenHotelSourcePerson to personFishFishFishFishFishFresh vegetablesComposite mealJuicesBuffet mealsFUDno.893898929934925923890944870913
a) The outbreak started in 2008, only cases from 2009 are reported here.
Table A4.VTEC O-groupdistribution in humansa, 2009Number of episodesO157O103O26O145O146O128O111O117O91O-roughOther O-groups or not-typedTotal24201110997761442159
a) All O-groups that resulted in five or more episodes are listed.Source:Statens Serum Institut
Annual Report on Zoonoses in Denmark 2009
31
Appendix CMonitoring and surveillance dataTable A5. Serotype distribution (%) of Salmonella from humans, animals, carcasses at slaughterhouse andimported meat, 2009Human PigPorkbBeefbLayer Broiler DuckImported meateherdsabatch batch flockscflocksdflocksdPork BeefBroiler TurkeySerotypeTyphimuriumEnteritidisO:4,5,12; H:i:-DublinNewportVirchowAgonaInfantisSaintpaulStanleyOthersTOTALN=2,12936.028.22.32.22.01.71.31.21.11.023.1100N=388 N=156 N=1168.60.5000003.10027.810036.5000002.61.90.6058.310018.20063.600000018.2100N=837.562.5000000000100N=3327.300000018.20054.5100N=540000000000100100N=43 N=553.50000004.70041.910020.020.0040.000000020.0100N=417.319.5002.409.800061.0100N=6921.70008.74.35.8013.0046.4100
a) Isolates obtained from sampling of slaughter pig herds placed in level 2 and 3 (See Table A36 for detailes on the surveillance pro-gramme). The isolates are biased towards herds positive withS.Typhimurium as the ELISA method used to analyse the meat juicesamples forming the bases for assignment of herds into level 1-3 primarily focus on detection ofS.Typhimurium antibodies.b) Swab samples of pork and beef carcasses from the surveillance programme at slaughterhouses.c) Represenative samples from the surveillance programme in prodution flocks.d) Representative faecal or sock samples from the mandatory AM inspection prior to slaughter.e) Case-by-case monitoring of imported meat and meat products, batch based.Source: Danish Veterinary and Food Administration, Statens Serum Institut and National Food Institute
Table A6. Phagetype distribution (%) ofS.Typhimuriumffrom humans, animals and imported meat, 2009Human PigPorkbBeefbLayer BroilerImported meateherdsaPhagetypeU292DT 135DT 120RDNCDT 3DT 193U312DT 170DT 12DT 104OthersTotaln=76727.812.68.25.75.04.74.64.44.03.919.0100n=2661.10.425.614.30.86.00.49.010.54.927.1100batchn=570014.07.01.85.3015.821.13.531.6100batchn=20000000000100100flockscn=300000000033.366.7100flocksdn=90055.622.200000022.2100Porkn=230030.44.3021.70008.734.8100Beefn=10000010000000100Broilern=300033.300000066.7100Turkeyn=150033.30033.300020.013.3100
a-e) See Table A5.f) The total number of samples may differ between phage type and serotype tabels (Tables A5-A7), since isolates of one serotypemay contain more than one phage type.Source: Danish Veterinary and Food Administration, Statens Serum Institut and National Food Institute
32
Annual Report on Zoonoses in Denmark 2009
Appendix C
Table A7. Phage type distribution (%) of S. Enteritidisafrom humans, animalsand imported meat, 2009HumanPigLayerImported meateherdsbPhagetypePT 8PT 13APT 1PT 21PT 4PT 14BPT 6RDNCPT 6APT 11OthersTotaln=60034.314.07.36.55.74.54.03.73.32.714.0100n=250.050.0000000000100flockscn=540.060.0000000000100Beefn=11000000000000100Broilern=80012.512.512.500012.5050100
a) The total number of samples may differ between phage type and serotype tabels (Tables A5-A7),since isolates of one serotype may contain more than one phage type.b, c and e): See Table A5.Source: Danish Veterinary and Food Administration, Statens Serum Institut and National FoodInstitute
Table A8. Occurrence of Salmonella in the table egg productiona, 2000-2009Rearing periodAdult periodPullet-rearing flocks(parent flocks)(parent flocks)N20002001200220032004200520062007200820091514152491617111013Positive0000200000N2922221599111266Positive0000000000N374339330367368255289326258253Positive8494162010
Table egg layer flocksN688607619611641655565510508454Positive32351510572548b
a) See Tables A31 and A33 for description of the surveillance programmes.b) One flock positive withS.Typhimurium DT 40, one withS.Typhimurium DT 41, one withS.Typhimurium DT 104, twoflocks positive withS.Enteritidis PT 8 and three withS.Enteritidis PT 13a. Two of the flocks positive withS.Enteritidis 13abelonged to the same holding, and were found positive at the same time.Source: Danish Veterinary and Food Administration
Annual Report on Zoonoses in Denmark 2009
33
Appendix C
Appendix C
Table A9. Occurrence of Salmonella in the table egg layer flocks sorted by type of production, 2000-2009Deep litterFree rangeOrganicBatteryN200020012002200320042005200620072008200986122123191214217185155151133Positive0212030201aN48464971727062566178Positive51642200020N111137130173175178164146145130Positive9341102214bN79129127167177175148146135110Positive161479240113c
a) One flock positive withS.Enteritidis PT 8.b) One flock positive withS.Typhimurium DT 41, one withS.Typhimurium DT 104, one withS.Typhimurium DT 40 and onewithS.Enteritidis PT 13a.c) One flock positive with S. Enteritidis PT 8 and two positive withS.Enteritidis PT 13a.Source: Danish Veterinary and Food Administration
Table A10. Occurrence ofSalmonella inthe broiler production, 2000-2009Rearing periodAdult periodBroiler flocks(parent flocks)(parent flocks)N2000200120022003200420052006200720082009222243241265275214190152146140Positive4022100000N345325330182b155b185b282258293225Positive3724605324eN4,5004,5714,4434,4144,2464,0343,6213,7033,8453,767fPositive95766877648771604335
Slaughterhouse(flocks/batches)N4,5431,695a1,6671,5521,4721,174875c884518d375Positive1316992772427171033
a) PM sampling at the slaughterhouse were changed from pooled neck skin samples of flocks to chicken cuts sampling of batches.b) In 2003-2005, only one flock per house was registered per year although there may have been more than one flock in thehouse, however all flocks were sampled according to the surveillance programme.c) From 2006, data cover only samples taken following theSalmonellaprogramme. Verification samples taken once a week byproducers of poultry meat approved to marketSalmonella-freepoultry meat are not included, this sampling started in middle of2005.d) From 2008, all AM positive flocks are heat treated at slaughter. Sampling is now carried out as verification of the AM results ofthe negative flocks. See Tables A31 and A32 for description of the surveillance programmes.e) Two flocks were from the same holding and found positive at the same time. Two flocks positive withS.Enteritidis, one flockspositive withS.Typhimurium and one flock positive withS.Derbyf) In total, 13 flocks were positive withS.Typhimurium. Data includes 51 organic flocks.Source: Danish Agriculture and Food Council and Danish Veterinary and Food Administration
34
Annual Report on Zoonoses in Denmark 2009
Appendix C
Table A11. Occurrence of Campylobacter in broiler flocks and in fresh meat at slaughter, 2003-2009YearBroiler flocksaChilled broiler meatbN20032004200520062007200820095,3735,1574,9524,5224,5274,9504,591% pos34.227.030.430.826.826.329.4N-1,6031,689959439484c1,179d% pos-17.812.37.98.214.7c15.4d
a) Flocks investigated by cloacal swabs collected at slaughter, samples are pooled and analysed as one sample using PCR.b) Centrally coordinated studies (see section 7.4 for describtion). Detection limit <10 cfu/g.c) Data are not compareable with other years as they represent the last two quarters of the year, which is the high preva-lent period.d) Data are not directly comparable to previous years, as additional small slaughterhouses has been included in the mo-nitoring. The prevalence has been weighted according to the Danish market share.Source: Danish Veterinary and Food Administration, Danish Agriculture and Food Council and National VeterinaryInstitute
Table A12. Occurrence ofCampylobacterin non-heat treated broiler meat at retaila, 2002-2009Chilled broiler meat (samples)Frozen broiler meat (samples)Year2002-20032003-20042004-20052005-20062006-20072007-20082008-2009DenmarkN4033345174013631,0581,459% posb40.827.231.129.831.032.833.8ImportN1391702998541,1281,0671,316% posb78.565.773.256.351.153.946.7DenmarkN3245669371,087897655847% posb18.310.912.213.519.029.626.1ImportN167272391698812577773% posb24.919.625.931.333.944.427.7
a) Centrally coordinated studies, retail samples (see section 7.4 for describtion). 2000-2002: detection limit <0.4 cfu/g; 2003-2009:detection limit <0.1 cfu/g.b) The prevalence is calculated as a mean of quarterly prevalences based on the sum of data from the two years specified.Source: National Food Institute
Table A13. Relative distribution ofCampylobacterspecies (%) in broilersbefore slaughtera, 2003-2009YearNC. jejuni C. upsaliensis C. coliNT/other200320042005200620072008200911310110911311110010592.994.190.892.091.990.589.0002.80.95.42.806.25.907.10.9011.00.906.401.86.60
a) Positive isolates collected as part of the DANMAP programme was examined usingconventional microbiological methods.Source: National Veterinary Institute
Annual Report on Zoonoses in Denmark 2009
35
Appendix CAppendix C
Appendix C
Table A14. Occurrence of Salmonella in turkey and duckflocksa, 2005-2009Duck flocksTurkey flocksYear20052006200720082009N254266-6885% pos71.380.5-64.763.5N911131015% pos00010.00
a) See Table A34 for description of the surveillance programmes. Thetwo major turkey and duck slaughterhouses in Denmark closed downin 2004 and 2007, respectively. Therefore, most commercially rearedduck and turkey flocks are transported abroad for slaughter.Source: Danish Agriculture and Food Council
Figure A7. Serological surveillance ofSalmonella inbreeding and multiplying pigsabased on monthlytesting of blood samples, 2005-20098
% positive breeding- andmultiplying pigs
642020052006200720082009% positive% positive, moving avg for 12 months
a) For more information about the surveillance programme, see Table A36Source: Danish Agriculture and Food Council
Figure A8. Serological surveillance ofSalmonella inslaughter pigsa, 2005-2009. Percentage ofseropositive meat juice samples (first sample per herd per month)b181512963020052006200720082009% positive% positive, moving avg for 12 months
a) For more information about the surveillance programme, see Table A36b) The peak in late summer 2007 and the very low level during 2008 were due to technical problems in the laboratory.Source: Danish Agriculture and Food Council
36
Annual Report on Zoonoses in Denmark 2009
% positive slaughter pigs
Appendix C
Table A15. Occurrence of zoonotic pathogens in pigs in Denmark, 2009HerdsZoonotic pathogenSalmonellaspp.a,bBrucella abortuscMycobacterium bovisdEchinococcusdgranulosis/multilocularisLeptospiraeTrichinellaspp.fN8,422---27-Positive190---1-
Animals/SamplesN-24,71718,972,88018,972,880-22,766,246Positive-000-0
a) See Table A36 for describtion of the surveillance programme.b) Data are from December 2009. Slaughter pig herds monitored using serological testing of meatjuice samples collected at slau-ghter. Herds belonging to level 2 and 3 were defined asSalmonellapositive.c) Including samples from boars (examined at pre-entry, every 18 month, and prior to release from semen collection centres)(14,605 samples), samples collected in connection with export (10,012 samples), import (6 samples) or fertility problems (72samples). 5-8 ml blood samples were analysed using either the SAT, RBT, CFT or ELISA methods.d) Slaughtered pigs were examined by slaughterhouse meat inspectors.e) Sampling is based on suspicion of leptosporosis due to increased abortions or other reproductive problems in a herd. Samplesare investigated using immunoflourescence techniques. In 2009, a total of 98 animals were tested.f) Samples from all pigs slaughtered at export approved slaughterhouses were examined using the method described in Directive2075/2005/EEC. In 2007, Denmark achieved official status as region with negligible risk ofTrichinella,according to EU Regula-tion (EC) No 2075/2005.Source: Danish Veterinary and Food Administration, National Veterinary Institute and National Food Institute
Figure A9. Salmonella in pork, monitored at slaughterhousesa,b, 2005-2009.2.52.0
% positive samples
1.51.00.50.020052006200720082009% positive% positive, moving avg for 12 months
a) Swab samples taken from three designated areas of chilled half-carcasses. See Table A36 for describtion of the surveillanceprogramme.b) When estimating the prevalence ofSalmonella,both the loss of sensitivity and the probability of more than one sample beingpositive in each pool are taken into consideration. A conversion factor has been determined on the basis of comparative studies,as described in Annual Report 2001. In 2009, a total of 24,385 samples with 1.1% positive were collected from slaughterhousesslaughtering more than 50 pigs per month, and 120 samples with 1.7% positives were analysed from slaughterhouses slaughteringless than 50 pigs per month.Source: Danish Veterinary and Food Administration
Annual Report on Zoonoses in Denmark 2009
37
Appendix C
Appendix C
Table A16. Occurrence of zoonotic pathogens in cattle in Denmark, 2009HerdsZoonotic pathogenBrucella abortusaMycobacterium bovisb,cVTEC O157dEchinococcususcgranulosis/multilocularisCoxiella brunetiiN--263-157ePositive--23-124
Animals/SamplesN2,701507,200-507,200111fPositive00-022
a) Denmark has been declared officially brucelosis free since 1979. The last outbreak was recorded in 1962. Including samplesfrom boars (examined at pre-entry, every year, and prior to release from semen collection centres) (2.215 samples), samplescollected in connection with export (329 samples) or fertility problems (77 samples). 5-8 ml blood samples were analysed usingeither the SAT, RBT, CFT or ELISA methods.b) Denmark has been declared officially tuberculosis free since 1980. The last case of TB in cattle was diagnosed in 1988.c) Slaughtered cattle were examined by the slaughterhouse meat inspectors.d) Caecal content are tested from one animal per herd, collected at slaughter (DANMAP programme). A 25 g faecal sample fromone slaughter calf per herd is examined using overnight enrichment, immunomagnetic separation method and plating on CT-SMAC plates for O157.e) Bulk tank milk samples taken for diagnostic testing and analysed using an ELISA method.f) Serum samples taken for diagnostic testing and analysed using an ELISA method. An additional 14 samples from placenta wasanalysed using the FISH method, one sample was positive.Source: Danish Veterinary and Food Administration, National Veterinary Institute and National Food Institute
Figure A10. Salmonella in beef, monitored at slaughterhousesa,b, 2005-2009.1.5
% positive samples
1.0
0.5
0.02005% positive2006200720082009% positive, moving avg for 12 months
a) Swab samples taken from three designated areas of chilled half-carcasses.SeeTable A35 for describtion of the surveillanceprogramme.b) When estimating the prevalence ofSalmonella,both the loss of sensitivity and the probability of more than one sample beingpositive in each pool are taken into consideration. A conversion factor has been determined on the basis of comparative studies,as described in Annual Report 2001. In 2009, a total of 7,080 samples with 0.3% positive were collected from slaughterhousesslaughtering more than 50 cattle per month, and 190 samples with no positives were collected from slaughterhouses slaughteringless than 50 cattle per month.Source: Danish Veterinary and Food Administration
38
Annual Report on Zoonoses in Denmark 2009
Appendix C
Table A17. Cattle herds in the S. Dublin surveillance programmea, January 2010SalmonellaDublin levelNon-milkproducing herdsNLevel 11a1bTotalLevel 2222TotalLevel 3UnknownTotalOn the basis of milk samplesOn the basis of blood samplesProbablySalmonellaDublin freeTiter high in blood- or milk samplesContact with herds in level 2 or 3’Non-Level 1’ due to too few blood samplesNonSalmonellaDublin freeSalmonellosis, official supervisionToo few blood samples1,02511,85112,87644263831,083154914,509%7.181.788.73.04.407.503.8100
Milk producingherdsN3,806133,819382203405504,229%90.00.390.39.00.50.19.60.10100
Total number of herds sampleda) See Table A35 for describtion of the surveillance programme.Source: Danish Veterinary and Food Administration
Table A18. Distribution ofCampylobacter(%) in pig and cattle herdsa, 2000-2009PigsNC. coli200020012002200320042005200620072008b200931023824025919118529526129228759.468.578.8-78.083.250.876.666.147.7% posC. jejuni4.22.91.7-1.02.21.41.91.78.0other/unknown0.65.5093.40.5000--907687886773224132168188CattleNC. coli1.16.60-1.506.73.03.01.1% posC. jejuni56.753.963.2-62.742.537.567.458.356.9other/unknown3.311.82.363.60000--
a) Samples were collected as part of the DANMAP programme. Caecal content was tested from one animal per herd.b) From 2008, samples are only tested forC. coliandC. jejuni.Source: National Food Institute
Annual Report on Zoonoses in Denmark 2009
39
Appendix C
Appendix C
Table A19. Results from the intensified control ofSalmonellaandCampylobacter infresh meat based on acase-by-case risk assessment, 2009No. of batchestestedCampylobacterDanishImportedSalmonellaDanishBeefPorkBroilerImportedBeefPorkBroilerTurkey12630410012530173634253005373062360267166.7%12.3%-5.7%5.5%8.7%10.7%29.04.3-47.65.60.80.8BroilerBroilerTurkey300736342371544812039.6%24.2%14.7%3.11.80.9No. of batches No. of batchespositivesanctionedMean preva-lence in positivebatchesa,bMean relativehuman risk inpositive batchesa
a) Include positive batches where a risk assesments has been performed. Risk assesments of positive batches of marinated meat isnot required, but conducted in most cases.b) TheSalmonellaprevalence in each batch is based on the proportion of positive pooled samples (12 pools per batch) and num-ber of subsamples per pool.Source: Danish Veterinary and Food Administration and National Food Institute
Table A20. Feed business operators own sampling ofSalmonellain compound feeds, feed processing andfeed material, 2007 and 200920092007SamplesNFeed processing plants (process control)a:Ordinary inspections - clean zoneOrdinary inspections - dirty zoneCompound feed, farm animalsFeed materials, farm animalsbTransport vehicles, clean zone/hygiene samplescTransport vehicles, dirty zone/hygiene samplesc7,7813401,3391,0611,176293d28e085f1g06,865-4241,408949-9-6352-PosSamplesNPos
a) The presence ofSalmonellain compound feed is indirectly monitored by the environmental samples collected during feedprocessing.b) Sampling of feed materials (predominantly soy bean meal and rapeseed cake).c) Samples from transport vehicles (hygiene samples) prior to loading of feed compounds.d)S.London,S.Idikan,S.Stourbridge.e)S.Agona,S.Banana,S.Cerro,S.Derby,S.Enteritidis,S.Falkensee,S.Havana,S.Infantis, Kentucky,S.Orion var 15,34,S.Regent,S.Rissen,S.Senftenberg,S.Tennessee,S.Westhampton.f)S.8.20:i:-,S.Agona,S.Anatum,S.Banana,S.Cerro,S.Cubana,S.Hanana,S.Infantis,S.Kentucky,S.Lexington var. 15,34,S.Livingstone,S.Mbandaka,S.Meleagridis,S.Ouakan,S.Orion var 15,34,S.Rissen,S.Senftenberg,S.Typhimurium.g)S.Infantis.Source: Danish Plant Directorate / the feed business operators
40
Annual Report on Zoonoses in Denmark 2009
Appendix C
Table A21. Control ofSalmonella incompound feeds, feed processing and feed material, 2005-200920092008200720062005SamplesNFeed processing plants (process control)a:Ordinary inspectionsAdditional inspectionsFeed materials, farm animalsbTransport vehicles, hygienesamplesc907-186-18d-4e-1,085-174318-120976-719517-301,58917433619131131621,8851751,1192542915723PosSamplesNPosSamplesNPosSamplesNPosSamplesNPos
a) The presence ofSalmonellain compound feed is indirectly monitored by the environmental samples collected during feedprocessing. Companies are sampled one to four times per year.b) Sampling of feed materials (predominantly soy bean meal and rapeseed cake).c) Samples from transport vehicles (hygiene samples) prior to loading of feed compounds.d)S.Adelaide,S.Anatum,S.Falkensee,S.Meleagridis,S.Putten,S.Senftenberg andS.Tennessee.e)S.Infantis,S.Livingstone,S.Rissen andS.Senftenberg.Source: Danish Plant Directorate
Table A22.Salmonellain three categories of meat and bone meal by-products not intended for humanconsumptiona, 2009Category ofOwn-check samplesProduct samplesprocessing plantNPositiveNPositive123By-products of this material cannot be used forfeeding purposesBy-product of this material may be used for feed forfur animalsBy-products from healthy animals slaughtered in aslaughterhouse. Products of these may be used forpetfoodband for feed for fur animalsTOTAL--601--4-331,194-03c
601
4
1,227
3
a) Regulation No. 1774 of 03/10/2002.b) For cats and dogs. Only by-products from pigs are used in this petfood.c) In 2009, the percentage of positive product samples from category 3 markedly decreased to 0.3% (from 2.8% in 2008), which isthe result of improved cleaning.Source: Danish Veterinary and Food Administration
Annual Report on Zoonoses in Denmark 2009
41
Appendix CAppendix C
Table A23. Occurrence of zoonotic pathogens in pets, zoo animals and wild life in Denmarka, 2009Pet animalsZoo animalsWildlifeDogsCatsOthersMam-mals &reptilesN2280220000Pos3b1e-1h0----00---0-BirdsMammals Birds
Zoonotic pathogenSalmonellaspp.Campylobacterspp.Chlamydia psittaciCryptosporidiumspp.Echinococcusspp.Trichinellaspp.jLyssavirus(classical)European BatLyssavirus
N1250270020
Pos00-2--0-
N251170010
Pos0002--0-
N02100020
Pos
N921020000
Pos00000---
N679105321265k09l
Pos6c4f-8i00-1m
N47160003400
Pos2d3g-000--
a) All samples are analysed based on suspision of disease and does not reflect the country prevalence.b) 1 pink tounge skink, 1 Brazilian rainbow boa, 1 Indian python.c) 1 fox, 4 European hedgehogs, 1 mink.d) 1 common buzzard, 1 greylag goose.e) 1 Zebra.f) 4 roe deer.g) 2 hooded crows, 1 dowe.h) 1 Galapagos tortoise.i) 2 roe deer, 2 European hedgehogs, 3 squirrels, 1 racoon dog.j) In 2007, Denmark achieved official status as region with negligible risk ofTrichinella,according to EU Regulation (EC) No2075/2005.k) 139 fox, 8 badgers, 79 minks, 23 raccoon dogs and 16 other.l) One bat was not suitable for testing.m) Bat tested positive for EBLV-1.Source: National Veterinary Institute
Table A24. The Bovine Spongiform Encephalopathy (BSE) surveillance programmeafor cattle, 2009Type of surveillanceNbPositiveActive surveillanceHealthy slaughtered animals (>30 month)Risk categories:Emergency slaugthers (>24 month)Slaughterhouse antemortem inspection revealed suspi-cion or signs of disease (>24 month)Fallen stock (>24 month)Animals from herds under restrictionPassive surveillanceAnimals suspected of having clinical BSETotal2159,00201566925,04740000133,3741c
a) According to the EU Regulation (EC) 999/2001 as amended and Commission Decision 2009/719/EC as amendedb) Samples (brain stem material) are tested using a IDEXX technique or Prionics-Check PrioStrip. Confirmatory testing is car-ried out using Western blot (definitive diagnosis if positive case), else with histopathology or immunohistochemistry. Furtherconfirmation on autolysed material is performed at the Community TSE reference laboratory.c) One 14 year old cow positive with classical BSE, probably infected by a BSE positive feed batch distributed in Denmark in1996. This batch caused an outbreak of classical BSE during 2000-2003 and a risk model developed by the National VeterinaryInstitute predicted that one or two cases of classical BSE probably could occur as long as animals from the cohort are still alive.Source: Danish Veterinary and Food Administration
42
Annual Report on Zoonoses in Denmark 2009
Appendix C
Table A25. The Transmissible Spongiform Encephalopathy (TSE) surveillanceprogramme for sheep and goats, 2009Type of SurveillanceNaPositiveActive surveillanceFallen stock (>18 mo.)Healthy slaughtered animals (>18 mo.)Animals from herds under restrictionPassive surveillanceAnimals suspected of having clinical TSETotal37,883007,88000000
a) Samples (brain stem material) are tested using a IDEXX technique or Prionics-Check Prio-Strip. Confirmatory testing is carried out using Western blot (definitive diagnosis if positivecase), else with histopathology or immunohistochemistry. Further confirmation on autolysedmaterial is performed at the Community TSE reference laboratory.Source: Danish Veterinary and Food Administration
Table A26. Distributiona(%) of prion protein genotype of sheeprandomly selected, 2009GenotypeSheepn=102NSP 1NSP 2ARR/ARRARR/AHQARR/ARQARR/ARH/QNSP 3 (ARQ/ARQ)NSP 3 (Other)ARQ/ARQAHQ/AHQARH/ARHARQ/ARHARQ/AHQNSP4NSP5TotalARR/VRQARQ/VRQ20.64.912.72.049.00005.904.9100
a) The genotypes were grouped in the NSP classification system according totheir different susceptibility: NSP 1: Genetically most resistant, NSP 2: Geneti-cally resistant, NSP 3: Genetically little resistance, NSP 4: Genetically suscepti-ble, and NSP 5: Genetically highly susceptible.Source: National Veterinary Institute
Annual Report on Zoonoses in Denmark 2009
43
Appendix C
Appendix C
Table A27. Centrally coordinated studies conducted in 2009Title of projectNo. ofBacteria analysed per samplesamples (regional laboratories)SalmonellaandEscheridia coliin pre-pared boiled bivalved molluscs fromGreenlandListeria monocytogenes, Salmonella, E.coliandStaphylococcusin fish productsfrom GreenlandMicrobiological classification of theproduction areas for bivalve molluscs50Salmonella, E. coli
Futher informationResults are being processed
50
Salmonella, E. coli,Staphylococcus, L. monocytogenesSalmonella, E. coli,virusesSalmonella, E. coli,Campylobacter, EnterococcusE. coli, S. aureusCampylobacterCampylobacterCampylobacterSalmonella, CampylobacterSalmonella, CampylobacterSalmonellaSalmonella
Results are being processed
20
Results are being processedResults are being processedResults are being processedAppendix C, Table A11Appendix C, Table A12Results are being processedAppendix C, Table A20Appendix C, Table A20Results are being processedContinues in 2010
Antimicrobial resistance in Danish and 1,000imported broiler meat, beef and porkMRSA and ESC in Danish pork meatCampylobacterin fresh, chilled Danishbroiler meatCampylobacterin fresh chilled and fro-zen Danish and imported broiler meatSalmonellaandCampylobacterin freshchilled imported duck and turkey meatIntensified control forSalmonellaandCampylobacterin fresh Danish meatIntensified control forSalmonellaandCampylobacterin fresh imported meatSalmonellaDublin in Danish dairyherdSamples of different origin related tohuman outbreak ofSalmonellaTyphi-murium U292Pathogens in Danish and importedslightly preserved fermented sausagesPathogens in slightly preserved slicedmeat (ready to eat)Microbiological quality of meat produ-cts with risk of recontaminationMicrobiological quality of cream cakesMicrobiological quality of minced meatMicrobiological quality of icecreamand the water used for storing thespoonsHygiene quality and microbiologicalquality of sliced meat productsMicrobiological quality of meals readyto eat1,7001,2002,8001,200725a1,500a753,000
500
Salmonella, E. coli O157(beefproducts),L. monocytogenes,enterobactericeae, enterococcusSalmonella, E. coli, S. aureus,L. monocytogenesE. coli, S. aureusE. coli, B. cereusSalmonella, E.coliE. coli, B. cereus
Continues in 2010
2601,3001,400750700
Continues in 2010Results are being processedResults are being processedResults are being processed
400495
E. coli, Listeria
Results are being processed
B. cereus, C. perfringens, S. aureusContinues in 2010
Continued on the next page
44
Annual Report on Zoonoses in Denmark 2009
Appendix C
Table A27. Centrally coordinated studies conducted in 2009, continued from page 44Title of projectNo. ofBacteria analysed per sampleFuther informationsamples (regional laboratories)Pathogens in Danish and importedvegetables (ready to eat)Meat preparations produced at theretailersPistacio nut and kernelsListeria monocytogenesin smoked fishand gravad fish1,500600100300Salmonella, E. coli, Campylo-bacterSalmonella, E. coli.SalmonellaL. monocytogenesContinues in 2010Results are being processedResults are being processedResults are being processed
a) BatchesSource: Danish Veterinary and Food Administartion and National Food Institute
Table A28.Listeria monocytogenesin ready-to-eat foodsa, 2009Samples analysed by aqualitative methodcBatchesbFood categorySampling placeAt retailCheese, RTEDanishImportAt processingAt processingN2-3-1711---Pos1-0-001---Products of meat origin,RTE At processingSingle samplesN31------1-Pos00------0-
Samples analysed by aquantitative methoddBatchesbN31-2--14---Pos00-0--0---Single samplesN-12-----2-5Pos-0-----0-0
Milk and dairy products, RTEDanishAt processingImportFishery products, RTEOther RTE productsAt processingAt processingAt retailAt processingAt retail
a) Samples are collected by the Regional Veterinary and Food Control Authorities according to European Regulation (EC) No2073/2005.b) 5 samples pooled together.c)Listeria monocytogenespresent in a 25 g sample of the the product.d) Detection limit is 10 cfu/g. cfu: Coloni forming units.Source: Danish Veterinary and Food Administration
Annual Report on Zoonoses in Denmark 2009
45
Appendix DMonitoring and surveillance programmes
Table A29. Overview of notifiable and non-notifiable human diseases presented in this report, 2009PatogenNotifiable in humansNotification routeBacteriaBrucellaspp.Campylobacterspp.Chlamydophila psittaci(Ornithosis)Listeria monocytogenesLeptospiraspp.Mycobacterium bovis/ tuberculosisCoxiella burnetiiSalmonellaspp.VTECYersinia enterocoliticaParasitesCryptosporidiumspp.Echinococcus multilocularisEchinococcus granulosusToxoplasma gondiiTrichinellaspp.VirusesLyssavirus(Rabies)PrionsTSEBSE/Creutzfeld Jacob-1997a-Physician1964aPhysician (via telephone)nonononono-----no1979a1980a1993a1980a1905ano1979a2000a1979a-LaboratorybPhysiciancPhysicianPhysicianPhysician (and laboratoryd)-LaboratoryPhysician and laboratoryLaboratory
a) Danish order no. 277 of 14/04/2000. Cases must be notified to Statens Serum Institut.b) The regional microbiological laboratories report confirmed cases.c) The physician report individually notifiable infections.d) The laboratories voluntarily report confirmed cases.Source: Statens Serum Institut
46
Annual Report on Zoonoses in Denmark 2009
Appendix D
Table A30. Overview of notifiable and non-notifiable animal diseases presented in this report, 2009PatogenNotifiable inEU legislationDanish legislationanimalsBacteriaBrucellaspp.CattleSheep and goatsPigsCampylobacterspp.Chlamydophila psittaciBirds and poultryListeria monocytogenesLeptospiraspp. (only inproduction animals)Mycobacterium bovis/tuber-culosisCattleCoxiella burnetiiSalmonellaspp.Cattle/swinePoultryVTECYersinia enterocoliticaParasitesCryptosporidiumspp.Echinococcus multilocularisEchinococcus granulosusToxoplasma gondiiTrichinellaspp.VirusesLyssavirusPrionsTSESheep and goatsBSECattleyesRegulation 999/2001/EC(as amended)Regulation 999/2001/EC(as amended)Order no. 930 of 07/09/20061920-Order no. 14 of 11/01/1999 andOrder no. 914 of 15/12/1987no20041993no1920a-Council directive 64/433/ECCouncil directive 64/433/EC-Regulation 2075/2005/EC-Act no. 432 of 09/06/2004Act no. 432 of 09/06/2004-Circular no. 9466 of 12/07/20061920aOBF in 1979bObmF in 1995cNo cases since1999no1920no20031920aOTF since1980d20051993eDecision 2004/320/EC--Order no. 1417 of 11/12 2007Act no. 432 of 09/06/2004Order no. 112 of 24/02/2005Order no. 1010 of 24/10/2005--Decision 2004/320/ECDecision 2004/320/ECDirective 2003/99/EC----Order no 305 of 3/5 2000Order no. 739 of 21/8 2001Order no. 205 of 28/3 2009-Order no. 78 of 30/1 1997-Act no. 432 of 09/06/2004
nono
--
yes
Order no. 800 of 13/07/2006
a) Clinical cases, observations during the meat inspection at the slaughterhouse, positive blood samples or finding of agens arenotifiable.b) Officially Brucellosis Free (OBF) according to Council Directive 64/432/EC as amended and Commision Decision 2004/320/EC. No cases in cattle since 1962.c) OfficiallyB. melitensisFree (ObmF) according to Council Directive 91/68/EC and Commision Decision 2004/320/EC. Neverdetected in sheep or goat.d) Officially Tuberculosis Free (OTF) according to Council Directive 64/432/EC as amended and Regulation (EC) 1226/2002, andCommission Decision 2003/467/EC. No cases in cattle since 1988 or in deer since 1994.e) Only clinical cases notifiable.Source: Danish Veterinary and Food Administration
Annual Report on Zoonoses in Denmark 2009
47
Appendix D
Appendix D
Table A31. Salmonella surveillance programme for the rearing flocks and adult flocks of the grandparentand parent generation of the broiler and table egg production, 2009TimeSamples MaterialMaterialtakenRearing flocksDay-olda,bPerdeliveryGrandparent generation5 transport crates from one delivery:crate liners (>1m2in total) or swabsamples (>1m2in total). Analysed asone pool.-Parent generation5 transport crates from one delivery:crate liners (>1m2in total) or swabsamples (>1m2in total). Analysed asone pool.2 pairs of boot swabs (analysed as onepooled sample) or 1 faeces sample of60g.2 pairs of boot swabs (analysed as onepooled sample) or 1 faeces sample of60g.2 pairs of boot swabs (analysed as onepooled sample). Cage birds: 60 samp-les of fresh droppings (1g). Analysedas one pool.2 pairs of boot swabs (analysed as onepooled sample) or 1 faeces sample of60g.Parent generationHatcher basket liners from 5 baskets(>1m2in total) or 10g of broken eggs-hells from each of 25 hatcher baskets(reduced to 25g sub-sample). Analysedas one pool.Wet dust samples. Up to four hatchersof the same flock can be pooled.2 pairs of boot swabs (analysed as onepooled sample) or 1 faeces sample of60g.5 pairs of boot swabs (analysed as twopooled samples), or 1 faeces sampleconsisting of 2x150g.5 pairs of boot swabs (analysed as twopooled samples), 2 dust samples (250ml) and 5 birds (analysed for antimi-crobial substances.
1st & 2nd weekb, c
Per unitd
4th weeka,b
5 pairs of boot swaps (analysed as twopooled samples), or 1 faeces sampleconsisting of 2x150g.Per unit2 pairs of boot swabs (analysed as onepooled sample). Cage birds: 60 samp-les of fresh droppings (1g). Analysedas one pool.5 pairs of boot swabs (analysed as twopooled samples), or 1 faeces sampleconsisting of 2x150g.Grandparent generationPer flockHatcher basket liners from 5 baskets(>1m2in total) or 10g of broken egg-shells from each of 25 hatcher baskets(reduced to 25g sub-sample). Analy-sed as one pool.
8th weekb,c
2 weeks prior tomovinga,eAdult flocksEvery two weeksb(Every 16th weekd)f
Per unit
After each hatchbEvery weekb
Per hatch Wet dust samples. Up to four hatchersof the same flock can be pooled.Per unit-
0-4 weeks aftermoving, 8-0 weeksbefore slaughtereAfter positive fin-dingse
Per unit
5 pairs of boot swabs (analysed as twopooled samples), or 1 faeces sampleconsisting of 2x150g.5 pairs of boot swabs (analysed as twopooled samples), 2 dust samples (250ml) and 5 birds (analysed for antimi-crobial substances.
Per unit
a) Sampling requirements set out by Regulation (EC) 2160/2003.b) Samples collected by the food business operator.c) Order no 1259 of 15/12/2008.d) A unit (house) may harbour part of a flock or more than one flock, depending on the size of the unit.e) Samples collected by the Regional Veterinary and Food Control Authorities.f) When eggs from a flock exceed the capacity of one incubator, each incubator should be sampled as described.Source: Danish Veterinary and Food Administration
48
Annual Report on Zoonoses in Denmark 2009
Appendix DAppendix D
Table A32.Salmonellasurveillance programmeafor the broiler flocks, 2009TimeSamples taken MaterialBroiler production15 - 21 days before slaughter,Ante mortem (AM)b,c7 - 10 days before slaughter,Ante mortem (AM)dAfter slaughter,Post mortem (PM)bPer flockPer flockPer batch5 pairs of boot swabs. Analysed individually.5 pairs of boot swabs. Analysed individually.Sampling is depending on whether the slaughterhouseslaughters only AM-negative flocks or AM-negative as wellas AM-positive flocks.
a) According to Order no 1261 of 15/12/2008.b) Samples collected by the food business operator.c) Once a year, the samples are collected by the Regional Veterinary and Food Control Administration.d) Samples are collected by a representative of the slaughterhouse, laboratorium or the Regional Veterinary and Food ControlAdministration.Source: Danish Veterinary and Food Administration
Table A33.Salmonella surveillanceprogramme for the pullet-rearing, table egg layer and barnyard/hobbyflocks in the table egg production, 2009TimeSamples taken MaterialPullet- rearingDay-olda,dPer delivery5 transport crates from one delivery: Crate liner (> 1 m2intotal) or swab samples (> 1 m2in total) (Analysed as onepooled sample).5 pairs of boot swabs (analysed as two pooled samples) or5 faeces samples of 60 gram.5 pairs of boot swabs (analysed as two pooled samples) or5 faeces samples of 60 gram. 60 blood samples (serology).2 pairs of boot swabs (analysed as one pooled sample) or1 faeces sample consisting of 2x150 gram. 250 ml (100 g)dust or 1 pair of boot swabs. 60 eggsb(serology).2 pairs of boot swabs (analysed as one pooled sample)or one faeces sample consisting of 2x150 gram. 60 eggsb(serology).Egg samples.
4 weeks oldb,d2 weeks before movinga,c
Per flockPer flock
Table egg layers(Production for certified packing stations)24 weeks olda,cPer flock
Every 9 weeksd,e
Per flock
Barnyard and hobby flocksEvery 18 weeksdPer folcka) Sampling requirements set out by Regulation (EC) 2160/2003.b) According to Order no 1260 of 15/12/2008.c) Samples collected by the Regional Veterinary and Food Control Administration.d) Samples collected by the food business operator.e) According to Regulation (EC) 2160/2003 sample collection must be carried out every 15 weeks as a minimum.Source: Danish Veterinaty and Food Administration
Annual Report on Zoonoses in Denmark 2009
49
Appendix D
Appendix D
Table A34.Salmonella surveillanceprogrammesafor the duck and turkey flocks, 2009TimeSamples takenMaterialDuck productionMax. 21 days before slaughter,Ante mortem (AM)bTurkey productionMax. 21 days before slaughter,Ante mortem (AM)bPer flock5 pairs of boot swabs. Analysed indi-vidually.Per flock2 pairs of boot swabs. Analysed indi-vidually.
a) According to Order no 1261 of 15/12/2008.b) Samples collected by the food business operator.Source: Danish Veterinary and Food Administration
Table A35. Salmonella Dublin surveillance programmeafor the cattle herds andSalmonellasurveillanceprogramme at slaughter, 2009No. of samplesMilk producing herds4 samples distributed over 13months8 samplesNon-milk producing herds1 samplec4-8 samplesBlood samplesBlood samplesCalculation of herd levelbIf the owner wants a herd moved fromlevel 2 to 1bdSlaughterhouses slaughtering more than200 cattle per daySlaughterhouses slaughtering morethan 200 cattle per month or 200 or lesscattle per daySlaughterhouses slaughtering 50-200cattle per monthSlaughterhouses slaughtering less than50 cattle per monthTank milk samplesBlood samplesCalculation of herd levelbIf the owner wants a herd moved fromlevel 2 to 1bSamples takenComment
Beef carcasses at the slaughterhouse5 samples daily, pooled intoone analysis5 samples per 200 slaughteredcattle, pooled into one analysis5 samples every 3rdmonth,pooled into one analysis1 sample every 3rdmonthSwab samples from 3 designated areasafter 12 hours chilling (3-100m2)Swab samples from 3 designated areasafter 12 hours chilling (3-100m2)Swab samples from 3 designated areasafter 12 hours chilling (3-100m2)Swab samples from 3 designated areasafter 12 hours chilling (3-100m2)
a) Order no. 112 of 24/02/2005 as ammendedb) Herd levels based on serological testing (blood and milk). Level 1a: Milk producing-herd assumed free of infection (based ontank milk samples), Level 1b: Non-milk producing-herd assumed free of infection, Level 2: Herd not assumed free of infection,Level 3: Herd infected, and Unknown level: insufficient number of blood samples have been taken from herd and no samples hadantibody levels above the limit value.c) No samples are taken, if the herd has been tested forS.Dublin within the last 120 days or 8 samples have been tested within thelast 12 months.d) Number of samples equals total number of animals in the herd minus 2 (max. 8 animals, min. 4 animals).Source: Danish Veterinary and Food Administration
50
Annual Report on Zoonoses in Denmark 2009
Appendix DAppendix D
Table A36.Salmonella surveillanceprogramme for the pig production, 2009TimeSamples takenPurposeBreeding and multiplier herdsEvery month10 blood samples perepidemiological unitCalculation ofSalmonella-indexbasedon the mean from the last three monthswith most weight to the result from themore recent months (1:3:6)Clarify distributionband type of infectionin the herdClarify distributionband type of infectionin the herd, and clarify possible trans-mission from sow herds to slaughter pigherds
Max. twice per yearSow herds
Herds withSalmonella-index5or above: Pen-faecal samplesa
When purchaser of piglets isPen-faecal samplesassigned to level 2 or 3, max. twiceper yearSlaughter pig herdsAt slaughter
Meat juice, 60-100 samples perCalculation of slaughter pig index basedherd per year. Herds in RBOVa,c: on the mean from the last three monthsone meat juice sample per month with most weight to the result from themost recent month (1:1:3). Assigningherds to level 1-3 and assigning herds torisk-based surveillance (RBOV)dPen-faecal samplesClarify distribution and type of infectionin the herd
Herds assigned to level 2 or 3,max. twice per yearPork carcasses at the slaughterhouse5 samples daily, pooled into oneanalysis5 samples per 200 slaughtered pig,pooled into one analysis5 samples every 3rdmonth,pooled into one analysis1 sample every 3rdmonth
Swab samples from 3 designated Slaughterhouses slaughtering more thanareas (3x100 cm2) after min. 12 h 200 pigs per daychillingSwab samples from 3 designated Slaughterhouses slaughtering moreareas (3x100 cm2) after min. 12 h than 200 pigs per month or 200 or lesschillingpigs per daySwab samples from 3 designated Slaughterhouses slaughtering moreareas (3x100 cm2) after min. 12 h than 50 pigs per month or less thanchilling200 pigs per monthSwab samples from 3 designated Slaughterhouses slaughtering less than 50areas (3x100 cm2) after min. 12 h pigs per monthchilling
a) Herds with index above 10 have to pay a penalty for each pig sold.b) Producers are paid a reduced price per animal in herds withSalmonella-indexhigher than 5. Pigs from herds in Level 3 mustbe slaughtered under special hygienic precautions.c) The herd owner must inform buyers of breeding animals about the infection level and type ofSalmonella.d) RBOV: risk-based surveillance where the sample size in herds with a SP-index of zero (no positive samples in the previousthree months) are reduced to one sample per month.Source: Danish Veterinary and Food Administration
Annual Report on Zoonoses in Denmark 2009Annual Report on Zoonoses in Denmark 2009
51
Appendix D
Appendix D
Table A37. Typing methods used in the surveillance of foodborne pathogens in Denmark, 2009MethodsIsolatesHumanaSalmonella
SerotypePhage typeAntimicrobialresistanceAllS.Typhimurium andS.EnteritidisS.Typhimurium,50% ofS.Enteritidis,approx. 90% of otherserotypesS.TyphimuriumOutbreak investigationsIsolates from 3 districts forDANMAP surveillanceOutbreak investigationOutbreaks investigaions,researchAllAllAllAllAllIsolates from one districtAllS.Typhimurium andS.EnteritidisS.Typhimurium andoccasionally other serotypesAllS.Typhimurium andS.EnteritidisS.Typhimurium andoccasionally other serotypesFoodAnimal
MLVAPFGEAntimicrobialresistancePFGEMLSTVTECSerotypeVirulence profilePFGEListeria
SerogroupPFGEYersinia enterocolitica
O-group
S.Typhimurium (outbreakinvestigations)Outbreak investigationsOnly for DANMAP surveil-lance purposesNoneNone
S.Typhimurium (outbreakinvestigations)Outbreak investigationsOnly for DANMAP surveil-lance purposesNoneNone
Campylobacter coli/jejuni
AllAllNoneNoneNoneNone
AllAllNoneNoneNoneNone
a) The number of laboratory-confirmed cases of zoonoses in humans is shown in appendix B, Table A2.Source: Statens Serum Institut and Danish Zoonosis Laboratory, National Food Institute
52
Annual Report on Zoonoses in Denmark 2009
Appendix EPopulation and slaughter dataTable A38. Human population, 2009Age groups (years)0-45-1415-2425-4445-6465+Source: Statistics Denmark
Males167,172345,871346,375738,150745,971399,7472,743,286
Females158,895329,380331,088728,155740,822503,1122,791,452
Total326,067675,251677,4631,466,3051,486,793902,8595,534,738
Total
Table A39. Number of herds/flocks, livestock and animals slaughtered, 2009Herds/flocksaLivestocka(capacity)Slaughter pigs (>30 kg)CattleBroilersLayers (excl. barnyard)TurkeysSheep & lambsGoatsHorses8,56922,479578288498,7383,626-6,657,0611,626,52821,993,0933,020,000486,839164,85725,799-
Number slaughtered18,972,880507,200100,132,000-7,58889,9872,0732,863
a) March 2010.Source: The Central Husbandry Register, Statistics Denmark and Danish Veterinary and Food Administration
Table A40. Number of farms in the broiler production, 2009No. of holdingsNo. of houses/flocksRearing period (grandparent)Adult period (grandparent)Rearing period (parent)Adult period (parent)HatcheriesBroilers241646523751895152-578
Livestock (capacity)50,00050,000130,000720,000--
Source: Danish Veterinary and Food Administration and Danish Agriculture and Food Council
Annual Report on Zoonoses in Denmark 2009
53
Appendix E
Appendix E
Table A41. Number of farms in the table egg production, 2009No. of holdingsNo. of houses/flocksRearing period (parent)Adult period (parent)HatcheriesPullet-rearingLayers (excl. Barnyard)4659021156-152288
Livestock (capacity)20,00030,000-1,400,0003,020,000
Source: Danish Veterinary and Food Administration and Danish Agriculture and Food Council
Table A42. Distribution of import, export and production of fresh and frozen meat and the production oftable eggs in Denmark, 2007-2009. Data is presented in tonsYearPorkBeefBroiler meataTurkey meat Duck meatbTable eggscImport200720082009Export200720082009Production200720082009Consumptiond20072008200940,20183,05783,2651,263,1691,386,8491,321,8201,447,8941,602,6481,508,640224,925298,857270,08480,28781,42788,81861,37466,69078,572134,374149,744163,068153,287164,481173,31430,39032,48030,321105,741109,725108,377168,354157,543159,72393,00380,29881,6678,4238,2647,0001,6922,3451,5643449936,7655,9685,5293,8454,4944,2514547725342,9563706,3473,7223,717------66,80067,90060,600---
a) Natural-marinated chicken is included.b) Mixed products of ducks, geese and guinea fowl are not included.c) Consumption of table eggs is assumed to be roughly the same as the production, since import and export of table eggs is mini-mal.d) Consumption = Production + import - exportSource: Statistics Denmark
54
Annual Report on Zoonoses in Denmark 2009
Appendix FList of FiguresFigure 1.1. Total incidence of human salmonellosis and estimated human incidence due to broilers, pork, tableeggs and imported foods in Denmark, 1988 to 2009Figure 1.2. Estimated sources of 2,129 cases of human salmonellosis in Denmark, 2009Figure 1.3. Estimated sources of antimicrobial resistantS.Typhimurium infections in humans, 2007-2009Figure 1.4. Weekly distribution ofS.Enteritidis cases, 2008-2009Figure 2.1. Aetiology of foodborne disease outbreaks reported with a causative agent in the Food- and waterborneOutbreak Database (FUD), 2009Figure 3.1. Number of notified cases of invasive listeriosis, 2003-2009Figure 4.1.Salmonellaculture results in slaughter pigs from 52 organic herds, 27 free range herds and 147 conventio-nal herdsFigure 5.1. PercentCampylobacterpositive organic and conventional broiler meat samples, April 2009-March 2010Figure 7.1. Overview of the monitoring and outbreak investigation network for reporting infectious pathogens inhumans, animals, foodstuffs and feedstuffs in DenmarkFigure A1. Incidence of human infections withS.Typhimurium by age and sex, 2009Figure A2. Incidence of human infections withS.Enteritidis by age and sex, 2009Figure A3. Incidence of human infections withSalmonellaother thanS.Typhimurium andS.Enteritidis by age andsex, 2009Figure A4. Incidence of human infections withCampylobacterby age and sex, 2009Figure A5. Incidence of human infections with VTEC by age and sex, 2009Figure A6. Incidence of human infections withYersiniaby age and sex, 2009Figure A7. Serological surveillance ofSalmonellain breeding and multiplying pigs based on monthly testing of bloodsamples, 2005-2009Figure A8. Serological surveillance ofSalmonellain slaughter pigs, 2005-2009Figure A9.Salmonellain pork, monitored at slaughterhouses, 2005-2009Figure A10.Salmonellain beef, monitored at slaughterhouses, 2005-2009
List of TablesTable 1.1. Top 10Salmonellaserotypes in humans and place of infection, 2008-2009Table 3.1. Presence ofListeria monocytogenesin foodstuffs (Centrally coordinated projects 2003-2010)Table 3.2.Listeria monocytogenesin RTE-products, 2005-2009Table A1. Estimated no. of reported human cases and percentage of cases per major food source, travel or outbreaks,2007-2009Table A2. Zoonoses in humans, number of laboratory-confirmed cases, 2000-2009Table A3. Foodborne disease outbreaks reported in the Food- and waterborne Outbreak Database (FUD), 2009Table A4. VTEC O-group distribution in humans, 2009Table A5. Serotype distribution (%) ofSalmonellafrom humans, animals, carcasses at slaughterhouse and importedmeat, 2009Table A6. Phage type distribution (%) ofS.Typhimurium from humans, animals and imported meat, 2009Table A7. Phage type distribution (%) ofS.Enteritidis from humans, animals and imported meat, 2009Table A8. Occurrence ofSalmonellain the table egg production, 2000-2009Annual Report on Zoonoses in Denmark 2009
55
Appendix F
Appendix F
Table A9. Occurrence ofSalmonellain the table egg layer flocks sorted by type of production, 2000-2009Table A10. Occurrence ofSalmonellain the broiler production, 2000-2009Table A11. Occurrence ofCampylobacterin broiler flocks and in fresh meat at slaughter, 2003-2009Table A12. Occurrence ofCampylobacterin non-heat treated broiler meat at retail, 2002-2009Table A13. Relative distribution ofCampylobacterspecies (%) in broilers before slaughter, 2003-2009Table A14. Occurrence ofSalmonellain turkey and duck flocks, 2005-2009Table A15. Occurrence of zoonotic pathogens in pigs in Denmark, 2009Table A16. Occurrence of zoonotic pathogens in cattle in Denmark, 2009Table A17. Cattle herds in theS.Dublin surveillance programme, January 2010Table A18. Distribution ofCampylobacter(%) in pig and cattle herds, 2000-2009Table A19. Results from the intensified control ofSalmonellaandCampylobacterin fresh meat based on a case-by-case risk assessment, 2009Table A20. Feed business operators own sampling ofSalmonellain compound feeds, feed processing and feed mate-rial, 2007 and 2009Table A21. Control ofSalmonellain compound feeds, feed processing and feed material, 2005-2009Table A22.Salmonellain three categories of meat and bone meal by-products not intended for human consumption,2009Table A23. Occurrence of zoonotic pathogens in pets, zoo animals and wild life in Denmark, 2009Table A24. The Bovine Spongiform Encephalopathy (BSE) surveillance programme for cattle, 2009Table A25. The Transmissible Spongiform Encephalopathy (TSE) surveillance programme for sheep and goats, 2009Table A26. Distribution (%) of prion protein genotype of sheep randomly selected, 2009Table A27. Centrally coordinated studies conducted in 2009Table A28.Listeria monocytogenesin ready-to-eat foods, 2009Table A29. Overview of notifiable and non-notifiable human diseases presented in this report, 2009Table A30. Overview of notifiable and non-notifiable animal diseases presented in this report, 2009Table A31.Salmonellasurveillance programme for the rearing flocks and adult flocks of the grandparent and parentgeneration of the broiler and table egg production, 2009Table A32.Salmonellasurveillance programme for the broiler flocks, 2009Table A33.Salmonellasurveillance programme for the pullet-rearing, table egg layer and barnyard/hobby flocks inthe table egg production, 2009Table A34.Salmonellasurveillance programmes for the duck and turkey flocks, 2009Table A35.SalmonellaDublin surveillance programme for the cattle herds andSalmonellasurveillance programme atslaughter, 2009Table A36.Salmonellasurveillance programme for the pig production, 2009Table A37. Typing methods used in the surveillance of foodborne pathogens in Denmark, 2009Table A38. Human population, 2009Table A39. Number of herds/flocks, livestock and animals slaughtered, 2009Table A40. Number of farms in the broiler production, 2009Table A41. Number of farms in the table egg production, 2009Table A42. Distribution of import, export and production of fresh and frozen meat and the production of table eggsin Denmark, 2007-2009
56
Annual Report on Zoonoses in Denmark 2009
NOTATER
Annual Report on Zoonoses in Denmark 2009
57
Contributing Institutions:Danish Zoonosis CentreNational Food Institute Technical University of DenmarkMørkhøj Bygade 19DK - 2860 SøborgTel: +45 40 21 53 77E-mail: [email protected]www.food.dtu.dkStatens Serum Institut Artillerivej 5DK - 2300 København STel: +45 3268 3268E-mail: [email protected]www.ssi.dk The Danish Veterinary and Food AdministrationThe Regional Veterinary and Food Control AuthoritiesMørkhøj Bygade 19DK - 2860 SøborgTel: +45 3395 6000E-mail: [email protected]www.fvst.dkThe National Veterinary Institute Technical University of DenmarkBülowsvej 27DK - 1790 Copenhagen VTel: +45 3588 6000E-mail: [email protected]www.vet.dtu.dkThe Danish Plant DirectorateSkovbrynet 20DK - 2800 LyngbyTel: +45 4526 3600E-mail: [email protected] www.pdir.dkDanish Agriculture and Food CouncilAxelborg, Axeltorv 3DK - 1609 Copenhagen VTel: +45 3339 4000 E-mail: [email protected] www.lf.dk
National Food InstituteTechnical University of DenmarkMørkhøj Bygade 19DK - 2860 Søborg T: 35 88 70 00F: 35 88 70 01www.food.dtu.dkISSN: 1600-3837
