Det Energipolitiske Udvalg 2010-11 (1. samling)
EPU Alm.del Bilag 68
Offentligt
Anticipated Indirect Land Use Change Associated with Expanded Useof Biofuels and Bioliquids in the EU – An Analysis of the NationalRenewable Energy Action PlansNovember 2010Author – Catherine Bowyer, Senior Policy Analyst, IEEP12This report is available to download atwww.ieep.eu
ContentsSummary ......................................................................................................................... 21. Introduction ............................................................................................................ 32. Methodological Approach ...................................................................................... 43. Delivering the 2020 Target ..................................................................................... 64. Anticipated Increase in Biofuel Usage Associated with the RED............................ 95. Calculating Indirect Land Use Change .................................................................. 106. Anticipated Indirect Land Use Change – the Size of the Challenge...................... 127. Indirect Land Use Change – The GHG Consequences........................................... 138. Assessing the Additional Impact of Bioliquids...................................................... 199. Conclusions ........................................................................................................... 2110.Annex ................................................................................................................ 22
1
IEEP would like to thank Ian Skinner of Transport and Environmental Policy Research for his support in peerreviewing this report to ensure its quality and accuracy.2This report was prepared by IEEP for Transport and Environment and partners
1
Summary-This study represents a first analysis and estimate of the effects of Indirect Land Use Change (ILUC)associated with the increased use of conventional biofuels that EU Member States have planned for withintheir National Renewable Energy Action Plans (NREAPs). These documents specify how Europeangovernments plan to deliver their transport targets under the Renewable Energy Directive (RED). 23NREAPs were available at the time of drafting and the analysis is based upon these. ILUC effects have beencalculated using recently released studies by the European Commission.The RED target, for 10% of transport fuel to be from renewable sources by 2020, is anticipated to stimulatea major increase in the use of conventional biofuels up to 2020, contributing up to 92% of total predictedbiofuel use or 24.3 Mtoe in 2020. This would represent 8.8% of the total energy in transport by 2020; 72% ofthis demand is anticipated to be met through the use of biodiesel and 28% from bioethanol.Member States are anticipating importing significant proportions of these fuels and their associatedfeedstocks. Figures reported equate to 50% of bioethanol and 41% of biodiesel in 2020. However, actualimported levels of feedstock are anticipated to be higher as it is unclear whether the imports anticipated byMember States refer to feedstock for ‘domestic’ processing into biofuels as well as imports of processedbiofuels.Additionally Member States are estimated to be sourcing 4349 Ktoe of bioliquids from conventionalfeedstocks in 2020. Used for heating and electricity, these will have similar ILUC consequences as forbiofuels representing an additional emission source of greenhouse gas emissions (GHG). ILUC impacts fromthese bioliquids are estimated to equate to an area of between 1 and 1.9 million ha and GHG emissions ofbetween 211 and 400 MtCO2e.In 2020 15,047 Ktoe of the biofuels used would be additional to 2008 levels and sourced from conventionalie primarily food crop based feedstocks; this can be considered to be additional demand stimulated by theRED.Using currently available data, this additional demand for these fuels is anticipated to lead to between 4.1and 6.9 million ha of ILUC ie an area equivalent to just larger than Belgium to just under that of the Republicof Ireland.This additional ILUC was calculated to result in between 44 and 73 million tonnes of CO2 equivalent(MtCO2e) on an annualised basis ie between 876 and 1459 MtCO2e in total.Under the RED biofuels must deliver a required level of GHG savings relative to fossil fuels to count towardsthe targets. Even when this saving is taken into account estimated additional GHG emissions arising fromILUC are between 273 and 564MtCO2e (for the period 2011 to 2020) or between 27 and 56 MtCO2eannually. The latter equates to up to 12% of emissions from EU agriculture in 2007 or 6% of total transportemissions. Put another way this would be equivalent to between 12 and 26 million additional cars on theroad across Europe in 2020.Based on this assessment, and the assumptions adopted, use of additional conventional biofuels up to 2020on the scale anticipated in the 23 NREAPs would lead to between 80.5% and 167% more GHG emissionsthan meeting the same need through fossil fuel use.This analysis was based on what were considered the most appropriate assumptions using the evidence andmodels available at the time of drafting. However, sensitivity analysis shows that even with far lowerestimates of ILUC arising per unit of additional biofuel consumption and of GHG emissions per unit area ofILUC the use of conventional biofuels envisaged in the NREAPs fails to deliver the reduction in GHGemissions required under the RED, and leads to an increase in GHG emissions overall.This analysis underlines the need to address the question of ILUC as a priority for biofuels policy and toinclude ILUC in the criteria for assessing whether biofuels should count towards the delivery of targetsunder the RED for 2020, and more generally EU European climate change mitigation goals. Moreover, it alsoraises urgent questions about the appropriateness of projected levels of conventional biofuel use byMember States in 2020. Many have focused little effort in their NREAPs on promoting advanced biofuels orpursuing a greater efficiency in their transport sector so as to reduce the overall climate burden.2
-
-
-
-
-
--
-
-
-
1. IntroductionThe EU Renewable Energy Directive, RED, on the promotion of the use of energy fromrenewable sources3(Directive 2009/28/EC) is a powerful measure at the heart of Europeanenergy and climate policy. It sets out two targets aimed at the promotion of renewable energy.The first requires the delivery of 20% of total energy from renewable sources by 2020, with thelevel of effort differentiated across the Member States. The second specifically promotes theuse of energy from renewable sources within the transport sector, requiring 10% of alltransport fuels to be delivered from renewable sources by 2020 across every Member State.When the Directive was adopted, it was unclear precisely what technologies and approacheswould be adopted by the Member States in order to deliver these targets. To reveal, open toscrutiny and monitoring, the national approaches to meeting these targets the RED alsoexplicitly requires that each Member State produce a National Renewable Energy Action Plan(NREAP).The NREAPs are critical to understanding the anticipated consequences associated withmeeting the EU RED targets. As of mid October 2010 23 Member States4had submitted theirNREAP to the Commission.This analysis represents a first attempt to analyse the datapresented by the Member States to ascertain the characteristics of the demand generated bythe targets in one important area: the anticipated use of biofuels.To deliver the RED transport target there are a number of potential technologies available toMember States:-use of conventional, also known as first generation, biofuels;-use of advanced biofuels, these are specified within the RED under Article 21.2 as thosederived from wastes, residues, non-food cellulosic material, and ligno-cellulosic materialand count double towards the delivery of the 2020 transport target;-efficiency gains within the transport sector that reduce fuel needs, therefore, the overallquantity of renewable energy needed to meet the target; and-the electrification of the transport system, utilising renewable electricity.Meeting the RED target for transport, and also to a more limited extent the use of bioliquids inheating and electricity generation, is anticipated to increase the demand for conventionalbiofuel and bioliquid feedstocks5. Moreover the RED is an important element of the EU’s effortsto reduce greenhouse gas (GHG) emissions. As a consequence the RED specifies sustainabilitycriteria intended to both limit the consequences of direct land use change6associated with
34
Directive 2009/28/EC can be downloaded athttp://www.energy.eu/directives/pro-re.pdfAustria, Bulgaria, Cyprus, Czech Republic, Denmark, Finland, France, Germany, Greece, Ireland, Italy, Latvia,Lithuania, Luxembourg, Malta, Netherlands, Portugal, Romania, Slovakia, Slovenia, Spain, Sweden and the UK5These include commodities such as oil seed crops including rape seed and soy, palm oil, wheat, maize, sugar caneand sugar beet.6The RED specifies that biofuel feedstocks used to comply with the EU targets must not be grown on land thatheld certain environmentally sensitive characteristics after January 2008 ie that is considered highly biodiverse ora significant carbon store. Article 17 of the Directive specifies the land uses to be protected. As a consequencethese land uses should be protected from being directly converted to feedstock production to meet expanded EUdemand.
3
expanded demand for feedstocks and requires minimum (GHG) savings to be delivered by allbiofuels and bioliquids used to meet the EU targets7.While the RED specifies mechanisms for dealing with direct land use change arising from thecultivation of feedstocks, it as yet fails to take into account indirect land use change (ILUC).ILUC is generated by the elevated demand for agricultural commodities as a consequence ofbiofuel consumption. When biofuels are grown on existing arable land, which will often be thecase, ILUC can ensue elsewhere, either in the same country or in other parts of the world. Thisis because current demand for food and animal feed may well remain unchanged and cannotbe assumed to fall. As a consequence pre-existing agricultural production can be displaced intonew areas. This displacement will cause some new land to be brought into arable productionpossibly far from the area in which the biofuel feedstock is being grown, potentially impactinggrasslands, forests or other natural habitats.The expansion in the area of cultivation leads toland use change, which is associated with significant GHG emissions as a consequence of therelease of carbon locked up in soils and biomass. Moreover the expansion in cultivated areaand more intensive use of agricultural land can pose a potentially significant threat tobiodiversity globally.For the RED Directive to deliver the intended goal of contributing towardsthe EU’s effort to combat climate change the additional GHG emissions from ILUC would needto be controlled, ensuring they are less than the savings in direct emission reductions deliveredby biofuel use.Given the information held in the NREAPs and ongoing work to determine the ILUC impactsassociated with biofuel use in the EU, it is now possible to estimate the ILUC consequencesassociated with an individual Member State’s biofuel demand driven by the 2020 targets. Thispaper presents the initial findings of such an analysis based on the 23 NREAPs published todate.The aim of this exercise is to help inform debate on ILUC and its consequences. This isintended to support the Commission’s work on ILUC, given that a report and new potentialproposals to take account of ILUC are scheduled to be published by the end of 2010 – asspecified in the RED.
2. Methodological ApproachThis assessment incorporated 5 key analytical steps set out in figure 1, below. These representa process starting with the collation of data from the NREAPs and using published data andmethodologies to establish an acceptable baseline for measuring the ILUC impact of expandedbiofuel demand associated with the RED targets. These methods allowed the anticipated areaof ILUC to be estimated along with the volume of associated GHG emissions. The primary datasources used within the assessment were as follows:–NREAP information per Member State regarding the level of conventional and Article 21.2biofuels to be used by 2020, bioliquid usage in 2020 and other transport related actions todeliver the RED targets8;–DG Energy data on 2008 usage of biofuels by Member State9;
7
The RED Article 17.2 requires that biofuels and bioliquids used to meet the EU targets or that are subsidised byMember States deliver a 35% GHG saving compared to the use of fossil fuels (this applies from December 2010when the EU Directive must formally be transposed by the Member States). The required level of saving rises to50% from 1 January 2017 and 60% from 1 January 2018 for fuels produced by installations that started productionafter January 2017.8These can be downloaded athttp://ec.europa.eu/energy/renewables/transparency_platform/action_plan_en.htm9This is available athttp://www.eurobserv-er.org/pdf/baro198.pdf
4
–
––––
Joint Research Centre (JRC) analysis reviewing ILUC modelling efforts and conclusionsregarding potential ILUC impact in terms of land use change measured in hectares (ha) andassociated GHG impact10(supported by analysis by other groups of ILUC impacts includingthat by Ecofys11);Data from the Intergovernmental Panel on Climate Change regarding GHG emissions fromland use change12;FAO data on area of agricultural and arable land in EU Member State13;DG Energy data on GHG emissions per Member State in 2007 – both for transport and totalGHG emissions (excluding international bunkers and LULUCF)14;Data on anticipated fuel efficiency and car usage up to 202015
Figure 1 – Outline of the methodological steps and approach used within this analysisStepApproach1Collation of data from theexisting NREAPs on biofueldemands per MSIdentification of increase inconventional biofuel use by2020 attributable to the REDtargetIdentification of anticipatedILUC associated with theincrease in biofuel useProportion of renewable energy in transport sector by 2020Total demand – biofuels, bioethanol, biodieselDemand for conventional vs advanced biofuels vs renewable electricity intransportSupply impact ie proportion of domestic vs imported biofuels to be usedAssumed a basis of Jan 2008 for pre-RED demand for bioethanol and biodieselAssumed that Jan 2008 usage is 100% conventional biofuelsIncrease = projected MS usage of bioethanol/biodiesel – 2008 levelsILUC = anticipated increase in level of bioethanol/biodiesel use by 2020 x ILUCconversion factor ie kHa change per kToe relevant fuelILUC conversion factors based on parameters derived from JRC analysis of ILUCmodelling – provides an upper and lower estimate – see annex regardingcalculations for approach to determining ILUC parametersGHG impact = ILUC scale x GHG conversion factor ie tCO2e per khaGHG associated with land use change based on conclusions from the JRC studyand estimates from IPCC – lower, central and upper values used to create ameanGHG volumes divided by 20 to provide an annualised level of emissions in linewith the RED specification and emission savings associated with biofuel usagesubtracted from the total to provide a picture of additional ILUC emissions by2020.Comparing the level of biofuel related ILUC for a single Member States withthe total area of arable land in that MSComparing the GHG impacts for a single Member State to their correspondingtransport emissions and emissions from agricultureCalculating the impact in terms of additional cars on the road in 2020 based onadditional GHG emissions associated with ILUC
2
3
4
Identifying the GHG emissionconsequences associated withILUC
5
Converting the ILUC estimatesinto meaningful proxies
10
European Commission, Joint Research Centre (JRC), Institute for Energy, 2010, Indirect Land Use Change fromincreased biofuels demand, Comparison of models and results for marginal biofuels production from differentfeedstocks, Robert Edwards, Declan Mulligan and Luisa Marelli11Ecofys, October 2009, Summary of approaches to accounting for indirect impacts of biofuel production, StijnCornelissen and Bart Dehue12For further details of their work seehttp://www.ipcc.ch/ipccreports/sres/land_use/index.php?idp=29913This can be downloaded athttp://faostat.fao.org/14Available for download athttp://ec.europa.eu/energy/publications/statistics/doc/2010_energy_transport_figures.pdf15Details on car usage set out in http://www.transportenvironment.org/Publications/prep_hand_out/lid/568 ,details on car emissions determined in discussions with external experts
5
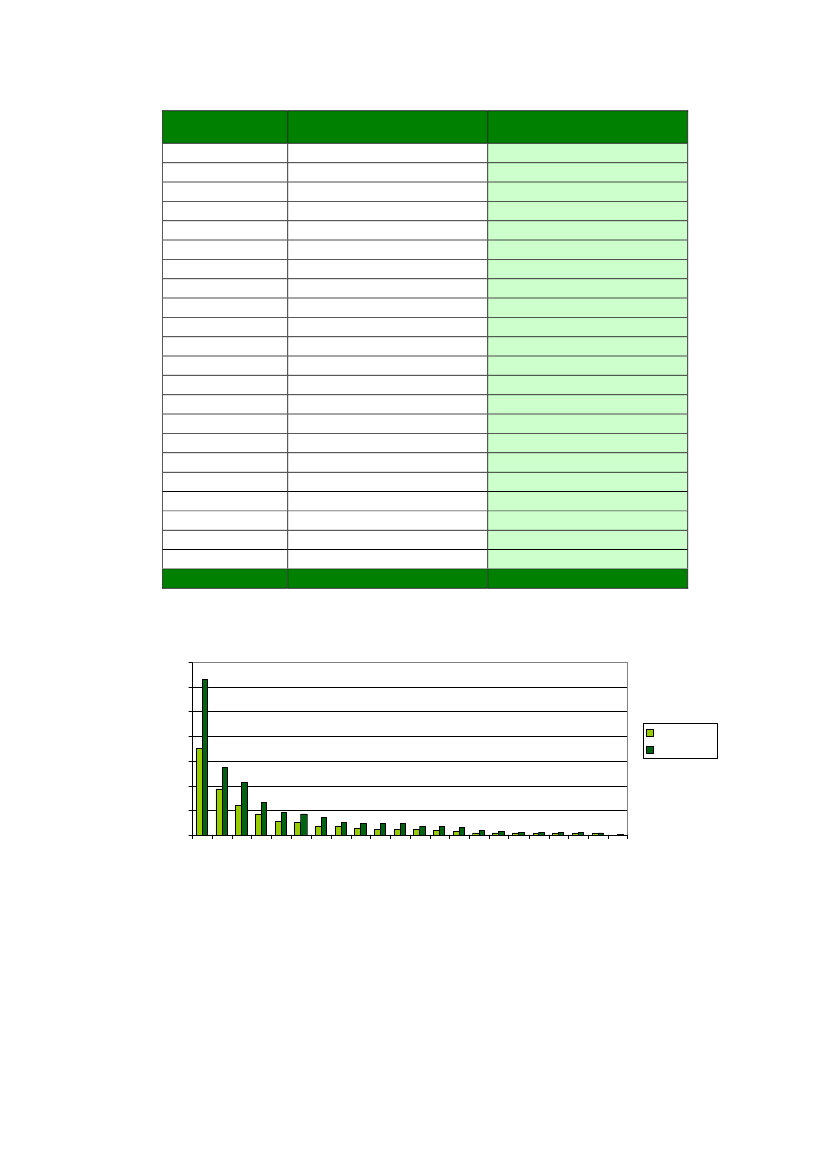
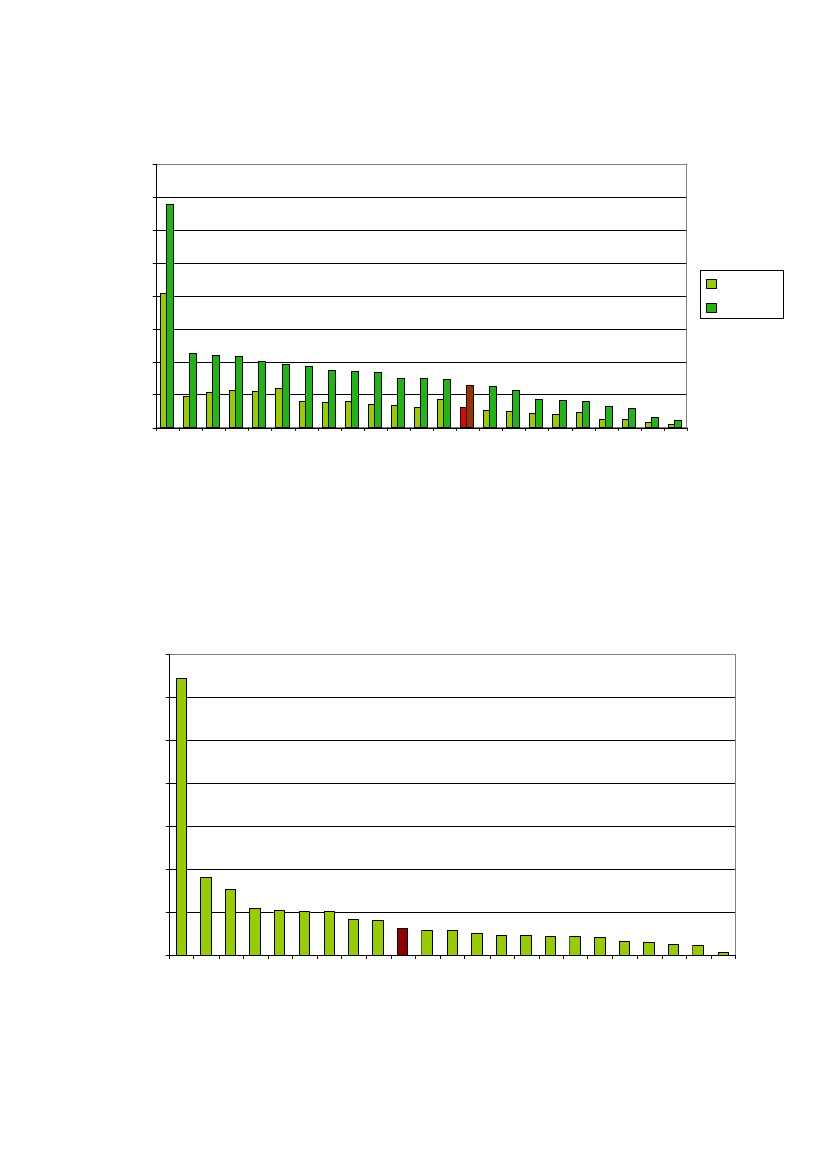
3. Delivering the 2020 TargetThe 23 NREAPs indicate that by 2020 a total of 26 Mtoe (Million tonnes of oil equivalent) ofbiofuels will be being made use of by the relevant Member States. This represents9.5% ofenergy in transport within these Member States being sourced from biofuels in 2020,takingaccount of energy efficiency gains anticipated. This compares to a total for usage of biofuels forall Member States of 10.2 Mtoe in 2008 or 9.4 Mtoe used in the relevant 23 Member States.The 2020 target is, therefore, anticipated to stimulate a major increase in the use of biofuelsby 2020, with these remaining the primary technology for delivering renewable energy in thetransport sectorand delivering the RED 10% target.Of this, the majority ieover 92% or 24.3 Mtoes of the biofuels utilised are anticipated to beconventional biofuelsie sourced primarily from agricultural feedstocks such as oil seeds, palmoil, sugar cane and beet, wheat, soy etc. This would represent 8.8% of the total energy used intransport by 2020. Advanced biofuels are anticipated to account only for 0.6% of total energy intransport by 2020 amounting to 1.7Mtoe by 2020 in the 23 Member States. It had been hopedthat the bonus provided for in the RED for the use of advanced biofuels (ie that they countdouble towards the achievement of the 2020 target) might better stimulate their greater use.Despite this, however, it seems that production of large volumes of advanced biofuels will notbe stimulated by the RED.The anticipated scale of total biofuel use and the selective use of advanced biofuels by MemberStates is highly varied given the huge differences in the size and make up of national transportsectors. For example Germany is anticipated to use by far the highest volumes of biofuels in2020, followed by the UK, France, Spain and Italy. This high user group is anticipated to accountfor a total of 19.5 Mtoe of biofuel by 2020 – see figure 2. All other Member States are eachanticipating using less than 1 Mtoe biofuel by 2020.In terms of use of advanced biofuels, Cyprus states that all its biofuels will be sourced from thisgroup by 2020 while Denmark anticipates using primarily conventional biodiesel but onlyadvanced bioethanol sources. Meanwhile others, including some major users, such as Austria,Greece, Lithuania, Luxembourg, Slovenia and the UK anticipate 100% use of conventionalbiofuels in 2020. The largest user by volume of advanced biofuels in 2020 is anticipated to beItaly (400 Ktoe ie thousand tonnes of oil equivalent), followed by Spain, France, Finland,Germany and the Netherlands. Advanced biodiesel based fuels are anticipated to account foralmost double that of advanced bioethanol (1022 versus 539Ktoe respectively16). Figure 2presents the total projected usage of biofuels split between conventional and advancedbiofuels, demonstrating the contrast in volumes. Figure 3 presents the overall percentage useof conventional biofuels by Member State with the proportion standing at over 80 per cent inthe great majority.
16
It should be noted that Romania did not provide details of the break down of biofuel usage within its NREAPhence total figures for advanced biofuel usage different slightly from the breakdown between biodiesel andbioethanol.
6
Figure 2 – Member State Usage of Biofuels in 2020 based on NREAP figures – comparing totalvolume usage of conventional and advanced biofuels60005000Biofuel Use - Ktoe
40003000200010000FranceSwedenGreeceAustriaFinlandRomaniaIrelandSpainItalyLuxembourgBulgariaGermanyNetherlandsPortugalUKCzech RepublicDenmark
Use of Biofuels inCompliance withArticle 21.2 KtoeUse ofConventionalBiofuels - Ktoe
Slovenia
Slovakia
Lithuania
Latvia
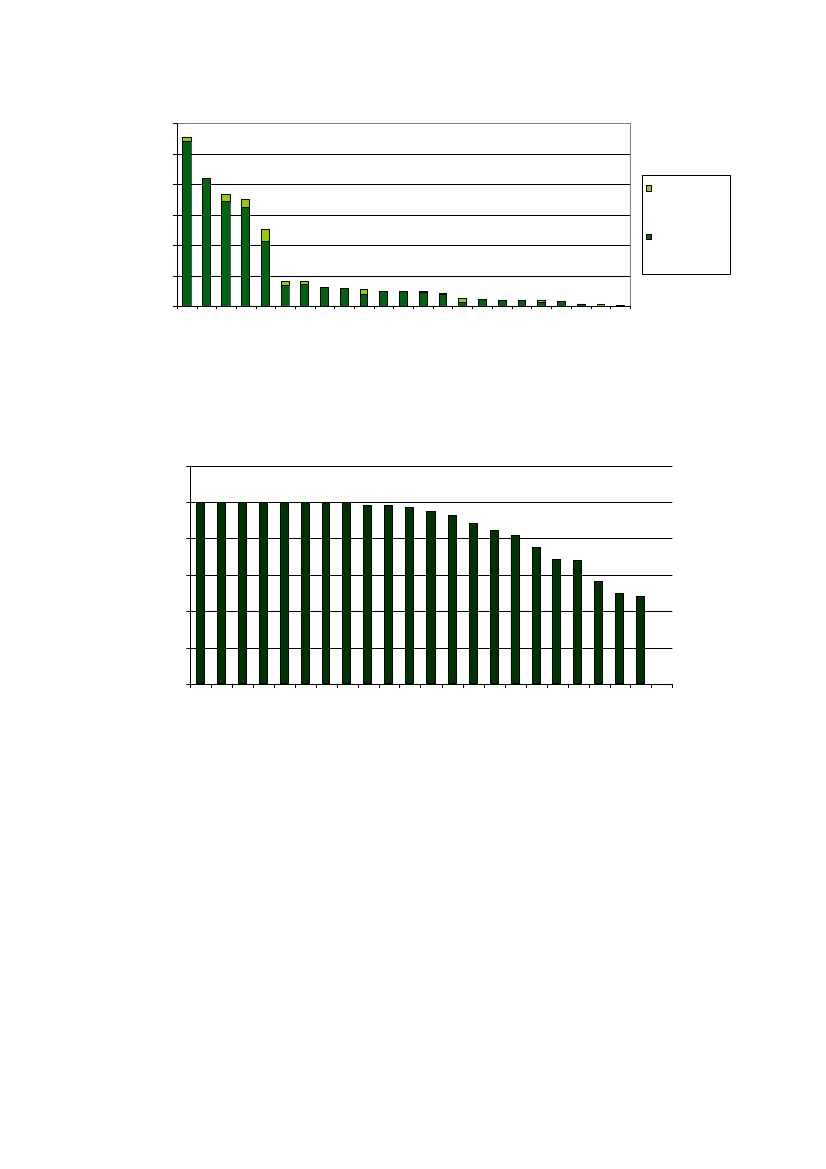
Figure 3 – Percentage of biofuel use anticipated to be from conventional biofuels by 2020Percentage Conventional Fuels in 2020
120100806040200SloveniaSlovakiaIrelandAustriaGreeceLithuaniaLuxembourgRomaniaBulgariaFranceSwedenPortugalGermanyNetherlandsFinlandCzech RepublicDenmarkLatviaSpainItalyMaltaUKCyprus
There is much higher usage of biodiesel anticipated in 2020 than bioethanol; 72% of biofuelsare anticipated to be sourced from biodiesel.In total 18.9 Mtoe of biodiesel are anticipated tobe consumed in 2020 compared to 6.2 Mtoe of bioethanol. Only Sweden anticipates makinguse of over 50% bioethanol in 2020; by contrast Slovenia and Luxembourg would be utilisingapproximately 90% biodiesel.In 2020 Member States are certainly not all anticipating to be sourcing their biofuelsdomestically withmany relying on a high proportion of importsto secure biofuel supplies. Onaverage the 23 Member States are anticipating importing 50% of bioethanol and 41% ofbiodiesel in 2020, equating to 3.1 and 7.7 Mtoe respectively. The reliance on imports and thetotal volumes involved varies significantly across the Member States, with imports accountingfor between 100% and 0% of biofuels depending on the country. It should, however, be notedthat it is unclear from many of the NREAPs whether the figures for imports relate explicitly to7
Cyprus
Malta
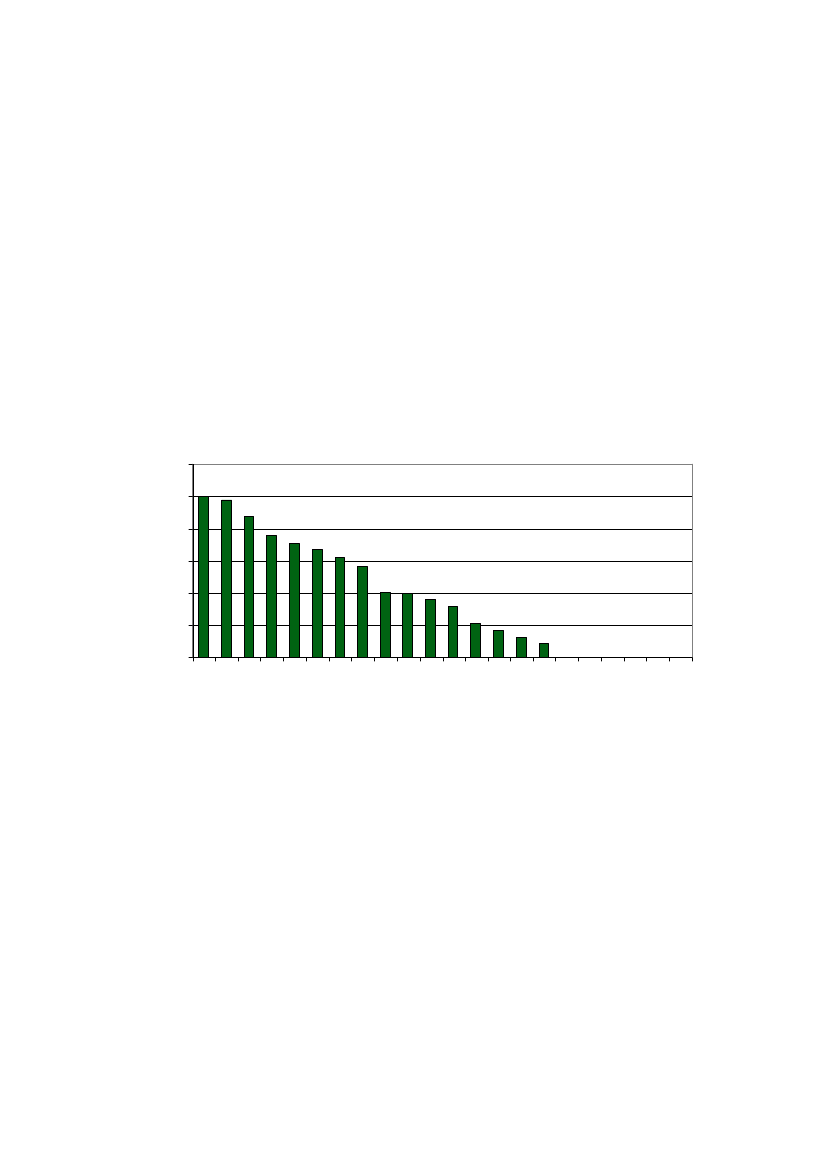
the importing of all materials to be used as biofuels in 2020 into the country concerned iewhether they include both raw feedstocks for conversion to biofuels in country and pre-processed biofuels or whether they relate only to pre-processed biofuels. Examining the figuresit is considered that a mixture of approaches to this calculation has been applied by nationalgovernments. Therefore, overall levels of imports related to biofuel consumption may higherthan reported. Imports relate to levels entering the market in that particular Member State,therefore, probably include exports from other EU countries.The UK is anticipated to be importing by far the largest quantities of bioethanol in 2020,anticipating use of 1.5 Mtoe of imported bioethanol or 81% of its total bioethanol usage; levelsof imports of bioethanol by all other Member States lie below 450Ktoe. Germany and the UKanticipate significantly greater volumes of biodiesel imports than other Member States, 2.9 and2.2 Mtoe respectively or 64 and 91% of their biodiesel usage.In total the UK is expected to bethe highest importer of biofuels by volume utilising 3.7 Mtoe of imported biofuels in 2020.Figure 4 presents the anticipated reliance on imports of biofuels per Member State inpercentage terms.Figure 4 – Reported reliance of the Member States on the imports of Biofuels to Meet Demandin 2020120Proportional Use of Imports
100806040200LatviaSlovakiaLuxembourgLithuaniaNetherlandsGermanyCzech RepublicDenmarkSloveniaIrelandMaltaGreeceItalySwedenAustriaBulgariaFranceSpainFinlandPortugalCyprusUK
*It should be noted that Romania did not report the breakdown between different biofuel sourcing and usagewithin the NREAP therefore they are excluded from this figure.
Liquid fuels from biomass can also be used in stationary energy sources, such as dieselgenerators or space heaters replacing fossil fuels to provide heat and power. These bioliquidswould be anticipated to be sourced in the same manner to biofuels and are subject to the samesustainability criteria under the RED. For those countries utilising bioliquids this would result inimpacts additional to those associated with transport demand. Consequently, bioliquids shouldalso be considered in any ILUC assessment for biofuels and also within policies designed toalleviate this. The scale of additional impact associated with bioliquids is discussed in section 8of this report.Within their NREAPs only eight of the 23 Member States explicitly specified thatthey anticipate making use of bioliquids within these stationary sources, generating anadditional demand for 5,462Ktoe primarily associated with heating- anticipated usage byMember State is presented within Table 1. Additionally the UK noted in their NREAP that theyhave yet to determine levels of bioliquid usage.8
Table 1 – Anticipated use of bioliquids in heating and electricity supplyMember StateAustriaDenmarkFinlandGermanyItalyPortugalSloveniaSwedenTotalTotal bioliquids in stationarysources – Ktoe by 202039302183656893228655,462
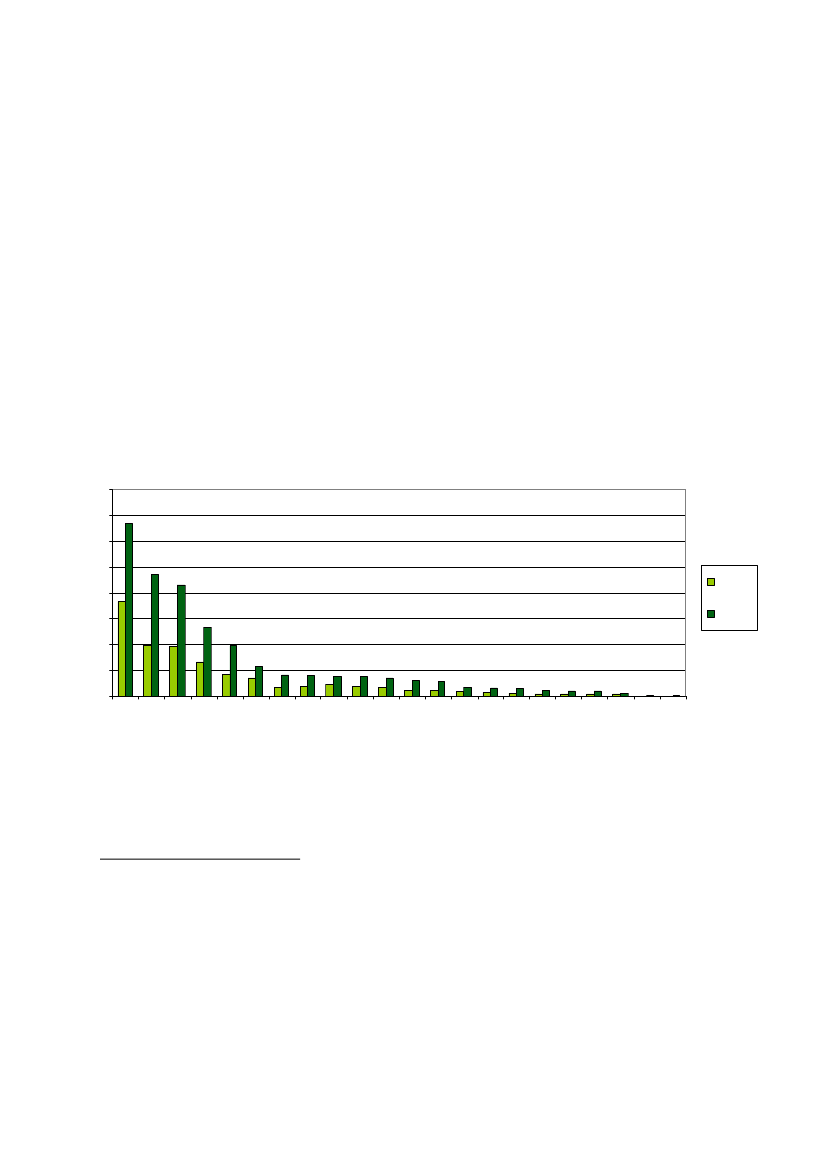
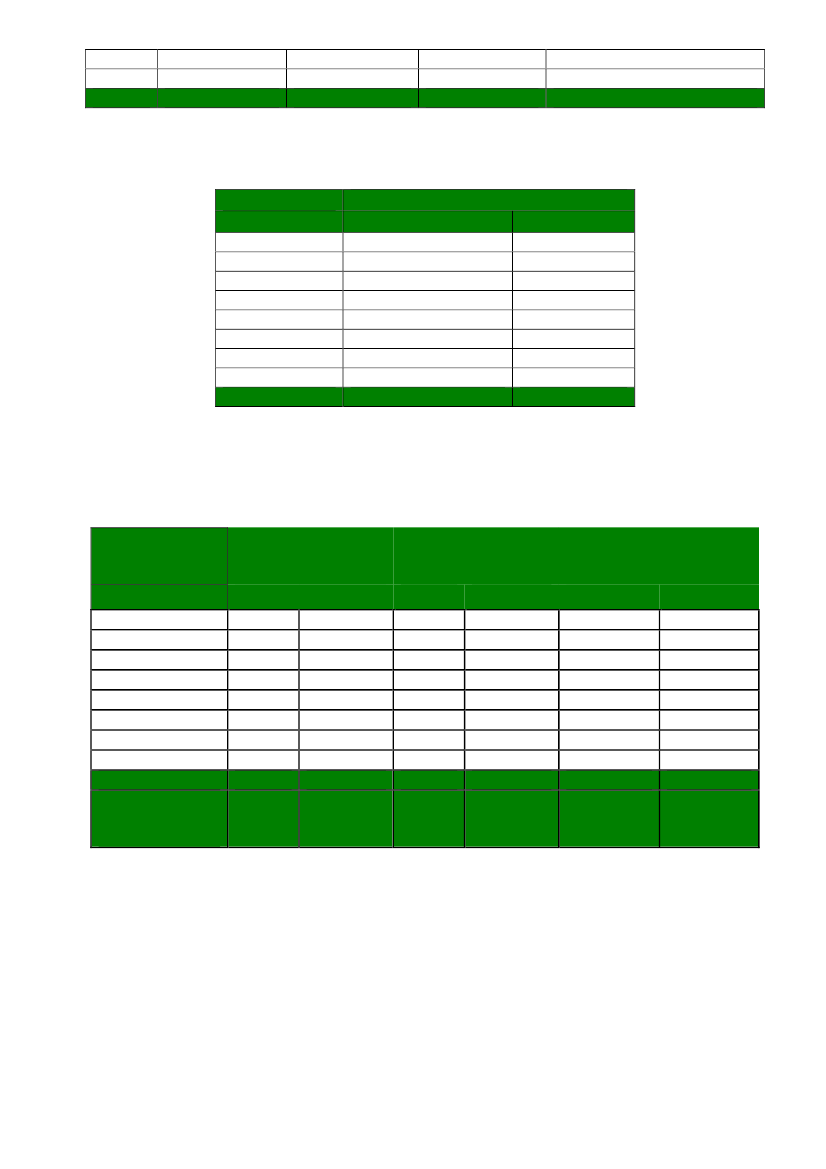
4. Anticipated Increase in Biofuel Usage Associated with the REDTo assess the ILUC impacts associated with the increase in biofuels use generated by the RED itis necessary to understand the baseline usage of biofuels prior to the Directive coming intoforce. Within this analysis the baseline usage of biofuels is assumed to be equivalent to totalconsumption in 2008, based on data reported in the Eurobserver. This baseline is equivalent toothers used within the RED to determine the limit of its influence. The additional biofueldemand generated by the RED would, therefore, be the difference between 2008 figures andpredicted figures for 2020.At present ILUC assessments have only been completed to assess the impact of conventionalbiofuels.While it is noted that advanced biofuels, especially those based on lingo cellulosictechnologies or non-food crops will also place demand on land it is not currently possible toappropriately estimate their impact with much accuracy.As a consequence this assessment ofthe increase in biofuel consumption is confined to the anticipated rise in the consumption ofconventional biofuels up to 2020. Given the limited market penetration of advanced biofuels in2008 it is assumed that all biofuel usage in that year was conventional. For the purpose of thisanalysis the increase in conventional fuel use associated with the RED is, therefore, total EU2020 biofuel consumption less total 2008 biofuel use and minus any use of advanced biofuels in2020. The uncertain impacts of advanced biofuels, which will be responsible for someadditional ILUC, are thus set aside.Based on the data specified in the NREAPs by2020 total additional usage of conventionalbiofuels is calculated to be 15.1 Mtoe, with a split of 72% new biodiesel demand and 28% newbioethanol demand.While the UK will not be the highest user of biofuels in 2020, it foreseesthe greatest increase in conventional biofuel use due to the relatively low 2008 baseline, thelack of use of advanced biofuels and low assumptions regarding energy efficiency in thetransport sector by 2020. Germany, while the largest overall user of biofuels in 2020 drops tothird place in the ranking of additional demand due to the relatively high 2008 baseline and theinclusion of advanced biofuels and higher levels of other renewable energy sources in thetransport mix in 2020. Amongst the 23 Member States reviewedthe UK, Spain, Germany, Italyand France account for 72% of the additional biofuel demand between 2008 and 2020.
9
Table 2 – Increase in conventional biofuel usage anticipated as a consequence of the RED,between 2008 and 2020CountryUKSpainGermanyItalyFranceGreeceCzech RepublicIrelandNetherlandsSwedenRomaniaPortugalFinlandBulgariaLuxembourgSlovenia*DenmarkLithuaniaAustriaSlovakiaLatviaMalta*CyprusTotal
Increase in Bioethanol Usage,2008 to 2020 (Ktoe)1640255396442160414661211432501402726422217-52025430604250
Increase in Biodiesel Usage,2008 to 2020 (Ktoe)176423801963972916136396304252123228313280150150154130857922113-1410797
Increase in Biofuels Usage,2008 to 2020 (Ktoe)3403263523601414107655046242539437336634030619217217112510610465119-1415047
*Cyprus and Denmark show negative figures as they anticipate making use of a high proportion of advanced biofuels by 2020.Given that it is not possible to take account of the impacts of these fuels at present these negative figures were excluded fromfurther analysis.** It should be noted that in their NREAP Romania did not report the split between different biofuel uses in 2020, in order toenable further calculations the total figure for Romanian biofuel usage was differentiated between bioethanol and biodieselsources based on the average split across all other Member States.
5. Calculating Indirect Land Use ChangeTo convert the increase in biofuel demand generated by the RED into an approximation of ILUCimpact it is necessary to apply a conversion factor predicting the anticipated extent of ILUC interms of area change per unit of additional biofuel consumed. There are a number of economicmodels that have been developed to estimate the impact of a marginal increase in biofuelproduction. A comparative analysis of the outputs of these models has been undertaken by theJoint Research Council (JRC)10. The JRC analysis presents a range of potential factors that couldbe used to convert estimates of biofuel consumption into estimates of associated land usechange and enables these to be compared and contrasted. For the purposes of this study thecomparative analysis completed by the JRC has been used as a basis for determining robustILUC conversion factors, which have been applied using upper and lower bounds.While the scenarios specified within the JRC study as a basis for modelling efforts are notperfectly tailored to the anticipated fuel mix in 2020, they provide the best available proxy forconverting a given volume of biofuel use to anticipated area of associated ILUC.Clearly thiscan be achieved only at an aggregated level. The assumptions in the different models have an10
important influence on the resulting outcomes. To ensure the overall rigour of this exercise andthat the model results and conversion factors were appropriately applied, we consulted anumber of experts within the field and examined in detail the model assumptions to developthe best set of conversion factors for this analysis.The ILUC conversion factors used within this assessment are presented in table 3. A summary ofthe logic behind the determination of these factors is presented in the Annex of this report,calculations. Lower and upper bounds were used in the analysis to take account of thedifferences in outcomes associated with variable modelling assumptions and consequentoutputs. The ILUC conversion factors are multiplied by the anticipated additional usage ofconventional bioethanol and biodiesel in 2020 to provide an estimated area in hectares of thepotential ILUC.Table 3 – ILUC conversion factors, expressed as thousand hectares of ILUC resulting from 1 Ktoeof additional biofuel consumption.ILUC conversion factor;1000 ha per KtoeLowerUpper0.390.520.230.44
FuelBioethanolBiodiesel
It should be noted that the factors derived represent relatively conservative estimates of ILUCbased on the JRC analysis and are likely to underestimate real GHG impacts associated withthe expanded agricultural production arising from ILUC.This is a consequence of theassumptions used within the modelling exercises. In particular the majority of models assumehigher levels of yields than are likely to be realised on land that is drawn into arable productionat the frontiers of cultivation. The JRC study also notes that the mix of feedstocks used in theproduction of biodiesel in some cases over estimates anticipated yield increases expected in thepalm oil sector. Moreover, as noted above, advanced biofuels and bioliquids will also have aland use impact additional to those arising from conventional biofuels, which it is not possibleto take into account here. Finally, the calculations of GHG impacts associated with ILUC, andmore generally with increased biofuel demand, are likely to inherently underestimate GHGemissions, as noted below.Estimates for emissions associated with ILUC only take into account the one-off release of GHGsassociated with the change of one land use to another. As such they do not take account of thefollowing additional sources of GHG emissions that would be associated with expanded andmore intensified cultivation of crops:-there is no allowance made for any sequestration forgone into the longer term by removalof a previous land cover, which might be significant in the case for example of young growthforest converted to arable;-estimates for ILUC often do not take into account that much land brought into arable usewill likely be less suited to cultivation than the existing area and therefore give lower yieldsfor a given level of inputs, hence emissions from cultivation may be higher than theaverage; and-all the ILUC models assume in addition to land use change a certain proportion ofintensification of existing agricultural production, which in turn is anticipated to lead tohigher GHG emissions per tonne of crop harvested. This would, for example, be associatedwith use of nitrogen rich fertilisers or loss of soil organic matter during ongoing cultivation.11
6. Anticipated Indirect Land Use Change – the Size of the ChallengeThe ILUC impacts attributable to additional conventional biofuel usage by 2020 in all 23Member States assessed within this study are between 4.1 and 6.9 million ha.At the lowerend this would be approximately equivalent to land use changing across the total area of arableland17in Hungary or double that in Denmark, Finland or Lithuania; or at the upper end would beequivalent to doubling the total area of arable land in the UK or a 50% increase in arable land ineither Poland or Spain18. This would also equate to at the lower end an area slightly larger thanBelgium or just smaller than the Netherlands and at the upper end an area slightly larger thanLatvia or Lithuania19and just under that of Republic of Ireland. Another way of putting thiswould be that this is the same area as between 82% and 138% of land used for palm oilproduction in Indonesia during 200820.Table 4 presents the ILUC estimates arising from projected biofuel usage per Member State. Itshould be noted that this land use change is unlikely to take place in the country in question butwill impact either within or beyond Europe, with the nature of this determined by thefeedstocks used; as a consequence this represents a significant European footprint across theglobe. To continue the comparison with the area of palm oil production in Indonesia,at theupper end of the estimates, the UK, Spain and Germany would each be responsible for an ILUCimpact that was equivalent to more than 20% of land currently used for Indonesian palm oilproduction.To provide a sense of scale of the anticipated ILUC impact figure 5 compares the anticipatedchange associated with a Member State’s consumption of conventional biofuels to the area ofarable land in use within that Member State. In this respect the proportionate ILUC impact ishighest in those Member States with limited area of arable land per capita ie effectively thosecharacterised by denser development patterns and higher per capita transport needs.The UK,Slovenia, Malta and Luxembourg would all be responsible for ILUC (at the upper level)equivalent to more than 20% of their own arable land area.
17
Arable land is defined by the Food and Agriculture Organization of the United Nations (FAO) as: land undertemporary agricultural crops (multiple-cropped areas are counted only once), temporary meadows for mowing orpasture, land under market and kitchen gardens and land temporarily fallow (less than five years). The abandonedland resulting from shifting cultivation is not included in this category. Data for “Arable land” are not meant toindicate the amount of land that is potentially cultivable - this is a wider category under the FAO statistics, calledagricultural land.18Based on data for 2007 from the FAO19Based on Eurostat data from 2004 regarding country area.20Based on figures for production in 2008 from the FAO -http://faostat.fao.org/site/567/DesktopDefault.aspx?PageID=567#ancor
12
Table 4 – Estimated ILUC per Member State associated with increased demand for conventionalbiofuels between 2008 and 2020.Lower estimate of totalILUC - 1000 haUpper estimate of totalILUC - 1000 ha
United KingdomSpainGermanyItalyFranceGreeceSwedenIrelandCzech RepublicNetherlandsRomaniaPortugalFinlandBulgariaLuxembourgSloveniaDenmarkAustriaLithuaniaSlovakiaMaltaLatviaTotal
1044647606395273192126117117113107837451434230282822334143
16151167105965148127318319520618317215013587777656484832456902
Figure 5 – Estimate of Member States’ proportionate ILUC impact – comparing the area of ILUCfrom conventional biofuels to the area of arable land available in each Member State.Equivelant Proportion of a MS's Arable Land thatwould be taken up by ILUC .
140120100806040200MaltaLuxembourgGermanySloveniaSlovakiaIrelandGreeceItalyAustriaNetherlandsUnited KingdomDenmarkPortugalSwedenFinlandBulgariaLithuaniaFranceCzech RepublicRomaniaLatviaSpain
Lower ILUCUpper ILUC
7. Indirect Land Use Change – The GHG ConsequencesGHG emissions associated with land use change are the consequence of a loss of carbon fromsoils and pre-existing biomass. They represent a one-off ‘hit’ of emissions associated with thatland’s change in status. It is these emissions that are estimated here, based on the anticipatedlevel of ILUC calculated above. To convert land use change into consequent GHG emissions aconversion factor must be applied. The level of GHG emissions associated with land use change13
will vary depending on prior land use; therefore, there is a wide range of possible conversionfactors. To take this into account emission levels were calculated based on three differentfactors utilised in other similar assessments21.Table 5 – The range of default values used to convert land use change in ha to GHG emissionsDefault values for land conversion - GHG impactLower (based on IPCC lower default value for conversionto cropland)Central (adopted by JRC as a basis for its calculation)Upper (based on IPCC upper default value for conversionto cropland)
38 tC/ha40 tC/ha95 tC/ha
For simplicity the figures presented within the rest of this section represent a mean of thevalues gained from applying all three conversion factors – in essence equivalent to 57 tC/ha22.This is justified given that in reality a number of different land types will be converted as aconsequence of ILUC. Using this assumption, table 6 presents the average total GHG emissionsresulting from ILUC as a consequence of the anticipated increase in biofuel use up to 2020. Asthis is a one off emission of GHGs associated with the change in land use it has been convertedto annualised emissions, based on the 20 year time horizon specified in the RED. For total ILUCassociated with biofuel use within the 23 Member States theannualised emissions arebetween 44 and 73 Million tonnes of CO2 equivalent. At the upper end this is the equivalentto the total GHG emissions generated by either Bulgaria or Hungary in 2007. Put another waythis would represent just under 16% of emissions from the EU’s agricultural sector or just over7% of total EU transport emissions in 2007.
21
It is noted that there are conversion factors that sit above and below the levels specified in table 6. The rangeproposed is considered the most appropriate for conversion to croplands.22Using the figures set out in Decision 2010/335/EU on guidelines for the calculation of land carbon stocks for thepurpose of Annex V to Directive 2009/28/EC -http://eur-lex.europa.eu/LexUriServ/LexUriServ.do?uri=OJ:L:2010:151:0019:0041:EN:PDFthis mean would be broadly akin tothe conversion of sustainably managed grassland to use for annual cropping under a normal system of tillageunder a dry, temperate climate – with a level of 53.3tC/ha calculated for this conversion in worked examples byEcofyshttp://ec.europa.eu/energy/renewables/biofuels/doc/ecofys_report_annotated_example_carbon_stock_calculation.pdf
14
Table 6 – Total ILUC related GHG emissions based on the mean values for land conversion – Thetable presents the totals per Member State in terms of ILUC emissions to deliver the additionalvolume of biofuels by 2020 specified in the 23 NREAPs and the annualised GHG emissions peryear per Member State, based on a 20 year time horizon (as specified in the RED). @@@Total GHG emissions associatedwith ILUC from additionalbiofuel use in 2020Lower ILUC;Upper ILUC;Mt CO2eMt CO2e220.71341.39136.71246.75128.10223.8983.62137.6657.72101.7440.6657.7124.6943.6424.7541.2023.9938.7626.5638.6422.6136.2717.4531.7515.7328.5710.7618.419.1216.238.8916.026.3111.935.8210.075.9310.054.616.720.531.010.630.928761459Annualised emissions associatedwith total ILUCLower ILUC;Mt CO2e11.046.846.404.182.892.031.231.241.201.331.130.870.790.540.460.440.320.290.300.230.030.0344Upper ILUC;Mt CO2e17.0712.3411.196.885.092.892.182.061.941.931.811.591.430.920.810.800.600.500.500.340.050.0573
United KingdomSpainGermanyItalyFranceGreeceCzech RepublicIrelandNetherlandsSwedenRomaniaPortugalFinlandBulgariaLuxembourgSloveniaDenmarkLithuaniaAustriaSlovakiaLatviaMaltaTotal
To qualify towards the delivery of the RED targets, biofuels must deliver a certain proportion ofGHG savings, which rises from 35% in 2011 to 50% by 2017. For the purpose of this exercise, itis assumed that biofuels consumed in response to the RED conform to these criteria, aside fromtheir ILUC impact. To understand the overall consequences for emissions associated withadditional biofuel usage stimulated by the RED targets this GHG benefit must, therefore, besubtracted from the emissions associated with ILUC23.
23
The GHG savings were calculated by assuming a linear increase from 2008 to 2020 in terms of the volume ofbiofuel usage per year per Member State. The volume of usage in 2008 was then subtracted from this to provide afigure of additional use associated with the RED comparable to the ILUC figure. The additional usage per year wasthen multiplied by the GHG emission reductions required under the RED for that given year, this reduction wasbased on the assumption of a linear increase in reductions from 2011 at 35% to 50% in 2017, additional savingswere then assumed at the same rate up to 56% in 2020. The GHG emission reductions are based on the savingsspecified in the RED and the assumptions specified within the Annexes of the RED that fossil based petrol anddiesel generate 43 MJ/kg of energy and that for each MJ 83.8gCO2e are released. As the RED only specifiesreductions in emissions from 2011 onwards, meaning it is unclear the level of reduction in 2008-2010. As aconsequence this calculation of additional emissions was only applied to 2011 to 2020.
15
When account is taken of biofuels anticipated GHG savings from switching from fossil fuels tobiofuels between 2011 and 202024(the dates specified in the RED) total additional emissionsfrom ILUC associated with the increased use of biofuels are still anticipated to range from 273and 565 MtCO2e or between 2.9 and 6 gCO2e/kgoe. This effectively represents emissions thatwould be additional to those arising were Europe to remain reliant on fossil fuels to providefor our transport needs up to 2020. This equates to additional GHG emissions of between 27.3and 56.5 MtCO2e on an annualised basis25. At the upper end this is comparable to just over12% of emissions from agriculture in the EU in 2007 or just under 6% of emissions fromtransport in the EU in 2007. Put another way, the additional GHG emissions associated withILUC up to 2020 would amount to the equivalent of placing between 12.4 and 25.6 Millionadditional cars on the road across Europe in 202026. Based on the assumptions set out in thisstudy the additional emissions from ILUC, associated with the predicted increase inconventional biofuels use within the 23 Member States up to 2020, can be estimated to leadto between 80.5 and 166.5% more GHG emissions than if that same fuel need were met usingfossil fuels ie diesel and petrol27.Figure 6 – Additional GHG emissions anticipated as a consequence of ILUC associated with theexpansion in biofuel demand up to 2020 – these represent emissions over and above whatwould be expected if fossil fuels were to continue to account for these quantities of transportfuels given that GHG savings associated with biofuel use have been subtracted.16141210
LowerMt CO2e
86420United KingdomCzech RepublicLuxembourgGermanyItalyNetherlandsDenmarkIrelandSwedenRomaniaPortugalSpainFranceGreeceFinlandBulgariaSloveniaAustriaLithuaniaSlovakiaLatviaMalta
Upper
24
Both ILUC emissions and the emissions saved were based on the additional usage of biofuels above the 2008baseline up to 2020.25Annualised figures based on the 20 year discounting period specified in the RED for land use change were usedin order to provide the 2011 to 2020 figures – see footnote 22. To provide the annualised data in this instance it is,therefore, appropriate to divide the total ILUC figure up to 2020 by the number of years between 2011 and 2020to avoid double counting of this reduction.26The number of additional cars on the road is calculated by dividing the additional GHG emissions from ILUC onan annualised basis by the estimated level of emissions per car in 2020. The latter is calculated based on theassumption that on average cars will produce 170gCO2e/km in 2020 and will travel on average 13,000km per year.This equates to 2.21tCO2e per car per year. These calculations are based on established scenarios for future caruse in Europe.27This calculation is based on the standard default values for fossil fuels in the RED, Annex III.
16
Table 7 – Comparing the additional annualised GHG emissions as a consequence of ILUC due toexpanded use of biofuels up to 2020 by Member State and the number of additional cars on theroad these figures would equate to in 2020.Annualised emissions fromadditional ILUCLower ILUC;Upper ILUC; MtMt CO2eCO2e7.3113.343.959.453.828.612.635.341.713.911.432.280.731.680.771.590.921.520.771.510.731.410.501.220.451.090.330.710.270.620.260.610.180.460.180.390.180.390.160.260.010.040.020.042756Additional million cars on theroad in 2020Lower3.311.791.731.190.770.650.330.350.420.350.330.230.200.150.120.120.080.080.080.070.010.0112Upper6.044.283.902.411.771.030.760.720.690.680.640.550.490.320.280.280.210.180.180.120.020.0226
United KingdomSpainGermanyItalyFranceGreeceCzech RepublicIrelandSwedenNetherlandsRomaniaPortugalFinlandBulgariaLuxembourgSloveniaDenmarkAustriaLithuaniaSlovakiaLatviaMaltaTotal
17
Figure 7 –The proportion of 2007 GHG emissions from transport that would be accounted forby the annualised, additional emissions from ILUC. The Member State figures are compared tothe overall value for the 23 Member States reviewed to provide a basis for comparison. Theposition of a Member State will depend on both the level of ILUC associated emissions and thescale of transport emissions in 2007.40Proportion of transport emissions - 2007
35302520151050RomaniaIrelandSloveniaSweden
LowerUpper
United Kingdom
Czech Republic
Luxembourg
Germany
Denmark
Greece
Finland
Malta
Slovakia
Average - 23 MS
Portugal
Netherlands
Bulgaria
Lithuania
France
Spain
Italy
Figure 8 – The per capita CO2 emissions associated with additional ILUC emissions per MemberState based on the upper estimates of additional ILUC emissions. This graph demonstrateswhich Member States are above and below the overall average for the 23 countries reviewed interms of per capita impact. It demonstrates the intensity of a populations ILUC GHG impact.14
12
10
tCO2e per capita .
8
6
4
2
0SloveniaEU 23 AverageSlovakiaIrelandLuxembourgFinlandGreeceSwedenLithuaniaBulgariaRomaniaFranceUnited KingdomCzech RepublicPortugalGermanyNetherlandsDenmarkAustriaLatviaSpainItalyMalta
18
Austria
Latvia
8. Assessing the Total Impact including BioliquidsEight of the 23 NREAPs available specify that the relevant Member State will make use ofbioliquids for heat and power as well as biofuels for transport in 2020 (additionally the UKspecifies that it has yet to determine anticipated bioliquid usage). Given that bioliquids are inessence the same product as biofuels, albeit utilised in a different way, and that they aresubject to the same rules under the RED the impact of their use alongside biofuels will have acumulative impact in terms of land use change and more specifically ILUC. This sectionexamines briefly the additional ILUC impact anticipated to be associated with bioliquid use in2020.In total the additional use of conventionally produced bioliquids from the eight MemberStates is estimated to be 4350 Ktoe.Member States were not required to specify the split ofbioliquid use between conventional and advanced biofuels, therefore, this figure was calculatedusing the same proportional usage of conventionally produced bioliquids as was reported forbiofuels. This is appropriate given that the sourcing from biofuels and bioliquids is likely to befrom the same material streams.In total the additional demand for bioliquids would beequivalent to 28% of the total demand for conventional biofuels in 2020.The majority of thismaterial is anticipated to be made use of by Finland and Portugal. The usage of bioliquids inthese Member States is anticipated to be far greater than for conventional biofuels in 2020 –see table 10.Given the more limited data provided on bioliquid use in the NREAPs, compared to biofuel use,it was necessary to make two assumptions to enable ILUC to be calculated. These were: firstlythat bioliquids would be made up entirelyofbiodiesel in 2020; and secondly that no bioliquidsare in use at present for heating and electricity - as there is no comparable baseline data. Basedon applying the same conversion factors as for biofuels the following estimates for the area ofILUC and GHG emissions associated with bioliquids were made.Bioliquids are anticipated to result in an additional area of ILUC between 1000 and 1892thousand ha, contributing between 211 and 399 million tonnes of additional CO2e -see tables11 and 12. In total biofuels are anticipated to lead to emissions between 875 and 1459 MtCO2e– based on figures unadjusted for GHG savings.Cumulatively, biofuels and bioliquids combinedwould lead to emission levels of between 1087 and 1858 MtCO2e by 2020.Table 10 - Calculating the usage of bioliquids from conventional feedstocks in 2020 based onthe proportion of convention biofuel use in the relevant Member State and comparing the scaleof usage of bioliquids to biofuels in 2020.MemberState% conventionalbiofuel use in20206898978488100Use ofconventionalbioliquids instationary sourcesin 2020; Ktoe20509168124785728Additional use ofconventionalbiofuels in 2020compared to2008 - Ktoe30634023601414373171Comparing the impact ofbioliquids to biofuels;conventional bioliquid use as apercentage of conventionalbiofuels use in 2020.670%269%34%33%15%16%
FinlandPortugalGermanyItalySwedenSlovenia
19
DenmarkAustriaTotal
50100
434350
12510515046
3%2%28%
Table 11 – The table sets out the total area of ILUC anticipated to be caused by the use ofbioliquids as specified in the NREAPsKha land convertedLower472211187110136111000
Member StateFinlandPortugalGermanyItalySwedenSloveniaDenmarkAustriaTotal
Upper8923993532082512211892
Table 12 – Presents the additional GHG emissions anticipated as a consequence of ILUCassociated with bioliquids, this is compared to the unadjusted levels of ILUC anticipated frombiofuels with a revised total present as to the cumulative GHG impacts of both biofuels andbioliquids.GHG emissions fromILUC associated withbioliquids – MtCO2eLowerUpper100453923310021111188847544530040020GHG emissions fromILUC associated withbiofuels – MtCO2eLowerUpper1617128842796687644293222413839161210145973Total GHG emissions fromboth biofuels and bioliquids -MtCO2eLowerUpper1156216810729107610875421711629918244191210185993
Member StateFinlandPortugalGermanyItalySwedenSloveniaDenmarkAustriaTotalAnnualisedemissions (dividedover 20 years)
20
9. ConclusionsThis study shows that the 23 Member States examined are predominantly anticipating usingconventional biofuels to deliver their 2020 renewable transport target under the RED, requiringan additional 15.1 Mtoe of supply compared to 2008 levels. As a consequence of this expandeduse of conventional biofuel use ILUC could be estimated to account for between 4.1 and 6.9million ha for biofuels alone.Assuming there is no further action undertaken to address ILUC, the major increase in the useof conventional biofuels and the consequent change in land use has been calculated to lead tobetween 44 and 73 million tonnes of CO2 equivalent being released on an annualised basis.Even when the GHG emission savings required under the RED sustainability requirements forbiofuels are taken into account, rather than aiding climate change mitigation up to 2020, theuse of these biofuels would lead to the production of additional GHG emissions. As aconsequence the use of these additional conventional biofuels could not be considered tocontribute to the achievement of EU climate change policy goals.Not only does this study suggest that ILUC associated with the reported additional use ofconventional biofuels up to 2020 would lead to additional GHG emissions in 2020, theadditional quantities of emissions are substantial. Using the method adopted in this study theseadditional emissions are estimated to range from 27.3 to 56.4 MtCO2e on an annual basis up to2020. Indeed, this estimate would represent emissions from ILUC 80.5 to 166.5% worse thanwould be delivered from continued reliance on fossil fuels in the transport sector. These resultsclearly depend upon the assumptions adopted within this study, primarily the level of ILUCassociated with the use of conventional biofuels and the level of GHG emissions associated withland use change.Given ongoing uncertainties about the location and consequences of ILUC, every effort wasmade to adopt the most appropriate assumptions based on the evidence available at the timeof drafting. The key assumptions and the rationale for them are set out transparentlythroughout the report. These assumptions could be improved through better knowledge of thetypes of feedstock to be used for biofuel production and likely locations of supply, providing abetter understanding of likely displacement effects. Hopefully this will become available in duecourse. It will also be important to seek greater consensus over the assumptions andparameters to be applied during modelling and application of the predicted levels of biofuel useup to 2020 and the ILUC impacts.Nonetheless, the level of uncertainty is diminishing.Sensitivity analysis completed during thework demonstrates that the overarching message of failure to deliver GHG savings fromconventional biofuel use remains the same even when far lower estimates of ILUC and GHGemissions from land use change are applied. This underlines the need to address the questionof ILUC associated with biofuel use as a priority.The current evidence clearly points to ILUCemissions undermining the arguments for the use of conventional biofuels as anenvironmentally sustainable, renewable technology. Moreover, this analysis raises questionsabout the appropriateness of anticipated conventional biofuels use by the Member States up to2020. In addition to action on ILUC the GHG consequences of biofuel use could be reducedsubstantially by focusing increased effort on alternative routes for delivery of the 2020 targets,for example by greater efficiency savings in the sector and increased emphasis on the use ofadvanced fuels.21
Certain national governments are anticipating making use of a significant quantity of bioliquidsto deliver renewable energy for heat and electricity up to 2020, in addition to biofuels. This willrequire an expansion in the same crops and resources as for biofuels. Eight Member Statesreported in their NREAPs that they will make use of bioliquids in 2020; amounting to anestimated 4.4 Mtoe of conventionally produced fuels. This would equate to an additional ILUCimpact of between 1 and 1.9 million ha and GHG emissions of between 211 and 400 MtCO2e.When figures for bioliquids and biofuels are combined the total area of ILUC would rise tobetween 5.1 and 8.8 million ha. The total associated GHG emissions would also increase,leading to a combined figure of between 1087 and 1859 MtCO2e or between 54 and 93MtCO2e on an annualised basis (before any emissions savings are discounted).
10. AnnexGlossary of Terms and AbbreviationsAdvanced biofuels – Also known as second generation fuels, in the context of this studythese are defined as the types of biofuels specified under Article 21.2 of the RED ascounting as double towards the achievement of the 2020 targets. These include biofuelsproduced from wastes, residues, non-food cellulosic material, and ligno-cellulosicArable land - defined by the Food and Agriculture Organization of the United Nations(FAO) as: land under temporary agricultural crops (multiple-cropped areas are countedonly once), temporary meadows for mowing or pasture, land under market and kitchengardens and land temporarily fallow (less than five years). The abandoned land resultingfrom shifting cultivation is not included in this category.Biofuels versus bioliquids – Within the RED bioliquids are defined as - liquid fuel forenergy purposes other than for transport, including electricity and heating and cooling,produced from biomass; where as biofuels are defined as liquid or gaseous fuel fortransport produced from biomass.CO2e – Carbon Dioxide equivalent, used as a standardised metric for evaluating GHGimpactConventional biofuels - Also known as first generation fuels, in the context of this studythese are in essence produced from primarily food crops. This commonly includesmaize, sugar cane, sugar beet, wheat, palm oil, oil seeds such as rape and soy.Ha - HectareKtoe or Mtoe- Kilo Tonnes of Oil Equivalent or Mega Tonnes of Oil Equivalent, ie 1thousand or 1 million tonnes – used as a standard metric for evaluating energy useMJ – MegajoulesNREAP – National Renewable Energy Action Plan – dossier specified in the RED withinwhich Member States must report on how they propose to meet the 2020 targets forrenewable energy and renewable transport fuelsRED – Renewable Energy Directive - Directive 2009/28/EC of the European Parliamentand of the Council of 23 April 2009 on the promotion of the use of energy fromrenewablesources-http://eur-lex.europa.eu/LexUriServ/LexUriServ.do?uri=OJ:L:2009:140:0016:0062:EN:PDF
Calculations - Conversion MethodologyThe conversion factors used for calculating the scale of ILUC in hectares were divided intoupper and lower factors for both bioethanol and biodiesel. These were then combined toprovide the overall ILUC figures for biofuels up to 2020. The basis for determining theconversion factors within this study was the comparative study completed by JRC in whichvarious models developed to assess ILUC were reviewed. This included outputs from key EU22
based and international modelling teams who have developed economic models to determinethe extent to which land use will change as a consequence of increased demand for biofuelfeedstock commodities. JRC asked the modelling teams to run four standardised scenariosintended to imitate different types of increase in demand for biofuel feedstocks aimed atunderstanding the consequent scale of land use change. The models assessed by the JRC wereAGLINK-COSIMO (from OECD), CARD (from FAPRI-ISU), IMPACT (from IFPRI), G-TAP (fromPurdue University), LEI-TAP (from LEI) and CAPRI (from LEI). In addition there is also the IFPRI –MIRAGE model considered separately from the JRC analysis. At the time of drafting, however,concerns regarding the assumptions adopted in this particular model combined with the factthat the results are very substantially lower than for all other studies meant that it was notadopted as a basis for this analysis. It should, however, be noted that the results were used inorder to help inform the sensitivity analysis.Despite attempts to standardise the scenarios the models assessed by JRC produced a variety ofresults and as a consequence a potential range of ILUC conversion factors that could be applied.This is a result of the variable assumptions applied within the models assessed. To determinethe most appropriate ILUC conversion factors for use in this study IEEP evaluated the differentmodel assumptions and likely reliability in consultation with experts from the JRC and withreference to other studies completed on this issue (ie work by Ecofys). Based on thisassessment the following judgements were made in order to determine the most appropriateconversion factors for both biodiesel and bioethanol fuels, which were then applied within thisexercise.It should be noted that while the modellers were asked to run certain scenarios for biofuelusage in 2020 none of these fully represented the likely mix of feedstocks used in the EU in2020. Instead the only way to enable comparison was to shock the models to specify increaseddemand for specific commodities rather than the whole range likely to be used to produceadditional biofuels. As a consequence separate ILUC factors emerged primarily for EU producedbiodiesel from oil seeds, palm oil from Indonesia, wheat bioethanol from the EU and cornethanol for the US. These were taken into account when determining the most appropriateconversion factors for use in this work.-Biodiesel– for biodiesel the conversion factor selected as the lower bound was the AGLINKfactor for EU production of biodiesel from oil seeds, while the upper bound was selected asthe CARD/FAPRI factor for EU production of biodiesel from oil seeds. Other higherestimates, for example from LEI-TAP for EU produced biodiesel, were discounted, in thiscase as a consequence of concerns regarding the appropriateness of oil seed elementswithin the model.These upper and lower factors selected were applied to all biodiesel, both imported anddomestic production. This was justified on the basis of these appearing, within modelresults identified for JRC and within other exercises, to be largely similar to the anticipatedILUC impact of palm oil production, based on the change in production area. It should benoted that the output from the G-TAP model for palm oil was much lower than for otherestimates, this is considered to be a consequence of over estimates in likely yield increasesand this figure was, therefore, discounted.-Bioethanol– For domestic EU production of bioethanol the lower bound selected wasbased on the figures for EU produced wheat based ethanol from the AG LINK model. Theupper bound selected was the equivalent scenario from the G-TAP model. Other estimates23
from IMPACT, for example, were discounted because of concerns regarding elasticities andassumptions relating to reductions in food consumption leading to a low ILUC estimate. Itshould be noted that the JRC consider outputs from G-TAP to be more accurate than forother models in terms of bioethanol impacts, this is because of the differentiated way thismodel takes into account yields on converted land by factoring in a frontier yield effect.Unlike biodiesel for bioethanol there is likely to be a significant difference between the ILUCimpact of domestically produced and imported bioethanol. This is because largeproportions of ethanol imports are anticipated to be produced from sugar cane and in anumber of studies sugar cane’s ILUC impact has proved to be lower than for other crops.Therefore, while the wheat based ethanol figures were used as a proxy for domesticbioethanol production the AG LINK value for sugar cane was applied to imports. Given thewide variety of anticipated imports into Member States an average rate of imports wasapplied to provide two consistent upper and lower factors for bioethanol. The level ofimports was assumed to be 43%.
24