Det Energipolitiske Udvalg 2010-11 (1. samling)
EPU Alm.del Bilag 64
Offentligt
A portfolio of power-trains for Europe:a fact-based analysis
The role of Battery Electric Vehicles, Plug-inHybrids and Fuel Cell Electric Vehicles
The following companies and organisations participated in this study:Car manufacturersBMW AG, Daimler AG, Ford, General Motors LLC, Honda R&D, Hyundai MotorCompany, Kia Motors Corporation, Nissan, Renault, Toyota Motor Corporation,VolkswagenOil and gasENI Refining and Marketing, Galp Energia, OMV Refining and Marketing GmbH,Shell Downstream Services International B.V., Total Raffinage MarketingUtilitiesEnBW Baden-Wuerttemberg AG, VattenfallIndustrial gas companiesAir Liquide, Air Products, The Linde GroupEquipment car manufacturersIntelligent Energy Holdings plc, PowertechWindNordexElectrolyser companiesELT Elektrolyse Technik, Hydrogenics, Hydrogen Technologies, Proton Energy SystemsNon-governmental organisationsEuropean Climate FoundationGovernmental organisationsEuropean Fuel Cells and Hydrogen Joint Undertaking, NOW GmbH
This document reflects the results of a fact-based study that has been preparedon behalf of the companies and organisations listed above. The information andconclusions contained in this document represent the collective view of the workinggroups of this study and not that of individual companies or organisations. Anyinformation and conclusions provided in this document are for reference purposesonly and are not intended, nor should they be used as a substitute for professionaladvice or judgement with respect to certain circumstances. None of the companiesand organisations listed above guarantee the adequacy, accuracy, timeliness orcompleteness of the document’s contents. Said companies and organisations thereforedisclaim any and all warranties and representations as to said contents, express orimplied, including any warranties of fitness for a particular purpose or use.McKinsey & Company, the management consultancy, provided analytical support to thestudy. Any recommendations or positions taken in this report are the responsibility of theauthors, not of McKinsey & Company.
ContentsEXECUTIVE SUMMARYINTRODUCTIONEU CO2reduction goal for 2050 requires 95% decarbonisation of road transport121111
Electric vehicles (BEVs, FCEVs and PHEVs) are necessary to achieve EU CO2reduction goal 12Technologically ready, FCEVs are now focused on commercial deploymentAll conclusions are based on proprietary industry dataMETHODOLOGYA balanced scenario for the electrification of passenger cars in the EU by 2050A combined forecasting and backcasting approach to maximise accuracyA balanced hydrogen production mix including a variety of technologiesAssumptions are robust to significant variationsINPUT DATAThe collection, benchmarking and validation of over 10,000 data pointsRESULTS1. BEVs and FCEVs have the potential to significantly reduce CO2and local emissions2. After 2025, the total cost of ownership of all the power-trains converge3. A portfolio of power-trains can satisfy the needs of consumers and the environment4. Costs for a hydrogen infrastructure are around 5% of the overall cost of FCEVs5. The deployment of FCEVs will incur a cost to society in the early yearsNEXT STEPSANNEXGLOSSARY121415161819242626282833444648525462
2
EXECUTIVE SUMMARYConventional vehicles alone may not achieve EU CO2reduction goal for 2050In September 2009, both the European Union (EU) and G81leaders agreed that CO2emissionsmust be cut by 80% by 2050 if atmospheric CO2is to stabilise at 450 parts per million2– andglobal warming stay below the safe level of 2�C. But 80% decarbonisation overall by 2050 mayrequire 95%3decarbonisation of the road transport sector.With the number of passenger cars set to rise to 273 million4in Europe – and to 2.5 billion5worldwide – by 2050, this may not be achievable through improvements to the traditional internalcombustion engine or alternative fuels: the traditional combustion engine is expected to improveby 30%, so achieving full decarbonisation is not possible through efficiency alone. There is alsouncertainty as to whether large amounts of (sustainably produced) biofuels - i.e. more than 50%of demand - will be available for passenger cars, given the potential demand for biofuels6fromother sectors, such as goods vehicles, aviation, marine, power and heavy industry.Combined with the increasing scarcity and cost of energy resources, it is therefore vital to developa range of technologies that will ensure the long-term sustainability of mobility in Europe.
A factual evaluation of BEVs, FCEVs, PHEVs and ICEs based onproprietary industry dataTo this end, a group of companies, government organisations and an NGO – the majority witha specific interest in the potential (or the commercialisation) of fuel cell electric vehicles (FCEVs)and hydrogen, but with a product range also spanning battery electric vehicles (BEVs), plug-inhybrids (PHEVs) and conventional vehicles with internal combustion engines (ICEs) includinghybridisation – undertook a study on passenger cars in order to assess alternative power-trainsmost likely to fulfil that need. Medium- or heavy-duty vehicles were not included.Electric vehicles (BEVs, FCEVs and PHEVs in electric drive) not only have zero tail-pipe emissions7while driving – significantly improving local air quality – they can be made close to CO2-free overtime and on a well-to-wheel basis, depending on the primary energy source used. Zero-emissionpower-trains therefore go hand-in-hand with the decarbonisation of energy supply, with thepotential to significantly reduce emissions from central power and hydrogen production by 2050.Electric vehicles have substantially lower pollution from noise, NO2and particles.It was considered particularly important to re-assess the role of FCEVs in the light of recenttechnological breakthroughs in fuel cell and electric systems that have now increased theirefficiency and cost-competitiveness significantly. Given satisfactory testing in a customerenvironment - with more than 500 cars covering over 15 million kilometres and 90,000 refuellings- the focus has now shifted from demonstration to planning commercial deployment so thatFCEVs, like all technologies, may benefit from mass production and the economies of scale.
123456
7
The Group of Eight industrial powers – Canada, France, Germany, Italy, Japan, Russia, the UK andthe United StatesCO2-equivalentMcKinsey Global GHG Abatement Cost Curve; International Energy Agency World Energy Outlook2009; US Environmental Protection Agency; European Environment Agency (EEA)Parc Auto Survey 2009, Global Insight 2010; study analysisEuropean Commission, April 2010The study makes the following assumptions: by 2020 biofuels are blended, delivering a 6%well-to-wheel reduction in CO2emissions for gasoline- and diesel-engined vehicles, in line with theEU Fuel Quality Directive. By 2050, biofuel blending increases but is limited to 24%, reflecting supplyconstraintsFCEVs emit water vapour only
The role of Battery Electric Vehicles, Plug-in Hybrids and Fuel Cell Electric VehiclesExecutive summary
3
Over 30 stakeholders therefore came together in order to develop a factual evaluation of theeconomics, sustainability and performance of BEVs, FCEVs, PHEVs and ICEs across the entirevalue chain – many with an equal interest in all four power-trains.It meant providing confidential and proprietary data on an unprecedented scale8– includingvehicle costs (in this report, purchase price is used to refer to cost plus a standard hypotheticalmargin, equal for all cars within one segment), operating costs, fuel and infrastructure cost.In order to ensure a realistic outcome, it was agreed that:�The study should include a balanced mix of vehicle sizes (or segments) and ensure no biastowards any particular power-train, representing the majority of vehicles on the market9�While it is possible that breakthrough technologies could provide step changes in currentpathways to sustainable mobility, the study should only consider vehicle technologies that areproven in R&D today and capable of a) scale-up and commercial deployment and b) meetingthe EU’s CO2reduction goal for 2050�Average values should be taken, with no “cherry-picking” of the most favourable data�Input data provided by participating companies would be frozen before results were shared.
A balanced scenario for the electrification of passenger carsin the EU by 2050A combined forecasting and backcasting approach was then used to calculate the results: from2010 to 2020, global cost and performance data were forecasted, based on proprietary industrydata; after 2020, on projected learning rates(see Annex, Exhibit 42, page 54).In order to test the sensitivity of these data to a broad range of market outcomes, three European“worlds” for 2050 were defined, assuming various power-train penetrations in 2050:1. A world skewed towards ICE (5% FCEVs, 10% BEVs, 25% PHEVs, 60% ICEs)2. A world skewed towards electric power-trains (25% FCEVs, 35% BEVs, 35% PHEVs, 5% ICEs)3. A world skewed towards FCEVs (50% FCEVs, 25% BEVs, 20% PHEVs, 5% ICEs).
These three “worlds” were then backcasted to 2010, resulting in a development pathway for eachpower-train. As the impact of the different “worlds” on FCEV costs was found not to be significant(see page 18),this report focuses on results for the second “world” as having a balanced splitbetween the four power-trains (25% FCEVs, 35% BEVs, 35% PHEVs and 5% ICEs).
89
Over 10,000 data points were collected for the studyNo assumptions have been made on a potential shift in the composition of the car fleet from largerto smaller cars. An average ~30% fuel efficiency gain was included for the entire ICE fleet
4
Assumptions are robust to significant variationsTo test the robustness of results, all assumptions in the study’s vehicle and supply models werevaried to identify possible “tipping points”. However, this showed that the conclusions wererobust to significant variations in learning rates for the power-trains and the cost of fossil fuels(see page 24).The power supply pathway underlying this report is based on the European Climate Foundation’s“Roadmap 2050”, which was developed in corporation with the industry and describes a pathwayto decarbonise the EU power mix by 2050. In 2020, the expected share of renewable (RES)production capacity is approximately 34%. This is the minimum needed to meet the 20% EUrenewable energy target, as there is limited RES opportunity outside of the power sector.For the following results, a conventional hydrogen production mix is assumed to 2020, utilisingexisting assets – industrially produced hydrogen and centralised steam methane reforming(SMR) – with a growing proportion of distributed units (water electrolysis and SMR). After 2020,a balanced and economically driven scenario is assumed, including CO2Capture and Storage(CCS), water electrolysis (increasingly using renewable energy) and avoiding over-dependenceon any single primary energy source.An alternative production mix was also examined(see Exhibit 26, page 38),representing 100%electrolysis, with 80% renewable energy by 2050, which increases the total cost of ownership(TCO) of FCEVs by 5% by 2030 and 3.5% by 2050. However, both production scenarios achieveCO2-free hydrogen by 2050.The value of electric vehicles on balancing an (increasingly intermittent) power grid can besignificant and could amount to several billions of euros (ref. “Roadmap 2050”). This applies toBEVs (charging when power supply is available) as well as hydrogen cars (using stored hydrogento produce power when supply is short).
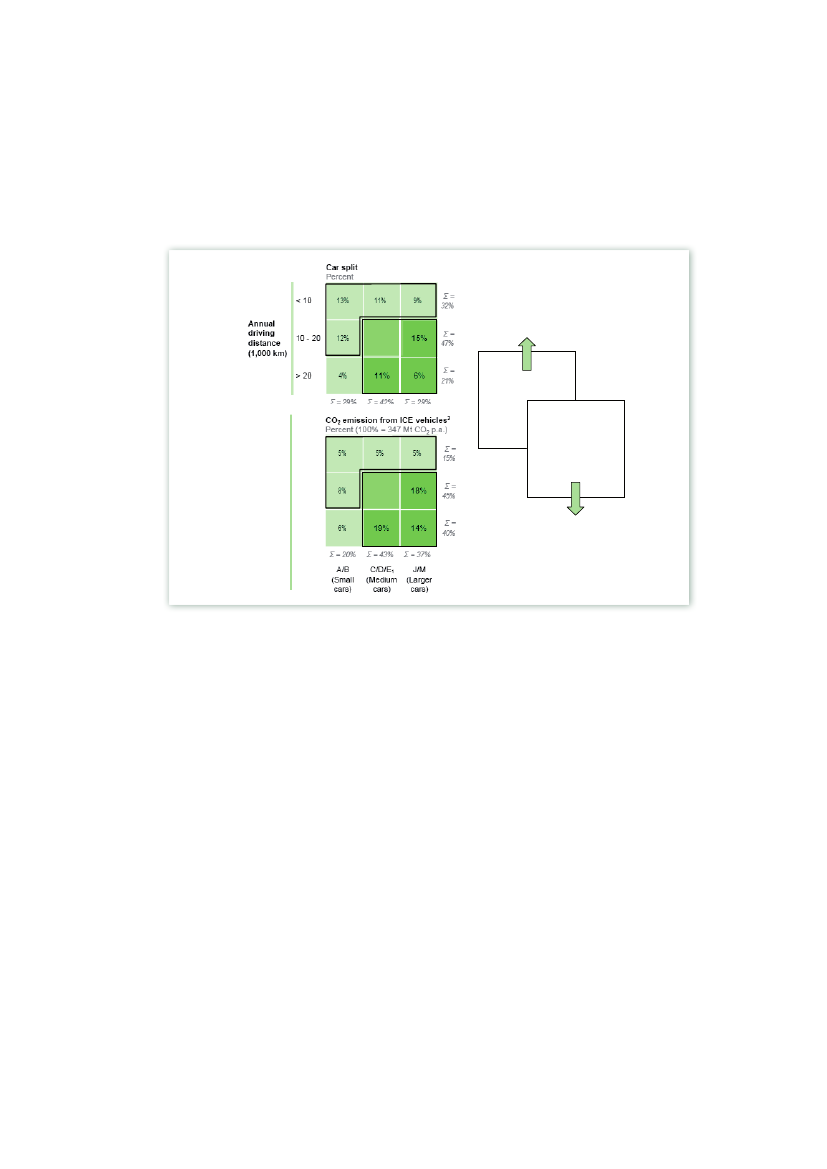
SUMMARY OF RESULTS1. BEVs, PHEVs and FCEVs have the potential to significantly reduce CO2and local emissionsElectric vehicles (BEVs, FCEVs and PHEVs in electric drive) can be fuelled by a wide variety ofprimary energy sources – reducing oil dependency and enhancing security of energy supply.Well-to-wheel efficiency analysis also shows that electric vehicles are more energy-efficient thanICEs over a broader range of primary energy sources.Owing to limits in battery capacity and driving range10(currently 100-200 km for a medium-sized car11) and a current recharging time of several hours,BEVsare ideally suited to smaller carsand shorter trips, i.e. urban driving (including new transportation models such as car sharing).With a driving range and performance comparable to ICEs,FCEVsare the lowest carbon solutionfor medium/larger cars and longer trips. These car segments account for 50% of all cars and75% of CO2emissions, hence replacing one ICE with one FCEV achieves a relatively high CO2reduction.10 The range chosen in the study for BEVs and PHEVs reflects the car manufacturers’ current view onthe best compromise between range, cost, and load bearing capacity for the vehicle11 For C/D segment cars this will increase to 150-250 km in the medium term
The role of Battery Electric Vehicles, Plug-in Hybrids Fuel Cell Electric VehiclesExecutive summary
5
With a smaller battery capacity than BEVs,PHEVshave an electric driving range of 40-60 km.Combined with the additional blending of biofuels, they could show emission reductions forlonger trips.ICEshave the potential to reduce their CO2footprint significantly through an average 30%improvement in energy efficiency by 2020 and the additional blending of biofuels. After 2020,however, further engine efficiency improvements are limited and relatively costly, while theamount of biofuels that will be available may be limited.BEVs, PHEVs and FCEVs have significant potential to reduce CO2and local emissions, assumingCO2reduction is performed at the production site. They play a complementary role, with BEVsideally suited to smaller cars and shorter trips and FCEVs to medium/larger cars and longertrips. PHEVs can reduce CO2considerably compared to ICEs on short trips or using biofuels,depending on availability. The energy and CO2efficiency of ICEs is expected to improve by 30%.Medium/larger cars with above-average driving distance account for 50% of all cars, and 75%of CO2emissions. FCEVs are therefore an effective low-carbon solution for a large proportion ofthe car fleet. Beyond 2030, they have a TCO advantage over BEVs and PHEVs in the largest carsegments(see below).
2. After 2025, the total cost of ownership (TCO) of all thepower-trains convergesIn the study, the economic comparison between power-trains is based on the total cost ofownership (TCO), as it describes the costs associated over their entire lifetime(see page 18).Inorder to ensure a like-for-like comparison, taxes are not included unless specifically stated.BEVs and FCEVs are expected to have a higher purchase price than ICEs (battery and fuel cellrelated) and a lower fuel cost (due to greater efficiency and no use of oil) and a lower maintenancecost (fewer rotating parts).The cost of fuel cell systems is expected to decrease by 90% and component costs for BEVs by80% by 2020, due to economies of scale and incremental improvements in technology. Around30% of technology improvements in BEVs and PHEVs also apply to FCEVs and vice versa. Thisassumes that FCEVs and BEVs will be mass produced, with infrastructure a key prerequisite tobe in place. The cost of hydrogen also reduces by 70% by 2025 due to higher utilisation of therefuelling infrastructure and economies of scale.PHEVs are more economic than BEVs and FCEVs in the short term. The gap gradually closes andby 2030 PHEVs are cost-competitive with BEVs for smaller cars, with both BEVs and FCEVs formedium cars and less competitive than FCEVs for larger cars.While the fuel economy of ICEs is expected to improve by an average of 30% by 2020, costs alsoincrease due to full hybridisation and further measures such as the use of lighter weight materials.The TCOs of all four power-trains is expected to converge after 2025 – or earlier, with taxexemptions and/or incentives during the ramp-up phase.For larger cars, the TCO of FCEVs is expected to be lower than PHEVs and BEVs as of 2030.By 2050, it is also (significantly) lower than the ICE. For medium-sized cars, the TCOs for alltechnologies converge by 2050. BEVs have a (small) TCO advantage over FCEVs in the smallercar segments.
6
PHEVs are more economic than BEVs and FCEVs in the short term. All electric vehicles areviable alternatives to ICEs by 2025, with BEVs suited to smaller cars and shorter trips, FCEVsfor medium/larger cars and longer trips. With tax incentives, BEVs and FCEVs could be cost-competitive with ICEs as early as 2020.
3. A portfolio of power-trains can meet the needs of consumersand the environmentBEVs have a shorter range than FCEVs, PHEVs and ICEs: an average, medium-sized BEV withmaximum battery loading cannot drive far beyond 150 km at 120 km/hour on the highway, if realdriving conditions are assumed (and taking expected improvements until 2020 into account)Charging times are also significantly longer: 6-8 hours using normal charging equipment. Fastcharging may become widespread, but the impact on battery performance degradation overtime and power grid stability is unclear. Moreover, it takes 15-30 minutes to (partially) recharge thebattery. Battery swapping reduces refuelling time; it is expected to be feasible if used once everytwo months or less and battery standards are adopted by a majority of car manufacturers. BEVsare therefore ideally suited to smaller cars and urban driving, potentially achieving ~80% CO2reduction by 2030 compared to today.FCEVs have a driving performance (similar acceleration), range (around 600 km) and refuellingtime (< 5 minutes) comparable to ICEs. They are therefore a feasible low-carbon substitute forICEs for medium/larger cars and longer trips, potentially achieving 80% CO2reduction by 2030compared to today.PHEVs have a similar range and performance to ICEs, but electric driving only applies to shorterdistances, while the amount of biofuels available for longer trips is uncertain. They represent anattractive solution, reducing CO2considerably compared to ICEs.Over the next 40 years, no single power-train satisfies all key criteria for economics, performanceand the environment. The world is therefore likely to move from a single power-train (ICE) to aportfolio of power-trains in which BEVs and FCEVs play a complementary role: BEVs are ideallysuited to smaller cars and shorter trips; FCEVs to medium/larger cars and longer trips; withPHEVs an attractive solution for short trips or where sustainably produced biofuels are available.
4. Costs for a hydrogen infrastructure are approximately 5% of the overallcost of FCEVs (€1,000-2,000 per car)For consumers who prefer larger cars and drive longer distances, FCEVs therefore have clearbenefits in a CO2-constrained world. This segment represents around 50% of cars driven andcan therefore justify a dedicated hydrogen infrastructure. The value of the FCEV over alternativepower-trains in terms of TCO and emissions (including the cost of the hydrogen infrastructure) ispositive beyond 2030. The economic gap prior to 2030 is almost completely determined by thehigher purchase price, not by the cost of the hydrogen infrastructure. It can therefore be assumedthat if this consumer segment prefers the FCEV, the cost of the infrastructure (5% of the TCO) willnot be prohibitive to its roll-out. Having said that, an orchestrated investment plan is required tobuild up the first critical mass of hydrogen supply.
The role of Battery Electric Vehicles, Plug-in Hybrids and Fuel Cell Electric VehiclesExecutive summary
7
In order to develop a portfolio of power-trains, several supply infrastructure systems are required –not only for gasoline and diesel, but potentially new infrastructures for CNG, LPG, 100% biofuels,electricity and hydrogen. Early commercial deployment of BEVs and PHEVs is already happeningin several European countries: many car manufacturers have announced the introduction of newcommercial models between 2010 and 2014. This report therefore focuses on the commercialdeployment of FCEVs, which still needs to be addressed.One could argue that it is inefficient to build an additional vehicle refuelling infrastructure on topof existing infrastructures. However, the additional costs of a hydrogen infrastructure are relativelylow compared to the total costs of FCEVs and comparable to other fuels and technologies, suchas a charging infrastructure for BEVs and PHEVs. Costs for a hydrogen distribution and retailinfrastructure are around 5% of the overall cost of FCEVs – the vast majority lies in the purchaseprice. The attractiveness of the business case for FCEVs is therefore hardly affected by theadditional costs required for distribution and retail. In other words, if FCEVs make commercialsense – as demonstrated by this study – building a dedicated hydrogen infrastructure can bejustified.In the first decade of a typical roll-out scenario, supply infrastructure costs per car – especiallythose for a retail infrastructure – are initially higher, due to lower utilisation. Nevertheless, sufficientnetwork coverage must be available for consumers and initial investments required could amountto around €3 billion (covering hydrogen production, distribution and retail) for a region such asGermany. Although a single company would struggle to absorb the risk of such an investment,this is not the case at a societal level. This is confirmed by countries which have built up alternativeinfrastructures, such as LPG and CNG.The cost per vehicle for rolling out a hydrogen infrastructure compares to rolling out a charginginfrastructure for BEVs or PHEVs. The costs for hydrogen retail and distribution are estimatedat €1,000-2,000 per vehicle (over its lifetime), including distribution from the production site tothe retail station, as well as operational and capital costs for the retail station itself. Building aninfrastructure for 25% market share of FCEVs requires infrastructure investments of around €3billion in the first decade and €2-3 billion per year thereafter. Annual infrastructure investmentsin oil and gas, telecommunications and road infrastructure each amount to €50-€60 billon.12Additional investments required to decarbonise the power sector amount to €20-30 billionper year.13Current costs for an electric charging infrastructure range from €1,500 - €2,500 per vehicle. Thehigher end of the range assumes 50% home charging (investment of €200 - €400 per chargingstation) and 50% public charging at €5,000 for a charging station that serves two cars (€10,000in the first years). Potential additional investment in the power distribution networks are notincluded, but could be material, depending on the local situation. In contrast, once the territory iscovered, no further investment is needed in hydrogen infrastructure – regardless of the numberof cars – due to the fast refuelling time. As the number of FCEVs increase, it also benefits from theeconomies of scale.
12 Global Insight13 http://www.roadmap2050.eu/attachments/files/Volume1_fullreport_PressPack.pdf
8
Under the key assumptions of the study (i.e. zero CO2from power by 205014), Europe mustachieve a significant penetration of electric cars by 2050, if it is to achieve its CO2reduction goal.Early commercial deployment of BEVs has already started in several European countries, butinfrastructure for FCEVs remains to be addressed.Over the course of the next decades, costs for a hydrogen distribution and retail infrastructure are5% of the overall cost of FCEVs (€1,000-2,000 per car) and comparable to rolling out a charginginfrastructure for BEVs and PHEVs (excluding potential upgrades in power distribution networks).The attractiveness of the business case for FCEVs is therefore hardly affected by the additionalcosts required for distribution and retail: if FCEVs make commercial sense – as demonstrated bythis study – building a dedicated hydrogen infrastructure can be justified.
5. The deployment of FCEVs will incur a cost to society in the early yearsThe benefits of lower CO2emissions, lower local emissions (NO2, particles), diversification ofprimary energy sources and the transition to renewable energy all come at an initial cost. Thesewill ultimately marginalise with the reduction in battery and fuel cell costs, economies of scale andpotentially increasing costs for fossil fuels and ICE specifications.A roll-out scenario that assumes 100,000 FCEVs in 2015, 1 million in 2020 and a 25% share of thetotal EU passenger car market in 2050 results in a cumulative economic gap of approximately€25 billion by 2020 – mainly due to the cost of the fuel cell system in the next decade, but alsoincluding around €3 billion for a hydrogen supply infrastructure. The CO2abatement cost isexpected to range between €150 and € 200 per tonne in 2030 and becomes negative for largercars after 2030.A hydrogen supply infrastructure for around 1 million FCEVs by 2020 requires an investmentof €3 billion (production, distribution, retail), of which €1 billion relates to retail infrastructure –concentrated in high-density areas (large cities, highways) and building on existing infrastructure.If only one energy company were to invest in hydrogen retail infrastructure, it faces a first-moverdisadvantage due to the initially low utilisation by a small number of FCEVs and the risk oftechnology delivery failure or delay. In the latter case it would result in a potential write-off in theorder of hundreds of millions per annum. The initial investment risk would be somewhat reducedif further companies also invest and even further if the roll-out is supported by adequate policymeasures and risk underwriting all one word by governments.Hydrogen manufacturers have an incentive – as soon as the economics work – to race to beattheir rivals. While financial incentives are required to persuade consumers to appreciate FCEVs,there is nothing to hold the hydrogen manufacturers back – as long as the retail infrastructure is inplace. Infrastructure providers, on the other hand, bear a first-mover risk, making a heavy upfrontoutlay to build a retail station network that will not be fully utilised for some years; the unit costreduces over time simply because the fixed capital expenditure is used by an increasing numberof FCEVs.The cumulative economic gap of around €25 billion for FCEVs up to 2020 is calculated on a globalcumulative FCEV production and is mainly due to a higher purchase price. If this is also only metby a few car manufacturers, they will each need to finance around €1 billion per annum. Bridgingthis gap could be facilitated by adequate government actions and global co-operation. After2030, it can be reasonably assumed that the majority of the consumers will be financially driven,making their choice of car in response to an established tax and legislative regime.14 The power supply pathway underlying this report is based on the European Climate Foundation“Roadmap 2050“, which was developed in cooperation with the industry and describes a pathway todecarbonise the EU‘s power mix by 2050 -See page 24
The role of Battery Electric Vehicles, Plug-in Hybrids and Fuel Cell Electric VehiclesExecutive summary
9
Provided these are stable and clear, car manufacturers, hydrogen manufacturers andinfrastructure providers should all be able to make investments on the basis of well-understoodrisks and projected returns. A global roll-out would further reduce the economic gap for Europe.A strong case will be required to persuade governments as to the level of explicit subsidy needed.In subsequent steps, it will therefore be important to make proposals that show how industryis taking responsibility for all the risks that they can reasonably analyse, control and mitigate.Discussions with Member State and EU governments are likely to focus on sharing the costs andrisks between public and private sectors.The emerging FCEV market (2010-20) requires close value chain synchronisation and externalstimulus in order to overcome the first-mover risk of building hydrogen retail infrastructure.While the initial investment is relatively low, the risk is high and therefore greatly reduced ifmany companies invest, co-ordinated by governments and supported by dedicated legislationand funding. With the market established, subsequent investment (2020-30) will present asignificantly reduced risk and by 2030 any potentially remaining economic gap is expected to bedirectly passed on to the consumer.
SUMMARY OF NEXT STEPSInvestment cycles in energy infrastructure are long and BEV and FCEV infrastructure andscale-up should be initiated as soon as possible in order to develop these technologies asmaterial transportation options beyond 2020. In the short term, CO2emissions will therefore haveto be reduced by more efficient ICEs and PHEVs – combined with biofuels – while taking twoconcrete actions:
1. Study EU market launch plan for FCEVs and hydrogen infrastructureCar manufacturers have signalled that they are ready to mass-produce FCEVs, as demonstratedby the Letter of Understanding in 2009(see page 13).This study shows that FCEVs aretechnologically ready and can be produced at much lower cost for an early commercialmarket over the next five years. The next logical step is therefore to develop a comprehensiveand co-ordinated EU market launch plan study for the deployment of FCEVs and hydrogeninfrastructure in Europe(see pages 52-53).This consists of two phases:�An in-depth business case and implementation plan for a single Member State (i.e. Germany)in order to de-risk the commercialisation of technology and test the supply chain for the rest ofEurope, starting in 2015. At the same time, a series of subsidised FCEV demonstration projectsin other Member States should start to gain experience with the technology.�A potential staged roll-out plan – first, a market introduction in Member States that havedeveloped experience through the demonstration projects, followed by other Member States.The implementation plan should be fit for investment by companies and the public sector. Thisincludes addressing the risks associated with the plan, how hydrogen will be decarbonised andits impact on future CO2emissions from the transport sector.
10
The dynamics of setting up a hydrogen retail infrastructure are such that there is a limitedopportunity to gain “early mover” advantage, so the first player will not be able to compensate forany losses. Indeed, they will develop the market for all other infrastructure providers who will thenreap the benefits at a later stage. However, if several hydrogen retail infrastructure providers invest– or a market-based mechanism is developed to spread the risk between different infrastructureproviders – none will gain a ‘free ride’. The market launch plan must therefore go hand-in-handwith appropriate government policies.After the technology has been de-risked and achieved cost reductions in one Member State –and at the same time gained more experience with a series of demonstration projects in otherMember States – a staged roll-out plan for subsequent introductions in other Member States hasthen to be studied. This will address the supply constraints of car manufacturers and hydrogeninfrastructure providers; the primary energy resources of different Member States; and CO2reduction goals for the transport sector as a whole.
2. Co-ordinate roll-out of BEVs/PHEVs and battery-charging infrastructureA similar action would be helpful to support the roll-out of BEVs and PHEVs in the EU. Here, too,the risk of market failure exists. Although the investments per electric recharging point are low,the financial risk for infrastructure providers remains. As with hydrogen infrastructure, upfrontinvestment for public charging will be necessary in order to give customers appropriate access toinfrastructure from the start.In order to achieve a sound market introduction, the technology also needs to be commerciallyde-risked and programmes for BEVs currently exist in several European countries and atEU level, addressing issues such as technology, market introduction, funding schemes andstandardisation etc. A coherent approach to these activities would help to optimise developmentand support early market readiness.
The role of Battery Electric Vehicles, Plug-in Hybrids and Fuel Cell Electric VehiclesExecutive summary
11
INTRODUCTIONEU CO2reduction goal for 2050 requires 95% decarbonisationof road transportIn 2009, both the European Union (EU) and G8 leaders agreed that CO2emissions must be cutby 80% by 2050 if atmospheric CO2is to stabilise at 450 parts per million15– and global warmingstay below the safe level of 2�C. But 80% decarbonisationoverallby 2050 requires 95%16decarbonisation of the road transport sector (Exhibit 1).Gt CO2e per yearEU-27 total GHG emissions1SectorPowerRoad transport-80%Air & sea transportIndustry31.20.10,10,40.600.20,1-0.32050 abated2BuildingsWasteAgricultureForestryTotalabatement95-100%95%50%40%95%100%20%-0.25 Gt CO2e
5,95.21.25.31.25.41.2
0,90,51.10.90.20.51990Source:2010
0,90,61.00.90.40.3
1,00,71.00.90.30.3
2030
2050
IEA forecasts
1 Large efficiency improvements are already included in the baseline based on the International Energy Agency, World Energy Outlook 2009,especially for industry2 Abatement estimates within sector based on Global GHG Cost Curve3 CCS applied to 50% of large industry (cement, chemistry, iron and steel, petroleum and gas, not applied to other industries)SOURCE: www.roadmap2050.eu
Exhibit 1: In order to achieve EU CO2reduction goal of 80% by 2050, road transport mustachieve 95% decarbonisationDecarbonisation may be achieved through efficiency, biofuels and electric power-trains (includinghydrogen). With the number of passenger cars set to rise to 273 million17in Europe – and to 2.5billion18worldwide – by 2050, full decarbonisation may not be achievable through improvementsin the traditional internal combustion engine or alternative fuels alone. A comprehensive analysiswould be helpful to determine the true global potential of biofuels and for which sectors andregions they may be most effectively used.Combined with the increasing scarcity and cost of energy resources, it is therefore vital to developarangeof technologies to ensure the long-term sustainability of mobility in Europe, with “ultralow-carbon electric power-trains and hydrogen fuel cells the most promising options”,19accordingto the European Commission. This study was therefore undertaken in order to compare theperformance and costs of alternative power-trains for passenger cars – fuel cell electric vehicles(FCEVs), battery electric vehicles (BEVs) and plug-in hybrids (PHEVs) – with those of conventionalvehicles with internal combustion engines (known as ICEs). This included every step of the valuechain, or “well-to-wheel”.15 CO2-equivalent16 McKinsey Global GHG Abatement Cost Curve; International Energy Agency World Energy Outlook2009; US Environmental Protection Agency; European Environment Agency (EEA)17 Parc Auto Survey 2009, Global Insight 2010; study analysis18 European Commission, April 201019 COM(2010)186: A European strategy on clean and energy efficient vehicles, published April 2010
12
Electric vehicles (BEVs, FCEVs and PHEVs) are necessary to achieve EU CO2reduction goalThe benefits of electric vehicles (BEVs, FCEVs and PHEVs in electric drive) over ICEs are:�Electric vehicles have zero emissions while driving – significantly improving local air quality– and they can be made close to CO2-free, depending on the primary energy source used20.Zero-emission power-trains therefore go hand-in-hand with the decarbonisation of energysupply, with the potential to eradicate emissions from central hydrogen production completelyby 2050.�Electric vehicles can be fuelled by a wide variety of primary energy sources – including gas,coal, oil, biomass, wind, solar and nuclear – reducing oil dependency and enhancing energysecurity (e.g. through stabilising an increasingly volatile power grid).�While ICEs have the potential to reduce their CO2footprint considerably through improvedenergy efficiency, this is insufficient to meet the EU’s CO2reduction goal for 2050. Fulldecarbonisation through biofuels depends on their availability.
Technologically ready, FCEVs are now focused on commercial deployment30 stakeholders came together in order to develop a factual evaluation of the four power-trainsand their role in decarbonising road transport. It was also considered particularly important tore-assess the role of FCEVs in the light of technological breakthroughs in fuel cell and electricsystems that have now increased their efficiency and cost-competitiveness significantly(Exhibit 2). Previous studies21predicted that all technological challenges would be addressedsimultaneously within a few years. In reality this has happened sequentially, with a steady butsignificant improvement in all key areas:�With the implementation of 700 bar storage technology, hydrogen storage capacity hasincreased – without sacrificing volume – resulting in driving ranges that approach gasolineICEs. In general, safety concerns have been adequately addressed.�Cold start is down to -25�C, or even lower, due to the application of purging strategies at shut-down and new materials (e.g. metallic bipolar plates) which have optimised heat managementin the stacks.�With better understanding of the mechanisms affecting durability and the implementation ofcounter measures, such as enhanced materials (e.g. functionalised or nanostructured catalystsupports) and cell voltage management, durability (hence cost) has significantly improved.�With the development of CCS, an additional low-cost, low CO2hydrogen production routewould be made available.Common standards for hydrogen and FCEV equipment have also been agreed, further reducingtheir complexity and costs: standard connections, safety limits and performance requirementsfor hydrogen refuelling have been established by several SAE22and ISO22standards, while theelectric system is fully compliant with SAE and ISO safety standards.20 This is commonly illustrated by well-to-wheel emissions, integrating the CO2footprint of fuelproduction with its transformation by the power-train (see Annex, Exhibit 43, page 54)21 See Annex, Exhibit 44, page 5522 SAE International (formerly Society of Automotive Engineers), the recognised authority on standardsfor commercial vehicles, together with ISO (International Organization for Standardization)
The role of Battery Electric Vehicles, Plug-in Hybrids and Fuel Cell Electric VehiclesIntroduction
13
With more than 500 passenger cars – both large and small – covering over 15 million kilometresand undergoing 90,000 refuellings,23FCEVs are therefore now considered to have beencomprehensively tested in a customer environment. The result: the focus has now shifted fromdemonstration to commercial deployment so that FCEVs, like all technologies, may benefit frommass production and the economies of scale.Heat management▪Current systems have reducedheat loss with remaining heatused for vehicle climate controlWater management▪Prototype systems have shownthat appropriate membranehumidity can be provided withoutexternal humidifierTemperature dependency▪Cold-weather performance testshave shown that cold start anddriving performance is equivalentto ICEEfficiency▪Fuel stack net efficiency hasincreased to 59%, with furtherimprovement leading to adownsized system at lower costDurability▪Durability tests have shown thatacceptable stack efficiency canbe maintained for the lifetimeof the vehicleSOURCE: Study analysis
Hydrogen storage▪Innovations in materials allowHydrogen storage at 700 bar forincreased driving range thatapproaches gasoline ICEs
Average and peak load▪Voltage range of stack hasimproved, with power batteryproviding additional bufferingcapacity for increased stackdurability and efficiencyPlatinum▪Catalyst requirement issignificantly reduced to 2-6times catalytic converterloading of conventional ICE.Platinum in fuel cells is alsohighly recyclableSize▪Current fuel cell systemsfit into vehicle withoutcompromising cargo volumeand vehicle weightMaterial cost▪Acceptable cost will beachieved by 2020 throughdesign simplifications,reduction of material use,production technology andeconomies of scale
Exhibit 2: With all technological hurdles resolved, the focus for FCEVs has now shifted fromdemonstration to commercial deploymentThis was clearly signalled in a Letter of Understanding issued by leading car manufacturers24in September 2009, in which they stated their goal to commercialise FCEVs by 2015, withhundreds of thousands of vehicles being rolled out worldwide shortly thereafter – assumingsufficient hydrogen refuelling infrastructure is in place. This was a catalyst for the in-depthevaluation of the four power-train technologies undertaken in this study.A public-private partnership called H2 Mobility was also established, which is now developinga business plan for building a hydrogen refuelling infrastructure in a single Member State (i.e.Germany) – complemented by a series of demonstration projects in other Member States – asessential first steps towards a full EU roll-out(see pages 52-53).The window of opportunity is short. If FCEVs are to achieve economies of scale within the time-frame necessary to meet EU CO2reduction goals, action must be taken as a matter of urgency.There is also a danger that Europe will lose its technological leadership as other internationalmarkets gain ground. The European Commission has confirmed that “the global trend towardssustainable transport shows that the European automotive industry can only remain competitiveby leading in green technologies”.2523 Study data24 Daimler AG, Ford Motor Company, General Motors Corporation/Opel, Honda Motor Co., Ltd.,Hyundai Motor Company, Kia Motors Corporation, the alliance Renault SA and Nissan Motor Co.,Ltd. and Toyota Motor Corporation25 European Commission, April 2010
14
The reality is that no transportation model can be changed overnight – it requires preparation andramp-up of production. A “knee-jerk” response to external factors, such as a rise in oil prices,supply constraints and the disastrous consequences of global warming will be too little, too late.
All conclusions are based on proprietary industry dataThis study represents the most accurate to date,26as conclusions are based not on informedspeculation, but on confidential, granular and proprietary data, provided by key industry players.This has allowed a true comparison of the power-trains, with all underlying assumptions clearlystated(see Methodology section, pages 15-25).In order to present an integrated perspective across the entire value chain, the study addressesfive key questions:1. On a well-to-wheel basis, how do BEVs, FCEVs and PHEVs compare to ICEs over the medium-to-long term on emissions, performance and costs?2. What are the key drivers by car size, miles driven, supply technology and over time?3. What are the potential market segments?4. How do fuels, electricity and hydrogen production, distribution and retail pathways compare?5. What is required at a high level to deploy electric vehicles (BEVs, FCEVs, PHEVs) at scaleso that they can benefit society by significantly reducing CO2emissions, enhancing energysecurity and improving air quality – without compromising its current expectations formobility?The positive effect of electric vehicles on public healthThe benefits of electric vehicles (BEVs, FCEVs and PHEVs in electric mode) go beyond thedecarbonisation of road transport and energy security to address the key issue of air pollutionin large, congested cities: the exhaust from ICEs not only emits CO2, but also local pollutants27such as carbon monoxide, hydrocarbons and nitrous oxides. Diesel vehicles also emit particlesreferred to as particulate emissions or “soots”. Although these emissions are mitigated bycatalytic converters, all pollutants that cannot be processed are released into the atmosphere,degrading air quality and reducing the ability of large cities to meet air quality targets.Electric vehicles, on the other hand, release zero emissions in their “tank-to-wheel” process, withemissions limited to the “well-to-tank” process – far removed from the vehicle itself. Emissionsalso depend on the primary energy source used and can be potentially reduced to zero. Finally,unlike ICEs, electric vehicles are virtually silent, also reducing noise pollution significantly.
26 Other studies taken into consideration include “Hydrogen Highway”: www.hydrogenhighway.com;Roads2HyCom project www.roads2hy.com; “On the road in 2035”, published 2008; “The HydrogenEconomy”, published 2009; “Hydrogen Production Roadmap: Technology Pathways to the Future”,published 201027 This would also apply even if using 100% biofuels
15
METHODOLOGYThis study provides a factual comparison of four different power-trains (Exhibit 3) – BEVs,FCEVs, PHEVs and ICEs – on economics, sustainability and performance across the entire valuechain1between now and 2050, based on confidential and proprietary industry data. This waspossible due to the central role of an independent consultancy and a strict division between theconsultancy’s “Clean Team” responsible for input gathering and the “Analysis Team” responsiblefor output generation.Data was submitted, challenged and, where necessary, benchmarked and validated for everystep of the value chain – including purchase price, operating costs, fuel, as well as infrastructure.While it is possible that breakthrough technologies could provide step changes in currentpathways to sustainable mobility, the study only considered vehicle technologies that areprovenin R&D today – and in many cases demonstrated – and therefore capable of a) scale-up andcommercial deployment and b) meeting the EU’s CO2reduction goal for 2050.To ensure a realistic outcome, it was agreed that all conclusions should be based onaverage values derived from the range provided, with no “cherry-picking” of the mostfavourable data.ICE power-trainTransmissionElectric power-trainBatteryFC power-train
Internal combustion engine (ICE) vehicleCurrent technology (2010) Advanced (2015/20)
Fuel cell electric vehicle(FCEV)
Battery electric vehicle(BEV)Trans-missionE-motorPowerelectronicsEnergybattery
Plug-in hybrid electricvehicle (PHEV)
Trans-missionICETank
Tank
Trans-missionE-motorPowerelec-tronicsPowerbattery
Trans-missionE-motorPowerelectronicsPowerbatteryFC stackBOPTank
TankICEGene-rator
Trans-missionE-motorPowerelec-tronicsEnergybatteryPlug-incharger
ICEGene-rator
Plug-incharger
▪Conventionalinternalcombustion engine
▪Parallelhybrid
▪No dependencyon
electric infrastructureand exhaust emissions800-1200 km
▪High fuel consumption▪High range:typically
configuration of electricand ICE drive; also knownas hybrid electric vehicle(HEV)of the vehicle with supportfrom small electric motorby the ICE
▪Seriesconfiguration of fuel▪Purely electricdrivecell system and electric▪Large battery capacity,drive
▪Series hybrid
▪Fuel cell stackbased onPEM technology
Li-ion technology
configuration of electricand ICE drive3than BEV, (Li-ion)
▪Only charging of batteryfrom the gridwhilestationary1
▪Smaller battery capacity▪Vehicle can beplugged-into charge from the grid
▪ICE is primary mover
▪Hydrogen tank pressuretypically 350 or 700 bar400-600 km
▪Small batterycharged▪Fully electric driving only▪Better fuel economyatlow speedforsmallerdistances(<5 km)than conventional ICE
▪Medium range:typically
▪Short range:typically
150-250 km (based onbattery weight of70-180 kg2)
▪Small ICE-based
generator for larger range(‘range extender’)40-60 km) electric driving.(based on battery weightof 20-80 kg2)
▪Short range:typically
1 Exchange of battery pack is possible, but not considered in this study2 2020 values averaged over A/B, C/D and J segments – a ~50% decrease over 2010. Although considerable cost improvements in battery technologyare considered in the study, it is not expected to achieve significantly lower specific volumes or weights beyond 20203 Other configurations are possibleSOURCE: Study analysis
Exhibit 3: The study focused on a portfolio of power-trains: BEVs, FCEVs, PHEVs and ICEs,taking into account significant advances in ICE technology between now and 2020In order to ensure no bias towards any particular power-train, the study included a balanced mixof car sizes (known as “segments”), representing the majority of vehicles currently on the marketand with high data availability among study participants (Exhibit 4). Average values for fleets, asopposed to specific cars, were taken.
1
Commonly referred to as “well-to-wheel”
16
Defined reference segmentsEU vehicleproduction2008, %EU vehicleproduction2008, %
VehiclesegmentA – City
Typicalcharacteristics
Example
VehiclesegmentS – Sport
Typicalcharacteristics
Example
▪<3,800 mm▪3 door hatchback▪€8k-15k▪3,700-4,200 mm▪5 door hatchback▪€10k-20k▪4,000-4,500 mm▪5 door hatchback▪€15k - 25k▪4,400-5,000 mm▪4 door sedan▪€25k-45k▪4,700-5,100 mm▪4 door sedan▪€40k-120k▪2/4 door sedan▪> €100k
▪Hyundai i10▪Smart
6
▪2 door coupe▪>€30k
▪Mercedes CLK▪Nissan 370Z
<1
B – Super-mini
▪Toyota Yaris▪Mercedes A
23
M1 – SmallMPV
▪3,900-4,400 mm▪5 door MPV▪€10k - 30k▪>4,400 mm▪5 door MPV▪€25k-50k▪3,700-4,000 mm▪5 door 4x4▪€10k-30k▪4,000-5,100 mm▪5 door 4x4▪€25k-75k
▪Mercedes B▪Renault Scenic
12
C – Medium
▪Honda Civic▪Ford Focus
23
M2 – LargeMPV
▪Mercedes R
9
D – Uppermedium
▪Renault Laguna▪Honda FCX▪Mercedes C▪Mercedes E/S▪Lexus GS
13
J1 – SmallSUV
▪Hyundai▪Toyota RAV4▪ToyotaTucson
5
E – Large
5
J2 – LargeSUV
▪Ford Explorer
Highlander
3
F – Luxury
▪Maybach
<1
SOURCE: HIS Global Insight 2010; study participants
Exhibit 4: The study focuses on the vehicle segments that represent the majority of the EUcar fleet (75%) – selected small (A/B), medium (C/D) and larger (SUV) cars
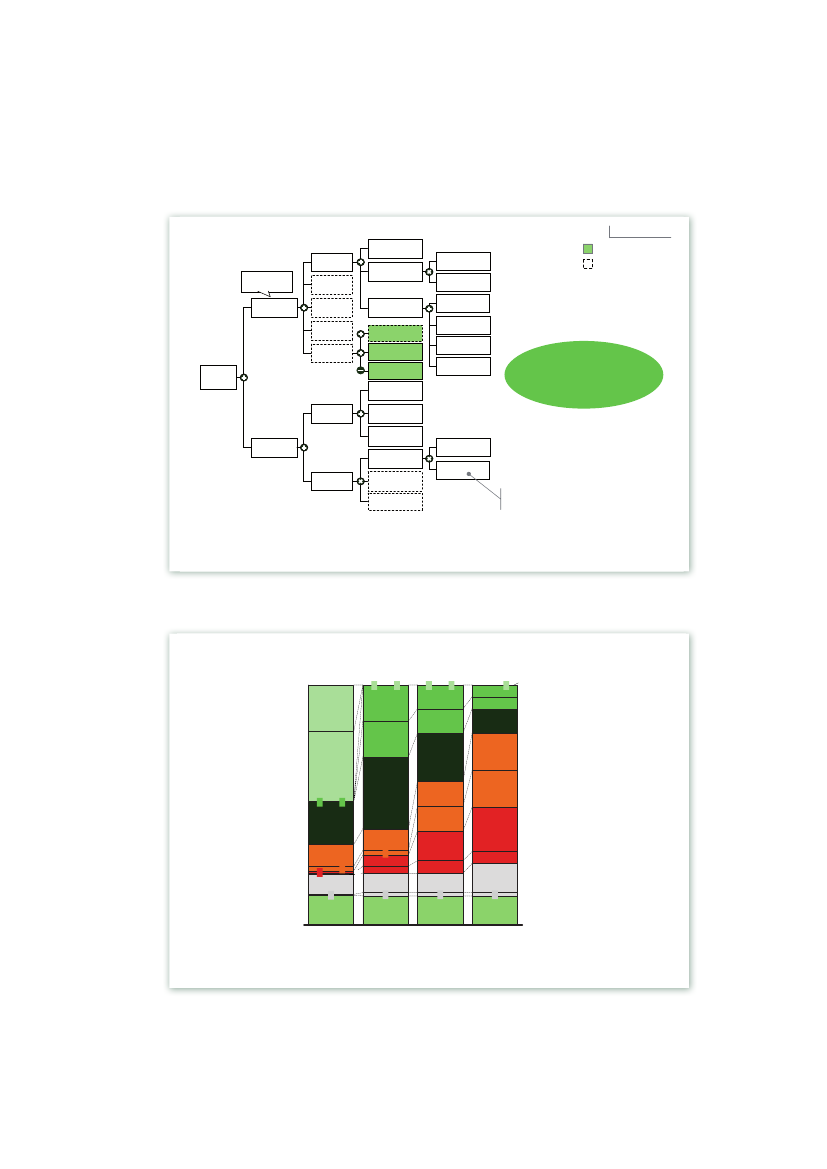
A balanced scenario for the electrification of passenger cars in theEU by 2050In order to test the sensitivity of the economics to a broad range of market outcomes, the studyenvisioned three “worlds” with varying degrees of BEV, FCEV and PHEV penetration (Exhibit 5).These cover:a. The full spectrum of expected futures for hydrogen, electricity and primary energy sourcesb. Market shares and segment penetration rates for the different power-trainsc. Coverage area and availability of hydrogen.All “worlds” assume 273 million passenger cars in the EU in 2050, with a hydrogen retail networkinfrastructure starting in the most densely populated areas (i.e. large cities) and growing to meetthe needs of expanding vehicle clusters, leading to mass market roll-out. The car fleet is built upby introducing BEVs, FCEVs and PHEVs where they are most competitive with ICEs (Exhibit 6).
The role of Battery Electric Vehicles, Plug-in Hybrids and Fuel Cell Electric VehiclesMethodology
17
1Non-zero emission –Conventional2010-2020
2Zero-emission –Electric vehicle dominated
3Zero-emission –FCEV dominated
▪
For all worlds, coverage grows to include 10% of Europe’s most metropolitan area and 20%of European motorways (>50% of cars)ICE60%FCEV25%BEV35%PHEV35%ICE5%FCEV50%BEV PHEV ICE25%20% 5%
FCEV penetration2050Percent
FCEV BEV PHEV10%5%25%
▪▪▪
FCEV with moderate adoptionafter 2020FCEVs sold in C+ segments,but with limited market sharesFCEV coverage area increasesonly to~1/4of the EU29 area1,(75 % cars)2020: 0.362030: 0.602040: 0.842050: 1.08
▪▪▪▪▪▪▪▪
BEVs achieve a higherpenetration than FCEVsFCEVs mainly sold in C+segments with high sharein J, M, DFCEVs are used in all countrieswith some rural exceptionsCoverage is~3/4of the EU29area1, (97% cars)2020: 0.362030: 1.32040: 2.32050: 3.3
▪▪▪
FC is the dominant power-traintechnology by 2050 so networkcoverage develops fastFCEVs sold in all segments withmajor shares in large segmentsAll over Europe, FCEVs are soldand driven. Coverage is equal totheentireEU29 area1(9 km2020: 0.362030: 1.72040: 3.02050: 4.3
Coverage end state2050
average distance between stations)
Size of coverageareamillion km2
▪▪▪▪
▪▪▪▪
1 EU29 defined to include EU27 + Norway and SwitzerlandSOURCE: Study analysis
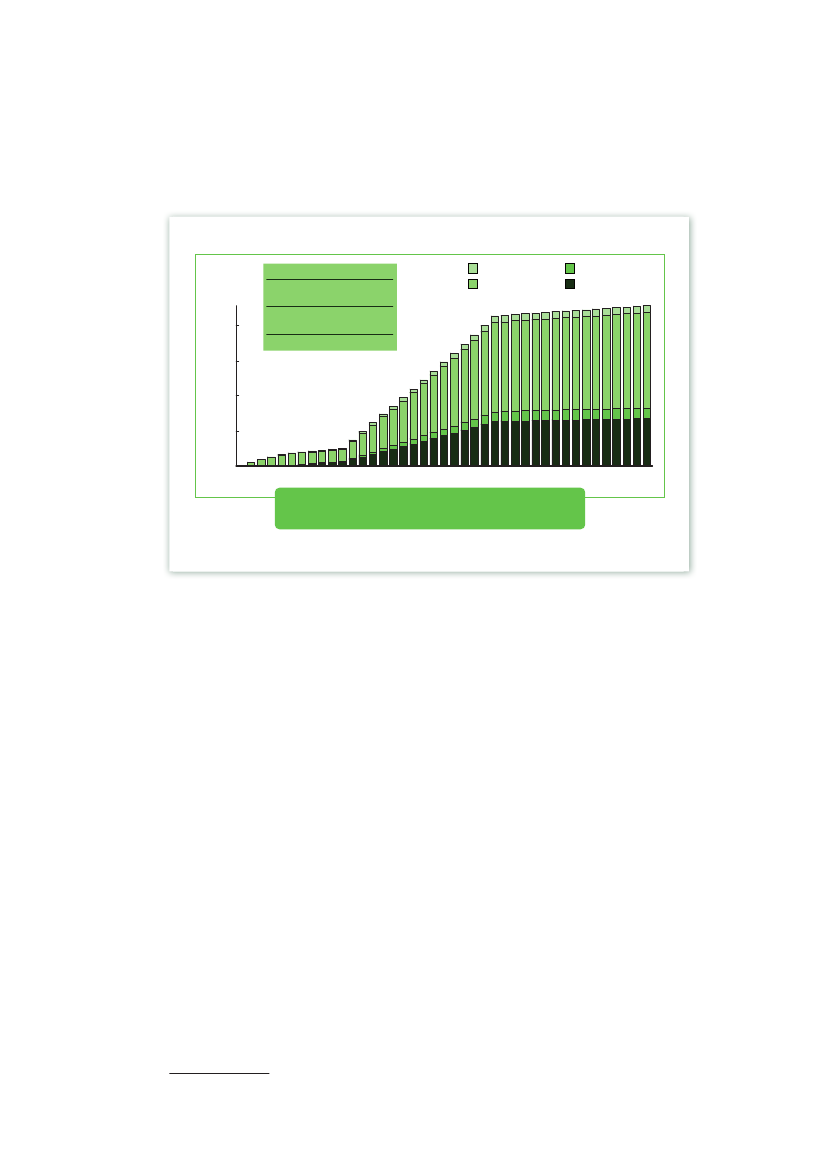
Exhibit 5: Assumptions for the three “worlds”, each showing a different penetration scenariofor BEVs, FCEVs, PHEVs and ICEs in the EU in 2050Total EU car fleet, million vehiclesICE gasolineICE dieselFCEVBEVPHEV
1Non-zero emission –Conventional
2Zero-emission –Electric vehicle dominated
3Zero-emission –FCEV dominated
2802602402202001801601401201008060402002010
2020
2030
2040
2050
2802602402202001801601401201008060402002010
2020
2030
2040
2050
2802602402202001801601401201008060402002010
2020
2030
2040
2050
SOURCE: Study analysis
Exhibit 6: For all three “worlds”, the car fleet is built up from 2010 to 2050 byintroducing BEVs, FCEVs and PHEVs where they are most competitive with ICEs
18
A combined forecasting and backcasting approach to maximise accuracyIn order to ensure conclusions were as accurate as possible, both a forecasting and backcastingapproach was then used: from 2010 to 2020, all cost and performance projections are based onproprietary industry data; after 2020, on projected learning and annual improvement rates.These forecasted data were then backcasted from the envisioned penetration of power-trainsin the EU in 2050, as described above. The results showed that the impact on costs for varyingFCEV penetrations is not significant2(see Annex, Exhibit 45, page 55):�5% penetration of FCEVs might be expected to be uncompetitive, but this is not the case:—Whilea Europe-wide highway infrastructure is deployed, clustering of vehicles in higherpopulation density regions could keep fuel costs from escalating significantly—FocusingFCEV deployment on the medium/larger car segments where FCEVs are morecompetitive helps offset the lower economies of scale and increased vehicle costs—Comparing5% to 25% FCEV penetration in 2050 on a “like-for-like” basis, a C/D segmentFCEV has a 6.1% higher purchase price and 17.4% higher fuel costs, resulting in a 7.3%increase in TCO�No significant improvements in economies of scale exist that improve the economics of FCEVsor hydrogen infrastructure between 25% and 50% penetration.The study therefore focused on the “world” with a penetration of 25% FCEVs, 35% BEVs,35% PHEVs and 5% ICEs as a balanced scenario for the penetration of electric vehicles in the EU.Total cost of ownership (TCO)In the study, the economic comparison between power-trains is based on the total cost of ownership (TCO), as well aspurchase price (see Annex, Exhibit 46, page 56 for a sample TCO calculation for an FCEV).Consumers buy cars for a wide variety of reasons, including purchase price, new vs. second-hand, depreciation rate, styling,performance and handling, brand preference and social image. The cost of driving the same vehicle when new is also greaterthan that for the next owner. Calculating the TCO of the power-trains is therefore important because it describes the costsassociated over their entire lifetime – on top of which individual customer criteria are applied. TCO includes:
▪Purchase price: the sum of all costs to deliver the assembled vehicle to the customer for a specific power-train and segment▪Running costs:–Maintenance costs in parts and servicing specific to each vehicle type and power-train combination–Fuel costs based on the vehicle fuel economy and mileage, including all costs to deliver the fuel at the pump/chargepoint and capital repayment charges on investments made for fuel production, distribution and retail; or forBEVs/PHEVs, for charging infrastructure
N.B. There is no discounting of cash flows over the years and no residual value after 15 years. Time value of money has notbeen taken into account. All taxes on vehicles and fuel (including VAT) are set to zero to ensure that comparisons reflect thetrue costs of driving and are revenue-neutral to governments.TCO equationTCO=Purchase price=Parts cost+Assembly cost+SG&A+Margin+Running cost=Maintenance cost+Fuel cost(incl. infrastructure & fuel costs)
2
The TCO of BEVs and PHEVs is constant over the three worlds due to the fact that their learningrates are defined on a yearly basis, not on an increase in capacity.
The role of Battery Electric Vehicles, Plug-in Hybrids and Fuel Cell Electric VehiclesMethodology
19
A balanced hydrogen production mix including a variety of technologiesN.B. Assumptions on power generation are in line with the European Climate Foundation’s“Roadmap 2050”, which describes a realistic scenario for all power-trains(see page 24 andAnnex, Exhibit 47, page 56).In this report, well-to-wheel emissions do not incorporate indirect emissions resulting fromfeedstock exploration and the associated infrastructure build-up (e.g. Exploration platforms,mining activities, power plant build-up), nor so-called CO2equivalent green-house gases. If theseindirect emissions are taken into account, the well-to-wheel emissions of the different power-trains will change over time, depending on the production and supply pathway. In future analysis,it would be useful to take these into account as well.The study consists of two business models – the vehicle model (generic for all power-trains)and the supply model (more detailed for hydrogen as the electricity supply chain already largelyexists). In each “world” scenario, the demand for each fuel in each year is set by the annual drivingand fuel economy of the power-trains on the road.1. The vehicle model(see Annex, Exhibit 48, page 57)calculates the purchase price, operatingcost, TCO and CO2emissions based on the cost of electricity and hydrogen and the CO2footprint calculated from the supply model. It also includes key assumptions agreed amongparticipating car manufacturers (Exhibit 7).
Parameter
Proposed value
▪▪▪▪▪▪▪
Average vehicle lifetimeAverage annual distance drivenCombined fuel economySales taxVehicle assembly cost as %of ICE purchase price1,2SG&A (including distribution) costas % of ICE purchase price1,2Return on investment as % of ICEpurchase price1,2
▪▪▪▪▪▪▪▪▪
15 years12,000 kmDistance weighted averageof ECE-15 and EUDC cyclesTax-free base model run13.5%13.5%2% - A/B segment7% - C/D segment8.5% - J segment
1 Assumed to be similar across reference segments, with the exception of profit assumption, since margins vary significantly between vehicle segments2 Percentage will be applied to ICE purchase price per reference segment; same absolute cost will then be applied to all power-trains in the segmentSOURCE: Euromonitor, Polk, EU MVEG, Credit Suisse, Goldman Sachs Global Investment Research report, study analysis
Exhibit 7: Key assumptions for the vehicle model were agreed among participating carmanufacturers2.The supply model(for FCEVs) then calculates the CO2footprint, the cost of deliveredhydrogen and investment required, based on cost and performance data received for thethree components of hydrogen infrastructure – production, distribution and retail.
20
Key assumptions included:�Each year, based on hydrogen demand for vehicles, components are added to meet newdemand and replace components that are at the end of their life�With the exception of retail infrastructure and delivery trucks, utilisation is set to 95% (80%for distributed production) due to rapid increase in hydrogen demand, allowing installedequipment to achieve full utilisation within a few years(see Annex, Exhibit 49, page 57).�Shifting from small to medium to large installation size depends on the annual hydrogencapacity added each year, i.e. small components are built when hydrogen demand is low, largecomponents when demand is high.a. ProductionNine major production pathways were considered for hydrogen, representing all the maintechnologies with the potential for rapid, large-scale deployment in Europe (Exhibit 8). Based onthese production pathways, many different production mixes are possible.Among other options, the study examined two hydrogen production mixes: a balanced andeconomically driven production mix with CCS; the other without CCS, representing 100%electrolysis with 80% renewable energy by 2050. Both, however, lead to CO2-free hydrogenproduction by 2050 (Exhibit 9). While the production of hydrogen from SMR with CCS remainsthe lowest-cost scenario, the 100% electrolysis production mix only increases the TCO of FCEVs(C/D segment) by 5% by 2030 and 3.5% by 2050.N.B. All the results in this report are based on the first balanced and economically drivenproduction mix described below
TechnologySMRSteam MethaneReforming
ProcessMethaneSteamH2CO2
Governing reaction1CH4+ 2H2O4H2+ CO2
Variations
▪▪▪
On-site SMRCentral SMRCentral SMR + CCS
WEWaterElectrolysis
WaterElectricity3
H2O2
2H2O2H2+ O2
▪▪▪▪▪▪
On-site WECentral WE
CG/(IGCC)Coal Gasification/IntegratedGasificationCombined Cycle
Coal2Steam
H2CO2
C + 2H2OCO2+ 2H2
CGCG + CCSIGCCIGCC + CCS
1 Simplified reaction2 Includes co-firing with biomass3 100% CO2 reduction from power by 2050: www.roadmap2050.euSOURCE: Study analysis
Exhibit 8: Nine major production pathways were assessed
The role of Battery Electric Vehicles, Plug-in Hybrids and Fuel Cell Electric VehiclesMethodology
21
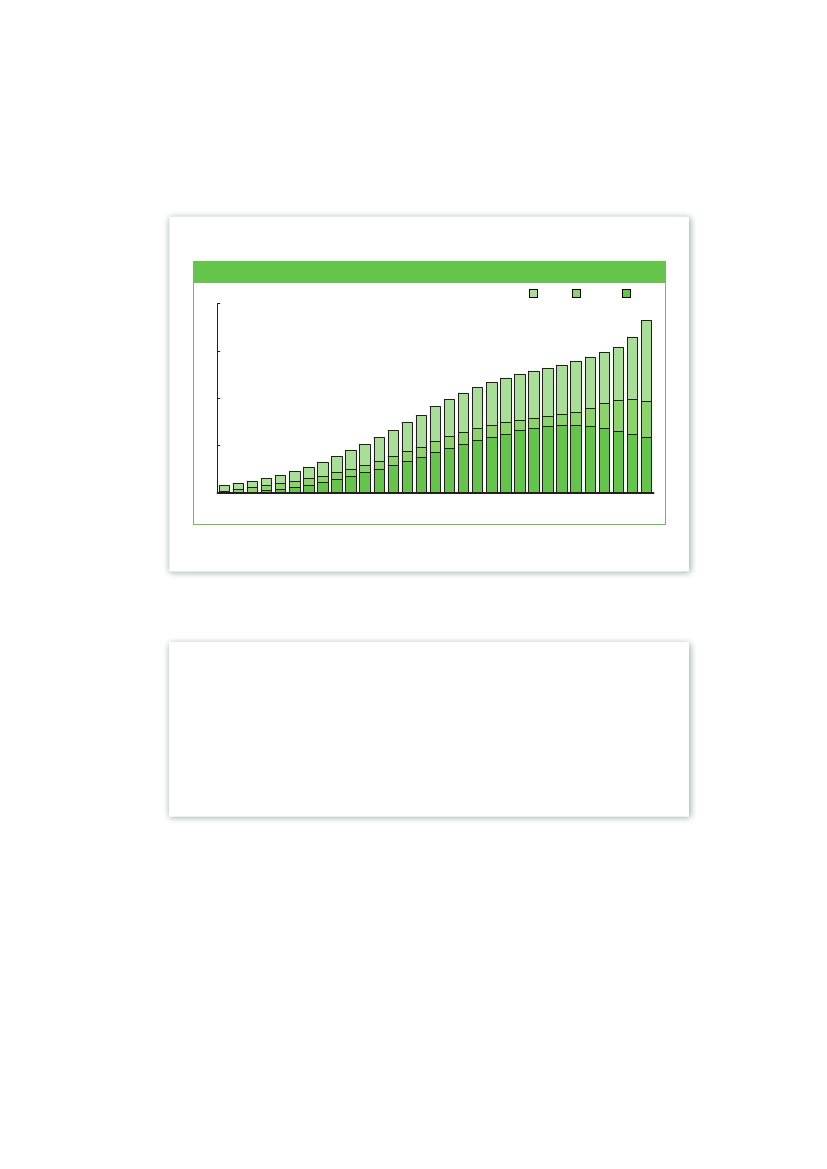
Balanced and economically driven production mix scenarioByproductDSMRCSMRSMR w/CCSCG w/CCSDWECWEIGCC w/CCS
Fraction of production method,Percent10080604020020102020203020402050
CO2well-to-tank emissions,kg CO2/kg H2
1510502010 2015 2020 2025 2030 2035 2040 2045 2050
100% water electrolysis production scenarioExistingDWECWE
Fraction of production method,Percent1008060402002010202020302040
CO2well-to-tank emissions,kg CO2/kg H2
2015105020502010 2015 2020 2025 2030 2035 2040 2045 2050
SOURCE: Study analysis
Exhibit 9: The study examined two hydrogen production mixes, both of whichlead to CO2-free hydrogen by 2050As total hydrogen demand for FCEVs is comparatively low up to 2020, a conventional productionmix is assumed, utilising excess hydrogen from existing assets (industrial sites and centralisedSMR), with a growing proportion of distributed units (water electrolysis and SMR).Beyond 2020, when hydrogen demand for FCEVs increases rapidly, a balanced andeconomically driven scenario is assumed, reflecting the diversity of resources available indifferent parts of Europe and including new sources of clean and green hydrogen.3This scenarioavoids over-dependence on any single primary energy source and provides the most cost-effective means of decarbonising hydrogen supply.In summary:�Before 2020, utilising existing production assets, Central Steam Methane Reforming (CSMR)has 40% and Distributed Steam Methane Reforming (DSMR) and Distributed Water Electrolysis(DWE) each have 30% share of new production.�After 2020, CSMR and Integrated Gasification Combined Cycle (IGCC) each have 30%, coalgasification has 10% and Central Water Electrolysis (CWE) and DWE each have 15% share ofnew production.�In line with the “Roadmap 2050” study, it is assumed that the share of renewable energy in thepower mix increases steadily (important for electrolysis) –see Annex, Exhibit 47, page 56.�CO2Capture and Storage (CCS) is applied to all new CSMR, IGCC and coal gasificationcapacity starting in 2020 and coal is co-fired with 10% biomass, which costs three times theIEA4estimate to account for pre-treatment required prior to gasification.34“Clean hydrogen” refers to the use of CCS; “green hydrogen” to renewable energyInternational Energy Agency
22
�Coal, natural gas, clean electricity and biomass are all important for hydrogen production.Both water electrolysis and IGCC could play a key role in supporting the electricity grid:electrolysis for demand management; IGCC for dispatchable power, i.e. for storage or export.Both technologies are also compatible with providing load balancing services, which will be inhigh demand in an electricity grid which includes a high percentage of renewable energies.The role of biofuelsThere is still uncertainty as to the amount of (sustainably produced) biofuels that will be available for passenger carsin the medium and long term in Europe. The study takes the following assumptions: by 2020 biofuels are blended,delivering a 6% well-to-wheel reduction in CO2emissions for gasoline and diesel engined vehicles, in line with the EUFuel Quality Directive; by 2050 this increases to 24% to reflect growing supplies.It also reflects the fact that this market will face increasing competition from other sectors – especially goods vehicles,aviation, marine, electric power and heavy industry to meet the needs of these sectors and a global passenger carfleet of 2.5 billion cars in 2050. A comprehensive analysis on the true global potential of biofuels is needed todetermine both their availability and for which sectors and regions they may be most effectively used.
b. DistributionA range of distribution methods was included in the study (Table 1).Distribution methodTonnes of hydrogen/day
Liquid trucksGaseous trucksPipelines
3.50.4 (250 bar), 0.8 (500 bar)1, 2.5, 10, 100
Table 1: An overview of distribution methods included in the studyIndustry data were then used to calculate the distribution costs5for different volumes anddistances, with the least expensive distribution method chosen for the required deliverydistance.A wide variety of distribution infrastructures may be considered, according to hydrogen volumes,distances and local specificities. This study assumes a distribution roadmap where gaseoustrucks are initially the most important method, with liquid trucks bridging the gap to pipelines,6which will result in a significant reduction in delivery cost and CO2emissions (Exhibit 10).
56
Delivered cost = production cost + distribution cost + retail cost (each cost comes from theweighted average cost of all operating components using current feedstock and electricity prices).Components already built are assumed to continue operating for their lifetime until retiredPrivate companies in Europe already own and operate the world’s largest hydrogen pipeline networkcovering ~1600 kilometres in France, Germany and the Benelux countries. Smaller pipelines are alsooperating in Italy and Sweden.
The role of Battery Electric Vehicles, Plug-in Hybrids and Fuel Cell Electric VehiclesMethodology
23
Annual H2distributionPercent
Pipeline
Liquid Truck
Gaseous Truck
100%Method
Pipeline
Liquid TrucksGaseous Trucks2010202020302050
SOURCE: Study analysis
Exhibit 10: The hydrogen distribution mix assumed for the studyc. Retail stations
Small station (70-100 cars per day)Medium station (150-250 cars per day)Large station (450-600 cars per day)
2 dispensers, 0.4 tonnes of hydrogen/day4 dispensers, 1 tonne of hydrogen/day10 dispensers, 2.5 tonnes of hydrogen/day
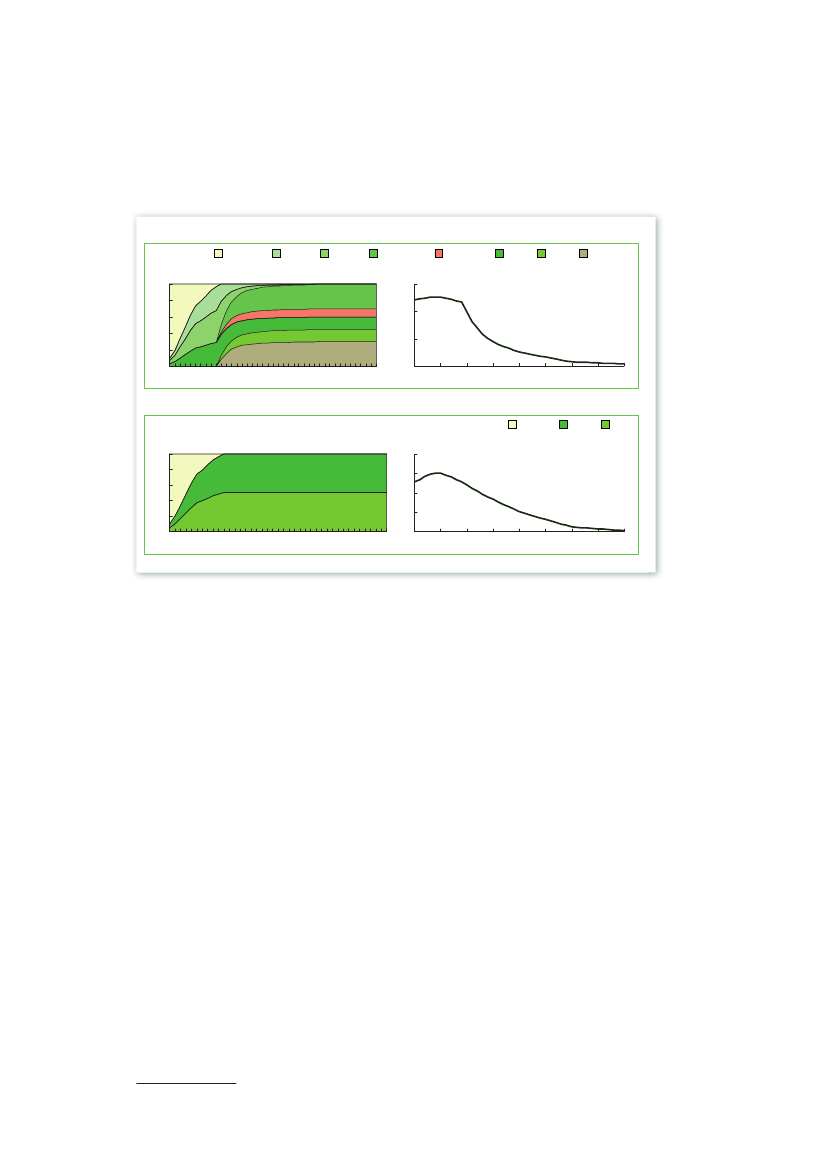
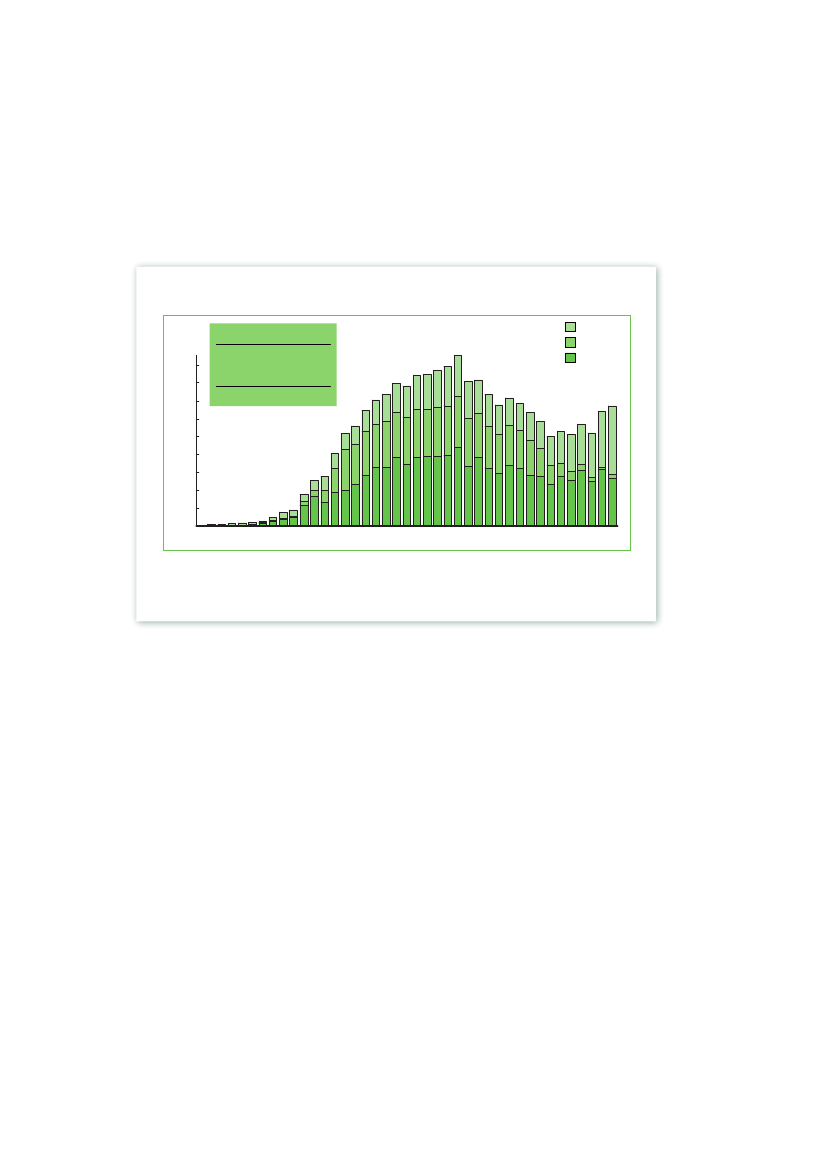
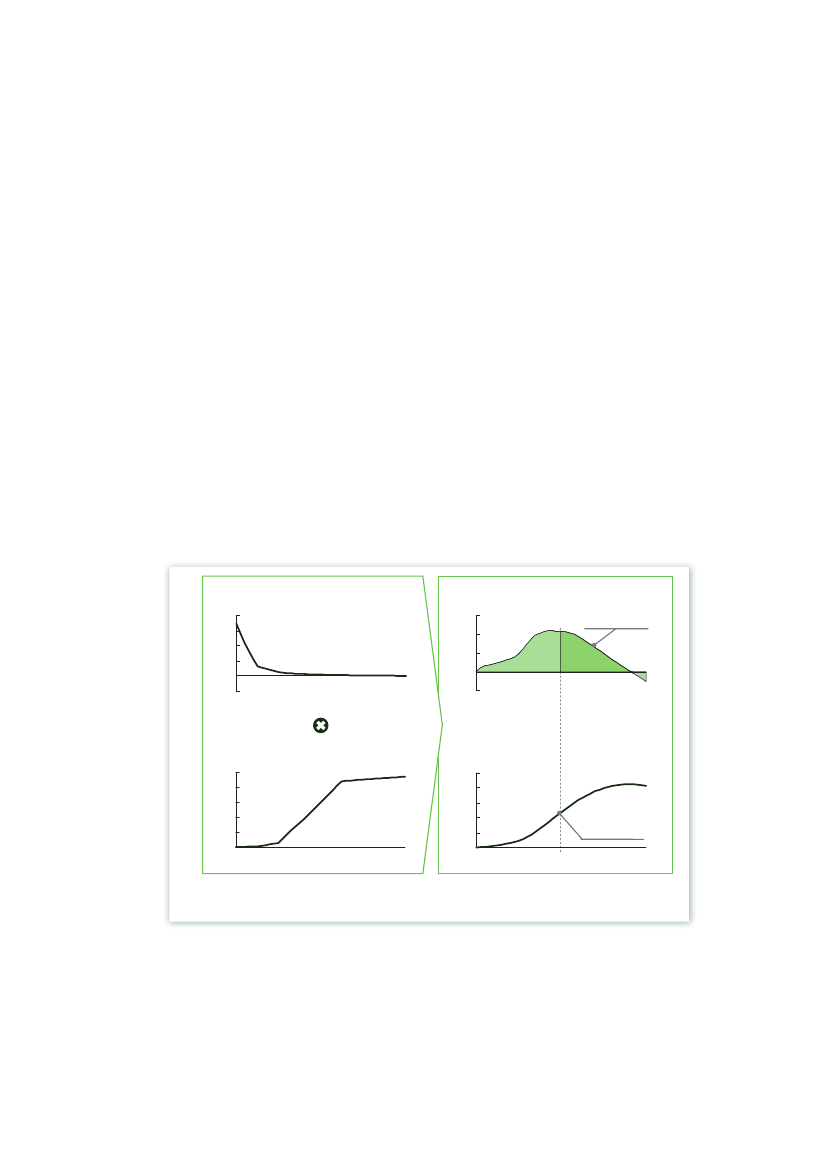
Table 2: An overview of retail stations included in the studyThe size of retail stations added was determined by hydrogen demand and coverage area: whencoverage expands faster than demand, new retail stations are small; when demand grows fasterthan the coverage area, larger retail stations are added etc.In the first decade, utilisation of retail stations is low, resulting in higher costs, but by 2020 itachieves 80% of the designed capacity, based on industry experience in fuels retail(see Annex,Exhibit 49, page 57).As expected, large retail stations have better economics than small andmedium stations.For the simulation in all “worlds”(see pages 16-18),the number of retail stations grows from aninitial cluster of four in 2010 to 198 in 2015 and 755 in 2020; for the electric vehicle-dominated“world”, Exhibit 11 shows a breakdown of retail stations from 2020 to 2050.
24
Thousand retail stations in EU29
25% FCEV penetration in 2050 (hydrogen retail network covers 75% of EU29, giving local access to 97% of all cars)20SmallMediumLarge
18.2
1512.1109.1
13.9
52.30.80
5.1
2020
2025
2030
2035
2040
2045
2050
Note Small stations have maximum capacity of 400 kg H2/day, medium have 1 tonne H2 /day and large have 2.5 tonnes H2 /daySOURCE: Study analysis
Exhibit 11: The number of hydrogen retail stations from 2020 to 2050in theelectric vehicle-dominated“world”
Key assumptions
▪WACC (Weighted average cost of capital) of 7% in nominal terms (post corporate tax), with no additional margin▪An asset lifetime of 20 years (30 years for pipelines)▪Oil, gas and coal prices are assumed from the IEA (see Annex, Exhibits 50-52, pages 58-59)▪Key raw material prices (e.g. metals) are taken from industry consensus analysisThe power supply pathway underlying this report is based on the European Climate Foundation “Roadmap 2050”,which was developed in cooperation with the industry and describes a pathway to decarbonise the EU’s power mix by2050. In 2020, the expected share of renewable production capacity is approximately 34%. This is the minimumneeded to meet the 20% EU renewable energy target, as there is limited RES opportunity outside of the power sector(see Annex, Exhibit 47, page 56). This ensures that the treatment of the power sector is consistent with the EU CO2reduction goal of 80% by 2050 (i.e. zero CO2from power by 2050) and draws a self-consistent set of electricity tariffsfor wholesale, industrial and retail use, together with CO2emissions from power generation.
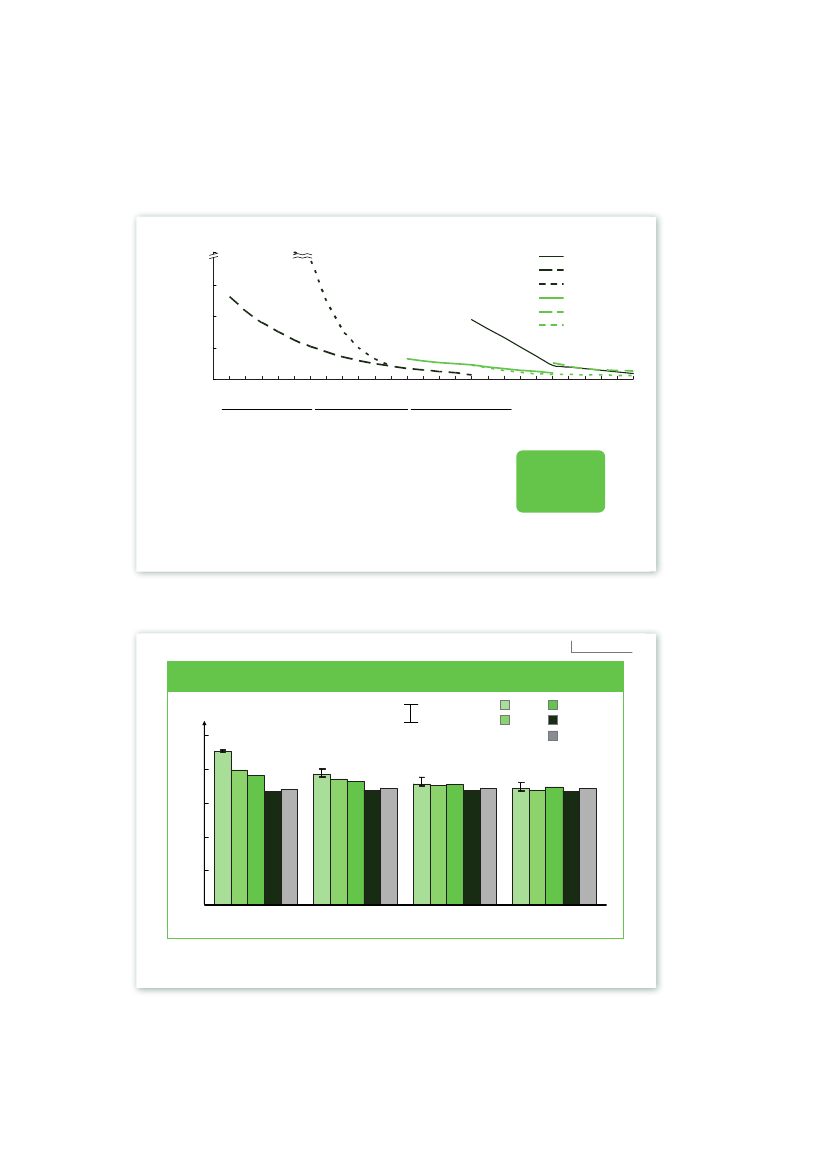
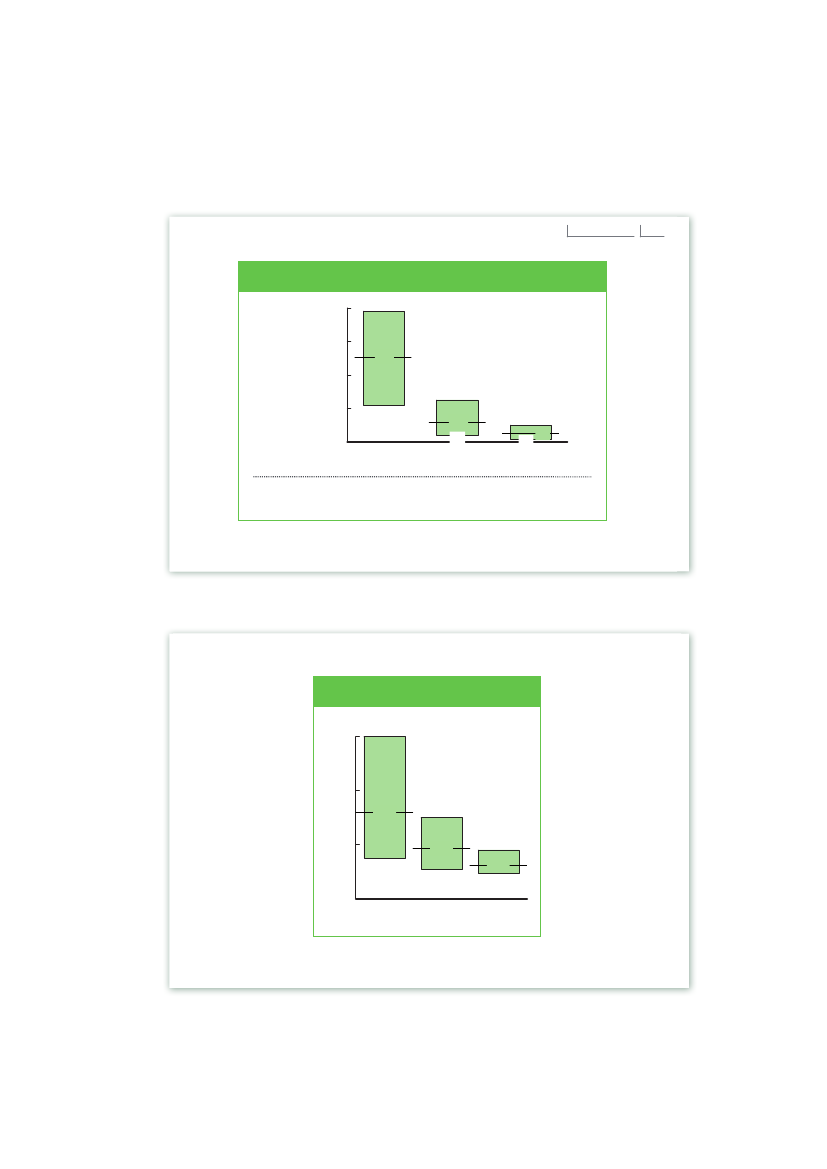
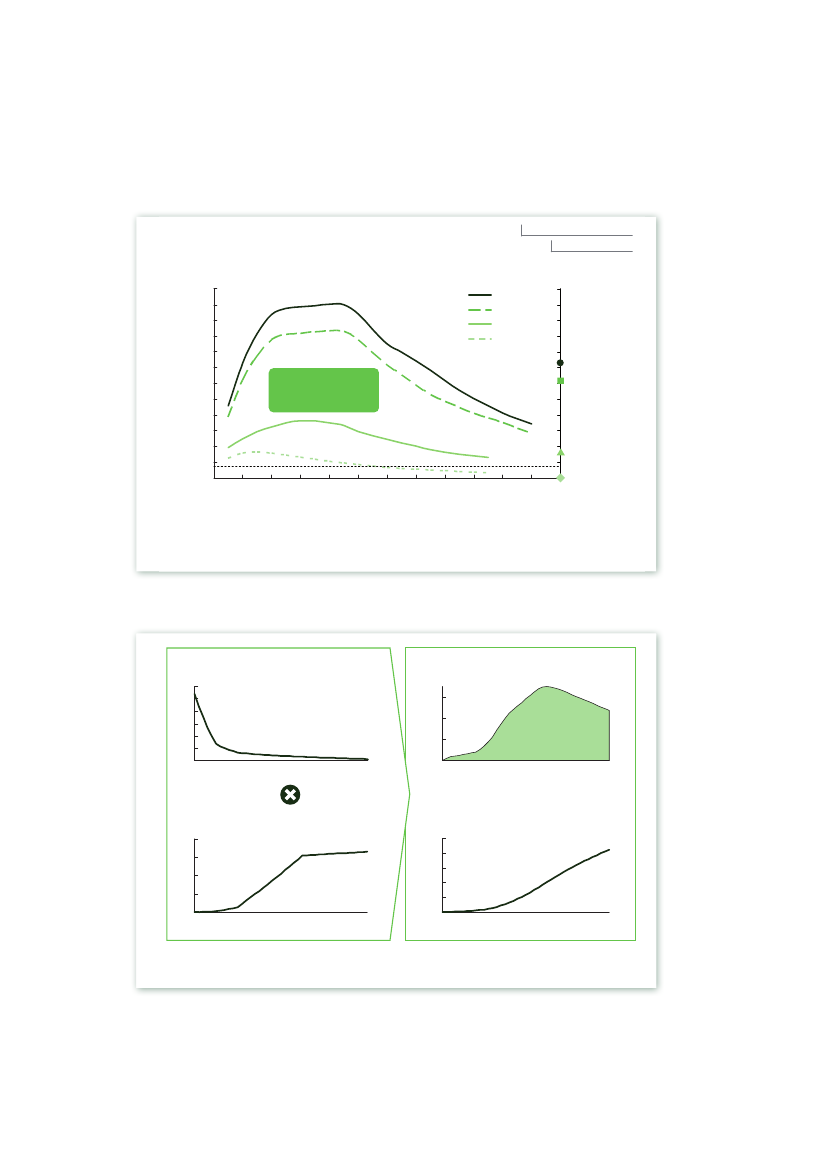
Assumptions are robust to significant variationsProjected cost reductions are based on years of experience of conventional vehicles – ICEs –including learning rates, the simplification of systems and economies of scale achieved by scalingup to larger production lines. The introduction of hybrid electric vehicles (HEVs), on the otherhand – with millions now on the road – has given a deep insight into the pace of cost reduction forinnovative power-trains and components over the last 10 years.Nevertheless, all conclusions are robust to significant variations in learning rates and the cost offossil fuels; and by 2030, there is only a small difference of –1 to +3 cents per kilometre (based ona pre-tax cost of 18 cents per kilometre), even with variations of +/– 50% (Exhibit 12).
The role of Battery Electric Vehicles, Plug-in Hybrids and Fuel Cell Electric VehiclesMethodology
25
C/D SEGMENT
TCO delta between FCEV andEURct/km, 2030+50%
ICE-gasoline1-2
iso TCO linesNegative numbersrelate to a TCOAdvantage ofFCEV over ICE
-1
0FossilOil 0.58 EUR/litre,Gas 39 EUR/MWhCoal 88 EUR/ton+3fuel2+1+2
-50%-50%0% - 15%3Learning rates after 20201 Assuming 15 year lifetime and annual driving distance of 12,000 km2 No taxes included, e.g. excise tax, CO2 tax, VAT3 Fuel cell membranes: 15% pdc (per doubling of capacity); non-platinum catalyst: 15% pdc; FC structure: 15% pdc, EV-specific parts: 4.0%/1.5% p.a.;FC periphery 4.0%/1.5% p.a.; glider cost (FCEV & ICE): 0%; ICE basic power-train parts: 0%; technology packages: 1.5% p.a.SOURCE: Study analysis
+50%
Exhibit 12: All conclusions are robust to significant variations in learning rates and the cost offossil fuels
26
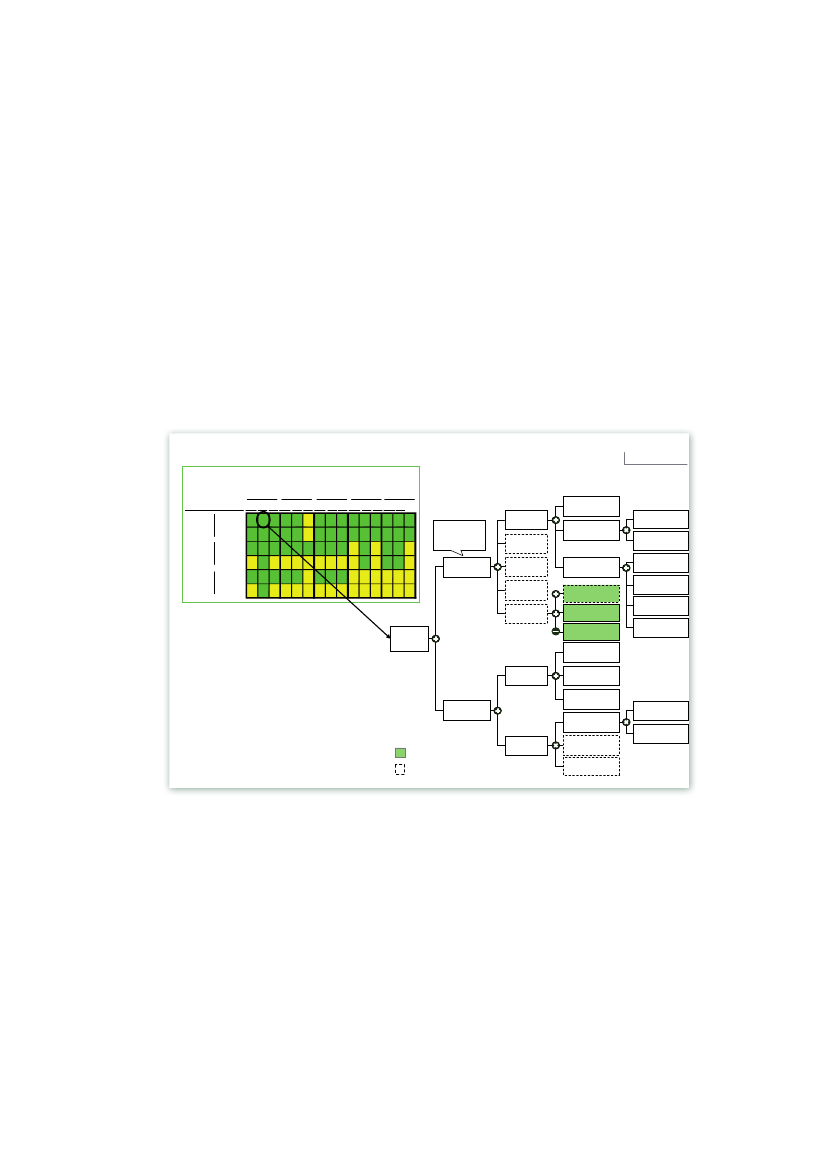
INPUT DATAThe collection, benchmarking and validation of over 10,000 data pointsThe process of collecting and sanitising data from participating companies was both methodicaland rigorous:1. The independent consultancy and participating companies together defined precisely thedata to be collected in order to evaluate the four power-trains on a well-to-wheel basis.2. The consultancy’s “Clean Team” then sent out detailed data requests on economics(Exhibit 13), sustainability and performance for all four power-trains (BEV, FCEVs, PHEVs andICEs), including the following supply chains: Gasoline and diesel, Electricity, and Hydrogen
ILLUSTRATIVECollected data sets for all drive trains in the segments A/B, D, JFCVData pointsCost20102015,20FueleconomyPerfor-mance20102015, 2020102015,20A/B DBEVJ A/B DPHEVJ A/B DICE –DieselJ A/B DICE – GasJ A/B DAssumingcompletedepreciation overvehicle lifetimePurchase priceEUR/vehicleParts costEUR/vehicleAssembly costEUR/vehicleSG&AEUR/vehicleMarginEUR/vehicleTaxesEUR/vehicleTotal cost ofownershipEUR/vehicle
Example of cost calculation – FCEV D segment – 22 data pointsConventional partscostEUR/vehicleFuel cell cost1EUR/vehicle
8 8 8 6 5 4 5 5 5 6 6 6 6 6 68 8 8 6 5 4 5 5 5 6 6 6 6 6 68 8 8 7 6 5 6 6 6 4 5 4 5 5 43 7 4 4 3 3 3 3 3 4 5 4 5 5 48 8 8 7 6 4 6 6 6 3 4 3 4 4 33 7 4 4 3 4 4 4 4 4 4 4 4 4 4
Fuel cell powerkW/vehicleCost per kWEUR/kWFC periphery costEUR/vehicleFC battery costEUR/vehicleH2 tank costEUR/vehicleEV-specificparts costEUR/vehicle
FCV-specific partscost (other than FC)EUR/vehicleSales taxEUR/vehicleCO2 taxEUR/vehicleSubsidyEUR/vehicleICE-specific partsEUR/vehicle
MaintenancecostEUR/vehicle
Fuel cellEUR/vehicleOther FCV partsEUR/vehicleHydrogen costEUR/km
Running costEUR/vehicle
HydrogenconsumptionkgH2/kmHydrogen priceEUR/kg
Not included in the studyAssumptions pre-definedwith participating companies
Fuel costEUR/vehicle
Vehicle lifetimeyearsTravelled distancekm/year
Exhibit 13: An example of cost data collected for a FCEV3. The Clean Team collected the data and assessed whether they were of theappropriate quality.4. The Clean Team reviewed the submitted data in order to understand the differences betweenthe data sets of the various companies, asking them to preside correct data, where necessary.5. Individual output data were submitted to relevant companies for sign-off (Exhibit 14)
The role of Battery Electric Vehicles, Plug-in Hybrids and Fuel Cell Electric VehiclesInput data
27
ILLUSTRATIVECollecteddata setsH2 supplychainGeneralLearning ratesGreenfield capex; footprintDistributed SMRCentral SMRCCS / SMRCoal Gasification (CG)CCS for CGBiomass Gasification (BG)Water Electrolysis (WE)IGCCDistribution pipelineTransmission pipelineLiquid H2 TrucksLiquefierGas H2 TrucksCompressorRetail station 700 barRetail station 350 bar444/65/64/63/63/61/67/73/610 tonne/day4/44/43/53/53/54/56/74/7100 tonne/day2.5 tonne/dayx.xx1 tonne/dayx.xxz.zzy.yyx.xxy.yyx.xxy.yyz.zzy.yyz.zzx.xxy.yyx.xxz.zzx.xxy.yyx.xxx.xxy.yyz.zzy.yyx.xxz.zzy.yyx.xxy.yyz,.zzy.yy0.4 tonne/day
Fixed operation cost
Variable operational cost
Capital cost
An example of cost output data for water electrolysis – 60 data pointsEUR/kg H220102015y.yyz.zzx.xxy.yyz.zz2020x.xxy.yyz.zz2050x.xxy.yyz.zz
Production
x.xx
z.zzx.xxy.yy
z.zzx.xxy.yyz.zz
z.zzx.xxy.yy
z.zzx.xxz.zzy.yy
z.zzx.xxz.zzy.yy
Distribution
z.zz
Retail
Exhibit 14: An example of cost output data for water electrolysisAfter all the output data had been signed off, it was then considered frozen and the analysis of thepower-trains began.
28
RESULTSThe following conclusions are not forecasts, but one possible outcome – the result of abackcasting exercise based on a penetration of 25% FCEVs, 35% BEVs, 35% PHEVs and 5% ICEsin the EU by 2050(see pages 16-18).
1. BEVs and FCEVs have the potential to significantly reduce CO2and local emissionsBEVs: given their limited energy storage capacity and driving range (150-250 km1) – and a currentrecharging time of several hours – BEVs are ideally suited to smaller cars and shorter trips, i.e.urban driving.FCEVs: with a driving range and performance comparable to ICEs, FCEVs are the lowest-carbonsolution for medium/larger cars and longer trips.PHEVs: with a smaller battery capacity than BEVs, electric driving for PHEVs is restricted to shorttrips (40-60 km). Combined with the additional blending of biofuels(see page 2),they also showemission reductions for longer trips, but uncertainty remains as to the amount of sustainablyproduced biofuels that will be available for this market. Nevertheless, they are an attractivesolution, reducing emissions considerably compared to ICEs.ICEs: ICEs also have the potential to reduce their CO2footprint significantly through improvedenergy efficiency and biofuels. After 2020, however, further engine efficiency improvements arelimited and relatively costly, while the availability of biofuels may also be limited.a. Electric vehicles are more energy efficient than ICEs over a broader range offeedstocks2020
0,90,8Well-to-wheel efficiency, km/MJ
ICE gasolineICE dieselBEVFCV
3.22.8Well-to-wheel efficiency, km/kWh2.42.01.6
0,70,60,50,40,30,20,10OilGas2Coal3FCEV and BEVefficiency can befurther improved
1.20.8Biomassefficiency heavilydependent ontype of biomass
Comparisonincludes CCSfor BEV andFCEV
0.40
Biomass
1 All power-trains have different performance criteria and therefore different driving missions2 CNG used in gasoline ICE; diesel production from natural gas through Fischer-Tropsch process3 Gasoline and diesel production from coal-to-liquids transformation through Fischer-Tropsch processSOURCE: CONCAWE-EUCAR JEC-WTW study; study analysis
Exhibit 15: The well-to-wheel efficiency of FCEVs is comparable to ICEs, while BEV remainsthe most efficient power-train1For C/D segment cars in the medium term
The role of Battery Electric Vehicles, Plug-in Hybrids and Fuel Cell Electric VehiclesResults
29
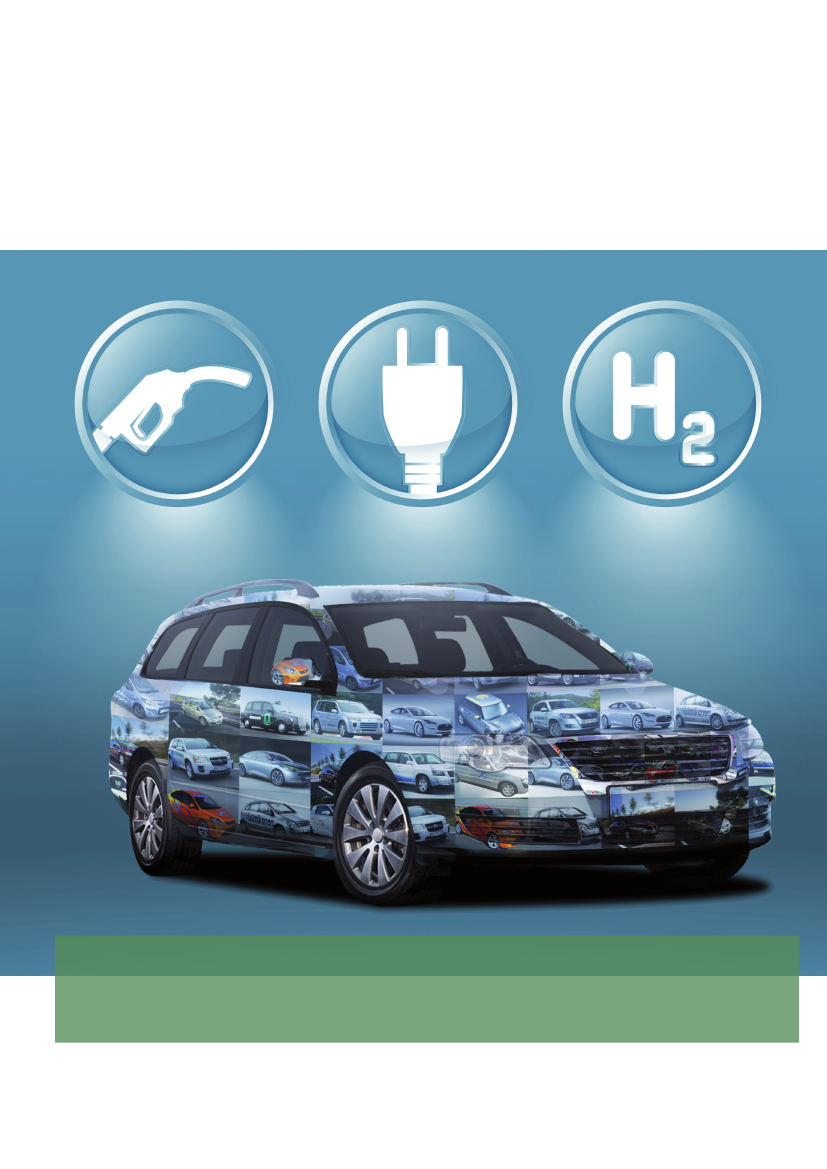
In the energy- and carbon-constrained world in which we now live, the efficient use of primaryenergy resources is essential.Exhibit 15 shows the well-to-wheel efficiency of the different power-trains using different types ofprimary energy sources. BEVs are the most efficient solution. FCEVs are more efficient than ICEon gas and coal. On oil and biofuels, the difference between ICE and FCEVs is small(see Annex,Exhibit 43, page 54, for a more detailed analysis).EU29 WTW energy consumption for passenger car transport, percentBiofuel1BiomassElectricity2Natural gasNOT A FORECASTCoalOil
Primary energyconsumptionTWh
100% = 1,9001%
Non-zero emission -conventional100% = 1,35018%0%2% 8% 4%68%
Zero-emission –xEV dominated
Zero-emission –FCEV dominated100% = 1,2504% 4%22%18%38%14%3.4
99%
100% = 1,0506% 3%28%13%27%22%3.4
2.8Distance driventrillion km
3.4
▪▪▪
Transportation notdecarbonisedLarge volume ofbiofuels neededAverage~30%efficiency improve-ment in ICEs
▪▪
Mix of primary andsecondary energy(not “like-for-like”)Reduced energyconsumption dueto high share ofelectric vehicles2050
▪▪
Mix of primary andsecondary energyHigher consumption(than 25% world)due to increasedhydrogenproduction fromcoal
2010
1 Biofuels assumed to have zero carbon footprint, otherwise more is required to meet well-to-wheels CO2 reduction assumption2 Electricity as secondary energy – no losses from primary energy includedSOURCE: Study analysis
Exhibit 16: On a net-distance-travelled basis, electric vehicles could potentially drive morekilometres than ICEs using less energyThe data in this exhibit are the result of a backcasting exercise based on FCEVs achieving arange of penetrations in the EU by 2050(see pages 16-18)and the scenario for power generationoutlined in the European Climate Foundation’s report, “Roadmap 2050”(see page 24).While oil will remain the main source of energy for passenger cars in the short-to-medium term,switching to a high percentage of electric vehicles will increase flexibility and security of energysupply as they can be fuelled by a variety of primary energy sources.For all future scenarios – and on a total global vehicle travel basis – BEVs, FCEVs, PHEVs andfuture ICEs can drive more total kilometres than today’s ICEs using less primary energy due toincreased efficiency.
30
H2production costEUR / kg H2
2050
2030
6,05,04,03,02,01,000510152025CO2emissionskg CO2/ kg H2CG+ CCS3CSMR+ CCS1IGCC+ CCS3CSMR1IGCC3DWE2CWE2DSMR1
CG3
1 SMR (Steam Methane Reforming) – dependent on natural gas2 WE (Water Electrolysis) – uses 80% RES pathway for electricity and can offer additional grid stabilisation load leveling benefits3 CG (Coal Gasification) – relies on domestic coal and when combined with CCS is assumed to be co-fired with 10% biomassSOURCE: Study analysis
Exhibit 17: A variety of technologies are available to produce CO2-free hydrogen(future cost levels)A variety of technologies and feedstocks will be able to produce CO2-free hydrogen, includingfossil fuels, renewable electricity, nuclear and biomass.The most cost-effective future production methods use existing technologies – steam reformingand coal gasification.Costs of existing technologies such as SMR and coal gasification, will increase due to increasingfuel prices and costs of CCS (partly offset by technology advancements).Cost of water electrolysers reduces due to efficiency improvements. The assumed powerprice reflects that these units can be run intermittently, providing a balancing solution for thepower grid.Hydrogen can be produced cost-effectively on both a small and large scale – from 0.4 to 1000tonnes per day – from centralised or decentralised production.
The role of Battery Electric Vehicles, Plug-in Hybrids and Fuel Cell Electric VehiclesResults
31
CO2Capture and Storage (CCS)CO2Capture and Storage (CCS) has been identified as an important solution for reducing CO2emissions, with thepotential to provide 20% of the cuts required in the EU by 2030 and 20% of global cuts required by 2050While the technology is being developed to reduce the CO2footprint of power generation, an additional benefit is thatpre-combustion CO2capture technology also allows the production of large volumes of CO2-free hydrogen. This isimportant to the economic assumptions of the study, as in the balanced and economically driven hydrogen productionscenario (see pages 20-22), 70% of hydrogen is assumed to be produced using CCS.CO2capture has already been practised on a small scale, while the technology for CO2storage is similar to that usedby the oil and gas industry for decades – to store natural gas or for enhanced oil recovery (EOR). CO2storagetechnology combined with EOR is therefore very advanced, providing ample data for storage in depleted oil and gasfields, while pure storage has been demonstrated for over a decade in a limited range of deep saline aquifers.However, the inherent risks associated with scale up and deployment are recognised.The next step is therefore to scale-up the technology, with demonstration projects of a size large enough to allowsubsequent projects to be at commercial scale. This will also build public confidence, as it is seen that CO2storage issafe and reliable.The EU has already made significant progress in advancing CCS, establishing a legal framework for the geologicalstorage of CO2and public funding to support an EU programme of up to 12 CCS demonstration projects. The goal: toenable the commercial availability of CCS by 2020. This has been echoed by many similar initiatives worldwide.For more information, please refer to the European Technology Platform for Zero Emissions Fossil Fuel Power Plants(ZEP), otherwise known as the Zero Emissions Platform: www.zeroemissionsplatform.eu.
b. BEVs are ideally suited to smaller cars and shorter tripsC/D SEGMENT
CO2emissionsgCO2/ km
20018016014012010080604020002010BEV2050FCEV2050Low emissions and high range20102010ICE – gasoline11020
ICE – diesel12010
PHEV2050
2050
2050
200
400
600
800
1.000
1.200
1.400
1.600Rangekm
1 ICE range for 2050 based on fuel economy improvement and assuming tank size stays constant. Assuming 6% CO2 reduction dueto biofuels by 2020; 24% by 2050SOURCE: Study analysis
Exhibit 18: BEVs and FCEVs can achieve significantly low CO2emissions, with BEVs showinglimitations in rangeDespite improvements in fuel economy, the capacity of ICEs to reduce CO2is significantly lessthan that of BEVs and FCEVs, which can achieve close to zero CO2emissions (well-to-wheel).As the range of BEVs is limited for medium sized cars, they are ideally suited to smaller cars andshorter trips.See Annex (Exhibit 53, page 59)for a graphical analysis of how BEVs, FCEVs and PHEVs canreduce CO2emissions over time.
32
c. FCEVs are the lowest-carbon solution for medium/larger cars and longer trips
(100% = 273 m)
21%
98 million cars = 62 Mt of CO2p.a.
< 10
Annual10-20drivingdistance(1,000 km)> 20
19%19%
145 million cars = 243 Mt of CO2p.a.
Exhibit 19: Medium/larger vehicles with above average driving distance account for 50% ofall cars and 75% of CO2emissionsMedium/larger cars are responsible for a disproportionately greater share of CO2emissions dueto the fact that they generally cover longer distances, as well as emit more CO2. Replacing oneICE in these segments with one FCEV therefore achieves a relatively higher CO2reduction.As FCEVs also have a clear TCO advantage over BEVs and PHEVs for medium/larger cars andlonger trips(see Exhibit 32, page 42),FCEVs represent the lowest-carbon solution for a largeproportion of the car fleet, based on current mobility patterns.BEVs and FCEVs have the potential to significantly reduce CO2and local emissions.
The role of Battery Electric Vehicles, Plug-in Hybrids and Fuel Cell Electric VehiclesResults
33
d. PHEVs are an attractive solution for short trips or using biofuelsWell-to-wheel CO2emissions, g CO2/kmC/D SEGMENT 2050Balanced scenarioRange of scenarios1
0FCEVBEVPHEVICE dieselICE gasoline
20
40
60
80
100
120
Technologies required for95% CO2reduction target
Reduced PHEV and ICE emissionspossible with greater use of biofuels
-95% CO2reduction2
1 Scenarios refer to a range of potential futures of varying electricity decarbonisation and biofuel implementation:Balanced – decarbonised electricity sector via renewables, CCS and nuclear, and 24% well-to-wheel reduction in diesel and gasoline CO2 footprintHigh CO2 – central SMR for H2 production, EU 2010 electricity mix and 6% well-to-wheel reduction in diesel and gasoline CO2 footprint2 C/D segment emission limit set to 4% of current 2010 vehicle emissions to achieve 95% CO2 reduction allows 20% more vehicles in 2050SOURCE: Study analysis
Exhibit 20: BEVs and FCEVs can achieve 95% decarbonisation of road transport by 2050In order to achieve the EU’s goal to reduce CO2emissions by 80% by 2050, CO2emissions in theroad transport sector must be reduced by 95%.PHEVs can reduce CO2emissions when using the electric drive, but only for short trips (40-60 km).Combined with the additional blending of biofuels, they also show emission reductions for longertrips, but uncertainty remains as to the amount that will be available for this market(see page 2).
2. After 2025, the total cost of ownership of all the power-trains convergeIn the study, the economic comparison between power-trains is based on the total cost ofownership (TCO), as well as purchase price, as it describes the costs associated over their entirelifetime(see page 18).All costs are “clean” of tax effects, including carbon prices.BEVs and FCEVs are expected to have a higher purchase price than ICEs (battery and fuel cellrelated) lower fuel cost (due to greater efficiency and no use of oil) and a lower maintenance cost(fewer rotating parts).The cost of fuel cell systems is expected to decrease by 90% and component costs for BEVs by80% by 2020, due to economies of scale and incremental improvements in technology. Around30% of technology improvements in BEVs and PHEVs also apply to FCEVs and vice versa. Thisassumes that FCEVs and BEVs will be mass produced, with infrastructure as a key prerequisiteto be in place. The cost of hydrogen also reduces by 70% by 2025 due to higher utilisation ofthe refuelling infrastructure and economies of scale, e.g. the capital cost of hydrogen refuellingstations is expected to reduce by 50% between 2010 and 2020.
34
PHEVs are more economic than BEVs and FCEVs in the short term. The gap gradually closesand by 2030 PHEVs are cost-competitive with BEVs for smaller cars, with both BEVs and FCEVsfor medium cars and less competitive than FCEVs for larger cars.While the fuel economy of ICEs is expected to improve by an average of 30% by 2020, costs alsoincrease due to full hybridisation and further measures such as the use of lighter weight materials.The TCOs of all four power-trains are expected to converge after 2025 – or earlier, with taxexemptions and/or incentives during the ramp-up phase.For larger cars, the TCO of FCEVs is expected to be lower than PHEVs and BEVs as of 2030.By 2050, it is also (significantly) lower than the ICE. For medium-sized cars, the TCOs for alltechnologies converge by 2050. BEVs have a (small) TCO advantage over FCEVs in the smallercar segments.By 2020, the cost of a fuel cell system falls by 90%, BEV components by 80%EUR per fuel cell system81,362MEA (excl. catalyst,incl. GDLs)Catalyst(incl. platinum)StructureC/D SEGMENT
14.2746.29622,228
~90%18,8922.9703.1943,2127,475-42%
Periphery
38.565
9.5162010FC stack lifetime‘000 kmPlatinum useg/kWØ Fuel cell stack costEUR/kWMinMaxSOURCE: Study analysis
4,30620502470.24431698
20151800.4411042252
2020
1150.93500221781
2900.11
Exhibit 21: The cost of a fuel cell system falls by 90% by 2020Exhibit 21 is based on a set of data provided by the participating companies. As discussedin the Methodology section, the average value for the fuel cell system cost is used for furthercalculations. The data set in 2010, 2015 and 2020 forms a broad range(see Annex, Exhibit 54,page 60),which is normal for an industry planning on mass production. The difference betweenthe best and the worst cost data points can vary by a factor of 5, depending on the differenttechnologies and processes used by car manufacturers.The fuel cell system is the most significant cost component in an FCEV (other cost elementsinclude the electric power-train and hydrogen tank). With all critical technological hurdlesresolved, all projected cost reductions for FCEVs are based on engineering improvements andmanufacturing efficiencies for commercial production. These include:�Improvements in design, e.g. removing components; operating at a higher temperature in orderto simplify the units
The role of Battery Electric Vehicles, Plug-in Hybrids and Fuel Cell Electric VehiclesResults
35
�Different use of materials, e.g. reduced platinum use; using alloys and smart catalyst structure;mitigation of fuel cell degradation�Improvements in production technology – moving from batch to continuous productionpatterns; solvent-free (dry processes) with high throughput�Economies of scale (1 million FCEVs in the EU by 2020).All projected cost reductions for FCEVs and hydrogen supply until 2020 are based on proprietarydata. In order to ensure a realistic outcome, learning rates after 2020 are conservative andconsiderably lower than historical improvements of comparable technologies, such as Wind,Solar PV or LNG(see Annex, Exhibit 42, page 54).C/D SEGMENTHigh risk as lifetime has not beenproven in real-life conditions yetBEV component cost, 2010EUR/vehicle66,534
Glider parts
11,384
Battery2
45.453
-69%
~80%-37%12,849
EV-specificparts1
66,534
20,488Other BEV-specific parts3
-44%7,2465.1692,0772050
Total parts
77,918
21.081
14.8115.678
8.9173.9312020230300230450
2010Battery lifetime‘000 kmØ Battery costEUR/kWhMinMax1038713751,500
2015165457275750
174
1 Including 29.7 kWh battery2 ~1.75 batteries required over BEV lifetime in 2010; ~1.1 required in 2015; only cost of utilized battery lifetime is included3 E.g., electric motor, transmission, inverter, wiring, controls, etc.SOURCE: Study analysis
Exhibit 22: The cost of BEV components falls by 80% by 2020Exhibit 22 is based on a set of data provided by the participating companies. As discussed inthe Methodology section, the average value for the BEV component cost is used for furthercalculations. The data set in 2010, 2015 and 2020 forms a broad range(see Annex, Exhibit 55,page 60),which is normal for an industry that has just started mass production. The differencebetween the best and the worst cost data point can vary by a factor of 3.All projected cost reductions for BEV components are based on proprietary dataand include:�Improvements in production engineering: operations such as electrode cutting, forming,stacking and contacting of the collectors will gradually grow more efficient through theintroduction of advanced laser technologies and a shift from “batch to continuous” productionmodes. The automatisation and rationalisation of quality testing along the production line willalso generate efficiency gains.�Economies of scale from larger production plants (3 million BEVs in the EU by 2020).
36
C/D SEGMENT 2020
Total power-train costsPercent100% =14,52612,8449,59622%
ICE
Fuel cell systemand H2tank
69%
69%
39%
BatteryElectric drive31%
6%25%31%
39%
FCEVBattery capacity2kWh1.3
BEV29.7
PHEV12.4
1 All power-trains have different performance criteria, mobility patterns and driving purposes2 Different types of batteries for each power-train depending on their driving patternSOURCE: Study analysis
Exhibit 23: In 2020, 31% of technology improvements in BEVs and PHEVsalso apply to FCEVs�BEVs, FCEVs and PHEVs are complementary technologies as they share many similarelectrical drive-train components, i.e. battery and electric drive. Investments in BEVs andPHEVs therefore also benefit FCEVs and vice versa.
2010 – Increasing hybridization
Typical hybridization measures
2020 – Significant hybridization
▪▪▪
Fuel economy mainly improvedby ICE power-train and non-power-train packagesIn addition, all OEMs have hybridvehicles in development or alreadyon the marketLevel of hybridization varies
▪
▪
Power-train improvements–ICE downsizing–Variable valve control–Engine friction reduction–Electric drive efficiency–Battery improvements,e.g., Li-ionNon-power-train improvements–Regenerative braking–Start-stop system–Low rolling resistance tyres–Strong weight reduction–Electrification of auxiliaries–Improved aerodynamics
▪▪
▪
OEMs expect that 80% of ICEvehicles in the C/D segment willbe hybridizedOptimized hybridization of C/Dsegment vehicle (with both power-train and non-power-trainmeasures) increases componentcost by EUR 3,100Fuel economy is assumed toincrease by an average of~30%1
2020 CO2emissions ICE gasolinegCO2/km, WtW
15912195
A/B1 Maximum fuel reduction potential from hybrid package, including non-power-train improvementsSOURCE: Study analysis
C/D
J
Exhibit 24: ICE fuel economy is assumed to increase by an average of 30% by 2020
The role of Battery Electric Vehicles, Plug-in Hybrids and Fuel Cell Electric VehiclesResults
37
The results of the study take into account significant improvements in fuel economy in ICEsby 2020.a. The cost of hydrogen reduces by 70% by 2025Description
▪▪▪▪▪
Before 2020, CSMR has 40% and DSMR & DWE each have 30% share of new productionAfter 2020, CSMR & IGCC each have 30%, CG has 10% and CWE & DWE each have 15% share of new productionCCS is applied to all new CSMR, IGCC and CG capacity starting in 2020Coal is co-fired with 10% biomass, which costs 3x IEA estimate to account for pre-treatment required prior to gasification1Coal, natural gas, electricity and biomass are all important for Hydrogen productionH2retail station delivered cost,EUR/kg H220151050201020152020202520302035204020452050
CO2well-to-tank emissions,kg CO2/kg H2151050201020152020202520302035204020452050
2030 H2distributed cost,EUR/kg H210862.84 2.02CSMR5.2 5.43.02.3SMR w/CCS3.50.82.83.83.04.45.5Ø4DistributionProduction
Fraction of total demand2,Percent10864201,57,8
4,31,2
CWEDWEIGCC w/CCSCG w/CCS DSMR
Coal
Natural Gas
Electricity
Biomass3
1 Co-firing more than 10% biomass with coal in IGCC and CG with CCS can allow negative CO2 emissions2 Fraction is the amount of primary energy source consumed in 2050 divided by total EU-29 wide consumption in 20083 Fraction of biomass is that assumed available to the power generation sector (1,600 TWh/year)SOURCE: Study analysis
Exhibit 25: The production mix assumed in the study is robust to energy shocksOf the nine hydrogen production mixes studied, two were considered the most relevant for thisstudy: the first (Exhibit 25) is more economically driven and based on a mix of fossil fuels andrenewable energy; the second is based entirely on renewable energy(see Exhibit 26).Bothproduction mixes reduce CO2emissions (well-to-tank) to near-zero.Before 2020, the first production mix assumes that the limited volume of hydrogen required will beproduced using centralised SMR (40%), distributed SMR (30%) and distributed water electrolysis(30%). After 2020, when the costs of FCEVs have come down and hydrogen demand rapidlyincreases, it assumes centralised SMR + CCS (30%); IGCC + CCS (30%); coal gasification + CCS(10%); centralised water electrolysis (15%); and decentralised water electrolysis (15%). Between2010 and 2050, the study assumes an increasing share of renewable energy in the power mix(seeAnnex, Exhibit 47, page 56).The exhibit shows results for the first hydrogen production mix on which the study is based: thelower left hand chart indicates the costs of the chosen production mix. In the upper left handchart, hydrogen retail delivered costs rapidly approach €4.50/kg, while in the upper right handchart, the CO2well-to-tank emissions first increase, then reduce rapidly after 2020.As can be seen in the lower right hand chart, hydrogen can be produced, distributed and retailedcost-effectively by 2020 from a variety of feedstocks to suit local and market conditions.N.B. All the results in this report are based on the balanced and economically drivenproduction mix described in Exhibit 25.
38
Description
▪▪▪▪
Only DWE and CWE production allowedHigh renewable power mix assumedEach production method share set to 50%Electricity is used for all production
Electricity assumed atindustrial shedable pricefor both CWE and DWE
H2delivered cost,EUR /kg H22015
CO2emissions,kg CO2/kg H22015
Emissions
10502010
2015
2020
2025
2030
2035
2040
2045
2050
10502010
2015
2020
2025
2030
2035
2040
2045
2050
2030 H2distributed cost,EUR /kg H26425.10.74.4CWE
Distribution5.5
ProductionØ 5.31
2050 H2distributed cost,EUR /kg H26424.50.63.9CWEDWE4.5Ø 4.46
DWE
Fraction of production method,Percent100500201020202030
Existing
DWE
CWE
2050 fraction of total 2008 EU-29 demand,Percent15105000110
2040
2050
Coal
Natural Gas
Electricity
Biomass
SOURCE: Study analysis
Exhibit 26: An alternative production mix representing 100% electrolysis, with 80%renewable production by 2050The alternative production mix – representing 100% electrolysis, with 80% renewable productionby 2050 – increases the TCO of FCEVs by 5% by 2030 and 3.5% by 2050.Delivered at pump, w/o taxes/excisesHydrogen costEUR per kg16.615.9RetailDistributionProduction
▪▪▪-67%
Small retail stations operating at low utilization drive highinitial cost, but is required to allow vehicle adoption1High initial price is only necessary for relatively smallvolume of H2Production costs decrease significantly after 2020 dueto IGCC and CGMinimal price decrease after 2025 is a result of relativelylow learning rates and increase in natural gas price
15
13.612.010.89.9
▪
10
5
8.6 7.76.87.16.3 5.86.65.5 5.3 5.16.0 5.75.0 4.8 4.7 4.6 4.6 4.5 4.5 4.5 4.5 4.4 4.45.4 5.2 5.04.9 4.8 4.74.64.54.4 4.4 4.4 4.4
0
2010
2015IGCC & CG plantsstart to be built
2020
2025
2030
2035
2040
2045
2050
1 Coverage requirement sets area and retail station density requirements for vehicle adoptionSOURCE: Study analysis
Exhibit 27: The cost of hydrogen reduces by 70% by 2025, then stays relativelyflat (excluding taxes and incentives)
The role of Battery Electric Vehicles, Plug-in Hybrids and Fuel Cell Electric VehiclesResults
39
The cost of hydrogen will be high in the first five years (2010-2015), as a result of the under-utilisation of retail stations and the fact that very small stations will be built to reduce capital costs.This is still a pre-commercial market, so these stations will have very low economies of scale.For example, in order to persuade current gasoline and diesel station owners (dealers) to startproviding hydrogen, hydrogen will need to be untaxed and dealers will require subsidy.In the next five years – in the early commercial phase, when stations become larger and utilisationgrows as more FCEVs come on the road – hydrogen (assuming it is untaxed) could become cost-competitive with gasoline ICEs (assuming gasoline is taxed).By 2020, retail costs will have significantly reduced, as more FCEVs come on the road and largestations, with multiple pumps and a higher utilisation, are built. New large-scale IGCC and CGplants will also start to be built, further reducing the cost of hydrogen.b. By 2030, BEVs, FCEVs, PHEVs are all cost-competitive with ICEs in relevant segmentsC/D SEGMENT
TCO ranges1of different power-train technologiesEUR/km1,00,80,60,40,202010
FCEVBEV
PHEVICE
2015
2020
2025
2030
1 Ranges based on data variance and sensitivities (fossil fuel prices varied by +/- 50%; learning rates varied by +/- 50%)SOURCE: Study analysis
Exhibit 28: After 2025, the TCOs of all the power-trains convergeDue to the initial steep decrease in the cost of fuel cell systems, BEV components and hydrogenas a result of higher utilisation and economies of scale, the TCOs of all the power-trains convergeafter 2025.
40
EUR thousandsA/B SegmentVehicleFCEVBEVPHEVICE - gasolineICE - dieselVehicleFCEVBEVPHEVICE - gasolineICE - dieselVehicleJ SegmentFCEVBEVPHEVICE - gasolineICE - dieselPurchase price20.016.914.711.311.3Purchase price30.928.926.821.421.9Purchase price38.941.037.028.529.5Maintenance2.82.32.93.03.0Maintenance4.53.74.95.55.7Maintenance5.65.46.77.17.5Fuel cost14.62.83.33.73.7Fuel cost5.63.43.84.74.7Fuel cost6.94.25.16.26.5
EXCLUDING ALL TAXES 2020Infrastructure22.22.51.40.50.4Infrastructure2.72.51.40.60.5Infrastructure3.32.51.40.80.7TCO29.624.522.318.518.4TCO43.838.536.932.332.8TCO54.853.150.242.544.1
1 Includes production and distribution cost2 Includes retail costNOTE: Assuming 15 year lifetime, annual driving distance of 12,000 km, no tax (e.g., fuel excise, VAT)SOURCE: Study analysis
Exhibit 29: By 2020, the purchase price of BEVs, FCEVs and PHEVs is several thousand moreeuros than ICEs, which could be offset by tax exemptions
By 2020, the purchase price of electric vehicles is still several thousand euros more than thatof ICEs, but reasonable public incentives on vehicle, fuel and an attractive customer valueproposition could be sufficient to bridge this cost gap(see page 43).The purchase price of BEVsis lower than FCEVs.The purchase prices of electric vehicles may vary widely according to market conditions and carmanufacturers who may either be further advanced in achieving cost reductions and/or chooseto limit the premium. They also depend on branding strategies, with a whole range of purchaseprices within any car segment – from lowest cost to premium vehicles.
C/D Segment
The role of Battery Electric Vehicles, Plug-in Hybrids and Fuel Cell Electric VehiclesResults
41
EUR thousandsA/B SegmentVehicleFCEVBEVPHEVICE - gasolineICE - dieselVehicleFCEVBEVPHEVICE - gasolineICE - dieselVehicleJ SegmentFCEVBEVPHEVICE - gasolineICE - dieselPurchase price16.015.213.711.111.2Purchase price25.726.325.021.121.6Purchase price32.737.334.728.329.1Maintenance2.52.22.83.03.0Maintenance4.23.64.95.45.6Maintenance5.35.26.77.07.4Fuel cost14.42.73.44.14.1Fuel cost5.23.23.75.35.2Fuel cost6.23.95.16.97.2
EXCLUDING ALL TAXES 2030Infrastructure21.22.51.40.50.4Infrastructure1.42.51.40.60.5Infrastructure1.72.51.40.80.7TCO24.022.621.318.718.7TCO36.535.635.032.332.9TCO45.948.947.942.944.4
1 Includes production and distribution cost2 Includes retail costNOTE: Assuming 15 year lifetime, annual driving distance of 12,000 km, no tax (e.g., fuel excise, VAT)SOURCE: Study analysis
Exhibit 30: By 2030, all electric vehicles are viable alternatives to ICEs, with running coststhat are comparable and a purchase price that is close to comparable for larger carsBy 2030, the advantages of lower running costs almost outweigh the higher purchase priceof electric vehicles, which start to close the gap with ICEs on both purchase price and TCO.Typically, electric vehicles (BEVs, FCEVs, PHEVs) cost 2-6 cents more per kilometre than ICEs.EUR thousandsA/B SegmentVehicleFCEVBEVPHEVICE - gasolineICE - dieselVehicleFCEVBEVPHEVICE - gasolineICE - dieselVehicleJ SegmentFCEVBEVPHEVICE - gasolineICE - dieselPurchase price14.313.412.810.811.0Purchase price23.723.523.520.521.2Purchase price30.433.332.627.928.7Maintenance2.32.22.82.92.9Maintenance4.03.54.85.15.4Maintenance5.05.16.66.97.2Fuel cost13.72.43.54.64.6Fuel cost4.02.83.65.85.8Fuel cost4.63.45.17.78.0EXCLUDING ALL TAXES 2050Infrastructure21.02.51.40.50.4Infrastructure1.12.51.40.60.5Infrastructure1.32.51.40.80.7TCO21.420.520.518.818.9TCO32.832.333.332.032.9TCO41.444.345.743.244.6
1 Includes production and distribution cost2 Includes retail costNOTE: Assuming 15 year lifetime, annual driving distance of 12,000 km, no tax (e.g., fuel excise, VAT)SOURCE: Study analysis
Exhibit 31: By 2050, FCEVs are more economic than ICEs for larger cars and fully competi-tive for medium-sized cars
C/D Segment
C/D Segment
42
By 2050, all electric vehicles are cost-competitive with ICEs, FCEVs are the lowest-cost solutionfor larger cars (J segment).EUR/year/car1, assuming no cost of CO22050
Lowest CO2abatement solutionTCO delta to ICE2PHEV/BEV/FCEV<10
Annualdrivingdistance(1,000 km)
10-20
>20
FCEV
A/B
C/D
J
1 Constant lifetime, but different total driving distances (90,000 km; 180,000 km; 360,000 km)2 Calculated as ICE TCO minus lowest FCEV/BEV/PHEV TCO. Negative numbers indicate a TCO advantage over the ICESOURCE: Study analysis
Exhibit 32: The FCEV has a TCO advantage over BEVs and PHEVs in the heavy/long-distance car segmentsIn terms of car size and annual driving distance, BEVs are economic for smaller cars and shortertrips while FCEVs perform best for C/D and J segments (medium and larger cars) and longer trips.FCEVs score almost as well as BEVs on annual driving distances of 10,000-20,000+ km in theA/B (small car) segments.As medium/larger vehicles with above average driving distance account for 50% of all cars, but75% of CO2emissions, FCEVs are therefore an attractive abatement option for a large proportionof the car fleet.
The role of Battery Electric Vehicles, Plug-in Hybrids and Fuel Cell Electric VehiclesResults
43
c. Incentives could make BEVs and FCEVs cost-competitive with ICEs by 2020C/D SEGMENT
Purchase price‘000 EUR175Excludingall taxes7550250175Includingsubsidiesfor EVs175502502010154160FCEVICE - gasolineICDE - diesel
854719 2031 29 2721 22
BEVPHEV
26 26 25 21 22
794119 2025 23 21 21 222020
20 20 19 21 222030
1 Assuming a EUR 6,000 subsidy on electric vehicles (either passively through foregoing excise taxes or actively through support)SOURCE: Study analysis
Exhibit 33: The higher purchase price of BEVs, FCEVs and PHEVs could be partially offset bytax exemptionsWith an average vehicle subsidy of nearly €6,000 for FECVs as currently provided for BEVs inseveral Member States , the purchase price of FCEVs could start to close with ICEs by 2020 andbe lower in 2030.C/D SEGMENT
Fuel and infrastructure costEUR/km0.10Excludingall taxes0.050.000.10Includingfuelexcisetaxes forICE10.050.000.090.080.060.03 0.040.060.060.030.050.050.05 0.030.040.040.040.09FCEVBEVICE - gasolineICDE-diesel
PHEV0.030.030.03 0.040.030.050.030.040.030.030.030.030.030.03
2010
2020
2030
1 Excluding VAT, but including fuel tax of EUR 0.655/litre gasoline ( ~EUR 5,500 over 180,000 km) and EUR 0,470/litre diesel(~EUR 3,300 over 180,000 km), corresponding to 2010 legislation in GermanySOURCE: Study analysis
Exhibit 34: Temporarily forgoing fuel taxes on hydrogen or electricity will level fuel costs forall power-trains over the next 10 to 20 years
44
If hydrogen is not taxed like gasoline and diesel in the ramp-up phase, infrastructure and fuelcosts for FCEVs could become cost-competitive with ICEs as early as 2020.
3. A portfolio of power-trains can satisfy the needs of consumers and theenvironmentOver the next 40 years, no single power-train satisfies all key criteria for economics, performanceand the environment. As different power-trains meet the needs of different consumers, the worldis therefore likely to move from a single power-train (ICE) to a portfolio of power-trains in whichBEVs and FCEVs play a complementary role.The results show that BEVs are ideally suited to smaller cars and shorter trips, FCEVs tomedium/larger cars and longer trips, with PHEVs providing an intermediate solution to a zero-emission world.a. FCEVs and PHEVs are comparable to ICEs on driving performance and rangeCD SEGMENT 2015Similar performanceDifferentiated performance1PoorTop speed,km/h100120140160180200220
▪Acceleration▪Curb weight▪Payload▪Cargo volume▪Minimum startingtemperature
Excellent
BEVPHEVFCEVRange,km1002003004005006007008009001,000
ICE
1,100
1,200
BEVFCEVRefueling time,min/hr (logarithmic scale)10 hr5 hr2 hr1 hr
ICEPHEV
30 min
10 min
5 min
1 min
BEVPHEV
BEV2PHEV2
ICEPHEV3FCEV
1 Bars represent range of performance across reference segments2 Fast charging; implies higher infrastructure costs, reduced battery lifetime and lower battery load3 The gas tank of a PHEV has the same refueling time as a conventional vehicleSOURCE: Study analysis
Exhibit 35: FCEVs and PHEVs have a driving performance and rangecomparable to ICEsWith limited energy storage capacity, BEVs are in a different category to FCEVs, PHEVs and ICEswith regard to speed, range or refuelling times:�For example, an average, medium-sized BEV with maximum battery loading e.g. 30 kWh,around 220 kg in 2020) will not be able to drive far beyond 150 km at 120 km/hour, if real drivingconditions are assumed (taking expected improvements until 2020 into account).�Charging times are longer, even at maximum proven battery technology potential: 6-8 hoursusing normal charging equipment. Using more sophisticated and expensive technologiescan reduce charging time. Fast charging may become widespread, but the impact on battery
The role of Battery Electric Vehicles, Plug-in Hybrids and Fuel Cell Electric VehiclesResults
45
performance degradation over time and power grid stability is unclear. Moreover, it takes15-30 minutes to (partially) recharge the battery. Battery swapping reduces refuelling time;it is expected to be feasible if used once every two months or less and battery standards areadopted by a majority of car manufacturers.FCEVs have a driving performance and range comparable to ICEs: an average driving rangeof 500-600 km, similar acceleration and a refuelling time of less than 5 minutes, similar to ICEfuelling which is a proven business model.The driving range and performance of PHEVs is similar to ICEs when in ICE drive.See Annex, Exhibit 56, page 61,for a graphical analysis of the impact of cruising speed on range.b. Snapshot of 2030: different power-trains meet different needsExcellentGoodModerateChallengedC/D SEGMENT2030
FCEV▪Driving performance in
BEV▪Limited energy storage
PHEV▪Driving range equal to ICE
ICE▪Highest driving range▪Best top speed and▪Only service intervals shorterrefueling time
Perfor-mance
similar range to ICE▪~600 km average drivingrange▪Refueling only takes acouple of minutes▪Fewer services needed
capacity and driving range(150-250 km)▪Refueling time in the orderof hours2
▪Ideally suited to smallercars and urban driving
in ICE drive ( >800km);40-60 km in electric drive▪Similar top speed, gasolinerefueling time & serviceintervals▪Battery recharging takessome hours
▪High CO2reduction (~80%)
Environ-ment
compared to today with CCS& water electrolysis▪No local vehicle emissions▪Lowest carbon solution formedium/larger cars & longertrips
▪High CO2reduction (~80%) ifCCS or renewable energy isused▪Depends on electricityfootprint▪No local vehicle emissions
▪Considerable CO2reduction
(~70%)▪Some local emissions in ICEdrive
▪Highest CO2and local▪Unlikely to meet EU CO2reduction goal for 2050vehicle emissions
▪Low CO2if 100% biofuels▪Economic for smaller cars▪Purchase price higher than▪TCO ~€3,000 higher than▪Fuel costs comparable toICE TCOICE due to high infrastructurecostICE
▪Low CO2if 100% biofuels▪Most economic vehicle▪Lowest purchase price▪Higher fuel or maintenance▪Existing infrastructurecosts
▪Purchase price is ~€4,000
Econo-mics1
higher than ICE▪TCO comparable to ICE forlarger, but not smaller cars▪Infrastructure costcomparable cost to BEVs
▪Higher purchase price andTCO than ICE▪Better fuel economy thanICE for larger cars▪Low infrastructure cost
1 Consumer economics can be different, dependent on tax region2 Fast charging for BEVs implies reduced battery lifetime, lower battery load and higher infrastructure costs than included in this studySOURCE: Study analysis
Exhibit 36: Snapshot of 2030 – only a portfolio of power-trains can satisfy key criteria forperformance and the environmentWith a driving performance comparable to ICEs and a TCO comparable in the J segment, FCEVsare the lowest-carbon solution for medium/larger cars and longer trips.With limited driving range, BEVs are ideally suited to smaller cars and urban mobility. Althoughconsiderable cost improvements in battery technology are considered in this study, it is notexpected to achieve significantly lower specific volumes or weights beyond 2020.PHEVs demonstrate a considerable CO2reduction. This applies either when using biofuels ordriving short distances. The smaller installed battery depletes quickly when driving at a higherspeed, with a heavier load or over a longer distance. Although fuel economy is better than ICEsfor larger cars (especially in stop/start city driving), the purchase price and TCO is higher and from2030, PHEVs no longer have a cost advantage compared to FCEVs.
46
4. Costs for a hydrogen infrastructure are around 5% of the overall cost ofFCEVs (€1,000-2,000 per vehicle)In order to develop a portfolio of drive-trains, several supply infrastructure systems are required –not only for gasoline and diesel, but potentially new infrastructures for CNG, LPG, 100% biofuels,electricity and hydrogen. Early commercial deployment of BEVs and PHEVs is already happeningin several European countries: many car manufacturers have announced production and the firstcommercial models are expected between 2011 and 2014. This report therefore focuses on thecommercial deployment of FCEVs, which still needs to be addressed.One could argue that it is inefficient to build an additional vehicle refuelling infrastructure on top ofexisting infrastructures. However, the additional costs of a hydrogen infrastructure are relativelylow compared to the total costs of FCEVs and comparable to other fuels and technologies, suchas a charging infrastructure for BEVs and PHEVs.Costs for a hydrogen distribution and retail infrastructure represent 5% of the overall cost ofFCEVs – the vast majority lies in the purchase price. The attractiveness of the business casefor FCEVs is therefore hardly affected by the additional costs required for distribution and retail.In other words, if FCEVs make commercial sense – as demonstrated by this study – building adedicated hydrogen infrastructure can be justified.In the first decade of a typical roll-out scenario, supply infrastructure costs – especially those fora retail infrastructure – are initially higher, due to lower utilisation. Nevertheless, sufficient networkcoverage must be available for consumers and initial investments required could amount to €3billion (covering hydrogen production, distribution and retail). Although a single company wouldstruggle to absorb the risk of such an investment, this is not the case at a societal level. This isconfirmed by countries which have built up alternative infrastructures, such as CNG and LPG.The cost per vehicle for rolling out a hydrogen infrastructure compares to rolling out a charginginfrastructure for BEVs or PHEVs (excluding potential upgrades in power distribution networks) –see Exhibit 38 below.The costs for hydrogen retail and distribution are estimated at €1,000-2,000per vehicle (over the lifetime), including distribution from the production site to the retail station,as well as operational and capital costs for the retail station itself. The average annual investmentof €2.5 billion compares to that for other industries, such as oil and gas, telecommunicationsand road infrastructure, which each amount to €50-€60 billion2. It is also significantly less thanadditional investments required to decarbonise power (€1.3 trillion3over 40 years).Costs for an electric charging infrastructure range from €1,500 to €2,500 per vehicle. The higherend of the range assumes 50% home charging (investment of €200-€400 per charging station)and 50% public charging (investment of €5,000-€10,000 for a charging station that serves twocars. Potential additional investment in the power distribution networks are not included, butcould be material, depending on the local situation. In contrast, once the territory is covered, nofurther investment is needed in hydrogen infrastructure – regardless of the number of cars –due to the fast refuelling time. As the number of FCEVs increase, it also benefits from economiesof scale.
23
Global Insightwww.roadmap2050.eu
The role of Battery Electric Vehicles, Plug-in Hybrids and Fuel Cell Electric VehiclesResults
47
a. Up to 2020, FCEVs require €3 billion supply infrastructure investmentfor 1 million cars
EUR millionsRetail4,7753,9223,5812,7963,3632,655DistributionProduction
Investment required
4.5004.0003.5003.0002.5002.0001.5001.00050002010
ProductionDistributionRetailTotal
47 billion EUR27 billion EUR27 billion EUR101 billion EUR
89010520152020202520302035204020452050
1 Current annual capex requirement for the EUSOURCE: WIS Global Insight; OVUM; OECD / International Transport Forum; study analysis
Exhibit 37: Total capital investment for a large-scale roll-out of hydrogen supply infrastructurein Europe is estimated at €100 billion over 40 yearsInitial investment before 2020 is relatively low, as it will be concentrated in areas of high density,such as large cities. Investment in retail stations is required in order to reach sufficient coverageof the territory, while being initially under-utilised. Retail cost then decreases as more vehicles aredeployed, with a higher utilisation of the retail station.The conclusions in this study are based on 25% penetration of FCEVs in Europe by 2050(seepages 16-18).To achieve a 50% penetration, the cost of infrastructure would rise by another €75billion, but there would be no significant difference in TCO per vehicle.
48
EUR billions
Investment requiredBEVPHEV20350 billion EUR190 billion EUR
BEV home boxBEV public station2122
PHEV home boxPHEV public station2223
Home box60 billion EURPublic charging 480 billion EURTotal540 billion EUR15
15
10
8
52020102015
2
2020
2025
2030
2035
2040
2045
2050
Average annual investment of 13+ billion EUR over next 40 years isconsiderably larger than investment needed for FCEVs, but serves morevehicles (~200 million BEVs/PHEVs1compared to ~100 million FCEVs)1 Cumulated new builds over 40 yearsSOURCE: Study analysis
Exhibit 38: A large-scale roll-out of BEVs and PHEVs in Europe could require up to€500+ billion over the next 40 yearsElectrical infrastructures could require an average annual investment of €13+ billion until 2050 inorder to serve 200 million BEVs/PHEVs. Two thirds of this relates to BEV infrastructure, as theycould require a higher share of public charging stations than PHEVs.
5. The deployment of FCEVs will incur a cost to society in the early yearsThe benefits of lower CO2emissions, lower local emissions (NO2, particles), diversification ofprimary energy sources and the transition to renewable energy all require an initial investment.However, these will ultimately disappear with the reduction in battery and fuel cell costs, highereconomies of scale and potentially increasing costs for fossil fuels and ICE specifications.A roll-out scenario that assumes 100,000 FCEVs in 2015, 1 million in 2020 and a 25% share ofthe total EU passenger car market in 2050 results in a cumulative economic gap4of €25 billionby 2020. Almost 90% of this relates to the relatively higher cost of the FCEV in the next decade.The CO2abatement cost is expected to range between €150 and €200 per tonne in 2030 andbecomes negative for larger cars after 2030.A strong case will be required to persuade governments as to the level of explicit subsidy needed.In subsequent steps, it will therefore be important to make proposals that show how industryis taking responsibility for all the risks that they can reasonably analyse, control and mitigate.Discussions with Member State and EU governments are likely to focus on sharing the costs andrisks between public and private sectors.
4
Economic gap is the delta between the TCO of the power-train under consideration and the ICETCO, multiplied by the number of vehicles in the respective year.
The role of Battery Electric Vehicles, Plug-in Hybrids and Fuel Cell Electric VehiclesResults
49
Up to 2020: a cumulative economic gap of €25 billionAround €3 billion investment is required for a hydrogen supply infrastructure (production,distribution, retail) for 1 million FCEVs by 2020. Of this investment, around €1 billion relates to retailinfrastructure. This will be concentrated in high-density areas (large cities, highways) and build onexisting infrastructure. If only one energy company made the investment in retail, it would face afirst-mover disadvantage due to the initially low utilisation by a small number of FCEVs. This couldlead to a potential write-off of around €0.5 billion per annum if roll-out is terminated or delayed.The initial investment risk would be somewhat reduced if further companies also invest and evenfurther if the roll-out is co-ordinated by government and supported by dedicated legislation andfunding.The remaining €2 billion required for production and distribution presents a different investmentrisk: hydrogen producers do not expect a shortfall and can meet hydrogen demand as itarises, being paid-for product at rates that would cover their costs. In the first couple of years,in particular, hydrogen producers can respond with existing production capacity without largespeculative upfront expenditures. Incremental capacity could then be added in small units atreasonable cost. The same applies to the distribution of hydrogen envisaged during this period.While hydrogen producers may enjoy a first-mover advantage, retail investors face a first-moverdisadvantage. Hydrogen manufacturers have an incentive – as soon as the economics work– to race to beat their rivals. While financial incentives are required to persuade consumersto appreciate FCEVs, there is nothing to hold the hydrogen manufacturers back – as long asthe retail infrastructure is in place. They may also gain a marketing advantage. Infrastructureproviders, on the other hand, bear a first-mover risk, making a heavy upfront outlay to build a retailstation network that will not be fully utilised for some years; the unit cost reduces over time simplybecause the fixed capital expenditure is used by an increasing number of FCEVs.To reap the benefits of lower emissions, energy diversification and technology development, acumulative economic gap for FCEVs of €25 billion may develop up to 2020, mainly due to a higherpurchase price. If this is met by only a few car manufacturers, they will each need to finance €1billion per year. An incentive to ramp up production therefore only exists if most car manufacturerscommit and co-ordinate, and government provides temporary funding support.This report assumes complete tax neutrality among the four power-trains, which allows cleancomparison of technologies, but may not be realistic where practical policy is concerned.Gasoline is heavily taxed throughout the EU and various green incentives are in place(see page 43).Financial support for car manufacturers could be provided through tuning the tax regime. Forthe period to 2020, more explicit per-vehicle subsidies could also be applied. In the case ofinfrastructure support, some form of underwriting or sharing by government of investment riskmay be more appropriate – the issue being not so much the cost of building the infrastructure asthe risk that the market does not develop, leaving the infrastructure a stranded asset.It is possible that governments could elect not only to provide the “carrot” of support to both carsmanufacturers and infrastructure providers, but also the “stick” of legislation. Legislation wouldneed to be credible and may present the risk of unstable outcomes that could leave the first-mover problem only partly resolved; however, it could have a role.
50
2020-2030: a cumulative economic gap in the order of €75 billion due to increasingcar volumesIf a core infrastructure is in place by 2020, even if it were regional, with a critical mass of FCEVson the road, there could be a much greater willingness to invest and more scope for finely tunedlegislative measures and tax incentives. However, as 2020 approaches, it will become clearerwhether target numbers and costs are being reached – and whether 1 million vehicles is indeedthe critical number to achieve momentum. At this stage, it seems possible that any governmentsupport needed during this period could be provided through tax and regulatory systems,without special measures or subsidies.Beyond 2030: any potential remaining economic gap per vehicle is expected to be smalland carried by the consumerAfter 2030, it can be assumed that the majority of the consumers will be financially driven, makingtheir choice of car in response to an established tax and legislative regime. Provided these arestable and clear, car manufacturers, hydrogen manufacturers and infrastructure providers shouldall be able to make investments on the basis of well-understood risks and projected returns.a. FCEVs face a cumulative economic gap of €25 billion (cars + infrastructure) up to 2020∆TCOFCEV-ICEper vehicle1‘000 EUREconomic gapEUR billions per year1510502020203020402050-520102020203020402050
200150100500-502010
TCO delta is< EUR 3,0001
FCEV new salesmillion FCEVs per year
Economic gapEUR billions cumulative2502001501005002010
5432102010
Gap until2030 is ~EUR 100 bn2020203020402050
2020
2030
2040
2050
1 Weighted by segments (7% in A/B segments, 39% in C/D/E segments and 54% in J/M segments)SOURCE: Study analysis
Exhibit 39: The cost of shifting from ICEs to FCEVs may amount to €4-5 billion per year forEurope (€500 per new car), with the economic gap beginning to close after 2030Up to 2020, FCEVs face a cumulative economic gap (cars + infrastructure) of €25 billion (mainlydue to a higher purchase price) and an additional €75 billion up to 2030.The TCO of FCEVs vs. ICEs falls dramatically by 2020 and is competitive with ICEs by 2030 formedium/larger cars, at which point it is anticipated that the economic gap per vehicle may bepassed on to the consumer. However, the economic gap continues to rise due to increased sales.
The role of Battery Electric Vehicles, Plug-in Hybrids and Fuel Cell Electric VehiclesResults
51
∆TCOBEV-ICEper vehicle1‘000 EUR60504030201002010
Economic gapEUR billions per year15105
2020
2030
2040
2050
0
BEV new salesmillion vehicles per year
Economic gapEUR billions cumulative50040030020010002010
8642020102020203020402050
2020
2030
2040
2050
1 Weighted by segments (53% in A/B segments, 43% in C/D/E segments, and 5% in J/M segments)SOURCE: Study analysis
Exhibit 40: BEVs could face a cumulative economic gap of €80 billion by 2020, €500 billionby 2050In total, a cumulative economic gap of €80 billion exists for BEVs by 2020 and €500 billion by2050. (For an analysis of the economic gap for PHEVs,see Annex, Exhibit 57, page 61.)Owing to their modular nature,5electrical infrastructures are easier to build up, but after 2020,infrastructure costs for FCEVs are less than those for BEVs as the number of public chargingstations remains commensurate with the number of cars, due to the lengthy recharging time. Incontrast, once the territory is covered, no further investment is needed in hydrogen infrastructure– regardless of the number of cars – due to the fast refuelling time. By 2030, infrastructure forBEVs therefore costs 1.5 - 2.5 cents per kilometre, compared to 1.5 cents per kilometre for FCEVs.
5
The study assumes 50% home charging (75% for PHEVs), 50% public charging, with two socketsserving two cars per public charging station, i.e. four cars
52
NEXT STEPSIn April 2010, the European Commission confirmed that “Green vehicles, including those capableof using electricity, hydrogen, biogas and liquid biofuels in high blends, are likely to contributesignificantly to the Europe 2020 priorities of...promoting a more resource efficient, greener andmore competitive economy”.1This echoed the call of the European Parliament in 2007 to “institutehydrogen fuel cell storage technology, and other storage technologies, for portable, stationaryand transport uses and establish a decentralised bottom-up hydrogen infrastructure by 2025 inall EU Member States”.
Urgent action is required for passenger cars to achieve EU CO2reduction goalPlans for the market launch of electric vehicles should therefore be initiated jointly by carmanufacturers, equipment manufacturers and infrastructure providers. In the short term, CO2emissions will have to be reduced by more efficient ICEs and PHEVs, combined with biofuels.But investment cycles in energy infrastructure are long and for BEVs and FCEVs to achieve theeconomies of scale necessary to meet the EU’s CO2reduction goal, action must be taken as apriority. Implementation plans for BEVs and PHEVs are described in other reports, therefore thisreport focuses on FCEVs.a. Prepare EU market launch plan study for FCEVs and hydrogen infrastructureThis study presents a first step towards a wider, co-ordinated EU roll-out plan study for FCEVsand hydrogen infrastructure. With all technological hurdles resolved and thousands of hours oftesting in a customer environment, industry is clearly ready – as demonstrated by the Letter ofunderstanding issued by car manufacturers in 2009(see page 13)and the global consortium ofstakeholders who have been prepared to share confidential data for the express purposes of thisstudy. The next logical step is to develop a comprehensive and co-ordinated EU market launchplan study (Exhibit 41). This consists of two phases:1. An in-depth business case and implementation plan for a single Member State (i.e. Germany),starting in 2015. At the same time, a series of FCEV demonstration projects should also start inother Member States in order to gain experience with the technology.2. A staged roll-out plan study – first, a market introduction in Member States that havedeveloped experience through the demonstration projects above, followed by otherMember States.The above single Member State implementation plan should be fit for investment by companiesand the public sector. This includes addressing the risks associated with the plan, how hydrogenwill be decarbonised and its impact on future CO2emissions from the transport sector.As this study indicates, there is a first-mover disadvantage for retail investors.However, ifseveral hydrogen retail infrastructure providers invest (e.g. via a consortium), or a market-based mechanism is developed to spread the risk between different infrastructureproviders, none will gain a “free ride”. The market launch plan must therefore go hand-in-hand with clear government incentive mechanisms to offset this risk, or the launch will nothappen.After the technology has been de-risked and achieved cost reductions in one Member State –with a series of small, subsidised demonstration projects taking place in parallel in other MemberStates – a staged EU roll-out plan study is required, with market introductions in those MemberStates that have gained experience through the earlier demonstrations.1COM(2010)186: A European strategy on clean and energy efficient vehicles
The role of Battery Electric Vehicles, Plug-in Hybrids and Fuel Cell Electric VehiclesNext steps
53
(Staging the roll-out will address the supply limitations of car manufacturers and hydrogeninfrastructure providers who cannot undertake market introductions in all Member States atthe same time.) Market introductions and hydrogen supply infrastructure build-up should alsotake into account the preferred primary energy resources of different Member States and CO2reduction goals for the transport sector as a whole.FCEV demonstration projects in other Member States are likely to start in 2015. These shouldideally benefit from the learnings in Germany. Starting too early could result in a 50% higherinvestment for the same volume of cars, e.g. for a country such as Belgium a FCEV demonstrationproject comprising 100 vehicles and four stations in 2011 would cost €30 million now, versus €12-13 million if implemented after the German launch (the cost of FCEVs will have reduced by a factorof four to five and retail stations by a factor of two).Jan 2010“A portfolio of power-trains for Europe:a fact-based analysis”6 monthsDeliverableJune 2010Q2 2011Q2 2011Q4 2011
Develop Member Statebusiness case forFCEVs9-12 months
Evaluation
Formulate EUroll-out plan4-6 months
▪Fact-based study on the
economics, sustainability,and performance of BEVs,FCEVS, PHEVS, and ICES,across the value chain
▪Joint business plan for roll-out▪▪in a Member State1(i.e. Germany)Incentive schemes & policyadviceJoint Implementation set-up
▪Share learnings from▪
▪Stakeholdersinvolved
business planning for a singleMember State (i.e. Germany)with other Member StatesDevelop a staged roll-out planper interested Member State,taking into account FCEV& equipment supplyconstraintsDecarbonisation plan forHydrogen production
▪Car OEMs▪Oil and gas companies▪Utilities▪Industrial gas companies▪Equipment car manufacturers▪Electrolyser companies▪Wind companies▪NGOs▪Governmental organizations
▪Car OEMs▪Hydrogen infrastructure▪providers (investors)Government (NOWorganization)
▪Fuel Cell and Hydrogen Joint▪Interested Member States▪NGOs▪IndustryUndertaking
1 Roll-out in a single member State will be complemented by a series of demonstration projects in other Member States
Exhibit 41: Market launch plan for FCEVs in Europeb. Co-ordinate roll-out of BEVs/PHEVs and battery charging infrastructureA similar action would be helpful to support the roll-out of BEVs and PHEVs in the EU. Here, too,the risk of market failure exists, but as investment per electric recharging point is low in non-publicapplications, so is the financial risk for infrastructure providers in such cases. However, as withhydrogen infrastructure, upfront investment for public charging will be necessary in order to givecustomers appropriate access to infrastructure from the start.In order to achieve a sound market introduction, the technology also needs to be commerciallyde-risked and several programmes for BEVs already exist in various European countries andat EU level,2addressing issues such as technology, market introduction, funding schemesand standardisation etc. A coherent approach to all these activities would help to optimisedevelopment and support early market readiness.
2
European Green Car Initiative
54
ANNEXValue set by study participants
Value chainFC stackH2tankFC peripheryEV-specific parts4BatteryICE related parts5Tech. packages6ICE parts“Glider”DSMRCSMRWEIGCC/CGCCSDelivery TrucksPipelineLiq./Comp.Retail stations
LearningRate1Percent151515107N/AN/AN/AN/A657371113
AnnualImprove2Percent2.232.232.272.371.51.51.5000.080.10.40.10.70.10.20.10.6
ExampleTechnologiesSolar PVWindSolar ThermalEthanolLNG
LearningRate1Percent221591513
AnnualImprove2Percent107764
Vehicle
Supply3
Higher learning ratesare observed in othernew technologies
1 Percent cost reduction with every doubling of accumulated installed capacity3 Annual improvement from 2020-2050 from applied learning rate5 ICE, generator, fuel tank, exhaust7 Annual improvement rate is 4% and 1.5% from 2020-2030 and after 2030 respectively
2 Annual reduction in cost4 electric motor, transmission, inverter, wiring, controls6 Includes power-train and non-power-train efficiency packages8 No capacity added after 2020, resulting in no annual improvement
SOURCE: Worldwatch Institute; IEA; BTM Consult; ABS; NREL; IIIEE; ABI; Drewry 2007; UC Berkeley ERG
Exhibit 42: Projected cost reductions of FCEVs and hydrogen supply are lower than historicalimprovements for comparable technologiesEfficiency, PercentPrimary energycarrierFuel productionGasolineDieselPowerPowerH2H2CNGDiesel1PowerPowerH2H2Gasoline1Diesel1PowerPowerH2H2EthanolBiodieselPowerPowerH2H2PowerPowerH2PowerPowerH286%84%51%34%51%94%63%58%39%70%40%40%50%34%41%35%35%35%24%31%100%68%28%19%DistributionDistributionDistributionDistributionDistributionDistributionDistributionDistributionDistributionDistributionDistributionDistributionDistributionDistributionDistributionDistributionDistributionDistributionDistributionDistributionDistributionDistributionDistributionDistributionDistribution98%98%90%89%89%93%98%90%89%89%98%98%90%89%89%98%98%90%89%89%90%89%90%89%RetailRetailRetailRetailRetailRetailRetailRetailRetailRetailRetailRetailRetailRetailRetailRetailRetailRetailRetail99%99%90%90%90%99%90%90%99%99%90%90%99%99%90%90%90%90%VehicleICEICEBEVFCEVFCEVICEICEBEVFCEVFCEVICEICEBEVFCEVFCEVICEICEBEVFCEVFCEVBEVFCEVBEVFCEV30%35%68%56%56%30%35%68%56%56%30%35%68%56%56%30%35%68%56%56%68%56%68%56%8%17%
Common production pathways
2020
Well-to-wheel efficiency25%29%31%15%23%24%21%35%18%31%12%14%30%15%18%10%12%21%11%14%61%30%
Oil
Primary sourcesPower
Gas
Coal
Biomass
RenewablepowerUranium
1 Gasoline and diesel production through Fischer-Tropsch processSOURCE: CONCAWE-EUCAR JEC-WTW study; study analysis
Exhibit 43: FCEV well-to-wheel efficiency is competitive with ICE, with a flexible use offeedstocks, while BEV remains the most efficient power-train
The role of Battery Electric Vehicles, Plug-in Hybrids and Fuel Cell Electric VehiclesAnnex
55
Fuel cell system cost, EUR/kW3,0001,5001,0005000Coalition 2010Ballard 1995Balllard/OEMs 2000US DoE 2006HyWays 2007US DoE 2009
1995Ballard, 1995
2000
2005US DoE, 2006
2010
2015
2020
Ballard/OEMs, 2000reductionby 2005
Basis of promiseSize/timing ofFC marketData sourcesShare of car OEMscommitting1"Showstoppers"resolved and majorbreakthroughs
▪Technical advance-
ments, mass production
▪Mass production, catalyst▪Higher yields, mass▪100,000 vehicles▪Ballard Power Systems,Daimler, Fordby 2020
production, reduced BOP
▪USD 4 billion in 2000,▪10-50 billion in 2010▪Ballard Power Systems,Daimler
▪Mass FCEV production▪US Department of Energy▪~75%▪Catalyst loading reduction,standardized modulardesign, improved MEAfabricationStudy fuel cell costestimates are moreconservative thanprevious estimatesand are in line withmost recent reports
▪~40%▪Sufficient fuel cell powerdensity for automotiveuse
▪~70%▪Advances in materialstechnology (includingplatinum reduction), imp-roved manufacturability
1 Combined light duty passenger vehicle market share of OEMs committing to fuel cell and/or FCEV researchSOURCE: Press search, OICA, US Department of Energy, study analysis
Exhibit 44: Summary of previous studies which were not based on proprietary industry data
C/D SEGMENT
Total Cost of Ownership (TCO1)‘000 EUR5%FCEV World
FCEVBEV
PHEVICE - gasolineICE - diesel
50403020100
50% FCEV World
4439 373732 3336 3532 333434 34 32 3333
32 33 32 33
2020
2030
2040
2050
1 Based on 15 years vehicle lifetime, 12,000 km annual driving distance, no tax (e.g., fuel excise, VAT)SOURCE: Study analysis
Exhibit 45: The different “world” scenarios for the penetration of FCEVs in the EU – 5%,25% and 50% – do not alter the business case dramatically
56
ILLUSTRATIVEParts costEUR/vehicleAssuming completedepreciation overvehicle lifetimePurchase priceEUR/vehicleAssembly costEUR/vehicleSG&AEUR/vehicleMarginEUR/vehicleTaxesEUR/vehicleTotal cost ofownershipEUR/vehicleFCEV-specific partscost (other than FC)EUR/vehicleSales taxEUR/vehicleCO2taxEUR/vehicleSubsidyEUR/vehicleICE-specific partsEUR/vehicleMaintenancecostEUR/vehicleFuel cellEUR/vehicleOther FCEV partsEUR/vehicleHydrogen costEUR/kmFuel costEUR/vehicleVehicle lifetimeyearsTravelled distancekm/yearConventional partscostEUR/vehicleFuel cell cost1EUR/vehicle
Not included in base caseFuel cell powerkW/vehicleCost per kWEUR/kWFC periphery costEUR/vehicleFC battery costEUR/vehicleH2tank costEUR/vehicleEV-specific partscostEUR/vehicle
Assumptions pre-definedwith study participants
Time value of money(discounted cash flow)consideredfor infrastructure(7% WACC), not for vehiclepurchase price
Running costEUR/vehicle
HydrogenconsumptionkgH2/kmHydrogen priceEUR/kg
Input fromsupply model
1 If fuel cell lifetime is less than average vehicle lifetime (mileage), a replacement fuel cell(s) will be required.The cost of the replacement fuel cell(s) will be included in the vehicle purchase price.2 TCO based on 15 years lifetime and 12,000 km annual driving distanceSOURCE: Study analysis
Exhibit 46: An example of a TCO calculation for FCEVs
In percentage of production100CoalConventional10015100101015Gas and oilconventional29
0
0
0
0
1005510
0
0Coal CCS (incl. retrofits)
19
Gas CCSNuclear
20
16
Wind Onshore
018
0
30
1010
16
Wind Offshore
1892438
Solar PV
918
1258
512
Solar CSPBiomass dedicatedGeothermalLarge Hydro
2012
1
212
212
212
Baseline
40% RES /30% nuclear/ 30% CCS
60% RES /20% nuclear/ 20% CCS
80% RES /10% nuclear/ 10% CCS
SOURCE: Imperial College; KEMA analysis; study analysis
Exhibit 47: An EU 2050 production mix of 60% RES was assumed
The role of Battery Electric Vehicles, Plug-in Hybrids and Fuel Cell Electric VehiclesAnnex
57
ILLUSTRATIVEReferencevehiclePower-trainsICE -gasolineSmall(A/B)UsereconomicsICE -dieselEvaluationcriteriaTotal cost ofownershipPurchasepriceRunningcostPayoff timeT ota l cost ofo w ner shipE UR /vehicle
E 1Fu el C ell V ehicle – Use r e con om icsD ata and i mprov em en t ra tetak en f rom IC E inpu t dataPar ts cos tEUR /v ehic leA ss um ing c ompletede pre ciation ove rv ehicle lifetim eP ur cha se pric eE UR /vehicleAs sem bly co stEUR /v ehic leSG & AEUR /v ehic leM arginEUR /v ehic leTaxe sEUR /v ehic leF CEV -spec ific p artscost (o ther tha n FC )E UR /veh ic leS ales taxE UR /v ehic leC O2taxEU R /vehicleSub sid yEU R /vehicleIC E -s pe cif ic p art sE UR /veh ic leM aintenan ce co stEUR /v ehic leF uel ce llE UR /veh ic leO the r F CEV par t sE UR /veh ic leR un nin g costE UR /vehicleH yd r og en costE UR /k mTot al f uel c ostEUR /v ehic leV eh icle l ife ti mey ear sT ra velled d ist an cek m/ yearIC E -s pe cif ic p art scostE UR /veh ic le% p.a .F uel ce ll cost1E UR /veh ic leFu el ce ll po werk W /vehicl eCo st p er k WE U R/kWFC per iph ery c os tEU R/v ehi cleFC batte ry c os tE U R/veh ic leH2ta nk costE U R/veh ic le
In put data from coalitionAssum ption orcalc ulated value
Learning rate (% pe r do ublingof cum ulative prod uction)S ensitivity pa rame ter
FC me m br ane costEU R/k W. .. %FC catalyst co stEU R/kW. .. %FC str uc tur ecos t E UR /kW.. . %Battery p ow erkW /v ehicleCo st pe r kWEU R/k W.. . %. .. %
. .. %
E V-sp ecific par ts costE U R/veh ic le.. . %M aint enanc e as % ofIC E -spec if ic parts cos tM aint enanc e as % ofFC c os tM aint enanc e as % ofo ther FC EV p arts c os tH ydro gen co nsum ptionk gH2/km.. . %Hydr o ge n pr iceAv eraged o ver l ifeti meEU R/k gFr om h yd rog ens upply m odel
Hydro ge n cos tEU R/k g
... %
H ydr ogen t ax ( incl.CO2tax )E U R/k gMar gi n on h yd rog enEU R/k g
E 3F C E V – E n e rg y e ffic ie n c y
Input d ata from c oalitionP ro du ct io n eff icien cy S M RPro d u ctio n e fficien cy Electro ly sis%P%du ctio n eff icien cy B io m ass G as.roPro d u ctio n effi cien cy Co al g asifi catio n%P%u c tion effic ien cy IG C CrodPro d u ctio n ef fic ien cy SM R / C C S%P%u ctio n efficie n cy Co al G a s. / CC SrodP%d uct io n ef ficien c y IG C C / CC Sro%A ss um ption or calc ula tedv alueL earning rate ( % per doub lingo f cum ulativ e pr oduction)H2p rod u ctio nKW h H2/y ear... %S ens itivity param eter
ProductionMedium(C/D)Overallsustain-ability1OperationEnd-of-life
S um pro du ct toobtain w eighte dav erageW eig h ted avera g eH2p ro d uct io neff icie n cy%
Sx
F eed sto ckco n sum p tio nKW hfee d/year... %
S um pro du ct toobtain w eighte dav erageW eig h ted avera g eH2d is tribu tioneff icie n cy%F C EV ef fic ien cy%S um pro du ct toobtain w eighte dav erageW eig h ted avera g eH2ret a il e fficien c y%H2t ank eff icien cy%. .. %H2f ue l celleff icie n cy%
S hare o f to tal p er p ro d uct io n m eth od%D istrib ut io n ef fic ien cy p ip elin eE UR/kg H2D ist rib u tio n effic ien cy L iq u id truc k
PHEV
Sx
EUR/k gH2Distrib u ti on efficie n cy G as tru ckNEUd istrib u tion effic ienc y (o n site p ro d .)oR/k gH2kg CO2/kgH2
Sh are o f t ot al p er d istrib u tion m eth o d%Retail ef ficien cy 3 50 b arRE UR/kgH2ien c y 70 0 b aretail effick g C O2/kgH2S h are o f to tal p er re tail m et ho d%E fficie nc y ...%E fficie nc y ...%E fficie nc y ...%
Sx
. .. %
Bat tery e fficien c y%. .. %E lec tric p o w ertraineff icie n cy. .. %%
BEV
…Perfor-mance………
SUV(J)
FCEV
▪▪▪▪▪▪▪
Fuel economy (EUR/km or unit of fuel/km)Range (km)Acceleration: 0-100 km/h (sec)Cargo volume (liter)Service interval (km or months)Refueling time (min.)Hot and cold weather performance
1 Sustainability focuses on the operation (running period) of the vehicle, not emissions for vehicle production or end-of-lifeSOURCE: Study analysis
Exhibit 48: The basic structure of the vehicle model used for the study
Percent
Max utilization set at 80%
8065
80
80
80
4034282121
45
2010
11
12
13
14
15
16
17
18
19
2020
SOURCE: Study analysis
Exhibit 49: Average utilisation rate of hydrogen refuelling stations
58
Natural gasCoal
BiomassOil
DieselGasoline
Energy cost assumptions excluding taxFeedstock pricesEUR/MWh
Rationale
100908070605040302010020102020203020402050Natural gas, oil, coal andbiomass prices until 2030 basedon IEA World Energy Outlook,2009. After 2030 flat pricedevelopment is assumedGasoline and diesel prices linkedto the cost of oil (delivered atpump, without taxes/excises)
SOURCE: IEA WEO 2009; Working team diesel/gasoline regression analysis on Germany. Study estimates after 2030
Exhibit 50: Feedstock price assumptions up to 2050 and corresponding gasoline anddiesel prices (version 1)Gasoline/diesel delivered at pump, w/o taxes/excisesOilDieselGasolineNatural gasCoalBiomass
Energy cost assumptions excluding taxOil$ / bbl16014012010080604020020100,2020500,80,60,4Diesel and GasolineEUR / liter1,21,0Coal and Biomass$ / tonneNatural gas$ / MMBtu
120110100908070605040302010
30252015105
2020
2030
2040
002010 2015 2020 2025 2030 2035 2040 2045 2050
1 Oil, coal, biomass and natural gas prices until 2030 based on IEA World Energy Outlook 2009. After 2030 flat price development is assumed2 Gasoline and diesel prices linked to the cost of oilSOURCE: IEA WEO 2009; McKinsey diesel/gasoline regression analysis
Exhibit 51: Feedstock price assumptions up to 2050 and corresponding gasoline and dieselprices (version 2)
The role of Battery Electric Vehicles, Plug-in Hybrids and Fuel Cell Electric VehiclesAnnex
59
Average of different pathways with varying RES shareRetail & commercialIndustrial shedableWholesale peakWholesale off-peak
Power pricesEUR/MWh
Commercial shedableIndustrial
14013012011010090807060504030201002010
2015
2020
2025
2030
2035
2040
2045
2050
SOURCE: EEX power spot price; “Roadmap 2050” study by the European Climate Foundation; Global Insight; study data
Exhibit 52: Power price assumptions for electrolysis production scenario
Unit of measure
C/D SEGMENTICE gasolineICE dieselPHEV2FCEVBEVEU plannedregulation
Average carbon footprint1g CO2/km20017515012510075502502010EU 2010 electric mix4
Planned EU regulations will reduce fleetemissions to 95 g CO2/km (TTW) in 2020,equivalent to 113 g CO2/km (WTW)
CCS deployed with H2production andincreasing share of renewable energyFully decarbonised electricity3
2020
2030
2040
2050
1 NEDC efficiency assumed2 PHEV assumed to drive all electric for 77.5% of its total driving distance3 EU2050 electricity assumes 80% renewable, 10% nuclear and 10% fossil with CCS generation4 EU mix in 2010 contains 22% gas, 29% coal, 27% nuclear, 4% biomass, 16% renewable and 2% oilSOURCE: Study analysis
Exhibit 53: In the long run, BEVs and FCEVs have the greatest potential to reduceCO2emissions
60
EUR/kW
ALL SEGMENTS FCEV
Fuel cell stack costEUR/kW800600400
781
500252
2000
221
110422015~100,000
2010FCEV units (installedcumulative capacity)~1,000
9843162020~1,000,000
SOURCE: Study data
Exhibit 54: The cost of the fuel cell stack, based on data submitted by participating carmanufacturers and suppliersEUR/kWh
Battery costEUR/kWh1.500
1,500
1.000
8715003750
750457275
450300230
2010
2015
2020
SOURCE: Study data
Exhibit 55: The cost of the battery, based on data submitted by participating car manufactu-rers and suppliers
The role of Battery Electric Vehicles, Plug-in Hybrids and Fuel Cell Electric VehiclesAnnex
61
ILLUSTRATIVE, OUTSIDE-INC/D SEGMENT, 2020
Range at constantkm
speed1ICE dieselICE gasolineFCEVBEV3
2.4002.2002.0001.8001.6001.4001.2001.0008006004002000020406080100120140160180Rapid chargingand/or swappingstations not assumed
Range on NEDC2km2,4002,2002,0001,8001,6001,4001,2001,000800600400200
1 Range at constant speed estimated for NEDC conditions, scaled to study average for C/D segment2 C/D segment car with 29.7 kWh battery and 77% state of charge due to not fully charging and de-chargingthe battery for lifetime and performance reasons. Range on NEDC based on study data, assuming tanksize and battery capacity stay constant ; range on NEDC is relatively better for FCEV and BEV, due to higher efficiency in transient driving3 C/D segment BEV only allows 150 km trip at 120 km/hrSOURCE: Study analysis
0200 220Cruising speedkm/h
Exhibit 56: FCEVs have sufficient range at higher cruising speed, while BEVsare restricted on range
∆TCOPHEV-ICEper vehicle1‘000 EUR60504030201002010
Economic gapEUR billions per year15105
2020
2030
2040
2050
0
PHEV new salesmillion vehicles per year
Economic gapEUR billions cumulative50040030020010002010
8642020102020203020402050
2020
2030
2040
2050
1 Weighted by segments (25% in A/B segments, 42% in C/D/E segments, and 33% in J/M segments)SOURCE: Study analysis
Exhibit 57: PHEVs face an economic gap of €420 billion by 2050
62
GLOSSARY350/750 bar4x4BBLBEVCCSCGCNGCO2CO2eCSMRCWEDSMRDWEECE-15EUEU27EU29ECE-15EUDCEVFCFCEVGDLGHGGtH2HEVICEIEAIGCCISOPressure levels for hydrogen storage tanksFour-wheel driveBarrels of oilBattery Electric VehicleCO2Capture and StorageCoal GasificationCompressed Natural GasCarbon DioxideCarbon Dioxide EquivalentsCentral Steam Methane ReformingCentral Water ElectrolysisDistributed Steam Methane ReformingDistributed Water ElectrolysisThe United Nations Economic Commission for Europe specificationfor urban driving cycle simulationEuropean UnionEuropean Union Member StatesEuropean Union Member States + Norway and SwitzerlandThe United Nations Economic Commission for Europe specificationfor urban driving cycle simulationExtra Urban Driving Cycle – specification for European urban drivingcycle simulationElectric VehicleFuel CellFuel Cell Electric VehicleGas Diffusion LayerGreenhouse GasGiga (billion) tonnesHydrogenHybrid Electric VehicleInternal Combustion EngineInternational Energy AgencyIntegrated Gasification Combined CycleInternational Organization for Standardization
The role of Battery Electric Vehicles, Plug-in Hybrids and Fuel Cell Electric VehiclesGlossary
63
kgkmmMEAMWhMPVMJMtNEDCNGOOEMp.a.PEMPDCPHEVPPMR&DRESRTDSAESegment (A/B)Segment (C/D)Segment (J)SG&ASMRSUVTCOTWhVATWACCWEWTW
KilogrammeKilometreMillionMembrane Electrode AssemblyMegawatt HourMulti-purpose vehicleMegajouleMega (million) tonneNew European Driving CycleNon-governmental organisationOriginal equipment manufacturerPer annumProton Exchange MembranePer doubling of capacityPlug-in Hybrid Electric VehicleParts per millionResearch and DevelopmentRenewable energy sourcesResearch and Technology DevelopmentSociety of Automotive Engineers (SAE International)Small-size cars(see page 16)Medium-size cars(see page 16)Larger 4 x 4 SUV-type cars(see page 16)Selling, General and Administrative ExpensesSteam Methane ReformingSports Utility VehicleTotal cost of ownershipTerawatt HourValue Added TaxWeighted Average Cost of CapitalWater ElectrolysisWell-to-wheel
For questions:www.zeroemissionvehicles.euinfo@zeroemissionvehicles.euAtt: Ms Alexandra Reis+32 2 54 087 75