Trafikudvalget 2009-10
TRU Alm.del
Offentligt
post10
Ministry of Transport and Energy
Estimation of Revenues and Costs of differentScenarios of a HGV Charging System inDenmark
Final Report1.002.06.2006Report-Nr. 01 / MR/RYe/PMR
I-2
MTE_Denmark v1.0_final_02jun2006.doc
RappTrans
I-1
Table of Contents
Executive Summary12IntroductionApproach and MethodologyThe study has been conducted in 3 steps.Step 1: Scenario descriptionStep 2: Estimation of costs and revenues of the ScenariosStep 3: Evaluation of the Scenarios3High Level Description of the Scenarios3.1General3.1.13.1.23.1.33.1.4
113131313131314
3.2
3.3
Assumptions pertaining to all Scenarios17Legal status of the charge is a tax.17Vehicles subject to charge are HGV above 12 tonnes.18Tariff is modulated regarding the emission class.18Basically, the EFC system should able to differentiate in a further step regardingto the area/network or time of day183.1.5The charge depends on the number of axles in scenario 1A and B and on theregistered maximum permissible weight in scenario 2A and B183.1.6The scheme has to be compliant with NORITS (NORdic interoperable TollingSystem)193.1.7The scheme has to be EETS compliant.193.1.8The On Board Equipment (OBE) is mandatory.193.1.9It has to be a free-flow multi-lane tolling system.203.1.10 The central account is the master and comes with the only confirmed balance. 213.1.11 An anonymous use of the system is not possible.213.1.12 The driver and the vehicle holder share the liability regarding the HGV charge. 213.1.13 At the time of registration declared vehicle data are verified.213.1.14 The enforcement strategy will be based on a assessment of fraud.213.1.15 The OBE is in the ownership of the EFC operator.22Scenario Group 1: Charging of a Defined Road Network223.2.1Scenario 1A: Network Charging Using the GNSS/Cellular Network Technology 233.2.2Network Charging Using the DSRC Technology25Scenario Group 2: Area Charging273.3.1Scenario 2A: Distance Based Area Charging283.3.2Scenario 2B: Time Based Area Charging313434343536373737
4
Volumetrics4.1Road Network4.1.1Network charging4.1.2Area charging4.1.3Summary of network lengthsVehicle stock4.2.1Danish vehicles4.2.2Foreign vehicles
4.2
MTE_Denmark v1.0_final_02jun2006.doc
RappTrans
I-2
4.3
Traffic performance4.3.1Traffic counts4.3.2Odometer data4.3.3Estimation of traffic performance4.3.4Summary of traffic performance
383838394041414143434445464747484848484950505151515252535354545657
5
Issues Related to the Definition of the Road Network5.15.25.3Case of existing charging schemesSegmenting a non-motorway networkEquipping a non-motorway network5.3.1Case of physical gantries5.3.2Case of virtual gantriesIdentifying the chargeable networkDetour trafficFurther issuesSummary
5.45.55.65.76
Revenues6.1Approach to Revenue Estimation6.1.1Philosophy6.1.2Method6.1.3Road infrastructure cost allocated to HGV traffic by the COWI reportCost allocation for tariff calculation6.2.1Restriction to HGV > 12 tons6.2.2Restriction to chargeable network (scenarios 1A and 1B)6.2.3Exclusion of other charges levied on the ground of external costs6.2.4Inclusion of costs of charging system6.2.5Tariff calculationLimitation of tariff to trunk network levelEffective charging revenue6.4.1Traffic evasion6.4.2Unpaid charges6.4.3Enforced charges and penaltiesRevenues
6.2
6.36.4
6.57Costs7.2
7.3
7.4
7.1.1AssumptionsCapital Investment (Tender and Implementation Phase)7.2.1Charging Services7.2.2Enforcement Services7.2.3Central ServicesOperating Costs (Operational Phase)7.3.1Charging Services7.3.2Enforcement Services7.3.3Central ServicesCost Sensitivities7.4.1Cost sensitivity of number of tolling segments7.4.2Cost sensitivity of the number of permanent enforcement stations
575859596060606161626263
MTE_Denmark v1.0_final_02jun2006.doc
RappTrans
I-3
7.4.38
Cost sensitivity of OBE leakage - Cost Effect of EETS
63666666666668686969
Evaluation of the Scenarios8.18.2Key Figures at a GlanceBenchmarks8.2.1Benchmark figures of the four scenarios8.2.2Comparison with foreign HGV Charging schemes8.2.3Benchmark costs8.2.4Benchmark revenuesRisksConclusions and recommendations
8.38.4
Version History
VersionNumber0.10.20.30.40.50.60.71.0
Date26.01.0609.02.0602.03.0620.03.0630.03.0624.04.0631.05.062.06.06
Summary of ChangesDefinition of the structure of the document, initial draftRevision after a Rapp internal short reviewRevision and compilation of the draftInclusion of cost and revenue estimationRevision and compilation of the draft after workshop with TEMFinal editing and quality assuranceIntegration of comments from MTE from 19 mayFinal Report
AuthorsRYe, PMRRYe, MRRYeRYe, PMR,MRRYe, PMR,MRRYe, MRMR
AuthorsDr. Matthias Rapp, Project ManagerRobert YenDr. Peter M. Rapp
MTE_Denmark v1.0_final_02jun2006.doc
RappTrans
I-4
Definitions and AbbreviationsANPRASECAPBOTCENCESARECITSClearingCNDSRCEETSEFCGNSSHGVLOBULPNLSVANORITSOBEOBUOperatorRSERUCS&BTENTOBUTSPUserVASVATAutomatic number plate readingAssociation Européenne des Concessionnaires d’Autoroutes etd’Ouvrages à peageBuild, operate, transferComité Europeen de NormalisationCommon EFC System for ASECAP Road Tolling European SystemCentral IT SystemSettlement – Payment from issuer to operator for services provided bythe operator used by issuer’s customersCellular Network (e.g. GSM)Dedicated Short range CommunicationEuropean Electronic Tolling ServiceElectronic Fee CollectionGeographical Navigation Satellite System (e.g. GPS, Galileo)Heavy Goods Vehicle"Light" On Board UnitLicense plate numberSwiss heavy vehicle fee "Leistungsabhängige Schwerverkehrsabgabe"NORdic Interoperable Tolling SystemOn Board EquipmentOn Board UnitThe of the tolling systemRoad Side EquipmentRoad User ChargingSund & Baelt ASTrans European NetworkOBU for time based area chargingTransport Service ProviderThe person and/or the entity having an agreement with an operatorfor using the RUC liable road network/areaValue Added ServicesValue Added Tax
MTE_Denmark v1.0_final_02jun2006.doc
RappTrans
1
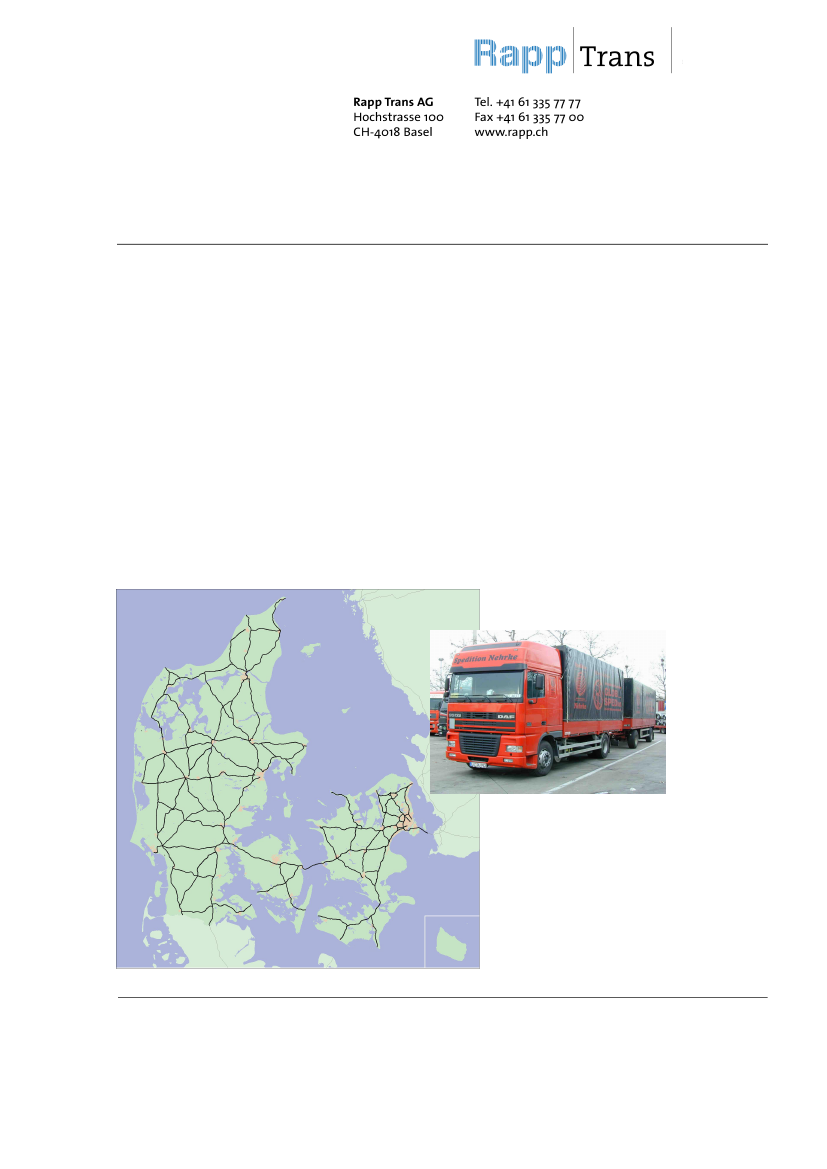
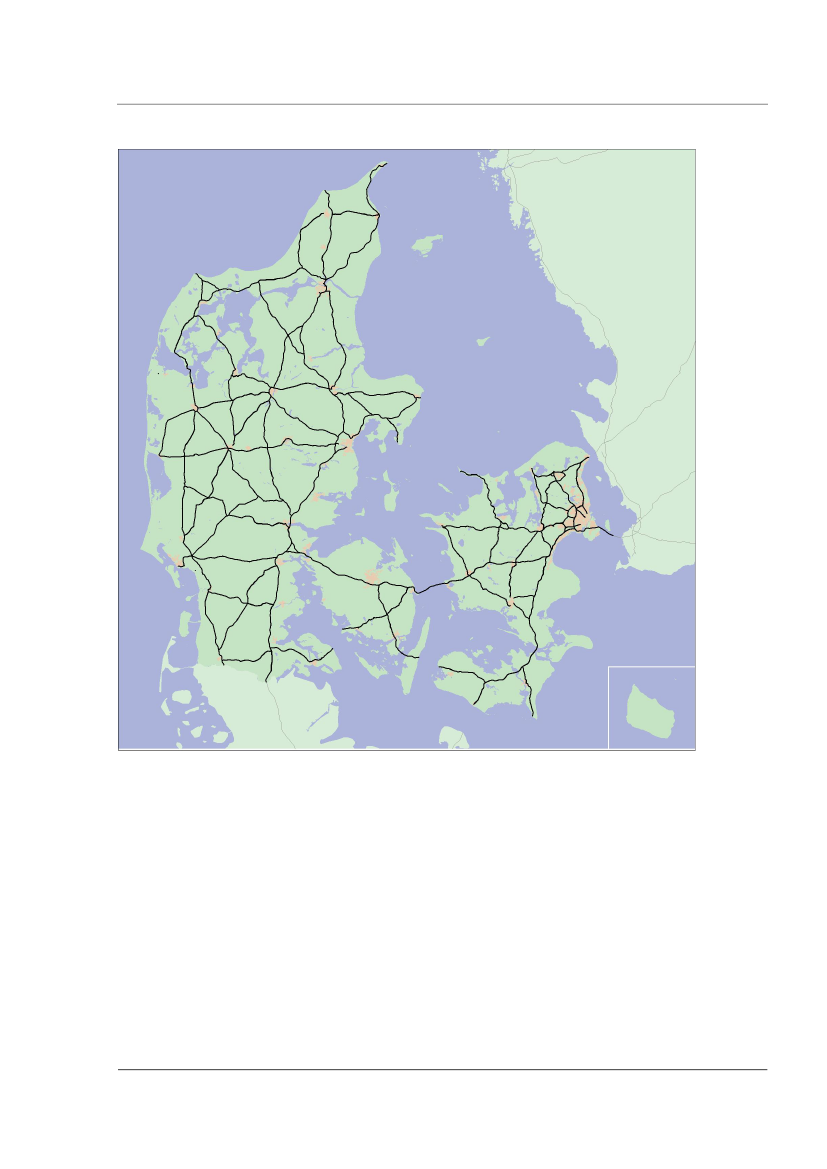
Executive SummaryThe Danish Ministry for Transport and Energy is investigating the possibilities of replacing theEurovignette with a distance based Heavy Goods Vehicle (HGV) charging scheme. Rapp Trans hasbeen assigned for estimating the financial effects on the costs and income of different EFC schemescorresponding to alternative charging scenarios. The work has been followed by an advisory groupwith representatives from the Ministry of Taxation, the Road Directorate and tolling experts fromSund&Bælt.The study has been conducted in 3 steps. In Step 1, four HGV charging scenarios have beendetermined and described based on the Client's task description. In Step 2, the financial estimateregarding the revenues and the infrastructural and operational costs of the scenarios was calculated inrelation to the traffic data and the defined tolling sections generated by the Danish Road Directorate.In Step 3, the scenarios have been evaluated and checked against benchmark figures from existingHGV charging schemes.4 Scenarios have been determined using two alternative technologies:Scenario Group 1: Network charging1A: Satellite positioning technology1B: Tag and beacon technologyScenario Group 2: Area charging2A: Distance charging based on Tachograph impulses2B: Charging based on driving time using motion sensorsScenario Group 1: Charging of a Defined Road NetworkHGV Charging on motorways and expressways can be done distance related or time based (i.e. daypass, monthly or yearly permit). This study only focuses on distance related network charging. It ispossible to execute distance charging by several available technologies.The road network should include :Roads with significant presence of HGV trafficRoads which offer alternatives to present itineraries if the present itineraries were subject tochargeRoads with important foreign HGV trafficRoads which connect the parts of the countryRoads which are a functional part of the international road network (European road namingscheme, Trans-European Road Network)Roads which complete the network to a whole connected entity.
MTE_Denmark v1.0_final_02jun2006.doc
RappTrans
2
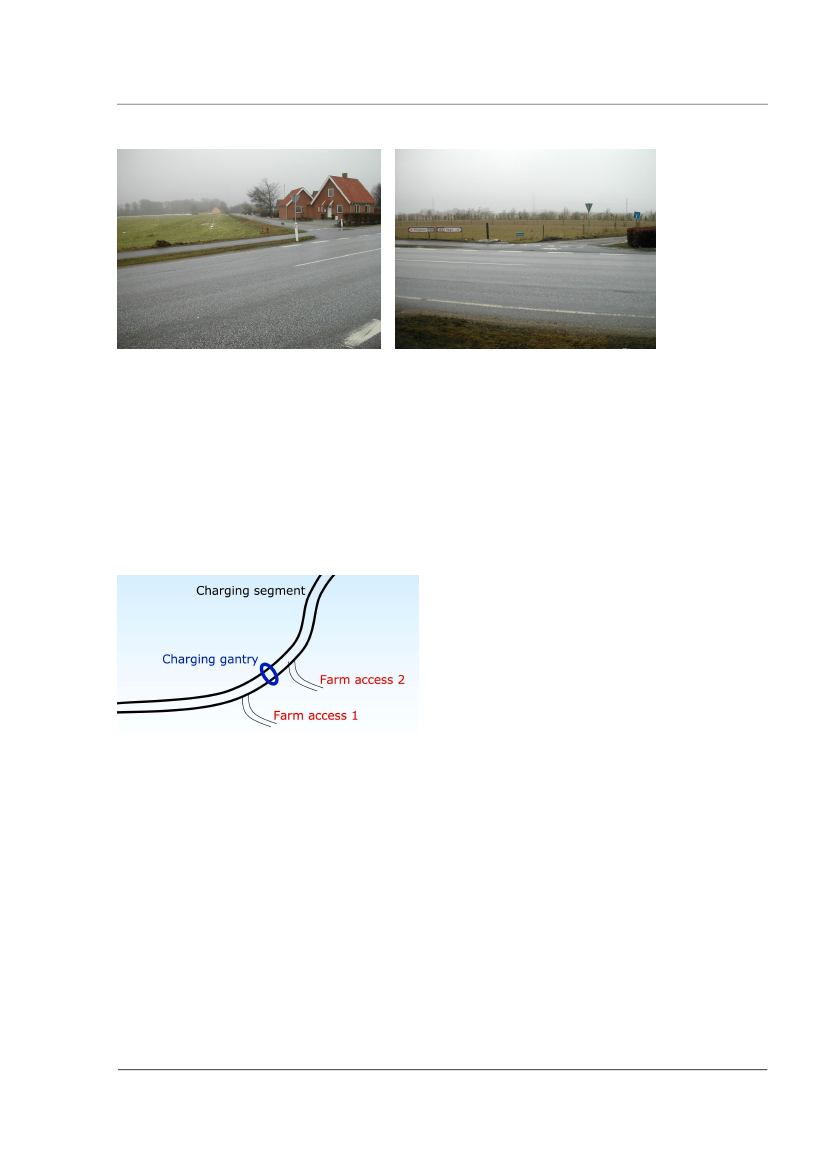
The Road Directorate, RD, is responsible for 985 km of motorways and Sund & Bælt for the 7 km longØresundsmotorway i.e. in total 992 km motorways. For the relevant road network approx. 2,500 kmof non-motorways are included, adding to a total of 3,500 km. The Greatbelt and Øresund links arenot a part of the relevant road network, since these links are already subject to fee collection.The inclusion of other roads than motorways into the network charging scenarios raises delicate issueswhich do not have proven solutions to this day, and which imply important reservations on theirfeasibility:Dividing a non-motorway network into chargeable segmentsPositioning of physical gantries on non-motorway network segmentsIdentification of the chargeable network by the userAvoiding detour traffic.
Scenario 1A: Network Charging Using the GNSS/Cellular Network TechnologyOne approved technology for network tolling is GNSS/CN. It uses two technologies adapted from otherapplications; namely, GNSS (Global Navigation Satellite System), whose satellites enable suitablyequipped vehicles to calculate their location accurately; and a two-way communication link (e.g.GSM/GPRS) based upon cellular telephone network. According to the position, the system recognises ifthe vehicle is driving on a toll road. In contrast to DSRC based systems GNSS/CN systems needpractically no roadside infrastructure. Due to the several limitation by using GNSS only (no GNSSsignal by shadowing effects, temporary system turn-off, etc.) the OBU is connected to or equipped byother sensors for localisation and distance measurement (tachograph, wheel sensors, gyrocompass,etc.).Two main designs of the overall system are technically possible. The one approach uses a high-endGNSS/CN OBU (so called “fat client”) which means all the intelligence for a single fee calculation isinside the OBU. This OBU transmits complete fee transaction data to a central system where they arecumulated and further processed for billing.This technology is operated by Toll Collect in the GermanLKW-Maut System. The other approach is a low-end GNSS/CN OBU (so called “thin client”). This OBUcollects only position data (GNSS position and time plus potential other sensors) and sends this to acentral IT system. Based on the position data received from the OBU the central system calculates thededicated fee. The map matching process and the tariff management run in the central system. Theinvestment and operating costs are much lower. This technology has been proposed by bidders in theUK Lorry Road User Charging project. Scenario 1A is based on the thin client architecture.Scenario 1B: Network Charging Using the DSRC TechnologyThe payment transaction takes place between an electronic On Board Units (OBU), which is fixed atthe windscreen of the car, and the toll road operator’s electronic road side equipment while the vehicleis in motion. The relevant information between the OBU and the roadside equipment is exchanged,using a standardised 5.8 GHz microwave communication. The DSRC technology implies that eachsection of a tolled road network is equipped by a beacon installed on a gantry. The OBU itself has asize of a credit card (but thicker) and has its own power supply (internal battery) with a lifetime of
MTE_Denmark v1.0_final_02jun2006.doc
RappTrans
3
usually 5 years. The cost savings of simple OBU come along with more extensive resources regardinginstallation of roadside equipment (gantries with DSRC beacons).Scenario Group 2: Area ChargingThis type of scheme applies to trips made within the borders of Denmark on all roads. Users of HGVwho wish to use their vehicles within Denmark would need to have an On Board Equipment whichmeasures distance or duration of vehicles usage. A key advantage for area charging is that there is noevasion of traffic to uncharged parallel roads. Main requirement of area charging is the existence ofwell defined borders with a limited number of border crossings. The charge in an area pricing schemeis assessed by the EFC operator based on the self-declaration of the vehicle holder. The OBU storesdefined events in a log file which is sent by the vehicle holder after the end of the declaration period tothe central service via chip card or via internet.For area charging, all roads on national territory are included:Motorways (Road Directorate)985Øresundsmotorway (Sund & Bælt)7Dual carriageways352Other roads70'872Total road network72'216kmkmkmkmkm
The Great Belt and the Øresund links (app. 40 km.) are excluded because HGV charging alreadyapplies on these links.
Scenario 2A: Distance Based Area ChargingThe approach of distance based area charging is implemented by means of a permanently built in OBUwith a connection to the vehicle’s tachograph. Additional sensors (GPS, gyroscope, motion sensors)supervise the correctness of the measurement of the OBU. This technology is applied by the Swissdistance related HGV charging scheme (LSVA). Foreign occasional users are provided with a light OBU(LOBU) without a connection to the tachograph. The driver has to enter the km reading of thetachograph manually into the LOBU each time he enters or exit Denmark. For reasons of practicabilityno modulation of tariff regarding the type of road and regarding the time of day is included in thescenario.Scenario 2B: Time Based Area ChargingDifferent to the distance based area charging the time based area charge is based on the time periodduring which the road network in Denmark is used. A low-cost TOBU (Time based area charging OBU)is used containing a conventional 5.8 GHz DSRC tolling tag, a clock, vibration sensors capable ofdetermining whether the engine is switched on or off, and accelerometers capable of determiningwhether vehicle is moving or stationary. The TOBU logs the time when the vehicle is moving insideDenmark. A chip card or a USB stick is used for downloading the log file and the user declares hischarging parameters by sending in the chip card or via the Internet. With appropriate roadsideinfrastructure at the area boundary the charging data can also be automatic transmitted to theCentral System when a vehicle is entering and leaving Denmark. The key advantage of the time basedapproach of this scenario is that the TOBU is autonomous and can be self-mounted in the same way as
MTE_Denmark v1.0_final_02jun2006.doc
RappTrans
4
the DSRC tags of Scenario 1b. Therefore, there is no need for an manual declaration scheme for non-equipped users as in scenario 2A.VehiclesThe Danish vehicle stock is known through the car register. The following figures are from 2005.Lorries above 6 t gross weightSemitrailer trucks30'71013'021
Out of the 30,710 lorries above 6 tons, 28,640 are assumed to be above 12 tons. This ratio istransposed from the statistics on traffic performance per vehicle weight class. With these assumptions,the total Danish vehicle stock above 12 tons is 41,660.The relevant figure is the number of different foreign vehicles who use the Danish network within agiven period of time. These vehicles are cost-relevant since they need to be equipped with an OBUwhen they come into contact with the EFC system for the first time. No statistics are available on thissubject. Based on estimates from Sund & Bælt and the Danish Ministry of Transport and analogiesfrom HGV charging schemes in Austria and Switzerland the estimate is 100,000 different foreignvehicles per year, with a renewal rate of 30 % per year.Traffic performanceDepending on the scenario, the revenue-relevant figures are:Total distance travelled (vehicle-kilometres),Total driving time (vehicle-hours).
The Danish Ministry of Transport has provided an estimate of the total distance travelled by HGVabove 12 tons on the network on state roads and former county roads. Using extrapolations, and aconversion from total distance to total driving time based on assumptions of average speed, theresulting estimate is indicative of the order of magnitude.Traffic performance per year[million veh-km or million veh-min]Vehicle-km on chargeable roadsVehicle-minutes on chargeable roads1A1'6601B1'6602A2'4063'0202B
RevenuesThe revenue to be raised by the HGV charging scheme is intended to account for a determined shareof the external cost of road transport in Denmark in accordance with the approach of the Amendment
MTE_Denmark v1.0_final_02jun2006.doc
RappTrans
5
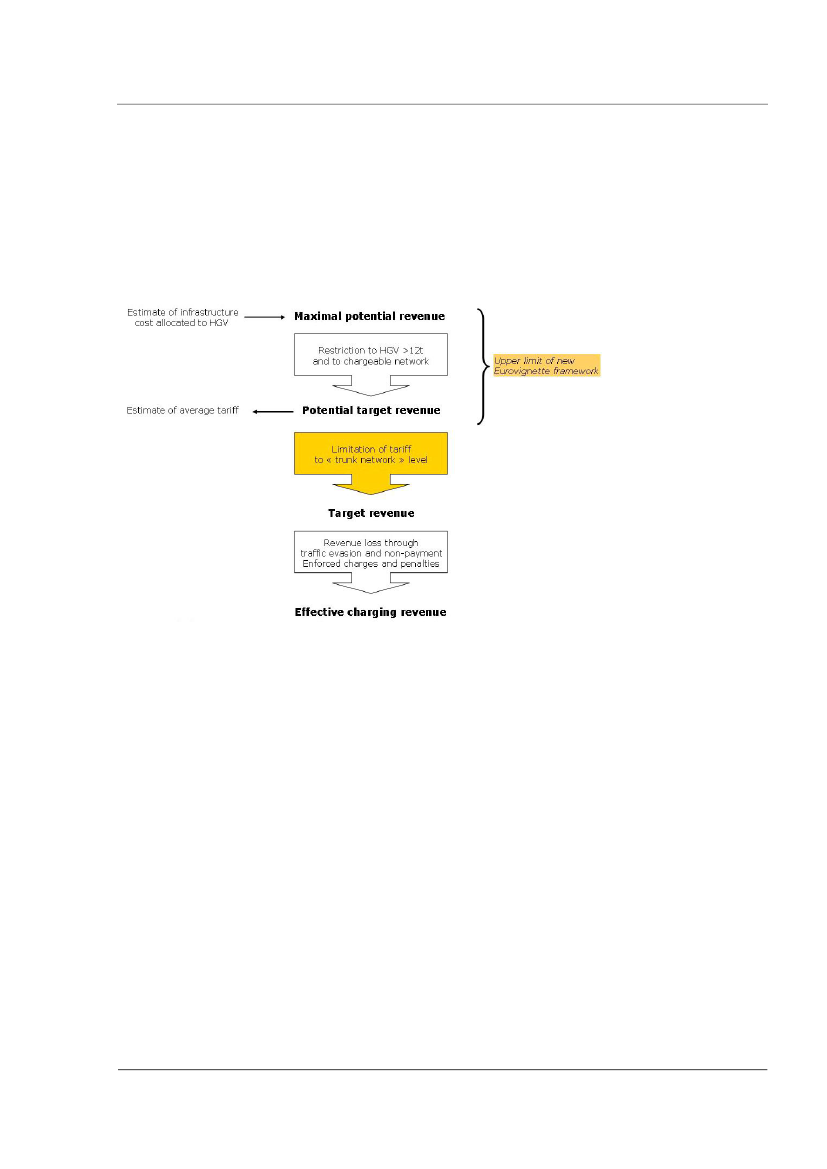
of the Eurovignette directive 1999/62/EC, which aims at a fair allocation of road transport costs totransport operators.1The estimated infrastructure cost allocated to HGV traffic are taken from a report from COWI.2It mustbe noted that the figures from the COWI report are being used without having been produced for thatpurpose. Therefore, the toll levels calculated in the present study are subject to some uncertainty andmust be studied further in a next step.The maximum potential revenue of the HGV charging scheme is assumed to be equal to theinfrastructure cost allocated to HGV which according to COWI is 2'733 million DKK per year forHGV>6t. If the cost allocation is limited to HGV >12 t it is 2'460 million DKK per year. By furtherrestricting the cost allocation, for each scenario, to the road network concerned and by adding thecosts of the charging system itself3, the total costs that can be allocated for each scenario aredetermined. For network charging, the tariff is determined by dividing the potential revenue by theannual kilometres driven on the network. For area charging, the tariff is limited to the tariffcorresponding to the Eurovignette approach on the trunk network. The effective revenue of thescheme is computed by taking the adjustments for traffic evasion and for non-payment of due chargesinto account, and by adding the revenue of enforced charges and penalties. These adjustments arescenario-dependent.
Revenue Summaryin million DKK/yearinfrastructure cost HGV>12 t assigned tochargeable networkcosts of HGV charging systemtotal assignable costsaverage tariff in DKK/veh-kmaverage tariff in DKK/veh-hourRevenue before adjustments based onaverage tariffAdjustments for charge evasion andpenaltiesEffective Charging RevenueScenario 1A Scenario 1B Scenario 2A Scenario 2B
9844861'4700.891'470-601'410
9845341'5170.911'517-611'456
2'4603992'8580.89
2'4603282'78741.31
2'126212'148
2'074212'094
1
Directive 2006/…/EC amending Directive 1999/62/EC on the charging of heavy goods vehicles for the use ofCOWI, "Total external costs of road and rail transport in Denmark", 3rd Report, July 2004conformant to Annex II of the Directive 2006/…/EC amending Directive 1999/62/EC
certain infrastructures, PE-CONS 3682/05 (6 March 2006)23
MTE_Denmark v1.0_final_02jun2006.doc
RappTrans
6
CostsThe cost estimations are based on the following general assumptions:41,660 Danish vehicles above 12 t maximum permissible weight per year100,000 foreign vehicles above 12 t maximum permissible weight per yearon average: Every 12thtoll section is an enforcement section
Scenario-specific assumptions:Scenario 1A and 1B:1,571 toll sections430 points of sales20% OBU leakage per year for DSRC-OBU and GPS-OBU
Scenario 2A:18 system entry points (border crossing stations)90 points of sales6% OBU replacement per year of fixed mounted OBU30% OBU leakage per year of LOBU
Scenario 2B:18 system entry points (border crossing stations)90 points of sales20% OBU leakage per year for time based OBU
For all scenarios, it is assumed that all vehicles registered in Denmark and all foreign HGV travelling inDenmark must be equipped with an OBU. Potential cost savings from interoperability are not includedin the estimates.It is assumed that the EFC system is procured under a BOT arrangement. The capital investmentincludes the whole costs of the tender (12 months) and the implementation (18 months) phase as wellas the costs for external consulting within the first 6 months after start of operation.The investment and implementation costs include:Charging serviceson board equipment (OBU, LOBU)roadside equipment (gantries and beacons)integration of existing toll stations
MTE_Denmark v1.0_final_02jun2006.doc
RappTrans
7
Enforcement servicesfixed roadside enforcement stationsportable enforcement stationsmobile enforcement unitsbeacon and enforcement ITCentral servicespoints of sales, including POS softwarecentral IT systemcentral back officetest equipmenttraining equipmentpre sale activitiesmarketing and information incl. call centerproject management
The operating costs include:human resources costs Management Authorityhuman resources costs Service Providernew on board equipment (OBE leackage and system growth)maintenance costs (on board equipment, road side equipment, enforcment equipment, POS)IT maintenance and support, programme licencesmaintenance of test and training equipment
The costs per year include the operating costs plus the amortisation of the investments. Theamortisation costs are based on the estimated lifetime of the components. No interests or otherfinancing costs are included.
MTE_Denmark v1.0_final_02jun2006.doc
RappTrans
8
Cost SummaryCapital investments and implementation costsin million DKKcharging servicesenforcement servicescentral servicesTotal investment costsScenario 1A3502914351'076Scenario 1B1'9412884592'688Scenario 2A24260420723Scenario 2B85127406618
Costs per yearin million DKK/yearcharging servicesenforcement servicescentral servicesTotal costs per yearScenario 1A136182167486Scenario 1B197181155534Scenario 2A64138196399Scenario 2B26154147328
MTE_Denmark v1.0_final_02jun2006.doc
RappTrans
9
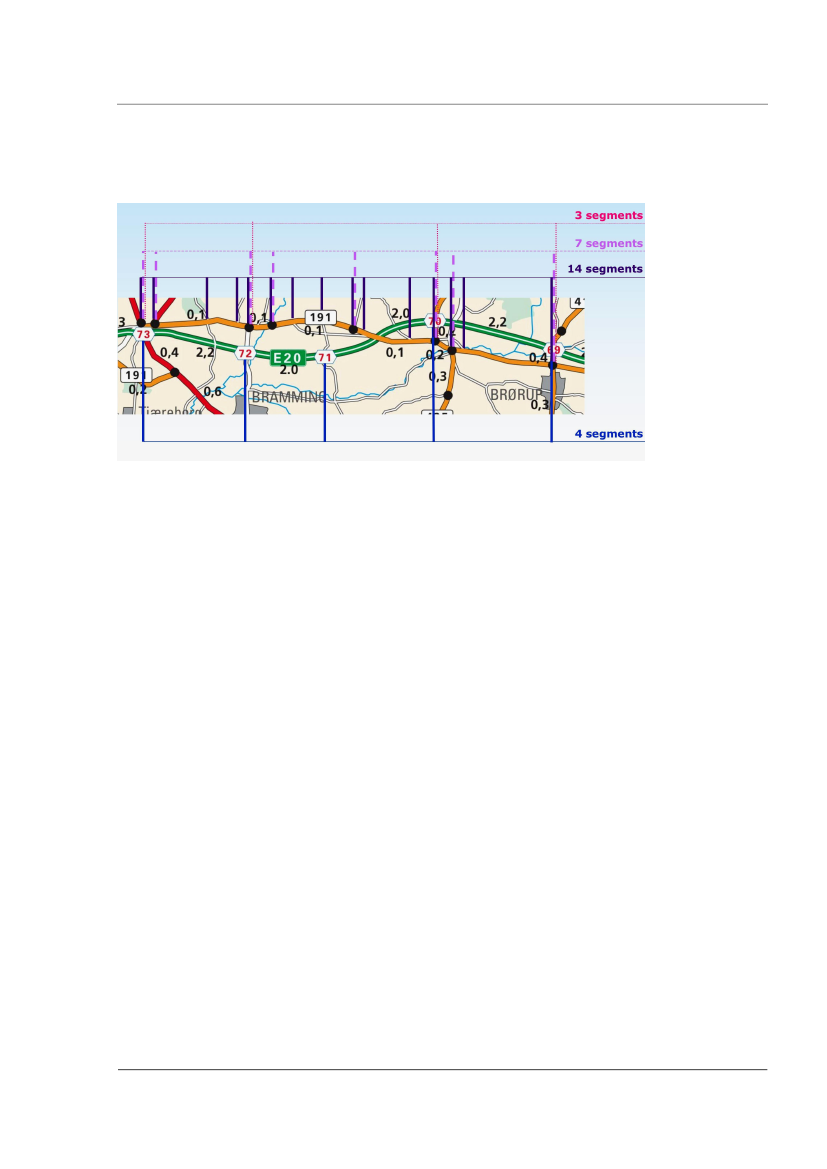
Sensitivity analysisSeveral sensitivity analyses have been conducted. They show the following:Gantry density: the cost estimates are based on the assumption that the average segmentlength on the non-motorway network is 4.4. km similar to the motorway network. If thenumber of segments is doubled, the total annual cost of Scenario 1A remain approximately thesame whereas they increase in Scenario 1B by 24%.If the density of enforcement stations is increased from 1 enforcement gantry out of 12gantries to 1 enforcement gantry out of 7 gantries the total annual costs increase for Scenario1A by 6% and for Scenario 1B by 4%.The OBU leakage (= percent of new OBUs that must be issued to occasional users) is assumedto be significantly less with the HGV charging schemes in Austria and Switzerland due to amore stable clientele of foreign trucks passing through Denmark. If the leakage ratios werethe same than in Austria and Switzerland, Scenario 1A would become significantly moreexpensive (75% increase of OBU cost, 8% increase of total annual cost). The other scenariosmuch less sensible to OBU leakage.
BenchmarksScenario 1A Scenario 1B Scenario 2A Scenario 2BVehicle kilometers per year (mio km)Total costs per year in mio. DKKEffective charging revenue per year in mio DKKEffective charging revenue per vehicle kilometer inDKKTotal costs per vehicle kilometer in DKKNet revenue per vehicle kilometer in DKK1'6604861'4100.850.290.561'6605341'4560.880.320.562'4063992'1480.890.170.732'4063282'0940.870.140.73
All scenarios show that an important part of the revenues are consumed by the operating costs. Thearea charging scenarios show significantly lower charging system costs and higher revenues than thenetwork scenarios.In addition to comparing the scenarios against each other, the cost and revenue estimates of thescenarios 1A, 1B, and 2A have been benchmarked against figures from the functionally correspondingHGV charging schemes in Europe.
MTE_Denmark v1.0_final_02jun2006.doc
RappTrans
10
Benchmark costs:ScenarioEFC Costs per vehicle kilometreDenmarkDKK1A1B2A0.290.320.17Foreign schemeDKK0.200.220.23Country
GermanyAustriaSwitzerland
The reasons for the comparatively higher costs of the network schemes in Denmark are:compared to Germany: scale effects with the Danish scheme being much smaller. The highOBU costs penalise the comparatively small territory of Denmark because much lesskilometers are registered per OBU than in Germany.compared to Austria: inclusion of the non-motorway segments. If the Danish scheme wasreduced to motorways only, the DSRC gantry infrastructure costs would be significantly lower.
Compared to the LSVA scheme in Switzerland the Danish scheme compares favourably due to the factthat Denmark has only very few system entry points (18 in Denmark versus 120 in Switzerland).Benchmark revenues:ScenarioNet revenue per vehicle kilometreDenmarkDKK1A1B2A0.560.560.73Foreign schemeDKK0.741.863.05Country
GermanyAustriaSwitzerland
The network scenarios compare unfavourably with the motorway HGV charging schemes in Austriaand Germany. The reasons are the relatively low tariffs of the Danish system (based on lowinfrastructure costs that can be attributed) and the comparatively smaller HGV traffic volume than themotorways-only networks in Germany and Austria. The benchmark with the Swiss LSVA shows thatthe Swiss have a much higher tariff yielding a significantly higher net revenue despite the higher costof their system.
MTE_Denmark v1.0_final_02jun2006.doc
RappTrans
11
The benchmarks are a result of the assumptions on which the Danish study is based. Theseassumptions need to be reviewed in further studies. The present estimates give correct orders ofmagnitude.RisksIntroducing a nationwide EFC system for HGV charging carries high risks. In Germany, theintroduction of the scheme was delayed by 15 months, and in the UK the implementation of the LorryRoad User Charging scheme has been halted. On the other hand, the schemes in Switzerland andAustria went life on time and are running smoothly.The major risks are:political risk of implementing a system without the necessary acceptance from the hauliersand the publicmaking the system too complex with functional requirements that are too demanding. Suchrequirements could be:differentiating road types other than all motorwaysdifferentiating time of day or traffic conditionsdifferentiating vehicle categories that cannot be easily detected by automatic road sideequipment (e.g. exempting HGV or special tariffs on the ground of trip purpose)complex repayment or rebate schemesmixing added value services with a tax-like charging systemrelying too much on technology to meet complex functional requirements and therebyneglecting usability aspects (e.g. unpractical fall-back options in case of equipment failure)relying too much on the industry to come up with answers instead of clear functionalspecifications and a firm leadership from governement.insufficient experience of industry operating a tax-like systemlegal challenges of the system if the scheme is inequitable for some user groupslack of interoperability with the future EETS (whatever the EETS specifications may be)unwanted traffic reactions such as detour traffic or HGV parking problems at POS.
Conclusions and recommendationsThe results of the present study must be interpreted with caution. The costs are based on those of EFCsystems that were procured some time ago reflecting the particular competitive prices of the particularsituation. The revenues rest on assumptions regarding the infrastructure costs that could be allocatedto HGV>12t on different networks based on figures of a study which has not been produced for thisparticular purpose. Nevertheless, the results certainly indicate a probable order of magnitude and theyallow to show the trends between the different scenarios.
MTE_Denmark v1.0_final_02jun2006.doc
RappTrans
12
Key figures of the scenarios:
Scenario 1A Scenario 1B Scenario 2A Scenario 2Bin million DKK in million DKK in million DKK in million DKKEffective Charging RevenueCosts per yearNet Revenue per yearCosts in % of effective chargingrevenue1'41048692434%1'45653492237%2'1483991'74919%2'0943281'76716%
Under the present assumptions none of the scenarios show a satisfying cost effectiveness. Thereasons arethe low tariff resulting from the comparatively low infrastructure costs upon which thepotential charging revenues are based, andfor the network charging scenarios the extent of the network resulting from the inclusion of alarge part of the trunk roads. Including non-motorways is particularly penalising for the DSRCtechnology.the assumption, that all HGV travelling in Denmark must be equipped with a Danish OBU andthere are no cost savings from interoperability.
The situation regarding the European Electronic Tolling System (EETS) is yet too unclear for allowingto estimate the cost effects in the present study. We recommend to review the estimates as soon asthe EETS specifications have been settled by the relevant European bodies. The cost reduction frominteroperability is likely to be the highest with scenario 1A.Notwithstanding possible interoperability benefits in Scenario 1A, the area charging scenarios arelikely to remain significantly more cost-effective than the network scenarios as long as non-motorwaysare included. The geography and network topology of Denmark favour area charging over networkcharging more than in any other European country.It is difficult to answer the question if the cost difference of 18% between driving time related areacharging and distance related area charging is big enough to engage in a discussion for this entirelynovel approach to road user charging with the EU. We assume that the debate on the subject ofdriving time related charging will rather be taken up for light vehicles than for HGV.
MTE_Denmark v1.0_final_02jun2006.doc
RappTrans
13
1
Introduction
The Danish Ministry for Transport and Energy is investigating the possibilities of replacing theEurovignette with a distance based HGV charging scheme. Rapp Trans has been assigned forestimating the financial effects on the costs and income of different EFC schemes corresponding toalternative charging scenarios. The work has been followed by an advisory group with representativesfrom the Ministry of Taxation, the Road Directorate and tolling experts from Sund&Bælt.The assignment is described in the “Task description concerning the preparation of a financial estimatefor the implementation and operation of an electronic system for the collection of road tolls for HGVs(Heavy Goods Vehicles) in Denmark”. The project has been started 23 January 2006 and the targetdate was end of April 2006 when the draft final report was delivered.To have a realistic estimation of costs Rapp Trans has used confidential data from other schemesoriginating from operators and industries. Therefore, the detailed calculations cannot be published butare part of the confidential annex. The summary figures of the cost and revenue estimations are partof this report and can be published.
2
Approach and Methodology
The study has been conducted in 3 steps.Step 1: Scenario descriptionBased on the “Task description concerning the preparation of a financial estimate for the implement-tation and operation of an electronic system for the collection of road tolls for HGVs (Heavy GoodsVehicles) in Denmark”4four scenarios have been determined and described. The characteristics of thescenarios were further developed and discussed in detail in the first Workshop with the Working Groupof the Danish Ministry of Transport and Energy.Step 2: Estimation of costs and revenues of the ScenariosIn relation to the traffic data and the defined tolling sections generated by the Danish RoadDirectorate, the financial estimate regarding the revenues and the infrastructural and operationalcosts of the scenarios was calculated. The costs are structured into the following groups:
Charging ServicesEnforcement ServicesCentral Services
Step 3: Evaluation of the ScenariosThe financial evaluation of the scenarios is based on benchmarks. The key benchmark figure used isthe total EFC system costs per vehicle kilometres travelled on the charged network by chargeablevehicles.The evaluation includes a risks and issues list for each of the four scenarios.
4
Sund & Bælt, Note dated 21 December 2005
MTE_Denmark v1.0_final_02jun2006.doc
RappTrans
14
3
High Level Description of the Scenarios
4 Scenarios have been determined using two alternative technologies each:Scenario Group 1: Network charging1A: Satellite positioning technology1B: Tag and beacon technologyScenario Group 2: Area charging2A: Distance charging based on Tachograph impulses2B: Charging based on driving time using motion sensorsThe table below shows the detailed charactersitics of the 4 scenarios.
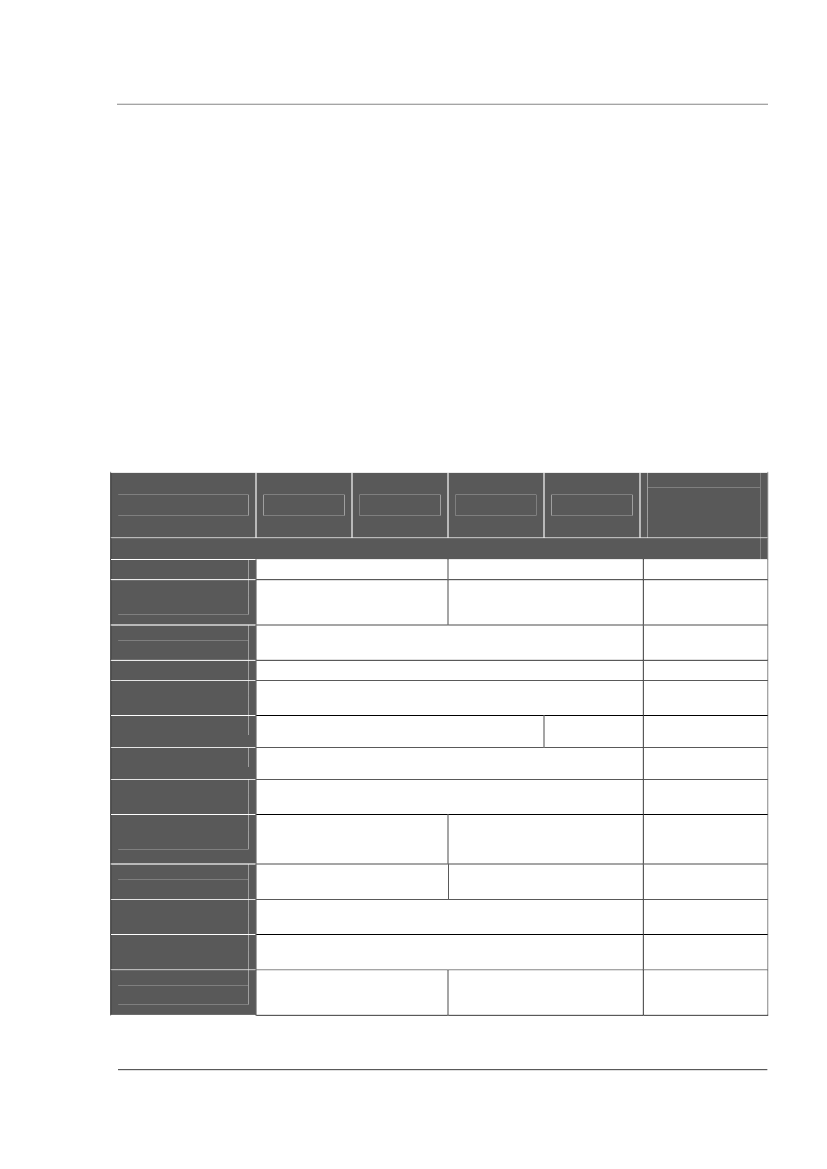
ScenarioCharging policyCharging principleRoad networkchargedLegal status ofchargeVATVehicles subject tochargeTariff baseTariff levelCompensationstrategyTariff modulation –type of roadTariff modulation –vehicle classTariff modulation -trailersTariff modulation –emission classTariff modulation –time of day
1A
1B
2A
2B
Alternativecharacteristicsnot included inthe scenarios
Network chargingMotorway network and mainroad network (3,500 km)TaxNo VATHGV>12tDistance based
Area chargingEntire road network incl.private roads and yards(approx. 72,000 km)Motorway networkonlyFeeVATHGV>3.5 tDriving timebasedFull inclusion of theexternal costs
Eurovignette proposalNot to be consideredNone /separate cost estimate for roadtype differentiationRegistered weight or number ofaxlesNoneRegistered maximumpermissible weight of road train
NonEURO normNone /separate estimate for time ofday differentiationNone
MTE_Denmark v1.0_final_02jun2006.doc
RappTrans
15
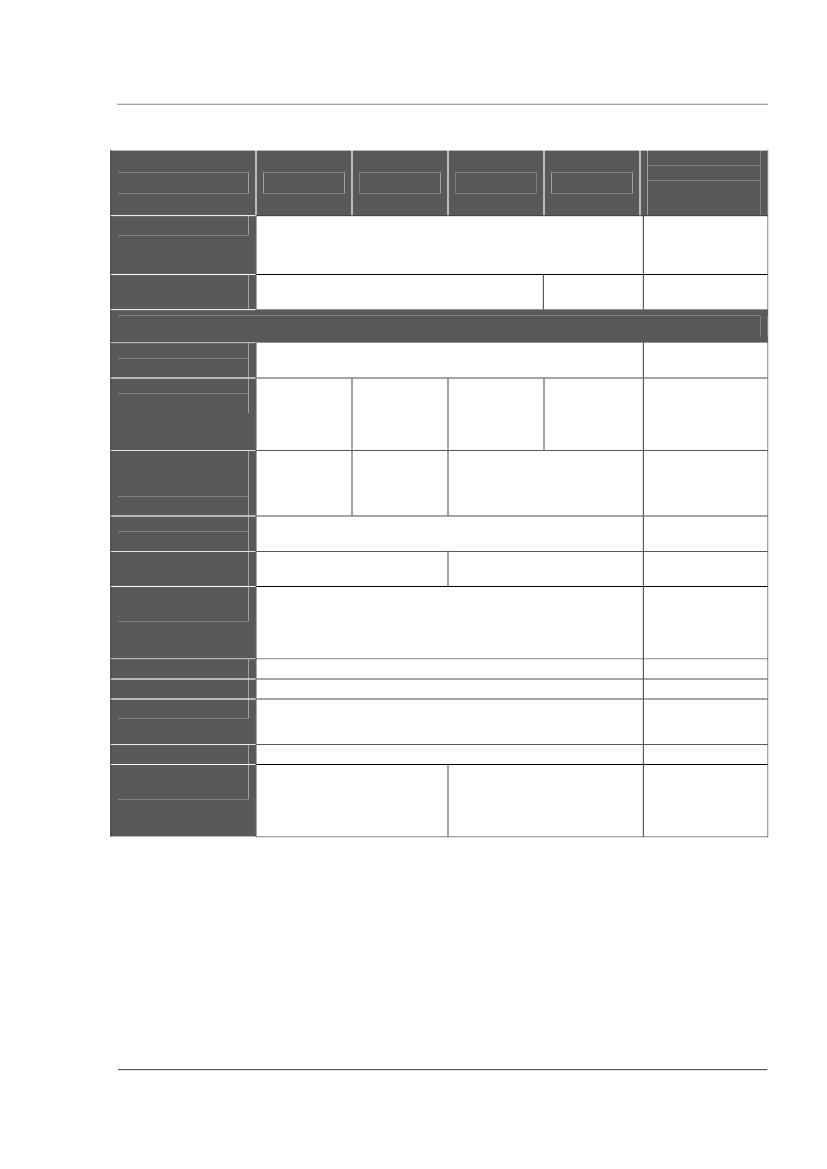
ScenarioExemptions
1A
1B
2A
2B
Alternativecharacteristicsnot included inthe scenariosExempted trippurposes orexemptedindividual journeys
Exempted vehicle categories
Interoperabilitystrategy
EETS compliant
Only one-wayinteroperability
TechnologySystem foroccasional usersTechnology forcapturing usageThe On Board Equipment (OBE) is mandatoryVirtualgantries & tollsectionidentificationGNSSTachographimpulsessupervised byGNSS
Physicalgantries DSRC
Movementsensors
Technology fortransmittingcharging data tocentral systemTraffic flow atcharge pointsOpen or closedsystemClassificationmethod
GSM/GPRS
DSRC
Smartcard (domestic users) /DSRC (foreign users)Toll plazas withsingle lanesClosed systemClassificationparametersmeasured by road-side sensingequipmentPre-paymentManual paymentand automaticpayment
Free-flow multi-laneOpen system--- (does not apply to areacharging)
Classification parameters stored in OBU and transmitted to RSE
AccountingPayment modePayment methodPayment meansRegistration method(first time users)
CentralGuaranteed payment/Post-paymentElectronic paymentCash/ Credit cards / Petrol cards / central accountManned POS at borders,manned and unmanned POSand fax in inlandManned POS at borders(occasional user) andregistration data providedautomatically by the vehicleregistration database
MTE_Denmark v1.0_final_02jun2006.doc
RappTrans
16
ScenarioRegistration datastored in centralsystemDistribution of OBU
1A
1B
2A
2B
Alternativecharacteristicsnot included inthe scenarios
Vehicle account, contract number, vehicle data (e.g. LPN,emission class et.) and account of guaranteed paymentManned POS at entry points of chargingnetwork, manned POS and postal expedition ininlandManned POSat borders(occasionaluser) andcertified fittersSelf mounting(occasionaluser) andcertified fitters
Certified fitters
Mounting of OBUSelf mounting
Certified fitters
EnforcementResponsibility fordeclarationLegal determinationof vehicle dataData used for proofEnforcement meansJoint several liability of driver and vehicle holder/ownerDeclarationPhotographic picture of license plate plus overviewFixed and portableenforcement gantries andextensive mobile patrolsFixed enforcement gantriesand strong OBU andenforcement at charging areaboundary, few mobile patrolsHolder/owner onlyobservationIn addition: picturefor identifyingdriver
Progressivity ofsanctionsAccess to chargeevadersVerification ofregistration datasupplied by userEnforcementstrategy
Distinction between administrative fee for retarded payment andfineMobile patrol and mailMail and enforcement atcharging area boundaryBarriersAt enforcementchecksBased oncost/benefit ofenforcementactivities
At time of registration
Risk profiling
Organisational and institutional characteristicsManagementauthorityEFC systemprovider/operatorEnforcementoperatorScope of EFCsystem providercontractUnit of national governmentPrivate company or public authorityPublic agency or privat EFC operatorSupply of EFCsystem components
Build and operate EFC system
MTE_Denmark v1.0_final_02jun2006.doc
RappTrans
17
ScenarioRemuneration ofEFC system provider
1A
1B
2A
2B
Alternativecharacteristicsnot included inthe scenariosDepending ofcharging revenuesor depending ofchargeable trafficvolume
Fixed
Responsibility forcharging incomelost by evasionOwnership of OBUCharge for OBU
National governmentUser ormanagementauthorityNo deposit ordeposit covering fullOBU cost
EFC operatorDeposit (according to draft Eurovignette directive) not coveringfull OBU cost
3.1
General Assumptions pertaining to all Scenarios
In this chapter the main general assumptions regarding to the table of scenarios are characterised.3.1.1Legal status of the charge is a tax.
The Danish tax freeze makes it difficult to conclude whether a road charge should be implemented asa tax or as a fee. It requires a political decision to choose the legal status of the charge. However, thisreport assumes that the legal status will be a tax in all of the scenarios, since it is necessary to makethe same assumption identical in all scenarios in order to be able to perform comparative studiesacross the scenarios.A tax is a charge where only a governmental authority has the fiscal sovereignty to collect it. A tax isnormally a charge that does not give a right to a certain service. Taxes are simply instruments forfinancing the governmental budget.In contrast a fee is normally a charge directly related to the usage of a service. A fee can be collectedby a public authority or a private entity on behalf on it.For taxes usually strict national regulations apply. In most countries, only public authorities canoperate the collection system. Toll charges with a tax status often also rely on a user declaration ofthe road usage and the technical equipment is only considered a tool to help the declaration. Withfees, the freedom in system design is higher since the environment is less regulated.If a road usage charge is legally considered a tax, it is not subject to Value Added Tax (VAT). If acharge is considered a fee, VAT normally applies. The VAT is an issue of handling and processing thepayments, but not an issue for the RUC scheme in itself. It is also an issue for procedural andcontractual interoperability.An other advantage of a tax is the governmental source of power to execute the enforcement.Enforcement of a tax is much more effective then the enforcement of a fee. A private company has in
MTE_Denmark v1.0_final_02jun2006.doc
RappTrans
18
most cases no access to the official vehicle registration database and no possibility to hinder the roaduser to continue his trip.However, in the Danish tax system taxes can also be subject to VAT. Furthermore, not only the publicauthorities can operate the collection system and third parties are in these cases well equipped withthe power to execute the enforcement of collection. Often the system is established in this way,because third parties are regarded as better executers than the authorities, since they possess moreinformation to screen the customers with respect to payment credibility. To keep things as simple aspossible it is assumed in this report that the road charge is a tax not subject to VAT.The contractual interoperability between EFC systems where the charge is a fee are commonly simplerto handle than if the charge is a tax. The issues of a taxes that are being collected by (foreign) thirdparties must be explored.3.1.2Vehicles subject to charge are HGV above 12 tonnes.
Denmark is currently participating in the Eurovignette scheme. All Heavy Goode Vehicles (HGV)heavier than 12 tons have to be registered at the Eurovignette database for paying their fee. SinceGermany contracted out of the agreement of the Eurovignette scheme in 2004, the discussions aboutthe possible end of Eurovignette scheme started. The introduction of a Road User Charge for vehiclesabove 12 t could be understood as succession of the Eurovignette using current technologies.Therefore it could get a higher acceptance in the haulier trade than a 3.5 t limit.3.1.3Tariff is modulated regarding the emission class.
A tariff related to the emission class has a significant impact on the status of the vehicles fleet of acountry (e.g. in the Swiss LSVA scheme the modulation of tariff regarding the emission class had asignificant impact on the renovation of the hauliers’ fleets). The emission class is part of the masterdata and can not be manipulated at the OBU by the user. The tariff could be differentiated dependingto the EURO norm emission classes (EURO 1 to 5).3.1.4Basically, the EFC system should able to differentiate in a further step regarding tothe area/network or time of day
In scenarios (1A, 1B, 2B) it is possible to modulate the tariff regarding the zone of an area or the roadnetwork and the time of day. In case of an area charging additional DSRC roadside equipment andseveral adaptations at the central IT system are necessary.In case of a distance based area charging (scenario 2A) the time related tariff is only in combinationwith a defined road network (e.g. motorways) or zones (e.g. inner part of a citiy) possible since thereis the need for passing a DSRC gantry which triggers a logfile entry.3.1.5The charge depends on the number of axles in scenario 1A and B and on theregistered maximum permissible weight in scenario 2A and B
The simplest way of taking the vehicle weight in to account of charging is to use the maximumpermissible weight of the road train. The charge would be the same for full and empty HGV and fortractor vehicles pulling a trailer or not, thereby incentivising a maximum utilisation of the loadingcapacity and a most efficient use of road capacity of road goods transport. However, this approach isconsidered being unfair by the road haulage industry. Compromises are the use of the number of
MTE_Denmark v1.0_final_02jun2006.doc
RappTrans
19
axles for classification ore the use of the registered maximum permissible weight of the pulling unitwith separate declaration of the trailer weight.3.1.6The scheme has to be compliant with NORITS (NORdic interoperable Tolling System)
NORITS is a service offered to all users of toll collection systems in the Scandinavian countries. Theservice makes it possible for any user to pay his road user charge in all Scandinavian schemes withthe OBE he has received from his local toll operator. Therefore it was necessary to create astandardised transaction (technical interoperability), common procedures (procedural interoperability)and a common contractual framework (contractual interoperability). Every new scheme withinScandinavia has to be compliant with this NORITS framework.3.1.7The scheme has to be EETS compliant.
The Directive 2004/52/EC on the interoperability of electronic road toll systems in the communitydefines the technologies of electronic toll systems brought into service after the 1stJanuary 2007.They shall, for carrying out electronic toll transactions, use one or more of the following technologies:satellite positioning;mobile communications using the GSM GPRS standard;5,8 GHz microwave technology.
Interoperability shall be achieved by On Board Units which work in all systems and not by harmonisingthe national systems. The specifications for the European Electronic Tolling System EETS are not yetdetermined. Nevertheless, the assumption is that the Danish HGV Charging Operator will acceptcustomers who want to pay the charge by using an EETS OBE linked to an EETS contract. This isliterally meant in all four scenarios possible. But since the European discussions and the directiveabout EETS emanate a distance based RUC it is not possible to act on the assumption that a timebased area charge is EETS compliant. However a one directional interoperability will be possible.3.1.8The On Board Equipment (OBE) is mandatory.
The handling of occasional users strongly determines the overall design of a charging system solution.If a technical solution for tolling requires the usage of special On Board Equipment (OBE) then it canbe assumed that frequent users will equip themselves with such a device to take part at the scheme.But according to the UN Convention on Road Traffic and to the EU non discrimination logic (e.g. Treatyof Nice), frequent and occasional users must be admitted to the charged road network in the samenon-discriminatory fashion. Especially occasional users will not be prepared to equip themselves withpermanent equipment.If the technical solution is based on a complex OBE with high effort for integration in the vehicle, e.g.installation time of several hours and only in certified workshops, then a second solution must beoffered to cover the needs of occasional users. This second technical solution must ensure that theunequipped or occasional users can have access to the system in an easy way and with minimal effort,e.g. with a ticket based solution or with an OBE that can be obtained and mounted by the driver in amatter of minutes.In charging, equal treatment especially means that all user groups pay the same when using the sameroads under the same conditions. System design must therefore ensure that users with permanently
MTE_Denmark v1.0_final_02jun2006.doc
RappTrans
20
fitted equipment pay the same as non-equipped or temporarily equipped users. It is questionablewhether users with permanently fitted equipment can be offered better tariffs or whether occasionalusers can be treated with a simplified charge.From this it follows that even the most sophisticated technical charging solution is limited in itscharging flexibility (flexible tariffs, flexible extensibility of charging area, etc.) to the capabilities of thetechnical solution for the occasional users. Only what can be done for the occasional or unequippedusers can also be done for the frequent or equipped users.For charging systems, the requirement “no barrier to free trade” especially means that foreign users,which are often occasional or unequipped ones, must have easy access to the charged road network.It is not allowed that the charging solution takes a lot of time or requires high deposits to be paid inadvance.One solution to the problem of occasional and foreign users is to construct the road user charge as anational tax which foreign users do not have to pay. The Netherlands had been planning such asystem for all vehicles for several years. The system was planned as a distance dependent charge onall roads and required the installation of an on-board unit in all vehicles. The intention was to replacethe taxes on vehicle use (annual vehicle tax, petrol taxes, etc.) with a distance dependent tax that hasdemand management aspects (differentiation of the fee according to time of day and according totype of road). Since the fee was constructed as a national tax, subsidiarity applies and theNetherlands had maximum freedom in system design, e.g. there would have been no obstacles tointroduce a mandatory on-board unit in every vehicle as a kind of “tax meter”.Since the OBE which is used to measure the distance in a distance based area charging scheme likethe Swiss LSVA needs an electrical connection to the tachograph (installation of the OBE needs morethen an hour). This requirement makes it necessary to develop an alternative solution for occasionalusers. Therefore the Swiss LSVA uses ticketing machines where the user enters his mileage and gets aticket. At the end of his trip in Switzerland the user declares his new mileage at the moment of exit onthis ticket and gives it to the custom officer. A more comfortable solution for this functionality could bea self mountable, autonomous DSRC Low use OBU (LOBU) with a display and a keypad to enter themileage. At the border crossing the user has to enter the mileage of his vehicle and the vehicleconfiguration into the LOBU. Passing the border the data will be transmitted to a central IT system viaDSRC.One main cost driver regarding OBE is the so-called OBE leakage: loss of OBE mainly through foreignusers who enter Denmark rarely or just one single time, and through the high number of newregistered vehicles. The experiences of the Austrian and the Swiss scheme show that 140,000 newOBE per year are distributed in Austria on top of the 400,000 OBE at the start of operation. 90,000new vehicles per year are registered at the Swiss border.3.1.9It has to be a free-flow multi-lane tolling system.
There should be no barriers for the traffic resulting out of the charging procedures. After registrationof the vehicle and haulier or payment data and if necessary after installation of the OBE in the vehiclethe user has not to stop trip anymore because of the tolling system. Independent of the number oflanes and traffic conditions charging has to be possible.
MTE_Denmark v1.0_final_02jun2006.doc
RappTrans
21
3.1.10 The central account is the master and comes with the only confirmed balance.In an area charging system, the self declaration principle is the only effective way to obtain thecharging data of vehicles that never or seldom leave the area. Self declaration does not allowinforming the user about the used charge since the assessment for HGV charge is based on the usersdeclaration by the back office of the charging system operator. Therefore a prepayment solutioncomprising an on board account is not applicable. The user may be offered the possibility to check thelog file entries informing him about the used distance and the declared weight. Based on thisinformation he can estimate the charge, but the system cannot give him any assurance for theamount before the declaration has been accepted.Neither a thin client GPS/CN scenario which is not as costly as a fat client GPS/CN scenario has thepossibility to provide a on board account. Since in this case the map matching and the calculation ofthe tariff is done in the central IT system, the actual balance of the charge is not online available.Within a certain time it is possible to transmit the balance from the central IT system to the thin clientOBE.Only a DSRC OBE could easily provide an on board account, since the receipt including the tariff of thetoll section is part of the DSRC transaction and is stored in the OBE.3.1.11 An anonymous use of the system is not possible.Every vehicle using the charged network or area has to be registered. Therefore at least a vehicleaccount has to be opened, a contract number has to be generated, the license plate number and othervehicle data (like emission class etc.) have to be stored and a payment mean has to be authorized.3.1.12 The driver and the vehicle holder share the liability regarding the HGV charge.Primarily liable for the HGV charge is the vehicle holder. He is responsible for the payment of thecharge. The driver can be enforced by the mobile enforcement officers in case of not executing hisobligation to co-operate.3.1.13 At the time of registration declared vehicle data are verified.To register the vehicle for the road user charge (RUC) the user has to show his vehicle registrationcertificate. Based on the vehicle registration certificate the employee of the point of sales (POS) hasthe possibility to verify the declared vehicle data. During the introduction of the charging system(some moth before and after the start of operation) there should be the possibility to register vehiclesby fax or letter. The vehicle holder has to attach photocopies of the vehicle registration certificates tothe declared vehicle data as a proof. The fact that there are no unassured vehicle data in the systemdata base takes a huge burden off from the enforcement system.3.1.14 The enforcement strategy will be based on a assessment of fraud.Enforcement is one of the main cost drivers of a charging system. The frequency of fraud dependsfrom the density of enforcement (the more enforcement the less fraud). But after a certain point theimpact of enforcement on fraud decrease and the operating costs increase strongly. Therefore it isnecessary to assess the risk and frequency of fraud. Based on this fraud assessment there will be anestimation of the best density of enforcement/operating costs ratio for each Scenario. The followingparameters have influence on the density of enforcement:
MTE_Denmark v1.0_final_02jun2006.doc
RappTrans
22
the number of toll sectionsthe number of operating fix and portable enforcementstationsthe geographical and stratigic location of fix and portable enforcementstations (at all areas ofa road network and at points with the most traffic)the frequency of mobile enforcement especially regarding foreign users
The following parameters have influence on the operating costs of enforcement mainly on the need ofmanual post processing:the number of operating fix and portable enforcementstationsthe quality of the automatic number plate recognitionnot readable LPNwrong read LPNthe quality of vehicle classificationwrong classification regarding the liabilitywrong classification regarding the vehicle class (incl. trailer)
3.1.15 The OBE is in the ownership of the EFC operator.Especially the more sophisticating on board units should not be out of control of the EFC operator forreasons of security. The ownership of the OBE allows the EFC operator an easier handling regardingthe operation and the maintenance of the OBE. Since the RUC should be a tax the acceptance of thecharging system is necessary for the political decision finding process. Additional costs for the roaduser regarding the OBE will not be accepted, especially if the costs are high like in the case of adistance based area pricing scheme.3.2Scenario Group 1: Charging of a Defined Road Network
HGV Charging on motorways and expressways can be done distance related or time based (i.e. daypass, monthly or yearly permit). This study only focuses on distance related network charging. It ispossible to execute distance charging by several available technologies (DSRC, ANPR, GNSS/CellularNetwork, ). In some schemes like the one in Austria, the motorway and expressway toll is combinedwith a corridor pricing for tunnels and bridges, which are part of the motorway network. In manyEuropean countries (e.g. France, Spain, Italy, Portugal, Slovenia, Austria, , Germany, Hungary) HGVare charged on motorways. In all of these countries, the toll is well accepted by hauliers.One of the main problems of motorway and expressway charging is the evasion of traffic to unchargedparallel roads particularly by occasional (foreign) users. To solve this problem, there are intentions toexpand the tolling liability on certain parallel (not tolled) roads, especially in Germany.EnforcementThe level of enforcement in a network charging scheme depends on the number of enforcement points(permanent installations or mobile units) relative to the length of the network. The Austrian HVcharging scheme comprises 120 permanently installed enforcement stations, 20 portable enforcementstations and 40 mobile enforcement units which are 7 days 24 hours active on a 2,000 km roadnetwork with 800 toll sections. The German HGV charging scheme covers 12,000 km of road networkwith 5,500 toll sections. The German enforcement system is based on 300 permanent enforcement
MTE_Denmark v1.0_final_02jun2006.doc
RappTrans
23
stations and 280 mobile enforcement units. Only a limited number of enforcement stations and mobileenforcement units are in operation at any time to decrease the operating costs of enforcement sinceevery picture of a potential enforcement case has to be checked manually.
Figure 1: Mobile enforcement executed by the BAG (Germany) and ASFINAG (Austria)
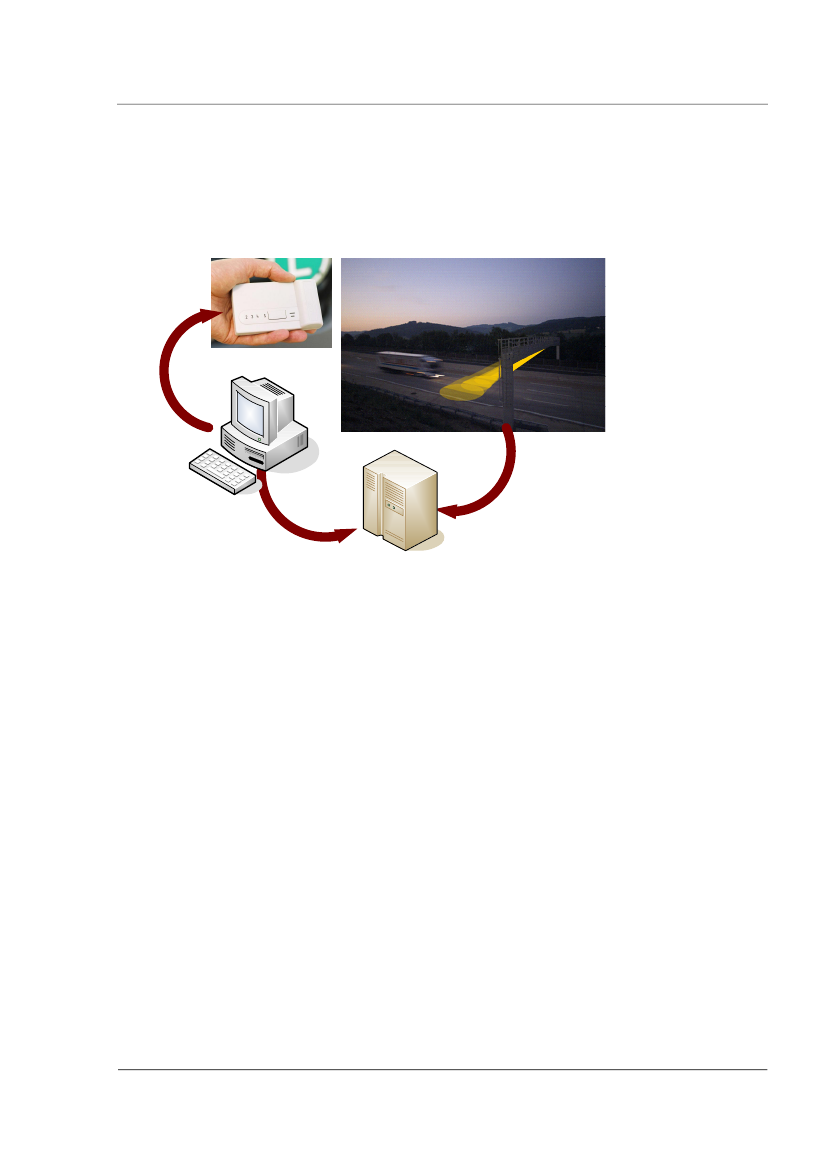
Registration and distribution of OBUBefore using the charged road network the user has to register his vehicle at a manned or unmannedpoint of sales (POS) or via fax (see chapter 3.1.13) or on the internet. After registration he gets hisOBU which is personalized via CN in case of a GNSS/CN scheme and via DSRC at the POS in case off aDSRC scheme. The OBU is mounted in both cases by the user/driver himself.3.2.1Scenario 1A: Network Charging Using the GNSS/Cellular Network Technology
One approved technology for network tolling is GNSS/CN. It uses two technologies adapted from otherapplications; namely, GNSS (Global Navigation Satellite System), whose satellites enable suitablyequipped vehicles to calculate their location accurately; and a two-way communication link (e.g.GSM/GPRS) based upon cellular telephone network. According to the position, the system recognises ifthe vehicle is driving on a toll road. In contrast to DSRC based systems GNSS/CN systems need only afew, if any, roadside infrastructure (gantries). Due to the several limitation by using GNSS only (noGNSS signal by shadowing effects, temporary system turn-off, etc.) the OBU is connected to orequipped by other sensors for localisation and distance measurement (tachograph, wheel sensors,gyrocompass, etc.).Two main designs of the overall system are technically possible. The one approach uses a high-endGNSS/CN OBU (so called “fat client”) which means all the intelligence for a single fee calculation isinside the OBU. This OBU transmits complete fee transaction data to a central system where they arecumulated and further processed for billing. The OBU recognizes by itself whether it is on a toll sectionor not and if yes what tariff applies and when. This implies that an application with map matching
MTE_Denmark v1.0_final_02jun2006.doc
RappTrans
24
algorithm and tariff handling must run on the OBU. If the properties of the charged network change,e.g. new tolled sections or tariff, the OBU software must be updated over the CN interface. This kindof system architecture was implemented by the German toll operator Toll Collect. The fat clientarchitecture is highly sophisticated and has to be mounted by certified garages because of thenecessary connection to the antennas and other sensing equipment and power supply. Therefore, thecapital investment and the operating costs of fat client architecture are relatively high. Since the mapmatching and the calculation of tariff is executed by the OBU, the liability of the road network and theactual charge can be displayed online to the driver. This technology is applied for the German LKWMaut system by Toll Collect.The other approach is a low-end GNSS/CN OBU (so called “thin client”). This OBU collects only positiondata (GNSS position and time plus potential other sensors) and sends this to a central IT system.Based on the position data received from the OBU the central system calculates the dedicated fee. Themap matching process and the tariff management run in the central system. The needed OBUsoftware updates are limited, because the fee calculation process is done by the central system. Incurrent discussions about architecture of GNSS/CN EFC systems, the thin client architecture isfavoured by the industry. The complexity of the OBU is less than in a fat client architecture and can behandled easier. In spite of higher communication rates via CN (since the localisation is not done in theOBU) the investment and operating costs are much lower. Regarding the main current Europeaninteroperability projects the EETS OBU could be a thin client. This technology has been proposed forthe UK Lorry Road User Charging project. Scenario 1A is based on the thin client architecture.At the time when the tender of the German “LKW Maut” was prepared, telematics platforms integratedinto the vehicles to provide different value added services (VAS) beside EFC were in the expert’sminds. The concept was to create an OBU which is able to run different applications using a singlehardware platform. This telematics platform should include technical components processing thelocalisation of the vehicle and communication equipment to transfer data to the different serviceproviders. The German OBU should be such a telematics platform running different applications andproviding VAS. After the start of operation of the German LKW Maut was postponed, the prioritychanged. First priority became the start of operation of the German HGV charge. Currently Toll Collectis not allowed providing VAS. The German OBU is a very complex multi application device which runsonly one application to collect RUC. The hype of VAS provided in the vehicle has cooled off. There is noreason anymore to invest a lot of money into a device which is able to provide several services in thevehicle which are not demanded by the market.The thin client architecture does not provide the same potential to implement Value Added Services(VAS). On the other hand, there are less implementation risks and lower cost than with a fat. TheGerman fat client concept was originally designed to act as a general telematics platform in thevehicle. Only when the problems of delivery of the systems became obvious a new policy was adoptedto only implement the charging function and to abstain from offering VAS.The power consumption of a GNSS/CN OBU is much higher than with a DSRC OBU. This comes fromthe current drain of the GNSS module itself and from the higher computing power. The power supplyof such an OBU usually can not be provided internally (by battery) for a sufficient time, therefore it isnecessary to have connection to the power supply of the vehicle (permanent power supply connection- fat client; power supply to recharge the battery – thin client).
MTE_Denmark v1.0_final_02jun2006.doc
RappTrans
25
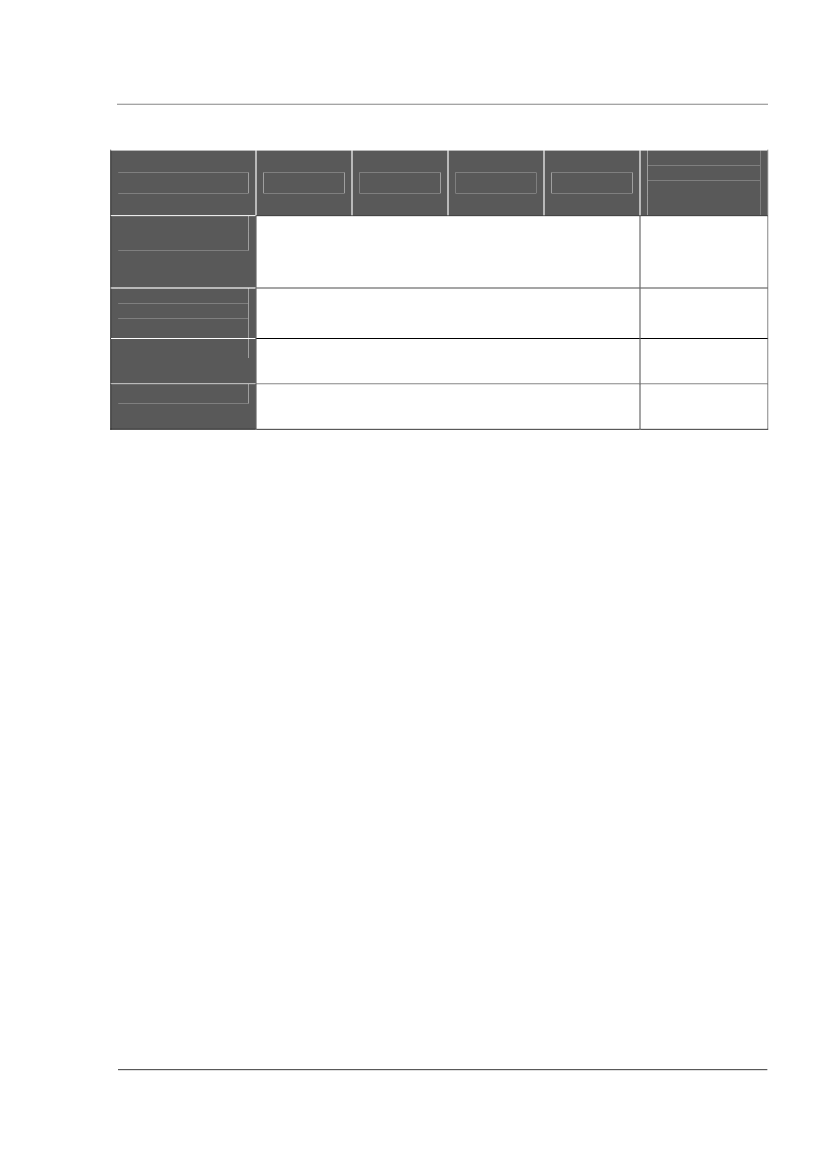
Collection of geographicalsensor data by OBULocalisation of the vehicle.calculation of tariff and datastorage and processing inthe central IT system
Transmission of sensor data tothe central IT system via CN
Figure 2: Key-functionality of a GNSS/CN charging system (thin client architecture)
Virtual gantries and toll section identification via GNSS and map matchingCurrently there are two different ways to charge a toll section in a GNSS/CN charging systems. Firstthere is the German Toll Collect approach which allows the identification of a certain point (small area)at a road network and with it a particular toll section. Passing this particular point the vehicle ischarged for the corresponding toll section. The other approach identifies a toll section by recognition ofpattern based on different geoposition data. The localisation is done via map matching. In the thinclient architecture the geographical data are collected by the OBU and transmitted to a central ITsystem which is processes the map matching and calculates the tariff. Regarding the capitalinvestment it is to consider that both approaches are patented. It is to emanate that potential supplierof such a technology will be able to come with a corresponding license.Communication between OBU and central IT system via cellular networkThe communication between the OBU and the central IT system like the transmission of geographicaldata will be proceeded by a public cellular network (CN) for instance a GSM/GPRS network. Tominimize the communication costs a flat fee for a certain time (e.g. day) has to be negotiated with thesupplier of the CN.
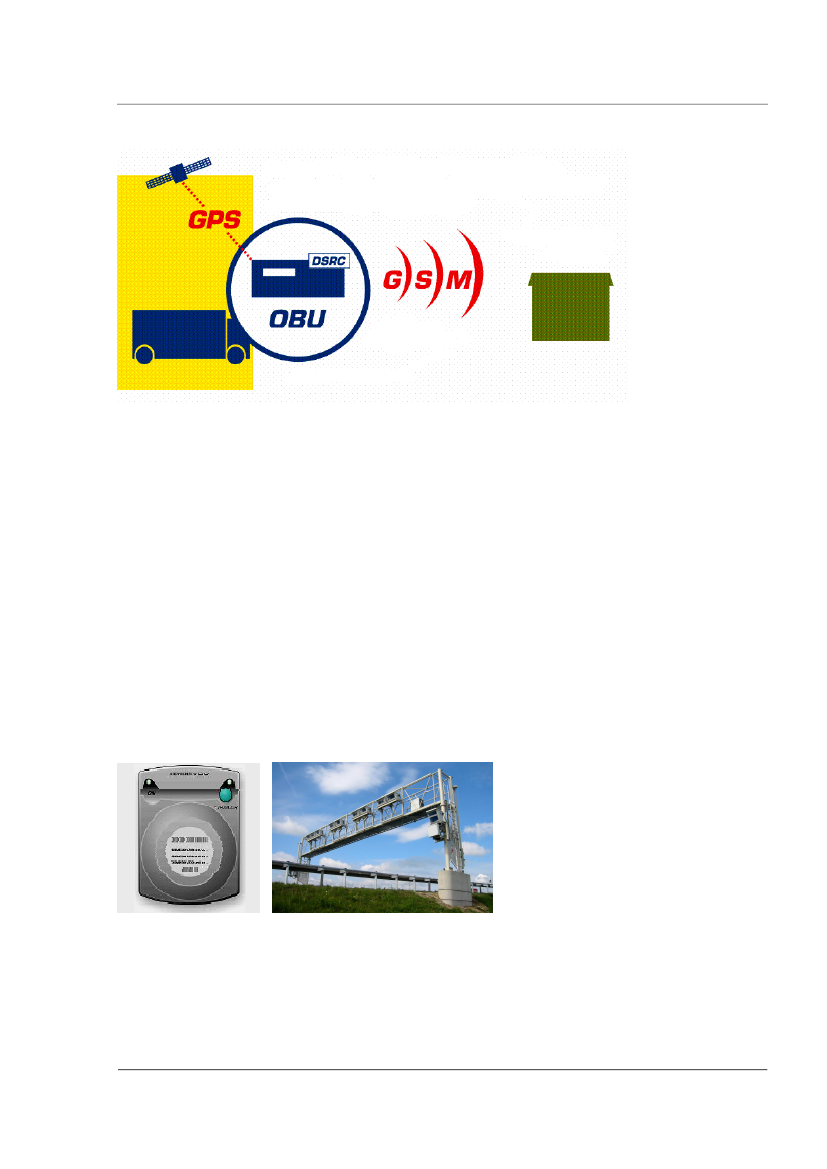
Figure 3: GNSS/CN OBU: possible solution of a thin client and a German enforcement station using IR beacons
3.2.2
Network Charging Using the DSRC Technology
Instead of using cash or payment cards, the payment transaction takes place between an electronicOn Board Units (OBU), which is fixed at the windscreen of the car, and the toll road operator’s
MTE_Denmark v1.0_final_02jun2006.doc
RappTrans
26
electronic road side equipment while the vehicle is in motion. During a split of a second, the relevantinformation between the OBU and the roadside equipment is exchanged, using a standardised 5.8 GHzmicrowave communication. In Europe commonly two standardized types of 5.8 GHz DSRC links areused. One is the DSRC link according to the approved CEN standard, which is the most common, andthe other one is the DSRC link according to the Italian UNI standard.
Personalised OBU transmits vehicle data to thebeacon
Communication zone of a DSRC gantry wheretransactions are generated
Point of saleswhere the OBU ispersonalised and thevehicle is registeredCentral IT system where all dataare proceeded and storedFigure 4: Key-functionality of a DSRC charging system
In a DSRC system the data exchange necessary for tolling happens between the OBU installed in thevehicle and a beacon installed roadside usually on a gantry. If the vehicle is passing underneath sucha gantry the relevant data for tolling (e.g. vehicle data, contract data, etc.) are provided by the OBUto the beacon. Having received this information the beacon calculates the fee based on its additionalinformation like time and section tariff. The OBU gets a receipt from the beacon including thisinformation. The data from all the beacons installed on the network are collected in a central systemfor further processing (billing etc.). From the central system the beacons are provided with data whichare subject to change, like tariffs, lists etc. This happens normally by using leased lines. The DSRCtechnology implies that each section of a tolled road network is equipped by a beacon installed on agantry. The OBU itself has a size of a credit card (but thicker) and has its own power supply (internalbattery) with a lifetime of usually 5 years. The cost savings of simple OBU come along with moreextensive resources regarding installation of roadside equipment (gantries and beacons). It isassumed that the DSRC system would be conformant to NORITS interoperability (technical,operational and contractual interoperability).
MTE_Denmark v1.0_final_02jun2006.doc
RappTrans
27
Figure 5: DSRC gantries and OBU in Austria (left: DSRC only, right: DSRC and enforcement).
3.3
Scenario Group 2: Area Charging
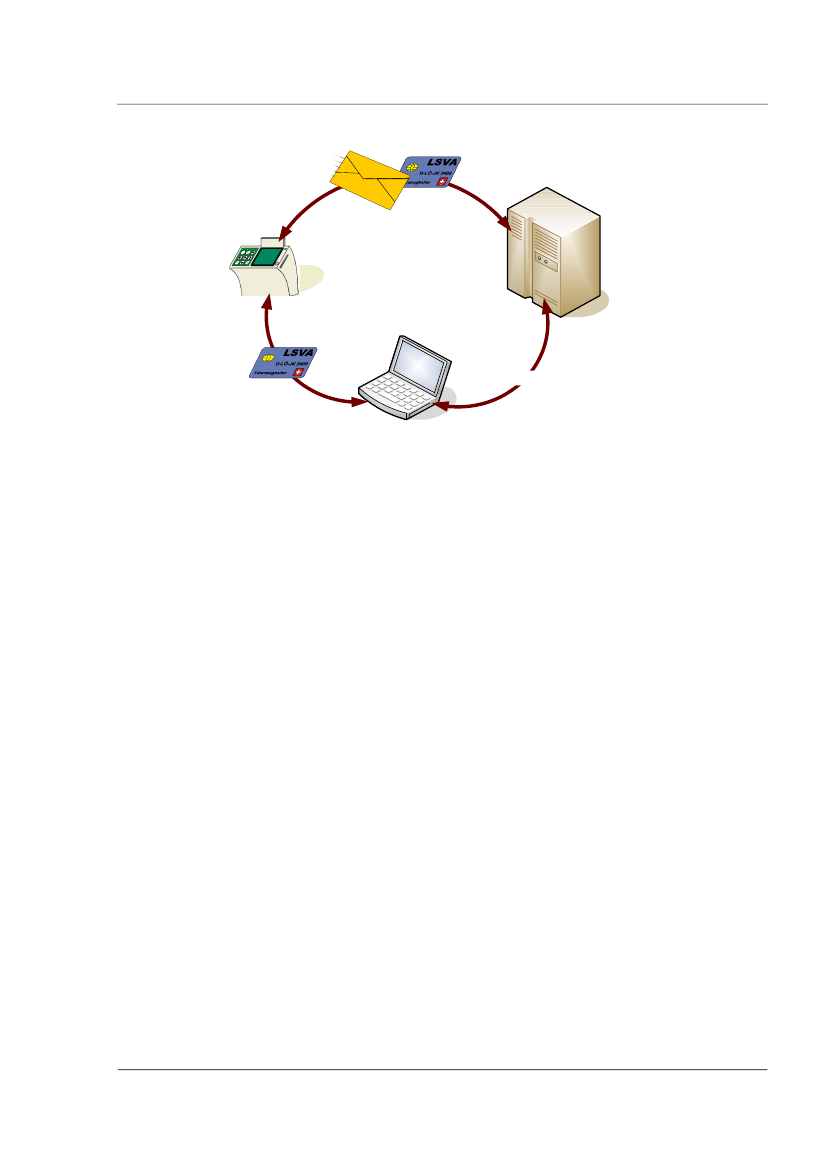
This type of scheme applies to trips made within a defined area – in our case the area within theborders of Denmark. Users of HGV who wish to use their vehicles within Denmark would need to havean On Board Equipment which measures distance or duration of vehicles usage. A key advantage forthis type of pricing mechanism is that there is no evasion of traffic to uncharged parallel roads. Theexperience with the Swiss HGV Fee (LSVA) shows that this kind of area charging allows having asignificant impact on traffic. Main requirement of area charging is the existence of well defined borderswith a limited number of border crossings. Regarding the geographical position of Denmark, there areperfect conditions for such a system.Self-declaration principleDifferent to road network charging schemes like the Austrian and the German one which proceed thecharging of a vehicle automatically without intervention by the user beside the declaration of thevehicle class at the OBU, the charge in an area pricing scheme is assessed by the EFC operator basedon the self-declaration of the vehicles holder. Therefore the vehicle holder is responsible for thedeclaration of the charge. The OBU stores defined events (e.g. start of trip, declaration of trailer,crossing of border etc.) in a log file. This log file is sent by the vehicle holder after the end of thedeclaration period (one month) to the central service via chip card or via internet. In the case of OBUerrors or the break down of the OBU the user has the obligation to enter his mileage/time and hisweight/vehicle class regarding the different events into a formula until the OBU is repaired by acertified garage. Regarding the operating costs the experience of the Swiss LSVA shows thatapproximately 80% of the RUC assessment is done automatically by the central IT system and 20% ofthe RUC assessment has to be proceeded manual.
MTE_Denmark v1.0_final_02jun2006.doc
RappTrans
28
Mailing of the smart card withthe declaration respectivelyapplication dataOBU where themovement data aregenerated and thevehicle configuration isstoredCentral IT system (CIS)where all data areproceeded and storedTransmission of thedeclaration data betweenOBU and vehicle holdersoftware via smart cardTransmission of thedeclaration databetween vehicle holdersoftware and central ITsystem via WANWAN
Reading the declaration data commingfrom the OBU and writing of theapplication data comming from the centralIT system by the vehicle holder softwarefor RUC declaration
Figure 6: Key-functionality of an area charging scheme
3.3.1
Scenario 2A: Distance Based Area Charging
This approach is based on the principle of fee payment for using the road network in a defined areaaccording to the driven distance. That means the every type of road in this area is subject to a fee.With the possibility to have different tariffs for different vehicles on different roads, as was planned inthe UK for the Lorry Road User Charging Programme (LRUC), or with one tariff for a dedicated vehicleon all roads, like the Heavy Goods Vehicle Fee (LSVA) in Switzerland. The first approach has theadvantage for better traffic management by varying the tariff for the road categories. But this has ahuge impact on the technical complexity for implementing such a system. The second approach aimsmore on the general reduction of driven mileage in a defined area by a dedicated vehicle group andthe change of the modal split – e.g. transferring goods from road to rail like with the LSVA inSwitzerland. This approach is technically easier to implement as the first one. But nevertheless thetechnical solution is just a derivation from the overall political and financial objective of the scheme. InScenario 2A there will be no modulation of tariff regarding the type of road and regarding the time ofday.The approach of distance based area charging especially for HGV postulates, if seriously handled, aconnection to the vehicle’s tachograph as the only certified source for distance measurement.Additional sensors can supervise the correctness of the operation of the OBU. The access to the pricedarea must be clearly recognized by the OBU, most suitable by redundant way.Registration, installation and initiation of the OBUIf a vehicle is registered at the Danish vehicle registration the database automatically provides thedata set to the central IT system of the EFC operator. The user receives a confirmation for theinstallation and initiation of the OBU at a certified garage. Foreign users which would like to use theDanish road network should have the possibility to apply for the installation of an OBU.
MTE_Denmark v1.0_final_02jun2006.doc
RappTrans
29
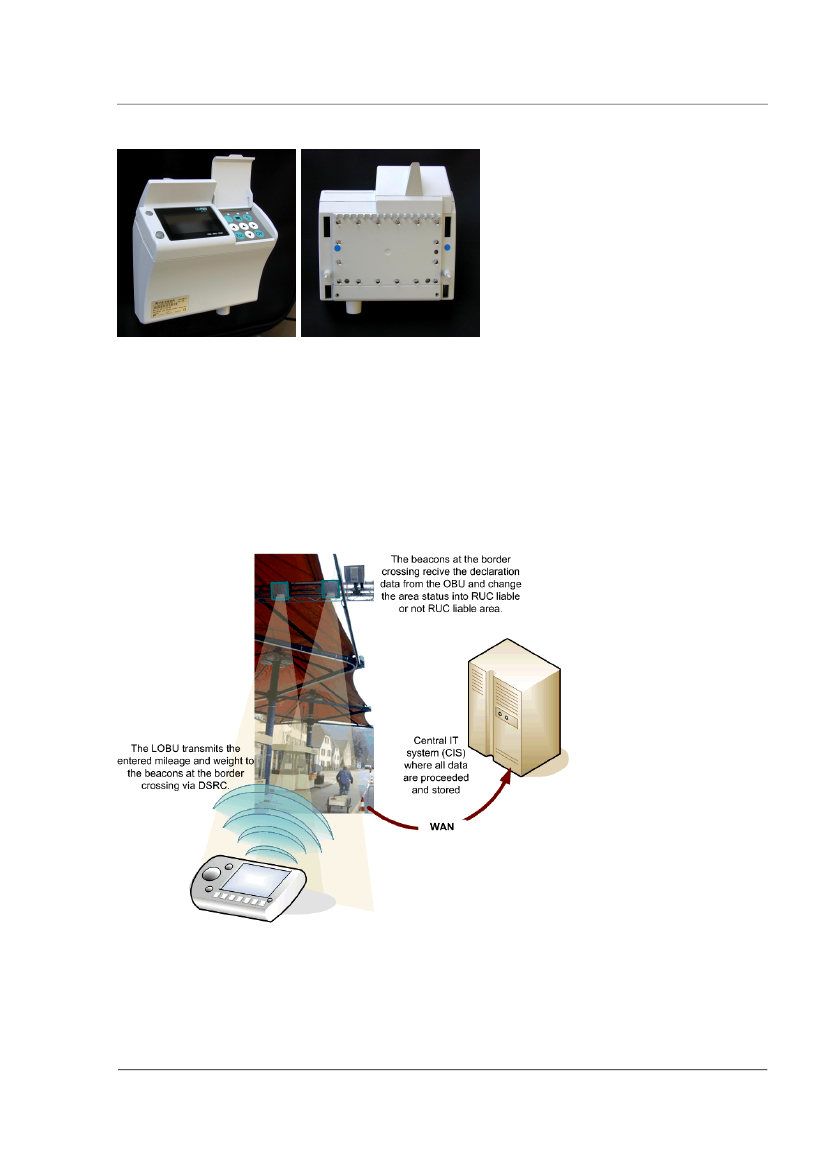
Figure 7: OBU of the Swiss HGV Fee (LSVA)
Registration and OBE of occasional usersVehicles which are registered in another country have to be registered regarding the RUC at the entrypoint to the charging area the first time they enter into Denmark. After registration at a manned POSthey get a personalized LOBU which stores the mileage and weight at the area entry point, themileage and new weight at the moment of change of the vehicle configuration and the mileage andweight at the area exit. All those data are entered by the user/driver at the keyboard of this LOBU.Passing the area boundary the LOBU transmits all those data via DSRC to the central IT system. TheTAG is mounted at the windscreen by the user himself.
Figure 8: Key-functionality of distance based area charging for occasional users using a LOBU
MTE_Denmark v1.0_final_02jun2006.doc
RappTrans
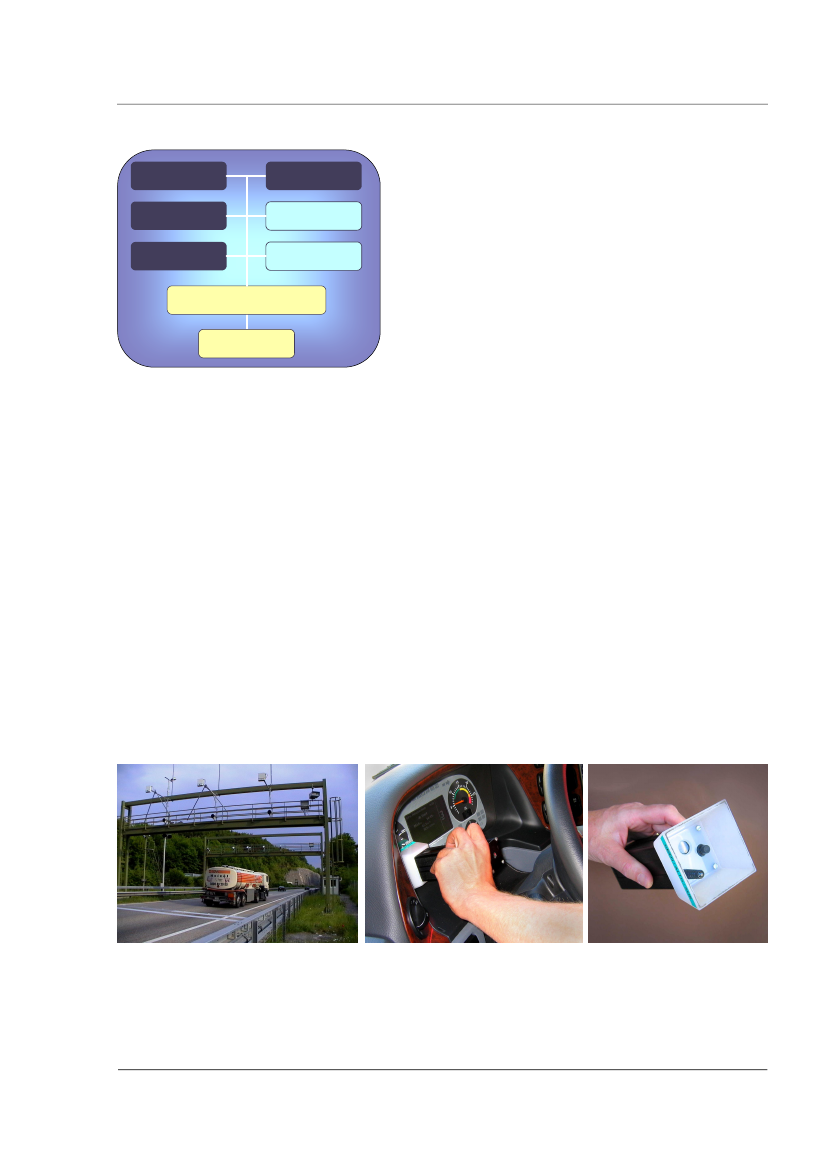
30
DSRC
Optical display
KeypadAcousticalbeeper
ClockDetector ofphys. fixing
Processor / Memory
Battery
Figure 9: Architecture of the LOBU (light OBU)
EnforcementThe self declaration principle requires that the OBU must store the driven distance of the vehicle andthe declaration of a trailer (number of axles of the road train or additional weight). It must be ensuredthat the OBU is in the assigned vehicle and in operation independent of the vehicle infrastructure. Thepermanent enforcement stations are focusing primarily on the foreign vehicles equipped with a LOBUand on the detection of trailers. For vehicles fitted with a permanent OBU, the OBU accomplishes themonitoring tasks autonomously and permanent enforcement stations are less critical. Since in thescenario 2A the vehicle classification is done regarding the registered maximum permissible weight ofthe road train, it is possible to mix the permanent and portable enforcement. For LOBU users thedriven distance is based on tachograph readings and it is entered manually by the driver. The entryand exit mileage is spot-checked at the border on the one hand, on the other hand the driven distancecan be verified to with a distance matrix (entry/exit/passages at enforcement sites). In Switzerlandthere are 18 automatic enforcement stations, 1 mobile non-stop enforcement unit and about 80border crossings for HGV. The permanent enforcement and particularly the portable enforcement of atime based area charging are focussing on two tasks: (1) the detection of not equipped vehicles and(2) the monitoring of correct trailer declaration.
Figure 10: LSVA enforcement station and tachograph camera to check the mileage of vehicles without OBU
MTE_Denmark v1.0_final_02jun2006.doc
RappTrans
31
3.3.2
Scenario 2B: Time Based Area Charging
By definition the movement of vehicles is a function of distance and time. This means that in theorydistance and/or time could be used as the basis of usage based road pricing. Different to the distancebased area charging the time based area charge is charged according to the time period the roadnetwork in a certain area is used. Similar to the cordon pricing like in Stockholm there is a clearlydefined boundary round the RUC liable area. The area will be identical to the territory of Denmark butsmall adjustments of the boundary for practical purposes may be considered in co-operation withneighbouring states.5Instead of charging the entering into this area (cordon pricing) the time ofmovement inside of the boundary is charged.A low-cost TOBU is used containing a conventional 5.8 GHz DSRC tolling tag, a clock, vibration sensorscapable of determining whether the engine is switched on or off, and accelerometers capable ofdetermining whether vehicle is moving or stationary. The TOBU logs the time when the vehicle ismoving inside Denmark. A chip card or a USB stick is used for downloading the log file and the userdeclares his charging parameters by sending in the chip card or via the Internet. With appropriateroadside infrastructure at the area boundary the charging data can also be automatic transmitted tothe Central System when a vehicle is entering and leaving Denmark. The key advantage of the timebased approach of this scenario is that the TOBU is autonomous and can be self-mounted in the sameway as the DSRC tags of Scenario 1b. Therefore, there is no need for an manual declaration schemefor non-equipped users as in scenario 2A. The EFC system is much less complex than with distancebased charging and the capital investment and the operating costs are low due to the absence oflocalisation technology on board or at the roadside excepting the installations at the boundary.Since there is currently no scheme using this technology regarding the requirements of a time basedarea charging, the proposed solution is not validated. Two problems could arise during thedevelopment phase:accuracy of the determination whether the engine is switched on or off by the vibration sensorthe power supply by batteries
Both points would change the concept in its fundamental advantages (e.g. the distribution conceptwith a self mountable TOBU would not be possible with the need of connection with the vehicles powersupply).
5
For the Swiss LSVA such adjustments have been agreed with France, Germany and Liechtenstein.
MTE_Denmark v1.0_final_02jun2006.doc
RappTrans
32
Trailer buttonDetector ofphys. fixingClockMovementsensor(s)
Optical display
Smartcard I/O
DSRC
Processor / Memory
Battery
Figure 11: Architecture of the TOBU for time based area charging
Potential EffectsIf a user is intent on minimising the level of charges incurred in the context of a time-based chargingscheme, then in principle they will need to take the quickest route and adopt the fastest driving stylefor the road conditions encountered on the way. This could encourage driving at excessive speeds,unsafe overtaking manoeuvres, and so on. More helpfully it could also result in drivers diverting orchanging time of travel to avoid delays and congestion. But in practice how likely is it that theparticularly undesirable behaviours will occur? It is a well-established principle that different users /trip purpose combinations lead to very different values of travel time. If the difference in cost of traveltime between different user / trip purpose combinations are genuine, then such an economic incentivetowards unacceptable driving behaviour already exists for some relative to others (most likely at agreater cost per hour than would be considered for road pricing purposes). If this differential economicincentive is material in terms of influencing driving style, then user type / trip purpose combinationsought already to be being highlighted by the road safety community as major influences on accidentrisk or accident severity. Yet this is not the case, suggesting that the primary motivations for suchundesirable driving behaviour today are not primarily about the cost of the journey. Overall thissuggests that charging on the basis of time need not necessarily result in any more undesirable userbehavioural responses than that associated with distance-based charging. This aspect of time-basedcharging would certainly benefit from further research to establish more precisely the degree of anylikely behavioural effects in practice. The effects must not be over-rated because the existing costassociated to HGV travel time (driver’s wage, use cost of lorry, time-based cost of goods transported)will always remain much higher than the supplementary cost of the charge.There could be a positive effect on pollution. However, there studies analysing vehicle emission databased on time are not available. All research on vehicle emission data is distance based.6EnforcementDifferent to the distance based area charging the TOBU of the time based area charging comprise onlya few secondary supervising sensors. Therefore there is the need of a higher enforcement density, butnot as high as for a net charging scheme. The following 4 types of fraud are thinkable in a time basedarea charging scheme:6
no TOBU on boardTravelling 100 km on interurban roads does not pollute the same as travelling 10 times 10 km on urban roads.
Emission correlate better to driving time.
MTE_Denmark v1.0_final_02jun2006.doc
RappTrans
33
not correct mounted TOBU (in case of self mountable TOBU)wrong TOBU in the vehicle
To face these fraud types in a time based area charging scheme the enforcement should provide thefollowing enforcement equipment regarding the necessary enforcement density:a moderate number of permanent enforcement stations strategically located at the maintransit roads and in the agglomeration of big citiesportable enforcement stations variably located in remote geographical parts of the RUC liableareaa relatively large number of mobile enforcement units which are nearly 7/24 in operation
MTE_Denmark v1.0_final_02jun2006.doc
RappTrans
34
4
Volumetrics
Besides the system characteristics described in the preceding chapter, the cost and revenueestimations depend on the quantitative system dimensions.In this chapter, we quote selected figures on Danish HGV traffic, which we use in the following costand revenue estimations. The figures come from the Ministry of Transport and Energy, unless statedotherwise.4.14.1.1Road NetworkNetwork charging
The road network for network charging corresponds to a previous proposal from the Road Directorate,and has been used as an input to the present study. It has the merit of providing a basis for cost andrevenue estimation, and a starting point for discussing the impacts of different scale factors on thefour scenarios.We must underline the preliminary character of these network definitions. Several issues must bestudied in more detail. We present the most important of them in chapter 5.In a memorandum of Vejdirektoratet dated 3rdMay 2004, a first proposal of a main road networkappropriate for HGV charging is laid down.It is considered that the network should include :Roads with significant present HGV trafficRoads which offer alternatives to present itineraries if the present itineraries were subject tochargeRoads with important foreign HGV trafficRoads which connect the parts of the countryRoads which are a functional part of the international road network (European road namingscheme, Trans-European Road Network)Roads which complete the network to a whole connected entity.
The Road Directorate, RD, is responsible for 985 km of motorways and Sund & Bælt for the 7 km longØresundsmotorway i.e. in total 992 km motorways. For the relevant road network approx. 2,500 kmof non-motorways are included, adding to a total of 3,500 km. The Greatbelt and Øresund links arenot a part of the relevant road network, since these links are already subject to fee collection.
MTE_Denmark v1.0_final_02jun2006.doc
RappTrans
35
Figure 12: Map of the relevant road network
4.1.2
Area charging
For area charging, all roads on national territory are included:Motorways (Road Directorate)Øresundsmotorway (Sund & Bælt)Dual carriagewaysOther roads70Total road network729857352872216kmkmkmkmkm))
motorways (total length) 992 km
The Great Belt and the Øresund links (app. 40 km.) are excluded because HGV charging alreadyapplies on these links.
MTE_Denmark v1.0_final_02jun2006.doc
RappTrans
36
The limits of a Danish area charging consist of all terrestrial border crossing points with relevance forheavy vehicles, and all seaports where heavy vehicles are shipped for international trips. These arethe entry and exit points to and from the charging network. If there are international piggy-backrailway terminals for heavy vehicles, they are limits of area charging as well.Our assumptions are:DK – DDK – SSeaports with ferry connections DK – abroad8Terrestrial border crossings77112
Beyond these basic assumptions, a detailed study of an area charging scheme must:Establish the official list of regular entry and points,Define the rules that apply to exceptional entry and exit points.
For practical reasons, a discrepancy between charging area and national territory may be introducedat that stage. For instance, closed seaport facilities might be excluded from the charging area, since itis preferable to install a charging gantry at the entrance of the seaport premise rather than to equipseveral docks.The Swiss HGV charging area differs in many details from the national territory. In each case, bilateralagreements with the neighbouring countries have been concluded. For instance,a German enclave is included in the charging area,the territory of Liechtenstein is included in the charging area,the charging area border points around Geneva and Basel are shifted inwards or outwardswith respect to the geographical border for practical convenience (maximum 1,5 km).
4.1.3
Summary of network lengths
Road networkTotal length [km]
1A3,500
1B3,500
2A70,872
2B70,872
Number of regular entry/exit points
20
20
78
Source http://www.trafikken.dk/hent/A0-Plot_DK_Tungvogn_2005.pdf.Source http://www.trafikken.dk/wimpdoc.asp?page=document&objno=74714. Rødby, Gedser, Rønne, Køge,
København, Helsingør, Grenaa, Frederikshavn, Hirtshals, Hanstholm, Esbjerg, Romø.
MTE_Denmark v1.0_final_02jun2006.doc
RappTrans
37
For comparison, the German LKW-Maut covers 12,000 km of motorways, comprising 5,200 tollsections.The Austrian Go-Maut covers 2,100 km of motorways and double carriageways, 140 km of which aresubject to a higher tariff. The number of toll sections is 800.The Czech Republic plans a first stage of HGV charging on 1,500 km of motorways. In a second stage,it is planned to add 5,000 km of major trunk roads and 1stclass highways.The Swiss HGV charging area comprises 70,000 km of roads, 1,800 km of which are motorways.There are 82 regular border crossing points.
4.24.2.1
Vehicle stockDanish vehicles
The Danish vehicle stock is known through the car register.Lorries above 6 t gross weightArticulated vehicles30,71013,021
Out of the 30,710 lorries above 6 tons, we assume that 28,640 are above 12 tons. This ratio istransposed from the statistics on traffic performance per vehicle weight class. We assume that allarticulated vehicles are above 12 tons. With these assumptions, the total Danish vehicle stock above12 tons is 41,660.4.2.2Foreign vehicles
The relevant figure is the number of different foreign vehicles who use the Danish network within agiven period of time. These vehicles are cost-relevant since they need to be equipped with themandatory OBU when they come into contact with the EFC system for the first time.No regular statistics are available on this subject. The data must be estimated from indirect sources.Sund & Bælt has estimated the number of different foreign HGV passing on Storebælt within a year. Ahigh level of uncertainty rises from the source data as well as from the method of estimation. The bestestimate amounts to 30,000 – 35,000 different foreign trucks a year. This estimate is for Storebæltonly, situated on a East-West route which is not a main transit axis.Estimates provided by the Danish Ministry of Transport9, based on data from a survey of transittraffic10, amount to 141,985 transit trips undertaken by foreign vehicles, and 690,000 import-exporttrips undertaken by foreign vehicles. However, no estimate on the number of different vehicles can bedrawn from these data. The sum (832,000 trips undertaken by foreign vehicles) sets an upper limit.
9
We acknowledge helpful input from Mr. Ole Kveiborg from the Danish Transport Research Institute (DTF).NUTRADA
10
MTE_Denmark v1.0_final_02jun2006.doc
RappTrans
38
In foreign HGV charging schemes, the only stable figure is the yearly number of new registrations. Forcomparison, 90,000 new foreign vehicles are registered in the Swiss LSVA per year. 140,000 new OBUare issued by the Austrian HGV charging scheme per year, this figure is however an upper limit to thenumber of new foreign vehicles since it comprises the renewal of OBU for Austrian lorries.On the basis of these elements, our best guess is 100,000 different foreign vehicles per year, with arenewal rate of 30 % per year. This is an uncertain estimate. Therefore we have conducted asensitivity test (impact of this assumption on system costs), see further below.We assume that the vehicle stock is the same for area charging and network charging. This meansthat all HGV circulating on Danish roads come into contact with the chargeable network of scenarios1A and 1B.
Vehicle stockDanish vehiclesDifferent foreign vehicles per year
1A41,660100,000
1B41,660100,000
2A41,660100,000
2B41,660100,000
4.3
Traffic performance
Depending on the scenario, the revenue-relevant figures are:Total distance travelled (vehicle-kilometres),Total driving time (vehicle-hours).
4.3.1
Traffic counts
Traffic counts are systematically conducted on state and county roads. The counts use a lengthclassification of the vehicle. The statistics assume that length above 5,80 meters corresponds toweight above 3,5 tons. An exact identification of the share of HGV above 12 tons is not possible.In principle, an estimate of the total distance travelled on a given network would be obtained bymultiplying traffic count by link length, for each link. An estimate of the total driving time would beobtained by multiplying the traffic count by the average link travel time, for each link. Unfortunately,such aggregates are not available at present.4.3.2Odometer data
The odometer count is systematically collected from each Danish vehicle, each time it undergoes atechnical verification. The data are statistically aggregated. Their limit is that foreign vehicles are notincluded, and that network categories cannot be distinguished.
MTE_Denmark v1.0_final_02jun2006.doc
RappTrans
39
4.3.3
Estimation of traffic performance
The Danish Ministry of Transport11has provided an estimate of the total distance travelled by HGVabove 12 tons on the network on state roads and former county roads described further above.The estimate is based on HGV odometer readings, and seaport and border crossing entry/exitstatistics collected by Denmarks Statistics, and on own assumptions related to the allocation of trafficto network categories, and to average distances travelled by foreign vehicles.It contains traffic with all vehicles above 6 tons total permissible weight; except the purely nationaltraffic, where the vehicles above 12 tons total weight could be isolated. Since most international trafficis undertaken with vehicles above 12 tons, DTF considers that the error contained in the figures isvery small.The figures refer to year 2003. The annual growth factor is 2%.[1,000 veh-km]DK-DKDK-AbroadAbroad-DKImport-exporttraffic totalTransitTotal
Danish veh.Foreign veh.TotalDanish veh.Foreign veh.Total
1,44301,4432,10402,104
5538938056136
3,500 km network54109387692185Total network (70,000 km)7955134159111270
0323203232
1,5521081,6602,2631432,406
Table 1:Estimate of vehicle-kilometres of HGV >12 t on 3,500-km network (scenarios 1A and 1B)and on the total network (scenarios 2A and 2B).
No available data allow the direct estimation of total driving time by HGV>12t on the Danish roads.We use a simple conversion from total distance to total driving time, based on two assumptions ofaverage speed: 65 km/h for the main road network (motorways and future state roads) where HGVcan be assumed to travel at "overland" speed, 30 km/h for the other roads where HGV are eithertravelling, or accessing facilities and destinations on small roads, or even manoeuvring.The resulting estimate is indicative of the order of magnitude. We will not use it in cost and revenuecalculation, but simply to derive the order of magnitude of the time-based tariff.
11
We acknowledge helpful input from Mr. Ole Kveiborg from the Danish Transport Research Institute (DTF).
MTE_Denmark v1.0_final_02jun2006.doc
RappTrans
40
Road category
3,500 km of motorways and main roadsAll other roadsTotal road network (70,000 km)
Vehicle-kmper year[in millions]1,6607462,406
Averagespeed[in km/h]6530
Vehicle-minutesper year[in millions]1,5301,4903,020
Table 2:Estimate of vehicle-time of HGV >12t on Danish roads.
4.3.4
Summary of traffic performance
Traffic performance per year[million veh-km or million veh-min]Vehicle-km on chargeable roadsVehicle-minutes on chargeable roads
1A1,660
1B1,660
2A2,406
2B
3,020
MTE_Denmark v1.0_final_02jun2006.doc
RappTrans
41
5
Issues Related to the Definition of the Road Network
In this chapter, we take up the most important issues related to the definition of the Road Network, asindicated in section 4.1.1 above.5.1Case of existing charging schemesGerman and Austrian distance-based HGV charging applies toall motorways,while all otherroads are exempt. The same is true for the light-vehicle "vignettes" of Austria, Hungary,Czech Republic, and Switzerland. The latter are not distance based, but lump sum fees for adetermined duration.Swiss distance-based HGV charging applies toall roadson the national territory. Urbancongestion charging schemes apply to all roads within a city cordon. Again, the latter are notdistance based, but lump sum taxes for a determined duration.Conventional motorway tolling in Southern Europe (France, Italy, Spain etc) applies toportions of the motorway network,delimited by toll plazas. Motorway sections in urbanareas are often exempt.Thanks to the exemption of urban areas, space-consuming and flow-hindering toll plazas areavoided where flows are biggest and space is rarest. Many small transactions, correspondingto short motorway sections and to a bad ratio between transaction cost and charging product,are avoided. Credible alternative routes, which are a legal requirement where the charge hasthe status of a fee, must not be offered in urban areas where indeed the priority is to canaliseHGV traffic on motorways.Certain "vignette" schemes apply tomotorways and selected main roads:the BelgianEurovignette for HGV, and the light-vehicle vignettes of Austria and Czech Republic are in thiscase.
Hence, we have only two variants, at present, for strictly distance based schemes: motorways only, orall roads.Germany and the Czech Republic are planning the extension of their HGV charging schemes frommotorways to selected main roads. In neither case, detailed plans are known at present. Germany hasnot announced the date of introduction. The Czech Republic plans to put into service its new HGVcharging scheme in 2007 on motorways, and in 2008 on main roads.5.2Segmenting a non-motorway network
A motorway network is made of identifiable sections. Their number is limited, and each of them has asignificant length (~ 1 to 15 km). The charging principle consists in summing up the each section'selementary charge over all sections that make up the user's itinerary.
MTE_Denmark v1.0_final_02jun2006.doc
RappTrans
42
The extension of a network charge on non-motorways implies decomposing the non-motorwaynetwork into elementary sections, since the charging principle remains the same.
Figure 13 : Illustration of the problem of segmenting a non-motorway road. Since there are minorintersections and private accesses all along the road, none of the sketched segmentations reaches thecharacteristic of the motorway segmentation : namely, that the detection of the vehicle at one point issufficient to conclude that it has travelled over the whole section length.
For each section, two terms must be defined :a section length (which might be a virtual length different from the real length)a measurement criterion which allows to determine that a vehicle has travelled through thesection and may be charged.
The common measurement criterion in DSRC and GPS systems is that a HGV is detected when passingunder the physical or virtual gantry placed on each elementary section. The gantry point stands forthe whole section.While this measurement is fully acceptable on motorways, it is insufficient to guarantee the equity ofcharging off motorways.
MTE_Denmark v1.0_final_02jun2006.doc
RappTrans
43
Figure 14 : Minor intersections on Road 150. Their unavoidable presence is the source of potential issues ofcharging equity.
Where minor intersections and private accesses are present all along the section, the detection of thevehicle at one point is not sufficient to conclude that it has travelled over the whole length of thesection. Partial trips on the section, or even U-turns and repeated back-and-forth movements withinthe same section are possible. If such movements are not identified and charged, then there is a riskthat the charging system will be challenged by certain trades on the grounds of non-equitabletreatment.
Figure 15 : Illustration of an issue of charging equity. Even if Farm 1 and Farm 2 are at practically the samedistance from a given destination, one is systematically charged for the road segment partially used, while theother is systematically exempt.
5.3
Equipping a non-motorway network
The equipment of each elementary section with a gantry is more difficult off motorways than onmotorways.The farther the chargeable road network goes down in the hierarchy of roads, the lesser will be thetraffic covered by a single gantry, and the lesser will be the revenue generated by a single gantry. The"Return on Investment" of a single gantry decreases.5.3.1Case of physical gantries
The number of physical gantries will have a direct impact on the system cost.
MTE_Denmark v1.0_final_02jun2006.doc
RappTrans
44
The unit cost of a gantry is drawn downwards off motorways by the fact that less traffic lanes arepresent. It is pushed upwards by the fact that specific local requirements are present:built environment and availability of space,electrical and communication infrastructure,landscape and architectural requirements,interference with property and use rights.
To illustrate the dependency between the length of a toll section respectively number of gantries andthe system costs we calculated the operating costs of the system regarding an average toll sectionlength of 4.4 km for the whole liable network and the operating costs of the system regarding anaverage toll section length of 4.4 km for motorways and an average toll section length of 2.2 km forthe 2,500 km of the secondary road network.5.3.2Case of virtual gantries
Satellite coverage and backscattering in built-up areas require major attention.On motorways, passage under a virtual gantry is detected when the positioning signal falls on a gantrylocation ; the required precision of the positioning is reduced, since the vehicle is necessarily drivingon the same section for 30 seconds or more. Situations where two highways are parallel and closelyadjacent can be excluded.Off motorways, such favourable conditions cannot be taken for granted. The metrological tolerancemay have to be reduced in order to achieve the required security of transaction.
Figure 16 : A situation where accurate positioning is needed : parallel adjacent toll sections. The metrologicaltolerance may have to be reduced in order to achieve the required security of transaction.
Identical movements at two distinct moments must induce the same tax. For example, an irregularGPS signal at the gantry point may not induce that vehicle A, who would pass at a moment withstrong GPS signal, is detected and debited while vehicle B, who would pass at a moment with weakGPS signal, is not detected. If vehicle A would leave the chargeable road and enter a private domain
MTE_Denmark v1.0_final_02jun2006.doc
RappTrans
45
just 20 meters before the gantry point, and would do so every day, it would either have to be debitedeach time, or never.
Figure 17 : Another situation where accurate positioning is needed in order to achieve the required security oftransaction. The trip to or from the farm must either give rise to a transaction at each time, or never.
5.4
Identifying the chargeable network
The road user must understand where he is subject to charging and where he is not.Since paying the charge is an obligation of road traffic legislation to the same virtue as, say, observingspeed and weight limits, one could argue that it should be represented by road traffic signs whereverit applies. In other words, specific road traffic sings would have to be installed at every point where auser can enter or exit the obligation to pay.In practice, HGV charging schemes cope easily with this requirement, since the entry and exit pointsof the obligation to pay coincide with national borders (for area charging) or with motorway junctions(for network charging). In both cases, corresponding traffic signals at the roadside already exist. Theobligation to pay does not have to be communicated specifically.However, if the charging network is a new artificial entity, heterogeneous with respect to existing roadcategories and unfamiliar to road users, this issue requires further attention. It might give rise tospecific operational tasks and to specific costs.Similar considerations could be developed for representations on road maps.
Figure 18 : Fictitious road traffic signs for marking where the user enters and exits the obligation to pay.Existing charging schemes feature no such signs, since small adaptations to motorway signage (for networkcharging) or to border crossing signage (for area charging) are sufficient to communicate the obligation topay.
MTE_Denmark v1.0_final_02jun2006.doc
RappTrans
46
Naming and numbering of the road charging segments is a further aspect. On motorways, the sectionlimits are officially named or numbered junctions, and the names or numbers are known to roadusers.Off motorways, no equivalent existing naming scheme is available. The physical reality of the sectionlimits will be very heterogeneous. The section limits could be major crossings in town centres oroutside, with traffic lights or without, of large or small dimensions ; it could also be exterior limits oftowns or industrial areas, etc. A specific naming scheme may have to be introduced and managed.5.5Detour traffic
Generation of detour traffic is the major drawback of a charging scheme limited to motorways. Detourtraffic is undesirable under every aspect, given that motorways minimize all negative impacts of HGVtraffic on the environment (traffic hindrance, infrastructure damage, noise, air pollution, accidents).The risk of detour traffic is particularly high where main roads have been raised to high standards inthe past (2x2 lanes, few level crossings).Detour traffic must be tolerated to a certain extent, if the road user charge is a fee rather than a tax.A fee must correspond to a service and be in proportion to the service; there must be alternatives tousing the service. In case of a tax, no detour traffic has to be tolerated.Recently introduced HGV charging schemes give rise to several observations:After the introduction of the German LKW-Maut, traffic from motorways to main roads(“Bundesstrassen”) have been observed. For instance, the international south-north traffic inthe upper Rhine valley has shifted partly from the German A5 motorway to the toll-freeFrench motorway A35. At the Swiss border at Basel, border crossings to Germany havediminished by 10%, those to France have increased by 10%. In the Strasbourg area, north-south HGV traffic has increased by 20%.Two types of measures are at present discussed in Germany: (1) the extension of thecharging scheme to parallel roads, (2) ban of HGV transit traffic on critical sections of mainroads. However, the problem is never definitively solved by such measures, but shifteddownwards in road hierarchy and in spatial scale.In Austria, the detour problem has also been observed, although on a less critical scale than inGermany due to the structure of the Austrian motorway network, i.e. more significantdifference of travel speed between motorways and main roads.In Switzerland, there is no difference between charged and uncharged network links. After theintroduction of area charging, shorter routes in terms of distance have become moreattractive as compared to shorter routes in terms of time. However, only exceptionalsituations have produced a measurable effect.
Estimating the detour traffic requires a traffic assignment model which takes the price elasticity ofHGV route choice into account. No such model has been used in the present study. In chapter 6.4,assumptions on a very high level are introduced.
MTE_Denmark v1.0_final_02jun2006.doc
RappTrans
47
Figure 19: Detour Traffic in SW-Germany after implementation of LKW-Maut (dark segments show HGVincrease)
5.6
Further issues
The work of enforcement agents is eased when the charging network is of simple definition.If HGV charging applies to motorways only, then there will be vehicles, agricultural in particular, whichwill never be concerned. If main roads are included, these cases will be less frequent. For example, inthe actual Walloon Eurovignette scheme, where some main roads are subject to charging, all vehiclesregistered in the Walloon region are subject to the taxex officio.5.7Summary
As stated in paragraph 4.1.1, the present study uses a preliminary orientation for the networkdefinition, provided by the Road Directorate. The inclusion of other roads than motorways into thenetwork charging scenarios raises delicate issues which do not have proven solutions to this day, andwhich imply important reservations on their feasibility.Regardless of these reservations, we leave this subject for further detailed studies. For our presentpurpose, we will continue to work with the assumptions presented in chapter 4.
MTE_Denmark v1.0_final_02jun2006.doc
RappTrans
48
66.16.1.1
RevenuesApproach to Revenue EstimationPhilosophy
The revenue to be raised by the HGV charging scheme is intended to account for a determined shareof the external cost of road transport in Denmark.This philosophy is in accordance with the approach of the Eurovignette directive 1999/62/EC and itsamendments, which aims at a fair allocation of road transport costs to transport operators.12Important debate has accompanied the Eurovignette directive and its modification agreed at the endof 2005. Matters of debate were the way of computing the infrastructure costs, and the issue ofincluding or not, and how to include, external costs not related to infrastructure.Within the context of this European issue, Denmark is establishing its methodology for computing thecosts of road transport, and elaborating its relevant cost figures.It is out of the scope of the present study to discuss these matters. In accordance with the DanishMinistry of Transport, we refer to chapter 7 (Infrastructure) of a recent report on external costs oftransport in Denmark, issued for the Ministry by COWI13.For the present study, we take the infrastructure cost allocated to HGV traffic, as estimated by theCOWI report, as the maximal potential revenue for the HGV charging scheme. It is for the DanishMinistry of Transport in accordance with the Ministry of Finance to identify additional infrastructurecost elements that could be included in the tariff calculation according to the Eurovignette Directive1999/62/EC.
6.1.2
Method
We assimilate the estimated infrastructure cost allocated to HGV traffic by the COWI report (seefigures below) to themaximal revenueof the HGV charging scheme.By restricting the maximal potential revenue, for each scenario, to the vehicles concerned and to theroad network concerned, we determine apotential target revenuefor each scenario.For each scenario, from the target revenue, we estimate an average tariff by means of an estimate ofthe charging basis. These figures are not used further in the subsequent estimations, but they giveadditional substance to the scenarios, and a further indication on their plausibility.In accordance with the Danish Ministry of Transport, we set the target revenue for the area chargingscenarios to less than the potential maximum. This adaptation represents a working hypothesis whichholds the place of the future political decision on the level of the charge. Also, we assume that thedistance based HGV charging scheme is the only fiscal charge lying on the transport operators on the12
Directive 2006/…/EC amending Directive 1999/62/EC on the charging of heavy goods vehicles for the use ofExternal Costs of Transport : 3rd Report – Total external costs of road and rail transport in Denmark. Danish
certain infrastructures, PE-CONS 3682/05 (6 March 2006)13
Ministry of Transport, July 2004.
MTE_Denmark v1.0_final_02jun2006.doc
RappTrans
49
grounds of external costs of road infrastructure, for otherwise the target revenue should be reducedfurther in order to avoid that the transport operators be charged twice for the same purpose. Throughthese steps, we determine the supposedtarget revenuefor each scenario.At this point, we proceed to corrections of this figure, in order to arrive to theeffective revenueofthe scheme. These corrections account for traffic evasion, for non-payment of due charges, and forrevenue of enforced charges and penalties. The corrections are scenario-dependent.
Figure 20: Method of revenue estimation
6.1.3
Road infrastructure cost allocated to HGV traffic by the COWI report
The report takes into account external costs in five areas: air quality, climate change, noise,accidents, and road infrastructure.On road infrastructure, the report states costs in five categories of expenditure :AdministrationWinter maintenanceOther maintenanceSurface renewalNew construction.
For each category, it states the costs incurred on three administrative levels :nationalregionallocal.
MTE_Denmark v1.0_final_02jun2006.doc
RappTrans
50
For allocating these costs to vehicle categories, a matrix of cost allocation factors is applied. Thefactors depend on :Category of expenditure (listed above),Administrative level (listed above),Four performance types :Fixed costsVehicle-kilometre related costsVehicle-length-kilometre related costsStandard-axle weight factor kilometre costs,Thevehicle categories are :CarsVans (< 6 tons)HGV (> 6 tons)Busses.
For the vehicle categoryHGV,the main findings are :Total infrastructure cost allocated to HGV traffic (> 6 tons) is2'733 million DKKper year.This represents15 %of the total infrastructure cost.The average infrastructure cost for a HGV vehicle-kilometre is1.79 DKK.
All costs are given for year 2000.
6.26.2.1
Cost allocation for tariff calculationRestriction to HGV > 12 tons
As the starting point for determining the target revenue, we take the total infrastructure cost allocatedto HGV traffic according to the COWI report (2'733 million DKK per year). This figure refers to all HGVabove 6 tons. It has to be restricted to the proportion corresponding to HGV above 12 tons.A an approximation, we estimate the proportion to be equal to the proportion of vehicle-kilometres.According to data from Vejdirektoratet for 2002 :HGV > 6 t :HGV > 12 t :1'840 million vehicle-km/year1'660 million vehicle-km/year= 90 %.
This restriction applies to all scenarios in the same way.
Restriction to HGV > 12t% of HGV infrastructure costs allocated toHGV > 12t
1A90%
1B90%
2A90%
2B90%
MTE_Denmark v1.0_final_02jun2006.doc
RappTrans
51
6.2.2
Restriction to chargeable network (scenarios 1A and 1B)
The cost estimation quoted above refers to the complete Danish road network. For scenarios 1A and1B (network charging), it has to be restricted to the chargeable network (trunk network of 3'500 km).A separate cost estimation for this network is not available.Since the 3'500-km trunk network is entirely included in the 11'626 km of roads administered onnational and county level (at present), it could be argued that an upper limit could be extracted fromthe decomposition of infrastructure costs according to the administrative levels, which is available inthe COWI report. National and county levels represent 49,2% of the costs. This upper limit should befurther reduced to the share which effectively corresponds to the 3'500 km of trunk network, thelength ratio being 3.3 (3'500km out of 11'626 km).However, this procedure neglects that HGV traffic is concentrated on the trunk network, where itcontributes strongly to surface renewal and road capital costs, which in turn are strong components ofinfrastructure costs on the national and regional levels. A proper estimate would require, firstly, toisolate the total costs incurred on the trunk network, and secondly, to proceed to a separateapplication of a cost allocation model between vehicle categories (as the one presented in the COWIreport).Lacking a better figure, we estimate that the trunk network accounts for 40% of the infrastructurecosts allocated to HGV traffic.
Restriction to chargeable network% of HGV infrastructure costs allocated tochargeable network
1A40%
1B40%
2A100%
2B100%
6.2.3
Exclusion of other charges levied on the ground of external costs
Any revenue generated by any other taxes and duties than distance based HGV charging, to which thetransport operators would be subject on the grounds of external costs of road infrastructureinparallel to the distance based charging scheme,should be subtracted from the target revenue.Otherwise, the transport operators would be charged twice for the same purpose.For example, this might be the case of fuel excise duties. It would be the case of the currentEurovignette if this scheme would not be abolished by the new distance based scheme.
6.2.4
Inclusion of costs of charging system
According to the Eurovignette Directive, the following costs can be included in the basis for thecharging revenue:the costs of estabilishing and implementing the charging systemthe costs of operating, administering and enforcing the chaging system
MTE_Denmark v1.0_final_02jun2006.doc
RappTrans
52
6.2.5
Tariff calculation
[million DKK/year]Infrastructure cost allocated to HGV > 6 tRestriction to HGV > 12 tRestriction to chargeable networkCosts of the charging systemTotal allocated costs = Potential targetrevenueCharging basis (see paragraph 4.3)
1A2'7332'4609844861'4701'660millionveh-km0,89 DKK/veh-km
1B2'7332'4609845341'5171'660millionveh-km0,91 DKK/veh-km
2A2'7332'4602'4603992'8582,406millionveh-km1,19 DKK/veh-km
2B2'7332'4602'4603282'7873'020millionveh-minutes0,92 DKK/veh-minute
Potential tariff
The tariff for network charging is low in comparison to other HGV charging schemes in Europe. Thetrunk network is appropriate for HGV traffic and produces a high share of the national HGV trafficperformance. Hence it is an economic infrastructure. Charged "at cost" to the road users, it results ina low tariff.The tariff for area charging is higher because less "productive" roads are included. The km-tariff isrelatively high, comparable to the future German tariff if the planned increase takes place. It remainslower than the Austrian tariff, Austria having justified exceptionally high infrastructure costs andhaving chosen to raise as high a revenue as possible from the HGV charge.The time-based tariff does not have any direct equivalent. Comparisons could be drawn from the one-day tariff of the Eurovignette directive: 8 EUR = 60 DKK in 1999/62/CE and 11 EUR = 82 DKK in theamendment voted by the European Parliament end of 2005. With regard to the average tariff derivedhere, this is roughly equivalent to 75 and 100 minutes respectively.
6.3
Limitation of tariff to trunk network level
In accordance with the Danish Ministry of Transport, we limit in the present study the tariff for areacharging to the tariff corresponding to the Eurovignette approach on the trunk network. In this way,we ensure for all four scenarios that the Eurovignette framework, which applies to the TEN roads, isrespected on the TEN roads. In principle, Denmark could use any other non-discriminativemethodology for determining the tariff on the remaining network.
MTE_Denmark v1.0_final_02jun2006.doc
RappTrans
53
[million DKK/year]Potential target revenue (from 6.2.5)Charging basis (from 4.3.4)
1A1'4701,660millionveh-km0,89 DKK/veh-km
1B1'5171,660millionveh-km0,91 DKK/veh-km
2A2'8582,406millionveh-km1,19 DKK/veh-km0,89 DKK/veh-km
2B2'7873,020millionveh-minutes0,92 DKK/veh-minute0,69 DKK/veh-minute2'074
Potential tariff (from 6.2.5)Average tariffLimited target revenue
1'470
1'517
2'126
6.4
Effective charging revenue
We estimate an effective charging revenue by applying three types of adjustments to the targetrevenue.6.4.1Traffic evasion
Traffic shifts are dependent on the relative generalised travel cost of alternative routes, as perceivedby the driver (or in certain cases by the dispatcher).Generalised travel costs are composed of:Travel timeDistance-related HGV costs (fuel and other operating costs)Tolls (amount of toll and effort related to registeration and payment)Costs related to unreliable service (unpredictable congestion, etc.).
In the absence of a traffic assignment model able to reproduce the route choices including these costelements, we estimate only a global percentage of traffic shift from the chargeable network to thenon-chargeable network for scenarios 1A and 1B. Assuming that the increase of the HGV travel costinduced by the charge is 10%, we estimate the shift is in the order of 5%, corresponding to a priceelasticity of 0.5.For area charging, there is an increase of travel costs for all the alternative routes. At the present levelof the study, the effect is negligible.
Traffic evasion% of traffic lost through traffic evasion(detour traffic)
1A5%
1B5%
2A0%
2B0%
MTE_Denmark v1.0_final_02jun2006.doc
RappTrans
54
6.4.2
Unpaid charges
Non-payment includes real fraud as well as irregular situations of any kind, where users justifythemselves through practical problems, misunderstandings, special circumstances and any kind ofreasons. The limit between these categories is blurred, and non-payers cannot generally be suspectedto act in bad faith. Surcharge taxes and administrative penalty schemes are a means of handling userswho are in this ambiguity, comparable to common practice in public transport. Penal action should bereserved to qualified fraud (repeated, intentional, manipulation of equipment).The level of non-payment depends on:The level of the charge (kilometre price higher for area charging than for network charging)The level of surcharge taxes and penalties for non-payment (same for all scenarios)The risk of fraud being detected (higher for area charging)The success rate of enforcement (same for all scenarios)The ease of paying regularly (same for all scenarios)The acceptance of the scheme (same for all scenarios)The share of occasional users (same for all scenarios).
At the present level of the study, we assume that the global factor is the same for all scenarios.Unpaid chargesDanish vehiclesForeign vehicles% of due charges which are not paid (allvehicles)1A2%5%3%1B2%5%3%2A2%5%3%2B2%5%3%
6.4.3
Enforced charges and penalties
The collection of penalty payments or surcharge taxes gives rise to a revenue complement. This doesnot include, in our revenue estimation, the costs of collecting these payments. The collection costs aretaken into account, along with all other enforcement costs, in the cost estimation (see chapter 7).The direct balance between revenue of penalty payments and enforcement costs is generally negative,because detecting the offence and processing the penalty is costly. Enforcement must primarily aim atgetting non-payers to become future regular payers; since an additional regular payer generallygenerates a better cost-revenue ratio than an additional penalty payer. Also, public acceptance of afee collection scheme suffers if the users perceive the penalty payments as a means of maximizingrevenue, be that perception justified or not.In other words, EFC operator and enforcement authority must strive not to collect more penalties, butto minimize the level of non-payers.
MTE_Denmark v1.0_final_02jun2006.doc
RappTrans
55
We estimate the monetary product of enforced charges and penalties as the combined result of thelevel of detection of non-paid charges, of the facility with which the enforcement body can get hold ofthe non-payers and execute the sanction (“success rate” of enforcement), and of the amount of thepenalty.Experience shows that the success rate of enforcement is close to 100% for regular users, while thereare numerous causes of incomplete pursuit of occasional users, in particular foreign users.We assume that a penalty charge is applied, equivalent to 200% markup of the regular charge whichhas not been paid.
Enforced charges and penalties% of unpaid charges (see 6.4.2)- Danish vehicles- Foreign vehiclesAll vehicles% of successfully enforced charges- Danish vehicles (success rate 100%)- Foreign vehicles (success rate 50%)All vehiclesAverage height of penalty(Ratio between enforced charge pluspenalty / regular charge)
1A
1B
2A
2B
2%5%3%
2%5%3%
2%5%3%
2%5%3%
2%2,5%2%200%
2%2,5%2%200%
2%2,5%2%200%
2%2,5%2%200%
MTE_Denmark v1.0_final_02jun2006.doc
RappTrans
56
6.5
Revenues
Scenario 1Ain thousand DKK per year
Scenario 1B
Scenario 2A
Scenario 2B
External data (COWI 3rd Report)Infrastructure cost allocated to HGV>6tScenario characteristics% of infrastructure cost allocated to HGV>12t% of infrastructure cost allocated to chargeablenetworkCharging basis in million veh-kmCharging basis in million veh-hoursAssumptions for revenue estimation% of traffic lost through evasion% of unpaid charges% of successfully enforced chargespenalty markupCalculationPotential revenue HGV>6tinfrastructure cost assigned to HGV > 12tinfrastructure cost HGV>12 t assigned tochargeable networkcosts of HGV charging systemtotal assignable costspotential tariff in DKK/veh-kmpotential tariff in DKK/veh-houraverage tariff in DKK/veh-kmaverage tariff in DKK/veh-hourRevenue before adjustments based on averagetariffLoss through traffic evasionadjusted revenue 1Loss through unpaid chargesadjusted revenue 2Revenue of enforced charges and penalties
2'733'000
90%40%1'660
90%40%1'660
90%100%2'402
90%100%50.2
5%3%2%200%
5%3%2%200%
0%3%2%200%
0%3%2%200%
2'733'0002'459'700983'880485'6781'469'5580.89
2'733'0002'459'700983'880533'6031'517'4830.91
2'733'0002'459'7002'459'700398'5162'858'2161.19
2'733'0002'459'7002'459'700327'5632'787'263
55.520.890.910.8941.311'469'55873'4781'396'08041'8821'354'19855'8431'517'48375'8741'441'60943'2481'398'36157'6642'126'43302'126'43363'7932'062'64085'0572'073'64602'073'64662'2092'011'43682'946
Effective Charging Revenuein million DKK per year
1'410
1'456
2'148
2'094
MTE_Denmark v1.0_final_02jun2006.doc
RappTrans
57
77.1.1
CostsAssumptions
The cost estimations are based on the following general assumptions:41,660 Danish vehicles above 12 t maximum permissible weight per year100,000 foreign vehicles above 12 t maximum permissible weight per yearon average: Every 12thtoll section is an enforcement section
Scenario-specific assumptions:Scenario 1A and 1B:1,571 toll sections430 points of sales20% OBU leakage per year for DSRC-OBU and GPS-OBU
Scenario 2A:18 system entry points (border crossing stations)90 points of sales6% OBU replacement per year of fixed mounted OBU30% OBU leakage per year of LOBU
Scenario 2B:18 system entry points (border crossing stations)90 points of sales20% OBU leakage per year for time based OBU
For all scenarios, it is assumed that all vehicles registered in Denmark and all foreign HGV travelling inDenmark must be equipped with an OBU. Potential cost savings from interoperability are not includedin the estimates.It is assumed that the EFC system is procured under a BOT arrangement. The capital investmentincludes the whole costs of the tender (12 months) and the implementation (18 months) phase as wellas the costs for external consulting within the first 6 months after start of operation.The investment and implementation costs include:Charging serviceson board equipment (OBU, LOBU)roadside equipment (gantries and beacons)
MTE_Denmark v1.0_final_02jun2006.doc
RappTrans
58
integration of existing toll stations
Enforcement servicesfixed roadside enforcement stationsportable enforcement stationsmobile enforcement unitsbeacon and enforcement ITCentral servicespoints of sales, including POS softwarecentral IT systemcentral back officetest equipmenttraining equipmentpre sale activitiesmarketing and information incl. call centerproject management
The operating costs include:human resources costs Management Authorityhuman resources costs Service Providernew on board equipment (OBE leackage and system growth)maintenance costs (on board equipment, road side equipment, enforcment equipment, POS)IT maintenance and support, programme licencesmaintenance of test and training equipment
The costs per year include the operating costs plus the amortisation of the investments. Theamortisation costs are based on the estimated lifetime of the components. No interests or otherfinancing costs are included.
7.2
Capital Investment (Tender and Implementation Phase)
The capital investment includes the whole costs of the tender (12 months) and the implementation(18 months) phase as well as the costs for external consulting within the first 6 moth after start ofoperation.The following table shows the total capital investment regarding the different scenarios:
MTE_Denmark v1.0_final_02jun2006.doc
RappTrans
59
Scenario 1Ain thousand DKK
Scenario 1Bin thousand DKK
Scenario 2Ain thousand DKK
Scenario 2Bin thousand DKK
Total capital investmentin million DKKin million EUR
1.077144174
2.698360436
72396117
61882100
in % (Scenario 2B = 100%)
7.2.1
Charging Services
Scenario 1Ain thousand DKK
Scenario 1Bin thousand DKK
Scenario 2Ain thousand DKK
Scenario 2Bin thousand DKK
Charging ServicesTotal on board equipmentTotal roadside equipmentTotal existing toll stationsTotal charging services
265.61385.2970350.910
26.5611.924.04901.950.610
194.34843.8154.038242.201
37.18643.8154.03885.039
7.2.2
Enforcement Services
Scenario 1Ain thousand DKK
Scenario 1Bin thousand DKK
Scenario 2Ain thousand DKK
Scenario 2Bin thousand DKK
Enforcement ServicesTotal roadside equipmentTotal mobile Enforcement unitsTotal beacon & enforcement ITTotal enforcement services
232.03332.17527.197291.405
229.67032.17527.197289.043
033.97526.43860.413
68.43132.17526.891127.497
MTE_Denmark v1.0_final_02jun2006.doc
RappTrans
60
7.2.3
Central Services
Scenario 1Ain thousand DKK
Scenario 1Bin thousand DKK
Scenario 2Ain thousand DKK
Scenario 2Bin thousand DKK
Central ServicesTotal point of salesTotal central IT systemTotal Test equipmentTotal training equipmentTotal pre saleTotal marketing & informationTotal project managementTotal central services
50.513149.98524.66011.1381.01327.750169.662434.720
84.263142.42522.97310.9691.12227.750169.232458.732
33.698153.73528.53811.6511.01327.750163.856420.239
24.135153.73524.17310.9581.16927.750163.856405.775
7.3
Operating Costs (Operational Phase)
The operating costs include the depreciation of the different system components.Scenario 1Ain thousand DKK
Scenario 1Bin thousand DKK
Scenario 2Ain thousand DKK
Scenario 2Bin thousand DKK
Total operating costsin million DKK per yearin million EUR per year
48665148
53571163
39953122
32844100
in % (Scenario 2B = 100%)
The system costs for hauliers additional to the RUC are only in scenario 2A remarkable. In thisscenario there are costs to calculate for mounting and installation which takes nearly 2 hours and inaverage 1 time per year OBU maintenance. That means the service fees for the certified fitter and themissing material gain for the 2 hours per vehicle life cycle and 1 hour maintenance per year.
7.3.1
Charging Services
Scenario 1Ain thousand DKK
Scenario 1Bin thousand DKK
Scenario 2Ain thousand DKK
Scenario 2Bin thousand DKK
Charging ServicesTotal OBU costsTotal roadside equipmentTotal HR costsTotal charging services
126.1667.7162.625136.507
12.617182.8542.625198.095
55.6034.8073.90064.310
17.6634.8073.90026.370
MTE_Denmark v1.0_final_02jun2006.doc
RappTrans
61
7.3.2
Enforcement Services
Scenario 1Ain thousand DKK
Scenario 1Bin thousand DKK
Scenario 2Ain thousand DKK
Scenario 2Bin thousand DKK
Enforcement ServicesTotal permanent enforcementTotal portable enforcementTotal mobile Enforcement unitsTotal beacon & enforcement ITTotal HR costsTotal enforcement services
31.3044.4558.9895.508131.700181.956
31.3043.9838.9895.508131.700181.484
009.4395.288123.000137.726
7.4673.9608.9895.417128.700154.532
7.3.3
Central Services
Scenario 1Ain thousand DKK
Scenario 1Bin thousand DKK
Scenario 2Ain thousand DKK
Scenario 2Bin thousand DKK
Central ServicesTotal point of salesTotal central IT systemTotal Test equipmentTotal training equipmentTotal general costsTotal HR costsTotal central services
10.66529.5352.2921.96473.01249.875167.343
19.02828.4851.8281.91853.88849.875155.021
7.62430.2852.9012.39999.64753.625196.480
5.25530.2852.0731.57153.88853.625146.696
MTE_Denmark v1.0_final_02jun2006.doc
RappTrans
62
7.47.4.1
Cost SensitivitiesCost sensitivity of number of tolling segments
In order to show the cost impact of the density of charging sections the number of segments on thenon-motorway roads were doubled.
1Ain million DKK per yearGantry density (motorway 4.4 km & roads4.4 km)Gantry density (motorway 4.4 km & roads2.2 km)
1B
486489
535666
Cost sensitivity of the number of toll sections
700
Gantry density (motorway4.4 km & roads 4.4 km)Gantry density (motorway4.4 km & roads 2.2 km)
600
500in million DKK
400
300
200
100
01AScenarios1B
The cost estimates are based on the assumption that the average segment length on the non-motorway network is 4.5. km similar to the motorway network. If the number of segments on thenon-motorway network is doubled, the total annual cost of Scenario 1A remain approximately thesame whereas they increase in Scenario 1B by 24%.
MTE_Denmark v1.0_final_02jun2006.doc
RappTrans
63
7.4.2
Cost sensitivity of the number of permanent enforcement stations
1Ain million DKK per year8% of the toll sections are equiped withpermanent enforcement stations15% of the toll sections are equiped withpermanent enforcement stations
1B
486515
535558
Cost sensitivity of density of permanent enforcement stations
560540in million DKK5205004804604401AScenarios1B
8% of the toll sections areequiped with permanentenforcement stations15% of the toll sections areequiped with permanentenforcement stations
If the density of enforcement stations is increased from 1 enforcement gantry out of 12 gantries to 1enforcement gantry out of 7 gantries the total annual costs increase for Scenario 1A by 6% and forScenario 1B by 4%.7.4.3Cost sensitivity of OBE leakage - Cost Effect of EETS
OBE leakage is the percentage of new OBU, LOBU or TOBU that must be issued every year tooccasional users. The leakage percentages are scenario dependent and in scenario 2A are different forthe built-in OBU for regular users and LOBU for occasional users. The percentages further depend onthe expectations of interoperability between the Danish HGV charging scheme and the foreingschemes. The following figures and charts show three levels of interoperability:Low interoperability and high proportion of occasional international transit: high leakagepercentages according to the experiences with the existing Austrian and Swiss schemes thatoffer a very limited interoperability (only unilateral interoperability from Switzerland to Austria,i.e. a Swiss OBU can be used fro the Austrian charge).Medium interoperability (NORITS) and smaller proportion of non-regular international transit:medium leakage percentagesHigh interoperability (EETS implemented): low leakage percentages.
The cost estimates in Chapter 7 are based on the medium leakage percentages.
MTE_Denmark v1.0_final_02jun2006.doc
RappTrans
64
Sensitivity of OBU costs:
1AGNSSin million DKK per yearEstimation OBU leakage regarding Austriaand Switzerland (35%, 35%, 6%, 45%, 35%)Estimation OBU leakage regarding thesituation of trafic in Denmark (low transit)(20%, 20%, 6%, 30%, 20%)Optimistic estimation OBU leakage(15%, 15%, 6%, 20%, 15%)
1BDSRC
2AOBULOBU
2BTOBU
935340
954
101010
1075
1376
OBU leakage1009080in million DKK706050403020100GNSS1ADSRC1BOBU2AScenariosLOBUTOBU2BEstimation OBU leakage regarding Austriaand Sw itzerland (35%, 35%, 6%, 45%,35%)Estimation OBU leakage regarding thesituation of trafic in Denmark (low transit)(20%, 20%, 6%, 30%, 20%)Optimistic estimation OBU leakage(15%, 15%, 6%, 20%, 15%)
For Scenario 2A, the leakage percentages are different for the permanent OBU, where onlyreplacements of broken OBU or OBU for new vehicles must be considered, and LOBU, where all HGVthat come for the first time to Denmark must be equipped.
MTE_Denmark v1.0_final_02jun2006.doc
RappTrans
65
Sensitivity of total annual costs:
1Ain million DKK per yearEstimation OBU leakage regarding Austriaand Switzerland (35%, 35%, 6%, 45%, 35%)Estimation OBU leakage regarding thesituation of trafic in Denmark (low transit)(20%, 20%, 6%, 30%, 20%)Optimistic estimation OBU leakage(15%, 15%, 6%, 20%, 15%)
1B
2A
2B
526486472
539535533
402399396
333328326
Cost sensitivity of OBU leakage (total costs)60050040030020010001A1B2A2BScenariosEstimation OBU leakage regardingthe situation of trafic in Denmark(low transit)(20%, 20%, 6%, 30%, 20%)Optimistic estimation OBU leakage(15%, 15%, 6%, 20%, 15%)Estimation OBU leakage regardingAustria and Sw itzerland (35%,35%, 6%, 45%, 35%)
It can be observed that Scenario reacts most senitively on varying assumptions regardinginteroperability and OBU leakage. If the leakage ratios were as high as they are in Austria andSwitzerland, Scenario 1A would become significantly more expensive (75% increase of OBU cost, 8%increase of total annual cost). On the other hand, with EETS, the total annual costs of this scenariocould be reduced by 3%. The other scenarios are much less sensible to OBU leakage.
in million DKK
MTE_Denmark v1.0_final_02jun2006.doc
RappTrans
66
88.1
Evaluation of the ScenariosKey Figures at a Glance
Scenario 1A Scenario 1B Scenario 2A Scenario 2Bin million DKK in million DKK in million DKK in million DKKEffective Charging RevenueCosts per yearNet Revenue per yearCosts in % of effective chargingrevenue1'41048692434%1'45653492237%2'1483991'74919%2'0943281'76716%
The above figures can be compared with the Eurovignette for Denmark:RevenueCost395,7 million DKK/year10,4 million DKK/year
8.28.2.1
BenchmarksBenchmark figures of the four scenarios
The benchmarks are a result of the assumptions on which the Danish study is based. Even if theseassumptions need to be reviewed in further studies, our present estimates give correct orders ofmagnitude. The results are based on real cost figures transposed from other road charging schemes.Also, our cost and revenue model is sufficiently complete to identify and represent the main factorswhich determine the behaviour of costs and revenues.Scenario 1A Scenario 1B Scenario 2A Scenario 2BVehicle kilometers per year (mio km)Total costs per year in mio. DKKEffective charging revenue per year in mio DKKEffective charging revenue per vehicle kilometer inDKKTotal costs per vehicle kilometer in DKKNet revenue per vehicle kilometer in DKK1'6604861'4100.850.290.561'6605341'4560.880.320.562'4063992'1480.890.170.732'4063282'0940.870.140.73
8.2.2
Comparison with foreign HGV Charging schemes
In addition to comparing the scenarios against each other, the cost and revenue estimates of thescenarios 1A, 1B, and 2A have been benchmarked against figures from the functionally correspondingHGV charging schemes in Europe. It is not possible to split the benchmark figures into benchmarks for
MTE_Denmark v1.0_final_02jun2006.doc
RappTrans
67
the charging services, enforcment services and central services because the cost data of the foreignschemes are not split in the same way as the cost estimates in this study.
Comparison with German schemeVehicle kilometers per year (mio km)Total costs per year in mio. DKKEffective charging revenue per year in mio DKKEffective charging revenue per vehicle kilometer inDKKTotal costs per vehicle kilometer in DKKNet revenue per vehicle kilometer in DKKCosts in % of charging revenue
Scenario 1A1'6604861'4100.850.290.5634%
Germany22'7004'50021'3750.940.200.7421%
Comparison with Austrian schemeVehicle kilometers per year (mio km)Total costs per year in mio. DKKEffective charging revenue per year in mio DKKEffective charging revenue per vehicle kilometer inDKKTotal costs per vehicle kilometer in DKKNet revenue per vehicle kilometer in DKKCosts in % of charging revenue
Scenario 1B1'6605341'4560.880.320.5637%
Austria2'7006005'6252.080.221.8611%
Comparison with Swiss schemeVehicle kilometers per year (mio km)Total costs per year in mio. DKKEffective charging revenue per year in mio DKKEffective charging revenue per vehicle kilometer inDKKTotal costs per vehicle kilometer in DKKNet revenue per vehicle kilometer in DKKCosts in % of charging revenue
Scenario 2A2'4063992'1480.890.170.7319%
Switzerland2'0804806'8303.280.233.057%
MTE_Denmark v1.0_final_02jun2006.doc
RappTrans
68
8.2.3
Benchmark costs
Scenario
EFC Costs per vehicle kilometreDenmarkDKKForeign schemeDKK0.200.220.23Country
1A1B2A
0.290.320.17
GermanyAustriaSwitzerland
The reasons for the comparatively higher costs of the network schemes in Denmark are:compared to Germany: scale effects with the Danish scheme being much smaller. The highOBU costs penalise the comparatively small territory of Denmark because much lesskilometers are registered per OBU than in Germany.compared to Austria: inclusion of the non-motorway segments. If the Danish scheme wasreduced to motorways only, the DSRC gantry infrastructure costs would be significantly lower.
Compared to the LSVA scheme in Switzerland the Danish scheme compares favourably due to the factthat Denmark has only very few system entry points (18 in Denmark versus 120 in Switzerland).8.2.4Benchmark revenues
Scenario
Net revenue per vehicle kilometreDenmarkDKKForeign schemeDKK0.741.863.05Country
1A1B2A
0.560.560.73
GermanyAustriaSwitzerland
The three Danish scenarios show a high percentage of revenue which is consumed by the operatingcosts. The area charging scenarios show significantly better relationships than the network scenarios.The network scenarios compare unfavourably with the motorway HGV charging schemes in Austria
MTE_Denmark v1.0_final_02jun2006.doc
RappTrans
69
and Germany. The reasons are the relatively low tariffs of the Danish system (based on lowinfrastructure costs that can be attributed) and the comparatively smaller HGV traffic volume than themotorways-only networks in Germany and Austria. The benchmark with the Swiss LSVA shows thatthe Swiss have a much higher tariff yielding a significantly higher net revenue despite the higher costof their system.The benchmarks are a result of the assumptions on which the Danish study is based. Theseassumptions need to be reviewed in further studies. The present estimates give correct orders ofmagnitude.8.3Risks
Introducing a nationwide EFC system for HGV charging carries high risks. In Germany, theintroduction of the scheme was delayed by 15 months, and in the UK the implementation of the LorryRoad User Charging scheme has been halted. On the other hand, the schemes in Switzerland andAustria went life on time and are running smoothly.The major risks are:political risk of implementing a system without the necessary acceptance from the hauliersand the publicmaking the system too complex with functional requirements that are too demanding. Suchrequirements could be:differentiating road types other than all motorwaysdifferentiating time of day or traffic conditionsdifferentiating vehicle categories that cannot be easily detected by automatic road sideequipment (e.g. exempting HGV or special tariffs on the ground of trip purpose)complex repayment or rebate schemesmixing added value services with a tax-like charging systemrelying too much on technology to meet complex functional requirements and therebyneglecting usability aspects (e.g. unpractical fall-back options in case of equipment failure)relying too much on the industry to come up with answers instead of clear functionalspecifications and a firm leadership from governement.insufficient experience of industry operating a tax-like systemlegal challenges of the system if the scheme is inequitable for some user groupslack of interoperability with the future EETS (whatever the EETS specifications may be)unwanted traffic reactions such as detour traffic or HGV parking problems at POS.
8.4
Conclusions and recommendations
The results of the present study must be interpreted with caution. The costs are based on those of EFCsystems that were procured some time ago reflecting the particular competitive prices of the particularsituation. The revenues rest on assumptions regarding the infrastructure costs that could be allocatedto HGV>12t on different networks based on figures of a study which has not been produced for this
MTE_Denmark v1.0_final_02jun2006.doc
RappTrans
70
particular purpose. Nevertheless, the results certainly indicate a probable order of magnitude and theyallow to show the trends between the different scenarios.Under the present assumptions none of the scenarios show a favourable cost effectiveness. Thereasons arethe low tariff resulting from the comparatively low infrastructure costs upon which thepotential charging revenues are based, andfor the network charging scenarios the extent of the network resulting from the inclusion of alarge part of the trunk roads. Including non-motorways is particularly penalising for the DSRCtechnology.the assumption, that all HGV travelling in Denmark must be equipped with a Danish OBU andthere are no cost savings from interoperability.
The situation regarding the European Electronic Tolling System (EETS) is yet too unclear for allowingto estimate the cost effects in the present study. We recommend to review the estimates as soon asthe EETS specifications have been settled by the relevant European bodies. The cost reduction frominteroperability is likely to be the highest with scenario 1A.Notwithstanding possible interoperability benefits in Scenario 1A, the area charging scenarios arelikely to remain significantly more cost-effective than the network scenarios as long as non-motorwaysare included. The geography and network topology of Denmark favour area charging over networkcharging more than in any other European country.It is difficult to answer the question if the cost difference of 18% between driving time related areacharging and distance related area charging is big enough to engage in a discussion for this entierlynovel approach to road user charging with the EU. We assume that the debate on the subject ofdriving time related charging will rather be taken up for light vehicles than for HGV.
Rapp Trans AG
Basel, 24.03.2006 / 67.034.0 / MR/Rye/PMRBericht-Nr. 01
MTE_Denmark v1.0_final_02jun2006.doc
RappTrans