Miljø- og Planlægningsudvalget 2009-10
MPU Alm.del
Offentligt
Nord Stream AG
Offshore pipeline through theBaltic SeaMemo 4.3A-6Spreading of viscous mustard gas
September 2008
Nord Stream AG
Offshore pipeline throughthe Baltic SeaMemo 4.3A-6Spreading of viscous mustard gasSeptember 2008
7774001G-PE-PER-EIA-100-43A60000-CVersion CDate 2009-09-29Prepared by JAN/PFSChecked by HSNApproved by JLA
Ref
Rambøll Danmark A/SBredevej 2DK-2830 VirumDanmarkPhone +45 4598 6000www.ramboll.dkRev.DateMade byChecked byAppr. byDescription
CBA
29-09-200920-05-200903-02-2009
LGG
HSN
NESJLAJLA
JAN/PFS HSNJAN/PFS HSN
Table of contents
1.1.12.3.3.13.23.33.44.4.14.25.5.15.26.7.
IntroductionSpreading of viscous mustard gasSummaryMustard gas dumped in the Baltic SeaDumping areasProperties and degradation of viscous mustard gasFindings of chemical warfare agentsObserved mobility of dumped materialImpacts due to pipe-layingDegradation of munitions due to pipe-layingExpected mobility due to pipe-layingModelling of spreadingScenariosCritical velocity for movement of the lumpsConclusionReferences
112445691111121313141920
Ref. G-PE-PER-EIA-100-�43A60000-C
I
1.1.1
IntroductionSpreading of viscous mustard gasAs basis for the environmental impact assessment (EIA) several background memoshave been prepared. This memo describes the spreading of lumps of viscous mus-tard gas.Viscous mustard gas was dumped in the Baltic Sea after World War II and remainson the seabed. Every year lumps of viscous mustard gas are caught by fishermen.There has been concern that if the pipeline were laid directly on the lumps of viscousmustard gas they could break into smaller pieces and be transported to the coastlineby currents. Because the physical appearance of the lumps resembles amber, thereis apprehension that people would collect these small pieces on the beach.This memo analyses the impact from the pipeline on the lumps of viscous mustardgas on the seabed, as well as the likelihood of fragments of the lumps moving to-wards the coastline. Furthermore, the drifting of lumps of viscous mustard gas isquantified.
Ref. G-PE-PER-EIA-100-�43A60000-C
1/21
2.
SummaryAfter World War II a large amount of chemical warfare agents were dumped in theBaltic Sea. There are two official dumping areas in the Baltic Proper. One area issouth-east of Gotland and the other, east of Bornholm. However, chemical munitionshave been found in a considerably larger area than the official dumping sites.Viscous mustard gas is mustard gas to which thickeners have been added. Thethickening agents prevent the mustard gas from reacting directly with the sea water;therefore, the viscous mustard gas can exist on the seabed for years.The mustard gas is in the form of solid lumps, which are degraded by different proc-esses.Lumps of viscous mustard gas are frequently found in the Baltic Sea, especially inconnection with fishing activities. The findings are reported to the Danish Navy atBornholm (Bornholms Marinedistrikt), and the lumps are either dumped at one of thetwo emergency dumping sites east and west of Bornholm or brought by the DanishNavy to land, where they are safely destroyed. The lumps that have been brought invary in size, and the weight of the findings ranges from approximately 0.1 kg to 100kg.Movement of the viscous mustard gas may have happened due to:••relocation by currentsrelocation by fishing activities
However, it is concluded that the primary means of relocation of chemical munitionsis via fishing activities; currents are only a minor factor. There have been no inci-dents in which lumps of viscous mustard gas have washed ashore.There is a small risk that the pipeline could be laid directly atop a lump of viscousmustard gas. If so, three different situations can occur:•••the lump is buried under the pipe, which is likely to occur in areas where thesediment is very softthe lump is pushed aside without breakingthe lump is broken into smaller pieces
The mobility of a lump would increase only if a lump were broken into smaller pieces.However, the pipeline introduces no new degradation processes, as these processesare already occurring because of weathering and fishing activities. Increased mobil-ity, therefore, only applies to those single lumps that may be broken, and not to thegeneral mobility of the lumps.
Ref. G-PE-PER-EIA-100-�43A60000-C
2/21
The mobility of broken lumps of viscous mustard gas has been analysed at two loca-tions. Based on the size range of lumps that have been found and brought in, a rele-vant size range of lumps broken due to interaction with the pipelines can be esti-mated at approximately 25 cm to 0.2 cm in diameter.The two locations in Table 2.1 below represent points where the pipeline is closest toeach of the two dumping sites in the Baltic Sea.LocationAreaCoordinatesWater depth(From MIKE 3model,/1/)90 m
1
Bornholm Basin(approximatelyKP 1025)Gotland Deep(approximatelyKP 800)
15.50�E, 55.43�N
2
18.58�E, 56.35�N
64 m
Table 2.1: Locations where pipeline is closest to dumping sites in the Baltic Sea
To evaluate whether the lumps would be moved by current and waves at the twolocations, a desktop analysis has been performed.The critical current velocity for movement of the lumps varies between 0.05-0.62m/s, dependent on lump size. The critical current velocity is only exceeded at Loca-tion 1 (Bornholm Deep), where movements of small lumps (1 cm in diameter) wouldbe possible.The maximum wave corresponding to the significant wave height at a one year seastate would not move the lumps at Location 1, but it could move very small lumps(0.2 cm in diameter) at Location 2.The analysis therefore supports the conclusions of the Helsinki Commission (HEL-COM) in /2/ that it is very unlikely that lumps of viscous mustard gas would betransported to the shoreline by the current, even in the case of very small lumps.It is concluded that breaking of the lumps of viscous mustard gas would not poseany threats to the coastal areas of the Baltic Sea.
Ref. G-PE-PER-EIA-100-�43A60000-C
3/21
3.3.1
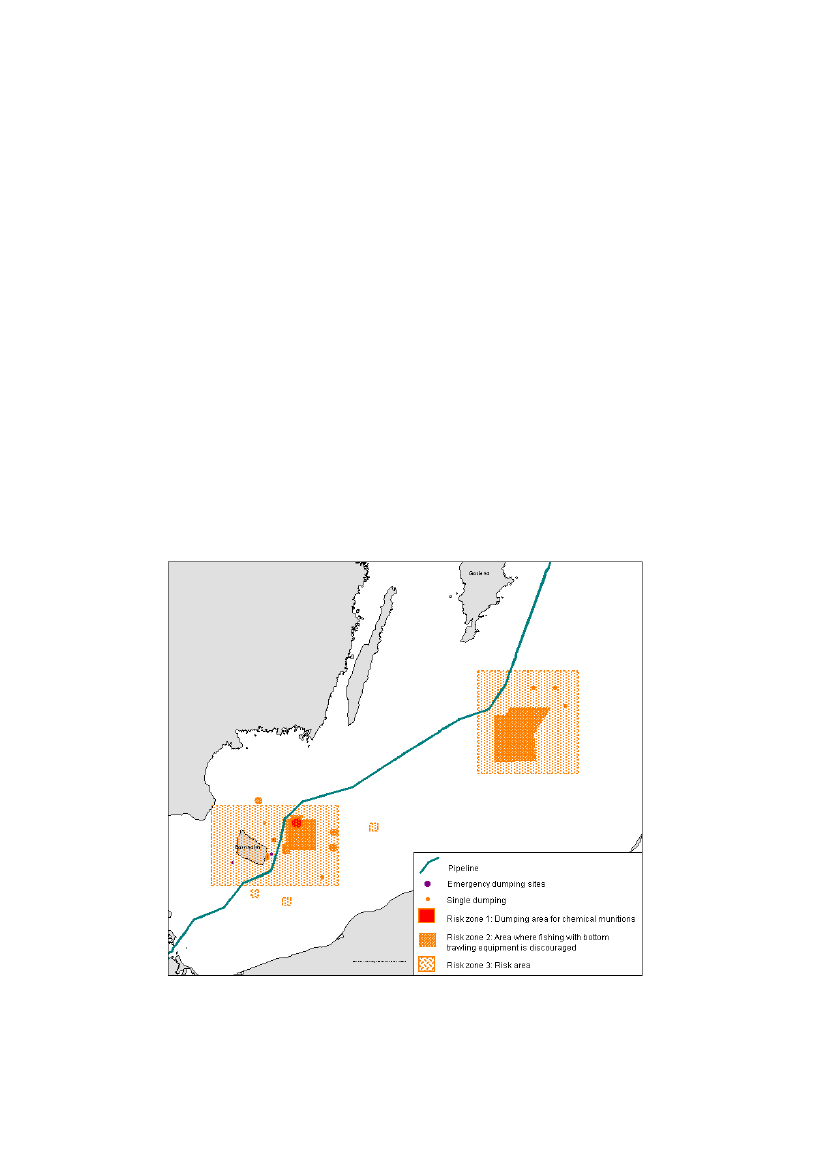
Mustard gas dumped in the Baltic SeaDumping areasAfter World War II a large amount of chemical warfare agents were dumped in theBaltic Sea, including approximately 7,635 tonnes of mustard gas, /2/. It is estimatedthat approximately 20% of the total production of mustard gas in Germany was inthe form of viscous mustard gas, /2/.The viscous mustard gas was used in different kinds of artillery, mostly in bombs andshells. Chemical warfare agents were also put in different kinds of containers, /2/.There are two official dumping areas in the Baltic Proper. One is located south-eastof Gotland, and the other east of Bornholm, cf. Figure 3.1. Both areas are relativelyclose to the alignment of the pipeline. There is some uncertainty regarding the actualsites where the munitions were dumped, due to several factors, including dumpingmethods, navigation and the possibility that some of the munitions were dumped enroute to the official sites, /2/. Therefore, chemical munitions have been found in anarea considerably larger than that of the official dumping sites. The official dumpingareas and the areas where there is considered to be a risk of mustard gas on theseabed are shown in Figure 3.1.
Figure 3.1: Risk zones and dumping areas for chemical munitions
Ref. G-PE-PER-EIA-100-�43A60000-C
4/21
3.2
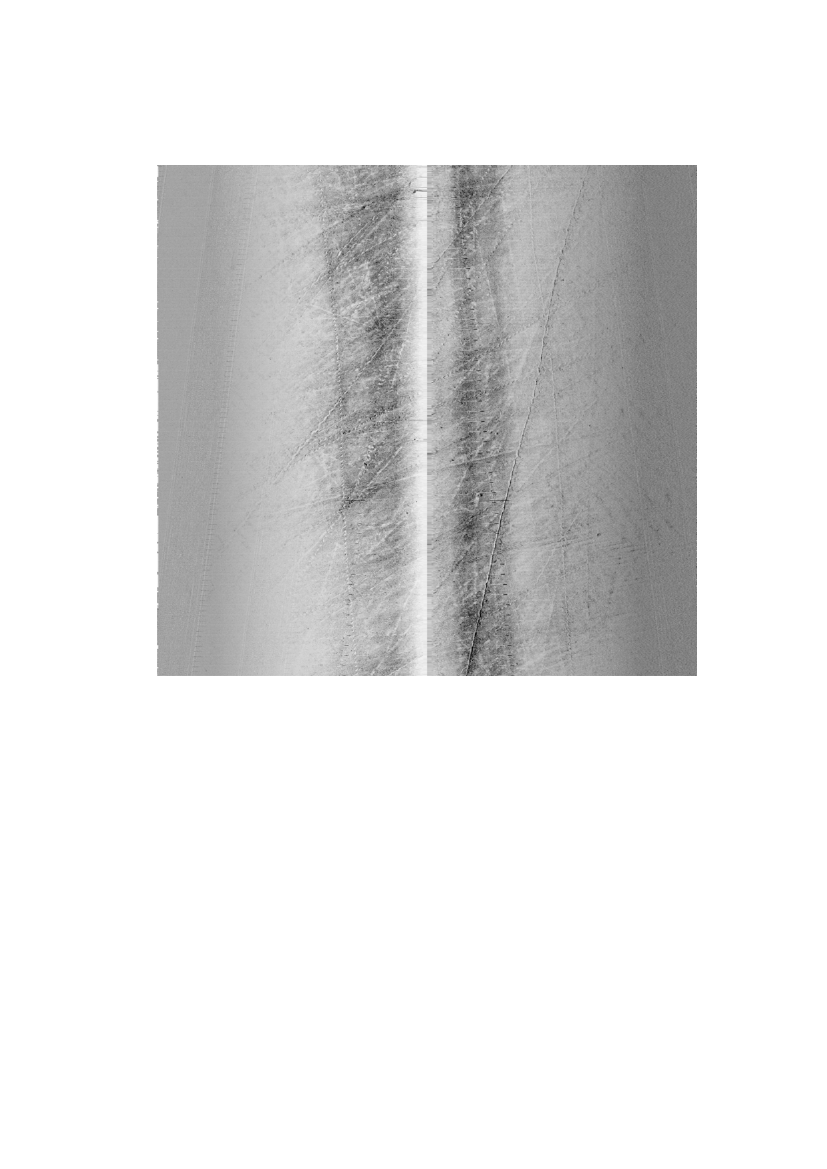
Properties and degradation of viscous mustard gasViscous mustard gas is mustard gas to which thickeners have been added. Becausethese thickening agents prevent the mustard gas from reacting directly with sea wa-ter, the viscous mustard gas can exist in the marine environment for years. The ar-tillery shells used to contain the mustard gas, however, are often corroded, leavingthe viscous mustard gas exposed on the seabed.The viscous mustard gas has the consistency of a thick, beeswax-like paste, and hasa density of 1.3–1.5 g/cm3, /2/. In the water environment, the viscous mustard gasis slowly oxidised and hydrolysed, because the active part of the mustard gas dif-fuses out of the viscous mustard gas and reacts with the water. The mustard gas ishydrolysed in two stages and ultimately neutralised by the sea water, /2/.When the viscous mustard gas is oxidised and hydrolysed, the thickening agentsremain and form the basis of a solid crust upon which sand and clay can deposit /2/.Therefore, the mustard gas is contained in solid lumps that are only slowly degradedin the sea water, which can be seen from the fact that lumps remain on the bottomof the Baltic Sea, 60 years after being dumped. Small lumps are degraded somewhatfaster than large lumps because of the larger surface area per mass unit of the smalllumps, /2/.The hardness of the solid lumps can be compared to hard sandstone, /3/, meaningthat it is quite stable but can be broken into smaller pieces by mechanical impact.Because of the intense fishing activity near the dumping area, lumps are thereforebroken into smaller pieces when they are hit by trawl boards and anchors, /3/.InFigure 3.2, a side-scan image shows the tracks from trawl boards in the areawhere the pipeline will traverse Risk Zone 2 at Bornholm.
Ref. G-PE-PER-EIA-100-�43A60000-C
5/21
Figure 3.2: Side-scan image of tracks from trawl boards in the area north of Bornholm.
3.3
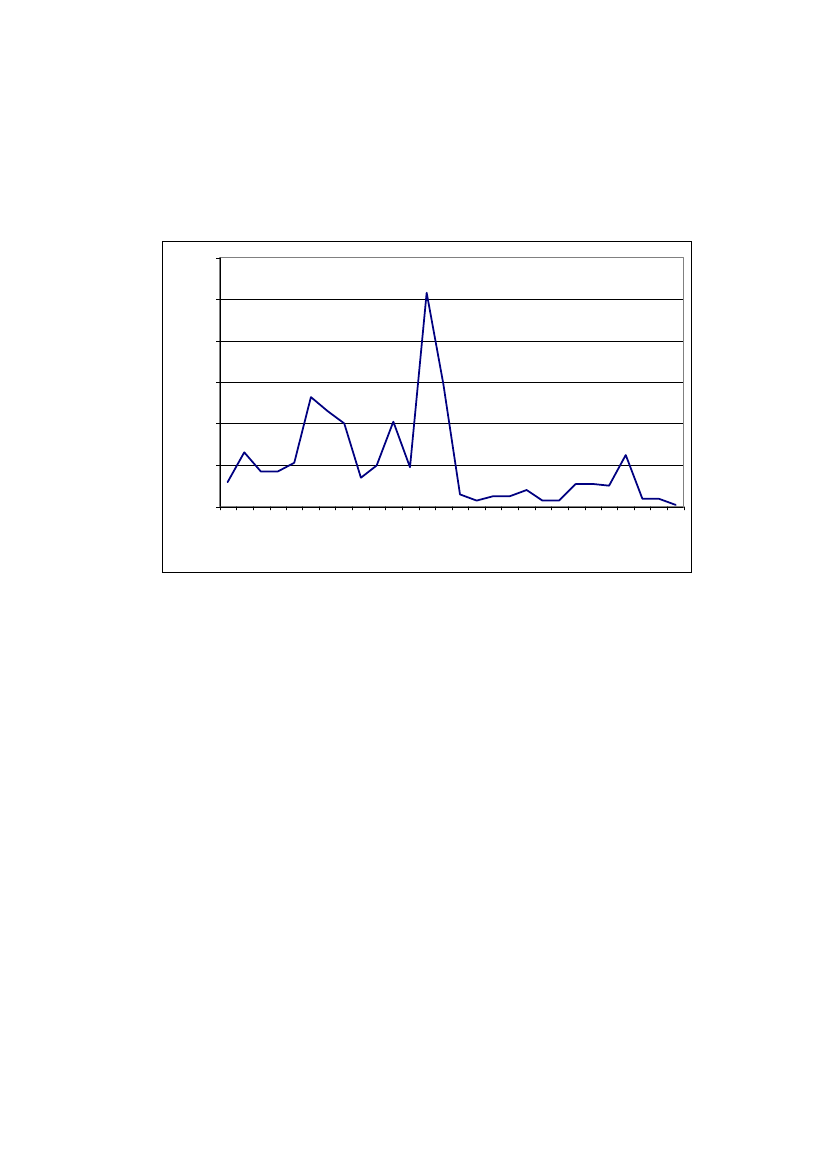
Findings of chemical warfare agentsChemical warfare agents are frequently found in the Baltic Sea, especially in connec-tion with fishing activities. The findings are reported to the Danish Navy at Bornholm(Bornholms Marinedistrikt) and are either dumped at one of the two emergencydumping sites east and west of Bornholm or brought to the Danish Navy to be safelydestroyed. The emergency dumping sites are shown in Figure 3.1. Approximately80% of the findings of chemical warfare agents are dumped at sea.The total number of chemical warfare finds reported to Bornholms Marinedistrikt inthe period 1979-2006 is shown in Figure 3.5. The number of findings has decreasedconsiderably, except for 2003. This could indicate that the risk of finding chemicalwarfare agents in the Baltic Sea has decreased.The findings were mainly mustard gas, but other gasses, such as tear gas andsneeze gas, were found as well.
Ref. G-PE-PER-EIA-100-�43A60000-C
6/21
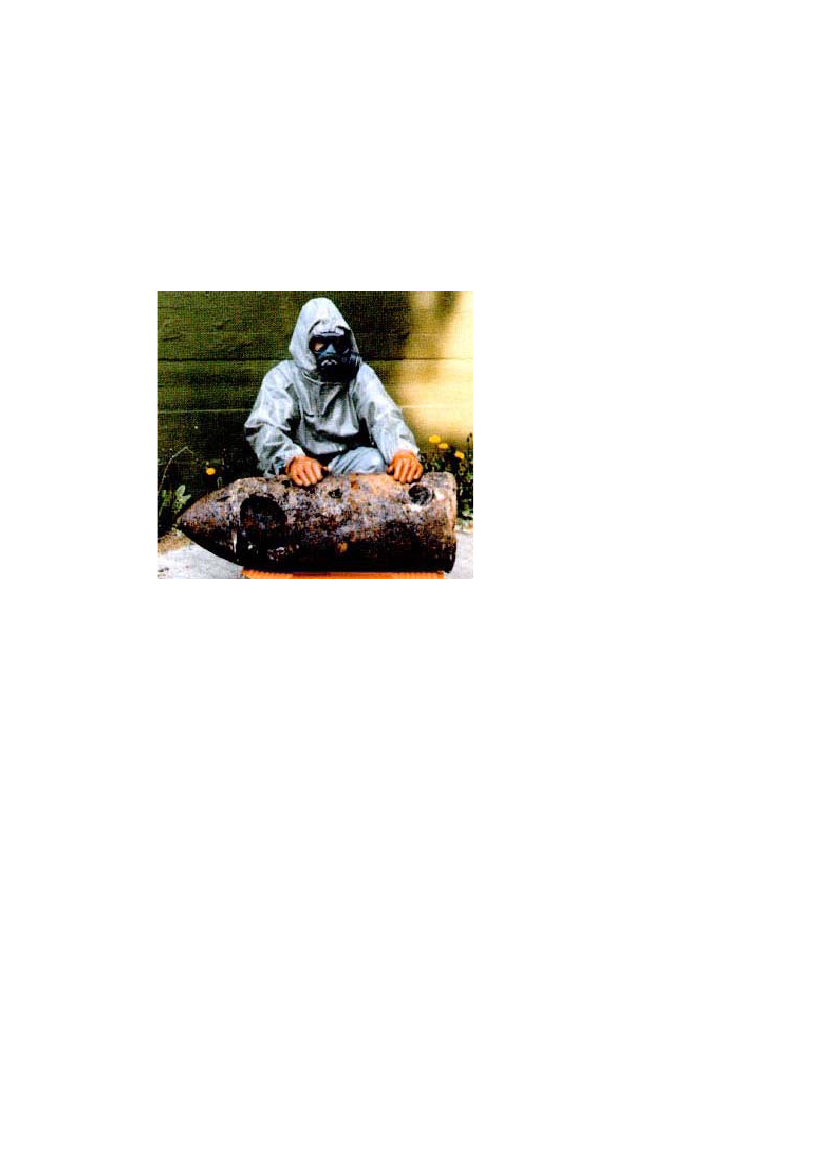
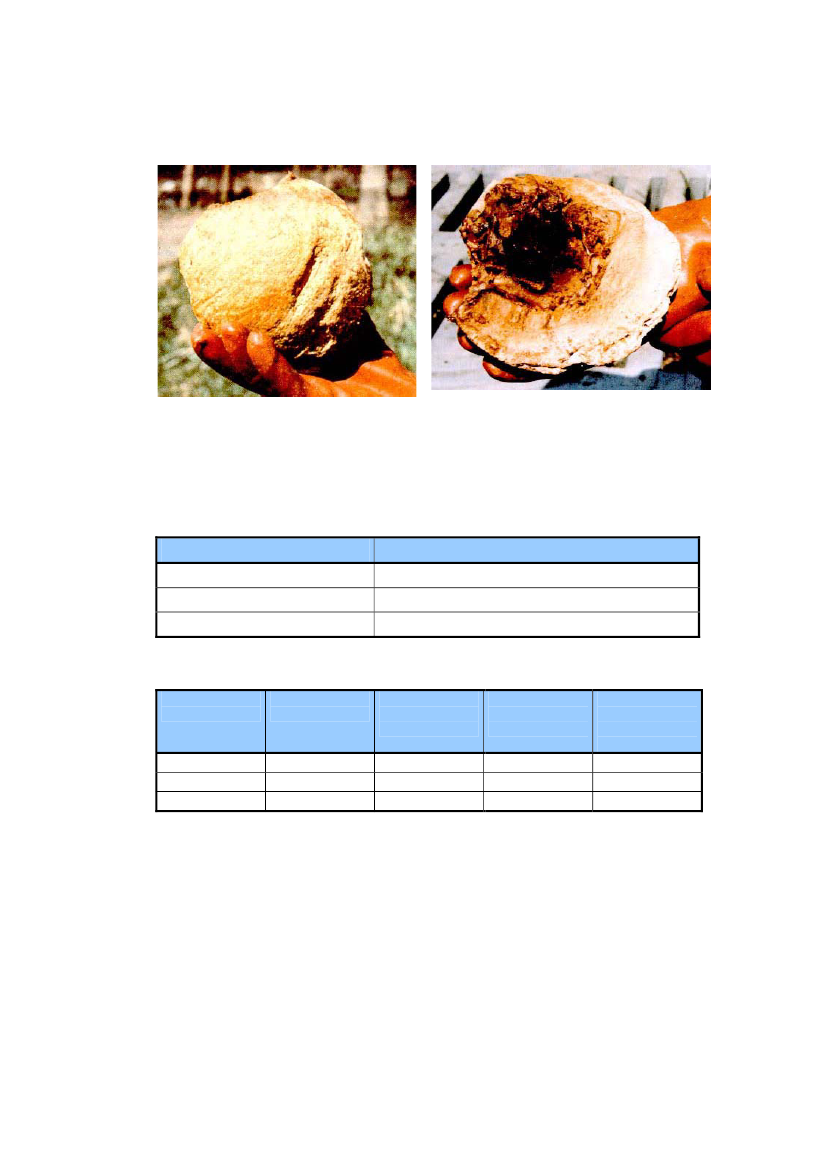
The chemical warfare agents are found in lumps of different sizes. Intact bombs arevery seldom among the more recent findings. Usually, the canisters of artillery shells(approximately 2 mm thick walls) have corroded away and only the warfare agentand some of the explosives remain /4/. An intact bomb containing mustard gas isshown in Figure 3.3. In Figure 3.4 weathered (oxidised and hydrolysed) lumps ofviscous mustard gas are shown.
Figure 3.3: Intact bomb containing mustard gas, /4/. (Photo from Bornholms Marinedistrikt)
Intact bombs contain up to 100 kg of warfare agent /4/. The mass of the lumpsfound in the Baltic Sea is often less than this. The lumps vary greatly in size, and theweight of the findings ranges from approximately 0.1 kg to 100 kg, /3/. Some find-ings consist of several smaller pieces, and some parts of the lumps may have beencrushed. The size of the broken pieces can be as small as a few millimetres in diame-ter, /3/. This indicates that the lumps of viscous mustard gas on the seabed of theBaltic Sea greatly vary in size; some of them were broken due to fishing activities.
Ref. G-PE-PER-EIA-100-�43A60000-C
7/21
Figure 3.4: Weathered lumps of viscous mustard gas, /4/. (Photos from Bornholms Marinedis-trikt)
The types and sizes of findings from the period 2003-2007 are shown in Table 3.1and Table 3.2.Type of gasMustard gasSneeze gasTear gasTable 3.1: Types of gas in findings from 2003-2007, /5/.
Number of findings in the period 2003-20073132
Total weightof findings
Total numberof findings
Number offindings ofone piece11141
Number offindings oftwo pieces210
Above 50 kg5 – 50 kgBelow 5 kg
14166
Number offindings ofmore thantwo pieces115
Table 3.2: Weight and number of lumps in findings from 2003-2007, /5/.
Table 3.1 shows that in the period 2003-2007 mainly viscous mustard gas wasfound. Table 3.2 shows that the findings typically consisted of one large lump, onmany occasions weighing more than 50 kg, but findings of several small lumps areidentified as well. In some cases, the findings consist of a large lump that has beenbroken in two where both pieces have been brought in /5/, /3/.
Ref. G-PE-PER-EIA-100-�43A60000-C
8/21
All recent findings of lumps of viscous mustard gas are weathered solid lumps, /3/,and it must be expected that the lumps of viscous mustard gas on the seabed in theBaltic Sea are solid as well.
120
100
80Number
60
40
20
01979198019811982198319841985198619871988198919901991199219931994199519961997199819992000200120022003200420052006
Year
Figure 3.5: Number of chemical warfare finds reported to Bornholms Marinedistrikt /3, 4/.
3.4
Observed mobility of dumped materialIt is considered that chemical warfare agents were dumped in an area larger thanthe official dumping area, /2/. Furthermore, spreading of viscous mustard gas mayalso have happened due to:••relocation by currentsrelocation by fishing activities
Findings by fishing vessels of viscous mustard gas have been reported in an areamuch larger than that of the official dumping sites. The reports, however, do notnecessarily reflect the distribution of viscous mustard gas on the seabed, as the posi-tions given for findings by vessels are those where trawls were taken onboard, notwhere the lumps were caught by trawls.However, there is a possibility that fishing vessels themselves transport lumps fromone site to another and drop the lumps before taking them onboard. It is also possi-ble that parts of a lump break off during trawling and are left on the seabed.On basis of /2/ chemical warfare agents are not found onshore, except for the fewincidents described below. From 1952–1954, five bombs were found along the Polish
Ref. G-PE-PER-EIA-100-�43A60000-C
9/21
coast, but it is not known if they were chemical or conventional bombs. In 1954, achemical bomb was found on the German island of Rügen. In all these cases it wasconcluded that the munitions were thrown overboard close to land, /2/.In addition to these reports, one newer finding of chemical munitions was reported.In 1992 a mustard gas bomb was found at Dueodde Beach on Bornholm. However,Danish experts concluded that the bomb had not washed ashore, but was placed atthe beach on purpose, /2/.The final conclusion from the HELCOM Working Group on Dumped Chemical Muni-tions regarding the mobility of the chemical munitions is, /2/: “A relocation by hy-drographic conditions is unlikely. Because of intensive fishing activities in or close tothe dumping areas relocation of chemical munitions may take place.” Furthermore,/2/: “The Group concludes that a threat to the coastal areas of the Helsinki Conven-tion Area from residues of warfare agents or chemical munitions washed ashore isunlikely.”These conclusions indicate that although there has been relocation of lumps of vis-cous mustard gas there have been no incidents where lumps have washed ashore.Furthermore, the relocation of chemical munitions is due primarily to fishing activi-ties; relocation by currents is only a minor factor.
Ref. G-PE-PER-EIA-100-�43A60000-C
10/21
4.4.1
Impacts due to pipe-layingDegradation of munitions due to pipe-layingThe pipelines will traverse two areas where there is a risk of chemical warfare agentslying on the seabed, as shown in Figure 3.1. There is therefore a small risk that thepipeline will be laid directly atop a lump of viscous mustard gas.The pipelines will influence only a narrow corridor in the risk areas. In the areaaround Bornholm, the length of each of the pipelines in the risk area is approxi-mately 105 km. The influenced area is 0.160 km�, assuming the influence area isequal to the diameter of the pipeline. This corresponds to 1/60,000 of Risk Zone 3(see Figure 3.1) being influenced by the pipelines. In the area south-east of Gotland,the length of each of the pipelines in the risk area is approximately 50 km. This cor-responds to 1/120,000 of Risk Zone 2. A much larger part of the risk area is influ-enced by fishing activities every year.During installation, the pipeline will be laid slowly on the seabed, so the mechanicalaction from the pipeline will be quite small. When laying the pipeline atop a lump ofviscous mustard gas, three possible situations can occur:•••the lump is buried under the pipe, which is likely in the areas where the sedi-ment is very softthe lump is pushed aside without breakingthe lump is broken into smaller pieces
Each of the three situations is likely to occur, and it is impossible to estimate whichis the most likely, as it will depend on several factors. However, it is certain thatthere is a risk of lumps breaking.The influence from the pipeline is not different from the breakdown of the lumps al-ready taking place in connection with weathering processes and fishing activities, butit may very slightly speed up the breakdown if the pipeline hits lumps on the seabedand breaks them to smaller pieces /3/.If a lump is broken into smaller pieces similar to those caused by trawl boards, thesizes of the broken pieces must be in the same range as the lumps broken due tofishing activities. From the lumps reported to Bornholms Marinedistrikt, the size ofthe broken pieces may be estimated. The size distribution of these findings cannotbe directly used as a size distribution of lumps broken by mechanical action. Largelumps may be caught in trawls more easily, and if small pieces break off when thelumps are moved in the trawls, they may be left behind. Furthermore, many of thelumps that have been found were not broken. However, from the description of thesize range of the findings, a relevant size range of lumps broken by mechanical ac-tion can be estimated at approximately 0.2-25 cm in diameter.
Ref. G-PE-PER-EIA-100-�43A60000-C
11/21
4.2
Expected mobility due to pipe-layingEach of the three different situations that could occur if the pipeline were laid directlyatop a lump of mustard gas would have a different effect on the mobility of thelumps.1.2.3.If a lump were buried under the pipe, the lump would become totally demobi-lised.If a lump were pushed aside without breaking, the mobility would be un-changed.If a lump were broken into smaller pieces, the mobility of the lump would in-crease.
It therefore cannot unambiguously be concluded whether pipe-laying will increase ordecrease the mobility of lumps in the corridor of the pipeline.As the process of degrading and breaking the lumps is ongoing due to weatheringand fishing activities, increased mobility would only apply to those single lumps thatcould be broken, not to the general mobility of the lumps. The pipeline introduces nonew degradation processes. This means that the considerations of the mobility of thebroken lumps is general and applies to both the breakdown caused by pipe-laying aswell as the breakdown caused by decades of fishing activities.The conclusions from Section 3.4 regarding the observed mobility of dumped chemi-cal munitions, therefore, also apply to viscous mustard gas influenced by pipe-laying.
Ref. G-PE-PER-EIA-100-�43A60000-C
12/21
5.5.1
Modelling of spreadingScenariosTo further support the conclusions from /2/, that relocation by hydrographic condi-tions is unlikely, the possibility of the lumps being transported by current and waveshas been quantified in the following.Two locations have been chosen to analyse the mobility of lumps of broken-downviscous mustard gas.The two locations represent the points where the pipeline is closest to each of thetwo dumping sites in the Baltic Sea. The locations are shown in Table 5.1.Location1AreaBornholm Basin(approximatelyKP 1025)Gotland Deep(approximatelyKP 800)Coordinates15.50�E, 55.43�NWater depth (fromMike 3 model,/1/)90 m
2
18.58�E, 56.35�N
64 m
Table 5.1: Locations where pipeline is closest to dumping sites.
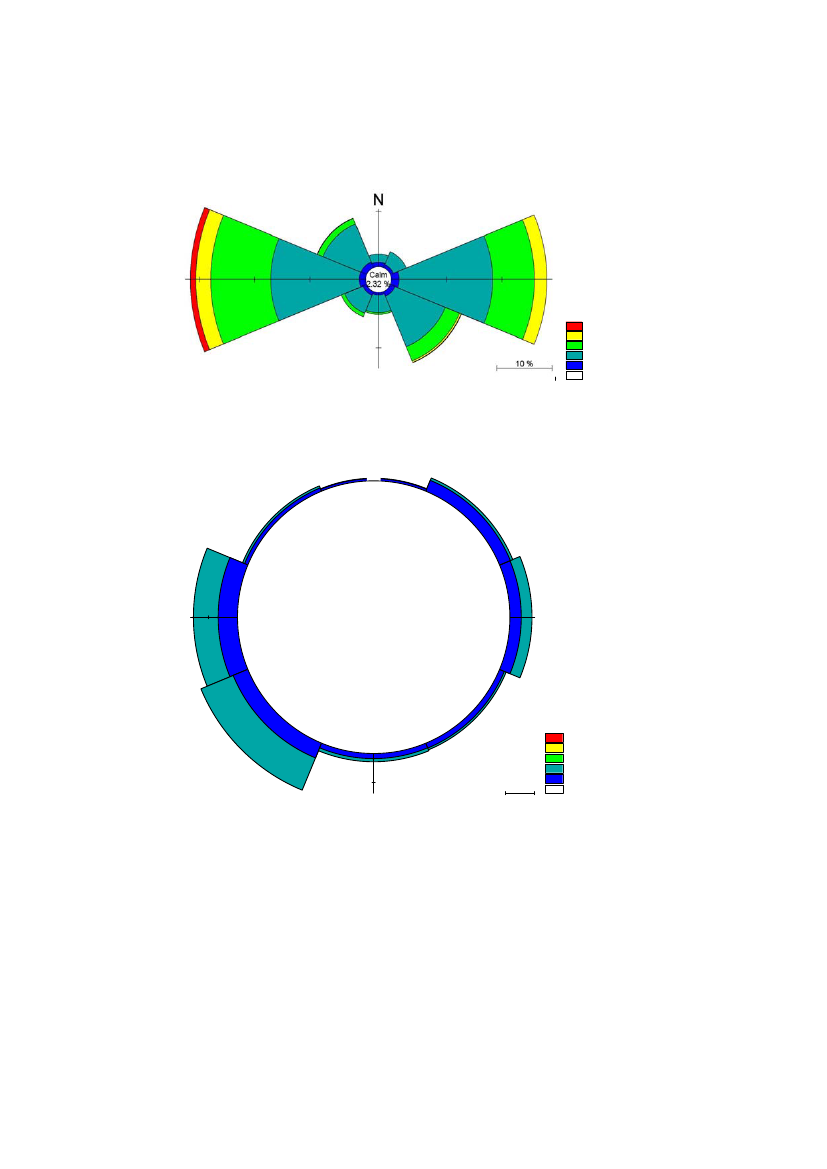
The mobility of broken lumps of viscous mustard gas has been analysed for the fol-lowing sizes in the interval that is assumed to represent the lumps: 0.2 cm, 1 cm, 5cm and 25 cm in diameter. The pieces are assumed to be spherical to make themodelling possible, although their actual shape is unknown.On basis of the MIKE 3 Model, /1/, the current conditions in the lower metre of thewater column at the sites at the two locations are shown inFigure 5.1and Figure 5.2as current roses representing conditions in the year 2005.
Ref. G-PE-PER-EIA-100-�43A60000-C
13/21
PaletteAbove 0.150.1 - 0.150.05 - 0.10.01 - 0.050.005 - 0.01Below 0.005
Figure 5.1: Current rose (m/s) representing modelled currents at the sea bottom in 2005 forLocation 1 (Bornholm Basin) /1/.
N
Calm46.75 %
10 %
PaletteAbove 0.150.1 - 0.150.05 - 0.10.01 - 0.050.005 - 0.01Below 0.005
Figure 5.2: Current rose (m/s) representing modelled currents at the sea bottom in 2005 forLocation 2 (Gotland Deep) /1/.
5.2
Critical velocity for movement of the lumpsTo evaluate whether the lumps will be moved by current and waves, a desktop studyhas been performed. Movement of the lumps on the seabed is only initiated if thecurrent velocity is above a certain critical velocity for the movement. The critical ve-
Ref. G-PE-PER-EIA-100-�43A60000-C
14/21
locity depends on several factors, but it can be estimated by making some assump-tions on the physical parameters governing the movement.The Morison equation for fixed circular elements has been used to calculate the hori-zontal current and wave-induced forces on the lumps. Drag and inertia coefficientshave been applied dependent on roughness of the lumps (estimated to 1 mm), andthe Reynolds number. Three dimensional effects have been taken into account byusing reduction factors on drag and inertia coefficients /6/.The horizontal hydrodynamic Morison force that causes the lump to move has beencompared with the friction force that retains lumps on the seabed.If the Morison force exceeds the friction force, the lumps can be moved by the cur-rent or waves on a plain seabed, i.e., where there are no influences due to obstacleslike larger rocks, grass, sloping seabed, etc.The friction force is calculated by the submerged weight of the lumps times a frictioncoefficient,f.The friction coefficient depends on the seabed type and the surface ofthe lumps. In /7/ conservative values for the longitudinal friction coefficients be-tween the soil and the pipe are given. A friction coefficient of 0.5 is assumed to berepresentative for sand, and a coefficient of 0.2 is assumed to be representative forclay, till and rock. In the two areas of concern, the seabed is dominated by clay.However, the lumps are considered to be quite irregular, and the friction coefficientbetween the soil and the lumps is presumably larger than the coefficient betweensoil and pipe. The friction coefficient between the soil and the lumps of mustard gasin the two areas, therefore, is estimated to be in the interval of 0.2–0.5. Conserva-tively, a friction coefficient of 0.2 has been used in the analysis.The critical current velocities for two friction coefficients are estimated by calculatingthe critical current velocity for friction coefficients, f, of 0.2 and 0.5. The results areshown inTable 5.2.Lump sizeCritical current velocityUc (m/s) forf= 0.20.05Critical current velocityUc (m/s) forf= 0.50.08
Very small(0.2 cm)Small(1 cm)Medium(10 cm)Large(25 cm)
0.11
0.16
0.23
0.36
0.62
0.91
Table 5.2: Critical current velocity for different values of the friction coefficient,f.
Ref. G-PE-PER-EIA-100-�43A60000-C
15/21
Thee critical current velocity is seen to increase by approximately 50% when using afriction coefficient of 0.5 in comparison with the current velocity calculated using afriction coefficient of 0.2. Due to precautionary reasons the calculated velocity valuesfor a friction coefficient of 0.2 are applied in the evaluation below.
5.3
ResultsThe critical current velocity for movement of the lumps, i.e., for which the force cri-teria just has been fulfilled, has been determined for each location and for differentlump sizes.The current conditions in the lower metre of the water column, as described in thesection above, have been analysed, and the maximum current velocity has beendetermined for each location and shown in Table 5.3. Assuming that the maximumcurrent is valid one metre above the seabed, a current profile of the power of 1/7has been applied for calculating the maximum current velocity at the level of onelump diameter above the seabed. The maximum current velocity has then beencompared with the critical current velocity in order to evaluate whether the lump canbe moved by the current.LocationMax velocity,Umax, in theLower 1 metre (m/s)0.23Significant wave height,Hs,in one year sea state (m)4.5
1(Bornholm Basin)2(Gotland Deep)
0.05
5.5
Table 5.3: Modelled maximum velocity from /1/ andHsin one year sea state from /7/
The probability of movement of the lumps by waves has been evaluated by calculat-ing the Morison force using wave-induced particle velocity and acceleration in thelevel of the lumps. The maximum wave within the sea state of one year, Hs,1 yearhasbeen considered in the analysis using linear wave transformation. Wave heights from/7/ have been used in the analysis as shown in Table 5.3.In Table 5.4, the main results of the calculations are presented. In Appendix A thecalculations are described in detail.The critical current velocity for movement of the lumps varies between 0.05-0.62m/s, depending on lump size. The critical current velocity is only exceeded at Loca-tion 1 (Bornholm Basin) where movements of very small lumps would be possible.The maximum wave corresponding to Hs,1 yearwill not move the lumps at Location 1for a water depth of 90 m. However, the influence from waves depends greatly onwater depth. The very small lumps would only be moved by the maximum wave indepths of less than 50 m.
Ref. G-PE-PER-EIA-100-�43A60000-C
16/21
At Location 2 the maximum wave corresponding to Hs,1 yearwould move the verysmall lumps, even at a water depth of 64 m. Small-sized lumps would be moved atdepths of 50 m and medium-sized lumps would be moved at depths of 40 m.LocationLumpsizeMax velocityUmaxat levelof the lump(m/s)Criticalcurrentvelocity Uc(m/s)Will the maxcurrentmove thelumps?Will the maxwave in aone yearsea statemove thelumps?No
Verysmall(0.2 cm)1(BornholmBasin, wa-ter depthof 90 m)Small(1 cm)Medium(10 cm)Large(25 cm)Verysmall(0.2 cm)Small(1 cm)Medium(10 cm)Large(25 cm)
0.09
0.05
Yes
0.12
0.11
Yes1
No
0.15
0.23
No
No
0.19
0.62
No
No
0.02
0.05
No
Yes
2(GotlandDeep, wa-ter depthof 64m)
0.03
0.11
No
No
0.03
0.23
No
No
0.04
0.62
No
No
Table 5.4: Possible movement of lumps.1Not exceeded for f=0.5, see Table 5.2
According to this analysis, the maximum current velocity at Location 1 (BornholmBasin) could move the very small and small lumps. The maximum wave in a oneyear sea state at Location 2 (Gotland Deep) could move the very small lumps. Themaximum current velocity is estimated by the MIKE 3 model for the year 2005 usinga time step of 6 hours. Assuming that the lumps at Location 1 are moved with a ve-locity corresponding to the maximum current velocity for a period of six hours, thelumps would be moved around 2600 m (on a plain seabed not taking the movementon a sloping seabed closer to the shore into account). Likewise, for Location 2 themaximum wave in a one year sea state (with a time period of around 10 seconds) isonly able to move the lumps at a limited distance.
Ref. G-PE-PER-EIA-100-�43A60000-C
17/21
The results in Table 5.4 are given for the maximum current velocities. FromFigure5.1it can be seen that the current velocities in general are lower than the maximumcurrent velocity.
Ref. G-PE-PER-EIA-100-�43A60000-C
18/21
6.
ConclusionAnalysis shows that under very rough conditions the waves and currents could beable to move small lumps of viscous mustard gas. However, due to the short dura-tion during which the lumps could be moved, they would not be transported very far.Furthermore, the lumps would have to travel up a slope from 60-90 m of depth tothe surface, which decreases the possibility the lumps moving towards the shoreline.The analysis therefore supports the conclusions from /2/ that it is very unlikely thatlumps of viscous mustard gas would be transported to the shoreline by the current,even in the case of small lumps.The weathering and natural degradation of viscous mustard gas is more rapid forvery small lumps than for large lumps. Therefore, it must be expected that the verysmall fragments with a diameter of 10 mm would not be preserved on the seabed aslong as the large lumps that are found in the Baltic Sea.It can be concluded that breaking of the lumps of viscous mustard gas would notcause increased threats to the coastal areas of the Baltic Sea.
Ref. G-PE-PER-EIA-100-�43A60000-C
19/21
7.
References/1/Nord Stream AG and Ramboll,2007,"Memo 4.3a-1 - Hydrodynamical modelsetup for the Baltic Sea", Nord Stream AG, Zug, Switzerland.HELCOM,1994,"Report on Chemical Munitions Dumped in the Baltic Sea -Report to the 15thmeeting of Helsinki Commission 8-11 March 1994, DanishEnvironmental Protection Agency",http://www.helcom.fi/stc/files/Publications/OtherPublications/1994Report-ChemicalMunitionsDumpedInTheBalticSea.pdf, Date accessed: 2008-8-14.
/2/
/3/ Ramboll,2007-9, "Conversationswith Bornholms Marinedistrikt (the DanishNavy at Bornholm)", Received by Jesper Aarosiin Hansen./4/HELCOM,2002,"Response Manual, Vol. 2 Chapter 6 - Amendment No.27/02/03".Bornholms Marinedistrikt,2007,"Opgørelse over minørsager vedr. gas i2003-2007 under Bornholms Marinedistrikt (In Danish)".Dansk Standard DS 449,1983,"Dansk ingeniørforenings norm for pælefun-derede offshore stålkonstruktioner (in Danish)", Teknisk forlag.
/5/
/6/
/7/ Snamprogetti,25-1-2008,"Re-routing at Bornholm - LA-E-70624".
Ref. G-PE-PER-EIA-100-�43A60000-C
20/21
Appendix A: Evaluation of critical currents
Ref. G-PE-PER-EIA-100-�43A60000-C
21/21
RAMBØLL
28/09/2009
Appendix A
NordStream; Evaluation of mustard gas lumpsDate:Prepared by:071008 Last updatePFS28/09/2009LGG
Wave parameters based on report 'LA-E-70624 Re-routing at Bornholm', by Snamprogetti
- Hmax calculated by Hs, using Hmax=Hs*sqrt( 0.5* ln(N)), where N is number of waves in a 3-hour seastate- Tz calculated by Tp, using Tp=1.56 Tz for a Pierson-Moskowitz wave spectraKP 1000 - KP 1050 (area NE of Bornholm): 50 - 80 mKP 800 (dumping area Gotland): 40 - 60 m
- Hydraulic roughness k=- Density of sea waterρ=- Density of sedimentρs=- Kinematic viscosityν=- Friction coefficient f =- Reduction factor on CD due to 3D,κ=
0.001102514001.30E-060.50.20.580.80
mkg/m3kg/m3m2/sfor sand, at KP 800for clay,till and rock, at KP 1000-1050for current for subcritical Re area (Re< 10^5)for current for supercritical Re area (Re> 10^6)
Possible Movement
F=FM+FD, wherefor fixed construction elementρs*V*Aw*(1+Cm)FM=FD=0.5*rs*CD*(Uw+Uc)[Uw+Uc]*ACm==0,5 for a sphere in current, =1,0 for cylinder in wavesCD=depends on k/D and Re for current, depends on Re for waveswhen (FM+FD)>f*Mass
LocationKP 800
Lump TypeVery small lump
Current or waveCurrent1-yr wave
Small lump
Current1-yr wave
Medium lump
Current1-yr wave
Large lump
Current1-yr wave
KP 1000-1050
Very small lump
Current1-yr wave
Small lump
Current1-yr wave
Medium lump
Current1-yr wave
Large lump
Current1-yr wave
D[m]0.0020.0020.0020.0020.0020.0100.0100.0100.0100.0100.0500.0500.0500.0500.0500.2500.2500.2500.2500.2500.0020.0020.0020.0020.0020.0100.0100.0100.0100.0100.0500.0500.0500.0500.0500.2500.2500.2500.2500.250
AVDepth[m2][m3][m]3.14E-064.19E-09 -3.14E-064.19E-09 -3.14E-064.19E-0940.03.14E-064.19E-0950.03.14E-064.19E-0960.07.85E-055.24E-07 -7.85E-055.24E-07 -7.85E-055.24E-0740.07.85E-055.24E-0750.07.85E-055.24E-0760.01.96E-036.54E-05 -1.96E-036.54E-05 -1.96E-036.54E-0540.01.96E-036.54E-0550.01.96E-036.54E-0560.04.91E-028.18E-03 -4.91E-028.18E-03 -4.91E-028.18E-0340.04.91E-028.18E-0350.04.91E-028.18E-0360.03.14E-064.19E-09 -3.14E-064.19E-09 -3.14E-064.19E-0950.03.14E-064.19E-0965.03.14E-064.19E-0980.07.85E-055.24E-07 -7.85E-055.24E-07 -7.85E-055.24E-0750.07.85E-055.24E-0765.07.85E-055.24E-0780.01.96E-036.54E-05 -1.96E-036.54E-05 -1.96E-036.54E-0550.01.96E-036.54E-0565.01.96E-036.54E-0580.04.91E-028.18E-03 -4.91E-028.18E-03 -4.91E-028.18E-0350.04.91E-028.18E-0365.04.91E-028.18E-0380.0
Hs[m]--5.55.55.5--5.55.55.5--5.55.55.5--5.55.55.5--4.54.54.5--4.54.54.5--4.54.54.5--4.54.54.5----------------
Tp[m/s]--11.211.211.2--11.211.211.2--11.211.211.2--11.211.211.2--10.210.210.2--10.210.210.2--10.210.210.2--10.210.210.2
Hmax[m]
Tz[s]0.00.07.1797.27.20.00.07.27.27.20.00.07.27.27.20.00.07.27.27.20.00.06.56.56.50.00.06.56.56.50.00.06.56.56.50.00.06.56.56.5--
Lo(m)--80.680.680.6--80.680.680.6--80.680.680.6--80.680.680.6--66.866.866.8--66.866.866.8--66.866.866.8--66.866.866.8--------------
L1(m)--80.380.580.5--80.380.580.5--80.380.580.5--80.380.580.5--66.866.866.8--66.866.866.8--66.866.866.8--66.866.866.8
L2(m)--80.380.580.5--80.380.580.5--80.380.580.5--80.380.580.5--66.866.866.8--66.866.866.8--66.866.866.8--66.866.866.8
error(m)--0.00.00.0--0.00.00.0--0.00.00.0--0.00.00.0--0.00.00.0--0.00.00.0--0.00.00.0--0.00.00.0
c(m/s)
10.51910.510.5
11.211.211.2
10.510.510.5
11.211.211.2
10.510.510.5
11.211.211.2
10.510.510.5
11.211.211.2
8.78.78.7
10.210.210.2
8.78.78.7
10.210.210.2
8.78.78.7
10.210.210.2
8.78.78.7
10.210.210.2
Uw[m/s]0.000.000.400.190.090.000.000.400.190.090.000.000.400.190.090.000.000.400.190.090.000.000.080.020.000.000.000.080.020.000.000.000.080.020.000.000.000.080.020.00
Aw(m/s2)0.000.000.350.160.070.000.000.350.160.070.000.000.350.160.070.000.000.350.160.070.000.000.070.020.000.000.000.070.020.000.000.000.070.020.000.000.000.070.020.00
UcKCRe[m/s]=Uw*Tz/D =Utot*D/ny0.050.00 7.69E+010.040.00 6.15E+010.001445.10 6.19E+020.00667.29 2.86E+020.00306.54 1.31E+020.110.00 8.46E+020.100.00 7.69E+020.00289.02 3.10E+030.00133.46 1.43E+030.0061.31 6.57E+020.230.00 8.85E+030.220.00 8.46E+030.0057.80 1.55E+040.0026.69 7.15E+030.0012.26 3.28E+030.620.00 1.19E+050.610.00 1.17E+050.0011.56 7.74E+040.005.34 3.58E+040.002.45 1.64E+040.050.00 7.69E+010.040.00 6.15E+010.00246.87 1.16E+020.0060.28 2.84E+010.0014.71 6.92E+000.110.00 8.46E+020.100.00 7.69E+020.0049.37 5.81E+020.0012.06 1.42E+020.002.94 3.46E+010.230.00 8.85E+030.220.00 8.46E+030.009.87 2.90E+030.002.41 7.09E+020.000.59 1.73E+020.620.00 1.19E+050.610.00 1.17E+050.001.98 1.45E+040.000.48 3.55E+030.000.12 8.65E+02
k/D0.5000.5000.5000.5000.5000.1000.1000.1000.1000.1000.0200.0200.0200.0200.0200.0040.0040.0040.0040.0040.5000.5000.5000.5000.5000.1000.1000.1000.1000.1000.0200.0200.0200.0200.0200.0040.0040.0040.0040.004
Cm0.50.51.01.01.00.50.51.01.01.00.50.51.01.01.00.50.51.01.01.00.50.51.01.01.00.50.51.01.01.00.50.51.01.01.00.50.51.01.01.0
CD1.21.21.21.21.21.21.21.21.21.21.21.21.21.21.20.80.81.21.21.21.21.21.21.21.21.21.21.21.21.21.21.21.21.21.20.80.81.21.21.2
Reduction factoron CD due to 3D0.580.580.580.580.580.580.580.580.580.580.580.580.580.580.580.580.580.580.580.580.580.580.580.580.580.580.580.580.580.580.580.580.580.580.580.580.580.580.580.58
FM[N]0.00E+000.00E+003.03E-061.40E-066.42E-070.00E+000.00E+003.78E-041.75E-048.02E-050.00E+000.00E+004.73E-022.18E-021.00E-020.00E+000.00E+005.91E+002.73E+001.25E+000.00E+000.00E+006.23E-071.52E-073.71E-080.00E+000.00E+007.79E-051.90E-054.64E-060.00E+000.00E+009.74E-032.38E-035.80E-040.00E+000.00E+001.22E+002.97E-017.25E-02
FD[N]3.67E-062.45E-061.82E-043.87E-058.17E-064.63E-043.83E-044.54E-039.68E-042.04E-045.06E-024.63E-021.14E-012.42E-025.11E-036.18E+005.98E+002.84E+006.05E-011.28E-013.67E-062.45E-066.39E-063.81E-072.27E-084.63E-043.83E-041.60E-049.52E-065.67E-075.06E-024.63E-023.99E-032.38E-041.42E-056.18E+005.98E+009.99E-025.96E-033.55E-04
MassFriction coefficient f[N]1.54E-051.54E-051.54E-051.54E-051.54E-051.93E-031.93E-031.93E-031.93E-031.93E-032.41E-012.41E-012.41E-012.41E-012.41E-013.01E+013.01E+013.01E+013.01E+013.01E+011.54E-051.54E-051.54E-051.54E-051.54E-051.93E-031.93E-031.93E-031.93E-031.93E-032.41E-012.41E-012.41E-012.41E-012.41E-013.01E+013.01E+013.01E+013.01E+013.01E+01
0.20.20.20.20.20.20.20.20.20.20.20.20.20.20.20.20.20.20.20.20.20.20.20.20.20.20.20.20.20.20.20.20.20.20.20.20.20.20.20.2
Possible MovementIs (FM+FD)>f*MassYesNoYesYesYesYesNoYesYesNoYesNoYesNoNoYesNoYesNoNoYesNoYesNoNoYesNoNoNoNoYesNoNoNoNoYesNoNoNoNo
sennepsbomber LGG.xls
Lumps
1 of 1
