Miljø- og Planlægningsudvalget 2009-10
MPU Alm.del
Offentligt
No:2007-61 ver.3.0
Report55.8
55.6
Drogden Sill
BornholmBasinBornholm-gatt
55.4
55.2Latitude [deg North]KriegersFlak
55.0
ArkonaBasin
54.8
nkBaneønRAdlergrund
54.6
Fehmarn BeltOderbank
54.4
54.2-80-60-40-20-10Depth[m]
PomeranianBight11.512.012.513.013.514.014.515.015.5
54.011.0
Longitude [deg East]
Possible hydrographical effects upon inflowingdeep water of a pipeline crossing the flow routein the Baltic Proper
Karin Borenäs, Anders Stigebrandt
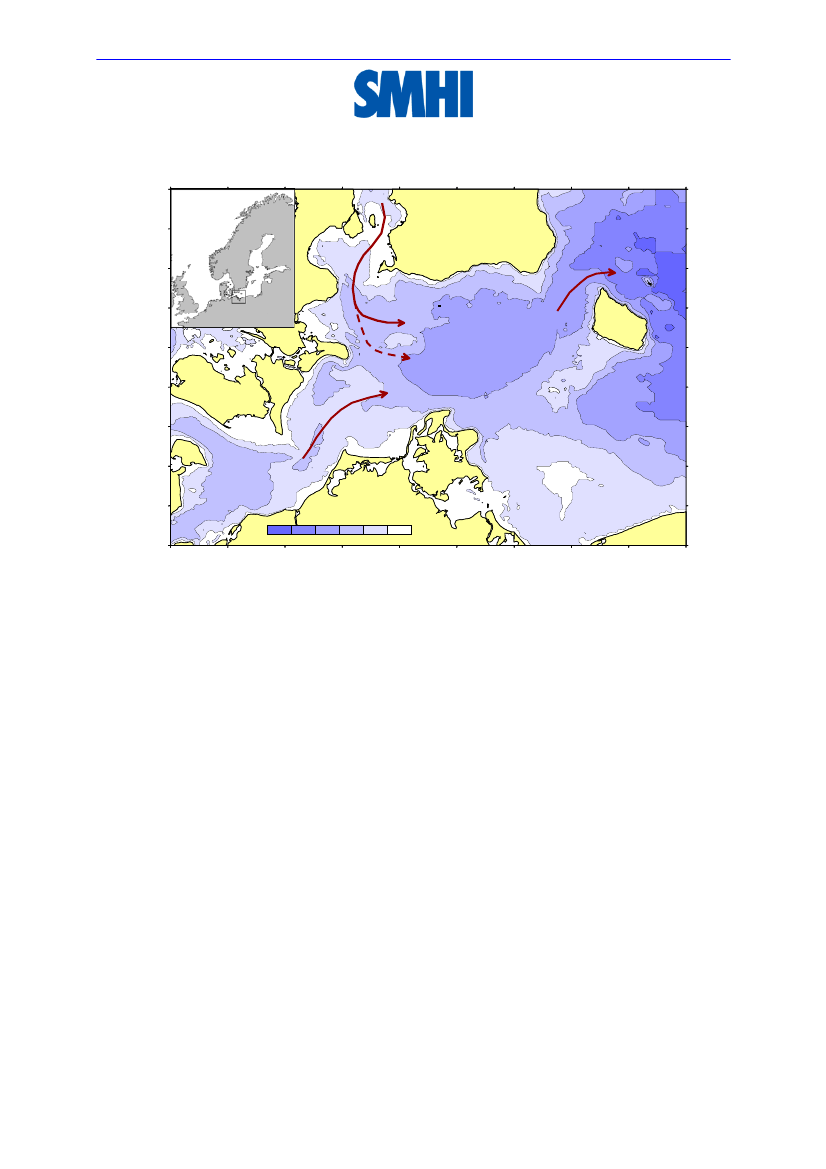
Cover picture.The picture shows the bathymetry of the Arkona Basin and parts of the BornholmBasin (courtesy of: Leibniz Institute for Baltic Sea Research, Warnemünde Germany)
2
ReportAuthor:Client:Reportno.:
Karin BorenäsAnders StigebrandtController:
Ramboll Oil and GasControl date:Diary No.:
2007-61 ver. 3.0Version:
Kjell Wickström
2009-09-11
2007/1871/204
3.0
Possible hydrographical effects upon inflowingdeep water of a pipeline crossing the flowroute in the Bornholm ProperKarin Borenäs, Anders Stigebrandt
Author
Project Leader
SMHISE 601 76 NorrköpingSwedenClient
Ramboll Oil & GasTeknikerbyen 312830 VirumDenmarkDistribution
Ramboll
Classification
ConfidentialKeywords
oceanography, salinity, oxygen, deep water inflow, gas pipelineOther
Denna sida är avsiktligt blank
Contents12344.14.24.34.4
SUMMARY.................................................................................... 1BACKGROUND ............................................................................ 2HYDROGRAPHY OF THE BALTIC PROPER.............................. 3CURRENTS IN THE WESTERN PART OF THE BALTIC SEA ... 7General description............................................................................... 7Observed bottom currents ................................................................... 7Modeled currents................................................................................. 12Density stratification close to the bottom......................................... 15
5677.17.27.3
THE GOTLAND SEA .................................................................. 15PROPERTIES OF WATER EXCHANGE.................................... 18DYNAMICS OF THE DEEPWATER FLOW................................ 19Frictional flow and mixing .................................................................. 19Hydraulic flow and upstream influence............................................. 20Topographic steering.......................................................................... 21
88.18.28.3
INTERACTION BETWEEN THE FLOW OF NEW DEEPWATERAND THE PIPELINES................................................................. 22Frictional flow ...................................................................................... 22Hydraulic flow ...................................................................................... 23Topographic steering.......................................................................... 23
910111213
CREATION AND EFFECTS OF PIPELINE DAMS..................... 24EFFECTS ON STRATIFICATION AND OXYGEN CONDITIONS INTHE BALTIC PROPER............................................................... 24CONCLUSIONS.......................................................................... 26REFERENCES............................................................................ 27APPENDICES ............................................................................. 30
Denna sida är avsiktligt blank
1
Summary
The new deepwater flowing through the Arkona and Bornholm Basins suppliesoxygen and salt to the deepwater of the Baltic Proper. It is therefore vital for thephysical, biogeochemical and ecological states of the Baltic Proper. The properties ofthe new deepwater are subjected to quite large changes in these basins due toentrainment of residing less saline and oxygen rich water. In this report we estimatethe impact of the planned Nord Stream pipelines on the salinity, volume flow andoxygen concentration of new deepwater in the Baltic Proper.At present the turbulence created by the dense bottom current is due to bottom andinterfacial mixing. The total dissipation of the dense bottom current, i.e. thedissipation integrated from the entrance sills in Fehmarn Belt and Öresund to StolpeChannel, is essentially determined by the potential energy of the dense water whenpassing the sills. The mixing of the new deepwater might increase if the mixingefficiency of pipeline-generated turbulence, Rfpipe, is greater than that of turbulencegenerated by the present combination of bottom and interfacial friction, Rf(Rf=0.04).It is found that if the Nord Stream pipelines rise 1.0 m above the sea bed they arecapable to dissipate up to 0.5 % of the total potential energy, depending on the speedof the dense bottom current in the crossing section. If the mixing efficiencies areequal, i.e. Rfpipe=Rf, there should in essence be no impact of the pipelines on theproperties of new deepwater. Using Rfpipe=0.12, which is conservative, it is estimatedthat the increased mixing of the new deepwater will be in the interval 0-1.0 %. In theGotland Basin a possible increase in mixing due to the pipelines should be less thanin the Bornholm Basin owing to generally lower velocities.During large inflow events the Bornholm Strait and the Stolpe Channel mayhydraulically control the transports from the Arkona and Bornholm Basins,respectively, into the Baltic Proper. Since the pipelines will not pass through theseconstrictions there will be no hydraulic effect on the flow. The same holds for theroute in the East and North Gotland Sea where the pipelines will not cross any sillcrests.A possible topographic steering of the inflow, as it passes the pipelines on a slopingbottom, will be of minor importance and it is estimated that less than 1.7% of theinflow can be diverted down the slope by this mechanism in the Bornholm Basin.Since the mixing properties of a diverted flow will be the same as for the maininflow, any effect of topographic steering will be negligible. In the Gotland Basintopographic steering is not relevant.Increased mixing of new deepwater by 0-1.0% means that deepwater salinitydecreases by 0- 0.02 psu and that both the flow rate and the oxygen transportincrease by 0- 1.0%. Such changes are very small compared to the natural variationswhy they cannot have any effect on density driven transport of new deepwater intothe northern parts of the Baltic proper. Increased volume flow will not change thevolume of deepwater of the Baltic proper but it decreases its residence time.Therefore, increased transport of oxygen would tend to improve the oxygenconditions in, and below, the halocline in the Baltic Proper and thereby increase the
No. 2007-61 v3.0 SMHI - Possible hydrographical effects upon inflowing deep water of apipeline crossing the flow route in the Baltic Proper
1
deposition of phosphorus in the deepwater. Although the effect is very small, thepipelines may thus tend to decrease the effects of eutrophication of the Baltic Proper.The estimated total area of dams (caused by closed depth contours) created by thepipeline in the depth interval 40-80 m is less than 25 km2why they cover less than0.06% of the bottom area in that depth interval. Temporary accumulation of denserwater and possibly following anoxia in the dams will therefore have negligibleinfluence on the phosphorus sinks in the Baltic proper.
2
Background
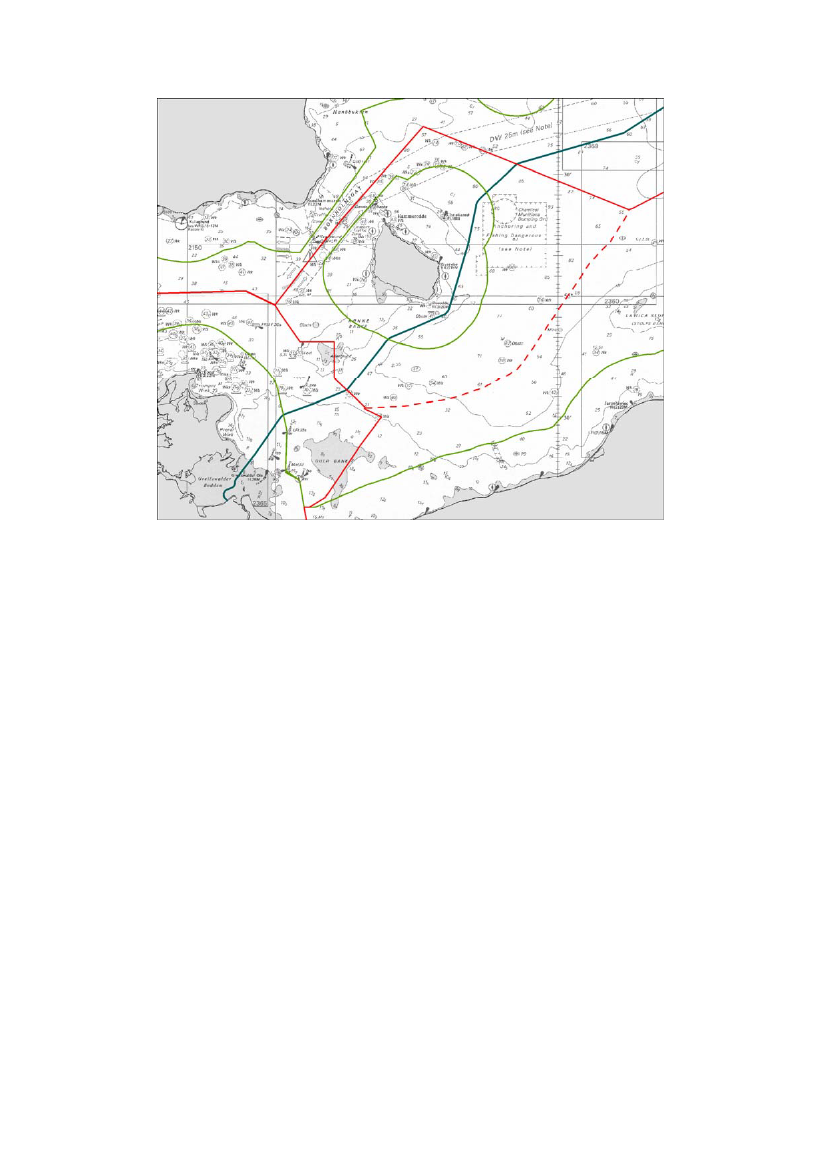
Nord Stream is composed of two parallel gas pipelines that will run through theBaltic Sea from Vyborg, Russia to Greifswald, Germany. The proposed route for thepipelines goes south of Bornholm, seeFigure 1.The inner diameter is fixed to 1153 mm throughout the entire pipe. The outerdiameter can vary due to varying wall thickness (different pressure classes), smallvariation in outer coating and different requirements for outer concrete ballast(depends on bottom stability). However as a conservative assumption the outerdiameter is in this context set to 1.5 m which is not exceeded at any sections of thepipelines. However, the pipes will sink into the bottom sediments why the meanheight above the bottom will be 1.0 meter.The objective of this report is to describe the general oceanographic conditions in thewestern part of the Baltic Sea and to discuss and estimate possible effects that theplanned pipelines may have upon the flow of new deepwater into the Baltic Properand its downstream properties. The pipelines may also create shallow dams, definedby closed depth contours. The dams may accumulate denser water that possibly maydevelop anoxia. The possible effect of this upon the phosphorus sink in the Balticproper will also be discussed.
2
Nr. 2007-61 v3.0 SMHI - Possible hydrographical effects upon inflowing deep water of a
pipeline crossing the flow route in the Baltic Proper
Figure 1.
Projected route (solid blue line) of Nord Stream.
3
Hydrography of the Baltic Proper
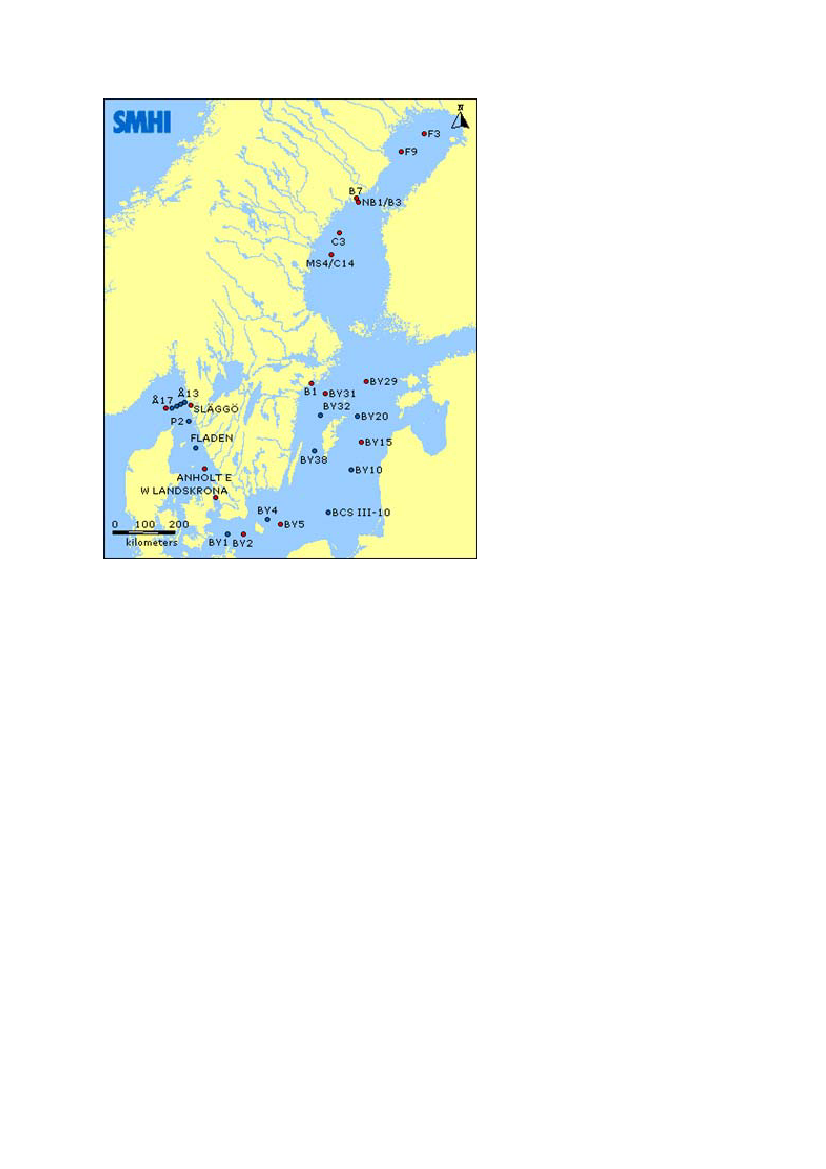
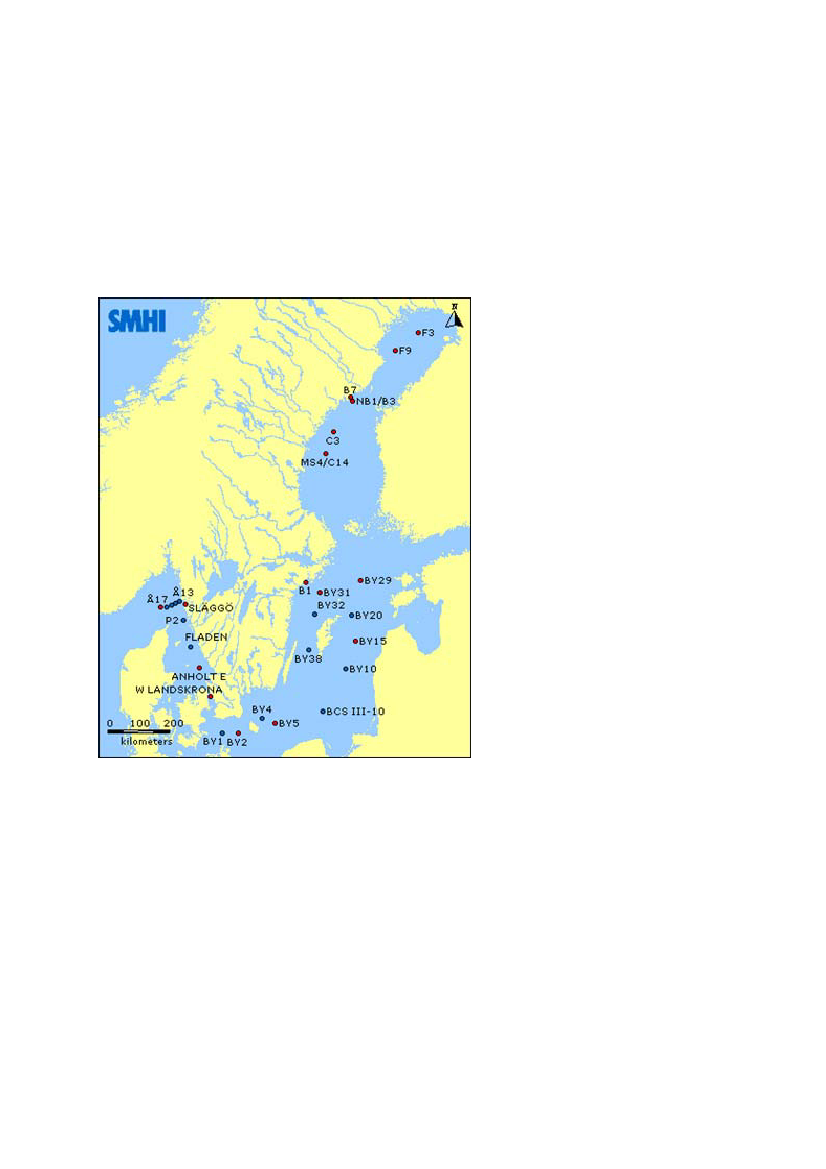
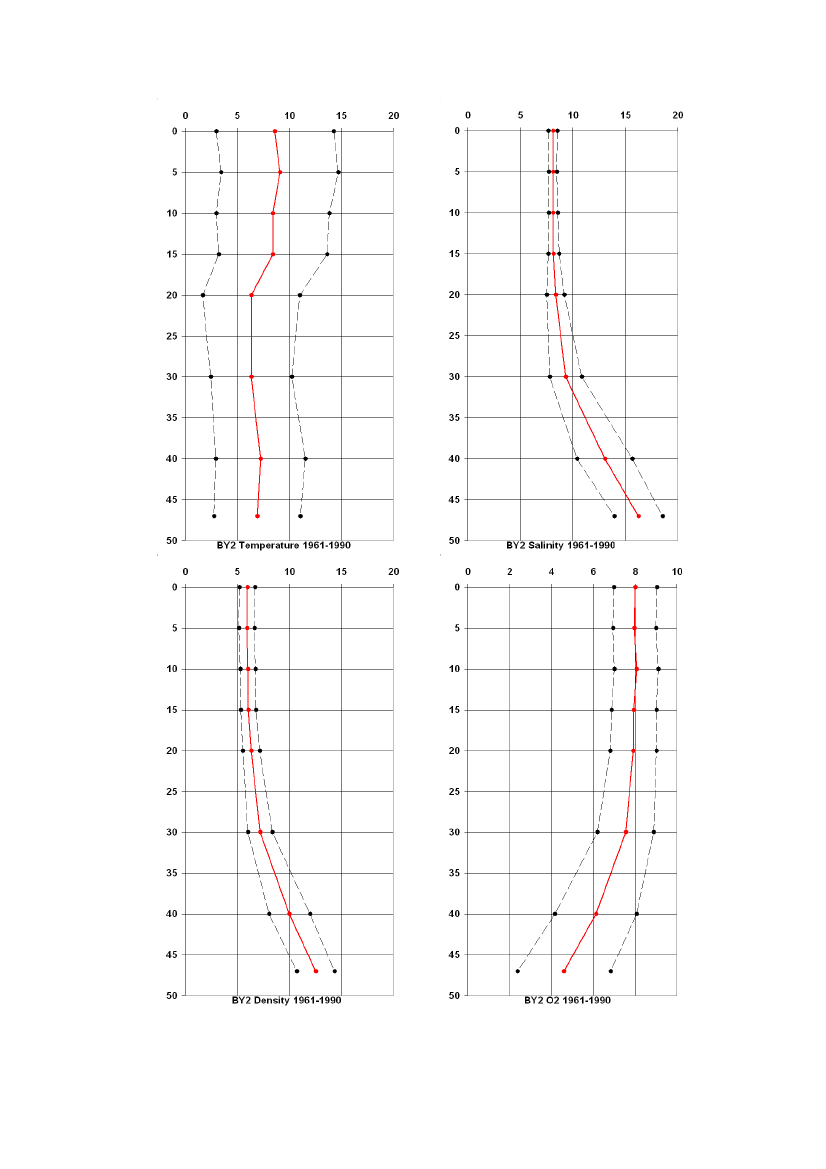
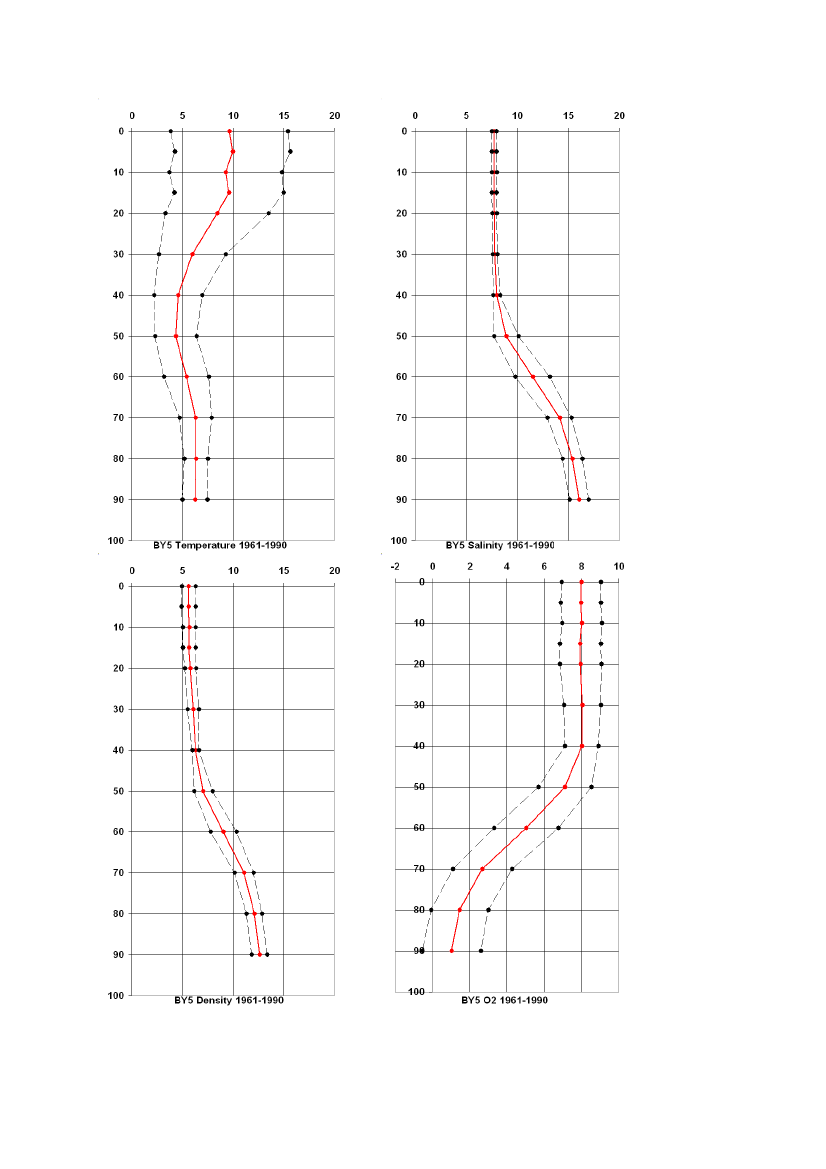
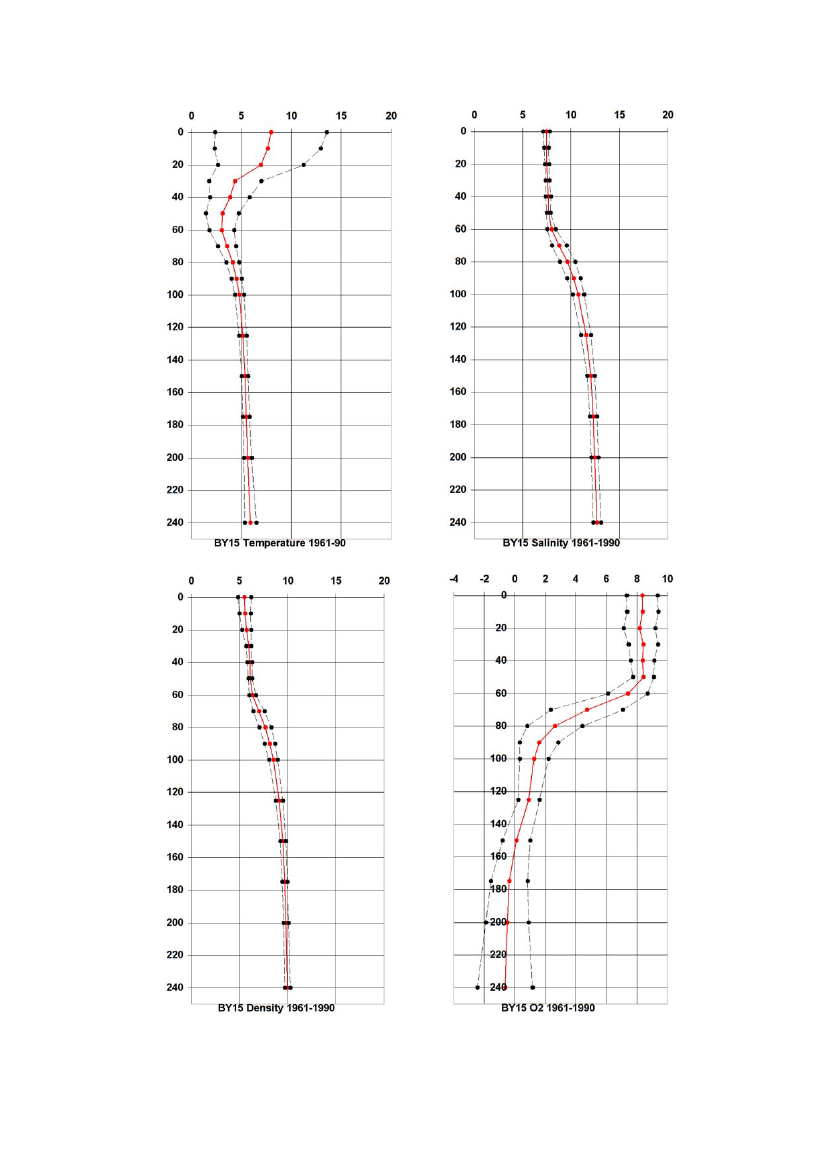
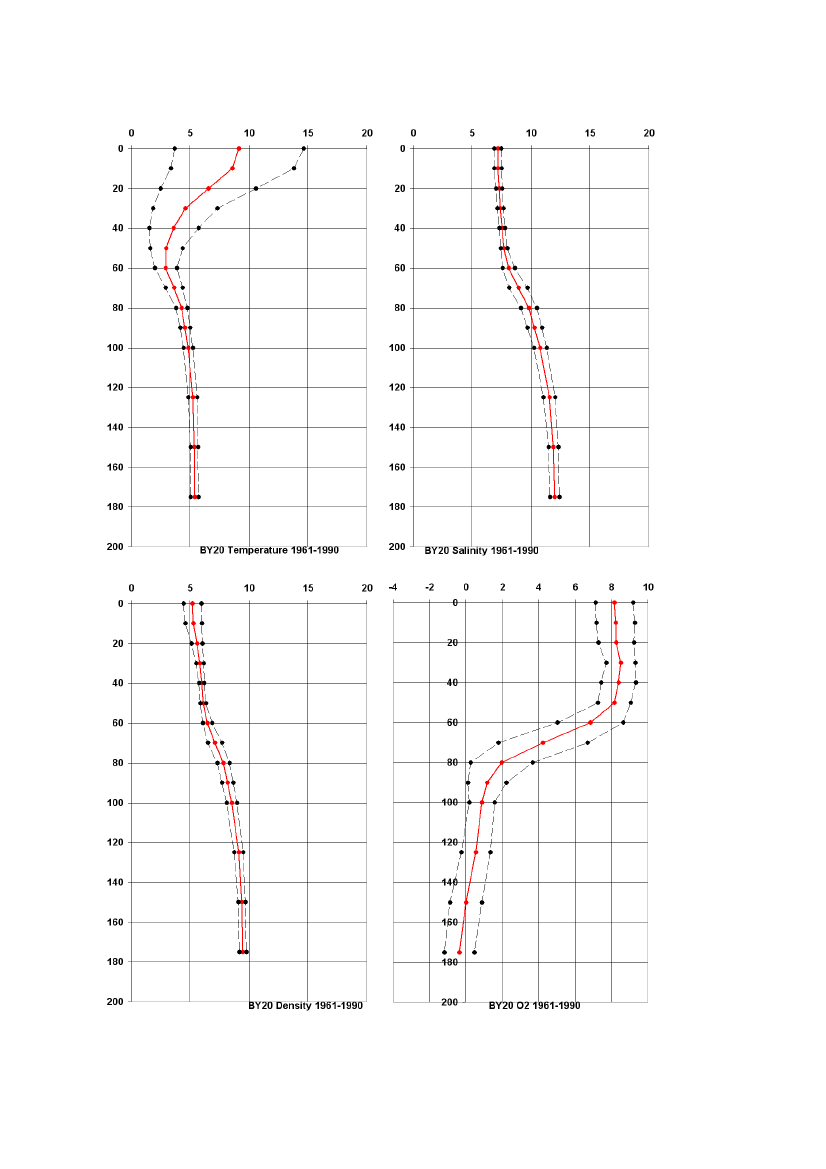
The Baltic proper is characterized by an extensive freshwater excess that produces astrong stratification. In the upper layer the salinity is rather constant whereas largevariations are found in the deeper parts. These are due to the sporadic inflows ofmore saline water. The temperature is subjected to seasonal changes and deviationsfrom the mean temperature may be large. The vertical density distribution is mainlydetermined by the salinity and in the south-western Baltic Sea the largest variationsare found in the deeper parts of the water column. Vertical profiles of the observedtemperature, salinity, density and oxygen have been compiled for 4 hydrographicstations (BY2, BY5, BY15 and BY20) in the Baltic Proper (for the positions, seeFigure 2).Climatological averages and standard deviations at standard depths arepresented in Appendix A.
No. 2007-61 v3.0 SMHI - Possible hydrographical effects upon inflowing deep water of apipeline crossing the flow route in the Baltic Proper
3
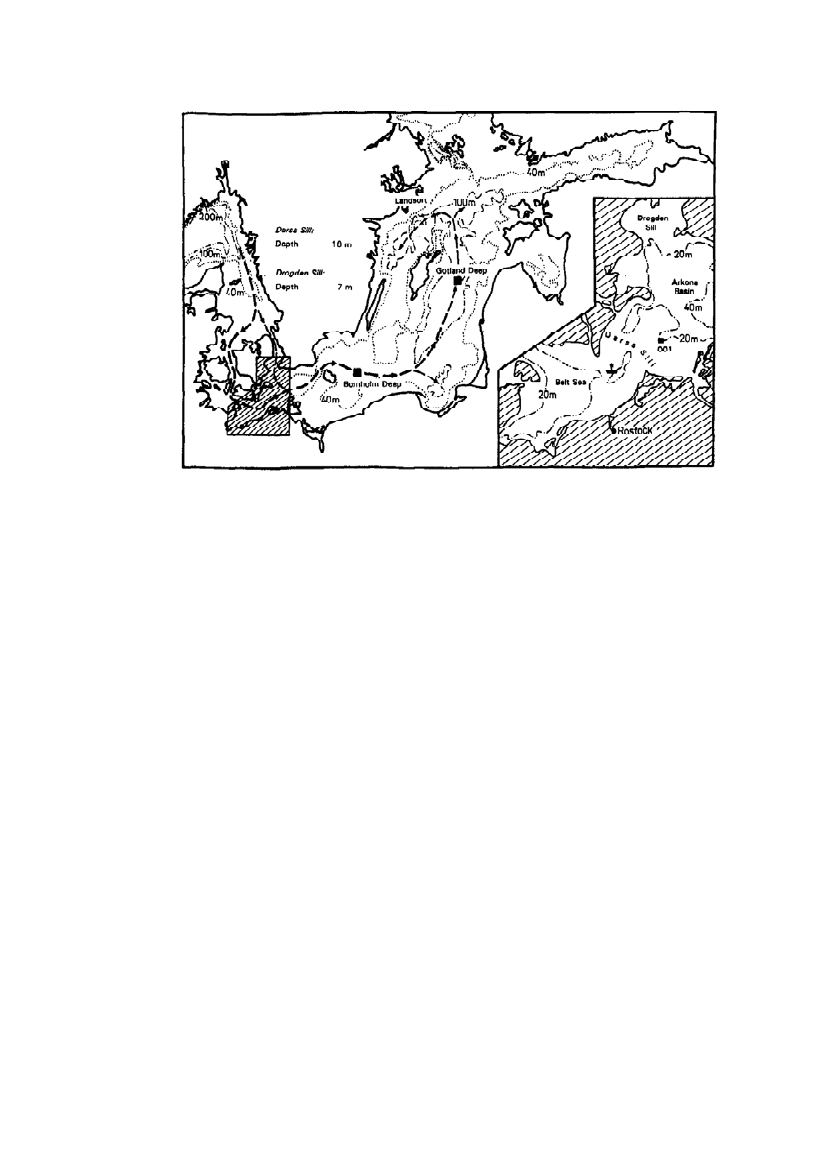
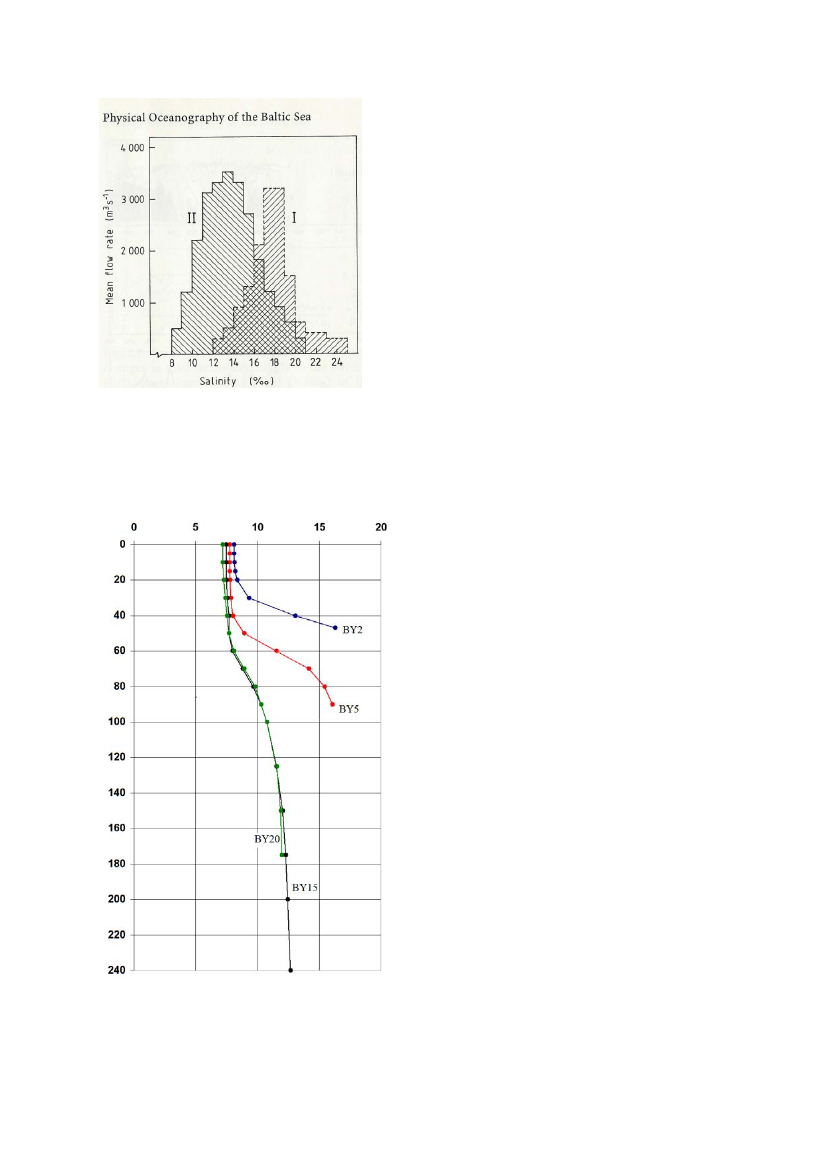
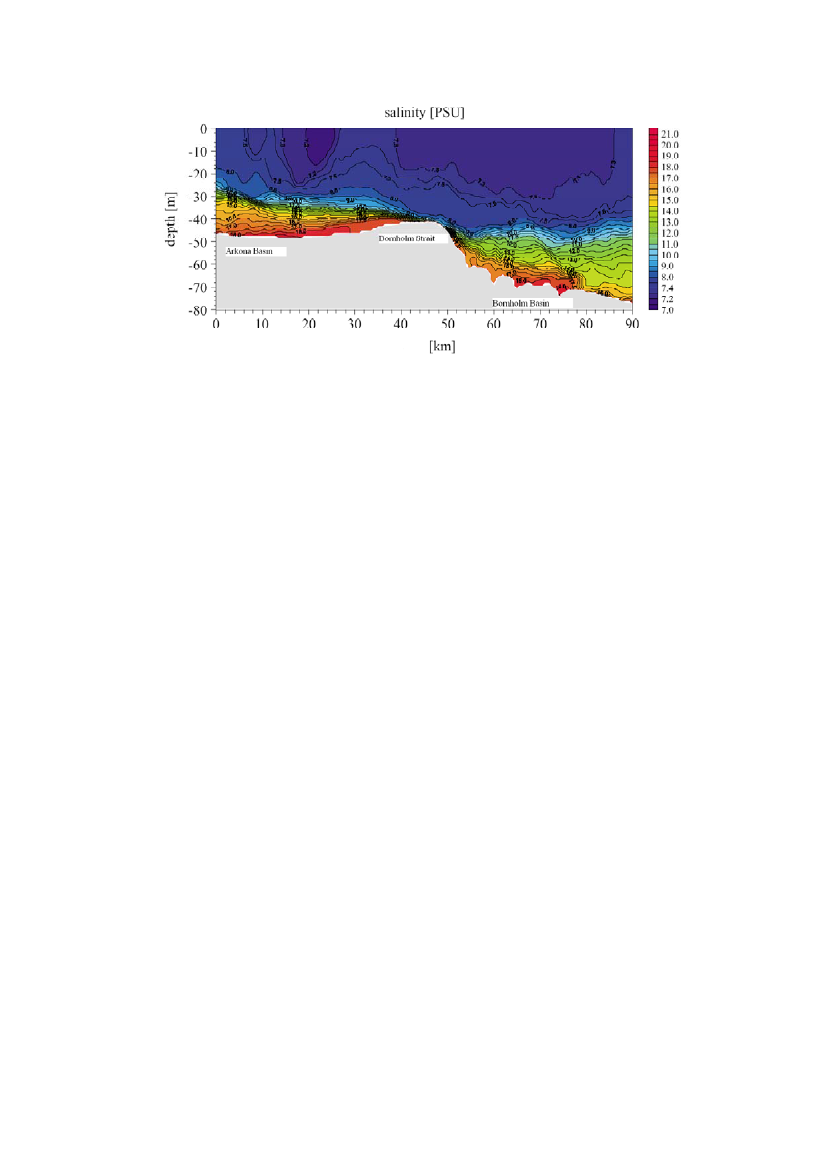
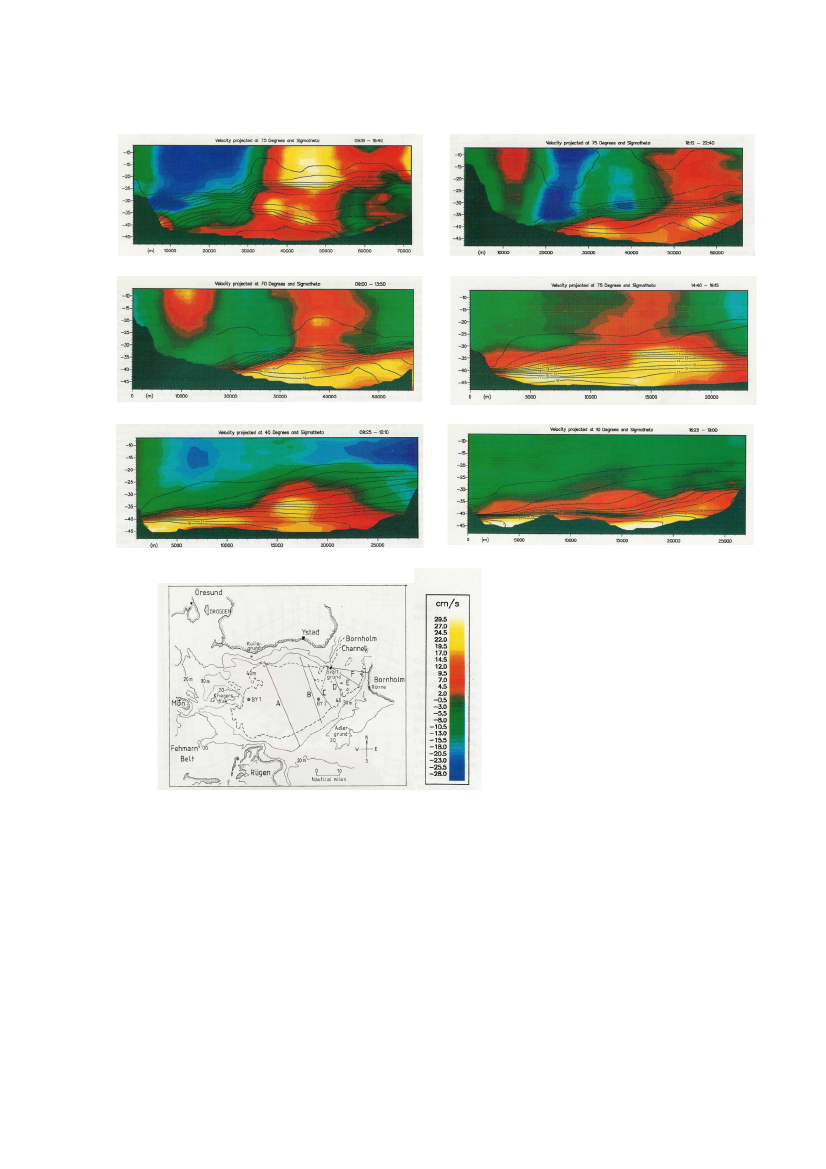
Figure 2. Position of hydrographic stations at which vertical profiles oftemperature, salinity and oxygen are measured on a regular basis. Stations markedwith red pertain to the Swedish National Monitoring Programme while stations inblue are additional stations sampled by SMHI.The Arkona Basin is the first basin that new deepwater flowing into the Baltic properencounters after having crossed the entrance sills in Öresund and Fehmarn Belt(Figure3).The deepwater flows along the bottom as a gravity-forced dense bottomcurrent that mixes with resident Baltic surface water. The salinity of the inflowingdeepwater therefore decreases as the flow proceeds into the basin and at the sametime the volume flow increases (seeFigure 4,showing flow of deepwater of varioussalinity at the entrance sills and just upstream the Bornholm Channel). Waterentering through Öresund may have a salinity of 30 psu but the highest salinity of thedeepest water in the East Gotland Basin varies around 13 psu. The change in salinityalong the path is demonstrated inFigure 5.Dense bottom currents coming from Öresund and Fehmarn Belt replenish adeepwater pool in the Arkona Sea that looses water by the dense bottom currentcarrying water through the Bornholm Strait and into the Bornholm Basin (seeFigure6).A deepwater pool is built up in the Bornholm Basin which is drained through theStolpe Channel. This water sustains the deepwater in the large basins in the interiorof the Baltic Proper.
4
Nr. 2007-61 v3.0 SMHI - Possible hydrographical effects upon inflowing deep water of a
pipeline crossing the flow route in the Baltic Proper
Figure 3. Map showing the topographic features of the Baltic Proper. Inserted isalso the main path of inflowing deepwater. (From Matthäus and Lass, 1994.)Only the largest and saltiest inflows may penetrate into the deepest parts of the largebasins in the interior of the Baltic Proper. In periods with no large inflows themoderately salty new deepwater is interleaved in and just below the halocline in thedeep basins of the Baltic Proper. During such periods anoxia develops in the deepestparts while the halocline area is well ventilated. In a decadal period ending in 1993,wintertime erosion of deepwater into the surface layer, above the halocline, wasextremely strong in the East Gotland Basin whereby the top of the halocline sankfrom its usual position at about 60 m depth to 90 m depth. Such a large decrease ofthe volume of deepwater had not earlier been observed in the salinity record thatstarts in the 1890’ies.The oxygen conditions improved in the depth interval fromabout 80 to 120 m. As a consequence a large amount of phosphorus was deposited onthe bottoms in this depth interval which led to a strong reduction of phosphorus inthe surface water (Conley et al., 2003; Stigebrandt and Gustafsson, 2007). This inturn led to reduced biological production and there were no strong summer blooms ofcyanobacteria.Dense bottom currents entrain ambient water from above themselves. In theBornholm Basin, there is always a gradient of upward increasing oxygenconcentration in the depth interval where the dense bottom currents usually run, i.e.from 70 m depth to the top of the halocline at 40-50 m depth (see Appendix A). Thewater mixed into a dense bottom current will therefore contribute to increasedoxygen transport by the current. The deepwater in the basins of the Baltic properobtains oxygen mainly by the new deepwater. If the supply of deepwater increasesdue to increased mixing in the Bornholm Basin there will also be an increasedoxygen supply to these basins.
No. 2007-61 v3.0 SMHI - Possible hydrographical effects upon inflowing deep water of apipeline crossing the flow route in the Baltic Proper
5
Figure 4. Distribution of flows into the Baltic Sea among different salinities atentrance sills (I) and in the Arkona Sea (II) respectively. Distribution I is a smoothedversion of model computations (Stigebrandt, 1983) and II is a slightly smoothedversion of a distribution computed from hydrographical data (Stigebrandt, 1987b).(From Stigebrandt, 2001)
Figure 5. Salinity profiles (psu), based on climatological data presented inAppendix A, roughly along the pathway of deep water inflow. Station BY2 is locatedin the Arkona Basin, BY5 in the Bornholm Basin and, BY15 and BY20 in the BalticProper (Figure 2).6Nr. 2007-61 v3.0 SMHI - Possible hydrographical effects upon inflowing deep water of apipeline crossing the flow route in the Baltic Proper
Figure 6. Salinity along a section from the Arkona Basin to the Bornholm Basin,passing the Bornholm Strait in February 2003. (From Piechura and Beszyńska-Möller, 2003.)
4
Currents in the western part of the Baltic Sea
In this chapter we try to synthesize, from observations and model results, sometypical properties of currents and density stratification near the bottom in the westernpart of the Baltic Sea.4.1General description
Currents in the sea are forced in many ways due to adjustment to local and regionaleffects of wind forcing and density differences. Inertial and internal waves aregenerally occurring responses that may have different amplitudes in different areasdue to differences in vertical stratification and water depth. Barotropic seiches aredependent on the specific topography of the basin. In the Arkona and BornholmBasins there is a strong specific component due to the water exchange betweenKattegat and the Baltic proper that causes strong temporary currents of newdeepwater along the bottom in the Arkona Basin, and in the Bornholm Strait(Figure8).4.2Observed bottom currents
A number of measurements of the bottom currents in the basins and straits of thewestern part of the Baltic Sea have been carried out during the last 35 years. Many ofthese observations have been collected during expeditions of limited duration butsome long-term time series have become available during the last couple of years.Below some results from field observations have been gathered for each of thedifferent areas.Arkona Basin:
As a part of the German MarNet Monitoring Network the automatedstation Arkonabecken (seeFigure 7)has been measuring the currents throughout thewater column since July 2006. The mean speed obtained at 40 m depth for the periodJuly 2006 to August 2007 was 0.11 m/s with a standard deviation of 0.06 m/s. Themaximum measured speed during this period was 0.31 m/s (A. Gyldenfeldt, BSH,pers. comm.).
No. 2007-61 v3.0 SMHI - Possible hydrographical effects upon inflowing deep water of apipeline crossing the flow route in the Baltic Proper
7
Figure 7.
Position of the German MarNet station Arkonabecken.
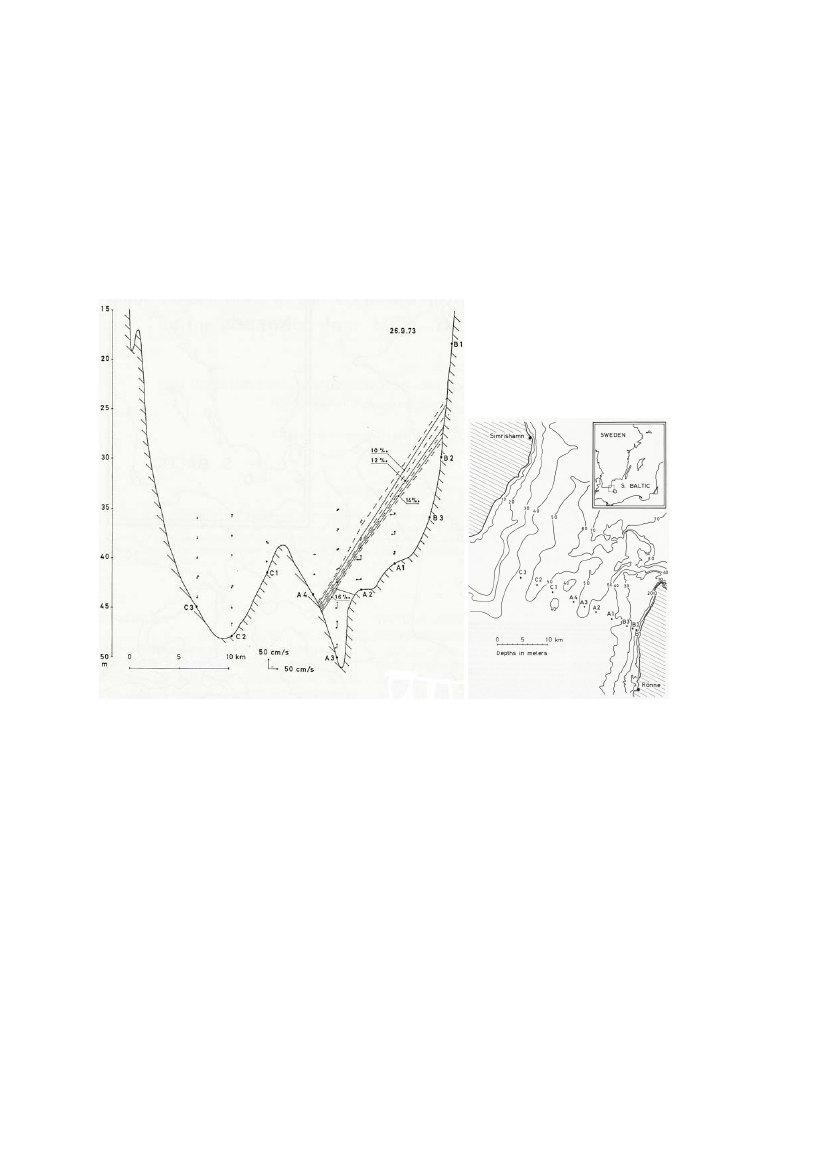
Shortly after the large 1993 inflow a survey was undertaken in the Arkona Basinwhich gave a nearly synoptic picture of the hydrographic conditions and the currentfield (Liljebladh and Stigebrandt, 1996). Measurements were taken along sixtransects, covering the area from the central part of the basin to the Bornholm Strait.The current field was very complex as demonstrated inFigure 8,with maximumvelocities being around 0.3 m/s. A dense bottom pool was found with the largestvelocities encountered near its northern edge where the pycnocline hits the bottom.This picture becomes more clear when barotropic currents are removed and fromgeostrophic computations based on the observed vertical stratification (Liljebladhand Stigebrandt, 1996).
8
Nr. 2007-61 v3.0 SMHI - Possible hydrographical effects upon inflowing deep water of a
pipeline crossing the flow route in the Baltic Proper
A
B
C
D
E
F
Figure 8. Current speed (in colours, positive values represent inflows) and salinity(isohalines) obtained from ship ADCP and CTD, respectively, in 6 different verticalsections (A-F, see the map) in the Arkona Basin and Bornholm Strait in February6-7, 1993. (From Liljebladh and Stigebrandt, 1996).The Polish Institute of Oceanology carried out 7 surveys in the western Balticbetween December 2002 and August 2003, covering the very cold January inflowthis year (Piechura and Beszyńska-Möller, 2003). In the Arkona a basin-widecyclonic circulation was found.Bornholm Strait:
The Bornholm Strait, which connects the Arkona Basin and theBornholm Basin, has a sill depth of 47.3 m according to the Swedish Water Archive(SMHI, 2003). The section at which the flow experiences the maximal constraint isNo. 2007-61 v3.0 SMHI - Possible hydrographical effects upon inflowing deep water of apipeline crossing the flow route in the Baltic Proper
9
not unambiguously defined, but should be close to the section shown in the rightpanel inFigure 9.From June 1973 to December 1974 a total of 17 transects wereconducted across this section with detailed measurements of the currents carried out(Petrén & Walin, 1976; Rydberg, 1980). The dense inflow from the Arkona Basin tothe Bornholm Basin was mainly, but not exclusively, through the southeasternchannel of the Bornholm Strait. For the transect shown inFigure 9high-saline waterwas only found in the southeastern channel. The maximum velocities of theinflowing water were typically≤0.5 m/s during the time period of the study. It maybe noted that the well-mixed layer beneath the halocline is several meters thick(Figure9).
Figure 9. A section across the Bornholm Strait (Sweden to the left) showingisohalines and current components (upward arrows are into the Baltic). The locationof the cross-section is shown in the right panel. (From Petrén and Walin, 1976).The Polish ADCP-measurements across the Bornholm Strait after the 2003 inflowyielded speeds of the dense water of around 0.3 m/s. In January the inflow took placein both channels while a month later the dense water was pushed up on to thesoutheastern slope (Piechura and Beszyńska-Möller, 2003).Rügen-Adlergrund:
The main passage for deep water transport between the ArkonaBasin and the Bornholm Basin is the Bornholm Strait. However, when the deep-water pool is thick enough in the Arkona Basin some water may spill over the sillbetween Rügen and Adlergrund, which has a depth of 28 m. Lass et al. (2001)reported on current observations from a section across this passage. An inflow withenhanced salinity was observed close to Rügen with currents in the range of 0.05-0.1m/s. At a section further downstream (Oderbank-Adlergrund) no deep-water inflowwas detected. From hydrographic measurements obtained at the hydrographic stationBY1 (seeFigure 2)in the Arkona Basin, Stigebrandt (1987b) estimated that about10Nr. 2007-61 v3.0 SMHI - Possible hydrographical effects upon inflowing deep water of a
pipeline crossing the flow route in the Baltic Proper
10% of the total volume flow of new deepwater should take the route between Rügenand Adlergrund. Most of the flow should occur during peaks of major inflows. Thisestimate was made for a sill depth of 30 m and should therefore be anoverestimation.Bornholm Basin:
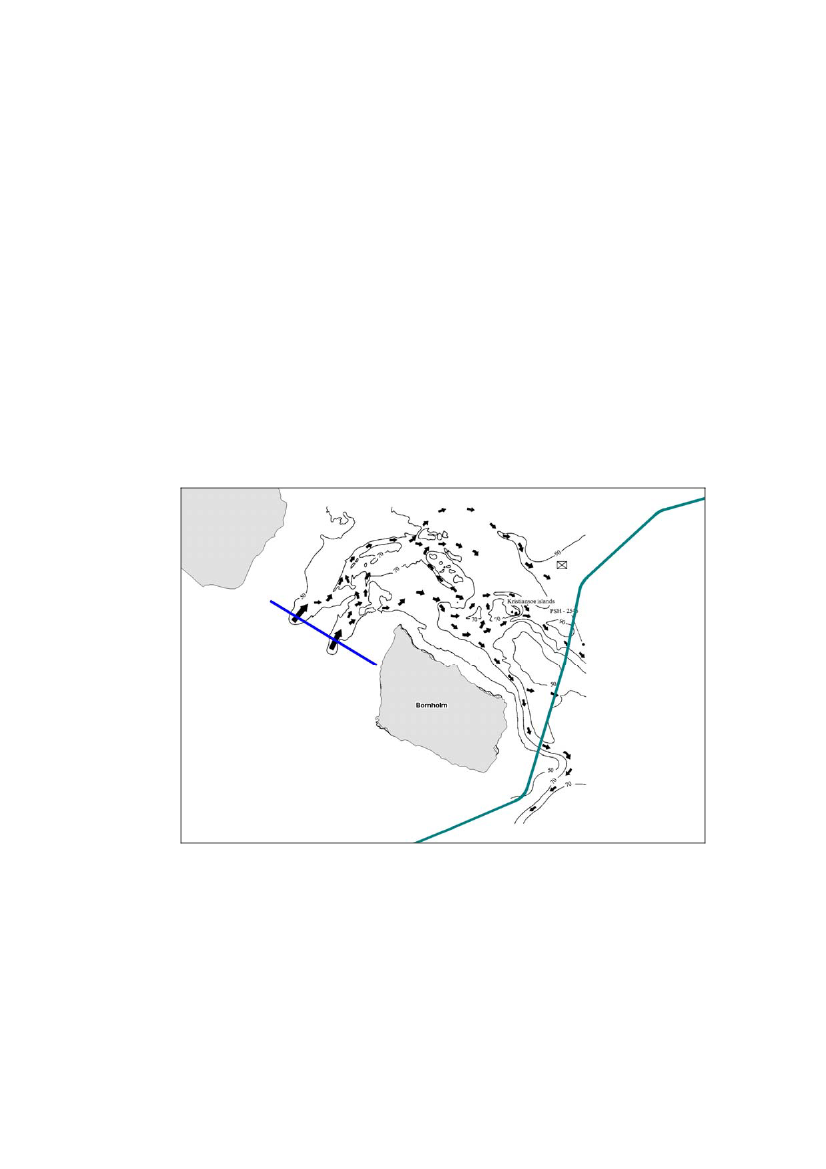
From geomorphological investigations in the western part of theBornholm Basin interesting conclusion can be made about the bottom currents. InSivkov and Sviridov (1994) a map was presented showing the pathways of the near-bottom currents in the area (Figure10).The two channels in the Bornholm Straitpresent bottom features indicating that the largest velocities are found here. Severalpathways for the bottom water were found, after entering the Bornholm Basin, mostof them going in a south-easterly direction moving the water towards the southernflank of the Bornholm Basin. By distinguishing between symmetric and asymmetricerosional-accumulative forms the authors could identify areas dominated by fast,gravitational currents and areas where slower, geostrophic currents dominate. Thismight mirror a dependence on the buoyancy of the currents, with slower currents inareas where the gravitational forcing has disappeared and the water has beeninterleaved at neutral buoyancy. FromFigure 10one should expect relatively slowcurrents along the pipeline section.
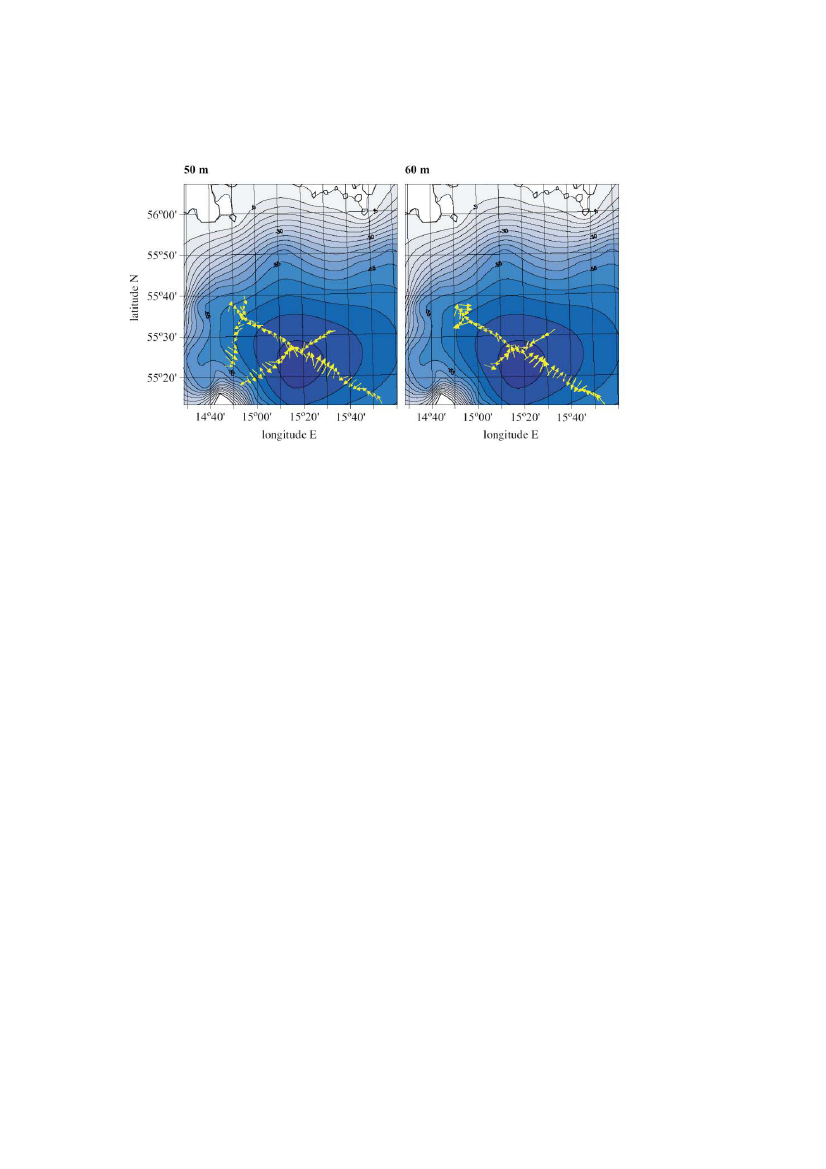
Figure 10. Pathways of nearbottom currents (from geomorphological data).Inserted are the location of the pipeline route and the cross-section shown in Figure9. (Adapted from Sivkov & Sviridov, 1994).From the January 2003 survey Piechura and Beszyńska-Möller (2003) report that themeasured near bottom velocity of the water entering the basin along the southernedge was up to 0.75 m/s. The hydrographic observations and the current field at 50 msuggested a cyclonic circulation in the Bornholm Basin (seeFigure 11).When thedense bottom current meandered along the southern slope baroclinic eddies wereNo. 2007-61 v3.0 SMHI - Possible hydrographical effects upon inflowing deep water of apipeline crossing the flow route in the Baltic Proper
11
developed. It was furthermore concluded that for the 2003 inflow the BornholmBasin was the main area for mixing.
Figure 11. Currents at 50 and 60 m depth obtained from Polish ADCPmeasurements in January 2003 (Piechura and Beszyńska-Möller, 2003).Stolpe Channel:
During one week in August 1976 daily current measurements werecarried out across two sections in the Stolpe Channel (Rydberg, 1976) which has asill depth of around 60 m. The maximum along-channel velocity in the10-m thicklayer closest to the bottom was 0.5 m/s in the western section (close to the sill) whilethe values were lower at the eastern section of the channel.In April-June 1993 continuous current measurements were undertaken by SMHI inthe Stolpe Channel. On the southern side of the channel at 65 m depth the maximumcurrent speed amounted to 0.6 m/s (B. Broman, SMHI, pers. comm.) According toPiechura and Beszyńska-Möller (2003) the speed of the dense bottom currents in theStolpe Channel amounted to 0.2-0.3 m/s in January and April 2003.4.3Modeled currents
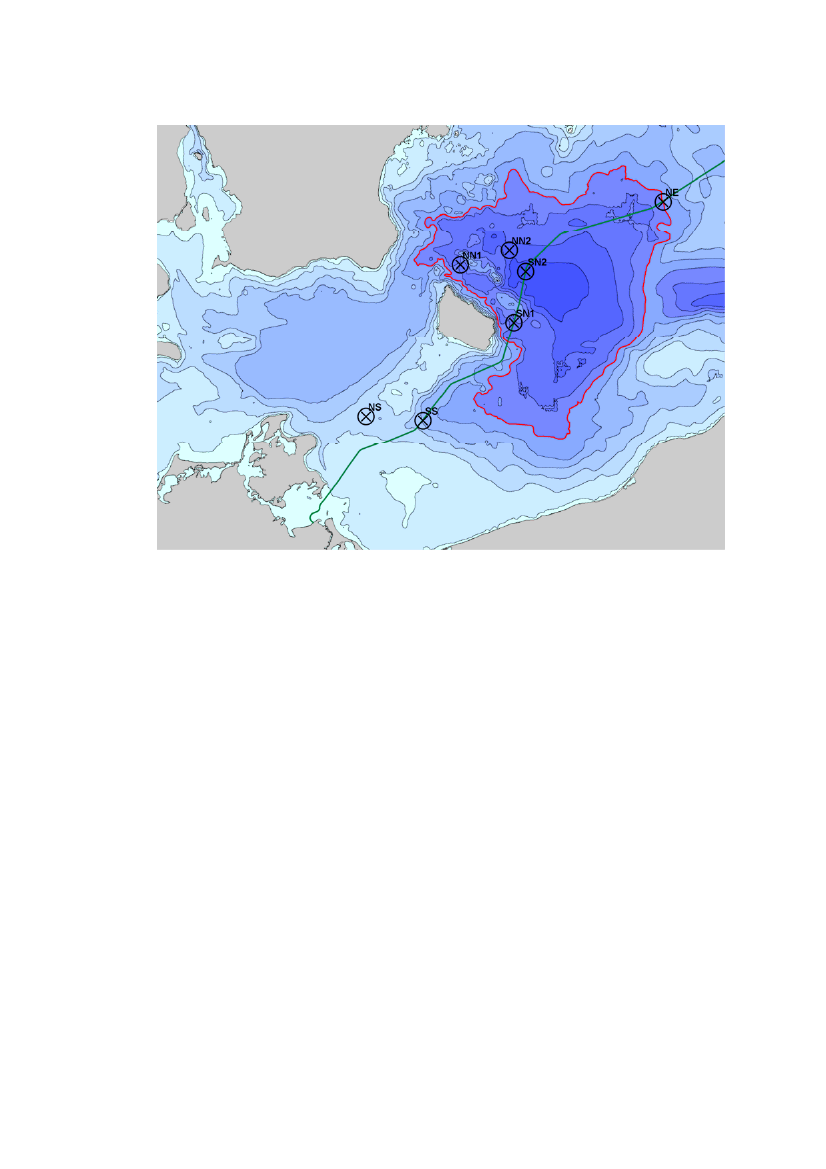
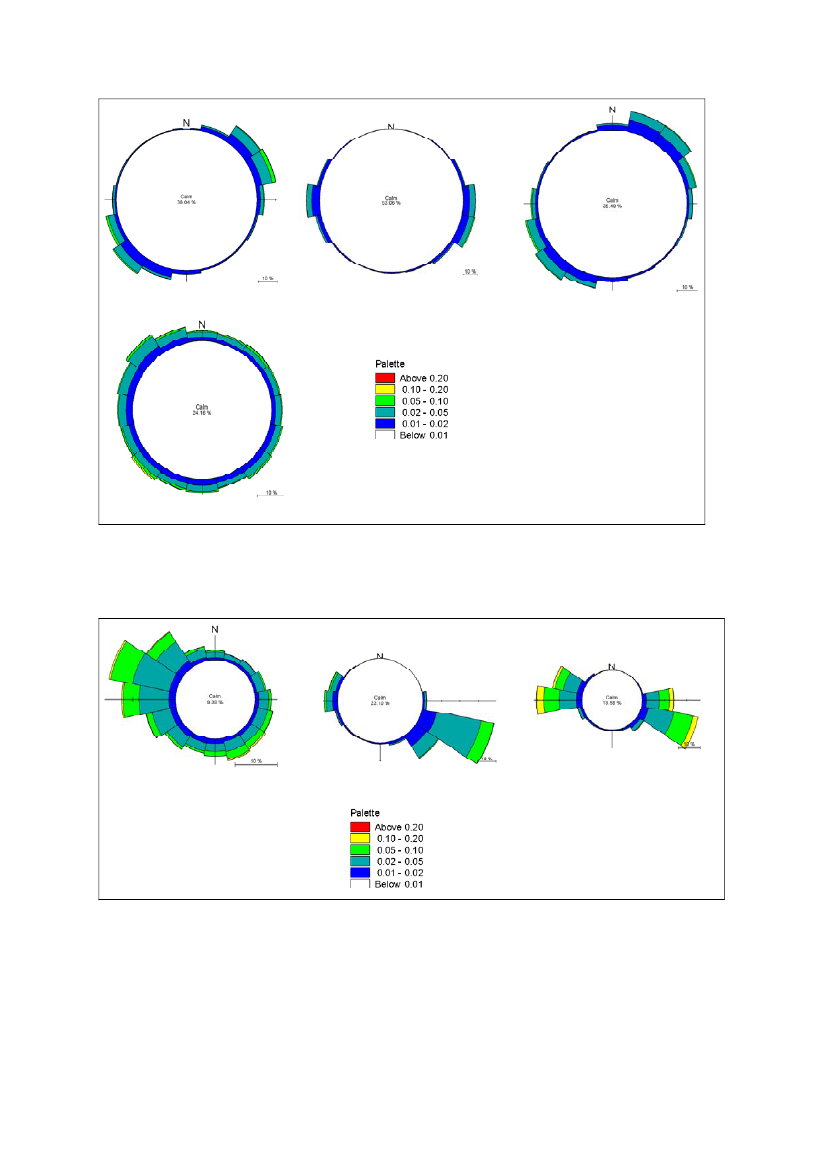
From model runs carried out at DHI using the Mike 3 model(http://www.dhigroup.com/Software/Marine/MIKE3.aspx) bottom currents for theperiod 2004-01-01 to 2008-10-31 have been obtained. The horizontal and verticalresolution of the model is 1 nm and 1 m, respectively, and data output is providedevery 30 minute. InFigure 12the spatial distribution, size and frequency of thebottom currents are presented for seven positions in the Arkona and BornholmBasins . Along the proposed route the velocities are generally very low and alignedin the northeast/southwest or east/west direction (Figure12b).The bottom velocitiesare higher for the three positions denoted NS, NN1 and NN2 (Figure12c).Thehighest velocities (0.1-0.2 m/s) are found on the northern side of the Bornholm Basingoing in either a westerly direction or in an easterly/south-easterly direction. At thenorth-eastern rim of the Bornholm Basin the NE site is where a possible flow alongthe edge, and above the sill depth of the Stolpe Channel, crosses the route of thepipelines. For this location the bottom velocities are also very low and no preferreddirection can be identified.12Nr. 2007-61 v3.0 SMHI - Possible hydrographical effects upon inflowing deep water of a
pipeline crossing the flow route in the Baltic Proper
Figure 12a.Positions at which model data have been extracted. The green line showsthe proposed route while the dark red line indicates the alternative route. Thethinner red line is the depth contour for the Stolpe Channel sill depth.
No. 2007-61 v3.0 SMHI - Possible hydrographical effects upon inflowing deep water of apipeline crossing the flow route in the Baltic Proper
13
SS
SN1
SN2
NE
Figure 12b.Current roses for the bottom layer at different positions along theproposed southern route (see map above), obtained from the MIKE 3 model. (Modeldata have been provided by Ramböll.)
NS
NN1
NN2
Figure 12c. Current roses for the bottom layer at different positions in the Arkonaand Bornholm Basins (see map above), obtained from the MIKE 3 model. (Modeldata have been provided by Ramböll.)
Within the QuantAS project the bottom salinity in the Arkona Basin was modeled fora period of 9 months and a movie (presented on the web-site http://www.io-14Nr. 2007-61 v3.0 SMHI - Possible hydrographical effects upon inflowing deep water of a
pipeline crossing the flow route in the Baltic Proper
warnemuende.de/quantas/index.php) was produced for this time period. One maydeduct from the model results that during these 9 months 4 overflows with enhancedsalinity took place over the Rügen-Adlergrund ridge. The main transport of salinedeep water went, however, at these occasions through the Bornholm Strait. Thisoverall impression from the model results corresponds well to the conclusion basedon hydrographical observations at BY1 reported in Stigebrandt (1987b), mentionedabove under the heading Rügen - Adlergrund.4.4Density stratification close to the bottom
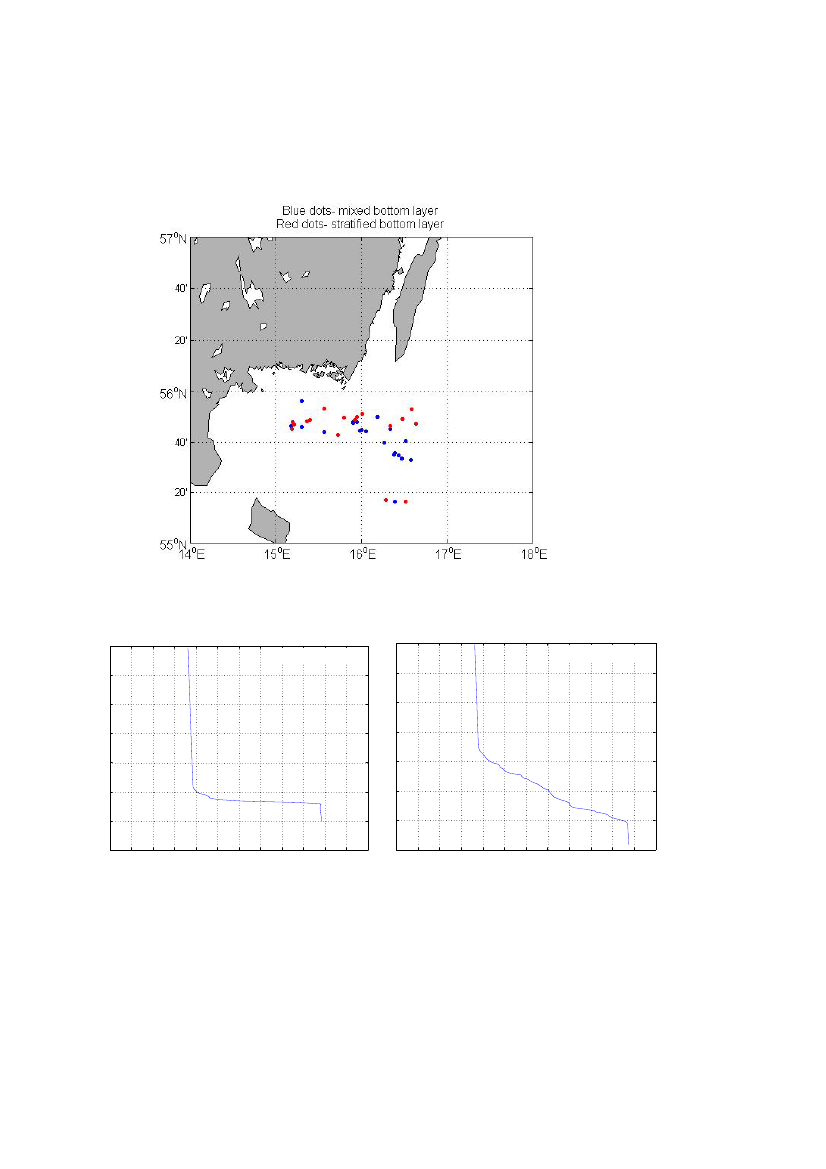
Both the flow resistance (form drag) by the pipelines acting on a crossing current,and the structure of the resulting turbulence, depend on the local verticalstratification in the crossing section (Appendix C). If the water is verticallyhomogeneous, the form drag causes eddies in the current downstream of thepipelines but there is no extra mixing due to the pipelines. However, if the water isvertically stratified close to the bottom and the speed of the crossing current is lessthan the speed of internal waves (waves in the stratification), the flow resistance bythe pipeline takes the form of internal waves that may transfer energy from thecurrent into the stratification. To estimate the flow resistance and the resultingmixing we have investigated the vertical structure of the density field close to thebottom in the Bornholm Basin as discussed below.Around 240 CTD profiles from stations in the Bornholm Basin, with a bottom depthin the range of 40-70 m, were investigated. In many cases the profiles did not extendall the way to the bottom, but for 46 profiles it was possible to judge whether therewas a homogeneous bottom layer present or if the layer below the halocline wasstratified all the way to the bottom. A mixed bottom layer was found in 27 profilesfor which the velocity ciof the lowest internal wave mode was calculated. It wasfound that the mean value of ciwas 0.55 m/s with a standard deviation of 0.18 m/s. Asimilar calculation was also carried out for the stratified bottom layer giving ci=(0.4�0.14) m/s. The reduced gravity, g´, for the 46 profiles was furthermore determinedto (3.4�1.6)×10−2ms-2.
5
The Gotland Sea
The hydrography of the Gotland Sea was touched upon in Chapter 3 with referencesalso to Appendix A where vertical profiles of the observed temperature, salinity,density and oxygen are provided for the Gotland Deep (BY15) and the Fårö Deep(BY20). The deepwater entering the Gotland Basin continues towards the GotlandDeep (249 m) and then further into the Fårö Deep (205 m). The sill separating thesetwo basins is 140 m deep. North of the Fårö Deep the flow divides into two branches,one going into the Gulf of Finland and the other one continuing towards the LandsortDeep. InFigure 13the approximate path of the inflowing water is shown.
No. 2007-61 v3.0 SMHI - Possible hydrographical effects upon inflowing deep water of apipeline crossing the flow route in the Baltic Proper
15
FDSill betweenGD and FD
GD
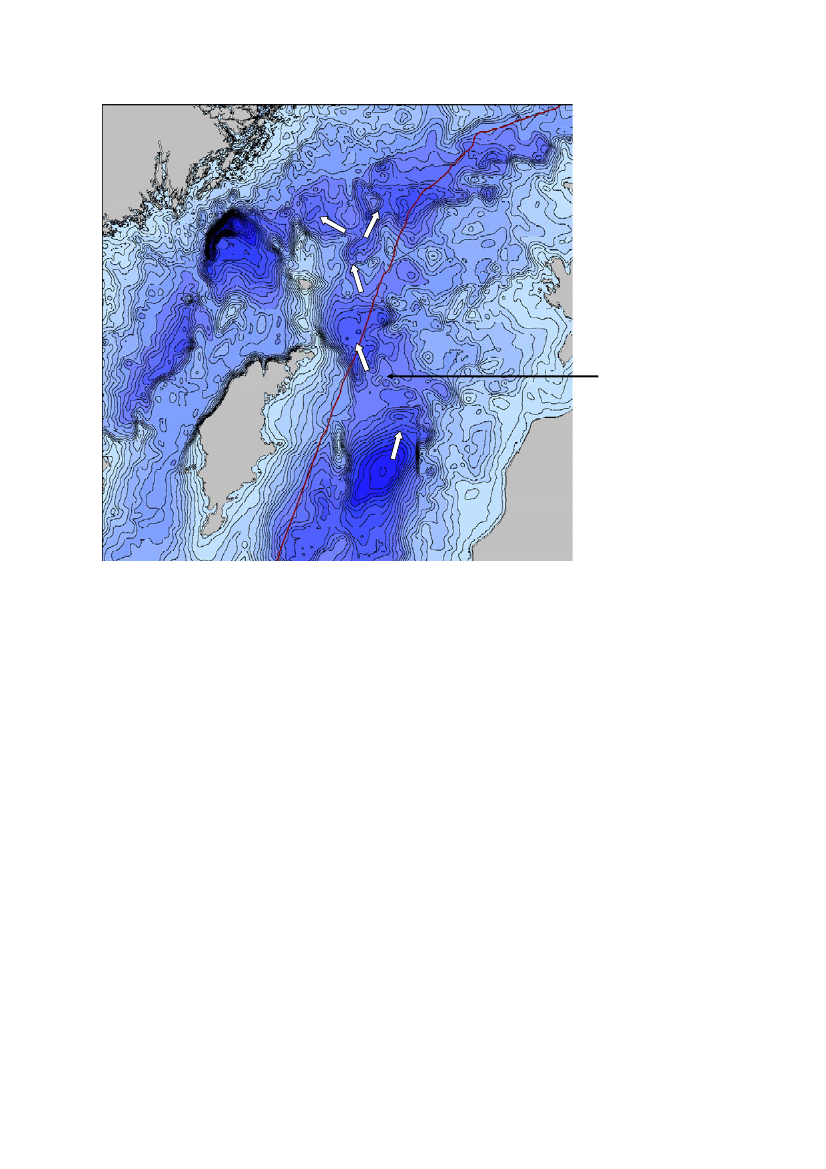
Figure 13. Detailed bathymetry of the East and North Gotland Sea with the route ofthe pipelines shown in red. The approximate path of the deep water is indicated bythe arrows. GD - Gotland Deep, FD - Fårö Deep.Long-term time series of observed deepwater currents in this area are, to ourknowledge, scarce. A complication is the presence of hydrogen sulphide below theperennial pycnocline which requires special mooring techniques. A 3-year longrecord of currents is, however, available from the north-eastern part of the GotlandBasin (Hagen and Feistel, 2004), seeFigure 14for position. Measurements wereobtained at 204 m depth, 20 m above the seabed, from August 1999 to October 2002.The mean velocity in the along-slope (north/south) direction was 0.03 m/s to thenorth with a standard deviation of 0.0003 m/s. The highest velocity recorded in thisdirection during the 3-year period was 0.4 m/s. The mean of the cross-slope velocitywas close to zero.From model runs carried out at DHI using the Mike 3 model, bottom currents for theperiod 2004-01-01 to 2008-10-31 have been obtained for a position where thepipelines crosses the Fårö Deep (seeFigure 14).The horizontal and verticalresolution of the model in the Gotland Sea is 3 nm and 1 m, respectively, and dataoutput is provided every 30 minute. The spatial distribution, size and frequency ofthe bottom currents are presented inFigure 15.The velocities are very small anddirected towards northwest or southeast. The size of the mean currents is comparablewith those observed in the Gotland Basin.
16
Nr. 2007-61 v3.0 SMHI - Possible hydrographical effects upon inflowing deep water of a
pipeline crossing the flow route in the Baltic Proper
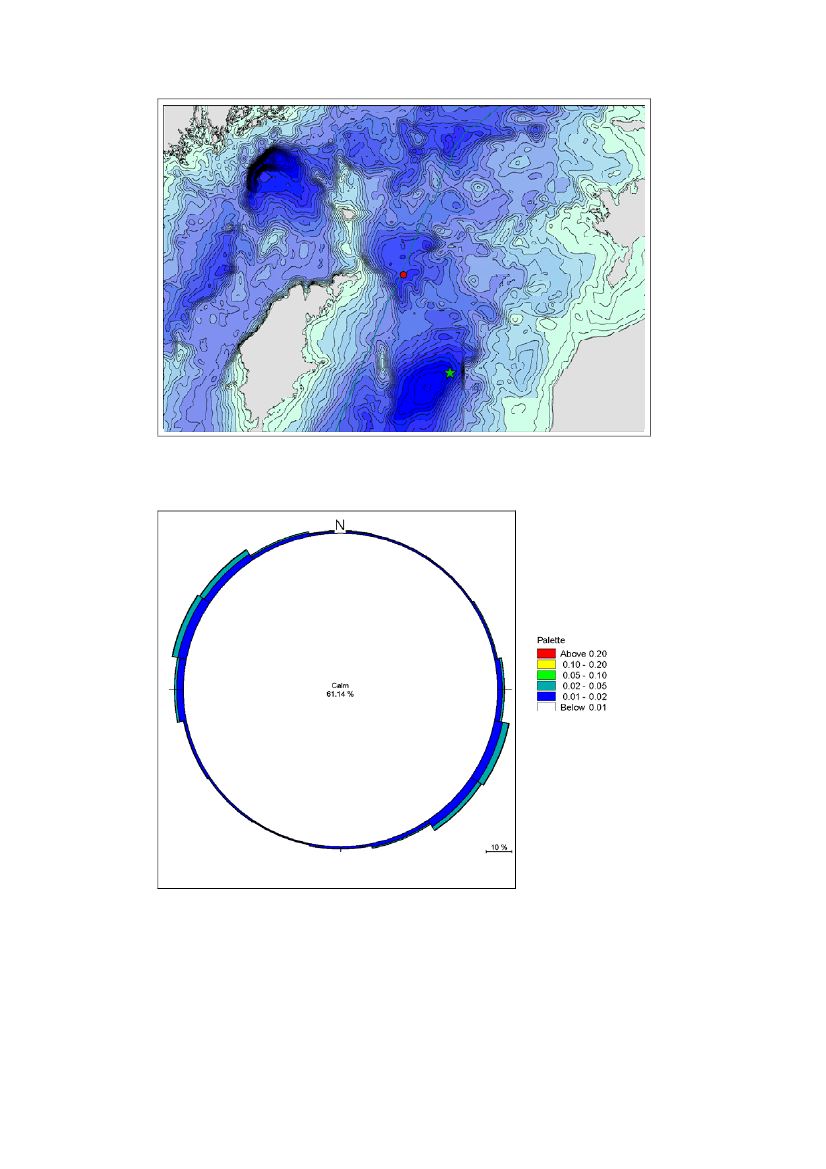
Figure 14. Map showing the position of observed currents (green star) and theposition at which model data have been extracted (red dot). The green line shows theproposed route.
Figure 15. Current rose for the bottom layer in the Fårö Deep, obtained from theMIKE 3 model. (Model data have been provided by Ramböll.)
No. 2007-61 v3.0 SMHI - Possible hydrographical effects upon inflowing deep water of apipeline crossing the flow route in the Baltic Proper
17
6
Properties of water exchange
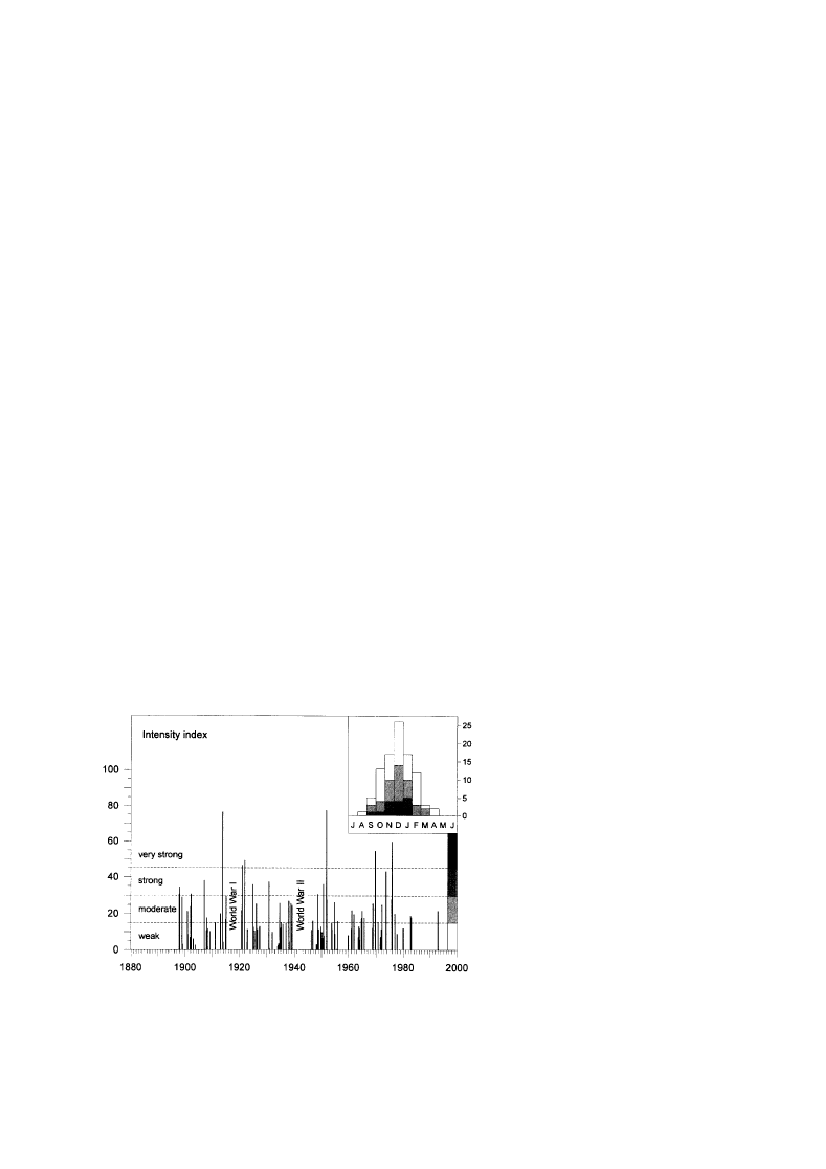
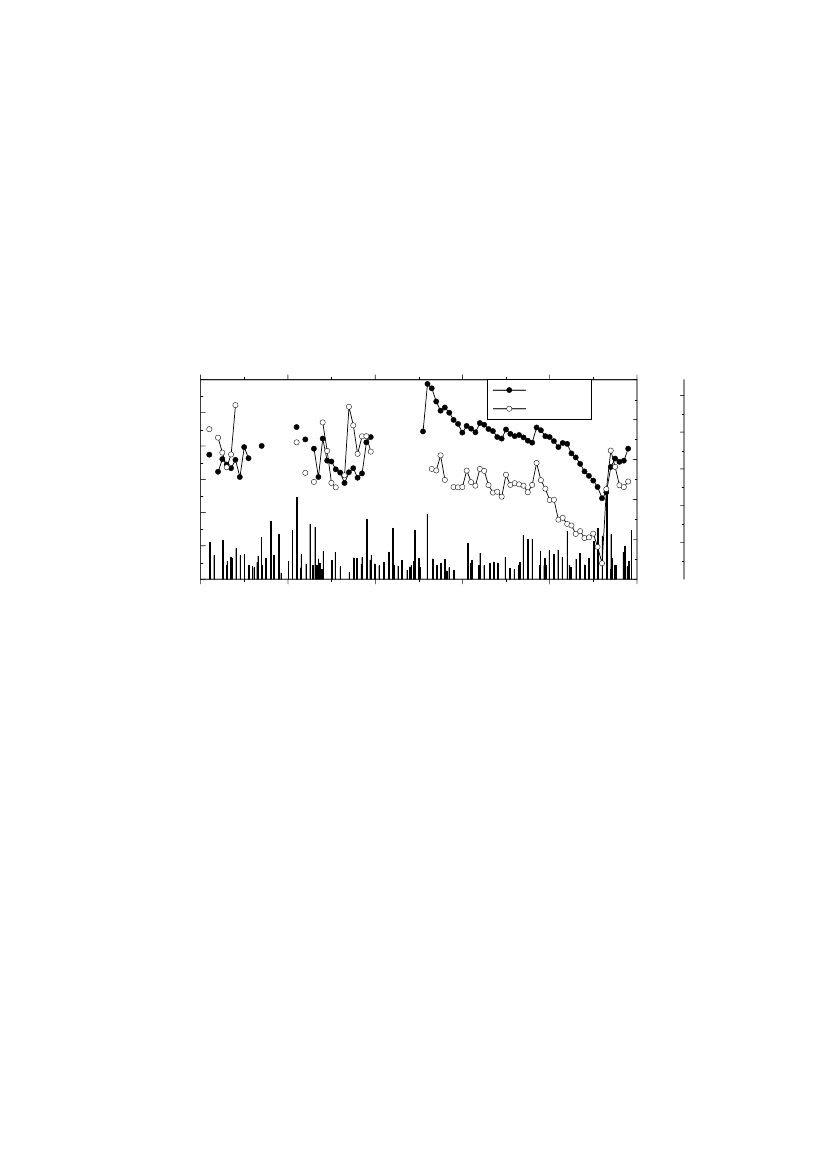
Inflow of new deepwater occurs when, for a period of days, the sea level standshigher in Kattegat than in the south-western Baltic. The inflow for a given sea leveldifference depends on the resistance properties of the straits between Kattegat andArkona Sea. Using the daily mean sea level in Kattegat and the freshwater supply tothe Baltic Sea, the barotropic water exchange through the entrance straits and thehorizontal mean sea level in the Baltic may be modeled quite well, Stigebrandt(1980) and e.g. Gustafsson and Andersson (2001). The latter authors showed that sealevel variations longer than about 15 days in Kattegat can be modeled from the west-east wind over the North Sea which may be estimated from the north-southatmospheric pressure difference estimated from observations at Oksøy and de Bilt.The largest occurring inflow events raise the sea level in the Baltic by about 1 meterin a couple of weeks which implies an accumulated inflow of about 350 km3.Statistically, such large inflows occur only about once a decade as illustrated inFigure 16.Most inflows are much smaller; see e.g. Matthäus and Franck (1992) andGustafsson and Andersson (2001). During an inflow event the salinity of newdeepwater increases with time as the storage of freshwater in the surface waters ofthe Belt Sea and Kattegat decreases. Inflow statistics based on hydrographicalmeasurements at BY1 (for location seeFigure 2)in the Arkona Basin show thatlarger inflows are saltier than smaller inflows (e.g. Stigebrandt, 1987b). Stigebrandt(1983) showed that simple coupled two-layer models of Kattegat and the Belt Sea,that describe the salinity gradients in the entrance area, together with the barotropicmodel mentioned above can be used to compute the salt exchange between Kattegatand the Baltic. Gustafsson and Andersson (2001) showed that even a simpleregression model of the horizontal salinity gradient in Kattegat and the Belt Sea doesa decent job. Using their model, these authors computed the salt fluxes for all majorinflows to the Baltic Sea from 1902 to 1998 (Figure17).Their ranking of the largestinflows compares rather well to a ranking based only on volume flows by Fischerand Matthäus (1996).
Figure 16. Major Baltic inflows and their seasonal distribution (inset) characterizedby an intensity index. (From Schinke and Matthäus, 1998).
18
Nr. 2007-61 v3.0 SMHI - Possible hydrographical effects upon inflowing deep water of a
pipeline crossing the flow route in the Baltic Proper
The results of Gustafsson and Andersson (2001) support the conclusions drawn inStigebrandt (1983) that the exchanges of water and salt between the Kattegat andBaltic Proper are independent of the vertical stratification in the south-western BalticSea. There is essentially no upstream influence from the conditions in the Arkonaand Bornholm Seas on the inflow of new deepwater to the Baltic Proper. However,very strong winds over the Arkona Sea may create thick well-mixed surface layersthat erode new deepwater stored in the basin as discussed in Liljebladh andStigebrandt (1996) and Gustafsson and Andersson (2001). Such a case occurred forinstance in January 1990 when very strong winds homogenized the whole watercolumn in the Arkona Basin whereby the salinity of the surface water increased fromabout 8 psu to 11 psu. This was, however, an exceptional event when the wind speedwas far from its mean value. The properties of the regional wind, here represented bythe conditions at Falsterbo, are shown in Appendix B.6SalinityOxygen
Salt flux (1012kg)
Salinity (psu)
54321192019401960
c
1451312111031
-1-3-5
01900
1980
92000
Figure 17. Computation of the integrated salt flux in major inflows (staples). Alsoshown are salinity and oxygen at 200 m depth in the east Gotland Basin. (Gustafssonand Andersson, 2001, their figure 15).
7
Dynamics of the deepwater flow
This chapter describes dynamical processes that are of importance to the flow ofdeepwater in the Baltic Proper.7.1Frictional flow and mixing
Instabilities of various kinds transfer energy from currents to turbulence. Most of theturbulent energy is dissipated to heat but a small fraction (expressed by the fluxRichardson number – Rf) is used for diapycnal mixing. Mixing efficiency is definedas Rf/(1-Rf). Bottom and interfacial stresses acting on dense gravity currentsgenerate turbulence and all turbulence in the new deepwater may contribute tomixing between the new deepwater and residing water above. Pipelines crossing theroute of the new deepwater will impose non-viscous drag on the current which, forweak stratification manifests itself as eddies downstream of the pipelines or, forstronger stratification, internal lee-waves. This is of immediate interest becauseturbulence generated by lee-waves might have higher Rf-value, and thus highermixing efficiency, than turbulence due to bottom and interfacial stresses (seeNo. 2007-61 v3.0 SMHI - Possible hydrographical effects upon inflowing deep water of apipeline crossing the flow route in the Baltic Proper
Oxygen concentration (ml l-1)19
Appendix C). If so, the new deepwater will be slightly more mixed than at presentdue to the pipelines.Dense gravity currents are driven by their excess buoyancy relative to the ambientwater. The potential energy of new deepwater when it passes the entrance sills,relative to the residing pool of deepwater is spent to drive the current againstfrictional forces so the energy is transformed to turbulent energy. This was utilized ina model of a dense bottom current developed by Stigebrandt (1987a), see AppendixC. For a given flow the model shows that the entrainment of overlying ambient wateris proportional to W2/3Rf where W is the width of the current. The width is knownonly in narrow systems, see an application to the Gullmar Fjord in Arneborg et al.(2004), and in basins with narrow canyons where the current runs. In applications ofthe model to the Baltic the width of the current is tuned; e.g. Stigebrandt (1987a),Omstedt and Axell (2003) and Gustafsson (2003).The potential energy of new deepwater when crossing the entrance sills in FehmarnBelt and Öresund is lost to turbulence generated by bottom and interfacial friction.Of this 4% is used for diapycnal mixing while 96% is dissipated to heat, thusRf=0.04 (Appendix C). The reason for the low mixing efficiency of dense bottomcurrents is probably that the turbulence is mainly generated near the sea bed bybottom friction where water is more or less well-mixed. Turbulence acting in thestratified water closer to or at the interface to the ambient water above might be moreefficient in performing diapycnal mixing. For our computations we also use Rf=0.12to get a conservative highest estimate of the mixing effect, see Appendix C.7.2Hydraulic flow and upstream influence
A change in the cross-section area of a strait or at a sill could lead to alteringupstream conditions which would affect the overflow. Deep-water flows throughstraits and over sills may sometimes be determined just by knowing the upstreamthickness of the bottom layer, the density difference between the upper and lowerlayer and the geometry of the constriction. Estimates of the maximum flow capacityare then achieved by applying the concept of rotating hydraulics for an inviscid flow(Whitehead et al., 1974., Rydberg, 1980, Borenäs and Lundberg, 1986). It isreasonable to assume that if the bottom layer is not too shallow in the upstream basinfriction may here play a limited role. This is in contrast to what is found for thedescending overflow plume on the downstream side of the sill.
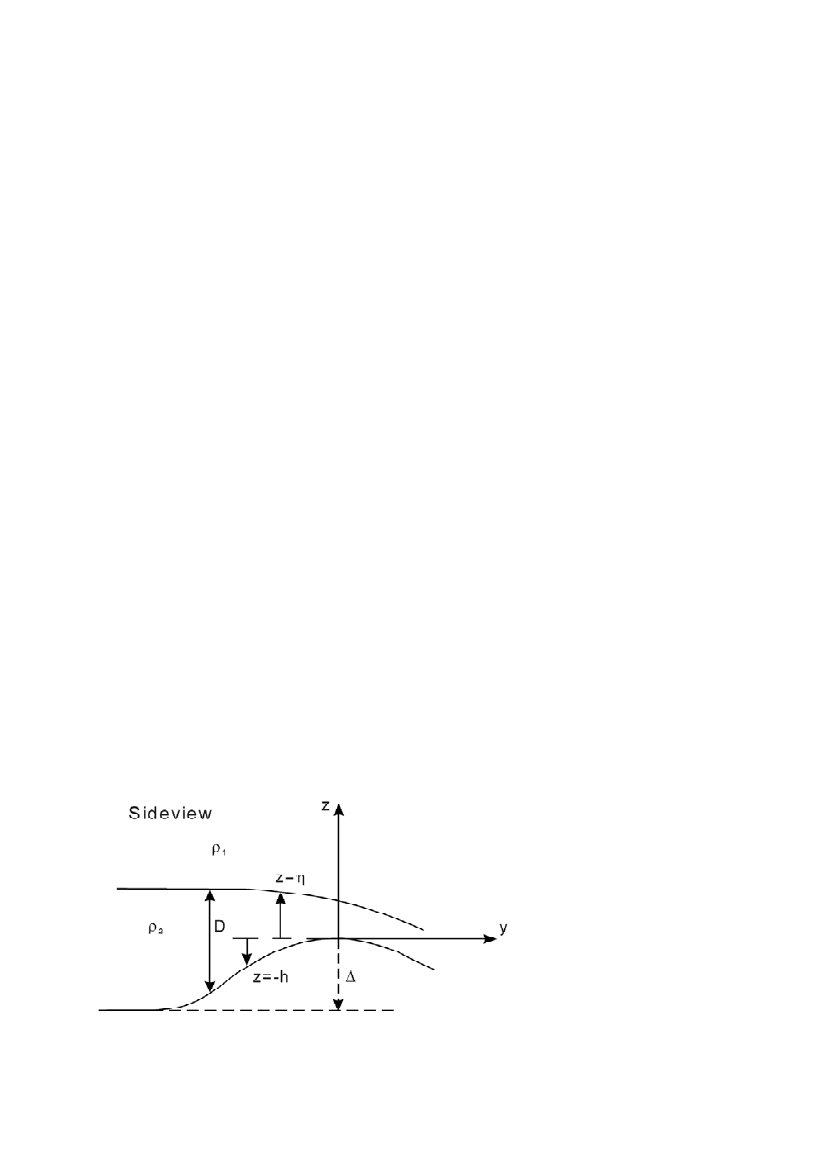
Figure 18. Sketch showing the position of the interface between the bottom layer ofdensityρ2and the upper layer of densityρ1along a channel with a sill heightΔ.20Nr. 2007-61 v3.0 SMHI - Possible hydrographical effects upon inflowing deep water of a
pipeline crossing the flow route in the Baltic Proper
The hydraulic theory is often applied to situations when the depth of the interfacedrops from the upstream side of the sill to the downstream side. For an inviscid flowthe upstream and downstream level can in this case only be connected if the flow atthe top of the sill is critical, which means that the flow velocity has to equal thespeed of a long wave. The flow is then maximized and the sill controls the upstreamheight of the interface. There are two approaches that will be discussed,1. in the first case the flow is locally controlled with regard to an internal longwave.2. in the second case the flow is on average controlled by a rotating internallong wave.For a simplified geometry, with the cross-channel geometry approximated by arectangular, the modeled velocity distribution at the control section differs betweenthe two cases. For the locally controlled flow the velocity is highest on the right handside (looking in the downstream direction) while for the second case the maximumvelocity is found at the left-hand edge of the flow. For both cases (and assuming thatthe depth of the bottom layer in the upstream basin is much larger than depth of thislayer at the top of the sill) the maximum flow rate through the channel is proportionalto the square of the upstream height,η∞, of the interface above the sill level (seeFigure 18).The concept of rotating hydraulic flow is based on the assumption of steady state andthat the frictional effects are negligible compared to the inertial, conditions which aregenerally not satisfied in the western part of the Baltic proper. However, duringperiods of major deep-water inflows the Arkona and Bornholm basins may havelarge and comparatively steady pools of deep water, and at these occasions thehydraulic theory may be justified. This was also concluded by Borenäs et al. (2007)who investigated whether the flow through the Stolpe Channel is hydraulicallycontrolled with regard to a rotating internal wave.According to observations the flow between the Arkona Basin and the BornholmBasin is usually larger in the southeastern channel than in the northwestern (Petrénand Walin, 1976, Piechura and Beszyńska-Möller, 2003).When the theory for alocally controlled flow is used for the actual topography in the Bornholm Strait themaximum velocity is found in the deepest part of the southeastern channel, but thevelocities on the Bornholm flank may be fairly high as well (Rydberg, 1980). If thereis a deep-water flow through the northwestern channel the maximum velocity will belower here than in the southeastern channel.7.3Topographic steering
A dense current flowing along a sloping bottom may be subjected to topographicsteering when encountering small-scale topographic features intersecting the slope.This effect has been investigated by, e.g., Darelius and Wåhlin (2007) who studiedthe steering effect of ridges and canyons on a geostrophic flow. They concluded thatpart of the flow will be channelled down the slope while the rest will continue overthe obstacle. The size of the topographically steered geostrophic transport dependson the geometry of the obstacle, the slope of the bottom, the stratification and thethickness of the frictional Ekman layer.
No. 2007-61 v3.0 SMHI - Possible hydrographical effects upon inflowing deep water of apipeline crossing the flow route in the Baltic Proper
21
8
Interaction between the flow of new deepwater andthe pipelines1. Firstly, pipeline-generated turbulence might be more efficient than turbulencegenerated by bottom and interfacial friction and this may increase the mixingbetween the new deepwater and ambient water.2. Secondly, the pipelines may increase the sill height and thereby dam thedense deepwater if it is placed in a section of hydraulic control.3. Thirdly, the pipelines may steer the dense water downslope if the currentencounters the pipelines when flowing along a sloping bottom.
The pipelines may influence the deepwater of the Baltic Proper in three ways.
8.1
Frictional flow
First we investigate how much of the dissipation that the crossing pipelines mightcause. The analysis is based on theory described in Appendix C. The total dissipationby the dense bottom current between the entrance sills and Stolpe Channel, where theoutlet of dense water from the Bornholm Basin occurs, can be estimated asD0=LWUS where L is the length, W the typical width and U the typical velocity ofthe dense bottom current. S is the bottom stress computed from S=ρ0CDU2. Here CDis the coefficient for combined bottom and interfacial drag andρ0is a standarddensity. The dissipation caused by the crossing pipeline of height h equalsDp=WUhρ0CU2where C is the coefficient for drag caused by the pipeline and wehave assumed that the width and speed of the current crossing the pipelines are equalto W and U, respectively. Typical value of CDis 0.003 and a typical value of Cequals 1.5, see Appendix C. This means that one pipeline of height h=1.0 m exerts adrag equivalent to the frictional drag along a stretch of about 500 m. The ratiobetween the drag caused by two pipelines and the total drag equals R=2hC/(L CD).With the figures for h, CDand C given above and with L=200 km one obtains R=0.005 (=0.5%)The increased mixing due to two pipelines equalsΔM=R¶(Rfpipe/Rf - 1). Assumingthat the mixing efficiency of form-drag generated turbulence were a factor of 3greater than for turbulence generated by combined bottom and interfacial friction, i.e.Rfpipe≈0.12and Rf≈0.04, one would get estimates of the highest possible mixingincrease (c.f. Appendix C). From the formula above one finds that the total mixing ofthe new deepwater with ambient water in this case would increase byΔM=2Rwhichequals about 1.0% for a 1.0 m high pipe. NB!ΔM=0if Rfpipe=Rf. If the speed andwidth of the current in the crossing section are less than U and W, respectively,, thedissipation (and mixing) caused by the pipelines will be lower. According to Figure12 the modeled bottom velocities are generally lower than 0.3 m/s. However, there isan uncertainty in how well the modeled bottom currents represent the true currents.Here we use U=0.3 m/s as an upper limit.It might be interesting to estimate D0for the Arkona and Bornholm Basins. Analternate expression for D0is given by Eq.(C11) based on the loss of potential energyof the new deepwater between the entrance sills and the Stolpe Channel, thusD0=ρ0Qg’h1. Inserting the following values Q=15,000 m3s-1, g’=0.06 m s-2, h1=60 m,one obtains D0=54 MW. Using L=200 km, W=10 km, U= 0.3 ms-1and CD=0.003 inEq. (C9) one obtains D0=60 MW. The typical width W=10 km and the typicalvelocity U=0.3 ms-1of the dense bottom current fits well with observations and22Nr. 2007-61 v3.0 SMHI - Possible hydrographical effects upon inflowing deep water of a
pipeline crossing the flow route in the Baltic Proper
model results, see Chapter 4, and also give a quite realistic value of the dissipation.The values of Q and g’ used here are the mean properties of new deepwater that maybe obtained from conservation of flows of salt and water across the entrance sills.The deepwater in the Arkona Basin has a short residence time so that turbulentmixing driven by wind and barotropic fluctuations should usually be small comparedto mixing performed by the gravity current itself. Thus, mixing of Baltic Sea surfacewater and new deepwater should usually take place mainly in the gravity current.The estimates above are therefore quite relevant for the possible change of mixing ofdeepwater due to the pipelines.The velocities in the Gotland Basin are lower than those in the Arkona and BornholmBasins (see Chapters 4 and 5) and consequently the possible increase in mixing dueto the pipelines should be less here.8.2Hydraulic flow
With the latest proposed route the pipelines will not pass any sills in thesouthwestern part of the Baltic Proper and, hence, the hydraulic considerations arenot relevant here. In the Gotland Sea the pipelines will cross the path of the deep-water inflow in the Fårö Deep (seeFigure 13)and they will not affect any sill flows.
8.3
Topographic steering
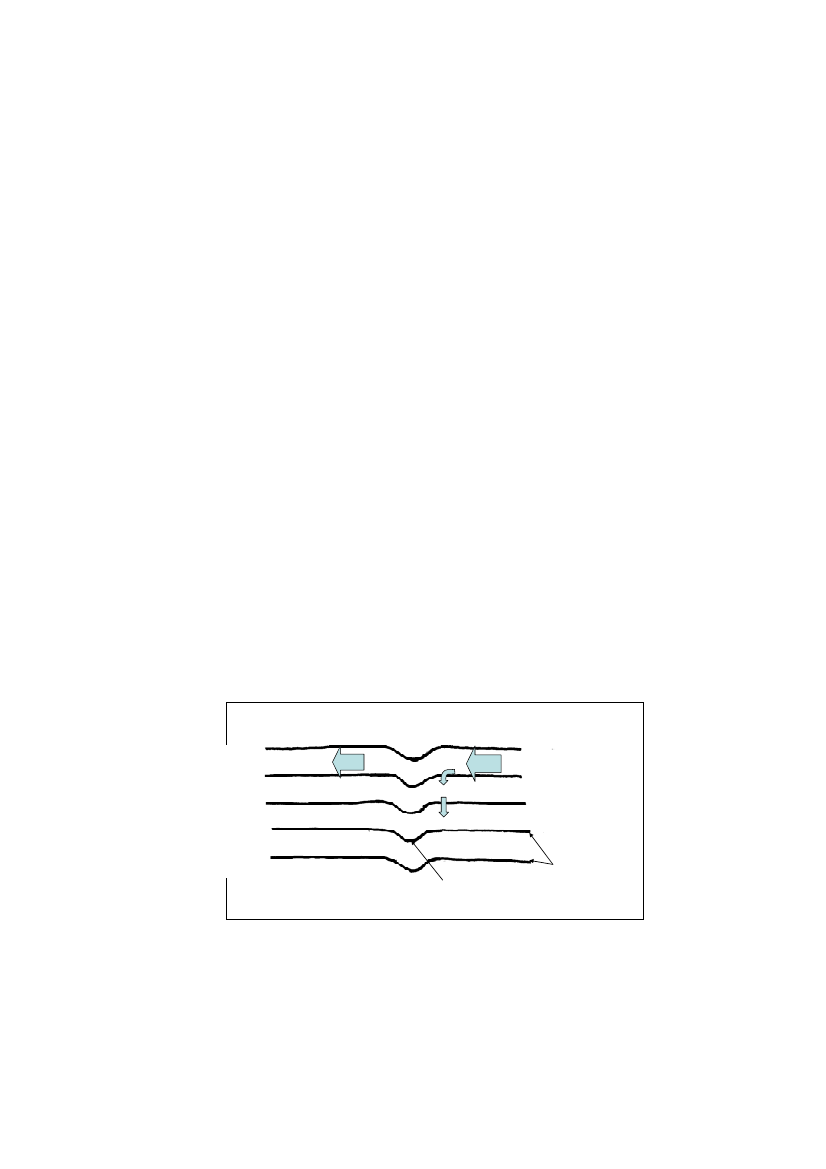
Topographic steering could possibly play a part if the dense flow crosses thepipelines on the slopes between Bornholm and the deeper part of the BornholmBasin.Consider a geostrophic flow along a sloping bottom as illustrated inFigure 19.Whenthe flow encounters the pipelines a portion of it may be steered down the slope. Toestimate the maximum size of the down-slope flow the pipelines may be treated as asmall ridge intersecting the slope.Shallow
DepthcontoursPipelineDeep
Figure 19. Sketch showing the possible effect the pipelines may have on a currentflowing along a sloping bottom.In Appendix D an expression for the maximum down-slope transport,Qmax, for acosine-shaped ridge is given. Simplifications may be made due to the small height ofNo. 2007-61 v3.0 SMHI - Possible hydrographical effects upon inflowing deep water of apipeline crossing the flow route in the Baltic Proper
23
the pipelines above the bottom and in this limit the shape of the obstacle becomesirrelevant. The upper limit for a possible down-slope transport is then given byQmax=1g′2HR2f
WithHR=1.0 m (the height of the pipelines) and g´=6x10⁻²ms-2, the maximum down-slope flow is around 250 m3/s. If the total inflow is approximated to 15 000 m3/s, thedown-slope flow must be less than 1.7 % of this value. This is a conservativeestimate since the deep-water flow rate downstream of the Bornholm Strait willincrease due to mixing and at the same time the value of g´ will be reduced.Considering the topography of the Bornholm Basin and that the mixing properties ofa diverted flow will be the same as for the main inflow it is concluded that the effectof a possible down-slope steering of the inflow will be negligible.Topographic steering is not relevant for the Gotland Basin since the pipelines do notcross the path of the inflowing water on any sloping bottom where this effect couldplay a role.
9
Creation and effects of pipeline dams
The establishment of pipelines may create closed depth contours and the areaenclosed by these may be filled with denser water when the deepwater moves up anddown along the bottom. Dams created by pipelines are not deeper than the height ofthe pipelines. If the denser water filling the dams can stay in the dams for sufficientlylong time the oxygen in the dam may be exhausted by consumption and thephosphorus bound to metals at the surface of the sediments may be released to thedam water. The total area of possible pipeline dams in depth interval 40-80 m hasbeen estimated to 25 km2for the whole stretch of the pipeline (R. Bijker, 2009, pers.comm.). The estimate was made for an assumed pipeline height of 1.5 m which isconservative because the mean height will be 1.0 m. The estimated pool area is onlyabout 0.06% of the bottom area in this depth interval why one may neglect theinfluence of pipeline dams on the phosphorus budget of the Baltic proper.
10
Effects on stratification and oxygen conditions in theBaltic Proper
The new deepwater flowing through the Arkona and Bornholm Basins suppliesoxygen and salt to the deepwater of the Baltic Proper. It is therefore vital for thephysical, biogeochemical and ecological states of the Baltic Proper. The properties ofthe new deepwater are subjected to quite large natural changes in these basins due toentrainment of residing less saline and oxygen rich water.At present the turbulence created by the dense bottom current is due to bottom andinterfacial friction. The total dissipation of the dense bottom current, i.e. thedissipation integrated from the entrance sills in Fehmarn Belt and Öresund to StolpeChannel, is essentially determined by the potential energy of the dense water whenpassing the sills. The mixing of new deepwater might increase if the mixingefficiency of pipeline-generated turbulence is greater than that of turbulencegenerated by the present combination of bottom and interfacial friction.24Nr. 2007-61 v3.0 SMHI - Possible hydrographical effects upon inflowing deep water of a
pipeline crossing the flow route in the Baltic Proper
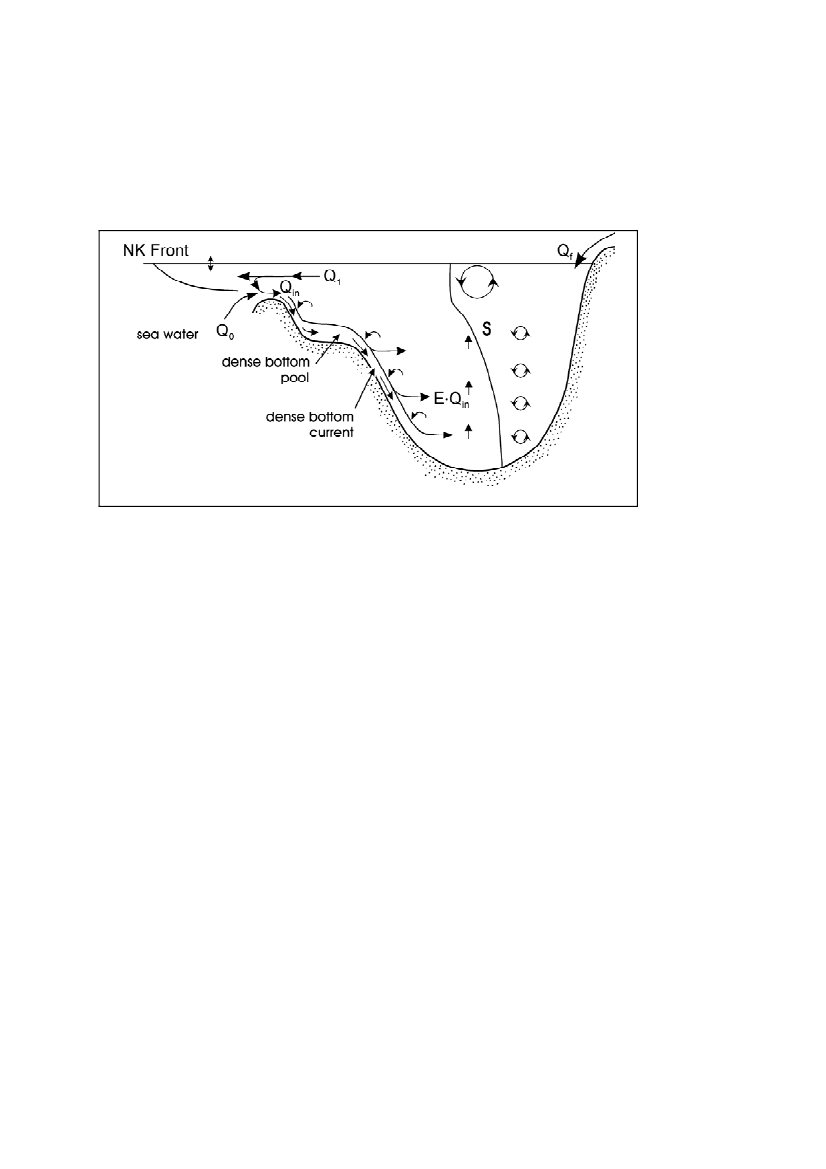
It was found in Section 8.1 that if the Nord Stream pipelines rise 1.0 m above the seabed they are capable to dissipate up to about 0.5 % of the total potential energy,depending on the speed of the dense bottom current in the crossing section. If themixing efficiencies were equal there should in essence be no impact of the pipelineson the properties of new deepwater. We estimated that the mixing of the newdeepwater might increase by 0-1.0%.The effect of increased mixing by the pipelines on the inflow of new deepwater canbe estimated as follows. The mean flow of water into the Baltic proper equals Qinandit has the salinity Sin(c.f.Figure 20).These quantities can be estimated usingconservation of salt and volume and knowing the freshwater supply Qfand thesalinity S1of the water flowing out of the Baltic proper. With Qf=15,000 m3s-1andS1=8.5 psu one obtains Qin= 15,000 m3s-1and Sin=17 psu. Due to mixing withambient water in the Arkona and Bornholm Basins, the flow of new deepwaterincreases by a factor E (>1) and the salinity decreases. The mean flow of newdeepwater out of the Bornholm Basin equalsQ2=EQinand its salinity is S2. The relationship between E and S2is obtained from thefollowing equation for salt conservationSinQin+(E−1)QinS1=S2Q2If S2=12 psu one obtains E=2.43 and Q2=36450 m3s-1. Due to extra mixing by thepipelines, entrainment of ambient water will increase x¶(E-1)Qinwhere x is theincreased mixing rate. A conservative estimate above gave that x is in the interval 0-0.010. This means that Q2should increase by 0-215 m3s-1, and S2should decrease byat 0-0.02 psu.The total negative buoyancy flux (by the new deepwater) into the Baltic proper isproportional to Q2¶(S2– S1) and that quantity does not change with increasedentrainment E. The depth of the halocline in the Baltic proper is adjusted so that thenegative buoyancy flux is eroded into the surface layer by wintertime convection.Thus, the depth of the halocline, and thereby the volume of the deepwater, should notchange with an increased E. This means that the flushing of the deepwater increaseswith E.The oxygen transport, by new deepwater, increases with the volume flow providedthe mixing occurs in areas where the ambient water is oxygenated, cf. last paragraphin Chapter 3. An increased transport of oxygen would tend to improve the oxygenconditions in, and below, the halocline in the Baltic Proper and thereby e.g. increasethe deposition of phosphorus in the deepwater. This conclusion is supported byresults reported by Gustafsson et al. (2008) who made numerical computations ofeffects of artificial halocline ventilation using two different state-of-the-art Baltic Seamodels. Both models showed that increased mixing of halocline water (haloclineventilation) gives improved oxygen conditions in the Baltic proper. Consideringmuch larger artificial mixing than that due to two pipelines discussed here, theyconcluded that because the decreased deepwater salinity, in the case considered bythem, is within the range of natural variability it should not affect biodiversity.The decrease in salinity due to extra mixing by the pipelines was shown above to bein the interval 0-0.02 psu which is very small compared to the range of naturalvariability (see Appendix A where it is shown that the standard deviation in salinityNo. 2007-61 v3.0 SMHI - Possible hydrographical effects upon inflowing deep water of apipeline crossing the flow route in the Baltic Proper
25
in East Gotland Basin (stn BY 15) is about 0.5 psu in and below the halocline). Oneshould therefore not expect that the flow of deepwater to northern parts of Balticproper and to the Finnish Bight should be affected. This is also supported byGustafsson et al. (2008) who did not report flow reductions to the northern regionsalthough they considered much larger density reductions.
Figure 20. The inflowing dense water is a mixture between seawater fromSkagerrak, volume flow Q0and surface water coming from the Baltic. The volumeflow of new deepwater entering the Baltic proper equals Qin. Ambient water isentrained in the Baltic proper whereby the volume flow increases by the factor E.
11
Conclusions
In this report we estimate the impact of the planned Nord Stream pipelines on thesalinity, volume flow and oxygen concentration of new deepwater in the BalticProper. The following findings were made:••••••••The mixing of the new deepwater might increase by 0-1.0%.The salinity of the new deepwater might decrease by 0-0.02 psu.The natural variability in and below the halocline in the East Gotland Basin isaround 0.5 psu.Flows of volume, salt and oxygen might increase by 0-1.0%.If topographic steering takes place it can affect at most 1.7% of the inflow.The pipelines will have no hydraulic effect on the inflow.Dams (closed depth contours) created by the pipeline have no significantimportance on the phosphorus dynamics.The pipelines will have no effect on, or possibly slightly counteract,eutrophication in the Baltic Proper.
From these findings one can conclude that the impact of the pipelines on the deepwater in the Baltic Proper will be negligible.26Nr. 2007-61 v3.0 SMHI - Possible hydrographical effects upon inflowing deep water of a
pipeline crossing the flow route in the Baltic Proper
12
References
Alexandersson, H., 2006. Vindstatistik för Sverige 1961-2004. SMHI, MeteorologiNr. 121.Arneborg, L., 2002. Mixing efficiencies in patchy turbulence. Journal of PhysicalOceanography, 32(5), 1496-1506.Arneborg, L., Erlandsson, C.P., Liljebladh, B. and Stigebrandt, A., 2004. The rate ofinflow and mixing during deepwater renewal in a sill fjord. Limnology andOceanography 49, 768-777.Arntsen, Ø.A., 1996. Disturbances, lift and drag firces due to the translation of ahorizontal circular cylinder in stratified water. Experiments in Fluid, 21, 387-400.Borenäs, K., and P. Lundberg, 1986. Rotating hydraulics of flow in a parabolicchannel, Journal of Fluid Mechanics 167, pp. 309-326.Borenäs, K., R. Hietala, J. Laanearu, and P. Lundberg, 2007. Some estimates of theBaltic deep-water transport through the Stolpe trench. Tellus A, doi: 10.1111/j.1600-0870.2006.00221.xBurchard, H, Lass, H.U., Mohrholz,V., Umlauf, L., Sellchopp, J., Fiekas, V.,Bolding, K., and Arneborg, L., 2005. Dynamics of medium-intensity dense waterplumes in the Arkona Basin. Ocean Dynamics (Accepted)E. Darelius and A. Wåhlin, 2007. Downward flow of dense water leaning on asubmarine ridge. Deep Sea Research I, Volume 56(7).Ellison, T.H., and Turner, J.S., 1959. Turbulent entrainment in stratified flows.Journal of Fluid Mechanics 6, pp. 423-448.Fischer, H., and W. Matthäus, 1996: The importance of the Drodgen Sill in the soundfor major Baltic inflows. Journal of Marine Systems 9, pp. 137-157.Gargett, A.E., and Holloway, G., 1984. Dissipation and diffusion by internal wavebreaking. J. Mar. Res., 42, 15-27.Grace, R.A., 1971. Submarine pipeline design against wave action. LookLab/Hawaii, vol. 2, no 2, 3-7.Gustafsson, B.G., 2003. A time-dependent coupled-basin model of the Baltic Sea.Earth Sciences Centre, Göteborg University, Rep. C47, 61 pp. (ISSN 1400-383X)Gustafsson, B.G. and Andersson, H.C., 2001. Modeling the exchange of the BalticSea from the meridional atmospheric pressure difference across the North Sea.Journal of Geophysical Research 106, pp. 19731-19744.Gustafsson, B.G., Meier, H.E.M., Savchuk, O.P., Eilola, K., Axell, L., and Almroth,E., 2008: Simulation of some engineering measures aiming at reducing effects fromeutrophication of the Baltic Sea. Univ. of Gothenburg, Dept. of Earth Science Centre,report no. C82, 59 pp.Hagen, E. and Feistel, R., 2004. Observations of low-frequency current fluctuationsin deep water of the Eastern Gotland Basin/Baltic Sea. Journal of GeophysicalResearch 109, C03044, doi:10. 1029/2003JC002017.No. 2007-61 v3.0 SMHI - Possible hydrographical effects upon inflowing deep water of apipeline crossing the flow route in the Baltic Proper
27
Håkansson, B., Broman, B. and Dahlin, H., 1993. The flow of salt and water in theSound during the Baltic major inflow event January 1993. Publ. C.M. 1993/C:57 (V).Int. Council for exploration of the Sea, Copenhagen.Lass, H.U., Mohrholz, V. and Seifert, T., 2001. On the Dynamics of the PomeranianBight. Continental Shelf Research, 21, pp. 1237-1261.Lass, H.U. and Mohrholz, V., 2003. On dynamics and mixing of inflowing salt-waterin the Arkona Sea. Journal of Geophysical Research 108, 3042, doi:10.1029/2002JC001465Liljebladh, B. and Stigebrandt, A. 1996. Observations of the deepwater flow into theBaltic Sea. Journal of Geophysical Research 101, pp. 8895-8912.Liungman, O., Rydberg, L. and Göransson, C.G., 2001. Modeling and observationsof deep water renewal and entrainment in a Swedish sill fjord. Journal of PhysicalOceanography 31, pp. 3401-3420MacDonald, D.G. and Geyer W.R., 2004. Turbulent energy production andentrainment at a highly stratified estuarine front. Journal of Geophysical Research109, C05004, doi:10.1029/2003JC002094Matthäus, W. and Franck, H., 1992: Characteristics of major Baltic inflows – astatistical analysis. Continental Shelf Research 12, pp. 1375-1400.Matthäus, W. and Lass, H.U., 1994. The recent salt inflow into the Baltic Sea. J.Phys. Oceanogr., 25, 280-286.Omstedt, A. and Axell, L.B., 2003. Modeling the variations of salinity andtemperature in the large gulfs of the Baltic Sea. Continental Shelf Research 23, pp.265-294.Omstedt, A. and Nohr, C., 2004. Calculating the water and heat balances of theBaltic Sea using ocean modelling and available meteorological, hydrological andocean data. Tellus 56A, pp. 400-414.Osborn, T.R., 1980. Estimates of the local rate of diffusion from dissipationmeasurements. Journal of Physical Oceanography, 10, 83-89.Pedersen, B.F., 1980. A monograph on turbulent entrainment and friction in two-layer stratified flow. Series Paper No. 25, Inst. of Hydrodynamics and HydraulicEngineering, Technical University of Denmark, Lyngby, 397 pp.Petrén, O. and G. Walin, 1976. Some observations of the deeo flow in the Bornholmstrait during the period June 1973-december 1974. Tellus, 28, 74-87.Piechura, J. and Beszczyńska-Möller, A. 2003. Inflow waters in the deep regions ofthe southern Baltic Sea – transport and transformations. Oceanologia 45, pp. 593-621.Prastowo, T., R.W. Griffiths, G.O. Hughes, and A.M. Hogg,, 2009: Effects oftopography on the cumulative mixing efficiency in exchange flows. J. Geophys.Res., vol 114, C08008, doi:10.1029/2008 JC005152.Rydberg, L., 1976.Observations at the deep water flow through the Stolpe Channelduring August 1976. Report No 15, Department of Oceanography, GöteborgUniversity.Rydberg, L., 1980. Rotating hydraulics in deep-water channel flow.Tellus32
77-89.28Nr. 2007-61 v3.0 SMHI - Possible hydrographical effects upon inflowing deep water of a
pipeline crossing the flow route in the Baltic Proper
Schimmels, S., 2007. Numerical Simulation of the Influence of Circular Cylinders onMixing and Entrainment in Natural Density Currents.Zur Erlangung desakademischen Grades Doktor der Ingenieurwissenschaften an der Fakultät fürBauingenieurwesen und Geodäsie der Gottfried Wilhelm Leibniz UniversitätHannover vorgelegte Dissertation.Schinke, H. and W. Matthäus, 1998. On the causes of major Baltic inflows -- ananalysis of long time series. Continental Shelf Research 18, pp. 67-97.Simpson, J.H. and Rippeth, T., 1993. The Clyde Sea: A model of the seasonal cycleof stratification and mixing. Estuarine Coastal and Shelf Sceince, 37, 129-144.Sivkov, V.V and N.I. Sviridov, 1994. The relation between erosional-accumulativeforms of bottom relief and nearbottom currents in the Bornholm deep. Oceanology,Vol. 34, no.2.St. Laurent, L. and Schmitt, R.W., 1999. The contribution of salt fingers to verticalmixing in the North Atlantic tracer release experiment. Journal of PhysicalOceanography, 29, 1404-1424.Stigebrandt, A., 1980: Barotropic and baroclinic response of a semi-enclosed basin tobarotropic forcing from the sea. InFjord Oceanography(H.J. Freeland, D.M. Farmerand C.D. Levings, eds.). Plenum, New York, pp. 151-164.Stigebrandt, A., 1983: A model for the exchange of water and salt between the Balticand the Skagerrak. J. Phys. Oceanogr., 13, 411-427.Stigebrandt, A., 1985. A model for the seasonal pycnocline in rotating systems withapplication to the Baltic proper. Journal of Physical Oceanography 15, pp. 1392-1404.Stigebrandt, A., 1987a. A model for the vertical circulation of the Baltic deep water.Journal of Physical Oceanography 17, 1772-1785.Stigebrandt, A., 1987b: Computations of the flow of dense water into the Baltic Seafrom hydrographical measurements in the Arkona Basin. Tellus 39A, pp. 170-177.Stigebrandt, A., 2001: Physical Oceanography of the Baltic Sea. Chapter 2 (pp. 19-74) inA systems Analysis of the Baltic Sea(F. Wulff, L. Rahm and P.Larsson, eds.),Springer Verlag.Stigebrandt, A. and B.G. Gustafsson, 2007. Improvement of Baltic proper waterquality using large-scale ecological engineering. AMBIO, 36, 280-286.Stigebrandt, A. Johnsson, M. and Wüest, J., 2006: Mixing efficiency of turbulence indense gravity-forced bottom currents. In Johnsson, M., 2006: Studies in coastal seasof small scale mixing processes related to topography. Göteborg University,Oceaanography/Earth Sciences Centre, Publ. A106 (Licentiate thesis).Tinis, S.W. and Pond, S., 2001. Tidal energy dissipation at the sill of Sechelt Inlet,British Columbia. Journal of Physical Oceanography, 31, 3365-3373.Whitehead, J., Leetma, A. and Knox, R. 1974. Rotating hydraulics of strait and sillflows.Geophys. Fluid Dyn.6
101-125
No. 2007-61 v3.0 SMHI - Possible hydrographical effects upon inflowing deep water of apipeline crossing the flow route in the Baltic Proper
29
13
Appendices
Appendix AClimatological averages (red) and standard deviations (black) for vertical profiles oftemperature (˚C), salinity, density (σt, kg/m3) and oxygen (ml/l) at stations BY2,BY5, BY15 and BY20, based on observations gathered for the period 1961-1990.For positions see map below.
30
Nr. 2007-61 v3.0 SMHI - Possible hydrographical effects upon inflowing deep water of a
pipeline crossing the flow route in the Baltic Proper
No. 2007-61 v3.0 SMHI - Possible hydrographical effects upon inflowing deep water of apipeline crossing the flow route in the Baltic Proper
31
32
Nr. 2007-61 v3.0 SMHI - Possible hydrographical effects upon inflowing deep water of a
pipeline crossing the flow route in the Baltic Proper
No. 2007-61 v3.0 SMHI - Possible hydrographical effects upon inflowing deep water of apipeline crossing the flow route in the Baltic Proper
33
34
Nr. 2007-61 v3.0 SMHI - Possible hydrographical effects upon inflowing deep water of a
pipeline crossing the flow route in the Baltic Proper
Appendix BJan
7.8Feb
6.9Mar Apr
7.06.2May Jun
5.95.9Jul
6.2Aug Sep
6.07.0Oct
7.6Nov
8.4Dec
8.1Year
6.9
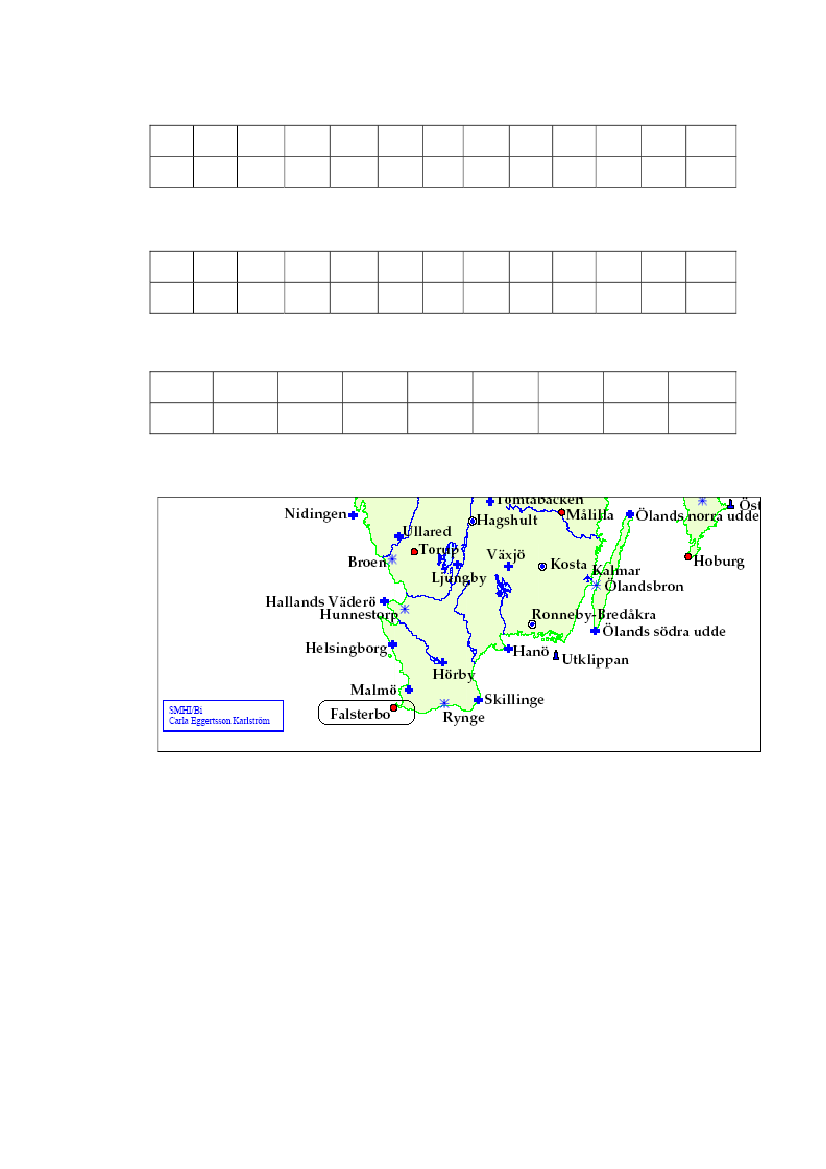
Mean values of the wind speed (m/s) at Falsterbo for the period 1961-1990.
Mean values of the wind speed (m/s) at Falsterbo for the period 1991-2004.
Frequency of the wind direction (%) at Falsterbo for the period 1961-2004.
From Alexandersson (2006).
No. 2007-61 v3.0 SMHI - Possible hydrographical effects upon inflowing deep water of apipeline crossing the flow route in the Baltic Proper
35
Appendix C
1. Dynamics of a frictional dense bottom current
We consider new deepwater flowing over a sill into a basin where the deepwaterforms an inclined gravity-forced plume that entrains ambient water. The plumeeventually debouches into a pool of deepwater. It is assumed that the dense plumeflows in a channel of widthW.The channel has the longitudinal slopesrelative thehorizontal plane. Ifdis the vertical thickness andUthe speed of the plume, thevolume flowQof the plume is given byQ=UWd(C1)
The (quasi) steady-state flow is governed by a balance between the longitudinal(down-slope) pressure gradient force and frictional forces, the latter are quadratic anddescribed by the combined (bottom and interfacial) drag coefficientCD. ThusU=g'dsCD
(C2)
Hereg΄= gΔρ/ρ0is the reduced gravity withΔρ=ρ1-ρ2andρ0is a reference density.The transport per unit width is defined by q = Ud = Q/W and the buoyancy flux isb = g’q. Stigebrandt (1987a) derived the following expressions for the speed andthickness of the plume⎛sU=⎜⎜C⎝D⎛sd=⎜⎜C⎝D
⎞1⎟b3⎟⎠⎞⎟⎟⎠−1123⎛q⎞3⎜⎟
13
(C3)
⎜g'⎟⎝⎠
(C4)
Since the fluids are miscible, turbulence generated by the plume may causeentrainment of less dense fluid into the bottom current whereby the volume flowincreases and the density decreases. The entrainment velocitywis given by thefollowing energy-based Kato-Phillips type of expression used for two-layer systems,c.f. Turner (1973)3u*w=2m0g'd
(C5)
Herem0is a constant (e.g. Stigebrandt, 1985). The friction velocityu*is defined by2u*=CDU2
(C6)
Stigebrandt et al. (2006) used the model above to estimate the effective value ofRfby deriving the ratio between the buoyancy flux by the entraining flow and the powersupplied to turbulence by bottom and interfacial drag. They obtained36Nr. 2007-61 v3.0 SMHI - Possible hydrographical effects upon inflowing deep water of a
pipeline crossing the flow route in the Baltic Proper
Rf=m0C1 / 2D
(C7)
Using m0= 0.6 as determined from a seasonal pycnocline model applied to the BalticSea (Stigebrandt, 1985), and a value of the combined CDin the range 0.003 – 0.005gives Rf in the range 0.033 – 0.042. They also analyzed results of laboratoryexperiments on entrainment by dense bottom currents conducted by Ellison andTurner (1959), displayed in Fig. 6.10 in Turner (1973), and found that Rf equalsabout 0.03 for rather steep slopes (s > 0.17). Results from hydrographicmeasurements in the dense bottom current in Denmark Strait presented by Pedersen(1980), also support a value of Rf in the range 0.03 to 0.04. One may thus concludethat the efficiency of turbulence generated by combined bottom and interfacial dragin dense bottom currents equals approximately 0.04. For other types of stratifiedflows Rf might have different values, see below.The total entrainment of ambient water, from the intrusion of new deepwater at theentrance sills until it reaches the top of the dense water pool at depth h1, equalsQe=W2⎛32Rf⎜
s⎜C⎟⎟⎝D⎠
1⎞3
1B3h1
(C8)
Here B=bW is the total buoyancy flux by the dense bottom current. Eq. (C8) showsthat the entrainment will vary with the width (height) of the current. Thus, even if theflux Richardson number is constant and known, the resulting mixing varies with thegeometry of the current. Eq. (C8) shows that a wide (and accordingly thin) currententrains more than a narrow current.In the present case it is believed that the dense bottom current will not change itswidth due to the crossing of the pipelines. However, the pipelines will induce so-called form drag on the current which in turn creates turbulence that might have another efficiency with respect to diapycnal mixing than ordinary bottom andinterfacial mixing.The total dissipation by the dense bottom current between the entrance sills andStolpe Channel, where the outlet of dense water from the Bornholm Basin occurs,can be estimated asD0=LWUS(C9)where L is the length and W the typical width and U the typical velocity of the densebottom current. S is the bottom stress computed from S=ρ0CDU2and CDis thecoefficient for combined bottom and interfacial drag andρ0is a standard density. Thedissipation caused by the crossing pipeline of height h equalsDp=WUhρ0CU2(C10)where C is the coefficient for form-drag caused by a pipeline resting on the bottom.Typical values of the drag coefficients are CD=0.003 and C=1.5, see below, and wehave assumed that the current in the crossing section has the typical speed and width.This means that one pipeline of height h=1.0 m exerts a drag equivalent to thefrictional drag along a stretch of about 500 m.The dissipation of energy by the dense water from the entrance sills to the StolpeChannel can also be estimated from the following equationNo. 2007-61 v3.0 SMHI - Possible hydrographical effects upon inflowing deep water of apipeline crossing the flow route in the Baltic Proper
37
D0=ρ0Qg'h1
(C11)
Here Q is the flow and g’ the (negative) buoyancy of new deepwater and h1is thedepth below the sea surface of the deepwater pool in the Bornholm Basin.Combining Eqs. (C10) and (C11) one might estimate typical values of U and W inthe Arkona and Bornholm Basins. This is done in Chapter 8.1 of the present report.2. Dissipation and drag caused by a pipeline
The dissipation caused by a pipeline is proportional to the height h of the pipelineand the cubed speed of the crossing current, c.f. Equation (C10). The coefficient ofproportionality, the form drag, in homogeneous water is known from many earlierinvestigations. For a flow past a circular cylinder the drag coefficient, C, is a functionof the Reynolds number, Re, the ratio of the inertia to the viscous force. For Re lessthan about 200,000 the drag coefficient is about 1.2 and it drops to less than 0.5 forhigher Re, see e.g. Schimmels (2007). In the present application Re typically equals3¶105. The secondary motion induced by the drag in homogeneous water takes theform of eddies that are shed from the pipe.Based on wave tank experiments Grace (1971) recommended a value of C=2 for apipeline on the seafloor with no spacing between the pipe and the bottom. This valuewas suggested for estimating the forcesacting on the pipeline,and may hence beconsidered to be conservative. Grace also carried out experiments outside Hawaiiwith a pipe placed on the bottom in the wave zone. The pipe had a diameter of 0.3 mand the water depth was 5m. The measured drag coefficient had a mean of 1.2 withthe minimum and maximum values being 0.5 and 1.4, respectively.In vertically stratified water, the drag may vary with the densimetric Froude number,F =U/ci, where U is the speed of the crossing current and ciis the phase speed of thelowest mode of internal waves. Arntsen (1996) made laboratory studies of the dragon a moving horizontal cylinder submerged in a stratified fluid with twohomogeneous layers of different density separated by a thin pycnocline. Thebaroclinic drag takes the form of internal waves behind the cylinder and is similar toso-called dead-water affecting slow ships in stratified waters that was described andanalyzed by (Ekman, 1904). In the experiments, 1000 < Re < 10,000 which is anorder of magnitude less than in the Bornholm Basin situation. Artsen (1996) foundthat the drag coefficient under stratified conditions, C, may have values up to about 2for small F. For Froude number greater than about 0.6 the drag was found to be evenslightly less than for non-stratified conditions. These results were valid for caseswhen the horizontal cylinder was above or below the pycnocline. When the cylinderwas at the level of the pycnocline the stratification actually decreased the drag ascompared to non-stratified conditions.How can these results be used in the present investigation? One difference for thestratified case is that the pipelines are lying on the bottom. However, the baroclinicresponse of the flow, mainly for F < 0.6, should take the form of stationary internalwaves, i.e. waves in the stratification bound to, and on the lee-side of, the pipelines(lee-waves). Due to mixing induced by bottom friction, the thickness of thehomogeneous bottom layer should increase with the speed of the bottom layer and acrossing pipeline should induce a combination of barotropic and baroclinic drag. The38Nr. 2007-61 v3.0 SMHI - Possible hydrographical effects upon inflowing deep water of a
pipeline crossing the flow route in the Baltic Proper
baroclinic contribution to the drag should decrease with increasing thickness of thehomogeneous bottom layer.For our computations of the contribution of the pipelines to total dissipation we haveimplicitly used the speed 0.3 m/s for the bottom current. By determining thestratification in the Bornholm Basin from observations (Chapter, 4.4) underconditions with dense bottom currents, shown by a homogeneous bottom layer inCTD-profiles, we can also estimate the maximal speed of internal waves and therebywe can assess the value of F in situations with dense bottom currents. We arethereafter in the position to discuss appropriate values of C for our estimates.For 46 (out of 240) profiles it was possible to judge whether there was ahomogeneous bottom layer present or if the layer below the halocline was stratifiedall the way to the bottom. A mixed bottom layer was found in 27 profiles for whichthe velocity of the lowest internal wave mode was calculated. It was found that themean value of ciwas 0.55 m/s with a standard deviation of 0.18 m/s. Thecorresponding mean value for F was 0.54. In these cases stratification shouldinfluence C although the pipelines are embedded in a homogeneous (mixed) bottomlayer. C=1.5 seems to be a reasonable mean value of the form drag for these cases. Asimilar calculation was also carried out for the 19 cases of stratified bottom layergiving ci=(0.4 �0.14) m/s with the corresponding mean value of 0.75 for F. For suchhigh values of F stratification should have small importance according to theexperiments by Artsen (1996) and C should be less than 1.5. However, it is possiblethat U=0.3 m/s is too high for these cases lacking a mixed layer, which wouldmotivate a higher value of C. On the other hand, only a relatively small share of thetotal transport should be performed by these cases why they should be given only asmall weight in determining C. All in all we conclude that using C=1.5 would beconservative.3. Mixing efficiency
There are two different definitions of mixing efficiency. The “process” definitionfocuses typically on one type of process, ideally localized in an infinitely smallvolume. The “system” or “bulk” or “overall” or “cumulative” definition aims atmacroscopically large volumes of a natural volume water body. Determining“system” mixing efficiency might be difficult because one has to establish both thepower supply to the turbulence and the resulting buoyancy fluxes. Reliable energybudgets have been established for fjord basins, where the main power input toturbulence comes via internal tides and the buoyancy fluxes resulting from verticalmixing may be estimated from repeated measurements of the (changing) verticalstratification in periods when there is no advective water exchange. Numerousestimates for basin waters of fjords give (system) Rf-values in the range 0.05-0.08 asshown by Stigebrandt & Aure (1989). This is supported by many authors, e.g.Simpson & Rippeth (1993) and Tinis & Pond (2001). For dense bottom currentsStigebrandt et al. (2006) estimated that the system Rf equals 0.04 for natural flowsand Rf=0.03 for published laboratory flows.Values of (process) Rf in the range 0.15-0.20, in essence based on laboratoryexperiments with rather differing results, have been widely used in oceanography,e.g. Osborn (1980), Gargett and Holloway (1984) and St Laurent and Schmitt (1999).No. 2007-61 v3.0 SMHI - Possible hydrographical effects upon inflowing deep water of apipeline crossing the flow route in the Baltic Proper
39
However, Arneborg (2002) has shown that numbers for process Rf estimated fromlaboratory experiments include both the work done against the buoyancy forces onthe system level and short-lived potential energy in turbulent patches. The latterdissipates when patches collapse. Arneborg (2002) estimated that the system Rfshould be slightly higher than half of the value of the process Rf. Accepting processRf=0.20 he finds that system Rf equals 0.11.The systems or cumulative mixing efficiency of buoyancy-driven, hydraulicallycontrolled laboratory flows was investigated by Prastowo et al. (2009). The overallamount of turbulent mixing was determined from measurements of vertical densityprofiles after the exchange. The systems mixing efficiency varied between 0.08 and0.11 depending on the topography of the constriction.In vertically stratified water, drag due to horizontal pipelines resting on bottom andperpendicular to the current direction might vary with the densimetric Froudenumber F=U/ci, where U is the current speed and ci the phase speed of the lowestmode of internal waves as discussed in Chapter C2 above. For F<1 internal lee-waves may be generated. However, due to bottom friction there will be a severalmeter thick homogeneous layer nearest to the bottom (c.f.Figure 9)reducing theinteraction between a 1.0 m high pipeline and the stratified water above thehomogeneous bottom layer. It is therefore likely that the drag due to the pipelinesmainly takes the form of eddies in the well-mixed bottom layer. This suggests thatthe system mixing efficiency of turbulence caused by the pipelines is similar to thesystem mixing efficiency in dense bottom currents, thus with Rf≈0.04. We have notfound any published values of mixing efficiency of turbulence generated by neitherhorizontal pipes nor vertical cylinders in stratified flows. Computations in this reportare done using system Rf=0.04 and system Rfpipe=0.12. The latter is higher than thehighest published estimate of system Rf and should give a conservative upper limitof mixing effects of the pipelines on the system level, see the overview in Table C1.Table C1. Overview of published Rf-values. S and P denotes the type of definitionwhere S=System, P=process.Rfvalue0.05-0.08 S0.04 S0.11 S0.08-0.11 S0.15-0.20 PCommentsInternal tides in fjord basins(numerous estimates)Bottom gravity currentsTurbulent patches after gravitationalcollapseLaboratory experiments withexchange flowsEstimates for shear-inducedturbulence in essence based onlaboratory estimatesReferencesStigebrandt & Aure (1989),Simpson & Rippeth (1993), Tinis& Pond (2001)Stigebrandt et al (2006)Arneborg (2002)Prastowo et al. (2009)Osborn (1980), Gargett andHolloway (1984), St. Laurent andSchmitt (1999)
40
Nr. 2007-61 v3.0 SMHI - Possible hydrographical effects upon inflowing deep water of a
pipeline crossing the flow route in the Baltic Proper
Appendix DTopographically steered flows
According to Darelius and Wåhlin (2007) the maximum down-slope transport,Qmax,for a cosine-shaped ridge is given by⎤g′2π2⎡π2(1+e−γ)γ=HR+⎢⎥f4⎢(π2+γ2)22(π2+γ2)⎥⎣⎦
Qmax
(D1).
Here g´ is the reduced gravity,fthe Coriolis parameter andHRthe height of the ridge(pipeline). The nondimensional quantityγis defined as
γ=
αWRδ
whereαis the slope parameter,WRthe width of the ridge (pipeline) andδthe Ekmanlayer thickness. The Ekman layer may be approximated by
δ=
CDUαf
whereCDis the drag coefficient andUαthe geostrophic velocity along the slopegiven byUα=g′α.f
Inserting the following values: g´=6x10⁻²m/s2,f=1.2x10-4s-1,α=1.2x10-3,CD=3x10-3andWR=3 m, yieldsγ=2.4x10⁻⁴. Since the value ofγis very small the maximumdown-slope transport, in the limitγ →0, becomeslimγ→0Qmax=1g′2HR2f(D2).
It should be mentioned that eq. (D2) holds for a variety of different shapes of theridge in the limitγ →0.
No. 2007-61 v3.0 SMHI - Possible hydrographical effects upon inflowing deep water of apipeline crossing the flow route in the Baltic Proper
41
Appendix EThe positions of the 46 profiles discussed in Section 4.4 and Appendix C, togetherwith some examples of density profiles.
year 1999 series 6550Datum: 1999−11−22location: lat 5547.9, lon 1554.2 depth 60−10
year 1996 series 6320Datum: 1996−11−28location: lat 5535.4, lon 1623.1 depth 69−10
−20
−20
−30
−30
−40
−40
−50
−50
−60
−60
−701002
1003
1004
1005
1006
1007
1008
1009
1010
1011
1012
1013
1014
−701002
1003
1004
1005
1006
1007
1008
1009
1010
1011
1012
1013
1014
Homogeneous bottom layer, thinpycnocline
Homogeneous bottom layer, thickpycnocline
42
Nr. 2007-61 v3.0 SMHI - Possible hydrographical effects upon inflowing deep water of a
pipeline crossing the flow route in the Baltic Proper
year 2003 series 2320Datum: 2003−3−6location: lat 5553.4, lon 1534 depth 49−10−100
year 2007 series 626Datum: 2007−10−25location: lat 5545.19, lon 1511.29 depth 57
−20
−20
−30
−30
−40
−40
−50
−50
−60
−60
−701002
1003
1004
1005
1006
1007
1008
1009
1010
1011
1012
1013
1014
−701002
1003
1004
1005
1006
1007
1008
1009
1010
1011
1012
1013
1014
Stratified bottom layer, thin pycnocline
Stratified bottom layer, thick pycnocline
No. 2007-61 v3.0 SMHI - Possible hydrographical effects upon inflowing deep water of apipeline crossing the flow route in the Baltic Proper
43
Denna sida är avsiktligt blank
Swedish Meteorological and Hydrological InstituteSE 601 76 NORRKÖPINGPhone 011-495 80 00 Fax 011-495 80 01
