Udenrigsudvalget 2009-10
URU Alm.del Bilag 257
Offentligt
Levels & Trends in
ChildMortality
Report 2010Estimates Developed by theUN Inter-agency Group forChild Mortality Estimation
United NationsDESA/Population Division
This report was prepared at UNICEF Headquarters by Danzhen You, Gareth Jones and Tessa Wardlaw on behalf of theUnitedNations Inter‑agency Group for Child Mortality Estimation.Organizations and individuals involved in generating country-specific estimates on child mortalityUnited Nations Children’s FundDanzhen You, Tessa WardlawWorld Health OrganizationTies Boerma, Colin Mathers, Mie Inoue, Mikkel OestergaardThe World BankEduard Bos, Emi SuzukiUnited Nations Population DivisionFrancois Pelletier, Gerhard Heilig, Kirill Andreev, Patrick Gerland, Danan Gu, Nan Li, Thomas SpoorenbergUnited Nations Economic Commission for Latin America and the Caribbean Population DivisionDirk Jaspers Faijer, Guiomar Bay, Tim MillerHarvard UniversityKenneth HillConsultantGareth Jones
Special thanks to the Technical Advisory Group of the Inter-agency Group for Child Mortality Estimation for providingtechnical guidance on methods for child mortality estimationKenneth Hill (Chair), Harvard UniversitySimon Cousens, London School of Hygiene and Tropical MedicineTrevor Croft, Measure DHS, ICF MacroGareth Jones, ConsultantMichel Guillot, University of PennsylvaniaJon Pedersen, FafoNeff Walker, Johns Hopkins UniversityJohn Wilmoth, University of California, Berkeley
Further thanks go to Mickey Chopra, Jimmy Kolker and Richard Morgan from UNICEF for their support. And special thanksto Khin Wityee Oo from UNICEF for her assistance in preparing the report.Communications Development Incorporated provided overall design direction, editing and layout.Copyright � 2010by the United Nations Children’s FundThe Inter‑agency Group for Child Mortality Estimation (IGME) constitutes representatives of the United Nations Children’sFund, the World Health Organization, the World Bank and the United Nations Population Division. The child mortality esti‑mates presented in this report have been reviewed by IGME members. As new information becomes available, estimates willbe updated by the IGME. Differences between the estimates presented in this report and those in forthcoming publications byIGME members may arise because of differences in reporting periods or in the availability of data during the production pro‑cess of each publication and other evidence.The designations employed and the presentation of the material in this publication do not imply the expression of any opinionwhatsoever on the part of UNICEF, the World Health Organization, the World Bank or the United Nations Population Divisionconcerning the legal status of any country, territory, city or area or of its authorities, or concerning the delimitation of its fron‑tiers or boundaries. Dotted lines on maps represent approximate border lines for which there may not yet be full agreement.United Nations Children’s Fund3 UN Plaza, New York, New York, 10017 USAThe World Bank1818 H Street, NW, Washington, DC, 20433 USAWorld Health OrganizationAvenue Appia 20, 1211 Geneva 27, SwitzerlandUnited Nations Population Division2 UN Plaza, New York, New York, 10017 USA
IntroductionMillennium Development Goal 4 (MDG4) callsfor reducing the under-five mortality rate bytwo-thirds between 1990 and 2015. As globalmomentum and investment for accelerating childsurvival grow, monitoring progress at the globaland country levels has become even more criti-cal. Generating accurate estimates of under-fivemortality poses a considerable challenge becauseof the limited data available for many develop-ing countries. In 2004 the United Nations estab-lished the Inter-agency Group for Child MortalityEstimation (IGME) to advance the work on moni-toring progress towards MDG 4 and to enhancecountry capacity to produce timely and prop-erly assessed estimates of child mortality. Thisreport presents the IGME’s latest estimates ofinfant and under-five mortality and assesses prog-ress towards MDG 4 at the country, regional andglobal levels.The most recent IGME estimates show thatnearly 8.1 million children under age five diedin 2009—or more than 22,000 children a day.Still, these figures reflect substantial progress.Globally, the under-five mortality rate has fallenfrom 89 deaths per 1,000 live births in 1990 to60 in 2009. But the rate of decline—a one-thirdreduction over 20 years—is insufficient to meetMDG4, particularly in Sub-Saharan Africa,Southern Asia and Oceania.
PROGRESS TOWARDS MillEnniuM DEvElOPMEnT GOAl 4: KEY FACTS AnD FiGuRES
• Globally, the number of deaths among children under age five has fallen from 12.4 million in 1990 to 8.1 million in 2009. This means that more than 22,000 children under five die each day—12,000 fewer than in 1990.• Since 1990 the global under-five mortality rate has fallen by a third—from 89 deaths per 1,000 live births in 1990 to 60 in 2009. All regions except Sub-Saharan Africa, Southern Asia and Oceania have seen reductions of at least 50 percent.• The rate of decline in under-five mortality has accelerated over 2000–2009 compared with the 1990s.• Northern Africa and Eastern Asia have made the most progress in reducing under-five mortality.• The rate of decline in under-five mortality remains insufficient to reach Millennium Development Goal 4, particularly in Sub-Saharan Africa, Southern Asia and Oceania.
• The highest rates of child mortality continue to be in Sub-Saharan Africa, where 1 child in8 dies before age five—nearly 20 times the average of 1 in 167 for developed regions. Southern Asia has the second highest rates, with about 1 child in 14 children dying before age five.• Under-five mortality is increasingly concentrated in a few countries. About half of global under-five deaths in 2009 occurred in only five countries: India, Nigeria, Democratic Republic of the Congo, Pakistan and China. India, with 21 percent, and Nigeria, with 10 percent, together account for nearly a third of under-five deaths worldwide. • Some 40 percent of under-five deaths occur within the first month of life, and some 70percent occur within the first year of life.• The two biggest killers of children under age five are pneumonia (18 percent of deaths) and diarrhoeal diseases (15 percent). 1
The UN Inter-agency Group forChild Mortality EstimationThe Inter-agency Group for Child Mortality Esti-mation (IGME) was formed in 2004 to sharedata on child mortality, harmonize estimateswithin the UN system, improve methods for childmortality estimation and produce consistentestimates of child mortality worldwide for report-ing on progress towards the Millennium Devel-opment Goals. The IGME, led by the UnitedNations Children’s Fund and the World HealthOrganization, also includes the World Bank andthe United Nations Population Division of theDepartment of Economic and Social Affairs asfull members.The IGME’s independent Technical AdvisoryGroup, comprising eminent scholars and inde-pendent experts in demography, provides techni-cal guidance on estimation methods, technicalissues and strategies for data analysis and dataquality assessment.The IGME updates its child mortality esti-mates annually after reviewing newly avail-able data and assessing data quality. Thisreport contains the latest IGME estimates ofchild mortality at the country, regional andglobal levels. Country- specific estimates andthe data used to derive them are availablefrom the child mortality database of the IGME:CMEInfo(www.childmortality.org).
2
EstimatingChildMortalityDATA SOuRCES AnD METhODOlOGYGenerating accurate estimates of under-five mortality poses a considerable challenge because of the limited avail-ability of high-quality data for many developing countries. Vital registration systems are the preferred source of data on child mortality because they collect information as events occur and cover the entire population. However, many developing countries lack vital registration systems that accurately record all births and deaths. Therefore, household surveys, such as the United Nations Children’s Fund–supported Multiple Indicator Cluster Surveys and the US Agency for International Development–supported Demographic and Health Surveys, are the primary source of data on child mortality in developing countries. The Inter-agency Group for Child Mortality Estima-tion seeks to compile all available national-level data on child mortality, including data from vital registration sys-tems, population censuses, household surveys and sam-ple registration systems. For each country a regression line is then fitted to the data points that meet data qual-ity standards established by the IGME and extrapolated to a common reference year: 2009 for the estimates pre-sented in this report.A substantial amount of newly available data has been incorporated into this year’s estimation process. The increased data availability has resulted in substantial changes to the estimates of child mortality levels and trends for some countries, compared with previous esti-mates. Because the fitted line is based on the entire time series of data available for each country, the estimates presented in this report may differ from and not be com-parable with those in previous reports.
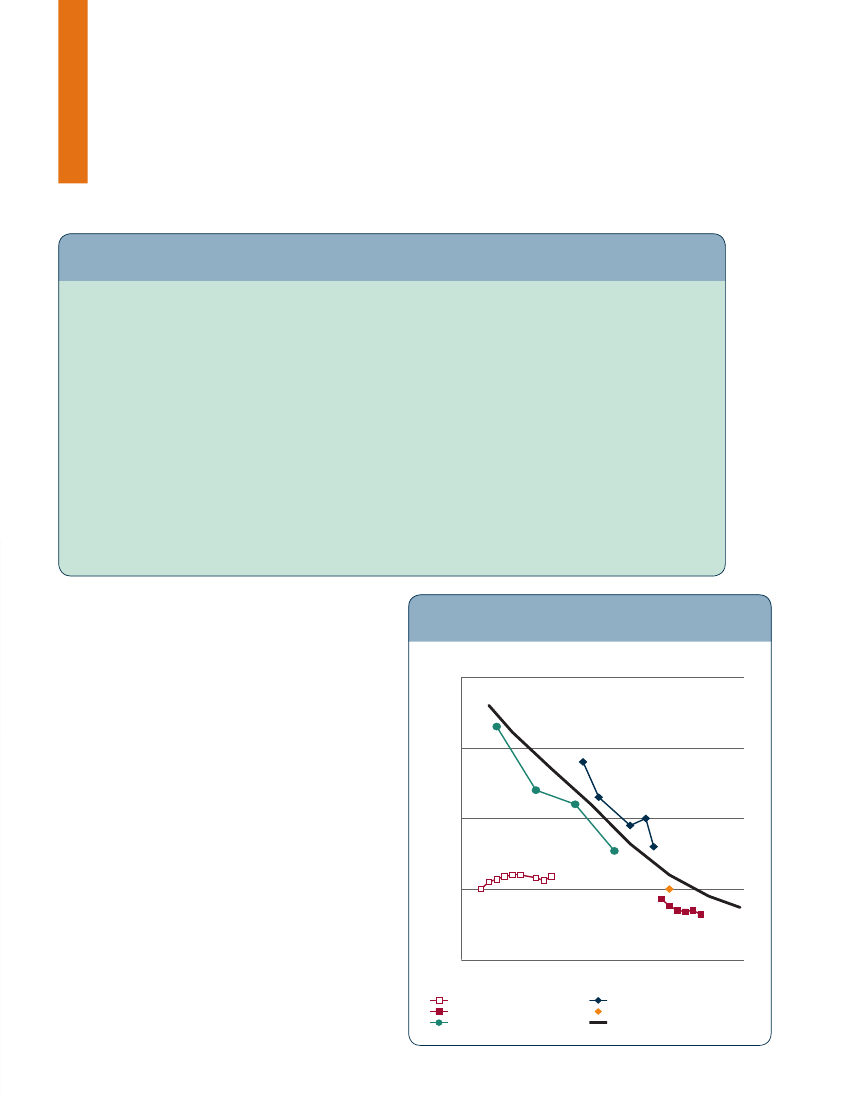
If each country had a single source of high-quality data on child mortality covering the last40 years, reporting on child mortality levels andtrends would be straightforward. Reality is dif-ferent. While industrialized countries and a fewdeveloping countries have such a source in theirvital registration systems, the majority of coun-tries do not. Furthermore, countries that havethe largest impact on global and regional childmortality estimates have to rely on multiplesources of varied quality covering limited periodsfor their national estimates.This section explains how child mortality esti-mates are derived from the available sources andthe challenges faced in producing high-qualityestimates. It focuses on the under-five mortal-ity rate, but estimates of the infant mortality ratehave similar issues.Figure 1 shows a hypothetical country example.The country has several sources of data: two house-hold surveys, A conducted in 1996 and B con-ducted in 2001; the 2000 population census; andvital registration data for two periods (1 and 2).
FiGuRE
1
Source data and estimate line for the under-fivemortality rate, hypothetical country, 1975–2010
Deaths per 1,000 live births200
150
100
50
019751980199020002010
Vital registration 1Vital registration 2Household survey A (1996)
Household survey B (2001)Census (2000)Estimate line
3
Household survey A collected full birth histo-ries, meaning that the women ages 15–49 whowere interviewed were asked when each of theirchildren had been born and the time of deathof children who had died. Such data allow directcalculation of the probability that children diebefore a certain age. Collecting such detailedbirth history data requires long questionnairesand well trained interviewers, but the data gath-ered can provide mortality rates covering periodsextending up to 25 years before the survey andyield better trend information than do indirectdata on child mortality (as household surveyBdoes). Household survey B collected data fromwomen ages 15–49 on the number of childrenthey had ever given birth to and the number whohad died by the time of the interview. Such dataprovide indirect information on the level of mor-tality affecting children and have proven to be asource of robust child mortality data, particularlyof under-five mortality, for the 10–15 years pre-ceding the survey or census.The single census point in figure 1 is derivedfrom data on births and deaths in the 12 monthsFiGuRE
immediately before the census; these data oftenunderreport mortality. However, most censusesalso collect indirect mortality data (as surveyBdoes) and thus also provide retrospective mortal-ity data.The vital registration data before 1990 under-report mortality, compared with data fromsurveys A and B. This is often the case whenregistration systems fail to record all childhooddeaths, especially those during the neonatalperiod. However, the vital registration data after1995 are more consistent with other sources,implying improved coverage of deaths.The thick black line in figure 1 is fitted to thedata sources and reports estimates of the under-five mortality rate for the country. There aremany ways of fitting these data, from a straightline fit to complex curvilinear models. The pri-mary methods used by the Inter-agency Groupfor Child Mortality Estimation are the multiple-spline regression and the locally weighted scatter-plot smoothing regression (for more detail onthese methods see www.childinfo.org/mortality_methodology.html).Whatever the method used to derive the esti-mates, data quality is critical. For example, theestimate line shown in figure 1 was fitted exclud-ing data from vital registration1 because thesedata grossly underreport under-five mortality.However, data from household surveys A and Bare considered of acceptable and similar quality,so the estimate line is approximately equidistantbetween them. The census and vital registra-tion2 underreport mortality but are still used infitting the estimate line, with a smaller influenceon the line than data from household surveysAand B.If household survey A data were of better qualitythan household survey B data, the estimate linewould be much closer to the household survey Adata; similarly, the estimate line would be closerto the household survey B data if its data were ofhigher quality. This range of possibilities for theestimate line between surveysA and B impliesuncertainty in the estimate: for example, theunder-five mortality rate estimate for 1990 rangesfrom 100 to 140 deaths per 1,000 live births. Inaddition, if the vital registration 2 data were miss-ing, the estimate line would have no data after
2
Source data and estimate line for theunder-five mortality rate, Mali, 1960–2010
Deaths per 1,000 live births450
350
250
150196019701980199020002010
Census (1976)Demographic and HealthSurvey (DHS), direct (1987)DHS, indirect (1987)DHS, direct (1995)DHS, indirect (1995)
DHS, direct (2001)DHS, indirect (2001)DHS, direct (2006)DHS, indirect (2006)Estimate line
4
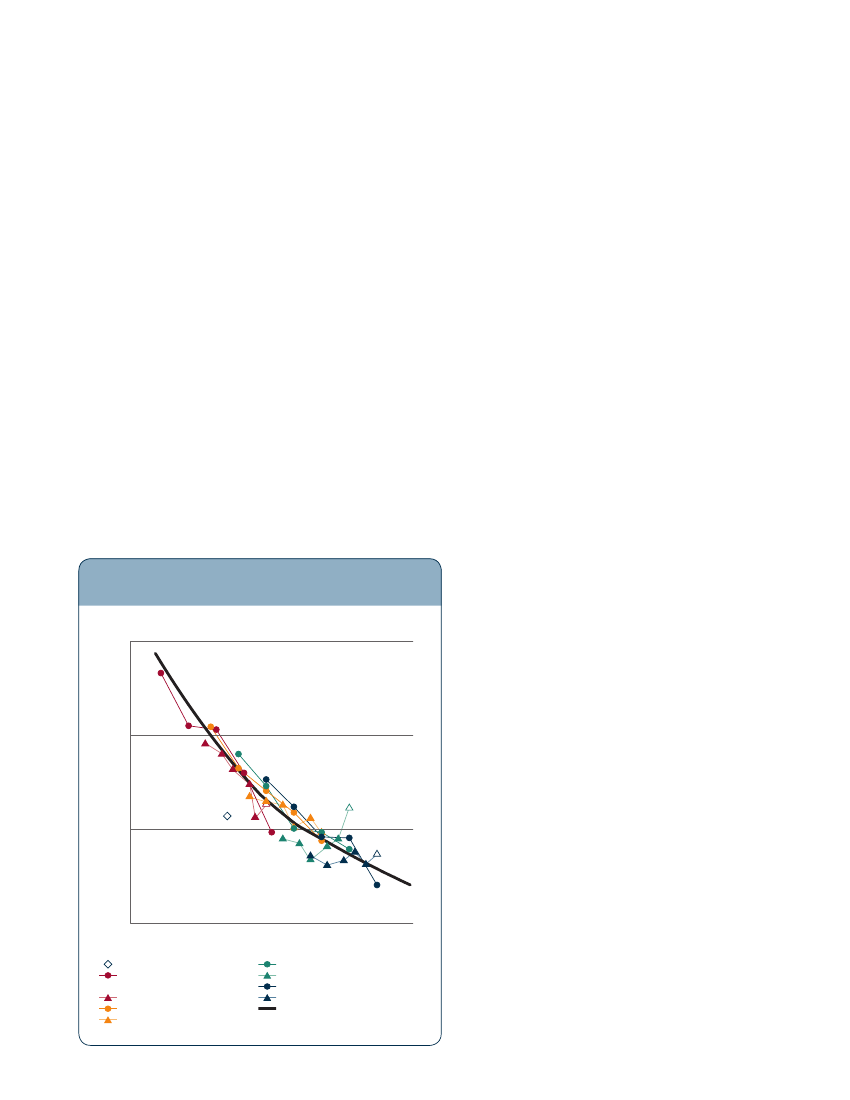
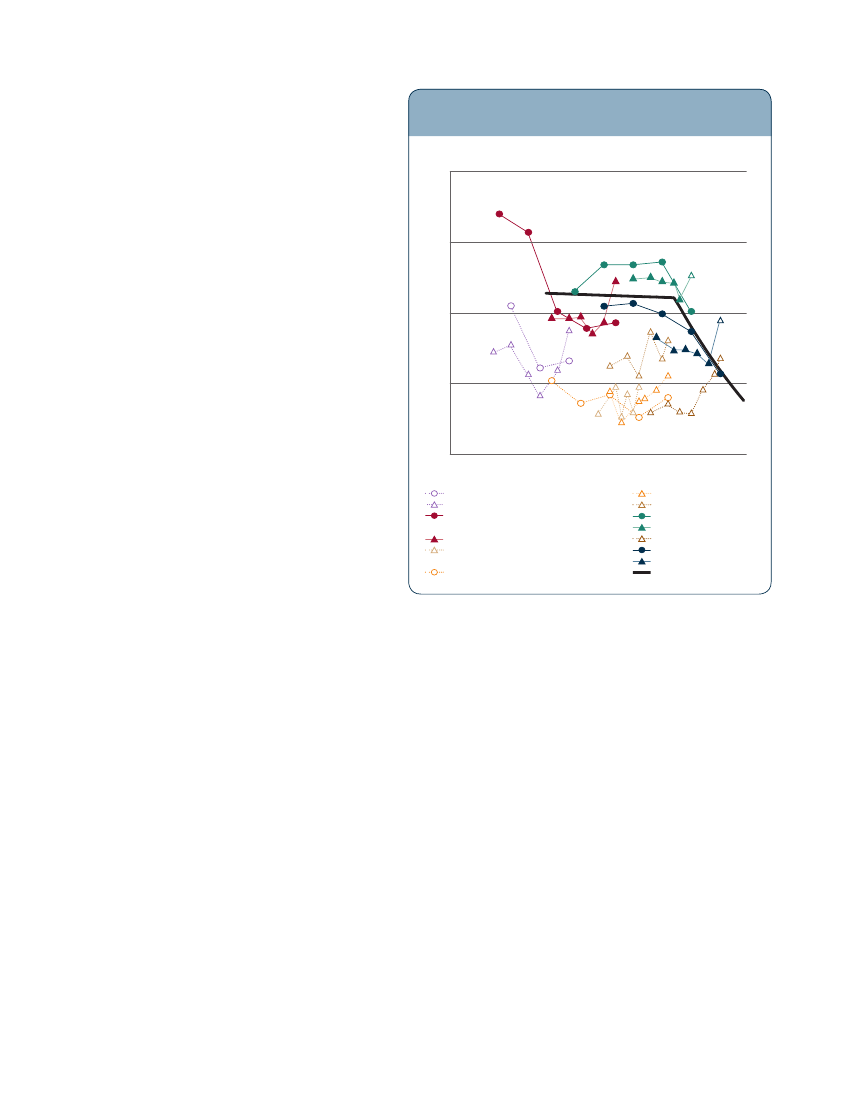
2000 to guide its projection to 2009, yieldingmore uncertain recent estimates.Thus, while the level of confidence attributable tounder-five mortality rate estimates at the countrylevel depends on the model used to fit the esti-mate line to the source data, the estimate lineis even more affected by the quality of the data,particularly the most recent data. Data qualityis generally reported in terms of sampling andnonsampling error. Because household surveyscollect data from only a sample of the total popu-lation in a country, sampling error reflects thedegree of uncertainty of reporting on the totalpopulation from a sample, with small samplesgenerally resulting in larger sampling errors.However, sampling errors can be calculated fromsurvey data.Because censuses and vital registrations coverevery birth and death, their data are not affectedby sampling errors, but their data are affectedby nonsampling errors, as are data from surveys.A common source of nonsampling error is non-response. If poorer women are missed by sur-veys, censuses and vital registrations, the datafrom these sources will likely understate the levelof child mortality, because mortality is higheramong the poor. And women who are uncomfort-able recalling the recent death of a child may notreport the death, which leads to underreporting.Nonsampling errors are often larger and morepervasive than sampling error and are difficult todetect and measure.Actual country examples can provide usefulinsights on the impact of data quality. In Mali, forinstance, the available data sources cluster over anarrow band, and the estimate line is fitted to allthe data because they show considerable consis-tency (figure 2). Bangladesh, Benin, Indonesia,Peru and Venezuela have similar results.Nigeria, by contrast, has one of the widestspreads of source data, with a range from 120to 240 deaths per 1,000 live births over 1980–2000 (figure 3). In deriving the estimate line, all
FiGuRE
3
Source data and estimate line for theunder-five mortality rate, nigeria, 1960–2010
Deaths per 1,000 live births300
250
200
150
100196019701980199020002010
World Fertility Survey, direct (1981)World Fertility Survey, indirect (1981)Demographic and HealthSurvey (DHS), direct (1990)DHS, indirect (1990)Multiple Indicator Cluster Survey(MICS), indirect (1995)DHS, direct (1999)
DHS, indirect (1999)MICS, indirect (1999)DHS, direct (2003)DHS, indirect (2003)MICS, indirect (2007)DHS, direct (2008)DHS, indirect (2008)Estimate line
sources with dotted lines in figure 3 are rated oflower quality and are not used. Other countrieswith wide ranges are Azerbaijan, China, Guyana,Mauritania and Tajikistan.None of the foregoing examples includes a coun-try with high HIV prevalence. In such countries ahigher proportion of women with AIDS die andare thus unable to report on their children, whoalso have higher mortality, resulting in a down-ward bias to overall child mortality. In Namibia,for instance, the under-five mortality rate for2001–06 from the 2006 Demographic and HealthSurvey had to be increased from 69 deaths per1,000 live births to 78 deaths to account for theimpact of AIDS. Similar adjustments were madefor 17 countries in Sub-Saharan Africa (see www.childinfo.org/mortality_methodology.html).
5
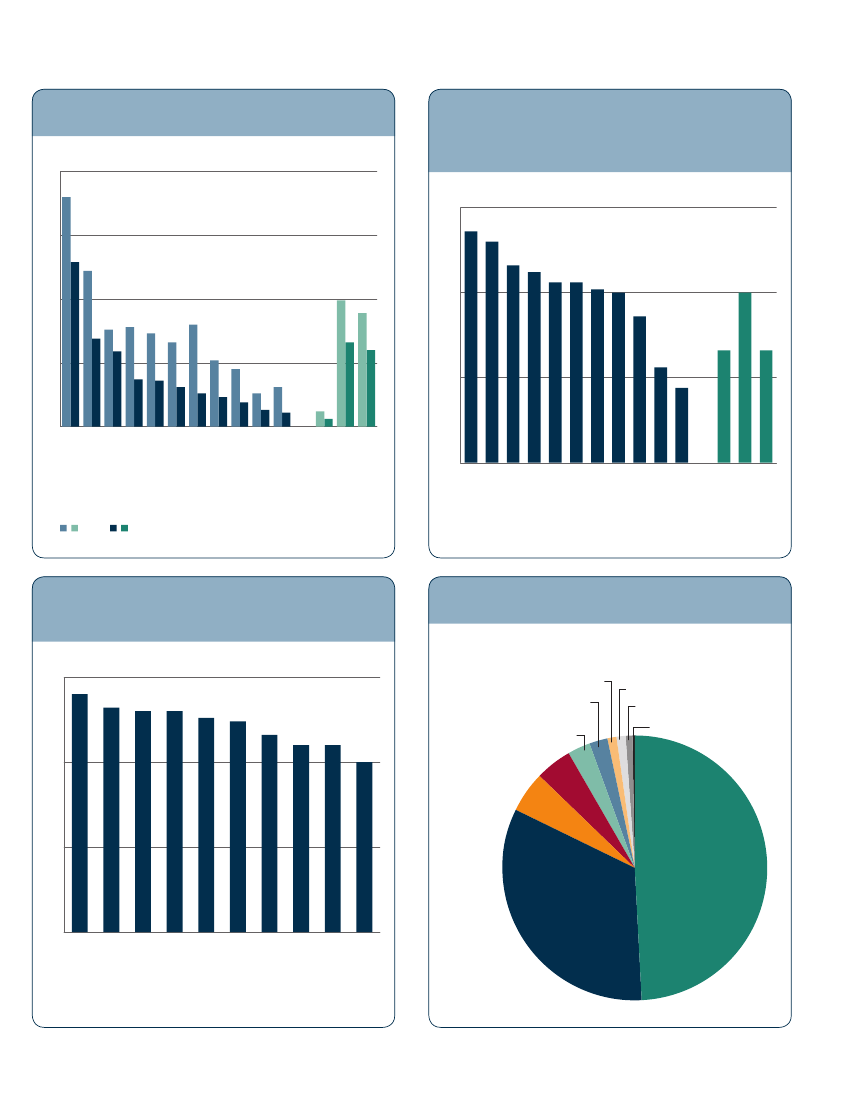
Levels and Trends inChildMortality, 1990–2009The global under-five mortality rate hasdeclined by a third, from 89 deaths per 1,000live births in 1990 to 60 in 2009 (table 1). Allregions except Sub-Saharan Africa, SouthernAsia and Oceania have seen reductions of atleast 50 percent (figures 4 and 5). The numberof under-five deaths worldwide has declinedfrom 12.4 million in 1990 to 8.1 million in 2009(table2).At the regional level in 2009 the highest rates ofunder-five mortality continue to be in Sub-Saha-ran Africa, where 1child in 8 died before age five(129 deaths per 1,000 live births), nearly doublethe average in developing regions (66) and nearly20 times the average in developed regions (6). Ofthe 31 countries with under-five mortality of atleast 100 deaths per 1,000 live births in 2009, 30are in Sub-Saharan Africa.Southern Asia has the second highest under-fivemortality rate, 69 deaths per 1,000 live births orabout 1 child in 14. Oceania is the only otherregion with an under-five mortality rate over 40deaths per 1,000 live births.In the developing world Northern Africa andEastern Asia have made the most progress inreducing under-five mortality, with averageannual rates of reduction of 5.9percent and4.5percent, respectively, between 1990 and 2009.Figure 6 shows the countries with high under-five mortality rates (at least 40deaths per 1,000live births in 2009) that had the highest ratesof decline between 1990 and 2009; 10 of themreduced under-five mortality by at least half. Ofthese, Timor-Leste, Nepal, Madagascar, Ban-gladesh, Eritrea and Lao People’s DemocraticRepublic recorded at least a 60 percent drop, oran average annual rate of reduction of at least5 percent. In absolute terms, Niger, Liberia,Timor-Leste, Madagascar, Malawi and Ethio-pia have achieved the largest reductions (morethan 100deaths per 1,000 live births during theperiod).6
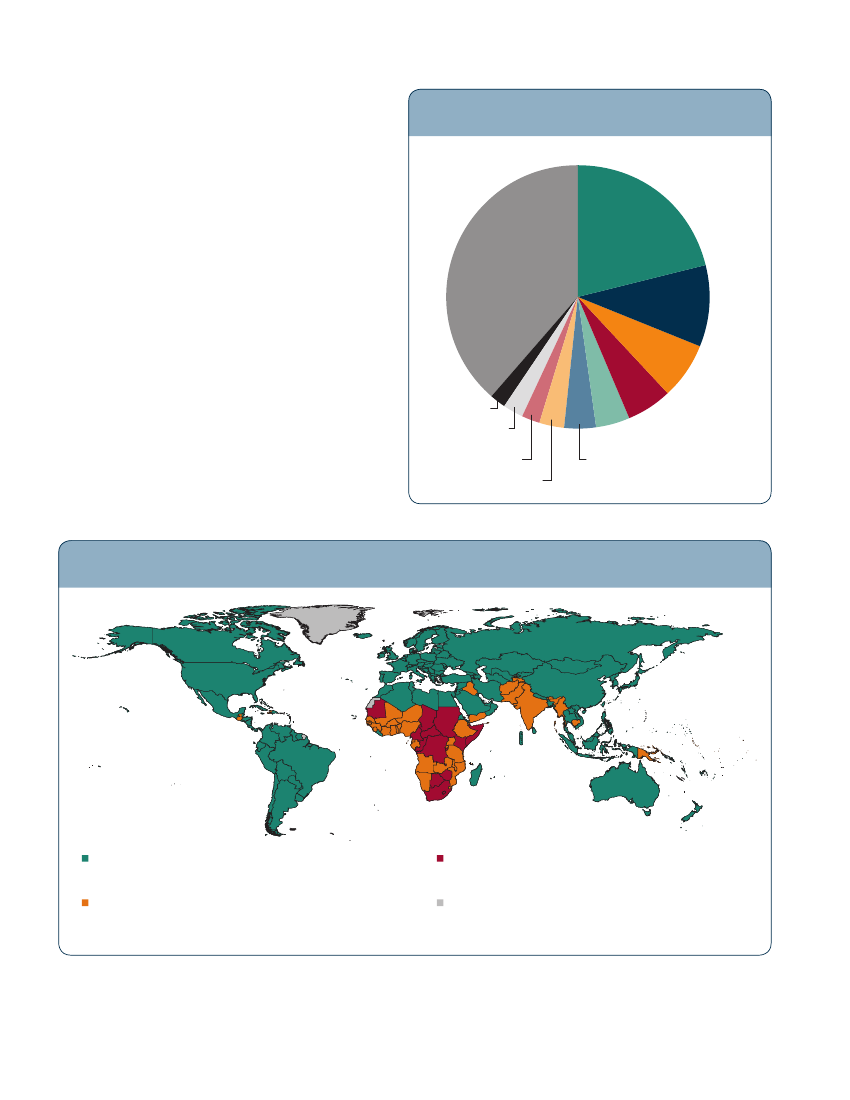
In 2009 nearly 8.1 million children died beforeage five worldwide. These deaths were con-centrated in two regions: Sub-Saharan Africaaccounted for nearly half, and Southern Asia athird (figure 7).Under-five mortality is increasingly concentrated:70 percent of the world’s under-five deaths in2009 occurred in only 15 countries. About halfoccurred in five countries: India, Nigeria, Dem-ocratic Republic of the Congo, Pakistan andChina(figure 8). India (21 percent) and Nigeria(10percent) together account for nearly a thirdof all under-five deaths worldwide.Overall, substantial progress has been madetowards Millennium Development Goal4(MDG4). In 2009 nearly 12,000 fewer childrendied every day than in 1990, the baseline yearfor the MDGs. The number of countries with anunder-five mortality rate of at least 100 deathsper 1,000 live births has fallen from 52 in 1990 to31 in 2009. Moreover, the annual rate of declinein under-five mortality has accelerated from1.4 percent over the 1990s to 2.8 percent over2000–2009.Nevertheless, the rate of decline remains insuf-ficient to achieve MDG4 by 2015. Of the devel-oping regions in table 1, all but3—Sub-SaharanAfrica, Southern Asia and Oceania—are ontrack to achieve the goal. However, those threeregions accounted for 82 percent of global under-five deaths in 2009. Thus, achieving MDG 4 atthe global level requires faster progress in thoseregions.Also alarming is that only 9 of the 64 countrieswith high under-five mortality rates (at least 40deaths per 1,000 live births in 2009) are on trackto achieve MDG 4 (map 1). But at the same time,substantial advances are being made. For exam-ple, 4 of the 10 best-performing countries are inSub-Saharan Africa (see figure 6), as are 5 of the6 countries with the largest absolute reductions
TAblE
1
levels and trends in the under-five mortality rate, 1990–2009 (deaths per 1,000 live births)Averageannual rateof reduction,1990–2009(percent)
Region
1990
1995
2000
2005
2007
2008
2009
Decline,1990–2009(percent)
Progress towardsMillenniumDevelopment Goal42009
Developing regionsNorthern AfricaSub-Saharan AfricaLatin America and the CaribbeanEastern AsiaExcluding ChinaSouthern AsiaExcluding IndiaSouth-eastern AsiaWestern AsiaOceaniaCountries of the Commonwealthof Independent StatesIn EuropeIn AsiaDeveloped regionsTransition countries ofSouth-eastern EuropeWorld
9980180524528122131736676462678123189
956017543443611011858566948257392586
84461603336299510148446539236282077
7433143272518798641366229174771567
7030136242218748139336026154261363
6828133232017728037326025143961262
6626129231917697836315923133761160
3368285658394340515322505053506533
2.15.91.84.34.52.63.02.73.74.01.33.63.63.93.65.52.1
Insufficient progressOn trackInsufficient progressOn trackOn trackOn trackInsufficient progressInsufficient progressOn trackOn trackInsufficient progressOn trackOn trackOn trackOn trackOn trackInsufficient progress
a“On track” indicates that under-five mortality is less than 40 deaths per 1,000 live births or that under-five mortality is at least 40 deaths per 1,000 live births and thatthe average annual rate of reduction is at least 4 percent; “insufficient progress” indicates that under-five mortality is at least 40 deaths per 1,000 live births and that theaverage annual rate of reduction is at least 1 percent but less than 4 percent. These standards may differ from those in other publications by Inter-agency Group for ChildMortality Estimation members.
TAblE
2
levels and trends in the number of deaths of children under age five, 1990–2009 (thousands)Share of globalunder-five deaths,2009(percent)
Region
1990
1995
2000
2005
2007
2008
2009
Decline,1990–2009(percent)
Developing regions12,012Northern Africa311Sub-Saharan Africa3,927Latin America and the Caribbean598Eastern Asia1,284Excluding China30Southern Asia4,727Excluding India1,595South-eastern Asia863Western Asia286Oceania15Countries of the Commonwealthof Independent States239In Europe83In Asia155Developed regions143Transition countries ofSouth-eastern Europe26World12,393
11,0981994,196496875464,3751,39668625715169461231061311,373
9,9531594,194385760283,7011,205527210161324686841210,169
8,7901184,117299459153,1461,0584651711510636707778,973
8,3511064,055267401152,9061,001436164159632657468,521
8,1351014,015252380152,789975420162159230627368,299
7,929963,976239361152,677951405159158728597168,087
3469–1607250434053440646662507735
98.01.249.23.04.50.233.111.85.02.00.21.10.30.70.90.1100.0
7
FiGuRE
4
under-five mortality declined in allregions between 1990 and 2009
FiGuRE
5
Under-five mortality rate, by region, 1990 and 2009 (deaths per 1,000 live births)200180
All regions except Southern Asia, Sub-Saharan Africa and Oceania reducedunder-five mortality rate by at least50percent between 1990 and 2009
Decline in under-five mortality rate, by region, 1990–2009 (percent)7568
150129122
6558
5653
53
51
50
89
76
78
69
73
66
80
66
43
100
50
99
33
5028
59
52
37
50
36
45
60
26
23
19
26
13
11
12
Transition countries ofsouth-eastern Europe
Sub-Saharan Africa
South-eastern Asia
Western Asia
Northern Africa
Southern Asia
Oceania
Latin America andthe Caribbean
Eastern Asia
Developed regions
Developing regions
CIS in Europe
CIS in Asia
World
0
6
Transition countries ofsouth-eastern Europe
Northern Africa
Western Asia
South-eastern Asia
Sub-Saharan Africa
Eastern Asia
Latin America andthe Caribbean
Southern Asia
Oceania
Developing regions
1990
2009
FiGuRE
6
Of the 64 countries with high under-fivemortality, 10 have seen reductions of atleast 50 percent between 1990 and 2009
FiGuRE
7
in 2009, 8.1 million children diedbefore their fifth birthday
Number of under-five deaths, by region, 2009 (thousands)
Decline in under-five mortality rate, 1990–2009, top 10 countries (percent)70
75
Northern Africa966565
CIS87Developed regions71Oceania15
Western Asia1596362
66
55
55
Latin America &Caribbean239Eastern Asia361South-easternAsia40550
50
25Sub-SaharanAfrica3,976SouthernAsia2,677Timor-LesteBangladeshEritreaLao People’sDemocratic RepublicBoliviaLiberiaTurkmenistanMadagascarEthiopiaNepal0
8
58
Developed regions
CIS in Europe
CIS in Asia
World
0
22
25
31
31
33
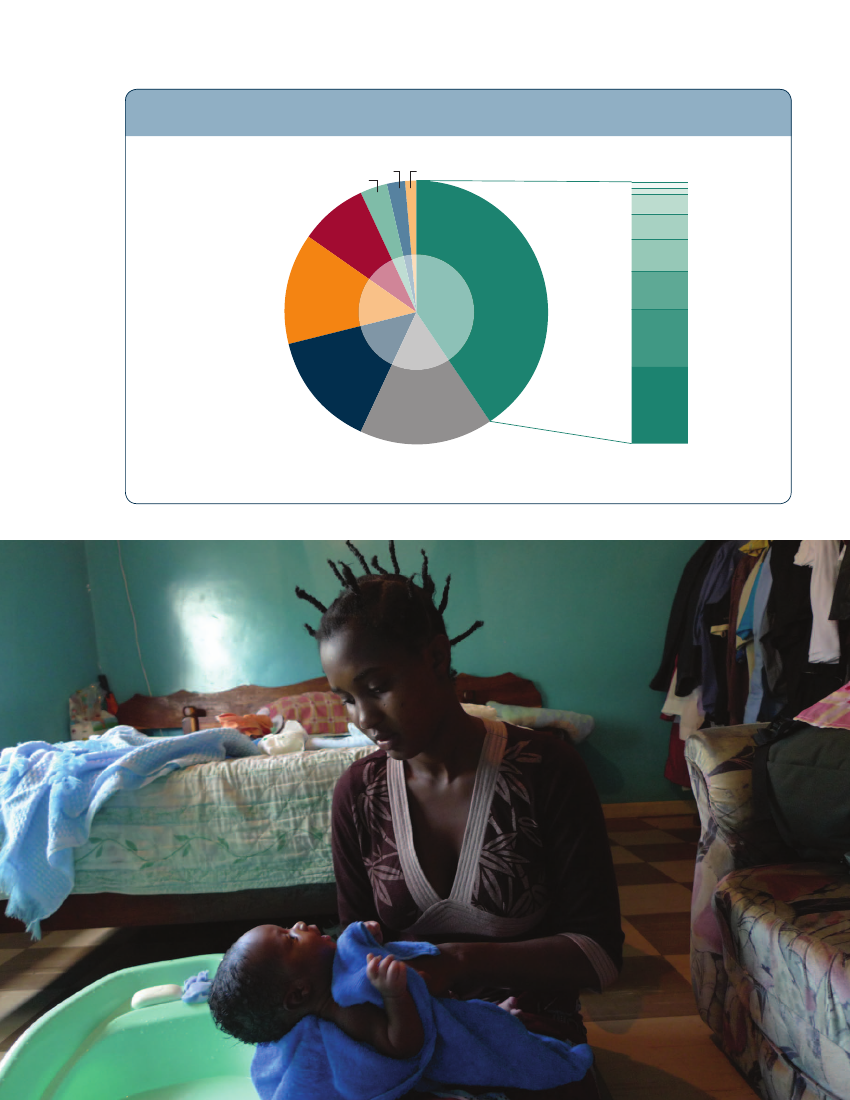
in under-five mortality rate (more than 100deaths per 1,000 live births).There is thus increasing evidence that MDG 4can be achieved, but only if countries in Sub-Saharan Africa, Southern Asia and Oceaniatarget the biggest killers of children. InSub-Saharan Africa diarrhoea, malaria andpneumonia cause more than half of under-fivedeaths. In Southern Asia more than half of allchildhood deaths occur in the first 28days afterbirth. For both regions undernutrition is anunderlying cause of a third of under-five deaths(figure9).Despite the substantial progress in reducing childdeaths, children from poorer or rural householdsremain disproportionately vulnerable across allregions. It is important to address these inequi-ties in order to achieve MDG 4.
FiGuRE
8
The 10 countries with the mostunder-fivedeaths
Number of under-five deaths, by country, 2009 (thousands)
India1,726Othercountries3,107Nigeria794
Dem. Rep. ofthe Congo558Bangladesh171Uganda184United Rep. ofTanzania188Afghanistan237China347Ethiopia315Pakistan460
MAP
1
Many countries were on track in 2009 to achieve Millennium Development Goal 4,but progress needs to accelerate in Southern Asia and Sub-Saharan Africa
On track: under-five mortality is less than 40 deaths per 1,000 livebirths, or under-five mortality is at least 40 deaths per 1,000 livebirths and the average annual rate of reduction is at least 4 percent.Insufficient progress: under-five mortality is at least 40 deaths per1,000 live births and the average annual rate of reduction is at least1 percent but less than 4 percent.
No progress: under-five mortality is at least 40 deaths per1,000 live births and the average annual rate of reduction isless than 1 percent.Data not available.Note:These standards may differ from those in other publicationsby Inter-agency Group for Child Mortality Estimation members.
9
FiGuRE
9
Revitalizing efforts against pneumonia and diarrhoea, whilebolstering nutrition, could save millions of childrenCauses of deaths among children under age five, 2008 (percent)HIV/AIDS2Injuries3Measles1Tetanus1Diarrhoea1Congenital3Pneumonia4Other5Globally, morethan one-thirdof child deaths areattributable toundernutritionNeonatal41
Malaria8
Pneumonia14
Sepsis6
Birth asphyxia9
Diarrhoea14Other16Preterm birthcomplications12
Source:Black R, Cousens S, Johnson H, Lawn J, Rudan I, Bassani D, Jha P Campbell H, Walker C, Cibulskis R, Eisele T, Liu L, and Mathers C,,for the Child Health Epidemiology Reference Group of WHO and UNICEF 2010, “Global, Regional, and National Causes of Child Mortality in,2008: A Systematic Analysis,Lancet375(9730): 1969–87”.
10
StatiStical table
country, regional and global estimates ofunder-five and infant mortality
Under-fivemortality rate(deaths per 1,000 live births)Millennium Observed averageDevelopmentannual rate ofGoal targetforreduction,20151990–2009831720386—9193333854968314614941820194667633949321586771512433566514531.26.43.44.32.5—3.64.93.14.35.63.91.55.52.63.63.64.62.33.34.62.60.35.22.43.11.00.71.5–0.21.54.30.1–0.24.74.73.21.1–1.11.02.61.35.04.54.8
Number ofunder-fivedeaths(thousands)
Infant mortality rate(deaths per 1,000live births)
Number ofinfantdeaths(thousands)
Country or territoryAfghanistanAlbaniaAlgeriaAndorraAngolaAntigua and BarbudaArgentinaArmeniaAustraliaAustriaAzerbaijanBahamasBahrainBangladeshBarbadosBelarusBelgiumBelizeBeninBhutanBolivia (Plurinational State of)Bosnia and HerzegovinaBotswanaBrazilBrunei DarussalamBulgariaBurkina FasoBurundiCambodiaCameroonCanadaCape VerdeCentral African RepublicChadChileChinaColombiaComorosCongoCook IslandsCosta RicaCôte d'IvoireCroatiaCubaCyprus
199025051619258—2856999825161481824104318414812223605611182011891171488631752012246351281041818152131410
20091991532416112142254341212521112518118795114572171016616688154628171209919191041281511119564
19901494470137—20521200057904103832823196028048417331205461,25531290276120
20092371230116010110600171011039113136101121463210820261002347172160183010
199016741517153—2548887817141021520935111918421464691411011485917491151201837289067161610511109
20091341429398111320433091041101141675524013431758911016895523112124717167581131083543
1990100339082—18421160039503102322012159024429284531133351,03125160153120
200916012107009110500134010025110025001702826662017592302152100158000
11
StatiStical table(cOntinueD)
country, regional and global estimates ofunder-five and infant mortality
Under-fivemortality rate(deaths per 1,000 live births)Millennium Observed averageDevelopmentannual rate ofGoal targetforreduction,20151990–20094156634162118302166506707233151163404132577802051—186239292418343112135.81.60.04.31.43.13.54.27.76.81.65.35.53.71.14.54.31.62.12.54.32.96.85.23.42.61.12.92.9—3.25.54.53.14.24.51.04.35.34.80.33.62.3
Number ofunder-fivedeaths(thousands)
Infant mortality rate(deaths per 1,000live births)
Number ofinfantdeaths(thousands)
Country or territoryCzech RepublicDemocratic People'sRepublic of KoreaDemocratic Republicof the CongoDenmarkDjiboutiDominicaDominican RepublicEcuadorEgyptEl SalvadorEquatorial GuineaEritreaEstoniaEthiopiaFijiFinlandFranceGabonGambiaGeorgiaGermanyGhanaGreeceGrenadaGuatemalaGuineaGuinea-BissauGuyanaHaitiHoly SeeHondurasHungaryIcelandIndiaIndonesiaIran (Islamic Republic of)IraqIrelandIsraelItalyJamaicaJapanJordan
19901245199912318625390621981501721022799315347912011407623124061152—551771188673539111033639
2009433199494103224211714555610418346910329469315401421933587—30636639314444431325
1990216350130131618610319045900636486810256310138—10203,13338613836015285
200901155802077422410031500336235000185412024—6101,7261634341012234
1990102312689515484166481209213124196768104417769335713714247105—4315684565542810828532
20093261263758272018158839467153352782644731333881152964—25525030263543326222
1990272251201012138821202770052446431019376126—8202,22325010229015254
200909352020663622702060022512340015347017—5101,3161243634002124
12
StatiStical table(cOntinueD)
Under-fivemortality rate(deaths per 1,000 live births)Millennium Observed averageDevelopmentannual rate ofGoal targetforreduction,20151990–2009203330625525133182123535673638834164381519334630773924—47342310271—3143.80.93.52.83.75.23.66.30.54.23.48.54.85.85.63.65.811.41.42.41.80.51.85.12.13.66.63.34.52.62.72.2—5.73.63.25.13.42.3—5.81.9
Number ofunder-fivedeaths(thousands)
Infant mortality rate(deaths per 1,000live births)
Number ofinfantdeaths(thousands)
Country or territoryKazakhstanKenyaKiribatiKuwaitKyrgyzstanLao People's DemocraticRepublicLatviaLebanonLesothoLiberiaLibyan Arab JamahiriyaLiechtensteinLithuaniaLuxembourgMadagascarMalawiMalaysiaMaldivesMaliMaltaMarshall IslandsMauritaniaMauritiusMexicoMicronesia(FederatedStates of)MonacoMongoliaMontenegroMoroccoMozambiqueMyanmarNamibiaNauruNepalNetherlandsNew ZealandNicaraguaNigerNigeriaNiueNorwayOccupied PalestinianTerritory
1990609989177515716409324736101591672181811325011491292445588101178923211873—14281168305212—943
2009298446103759812841121926358110613191735117171739429938142714844484626160138—330
1990249601102713524301082949196001001050080631321264—1002110124895—14
20099124015100151630003864301010012034001025121703034104122794—04
19905164651463108123374165329128102129168013910398121364577315691558449—997952144126—735
200926553783246711618017252416961110162974151532324833965434363945227686—325
19902163019191241630105357815300608500604887863—7011759532—03
20098830048014112000274030540080300010228153202710361500—04
13
StatiStical table(cOntinueD)
country, regional and global estimates ofunder-five and infant mortality
Under-fivemortality rate(deaths per 1,000 live births)Millennium Observed averageDevelopmentannual rate ofGoal targetforreduction,20151990–200916437103014262065631211957978175321450105953531360213941173123123911127.32.11.81.61.53.26.93.14.77.02.93.14.15.24.32.32.90.03.63.610.61.03.82.67.51.22.15.24.06.30.30.00.04.33.30.73.51.24.53.64.33.44.46.2
Number ofunder-fivedeaths(thousands)
Infant mortality rate(deaths per 1,000live births)
Number ofinfantdeaths(thousands)
Country or territoryOmanPakistanPalauPanamaPapua New GuineaParaguayPeruPhilippinesPolandPortugalQatarRepublic of KoreaRepublic of MoldovaRomaniaRussian FederationRwandaSaint Kitts and NevisSaint LuciaSaint Vincent and the GrenadinesSamoaSan MarinoSao Tome and PrincipeSaudi ArabiaSenegalSerbiaSeychellesSierra LeoneSingaporeSlovakiaSloveniaSolomon IslandsSomaliaSouth AfricaSpainSri LankaSudanSurinameSwazilandSwedenSwitzerlandSyrian Arab RepublicTajikistanThailandThe former YugoslavRepublic of Macedonia
1990481302131914278591715199373227171262024501595431512915285815103818062928124519278361173236
2009128715236823213374115171212111152012252782193712192373361806241510826733416611411
19903615021365111992053136155000000254740480100526641012803111725341
20091460021431375300213194200000012431043000169662513903001012130
199037101182567346241151217830252310322161940146235732513166613931109488237844676730912732
2009971131652191926631051510117013191121152185161112326230109434136924522414521210
19903482021054185810431051320000002123302701003351388203111420291
200913740111312602002121727000000112410270000424524890200910120
14
StatiStical table(cOntinueD)
Under-fivemortality rate(deaths per 1,000 live births)Millennium Observed averageDevelopmentannual rate ofGoal targetforreduction,20151990–2009615081117283318617635448251311184260276.32.21.0–0.24.67.64.12.21.91.84.72.72.11.73.23.84.83.04.43.41.3–0.6
Number ofunder-fivedeaths(thousands)
Infant mortality rate(deaths per 1,000live births)
Number ofinfantdeaths(thousands)
Country or territoryTimor-LesteTogoTongaTrinidad and TobagoTunisiaTurkeyTurkmenistanTuvaluUgandaUkraineUnited Arab EmiratesUnited KingdomUnited Republic of TanzaniaUnited StatesUruguayUzbekistanVanuatuVenezuela (BolivarianRepublic of)Viet NamYemenZambiaZimbabwe
199018415023345084995318421171016211247440325512517981
200956981935212045351281576108813361618246614190
19905240111115130152151717445153018116756031
200932001328501847041883512001035567433
1990138891930406981421111815899921613327398810854
200948641731181942297913756871132141520518656
1990414019921109413161083714501583533720
20092130132540117604121311180929444621
Estimates of under-five and infant mortality by Millennium Development Goal regionsa,bDeveloping regionsNorthern AfricaSub-Saharan AfricaLatin America and theCaribbeanEastern AsiaExcluding ChinaSouthern AsiaExcluding IndiaSouth-eastern AsiaWestern AsiaOceaniaCountries of the Commonwealthof Independent StatesIn EuropeIn AsiaDeveloped regionsTransition countries ofsouth-eastern EuropeWorld9980180524528122131736676462678123189662612923191769783631592313376116033276017159414424222515926410302.15.91.84.34.52.63.02.73.74.01.33.63.63.93.65.52.112,0123113,9275981,284304,7271,59586328615239831551432612,3937,929963,976239361152,677951405159158728597168,08768611094136188795505256382264102562472381191614536029264521123359428,3712372,4014761,049183,3821,1595922241119970129118228,6885,613852,503199314122,051736317132127725526155,751
15
StatiStical table(cOntinueD)
country, regional and global estimates ofunder-five and infant mortalityEstimates of under-five and infant mortality by uniCEF regionsbUnder-fivemortality rate(deaths per 1,000 live births)MillenniumDevelop- Observed averagement Goalannual rate oftargetforreduction,20151990–20095560556626294218171.81.82.31.53.32.93.03.74.3Number ofunder-fivedeaths(thousands)Infant mortality rate(deaths per 1,000live births)Number ofinfantdeaths(thousands)
RegionAfricaSub-Saharan AfricaEastern and Southern AfricaWest and Central AfricaMiddle East and North AfricaAsiaSouth AsiaEast Asia and PacificLatin America and CaribbeanCentral and EasternEurope/Commonwealth ofIndependent StatesIndustrialized countriesDeveloping countriesLeast developed countriesWorld
199016518016619977871255352
20091181291081504150712623
19904,2393,9271,6742,1227506,7524,5892,162598
20094,0723,9761,5042,3314103,4172,635782239
19901021091031185763894041
2009758169923239552119
19902,6382,4011,0471,2705544,9323,2801,652476
20092,5872,5039721,4403172,6582,015643199
51109917889
2166612160
173335930
4.72.72.12.02.1
38111712,1673,74412,393
120667,9883,3308,087
4286811262
195477842
313978,5002,3628,688
108565,6652,1485,751
Estimates of under-five and infant mortality by World health Organization regionsbUnder-fivemortality rate(deaths per 1,000 live births)MillenniumDevelop- Observed averagement Goalannual rate oftargetforreduction,20151990–2009601435113815301.84.31.95.13.54.12.1Number ofunder-fivedeaths(thousands)Infant mortality rate(deaths per 1,000live births)Number ofinfantdeaths(thousands)
RegionAfricaAmericasEastern MediterraneanEuropeSouth-East AsiaWestern PacificWorld
199017941104341144689
2009127187213592160
19903,7926461,5154394,3931,60512,393
20093,7902761,1471442,1985278,087
1990109327728803662
200980155412461842
19902,3225161,1273623,0751,2838,688
20092,3912328681271,6814485,751
16
StatiStical table(cOntinueD)
Estimates of under-five and infant mortality by World bank regionsbUnder-fivemortality rate(deaths per 1,000 live births)MillenniumDevelop- Observed averagement Goalannual rate oftargetforreduction,20151990–200957283017321817172542604302.02.62.44.22.13.84.54.44.43.01.73.12.1Number ofunder-fivedeaths(thousands)Infant mortality rate(deaths per 1,000live births)Number ofinfantdeaths(thousands)
RegionLow incomeMiddle incomeLower middle incomeUpper middle incomeLow and middle incomeEast Asia and PacificEurope and Central AsiaLatin America and theCaribbeanMiddle East and North AfricaSouth AsiaSub-Saharan AfricaHigh incomeWorld
199017083905097545152751251801289
2009117515722652621223371129760
19903,5838,6537,67398012,2352,1573815975914,5893,92115812,393
20093,1964,8044,4273778,0007791202382572,6353,971878,087
19901086064406741424257891091062
20097538421946211919275581642
19902,2696,2895,5027878,5581,6473134754473,2802,3971308,688
20092,0713,6063,2913145,6776411081992162,0152,499745,751
Estimates of under-five and infant mortality by united nations Population Division regionsbUnder-fivemortality rate(deaths per 1,000 live births)MillenniumDevelop- Observed averagement Goalannual rate oftargetforreduction,20151990–2009533593.92.12.0Number ofunder-fivedeaths(thousands)Infant mortality rate(deaths per 1,000live births)Number ofinfantdeaths(thousands)
RegionMore developed regionsLess developed regionsLeast developed countriesLess developed regions,excluding least developedcountriesLess developed regions,excluding ChinaSub-Saharan AfricaAfricaAsiaEuropeLatin America and theCaribbeanNorthern AmericaOceaniaWorld
19901599178
2009766121
199022612,1673,744
2009997,9883,330
19901268112
200964778
19901888,5002,362
2009865,6652,148
82114180165841752113689
50741291184872382960
273860552861741230
2.62.21.71.73.04.64.41.91.12.1
8,42310,9123,9274,2397,323168598481812,393
4,6587,6413,9764,0723,6655723937178,087
607710910261154192762
385281753761972242
6,1387,4692,4012,6385,38114047640148,688
3,5175,3632,5032,5872,8694919933135,751
— not available.aSee next page for country classifications by region.bThe sum of the number of deaths by region may differ from the world total because of rounding.
17
RegionalClassificationsThe regional classifications that are referred to in the report and for which aggregate data are provided inthe statistical table are Millennium Development Goal regions (see below). Aggregates presented for memberorganizations of the Inter-agency Group for Child Mortality Estimation may differ. Regions with the same namesin different agencies may include different countries.
Developing countriesEastern Asia
China, Democratic People’s Republic of Korea,Mongolia, Republic of Korealatin America and the Caribbean
Antigua and Barbuda, Argentina, Bahamas, Barba-dos, Belize, Bolivia (Plurinational State of), Brazil,Chile, Colombia, Costa Rica, Cuba, Dominica, Domin-ican Republic, Ecuador, El Salvador, Grenada, Gua-temala, Guyana, Haiti, Honduras, Jamaica, Mexico,Nicaragua, Panama, Paraguay, Peru, Saint Kitts andNevis, Saint Lucia, Saint Vincent and the Grenadines,Suriname, Trinidad and Tobago, Uruguay, Venezuela(Bolivarian Republic of)northern Africa
Guinea, Eritrea, Ethiopia, Gabon, Gambia, Ghana,Guinea, Guinea-Bissau, Kenya, Lesotho, Liberia,Madagascar, Malawi, Mali, Mauritania, Mauritius,Mozambique, Namibia, Niger, Nigeria, Rwanda;São Tomé and Príncipe, Senegal, Seychelles, SierraLeone, Somalia, South Africa, Sudan, Swaziland,Togo, Uganda, United Republic of Tanzania,Zambia, ZimbabweWestern Asia
Bahrain, Cyprus, Iraq, Israel, Jordan, Kuwait,Lebanon, Occupied Palestinian Territories, Oman,Qatar, Saudi Arabia, Syrian Arab Republic, Turkey,United Arab Emirates, Yemen
Countries of the Commonwealthof Independent Statesin Europe
Algeria, Egypt, Libyan Arab Jamahiriya, Morocco,TunisiaOceania
Belarus, Republic of Moldova, Russian Federation,Ukrainein Asia
Cook Islands, Fiji, Kiribati, Marshall Islands,Micronesia (Federated States of), Nauru, Niue, Palau,Papua New Guinea, Samoa, Solomon Islands, Tonga,Tuvalu, VanuatuSouth-eastern Asia
Armenia, Azerbaijan, Georgia, Kazakhstan,Kyrgyzstan, Tajikistan, Turkmenistan, Uzbekistan
Developed countriesBrunei Darussalam, Cambodia, Indonesia, LaoPeople’s Democratic Republic, Malaysia, Myanmar,Philippines, Singapore, Thailand, Timor-Leste,VietNamSouthern Asia
Afghanistan, Bangladesh, Bhutan, India, Iran (IslamicRepublic of), Maldives, Nepal, Pakistan, Sri LankaSub-Saharan Africa
Albania, Andorra, Australia, Austria, Belgium, Bosniaand Herzegovina, Bulgaria, Canada, Croatia, CzechRepublic, Denmark, Estonia, Finland, France, Ger-many, Greece, Hungary, Iceland, Ireland, Italy, Japan,Latvia, Liechtenstein, Lithuania, Luxembourg, Malta,Monaco, Montenegro, Netherlands, New Zealand,Norway, Poland, Portugal, Romania, SanMarino, Ser-bia, Slovakia, Slovenia, Spain, Sweden, Switzerland,The former Yugoslav Republic ofMacedonia, UnitedKingdom, United StatesTransition countries of South-eastern Europe
18
Angola, Benin, Botswana, Burkina Faso, Burundi,Cameroon, Cape Verde, Central African Republic,Chad, Comoros, Congo, Côte d’Ivoire, DemocraticRepublic of the Congo, Djibouti, Equatorial
Albania, Bosnia and Herzegovina, Bulgaria,Montenegro, Romania, Serbia, The former YugoslavRepublic of Macedonia
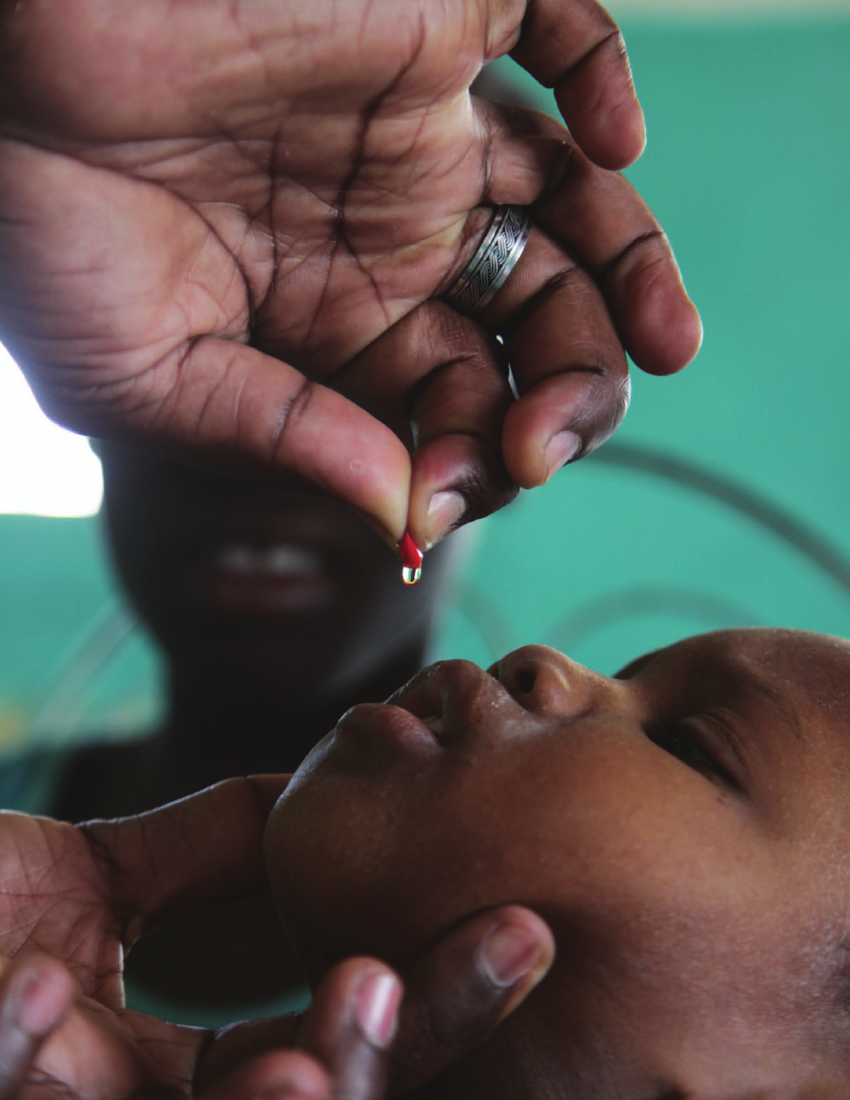
Photo credits: cover, � UNICEF/NYHQ2010‑0406/Holt; page 2, � UNICEF/NYHQ2010‑1185/Asselin;page 10, � UNICEF/NYHQ2009‑0730/Nesbitt; page 19, � UNICEF/NYHQ2010‑1207/LeMoyne.
United NationsDESA/Population Division
The UN Inter-agency Group for Child Mortality EstimationThe Inter-agency Group for Child Mortality Estimation (IGME) was formedin 2004 to share data on child mortality, harmonize estimates within theUN system, improve methods for child mortality estimation and produceconsistent estimates of child mortality worldwide for reporting on prog-ress towards the Millennium Development Goals. The IGME, led by theUnited Nations Children’s Fund and the World Health Organization, alsoincludes the World Bank and the United Nations Population Division of theDepartment of Economic and Social Affairs as full members.The IGME’s independent Technical Advisory Group, comprising eminentscholars and independent experts in demography, provides technicalguidance on estimation methods, technical issues and strategies for dataanalysis and data quality assessment.The IGME updates its child mortality estimates annually after review-ing newly available data and assessing data quality. This report containsthe latest IGME estimates of child mortality at the country, regional andglobal levels. Country-specific estimates and the data used to derive themare available at www.childmortality.org.
