Trafikudvalget 2009-10
TRU Alm.del Bilag 68
Offentligt
ENVIRONMENTALLY FRIENDLY COASTAL PROTECTIONBASED ON VERTICAL DRAINSPoul Jakobsen and Claus Brøgger1 2
A Field test over 11 km with the SIC vertical drain system was carried out in January2005 up till January 2008 and placed at Skodbjerge at the Danish west coast. Alreadyafter 6 month has the vertical drain system stabilized the beach in an equilibrium profile.The average beach level from the dune foot and 100 m. wide was after 3 years up to 157cm higher in the drained areas in relation to the reference area 2. The erosion wasstopped in the drained area’s, and the sand drift increased to the dune system over thenext 3 years. The sand drift from the beach to the dune system is calculated to 69 – 76cubic meters pr. meter along the coastline in the drained areas over 3 years.
Introduction.
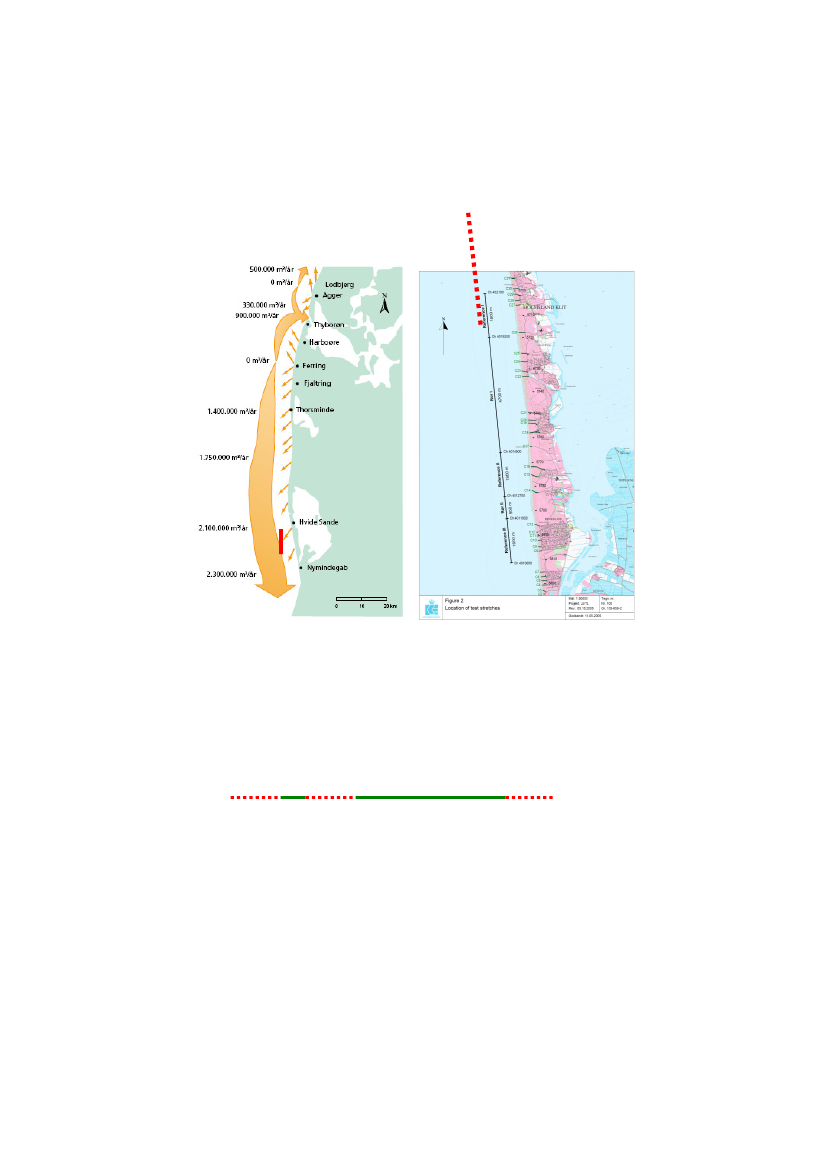
In accordance with the agreement of 10 Juni 2004 between Skagen InnovationCenter (SIC) and the Ministry of Transport a field test with purpose ofdemonstrating the efficiency of the SIC vertical drain system as a mean forcoastal protection was initiated in a meeting 24 August 2004.The project isstarted up in January 2005.The test period is three years. The first evaluation report was agreed to be madeafter the first 6 month. Afterwards are the results evaluated yearly and finallyafter 3 years.It was agreed with the Ministry of Transport that the effect of the SIC systemshould be compared to conventional coastal protection methods.The Danish west coast is a high erosion area as we see in fig 1. The erosion at110 km is total 4.030.000 cubic meters yearly.This coastline is nourished with 2,5mill. cubic meters sand yearly over the last25 years. The net result of the sand nourishment over 25 years is negative with-38.250.000 cubic meters and the efficiency is negative with 160% yearly afteran investment of 2.0 billions DKK equal to 270 mill. Euros. This is thebackground for the interest from the Ministry of Transport to supportdevelopment of new effective and environmentally friendly coastal protectionmethods.Field and laboratory observations have shown, that a relatively low beach groundwater table enhances beach accretion, while a high water table promotes erosion(L. Li and D.A. Barry)The test site is placed by Skodbjerge at the Danish West Coast
12
Skagen Innovation Center, Dr. Alexandrinesvej 75, 9990 Skagen DenmarkSkagen Innovation Center, Dr. Alexandrinesvej 75, 9990 Skagen Denmark
1
2Test SiteBar Nourishment1.0 mill m3sand
Fig. 1Fig. 2The test site is placed 5 km south of Hvide Sande Port in a lee side erosion area.The Coastal Authority has tried to disturb the project with an unplanned Barnourishment at 1,0 mill. m3sand, but the sand is still lying in the area, where thesand was placed. There is a well known competition situation between SIC andKDI. 190.000 m3sand are placed off shore in ref. 1.The test area is spitted up in the following areas.Ref 3 PEM 1 Ref 2Station 0SouthReference area 1PEM Area 1Reference area 2PEM area 2Reference area 3PEM 1Ref 1Station 11.000North1.800 Meters4.700 Meters1.800 Meters900 Meters1.800 Meters
3Hvide Sande Port
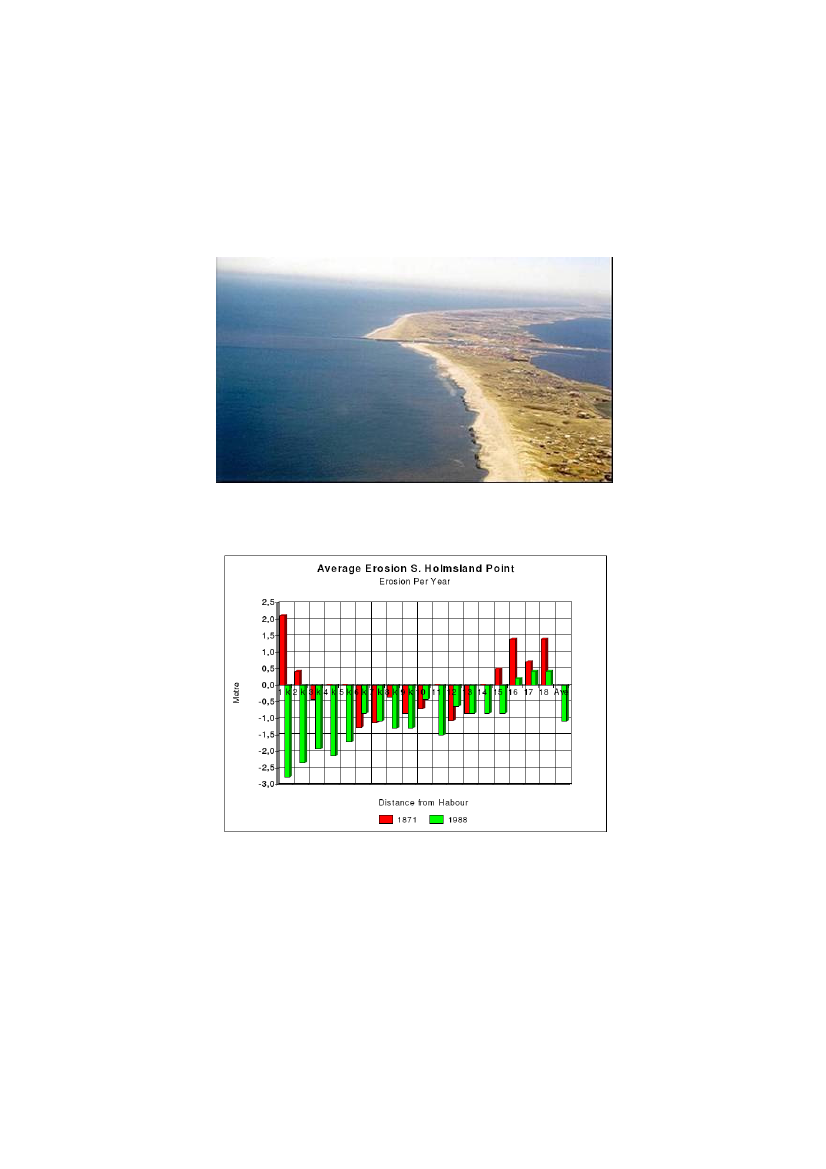
Fig. 3A groin of rocks is placed 450 meters out in the sea north of the channel intoHvide Sande Port.
Fig. 4As we see in fig. 4 the groin generates leeside erosion south of Hvide SandePort. The values are not true because the groin is first placed in 1962 and thelight grey shows the development from 1871 – 1988.The most interesting thing is we have accumulation 16 km south from the portover the last 200 years. This area is inside in reference area 3 in the project.
4Sea Level
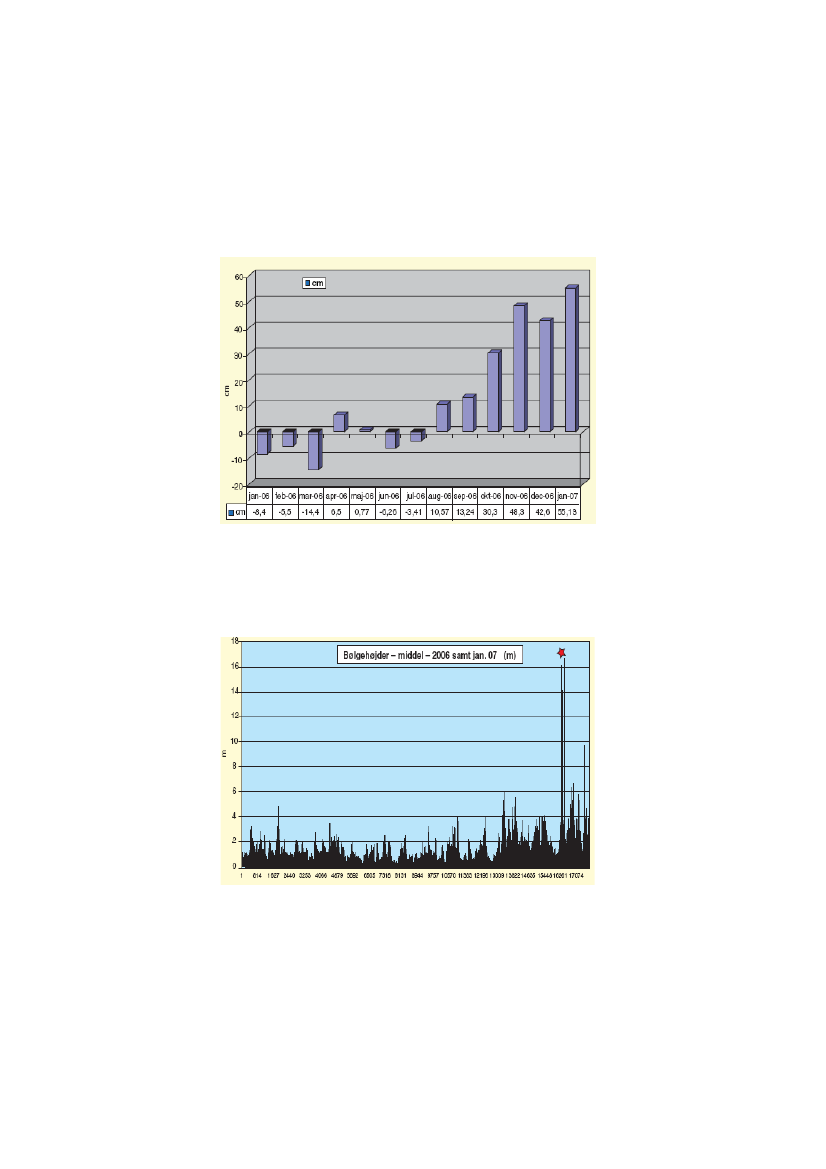
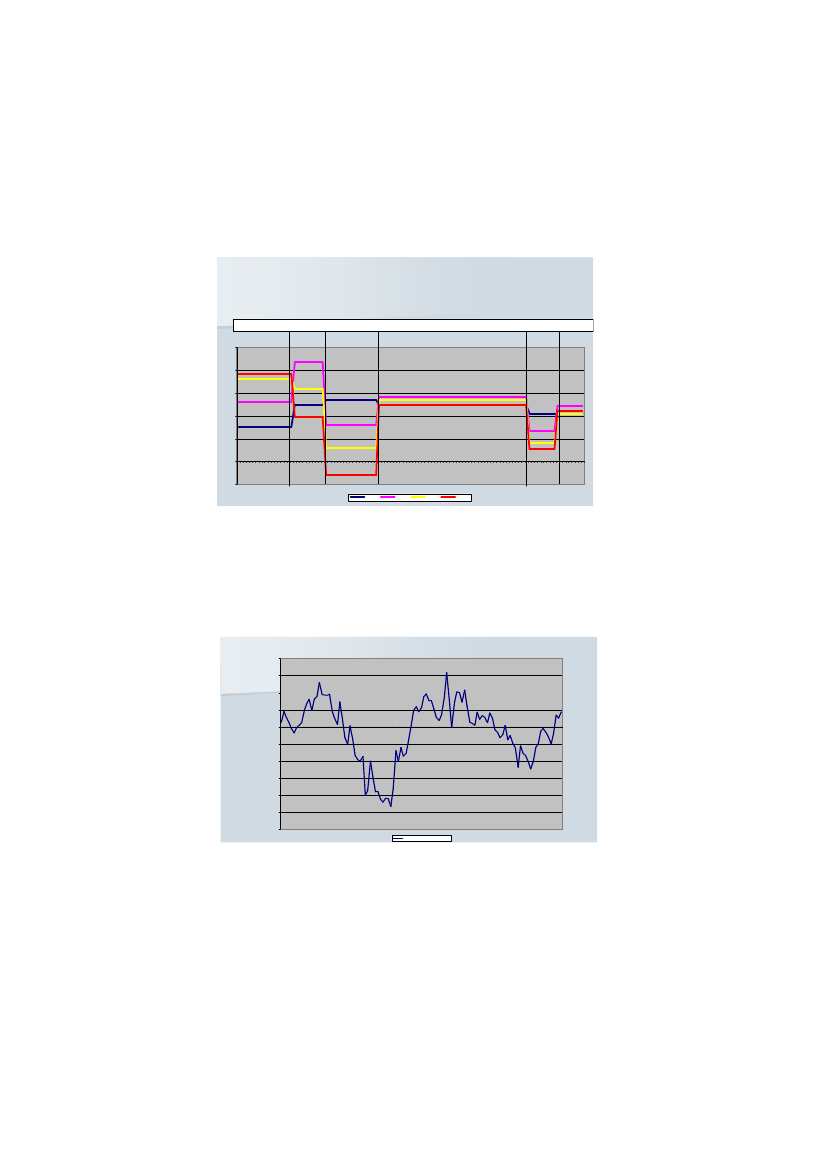
Fig. 5The sea level was very high at the Danish west coast in the winter time 2006/07The average sea level was 54 cm over DVR 90 in the period from 20 November2006 to 20 January 2007.Wave Height
Fig 6Fig 6 shows the wave height in 2006 and January 2007, where we have 5 heavystorms at the Danish west coast and 4 storms form 1. - 20. January 2007.
5Design/Installation
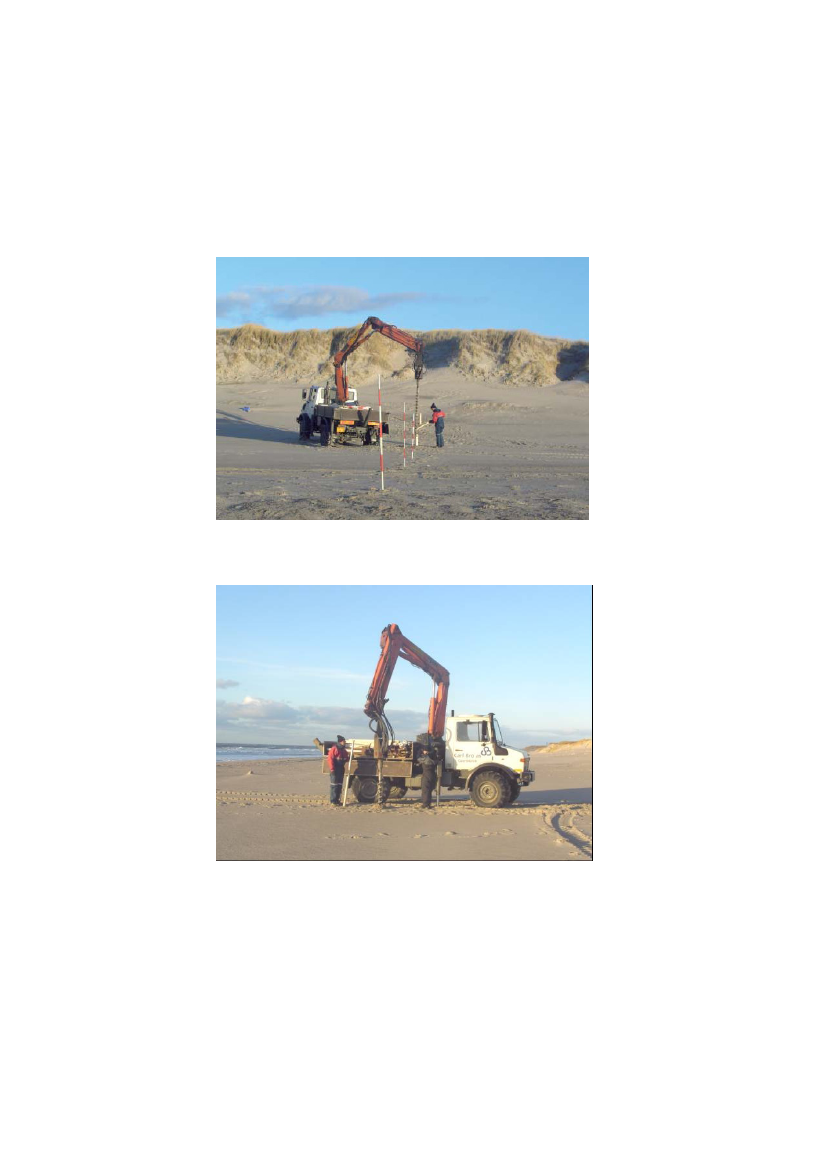
Fig. 7The PEM modules are placed in a matrix along the coast line, with a distance at100 meters between the rows and 10 meters in the cross.
Fig. 8The PEM modules are 175 cm long and are submerged 25 cm under the beachsurface and are normally not visible at the beach. There are max 11 PEM modu-les in each row, because we don’t like the beach wider than 100 meters.
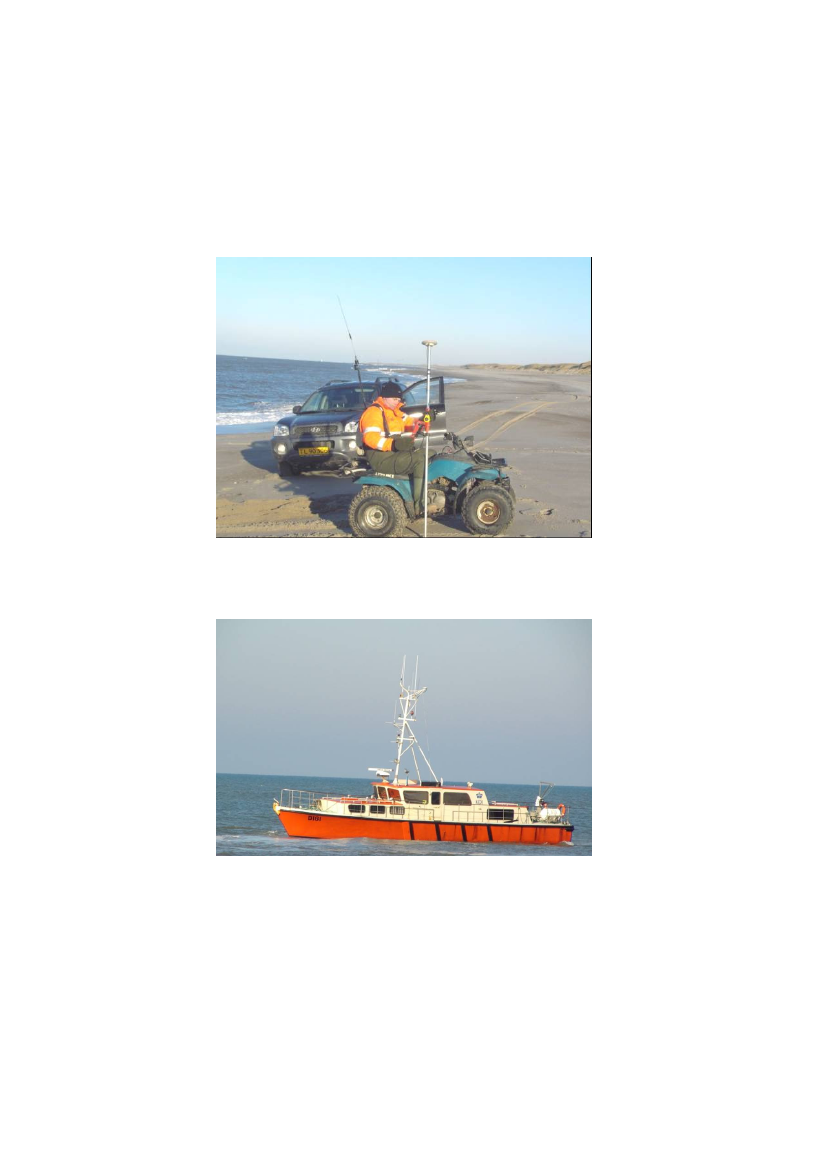
6Survey
Fig. 9The survey program is quarterly with 13 surveys over 3 years. There is 100meters between the survey lines at the beach and the tolerance is below 2 cm.The survey and data processing are done by Carl Bro A/S Denmark.
Fig 10In the first year the sea survey was quarterly and half yearly in year 2 and 3 inthe project period.The distance between the survey lines along the coast line is 200 meters and 600meters out in the sea.
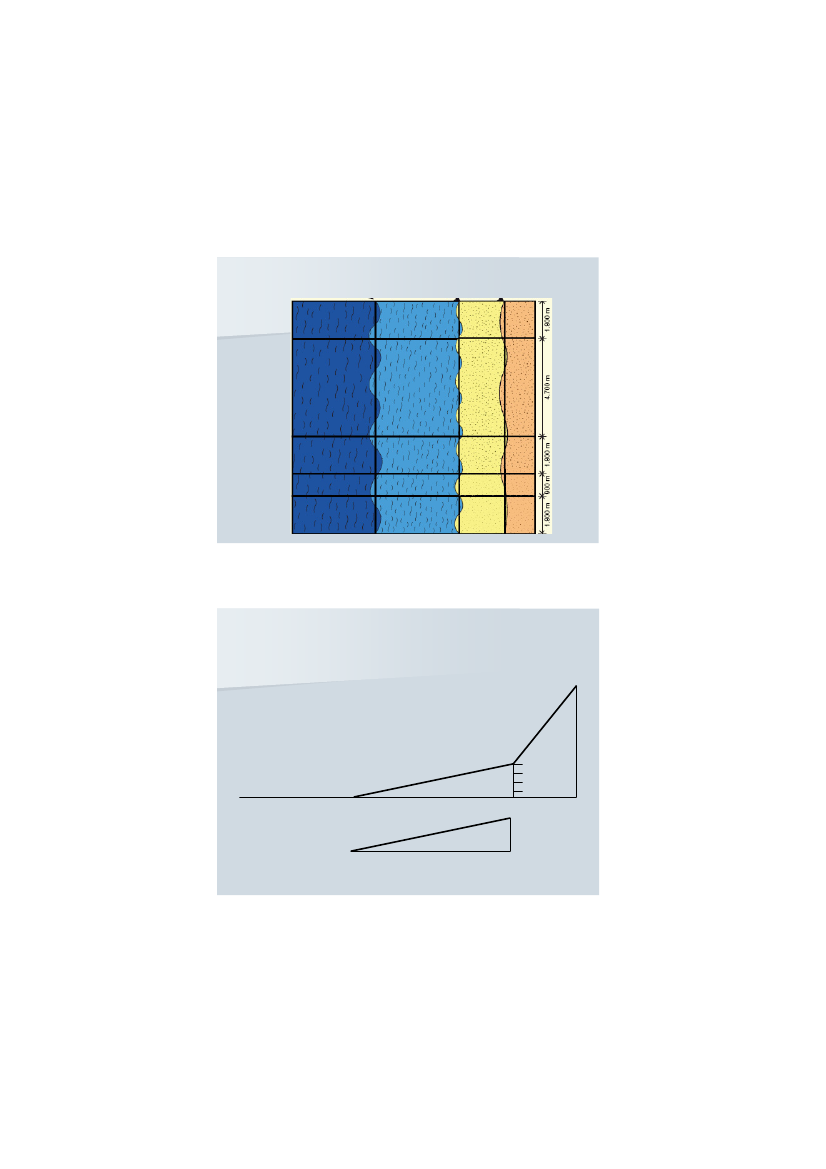
7EvaluationEvaluation MatrixOff Shore 2Off Shore 1BeachDune
Fig 11The evaluation is based at the dunes, average beach level (ABL) 100 meterswide from the dune foot (Fig. 12), and offshore 1 and 2 both 300 meters wide.
Average Beach Level
DuneLevel 4,0 m
Level 4,0 m
100 metre
Fig 12The ABL calculations are locked to the dune foot level + 4 m January 2005.
8Analysis – ABLAverage Beach Level jan 05 - 06
2,5
2
1,5
1
0,5
0jan-05jan-06
Ref 30,751,31
Pem 21,252,17jan-05
Ref. 21,350,81jan-06
Pem 11,231,41
Ref 11,060,95
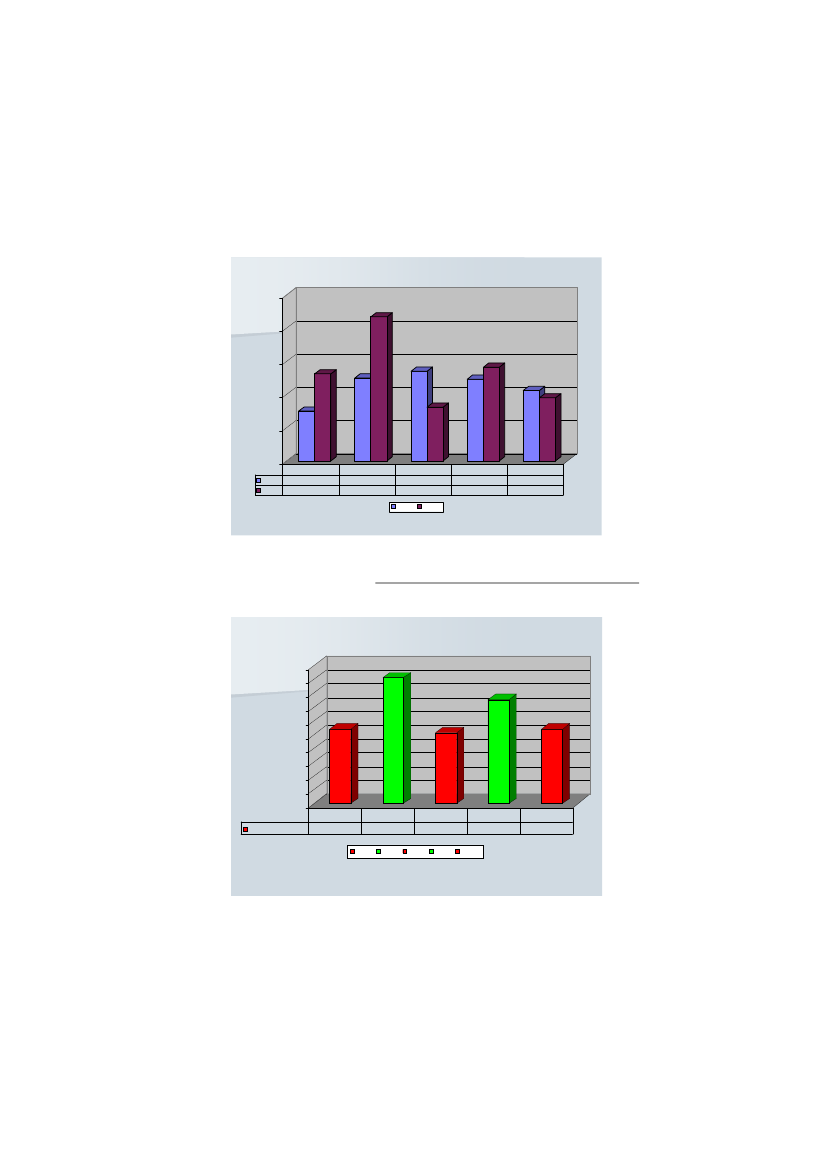
Fig. 13Fig. 13 shows the average beach level by the project start January 2005 andJanuary 2006 after the first year. Ref. 2 was the strongest area with ABL 1,35 mat project start.After 6 Month’s
Average Beach Level
21,81,61,41,2Meter
10,80,60,40,20Ref 31,08Ref 3Rør 21,82Rør 2Ref 2Ref 21,03Rør 1Ref 1Rør 11,51Ref 11,08
Middelstrandhøjde
Fig. 14Already after the first 6 month the results of the vertical drains was significant inrelation to the reference areas.
9Result ABL - 3 years
Result 2005 – 2008.Ref. 3PEM 2Ref. 2PEM 1Ref.1bRef.1a
2,5
2
1,5
1
0,5
014710131619222528313437404346495255586164677073767982858891949710101010
-0,5
jan-05
jan-06
jan- 07
jan- 08
Fig 15We see in fig. 15, there is a very significant and clear result after 3 years. Theaverage beach level in PEM 1 is 157 cm higher in relation to ref. 2. The averagebeach level in PEM 2 is 137 cm higher in relation to ref 2.We register during the first year that ref. 1 was disturbed with Bar Nourishmentdone of the Coastal Authorities in Denmark.(KDI)Dune foot developmentDune Foot Development Jan 2005/0820,0
15,0
10,0
5,0
0,01M tree s5913172125293337414549535761656973778185899397101 105 109
-5,0
-10,0
-15,0
-20,0
-25,0
-30,0Dune Foot level + 4,0 m.
Fig. 16We see in fig. 16 the dune foot move towards the shoreline in the drained areas,and big erosion in ref. 1 b and ref 2. Ref 3 is an accumulation area over the last200 years as we saw in Fig. 4. The average erosion in the dune foot in referencearea 2 is 15,7 meters over 3 years. We think we would have seen the samesituation in ref. 1, if this area not was disturbed with bar nourishment from KDI.
10Analysis.Dune Foot Development5
0
-5
-10
-15
-20Serie1
Ref 34,6
PEM 22,8Ref 3
Ref 2-15,7PEM 2Ref 2PEM 1
PEM 12,2Ref 1bRef 1a
Ref 1b-8,6
Ref 1a-0,3
Fig. 17After 3 years we see in fig 17 the dune foot moves towards the shoreline in thedrained areas and ref. 3, where we have leeside accumulation. In contrast wehave big sea erosion in ref 2 and 1 b.Dune development 24/05 -05 til 27/03-076040200Ref 1PEM 1Ref 2PEM 2Ref 3
Serie1 30,1333 42,2734 0,51167 46,7144 31,8872Ref 1PEM 1Ref 2PEM 2Ref 3
Fig. 18We have a laser scan survey with airplane, as cover the area from the dune footlevel 4 and 300 meters inside in the hinterland over 22 month.The result is very significant. The sand drift to the hinterland is 50 % higherfrom the drained areas in relation to ref. 1 and 3.There is no accumulation in ref. 2, because we have big sea erosion in the dunefront with a negative ABL at – 29 cm at the beach.
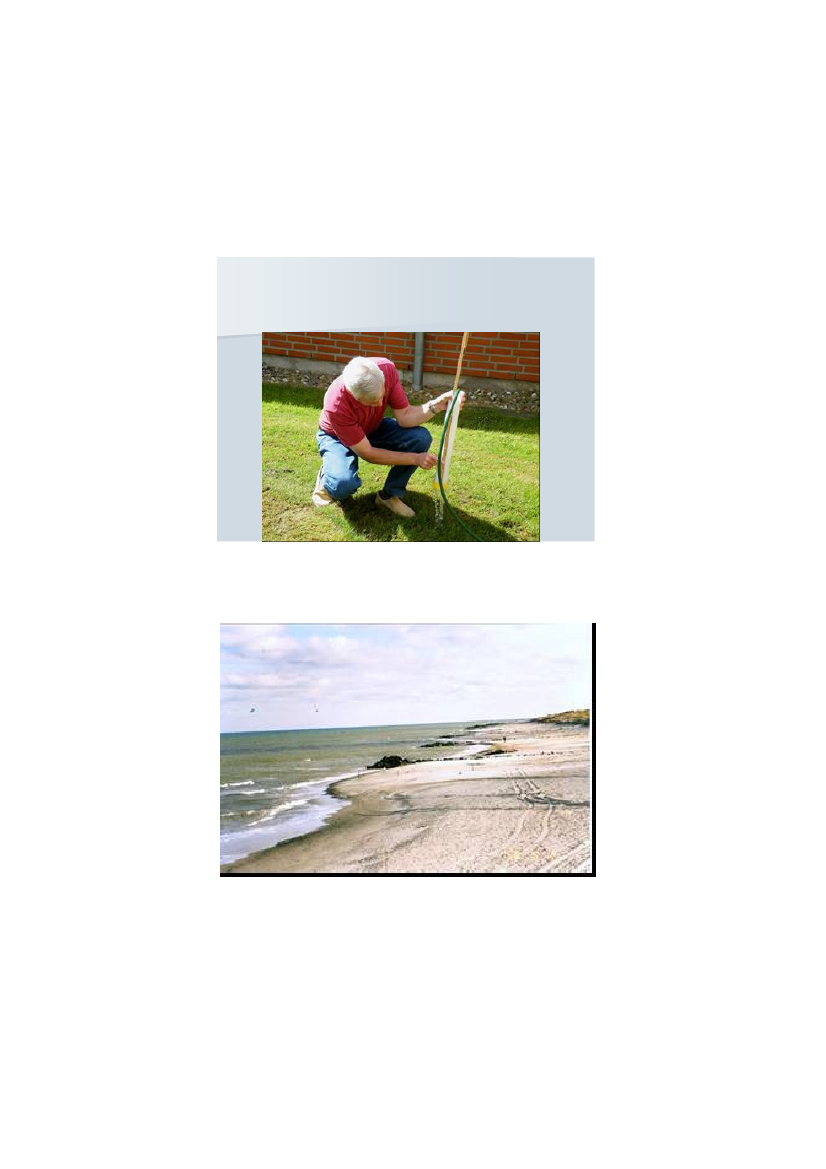
11Drain Capacity.
The main filter has a drain capacity at 150 l per minute equal toto9000 l per hour10 filters has a drain capacity at 90.000 l per hourOver 6 hours the dain capacity is 540.000 litre
Fig. 19The drain capacity at the main filter is tested by water flow with tap water. Thetest shows the main filter has a drain capacity at 150 l per minute.
Fig 20One row with vertical drain tubes Fig. 20 generates here a sand groin by OldSkagen in 1999.
12
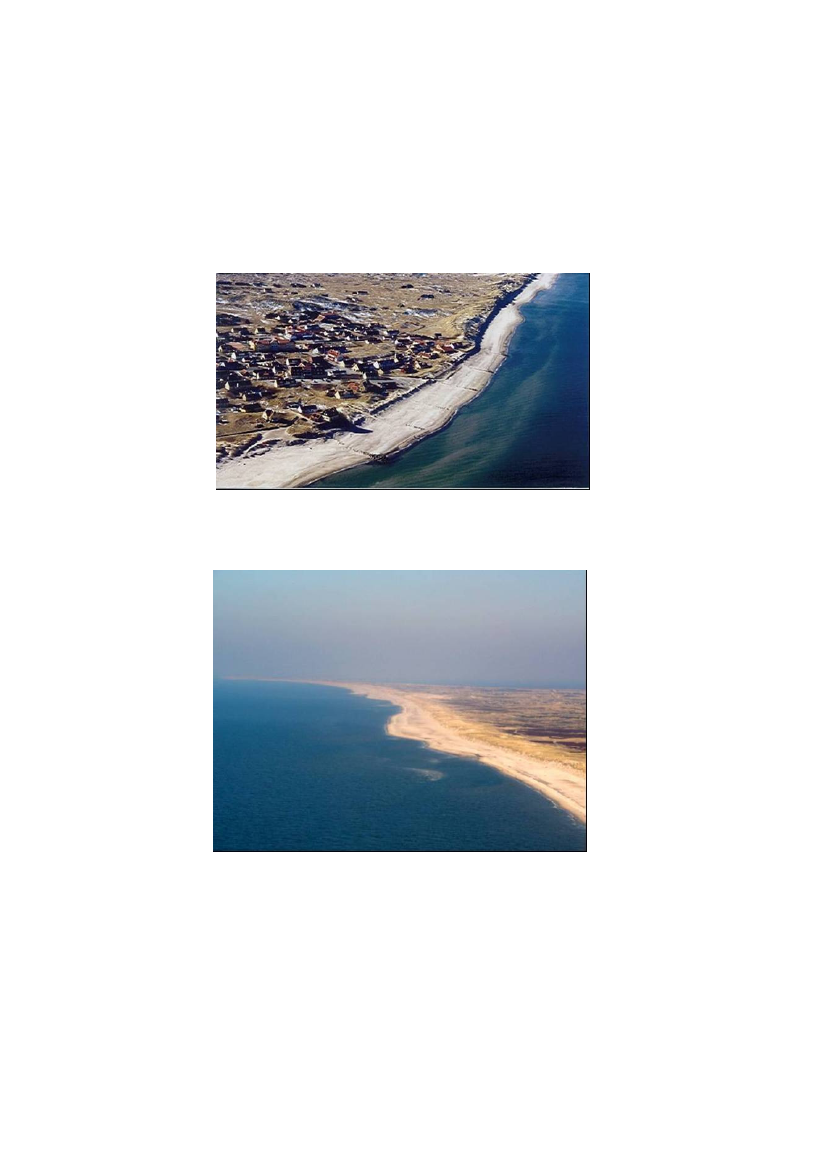
Effect of the Drain tubes
Fig. 21Fig 21 is an Arial photo from year 2000 from old Skagen with drain tubesbetween the groins. We see clearly the sand groins between the old groins ofstones as lay inside at the beach.
Fig. 22In fig. 22 we see the effect of the drain tubes by Skodbjerge in the PEM area 2after 6 month in July 2005.
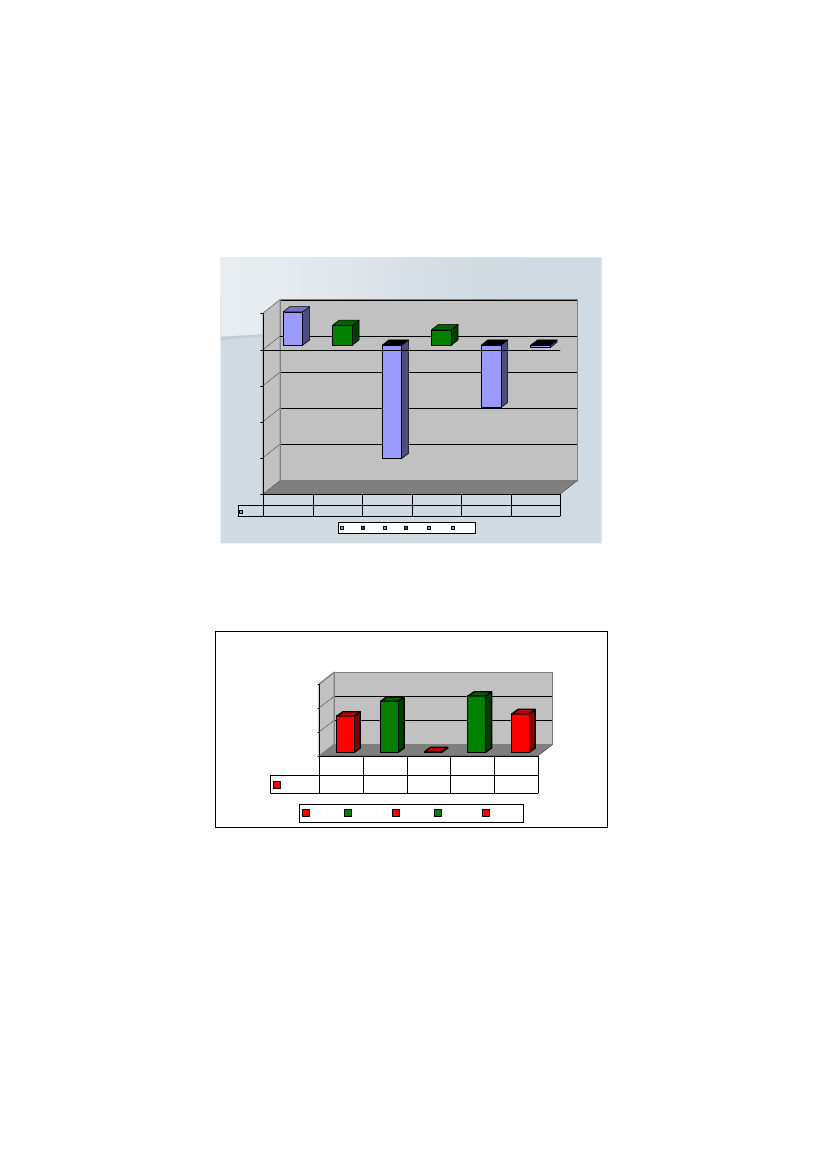
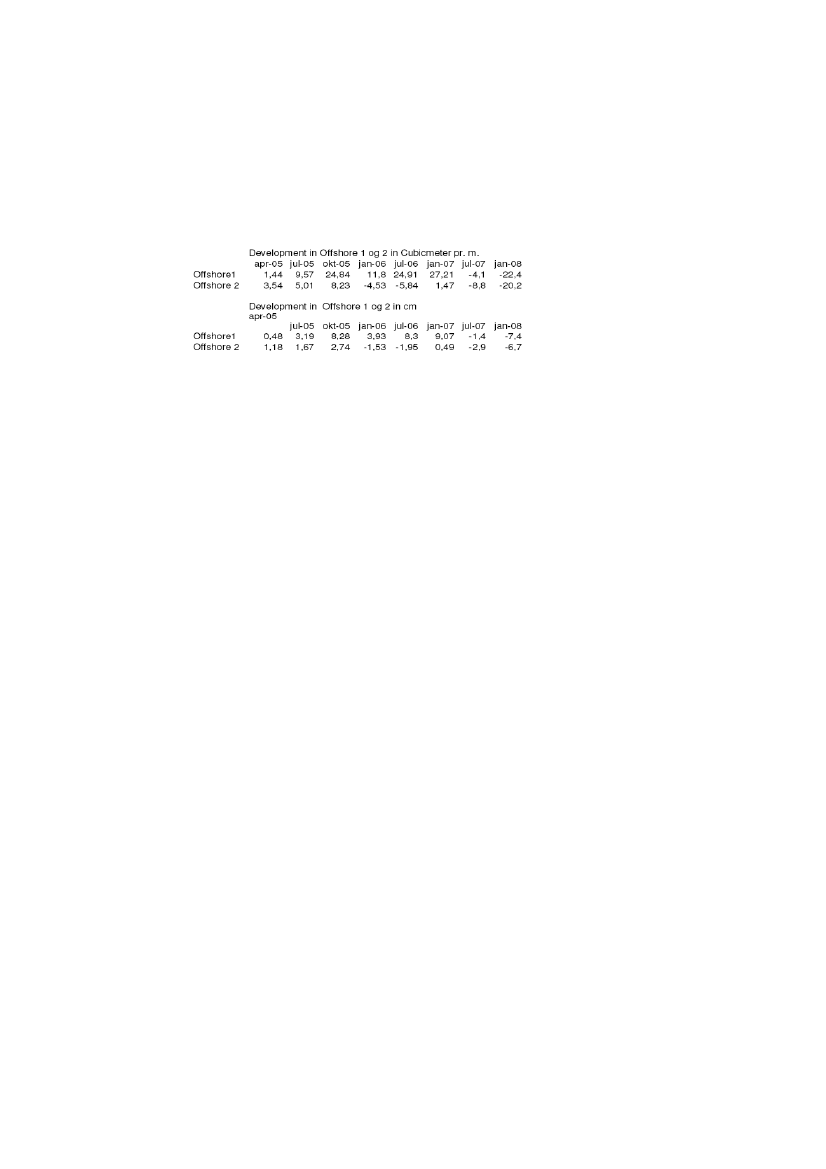
13Offshore development
Detailed analysis shows a negative effect, at the southern end of the barnourishment in off shore 1 and 2. where the erosion in the sea bed is more than300 cubic meters pr meter in ref 1 b off shore.SIC has complained about bar nourishment inside the project to the Ministry ofTransport who pay the project, but we made a mistake. We should havecomplained to the board for Scientific Dishonesty under the Ministry ofScientific.Conclusion1. The average beach level is significant higher in the drained areas in relationto ref. 1 and 2. The Beach in ref 1 b and ref 2 is eroded away over 3 years.2. There is no leeside erosion, but leeside accumulation in ref. 3.3. The dune foot move towards the shoreline in the drained areas and ref 3with leeside accumulation4. The Dune accumulation is 50 % higher in the drained areas in relation to ref1 and 3.5. The Sand comes from the long shore sediment transport at the coastline.6. Vertical beach draining is a coastal protection solution in relation to theglobal sea level rise, because it raises the average beach level in front of thedunes.REFERENCES
Jakobsen P. Pressure Equalisation Modules For Environmentally FriendlyCoastal Protection,Yamba 2000 Australia.Brøgger C. and Jakobsen P. Evaluation of the function of vertical drains,Conference ICS 2007 Gold Coast Australia.Jakobsen P. and Brøgger C. Coastal protection based on Pressure EqualizationModules (PEM),Conference ICS 2007 Gold Coast Australia.Brøgger C and Jakobsen P. Beach nourishment combined with SIC VerticalDrain System in Malaysia,Conference ICCE 2008 Hamburg.Li L. and Barry D.A. Groundwater effects on Sediment transport: A modelingstudy of the mechanisms underlaying beachdewatering for erosion control,School of Civil and Environmental EngineeringThe University, Edingburgh.AcknowledgmentWe would like to thank the Board for Trafic, and Transport Minister FlemmingHansen as initiated this field test, and founded the project with 1,0 mill Euro.
14
KEYWORDS – ICCE 2008
Environmentally Friendly Coastal Protection Based on Vertical DrainsAuthors: Poul Jakobsen and Claus BrøggerAbstract number: 1159Key wordsShoreBeachCoastCoastalErosionSkagenSICPEMPressure equalization modulesBeach DrainEnvironmentally FriendlyBeach DewateringVertical Drain