Trafikudvalget 2009-10
TRU Alm.del Bilag 68
Offentligt
BEACH NOURISHMENT COMBINED WITH SIC VERTICALDRAIN IN MALAYSIA.Claus Brøgger1and Poul Jakobsen2The present paper presents measurements and results from a three year full scale PilotProject with the SIC vertical drains system combined with beach nourishment. The SICvertical drain system is used to prevent beach erosion by draining the beach and thusreducing water pressure in the beach. The site Teluk Chempedak a pocket bay on theEast Coast of Malaysia near the town of Kuantan. The beach is located in front of Hyatt-and Sheraton Hotel and has a total length of 1000 metres. The beach was nourished with177669 m3sand in June, July 2004. The sand was placed on the beach 1000 x 100metres close to an equilibrium profile. The beach was drained with the SIC vertical drainsystem prior to and after beach nourishment. After three years the beach is stable withonly a few percentages of sand loos. The Pilot Project ended July 2007.
1. Introduction
Teluk Cempedak on the East coast of Malaysia is one of the main touristattractions in the Pahang State. This beach has a narrow and rather steep near-shore profile. There are hotels, roads and private properties located along thebeachfront.The beach has a history of erosion. This erosion has resulted in thenarrowing of the beach area, which has affected adversely on the recreationaland tourist activities in this area.The average retreat rate is estimated to 0.8 m/year. If protective measuresare not taken, the beach eventually will be eroded, and the ocean waves approachthe land will endanger the properties and Infrastructure.Conventional methods of using hard structures to arrest erosion are notsuitable for this beach because these methods are costly and not environmentallyfriendly.It was decided by the government to implement a pilot project to rehabilitatethis beach by use of the SIC vertical drain system.The objective of this project was to bring the beach back to a state where itcan serve its purpose as a high standard tourist and recreational beach with goodsand quality.As part of the government requirements, MIKE 21 model was required todescribe the hydrodynamic conditions (current and waves) and the sedimenttransport for the beach at Teluk Cempedak, where the beach over the last 20-30years has been eroded with approximately 0.8 m/year.A detailed dynamical model was setup for the beach area describinghydrographical conditions. The model includes water level, current, waves and
12
SIC, Skagen Innovation Centre, Dr. Alexandrinesvej75, Skagen, DK-9990, DenmarkSIC, Skagen Innovation Centre, Dr. Alexandrinesvej75, Skagen, DK-9990, Denmark
1
2sediment transport. With use of this model the yearly average sediment transporthas been calculated, the new beach profile optimized and sand nourishmentneeded estimated.The model verification is based upon previous reports (Coastal EngineeringCentre in the Department of Irrigation and Drainage DID, Malaysia), where ithas been documented that shoreline erosion is approximately 0.8 m/year. Thisinformation comes from present and historical aerial photos. The amount ofmaintenance dredging in the navigation channel to Kuantan Port has been usedto confirm the overall sedimentation in the area.Teluk Cempedak beach is in a pocket bay located between two rockyheadlands. The shoreline is orientated 355� according to north, which exposesthe most of the beach for waves coming from the main direction of the northeastmonsoon period (055�). The length of the beach is approximately 1000 m with awidth above MHHW (Mean Higher High Water) of 0 – 20 m.2. Construction Activities
July 2003: The beach in front of the Hyatt and Sheraton Hotel is pre-drained with the SIC vertical drain system.May to July 2004: The beach is nourished with 177669 m3sand, see fig 2.August 2004: The beach is drained again with the vertical drain System.3. Drain filter set-up
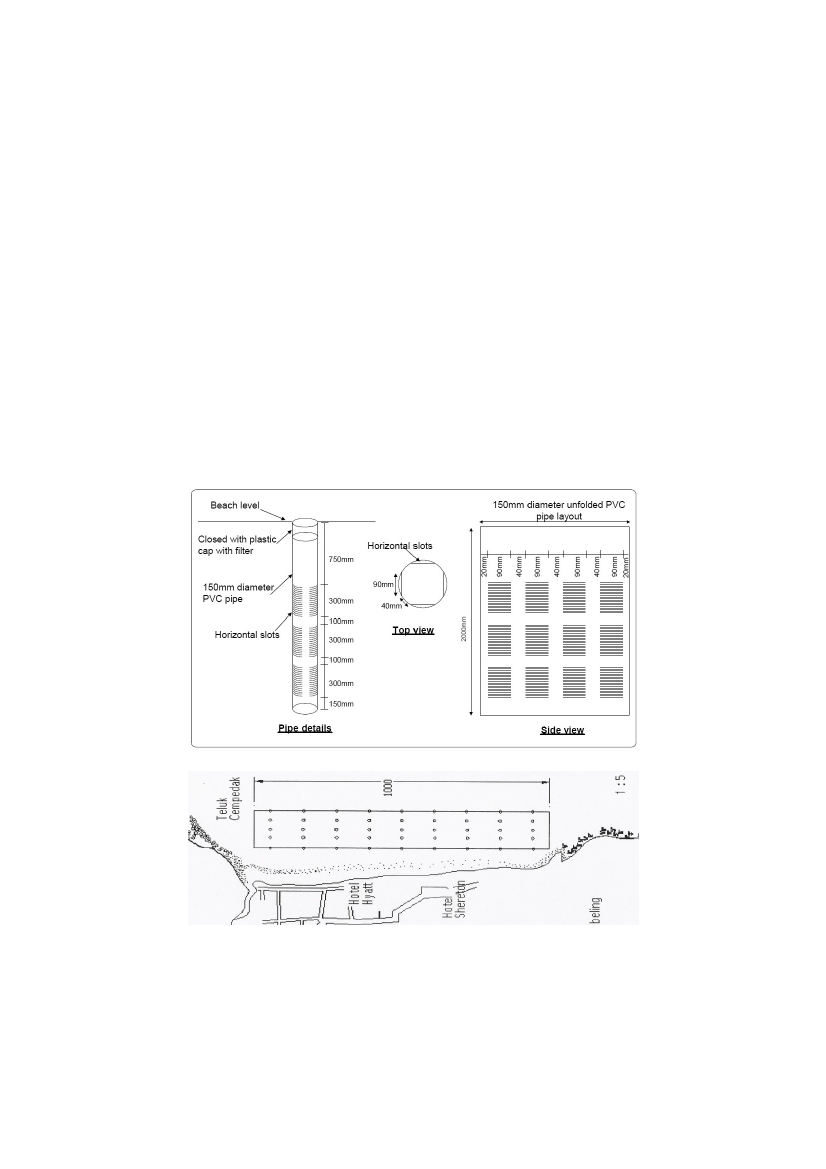
SIC vertical drain filters were placed in rows forming a matrix along thecoastline, see Fig. 1a . The drain system is designed in two sets as follows:1.The first set is the basic SIC vertical drain system used to drain the existingbeach and prepare for sand nourishment. Vertical 2m long drainpipes arelocated in a 100m x 10m matrix (9 columns and 5 rows) reaching from thesurface of the beach face to the groundwater table. Total number ofdrainpipes is 55. The effect of the basic installation is to initially increasethe drainage capacity of the active zone, and secondly transport silt awayfrom the beach thus accelerating further the drainage capacity.The second set is the off-set vertical drain system after sand nourishment.Vertical 2m long drainpipes are installed in a 100m x 10m matrix (9columns and 5 rows), however, shifted 20m in the alongshore direction.Total number of drainpipes in this project is 110.
2.
Each drainage pipe is made of PVC material, it has a length of 2.0 m and adiameter of 15 cm. see Fig. 1 .Each drainpipe is perforated with horizontal slots arranged in sectionsvertically along the length of the pipe. Each section is 30 cm long and consists ofhorizontal arc slots cut into the pipe 1 mm apart with a width of 0.2 mm. Firstsection of slots starts 75 cm below top of pipe.The top of the drainpipe is closed with a plastic cap with a filter hole.
3The top is covered with sand so they do not present obstacles to users of thebeach; the bottom of the drainpipe is closed with a plastic cap.The filters equalize the pressure of the ground water basin and an increasedcirculation of seawater in the coastal profile will take place. This will promotesedimentation of materials on the coastal profile.The vertical filters increase the drop of the water level in the coastal profilein the period from high tide to low tide. Thus, the beach will be more effectivelydrained of water. When the water level is low on the coast during the periodfrom low tide to high tide, the water circulation in the swash zone increases,which again increases the depositing of materials on the foreshore, therebybuilding up the beach from the sediments transported along the coast.Over time the new materials in the coastal profile become increasinglycoarse, due to a higher speed of the underlying water in the coastal profile. Theresult of deploying these vertical filters in a beach is a strong and wideequilibrium profile. (Brøgger and Jakobsen 2007).
Figure 1. Vertical 2m long drainpipes are located in a 100m x 10m matrix.
Figure 1a. SIC vertical drain pipe matrix on the beach, 9 columns and 5 rows
44. Nourishment Sand Area
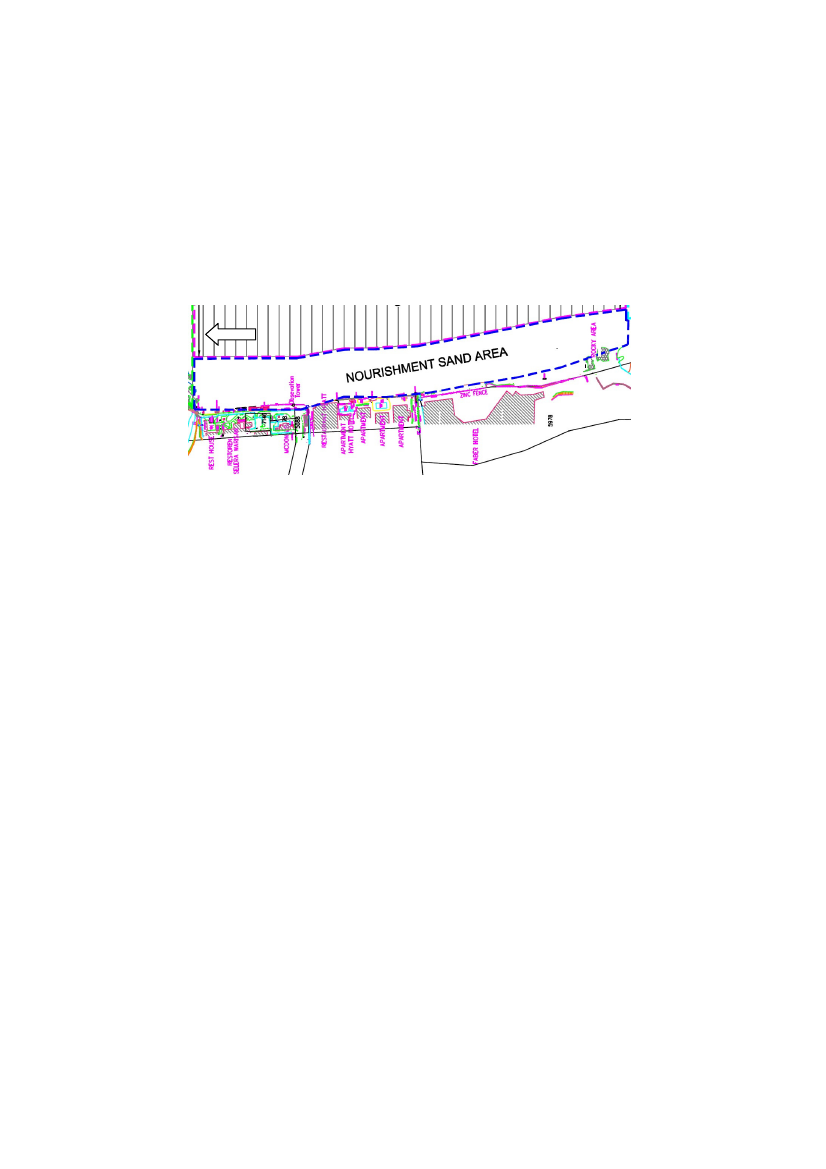
The beach is 1000 meters long, and the sand was placed from the concretewall and 100 meter out in the sea close to equilibrium profile, see figure 2.
Figure 2. Nourishment sand area 1000 m long and 100 m wide.
5. Sand Nourishment
The design of the sand nourishment (length, width and slope) starts with thedesign requirement of the SIC vertical drain system. The design of sandnourishment is mainly based on the following two manuals:1.2.Shore Protection Manual by Coastal engineering Research Center of USArmy Corps of Engineers, 1984.The Beach Nourishment Manual by the Delft Hydraulics, 1986.
The SIC vertical drain system requirement is that a minimum 30 m widebeach to be extended in front of the upper berm boundary above the mean highwater. Accordingly the drainpipes in the drain system shall also cover the rangefrom the mean higher high water (MHHW) till the mean lower low water(MLLW). The design requirement of the SIC vertical drain system requires thatthe sand nourishment should be pre-spread out in a profile close to theequilibrium. The designed profile should also cover the range from MHHW toMLLW instead of the conventional method of placing sand on bulk above themean high tide and allow the waves and tides to takes their course in shaping theequilibrium profile. The nourished sand was consequently placed from theconcrete wall on the beach and 100 meter seaward.Sand volume
The volume computed from the results of the Interim (Pre-Construction)topographic and bathymetric survey (surveyed on 06/03/2004 to 13/03/2004)and the designed sand nourishment level utilising the Terramodel version 9.8.,was 167488 Cubic metres.Actual nourished sand = 177669 Cubic metres.
5Sand grain size
The sand on the beach, before sand nourishment, had a grain size between0.3 – 0.5 mm (the finest sand in the northern part of the beach).The nourishment sand grain size is approximately 0.5 mm.Beach slope
The average beach slope before nourishment was 1 in 60, the designed slopewas 1 in 45 (equilibrium profile).6.0 WeatherWind
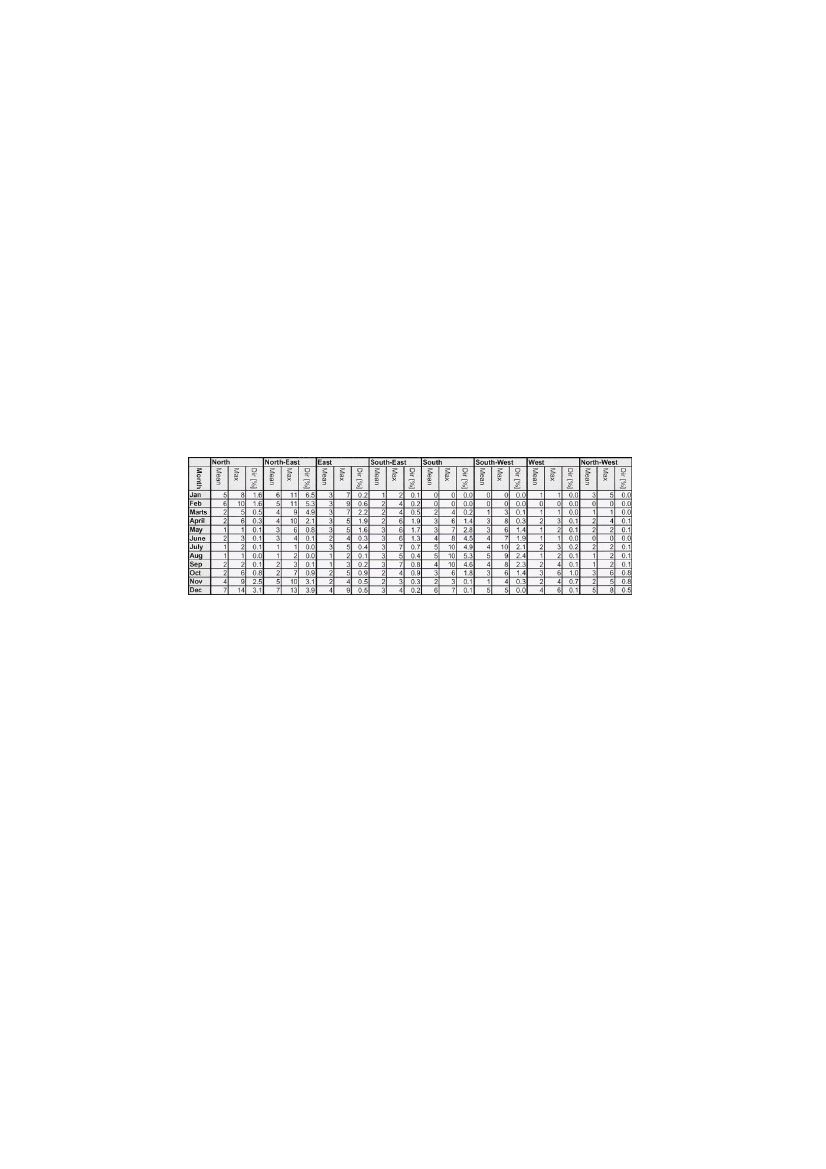
In the two monsoon periods the dominating wind directions are N/NE in theNE monsoon. December is the month with the highest wind speed and thelongest period with wind speed higher than 8 m/s, max 10-14 m/s, see table 1.
Table 1. Offshore wind in knots east coast of Malaysia 1991-08-01 to 1992-07-31,1998and 1999
Rainfall
The rainfall in Kuantan is approx. 2.5 metre yearly. The rainfall can be up to1.11 metre over a 5 day period in the monsoon time.7.0 Hydrodynamic data (historical)Current
Near shore current in the pocket bay in the monsoon time directs thesediment transport direction in the bay from north to south.In the inter-monsoon time the sediment transport direction in the bay is fromsouth to north.Sediment
There is no sediment input from the sea into the pocket bay.
6Tidal
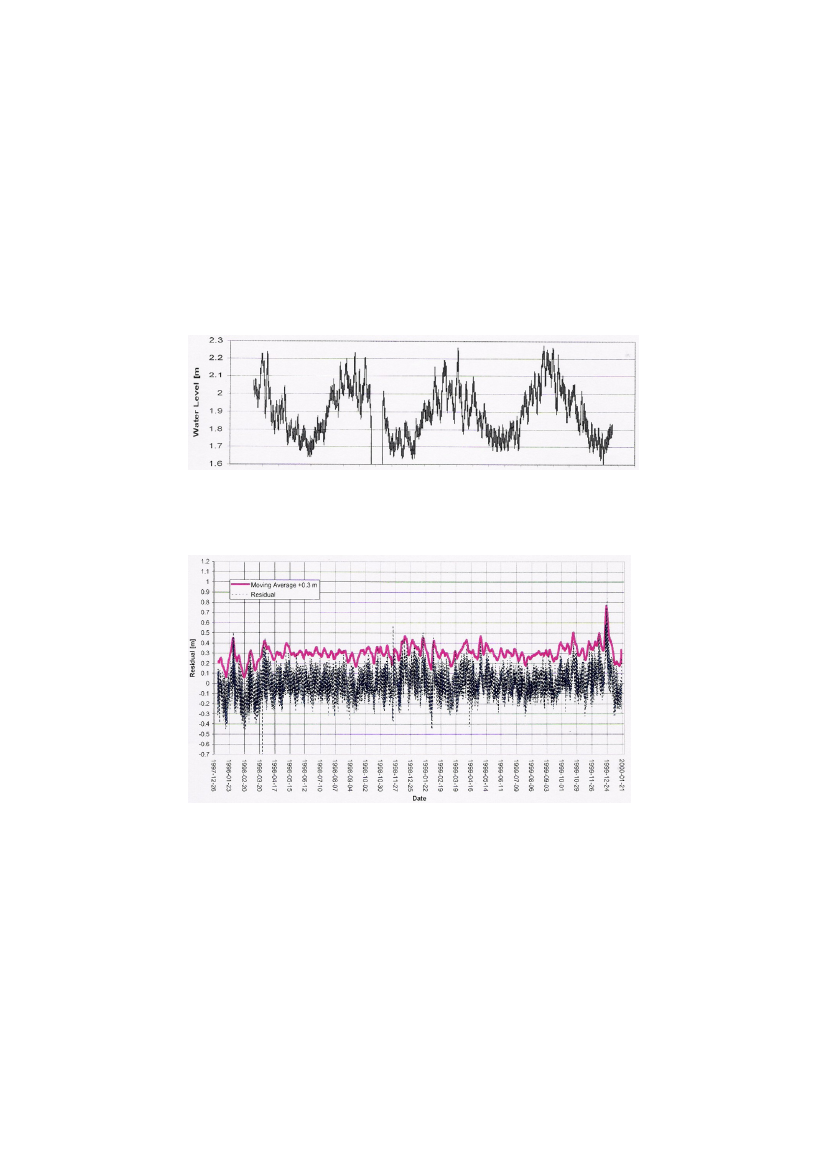
Tidal data is from the nearby Kuantan Port. Analyzing data from period1996-01-01 to 2000-08-31 indicates that there is a strong seasonal change in themean water level with a difference between the NE and SW monsoon atapproximately 0.4 m with the highest level in the NE monsoon (Nov-Feb) due tothe metrological conditions, see figure 3.
Figure 3. Tides at Kuantan Port over 4 years (X-axis), peaks are NE monsoon (Nov-Feb)
Difference between measured and predicted tide indicates that the NEmonsoon period is much more turbulent, see Figure 4.
Figure 4. Difference between measured and predicted tide (residual). (Kuantan Port)
Waves
Waves are not a strong factor. As for the wind data the dominating wavedirection is 055� (NE monsoon), the yearly average wave height isapproximately 0.20 m, but during the NE monsoon the average wave height is0.75 m.
7Near shore current in the pocket bay during the monsoon time, directs thesediment transport in direction from north to south.In the inter-monsoon time the sediment transport direction in the bay is fromsouth to north.8.0 Evaluation
1.
2.3.4.
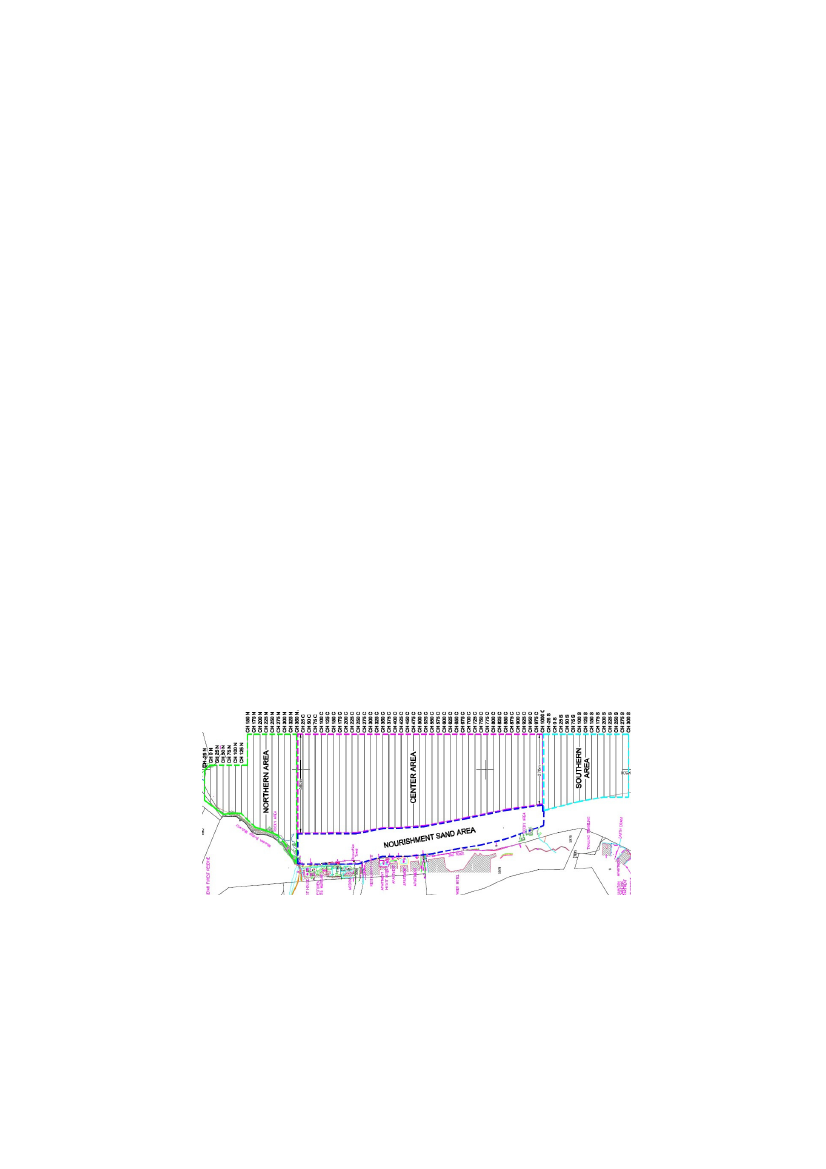
The evaluation of the project is based on data from four areas, see figure 5:Nourishment sand area from the concrete wall on the beach and 70 m outtowards the sea. The evaluation is based on the average beach level (ABL)from the concrete wall in front of the hotels and 70 metres towards theshoreline and out into the sea.Northern area, offshore.Center area, offshore.Southern area, offshore.
All areas are evaluated for every 25 m as shown in figure 5.Bathymetric survey was done by DFS3200 Dual Frequency echo sounder(operated on single frequency mode).D-GPS reference station was established for navigation and positioningduring the bathymetric survey utilizing Trimble 4000 RS Receiver.Topographic and bathymetric profiling of the foreshore area was performedover a length of the shoreline of 1000 meters. The shoreline profiles were spacedat 25 meters interval and 10 meter interval along the profile. The landward limitof the shoreline profiles were 100 meters beyond the high water mark. Theseaward limit was 1000 meters seawards of the high water mark.Land survey system used was Geodimeter Electronic Total Survey Station.The survey and data processing are done by licensed surveyor: JurukurPerunding, Bandar Baru Seri Petaling, KL Malaysia.
Figure 5. Evaluation areas.
8Evaluation schedule
The project area was evaluated first time on March 2003, this was a pre-project evaluation.Further evaluation:March 2004,July 2004,October 2004,March 2005,July 2005,October2005,March 2006,July 2006,Oktober 2006,March 2007,July 2007. (July 03 thebeach was pre-drained with SIC vertical drain, May-July 04 the beach wasnourished with 177669 m3 sand, August 04 the beach was drained again withSIC vertical drain).Offshore North
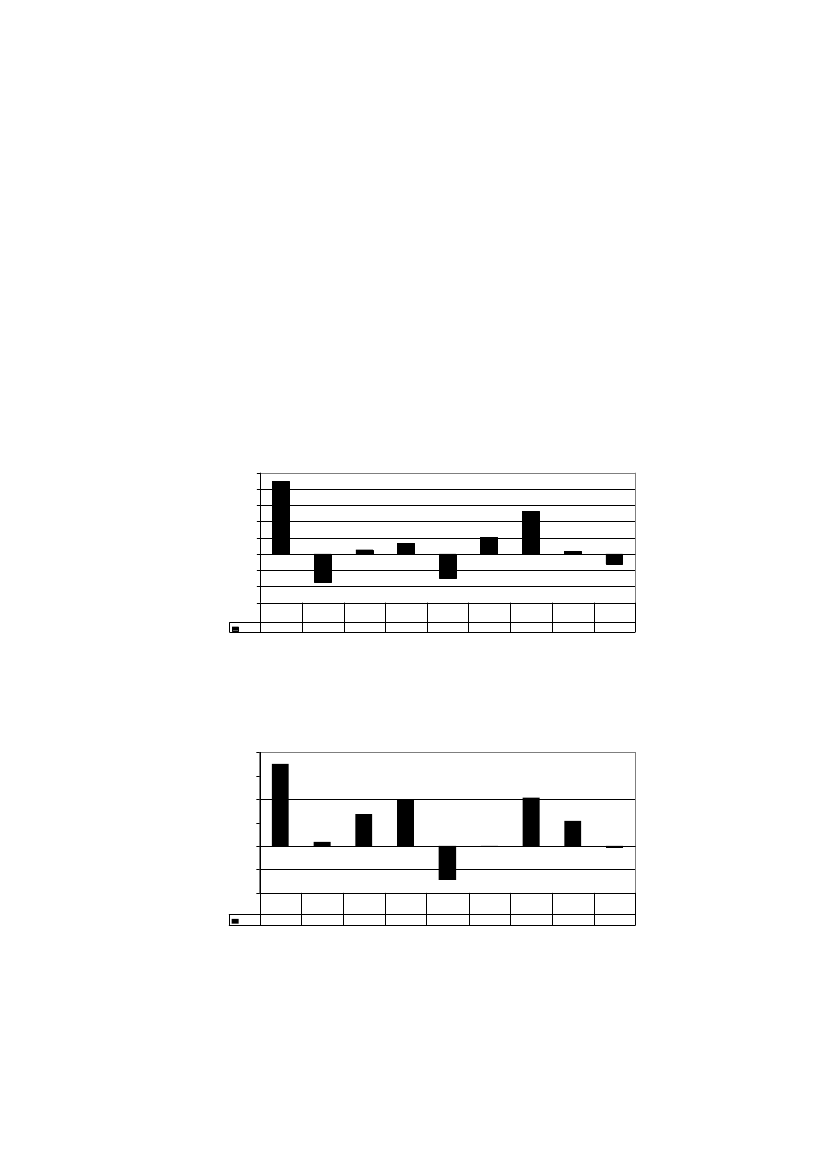
Figure 6 data shows that after sand nourishment, 44835 m3 sand havemoved into the offshore north area, and after the stabilizing period we register anormal fluctuation pattern.500004000030000q b mtru ic e e20000100000-10000-20000-30000Oct200444835March2005-17224july20052633Oct20056471March2006-14805July200610308Oct200626177March20071777July2007-6141
M3
Figure 6. Offshore North development CH -25N to CH 350N
Offshore Center area outside nourished area
Figure 7 shows that, just after sand nourishment, data indicate that 70167m3 sand have moved into the center area outside the nourished area, after thestabilizing period we register a normal fluctuation, see figure 7.800006000040000200000-20000-40000
q b m treu ic e
oct200470167
march20053556
july200527201
oct200539428
march2006-28757
july2006306
oct200641382
march200721277
july2007-1596
M3
Figure 7. Offshore center development outside nourished area.
9Offshore South
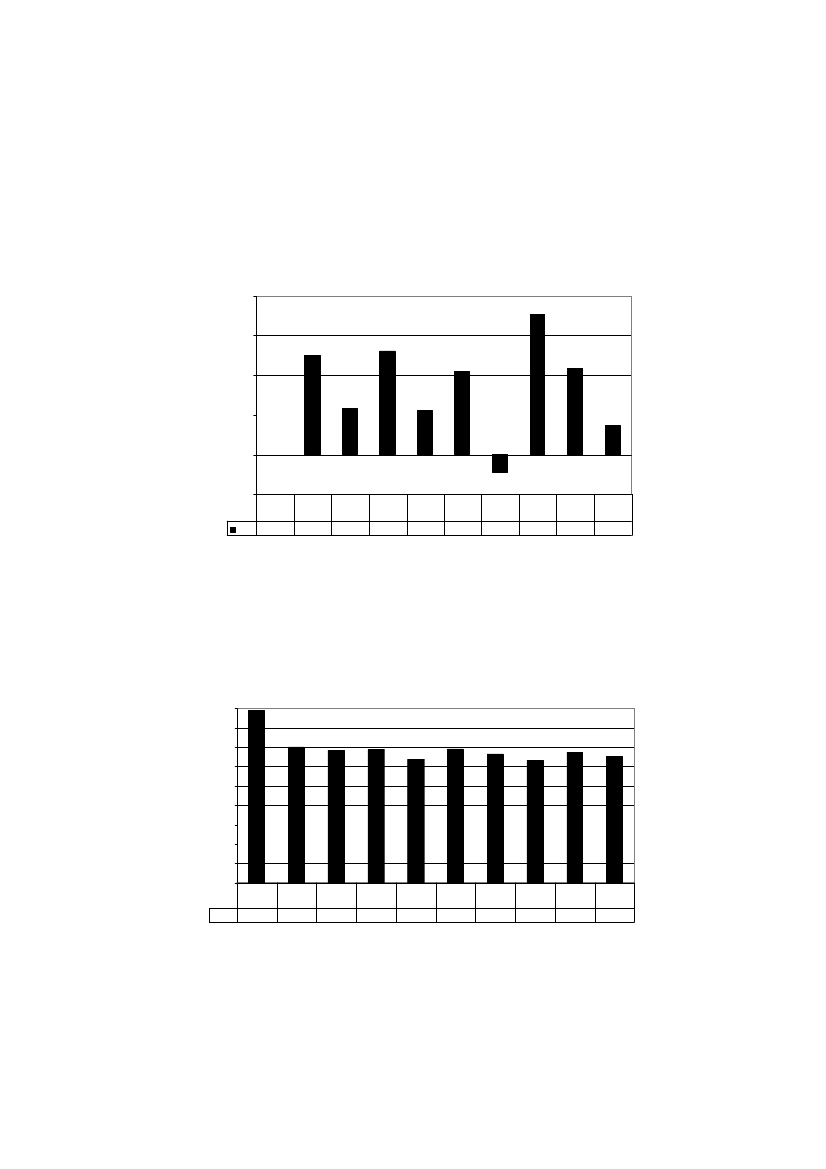
Figure 8 shows that, just after sand nourishment, the sand volume isfluctuating between 5000 and 13000 m3, which indicates a stable situation.20000
15000
Qubic meter
10000
5000
0
-5000
July20040
Oct200412542
March20055873
july200513097
Oct20055632
March200610463
July2006-2182
Oct200617738
March200710876
July20073655
M3
Figure 8. Offshore South development CH -25S to CH 300S.
Nourished area volume development
Figure 9 indicates that, after stabilizing and packing, the nourished sand hasfound a stable condition as a product of the SIC vertical drain system.180000160000140000120000Qubic m eter100000800006000040000200000
July 2004 Oct 2004Serie1 177669140101
March2005136896
july 2005 Oct 2005137263127139
March2006138149
July 2006 Oct 2006132834126476
March2007134755
July 2007130712
Figure 9. Nourished area volume development.
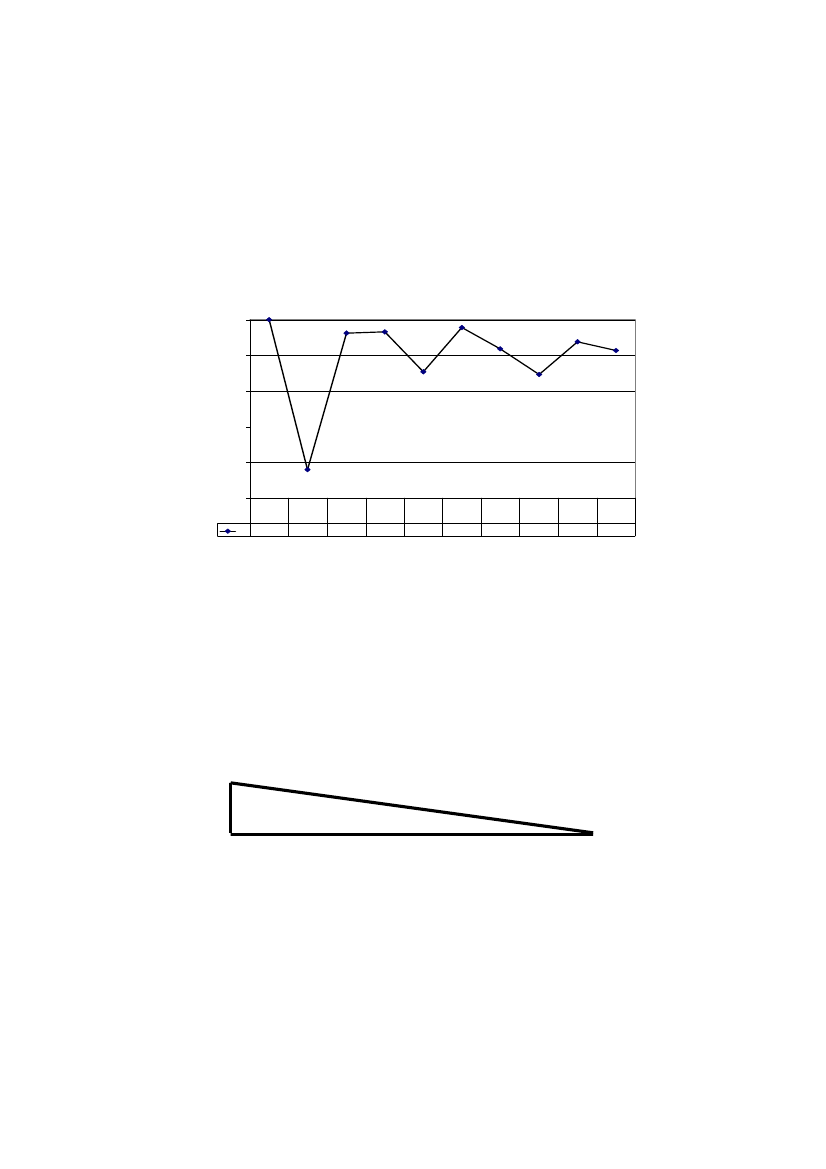
10Sand loss percentage
Figure 10 shows that, after the 21% loss in the stabilizing and packingperiod, the loss of nourished sand is only a few percent. It is also clearly seenthat the loss in the winter time (NE monsoon) is about 7%, while in the summertime the sand loss is less.0
-5percentage
-10
-15
-20
-25
July20040
Oct2004-21
March2005-1,9
july2005-1,7
Oct2005-7,3
March2006-1,1
July2006-4,1
Oct2006-7,7
March2007-3,1
July2007-4,3
%
Figure 10. Sand loss in percentage.
The Average Beach Level ( ABL )
ABL is a strong indicator of the beach resistance against erosion, (Jakobsenand Brøgger 2007). In figure 12 it is seen that the nourished sand, after thedrainage of the beach, has found its equilibrium profile and is stable. Again it isseen that the ABL is slightly lower in the winter time, but the beach is able toregain in the summer period.The design for a 70 meter wide beach at Teluk Cempedak is an ABL of 1.88meter and a volume of 131 m3/m. After 3 years in this project the ABL is 2.25m, and the average volume of sand in the profile is 156 m3/m .
ABL design
4m70mFigure 11. Average beach level calculation design, reference level is “official 0”.
112,50
2,00
1,50Meter1,000,500,00M
March 030,34
March 040,20
July 041,88
March 051,93
July 052,17
March 061,92
July 062,23
March 072,04
July 072,25
Figure 12. Average Beach Level (ABL) from concrete wall and 70 meter towards sea.
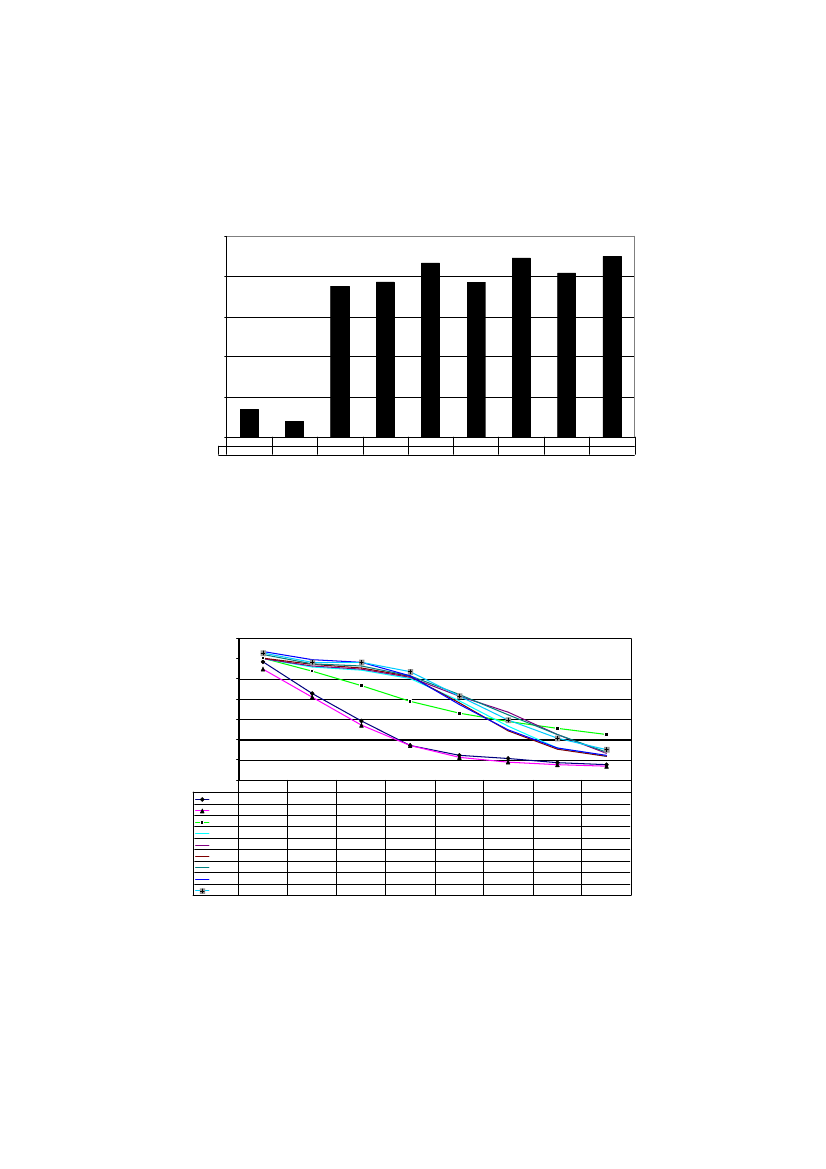
Average beach profile
Figure 12 shows the average profile in the sand nourishment area from theconcrete wall on the beach and 70 meter seawards. Before the beach wasnourished and drained, the beach was concave. After nourishment and drainage,the beach is convex. The beach stays convex after three years. Figure 12 alsoshows that beach width is stable around 60 meter, compared to the 27 meterbefore nourishment and the SIC vertical drain system.5,004,003,00Meter2,001,000,00-1,00-2,00March 03March 04DesignMarch 05July 05March 06July 2006March 07July 07
0m3,833,54,033,9944,024,24,364,29
10 m2,292,113,393,603,643,713,733,963,81
20 m0,930,722,673,433,493,533,643,813,81
30 m-0,28-0,281,903,023,073,133,173,163,37
40 m-0,78-0,871,311,922,171,822,221,742,14
50 m-0,91-1,10,890,681,360,441,230,500,97
60 m-1,12-1,220,57-0,400,26-0,470,24-0,400,08
70 m-1,23-1,30,26-0,81-0,66-0,82-0,61-0,78-0,48
Figure 12. Average beach profile from concrete wall and 70 meter seawards.
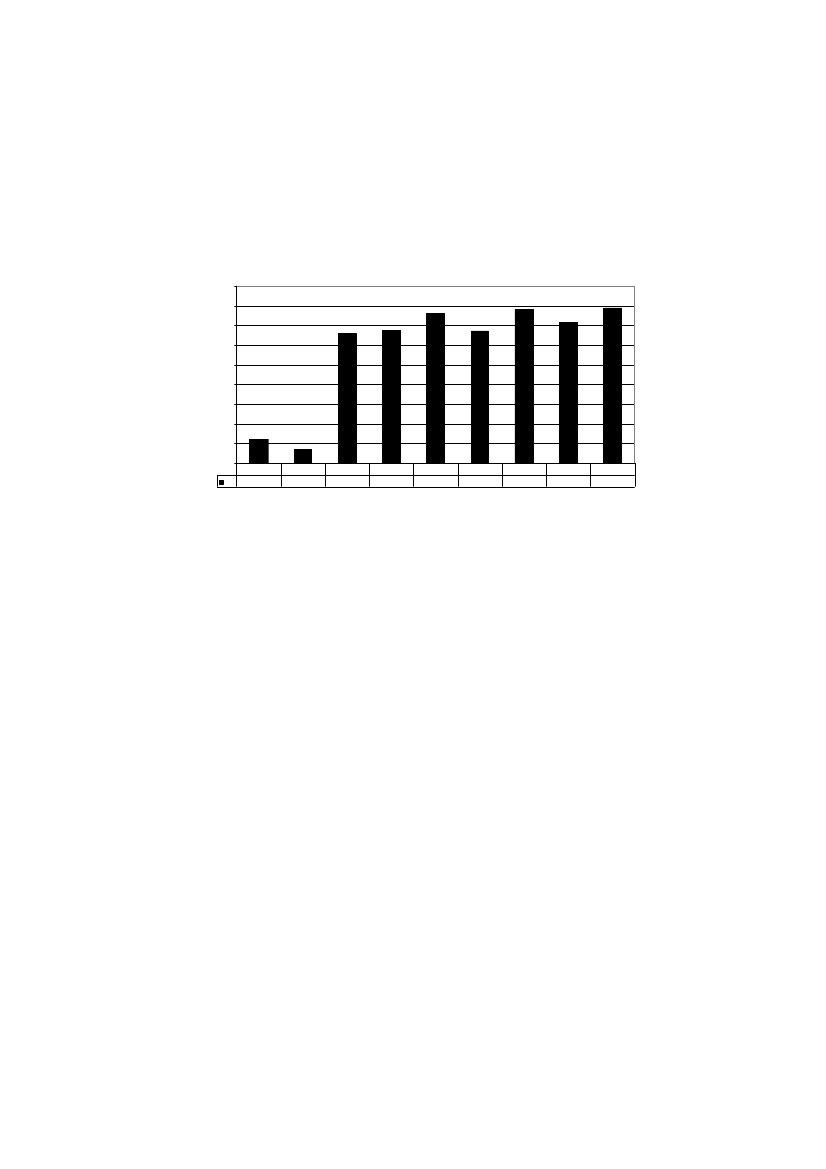
12Average beach volume development 70 meter
Fig 13 shows that the nourished sand on the beach (70 meter) has in threeyears increased 25900 m3, which is equal to 19,68%180000160000140000120000100000800006000040000200000M3
Meter
March 200323800
March 200414000
July 2004131600
March 2005135100
July 2005151900
March 2006134400
July 2006156100
March 2007142800
July 2007157500
Figure 13.Average beach volume development 70 meter
9,0 Summary
•
•
••
•••
The objective of this three year pilot project was to produce adocumentation of the efficiency of the SIC vertical drain system and thesystems capability to stop or reduce the erosion on a sand nourishment beachwith no natural sediment input. The nourished sand on this location normallyhas a lifetime from 3 to 5 years.Following a packing and stabilization period of 3-4 months during which thebeach reached an equilibrium profile, the beach at Teluk Cempedak hasremained stable, and the loss of sand offshore is after three years only a fewpercents.SIC is of the opinion that the project was over-nourished by some 30000 m3sand.The volume of the sand in the nourished area was, after three years, reducedby 46957 m3 some of which, 17.700 m3 (10 %), was reduced in the packingprocess and 29200 m3 had moved out in the offshore profile in the pocketbay in the process of creating a equilibrium profile. It must be noted that ofthe nourished 46957 m3 loss after three years, the 37568 was lost after 3month.Beach width is stable close to 60 meter after three years.The sand volume on the beach has gained 25900 m3 in three years.The SIC vertical drain system effectiveness has been proven anddocumented in this project.
13
REFERENCES
Brøgger C. and Jakobsen P. Evaluation of the function of Vertical drains,Conference ICS 2007 Gold Coast Australia.Jakobsen P. Pressure Equalisation Modules For Environmentally FriendlyCoastal Protection,Yamba 2000 Australia.Jakobsen P. and Brøgger C. Coastal protection based on Pressure EqualizationModules (PEM),Conference ICS 2007 Gold Coast Australia.Jakobsen P. and Brøgger C. Environmentally Friendly Coastal protectionBased on vertical drains,ConferenceICCE 2008 Hamburg Germany.
14KEYWORDS – ICCE 2008PAPER TITLE :BEACH NOURISHMENT COMBINED WITH SICVERTICAL DRAIN IN MALAYSIA.Authors : Claus Brøgger and Poul JakobsenAbstract number : 1164shore,beach,coast,coastal,erosion,skagen,SIC,vertical drain,swashzone,Equilibrium Profile,sand,environmentally friendly,PEM,pressureequalization module,