Trafikudvalget 2009-10
TRU Alm.del Bilag 313
Offentligt
Infrastructure to 2030 :The Global Context forDenmarkCopenhagen12 April 2010Barrie StevensDeputy DirectorAdvisory Unit to the Secretary-GeneralOECD
Plan of the presentation• World economic outlook (the big picture)• Future freight and passenger flows• Opportunities• Infrastructure’s contribution• Denmark’s infrastructure in relation to theglobal outlook• Challenges to 2030 and beyond
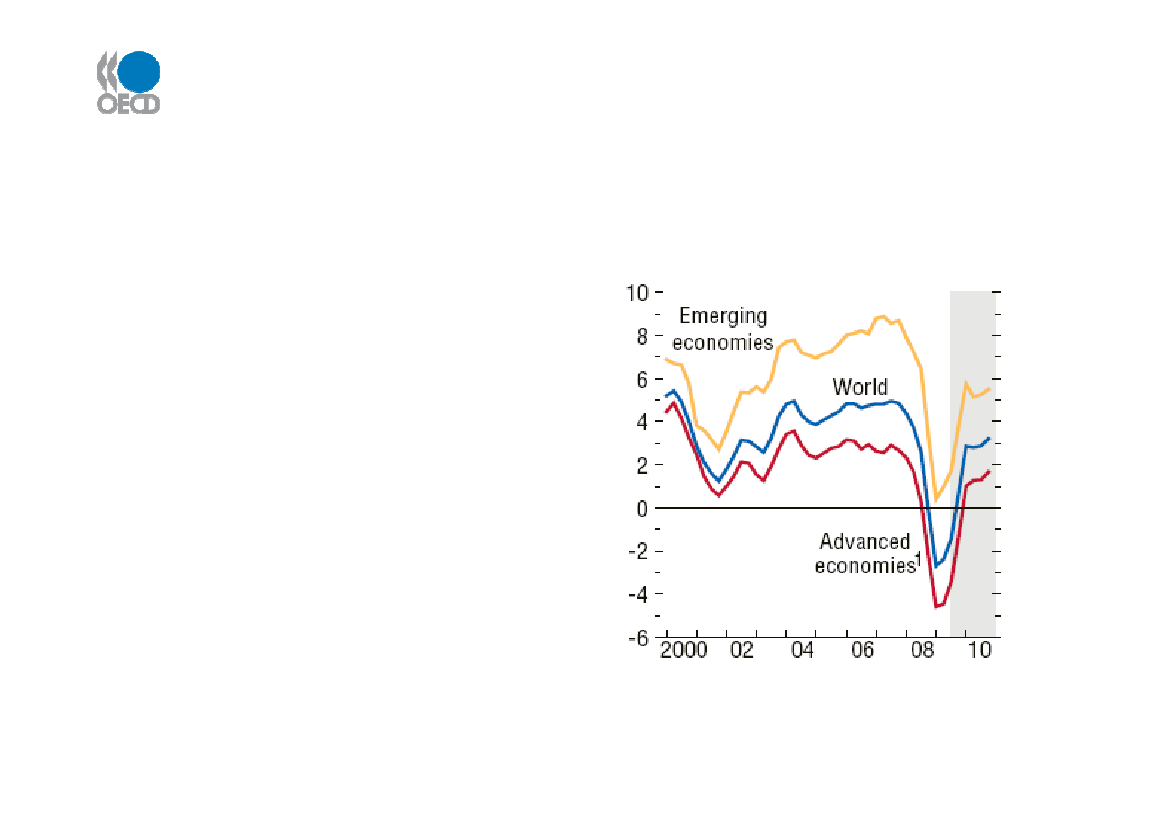
World economy – the big picture• Battered by one of theworst ever recessions• Deep contraction inadvanced economies in2008-09• Signs of recovery visible -fragile in OECD countries• Stronger growth in otherparts of world - notably inAsia and Latin AmericaSource: IMF October 2009
World GDP - % change
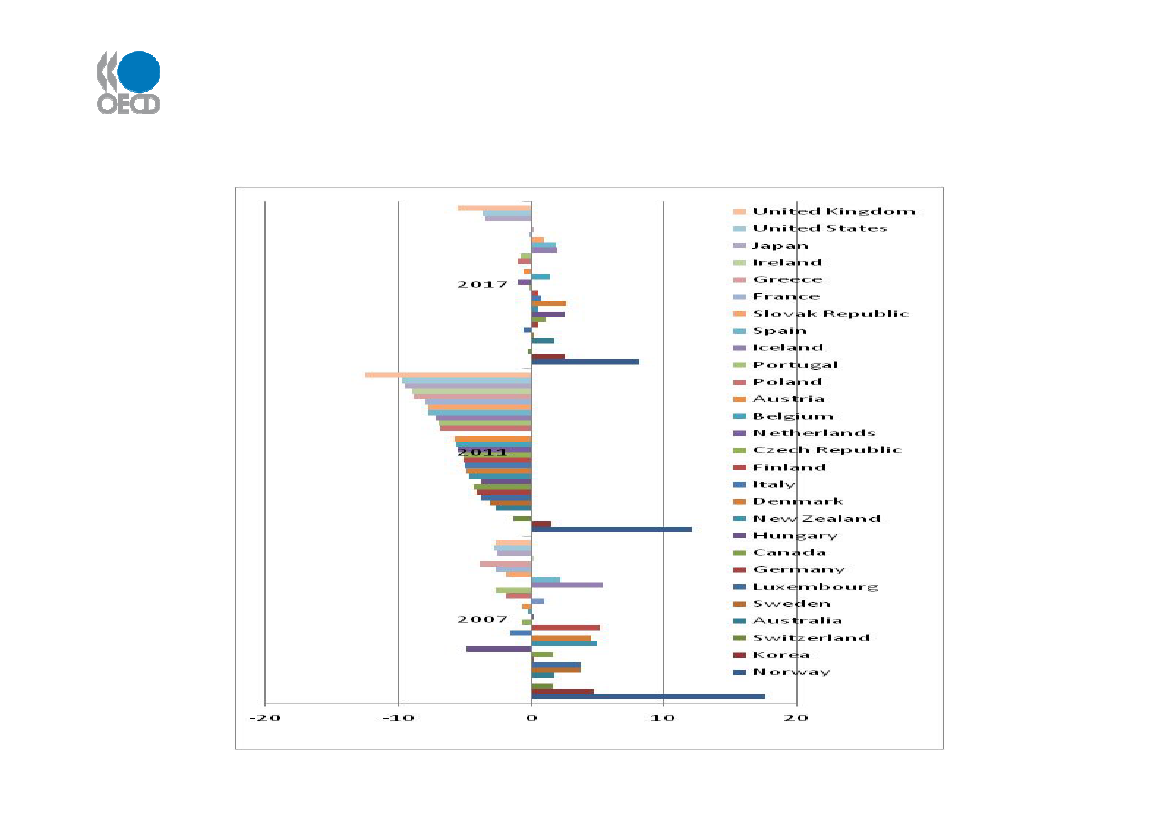
Fiscal Trends(general government fiscal surplus ordeficit as a % of GDP)Source: adapted from OECD Economic outlook, Nr 86
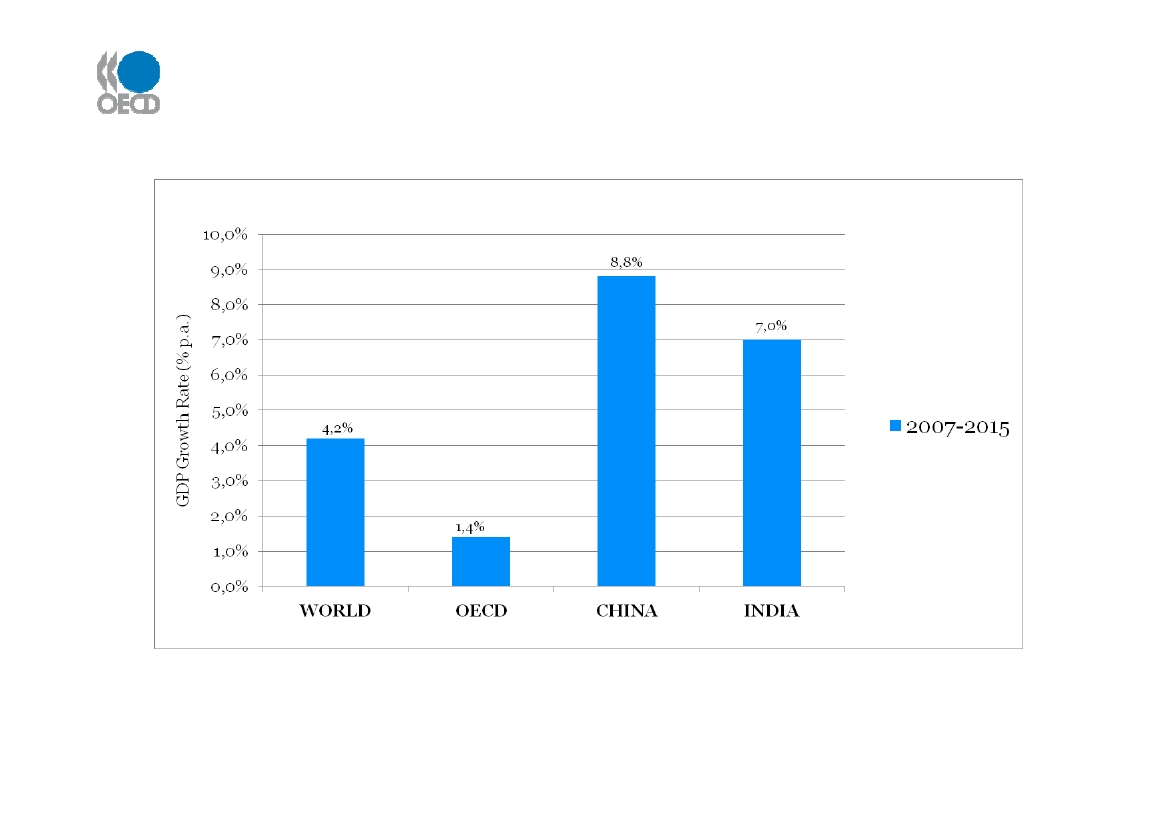
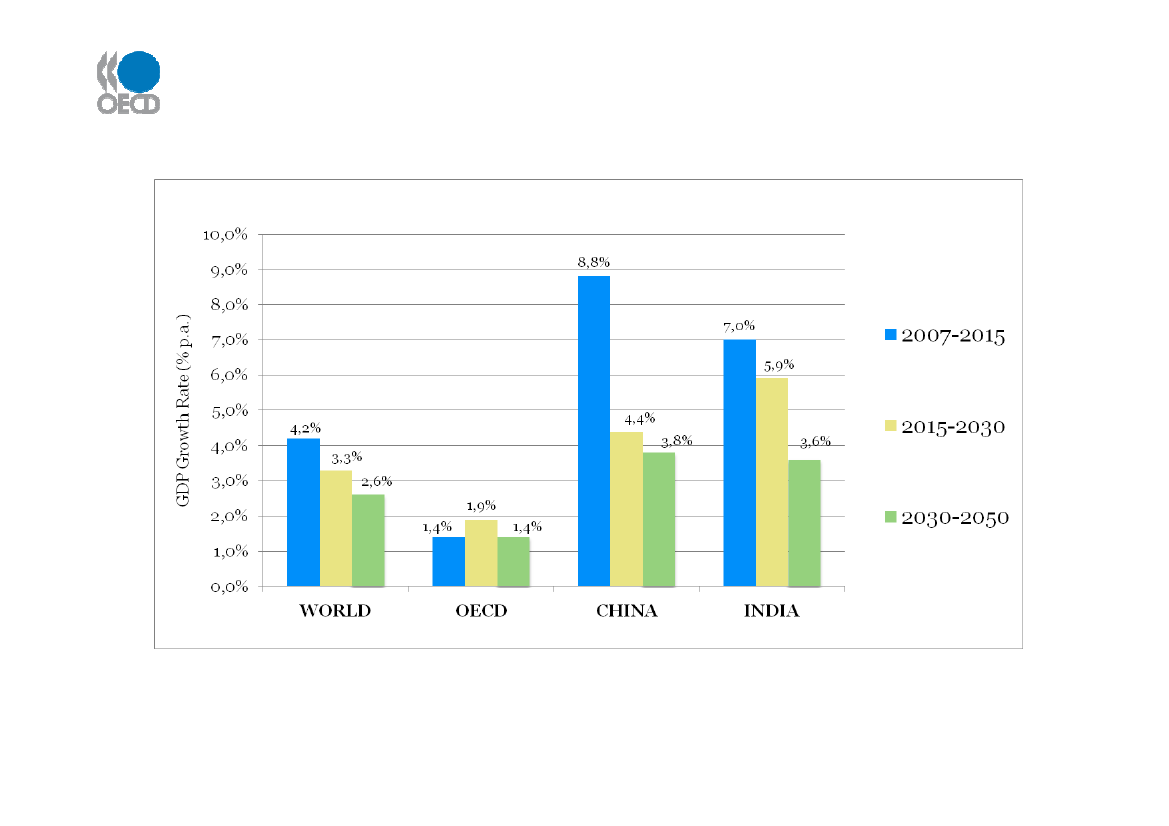
Period to 2015: Stronger growth, but differencesaround the globe
Source: IEA WEO (Nov 2009) for 2007 - 2015 - 2030; IEA ETP (June 2008) for 2030 - 2050
Strong and sustained economic growth in non-OECD countries over next 10+ years
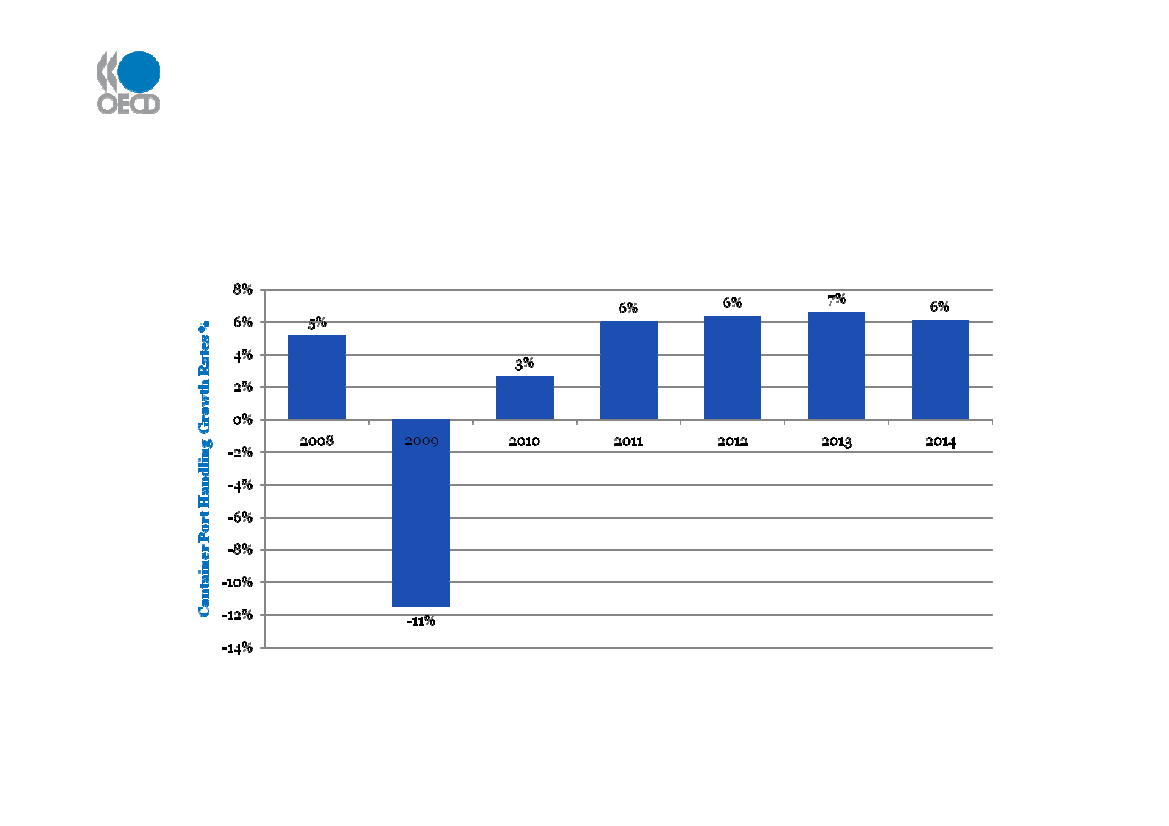
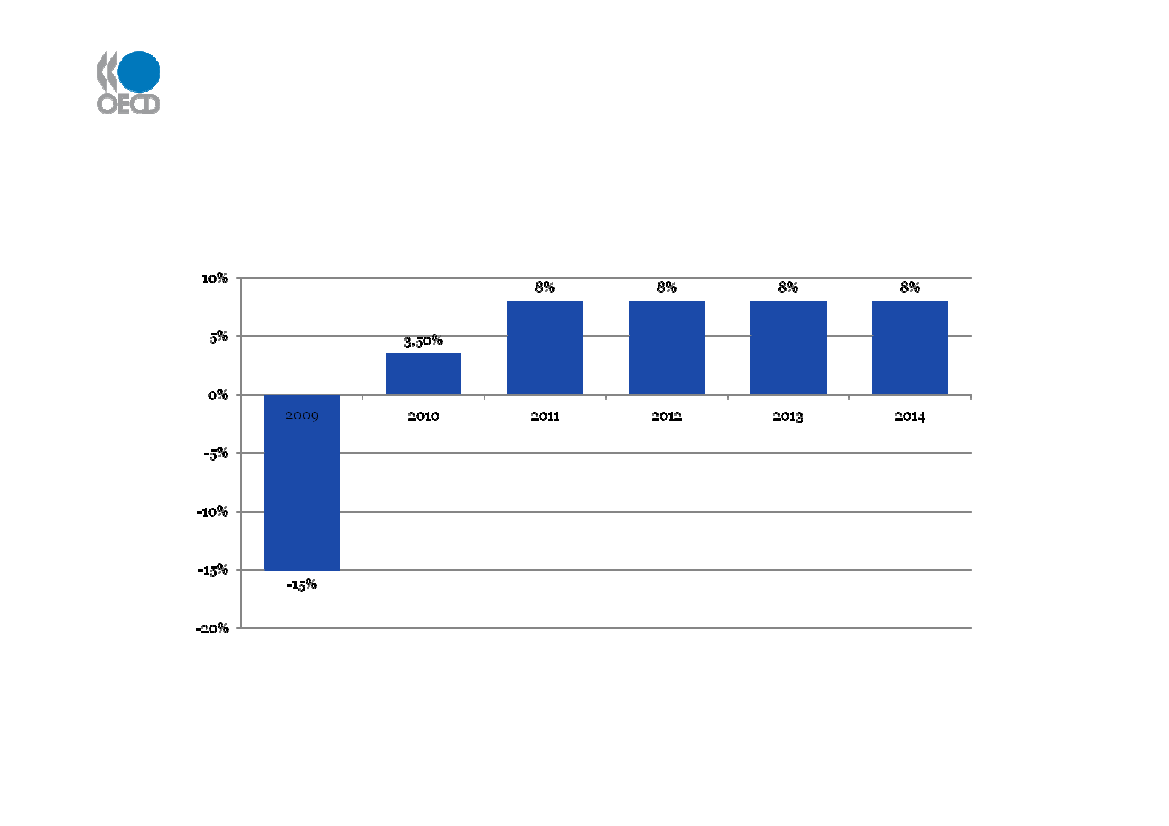
Maritime Outlook – Forecast growth in ContainerPort Handling to 2014World Container Port Handling - annual growth rates (%)
Source: Drewry, Container Market 2009-10, Oct 2009
Recovery from 2009 fall – but container growth rates below recent trend (>10% pa)
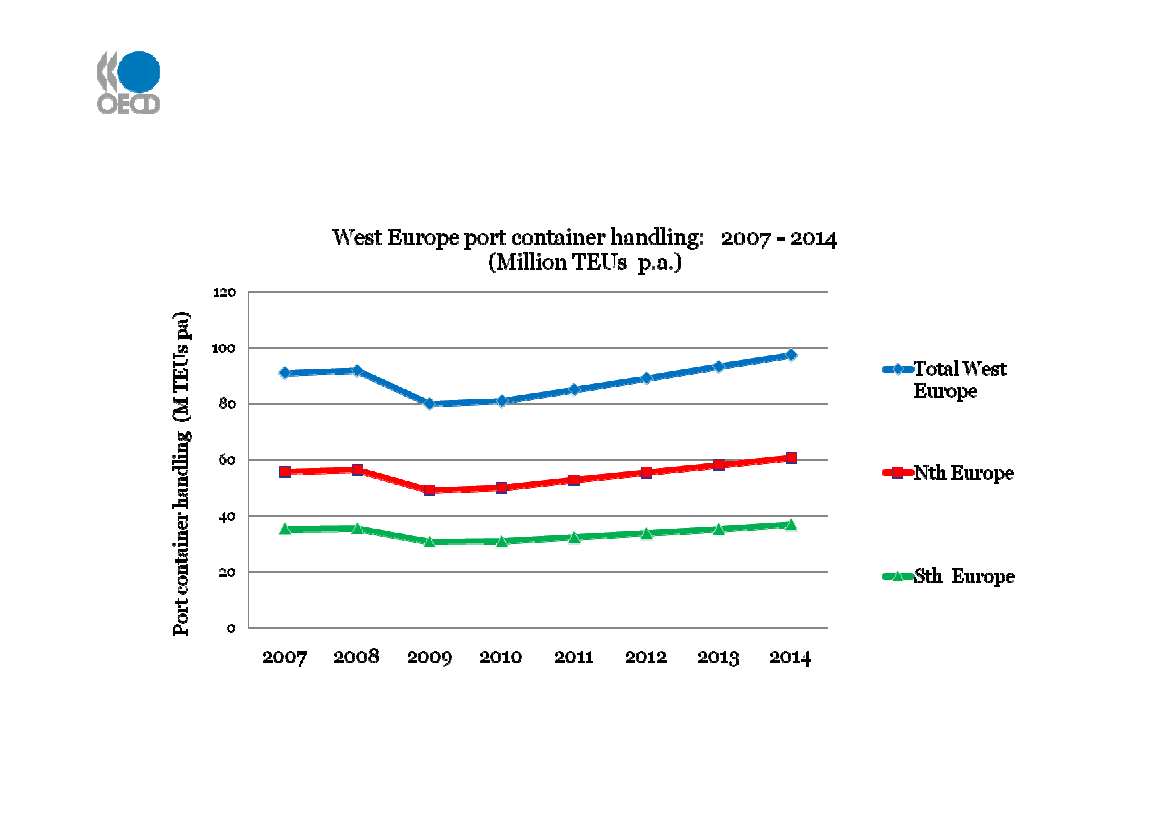
West Europe port container handling to 2014
Source: Drewry, Container Market 2009-10, Oct 2009
Growth in West Europe - a little stronger in Northern ports than in the South
Air cargo outlook - growth rates to 2014World air cargo – forecast annual growth rates (%)
Source: Airports Council International Aug 2009
Projected Air Freight growth well above av. annual rate of 3.8% p.a. (1999-2008)
Longer-term growth: differences lessening…
Source: IEA WEO (Nov 2009) for 2007 - 2015 - 2030; IEA ETP (June 2008) for 2030 - 2050
Strong and sustained economic growth in non-OECD countries over next 10+ years
Centre of gravity of world economy shifting East
China’s GDP overtakes US’ before 2025 - with India and Russia growing strongly too
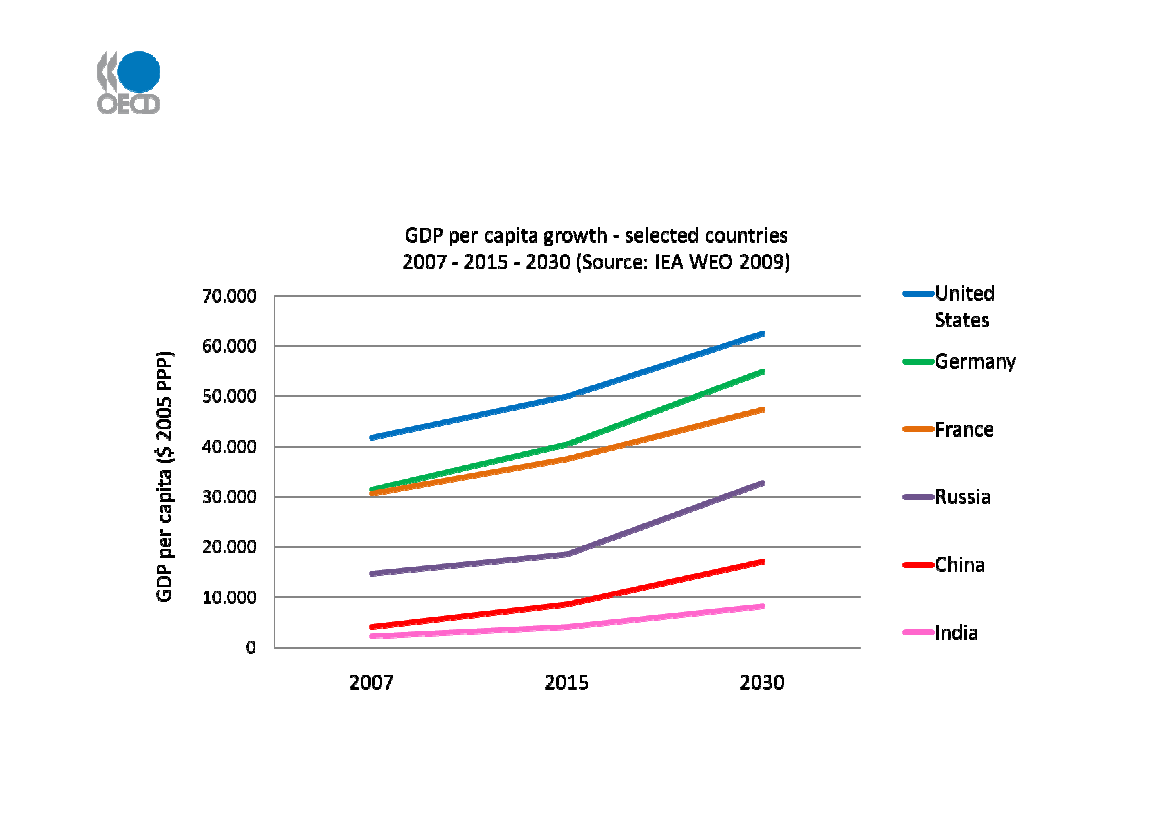
Per capita incomes – economic drivers offreight and passenger flows
Ongoing increases in GDP per capita in OECD countries. Growth rates highest in China
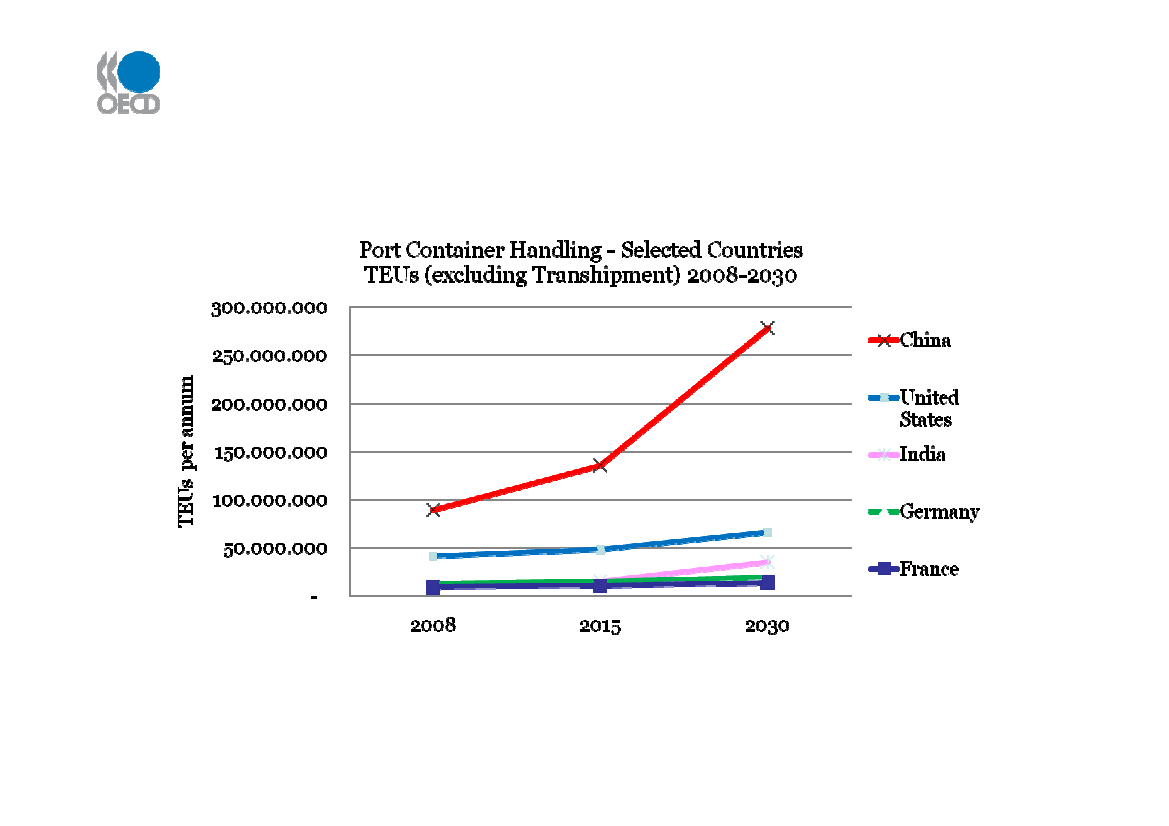
Maritime outlook – Trends in port containerhandling (TEUs p.a.) 2008-2030
Source: Drewry : Container Market 2009-10 Annual Review and Forecast (to 2015); Project estimates 2015 - 2030
Largest GDP-related volume increases in China followed by India and the US
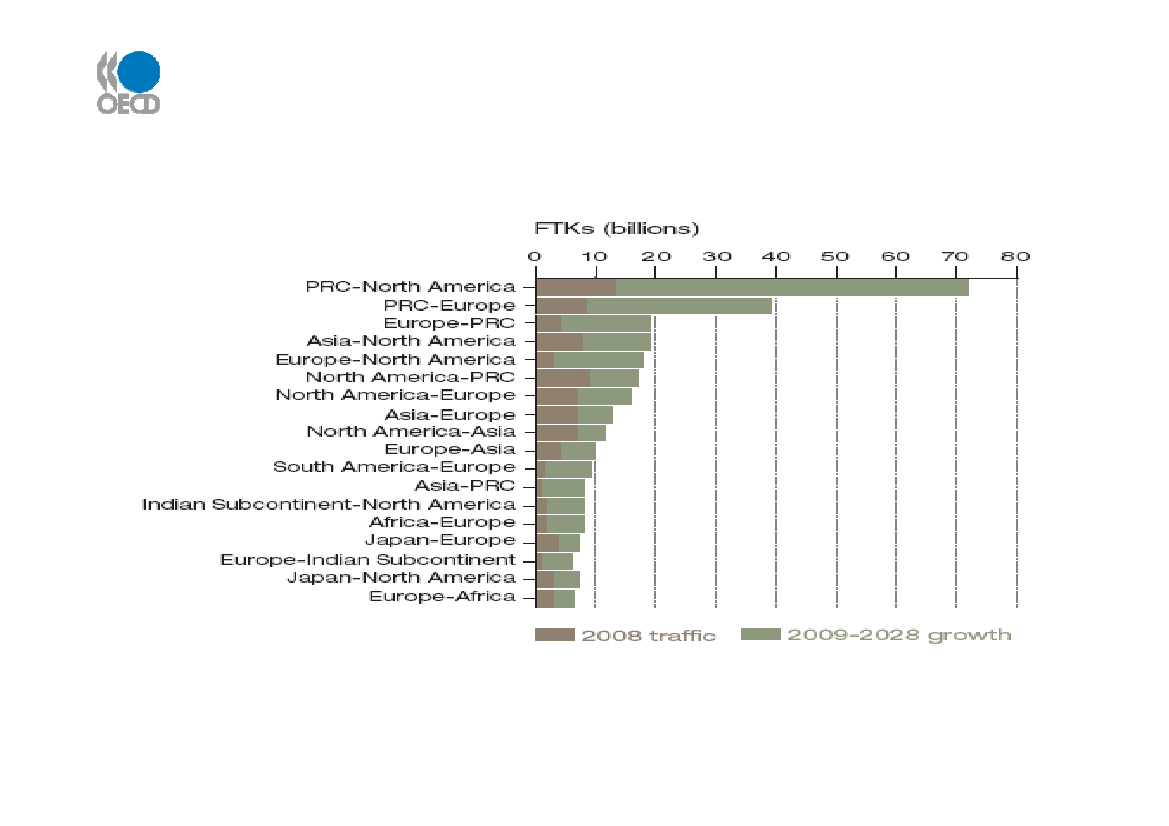
Longer term – air cargo flows & growthto 2028Airbus Projections – Largest air cargo routes / flows
Source: Airbus GMF 2009
Air freight traffic is expected to triple in 20 years–growth rate 5.2% (cf. 3.8%1998-2008)
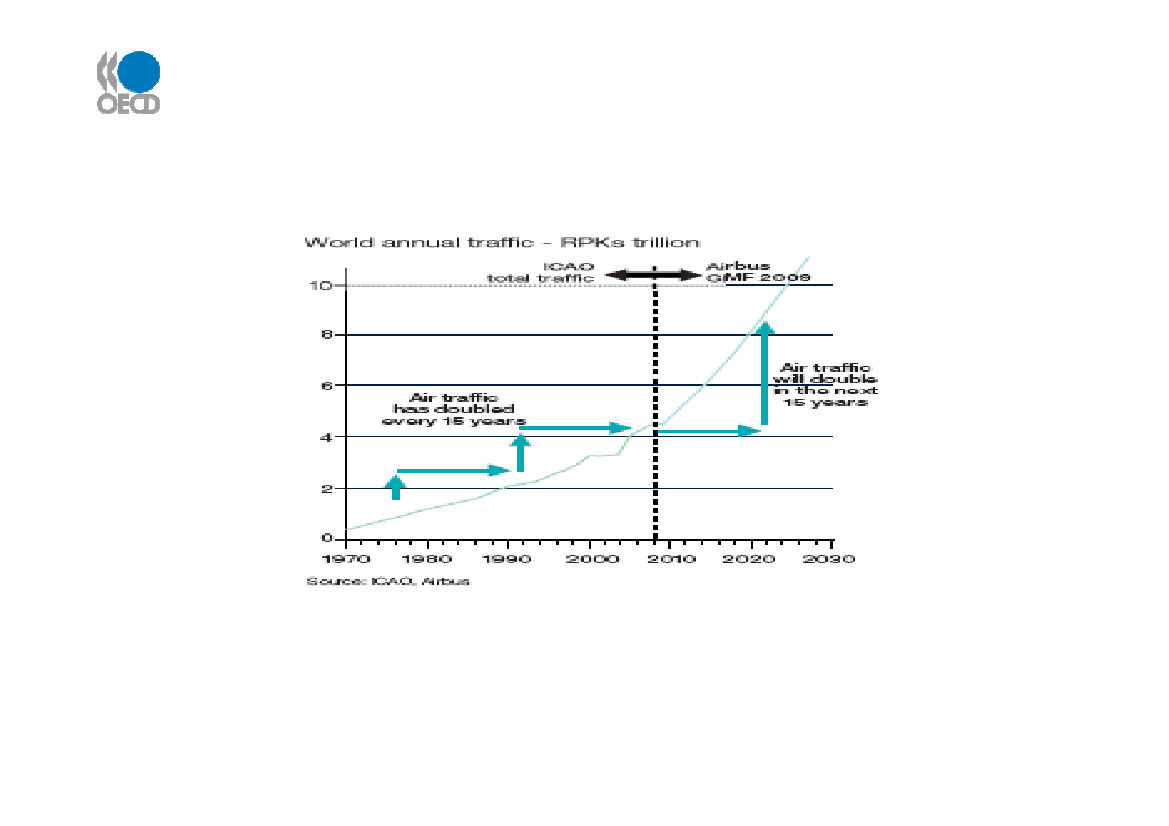
Air passenger outlook–trends & projections to 2030
Source: Airbus GMF, Oct 2009
Airbus projects air passenger traffic will double in 15 years – as it has in the past
Opportunities••---•----Increasing trade as global demand doubles 2030Growth opportunities include:Asia (China/India) and Latin AmericaRussian Federation, andresource-based growth in the Baltic /High NorthExport opportunities (subject tocompetitiveness)cruise and eco-tourism (with ageing population)transport services/container growth (eg Maersk)services / low carbon / ‘green growth’ industriesniche markets for high technology manufactures.
Quality Infrastructure - one of several key pillarsof competitiveness• Infrastructure- essential driver of competitiveness- critical for effective functioning of the economy- important for the location and kinds of activitiesor sectors that can develop.• Well-developed infrastructure reduces the effectof distance between regions, connecting it at lowcost to markets in other countries and regions.• The quality and extensiveness of infrastructurenetworks significantly impact economic growth
Denmark’s infrastructure in the globalcontext
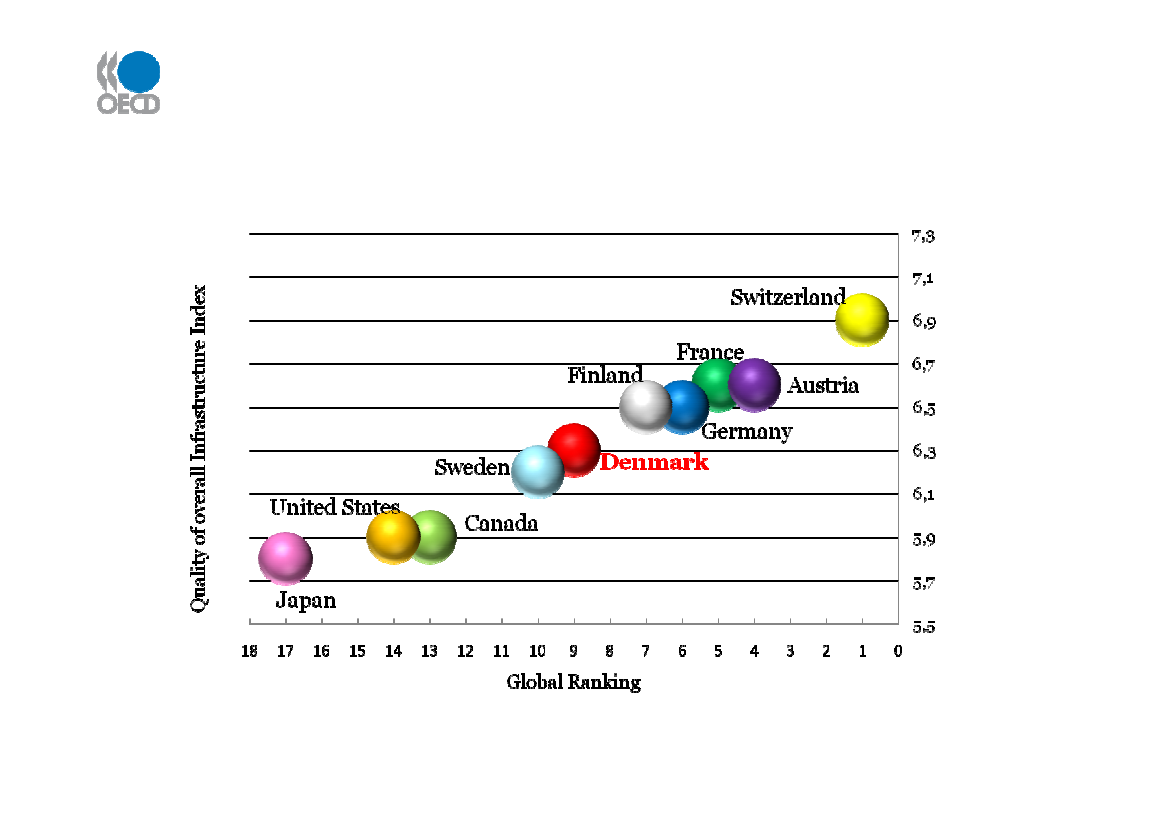
Overall infrastructure qualityDenmark’s global ranking – 9th
Source: Global Competitiveness Report 2009-10, World Economic Forum, 2009
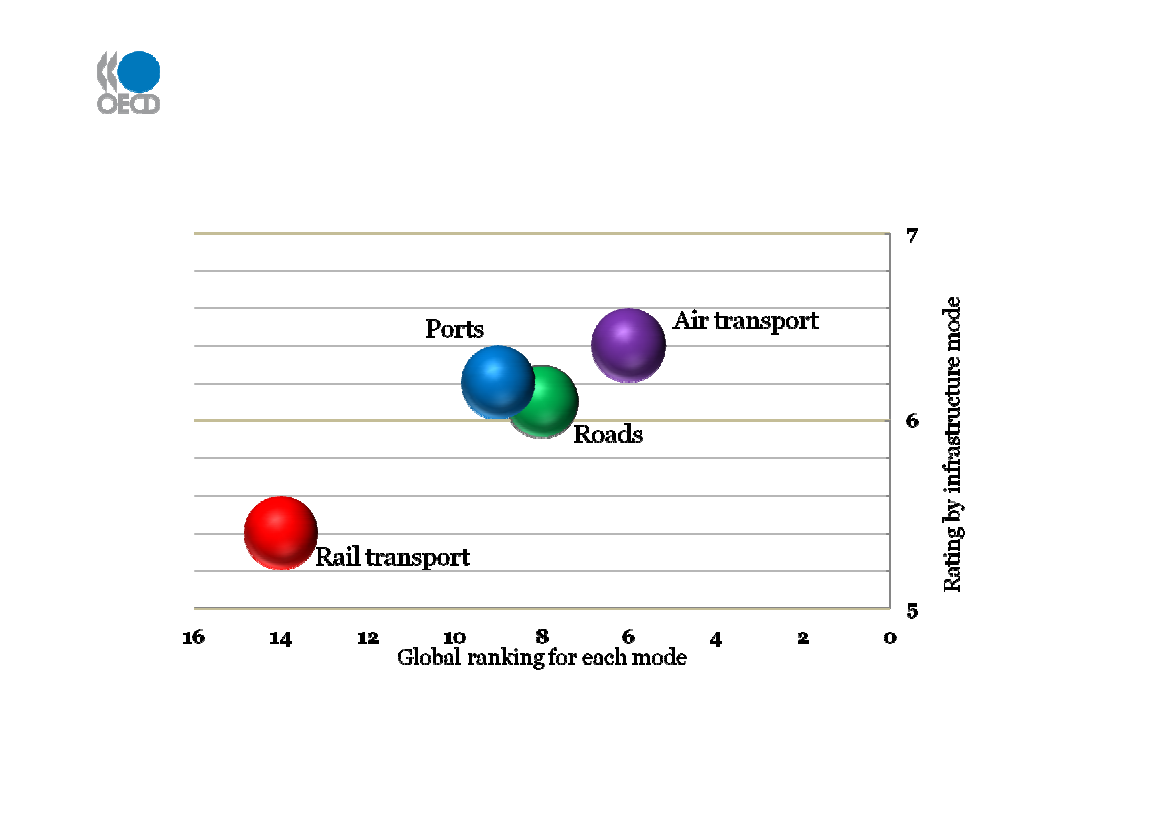
Denmark’s infrastructure quality by mode
Source: Global Competitiveness Report 2009-10, World Economic Forum, 2009
Fit for the long run?• Investment programme to 2020 – historicallyhigh levels- Fehmarn Belt - bridge and related rail links- New Metro Circle Line- Modernisation of rail network and new railcorridors- Expansion of most congested road corridors inCopenhagen Region and East Jutland• But numerous challenges beyond 2020…..
How to improve competitiveness in a higher resource cost /low carbon / “green growth” environment?
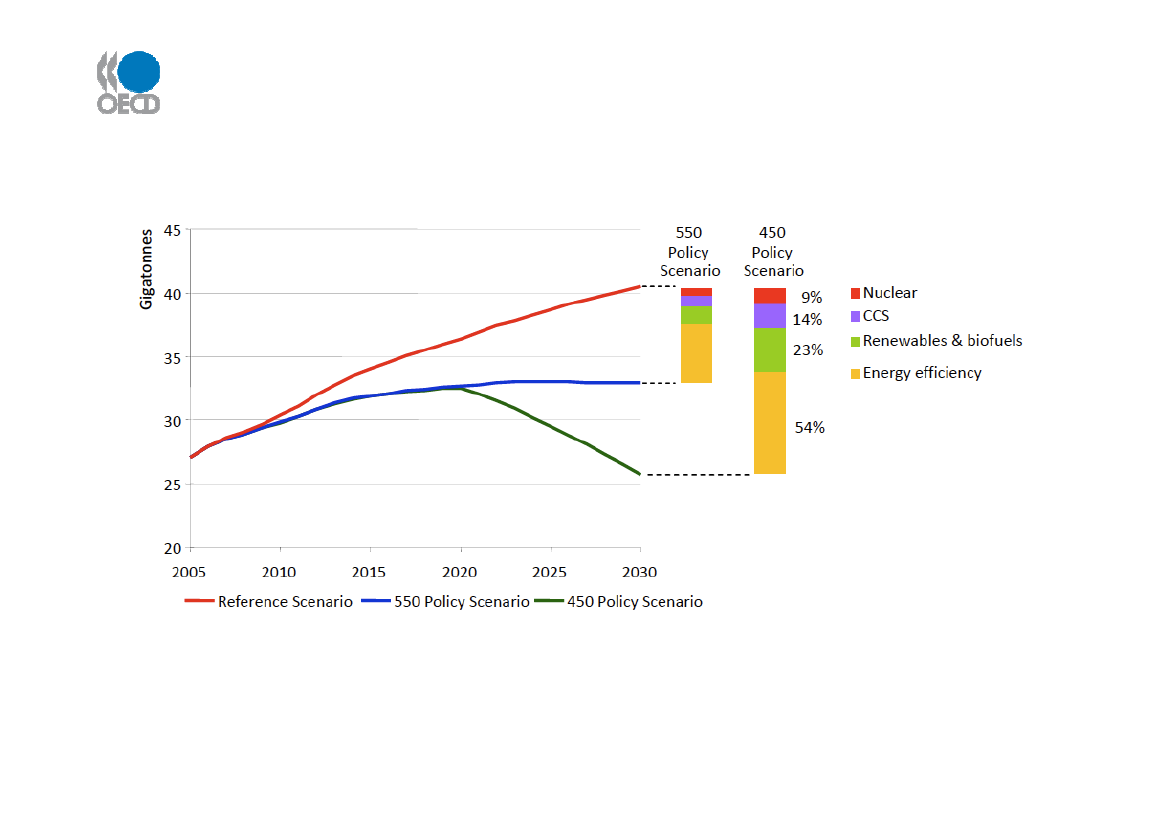
About 25% of world-wide CO2 emissions are attributable to transport. Transport CO2 emissions
are projected to increase by nearly 40% by 2030 – and more than 80% by 2050… Efficiency gains
and deployment of existing low carbon energy account for most of the savings.
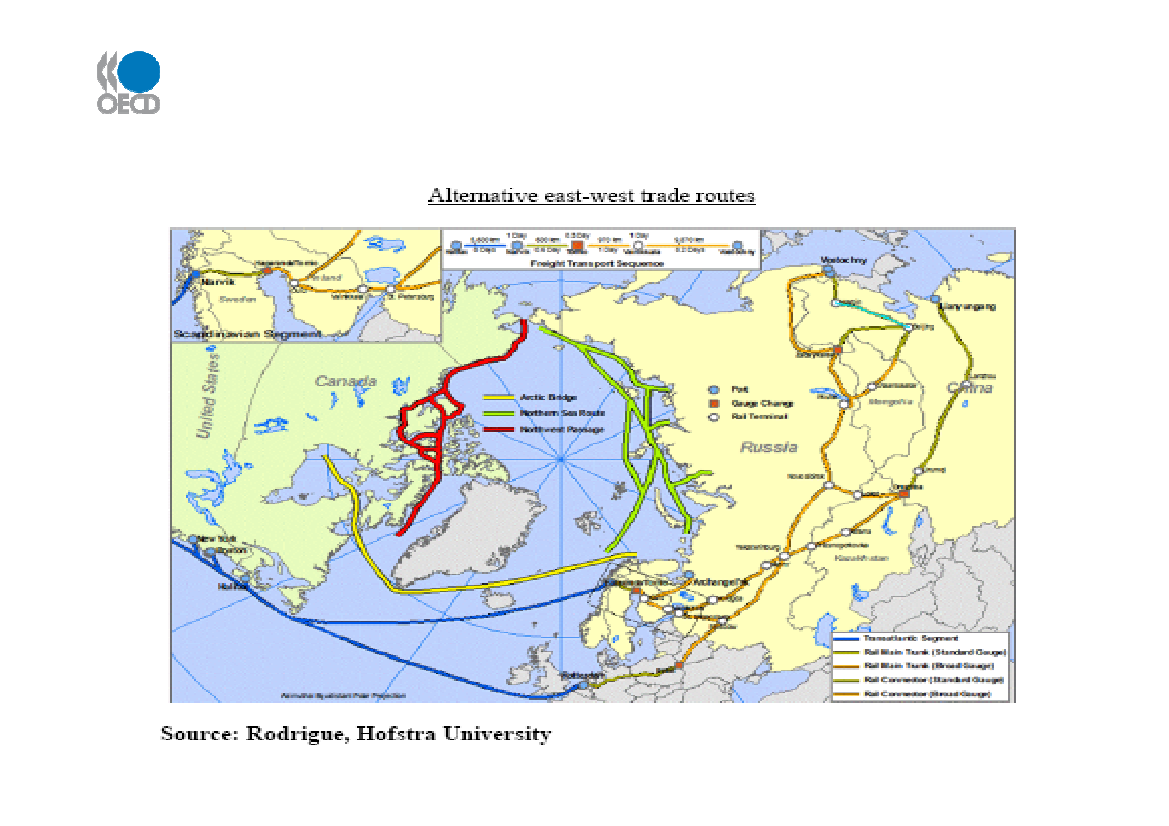
Source: IEA World Economic Outlook November 2009; IEA Transport Energy and CO2 October 2009.Emergence of new trade routes: what impact on tradeflows, gateways and infrastructure requirements?
What scope for more use of intelligent transportsystems on existing infrastructures?Pushing the frontiers further in:• Programmes that keep the road network atmaximum/optimal capacity during peak periods• Road network pricing..setting incentives?• Intelligent ICT-driven public transport managementschemes• Enhanced signalling and improved freight rail cargocapacity• Use of GIS codes to facilitate life-cycle management ofinfrastructure assets…• Etc.
What scope for more innovative approaches to finance?••Fiscal consolidation to 2017…?Growing expenditures on health, pensions, long-term care to 2050…
Options:••Diversify and expand traditional revenue-raising sources?Make greater use of user charges for funding infrastructures.?Theyshould be designed to signal prices, reflect real costs and contribute todemand management.Engage the private sector?Encourage public private partnerships (PPPs) as a means of raisingadditional financing for infrastructure investment and diversifyingbusiness models?Encourage the investment of pension funds and other large institutionalinvestors in infrastructures.?
••
•
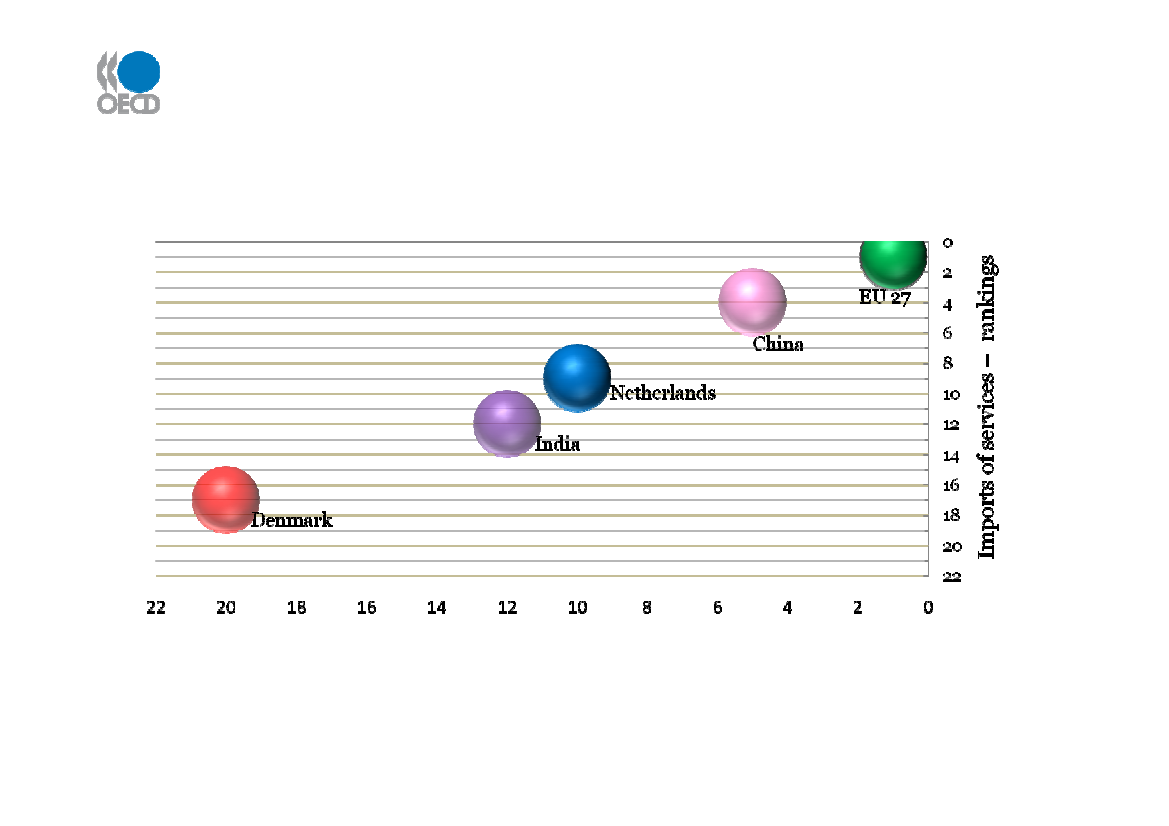
How to maintain export competitiveness as othercountries and regions develop more rapidly?(Worldtrade in commercial services –country rankings)
Exports of commercial services – country rankingsSource: UN World Trade Organization, March 2010
Thank you