Skatteudvalget 2009-10
SAU Alm.del Bilag 291
Offentligt
The Financial Crisis:Tax & RegulatoryArbitrageAdrian Blundell-WignallSpecial Advisor to the OECD Secretary-General for Financial MarketsFriday 10thSeptember
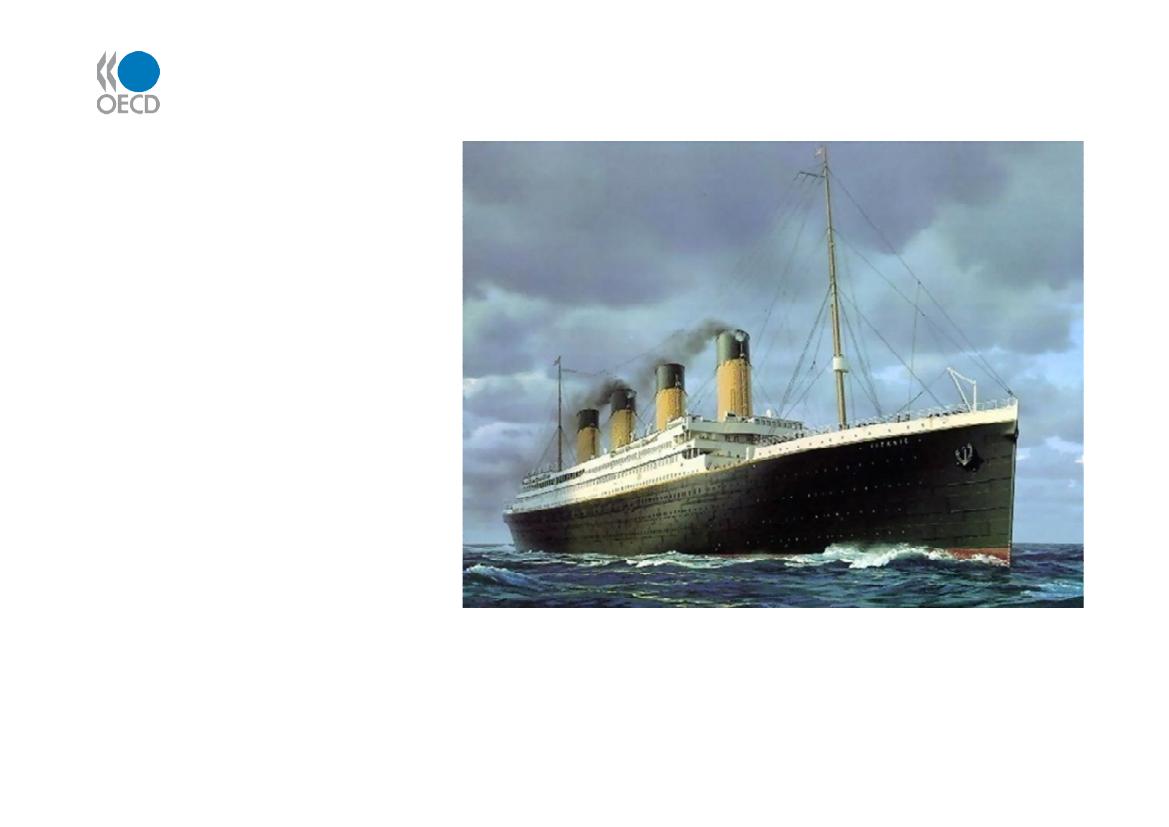
The Titanic
•Speeding to fast.•A badly madeship, with no fullywatertightcompartments.•Not enough lifeboats.•Too big to sink
Hallmarks of theCrisis•Its what banks do not howbig they are.•Contagion risk.•Counterparty risk.
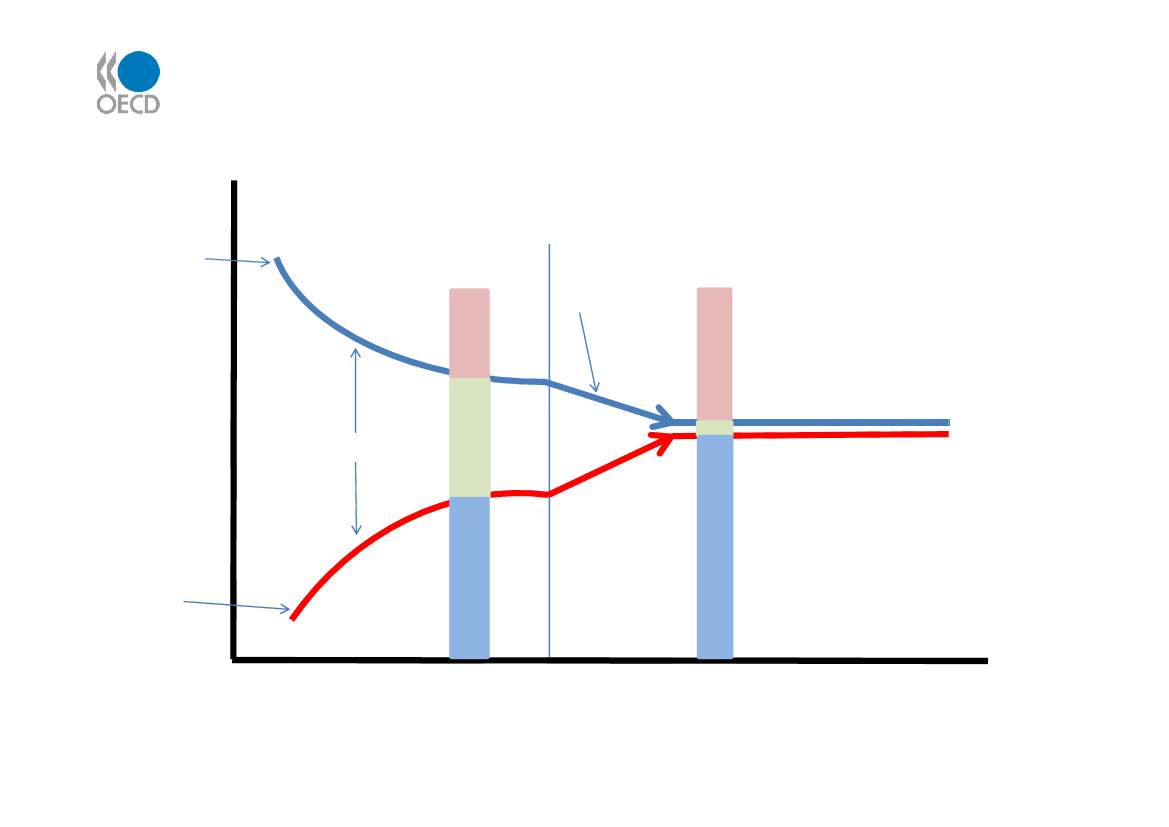
Fig. 1: The Arbitrage Process In Complete MarketsFor Credit—Promises Aren’t Treated the SameINTERESTRATEExcess leverage& risk takenas high profitopportunities areare squeezedout.
Observed RateBorrower
BANK
CSO/CDO
Agent Spreado/heads;fees;regulation;equity; tax wedges
Observed RateInvestor
SMALLTRANSACTION SIZESource: Ironbridge Capital/OECD
LARGE
Fig. 2: Tax Issues: Causal• Tax deductibility of interest favours mortgages andcorporate leverage.• A key part of the private equity boom (gearing, taxingcarried interest, etc).• A key part of the growth in structured products.Structuring as capital gains. Structuring in a completemarkets framework.• Pass through (entity not taxed) to mortgage and otherconduits (1986 reform in the US); synthetic leases.• Infrastructure funds.
Fig. 3: TAX ArbitrageBOND HBOND LYIELD % FACE VALUE101000INVESTOR A81000INVESTOR BINVESTOR AShort Bond LLong Bond HNet postionIncome Pick UpReturn on investmentINVESTOR BLong Bond LShort Bond HIncome Pick UpReturn on investmentTAX STATUS %BOND H BOND Lexemptexempt5025-10001000020
∞∞
1000-100010
Source: Thomson, Federal Reserve, OECD
Fig. 4: Tax Leveraging & De-leveraging• The tax-led boom in leverage led to de-equitisation in the 2000’s; and now thatprocess is being reversed with issuanceand dilution of shareholders. Equitycrash and overshoot.• The crisis is leading to deleveraging—balance sheet reductions and asset sales.Debt deflation dynamics which is killingthe economy.
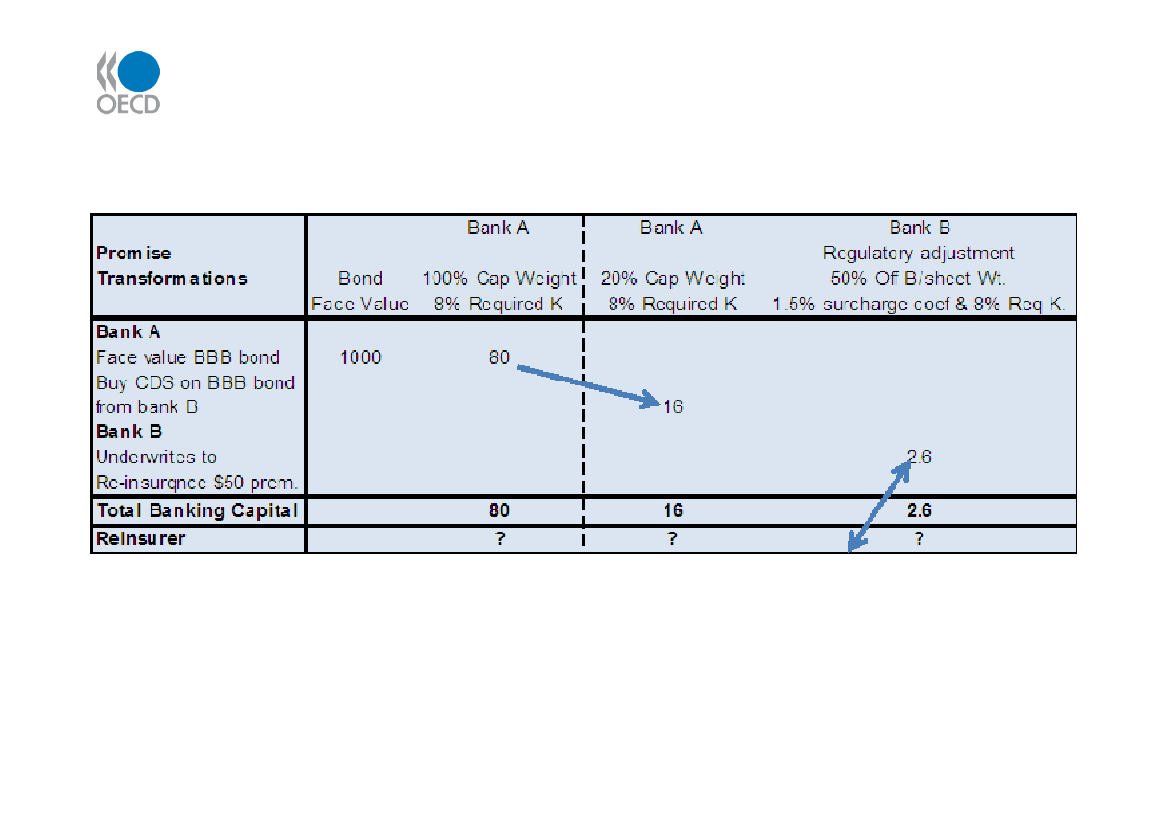
Fig. 5: Shifting the Promises
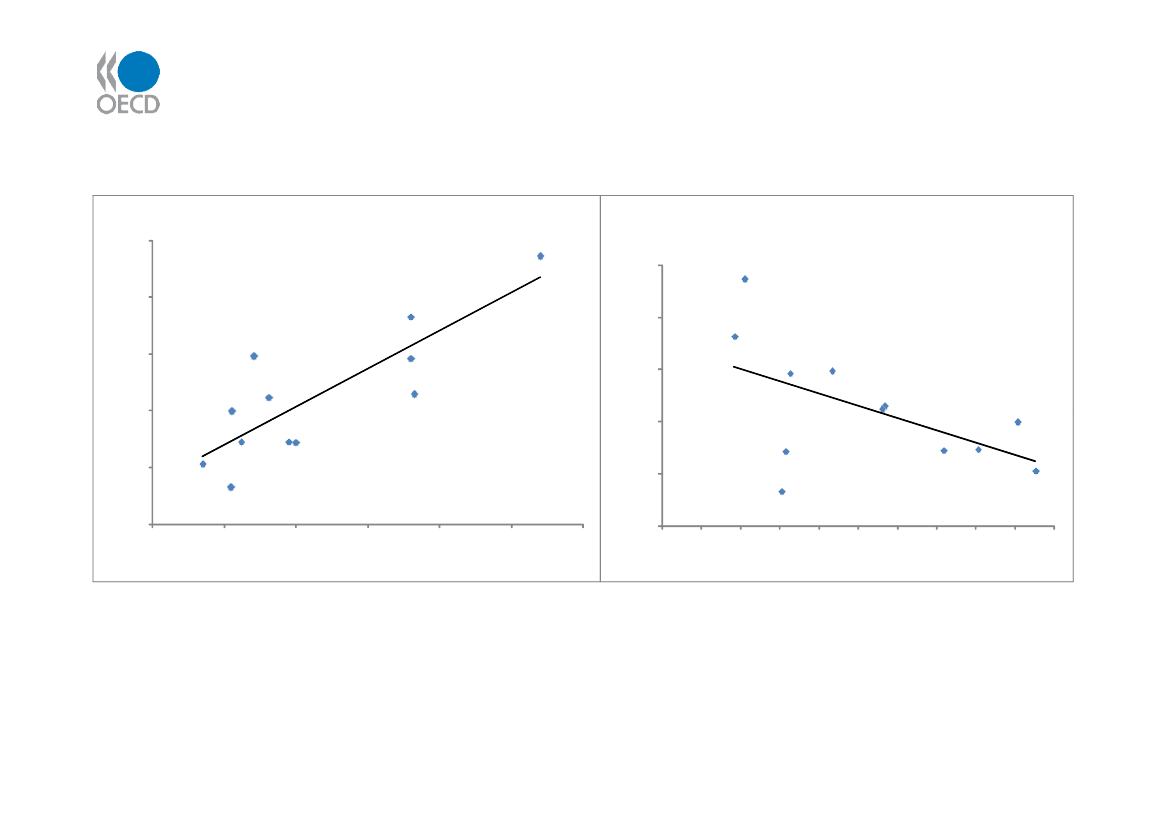
Fig. 6: Basel Capital Adequacy vs Leverage Ratio &Losses---Basel is PerverseWritedowns & losses/total assets (%)2.5
Capital Adequacy Ratio (Tier 1) vs.writedowns & losses/total assetsSwitzerland
Common equity/assets (lev. ratio)vs. writedowns & losses/assetsWritedowns & losses/total assets (%)2.5
Switzerland2.0
2.0
GermanyUnitedKingdom
GermanyBelgiumUnitedKingdomCanadaIrelandFranceNorwayAustraliaSpain
1.5
IrelandAustralia1.0
BelgiumCanada
1.5
0.5
SpainFranceItalyNorwayJapan
1.0
0.5
Japan
Italy3.03.54.04.55.05.56.0
0.06789101112
0.01.01.52.02.5
Tier 1 ratio
Common equity/total assets (%)
Source: , OECD; Thomson Reuters; Bloomberg, Worldscope, Datastream.Cum. Losses Jan 2007 to mid 2009. Regulatory ratios 2006-2008 averages.
Fig. 7: Tax Issues: Paying For the Crisis• Conservatively trillions of dollars arebeing spent and budget deficits havesoared to levels thought unthinkable(10%+??).• Taxes are going to have to rise to pay forit. But what forms of tax rises will bestsuit recovery and the type of investmentwe would like to see?
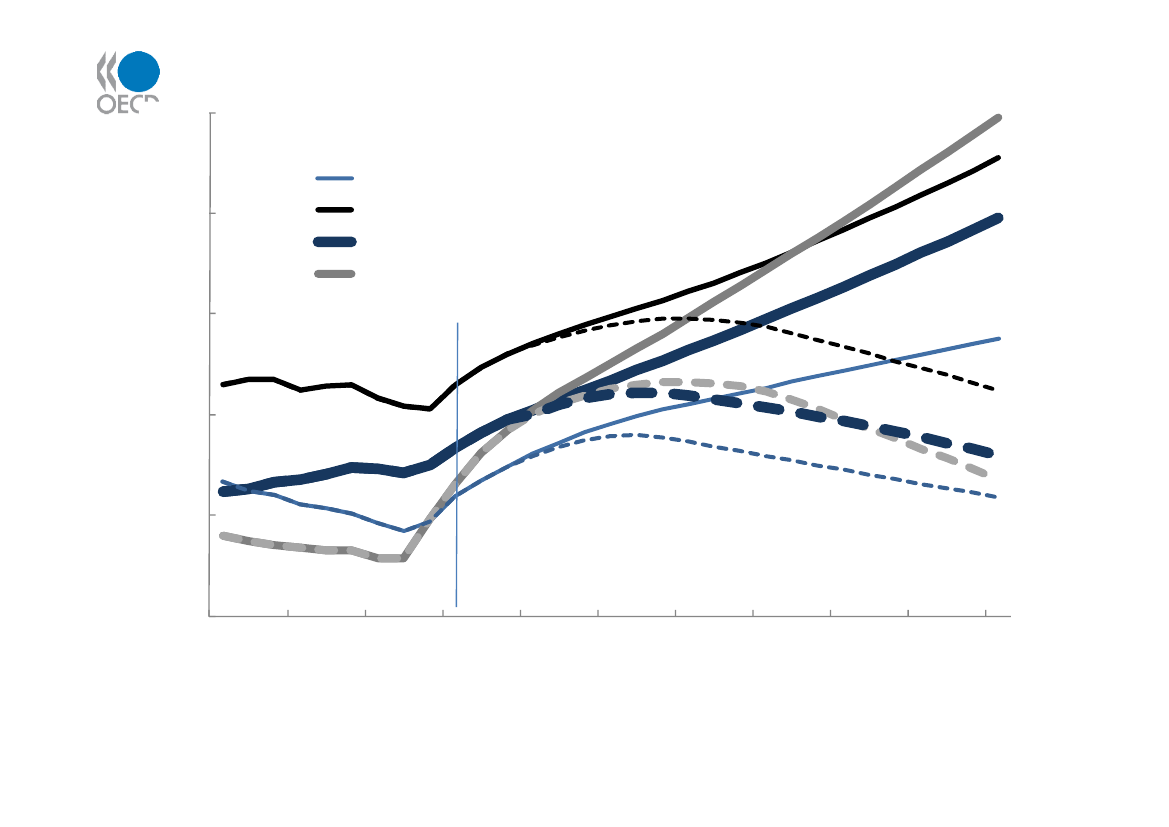
Fig. 8:Primary Budget Cuts Debt Projections250%GDP
200
Spain (-7% prim bal, 8yrs)
Greece (-14% prim bal, 13 yrs)
Portugal(-11% prim bal, 8 yrs)
Ireland (-17% prim bal, 13yrs)
150
100
50
0Jan-00Jan-03Jan-06Jan-09Jan-12Jan-15Jan-18Jan-21Jan-24Jan-27Jan-30
Source: , OECD, Datastream. .