Skatteudvalget 2009-10
SAU Alm.del Bilag 291
Offentligt
Organisation for Economic Co-operation and Development
Tax Policy Trendsin OECD countriesPresentation to Danish ParliamentariansParis, 9 September 2010Jeffrey OwensDirector of the Centre for Tax Policy and AdministrationOrganisation for Economic Co-operation and DevelopmentJeffrey.owens@oecd.org
Jens Lundsgaard
Centre for Tax Policy and Administration
Top challenges following the crisis
Public debt has risen strongly following the crisis
fiscal consolidation required in some countries•The scale ofboth spending cuts and tax increases are necessarymeans that
Economic growth potential is weakened
•Tax reform might be part of the answer
2
2
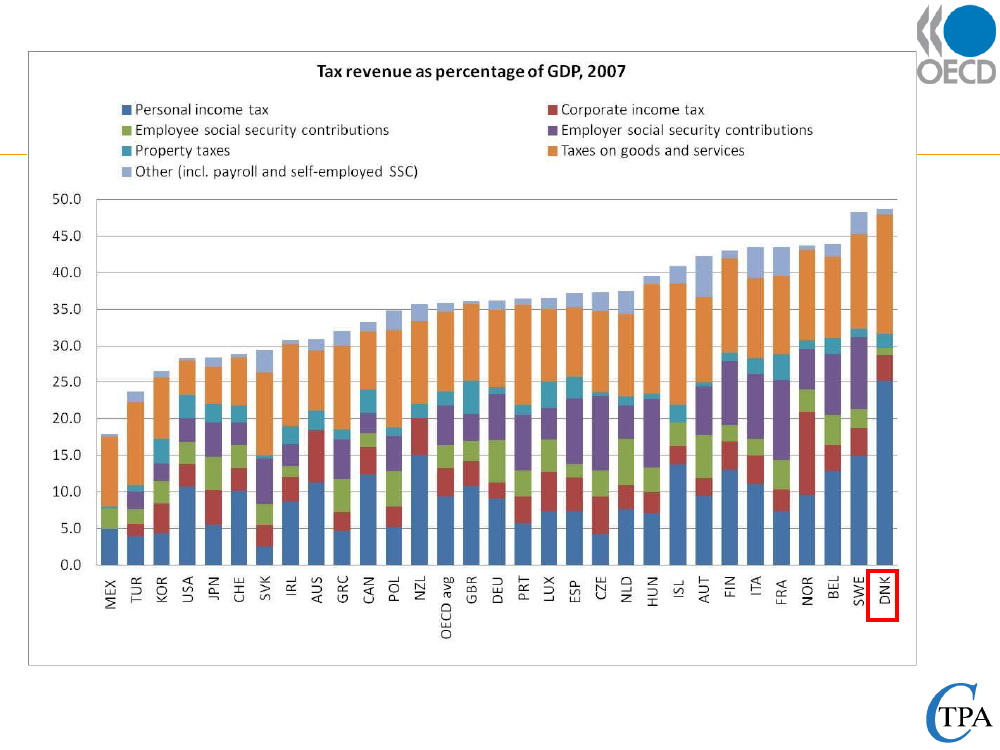
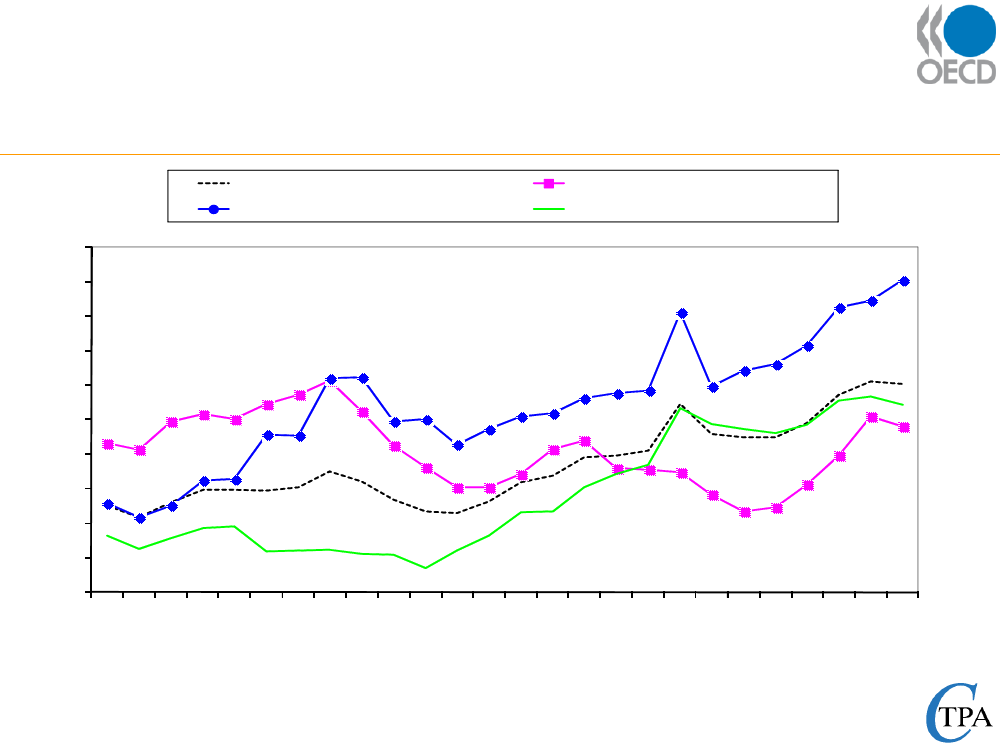
Tax-to-GDP ratios
3
Source: Revenue Statistics (OECD)4
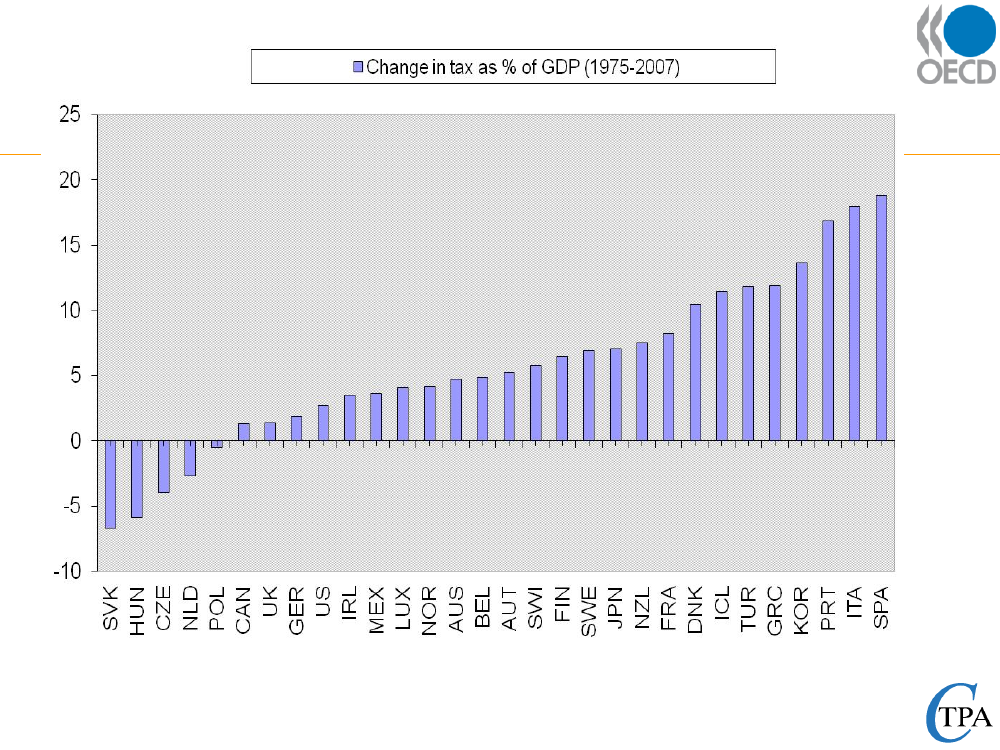
Earliest data available MEX: 1980; HUN-POL: 91; CZE: 93; SVK: 98Source: Revenue Statistics (OECD)5
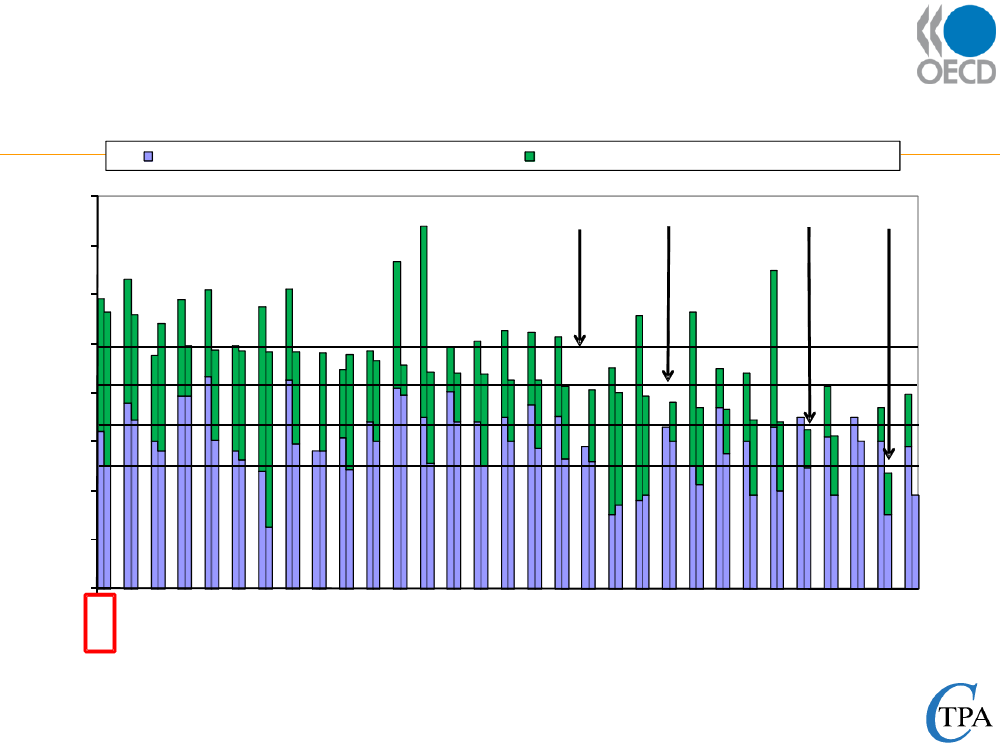
The tax mix
6
Revenue shares of major taxes in theOECD-area over time1965Personal income taxCorporate income taxSocial security contributions(employee)(employer)Payroll taxesProperty taxesGeneral consumption taxesSpecific consumption taxesOther taxesTotal7
197530822( 7)( 14)1613182100
198530822( 7)( 13)1516162100
199527825( 8)( 14)1618133100
2007251125( 9)( 15)1619113100
26918( 6)( 10)1812242100
Capital income taxation atcorporate and personal level
8
9
10
20
30
40
50
60
70
0
NPJSUARFLEBREGSUAXEMLZNAPSNACXULRONKUATITRP20101981
EWSNIFDLNTUAKNDROKCRGIWSRUTEZCNUHLOPKVSLHCLCILRI
Corporate income tax rate1994
Corporate tax rates and GDP across theOECDStatutory corporate income tax rate2000Large-sized OECD countriesUS-JPN-GER-UK-FRA-ITA
200436.0
200735.9
201033.1
39.5
Medium-sized OECD countriesCAN-SPA-KOR-MEX-AUS-NLD
35.7
33.1
29.9
28
Small-sized OECD countriesBEL-SWI-TUR-SWE-AUT-POLNOR-GRC-DNK-IRL-FIN-PRTCZE-HUN-NZL-SVK-LUX-ICL
30.9
26.6
24.1
22.7
OECD Total
33.6
29.8
27.6
25.9
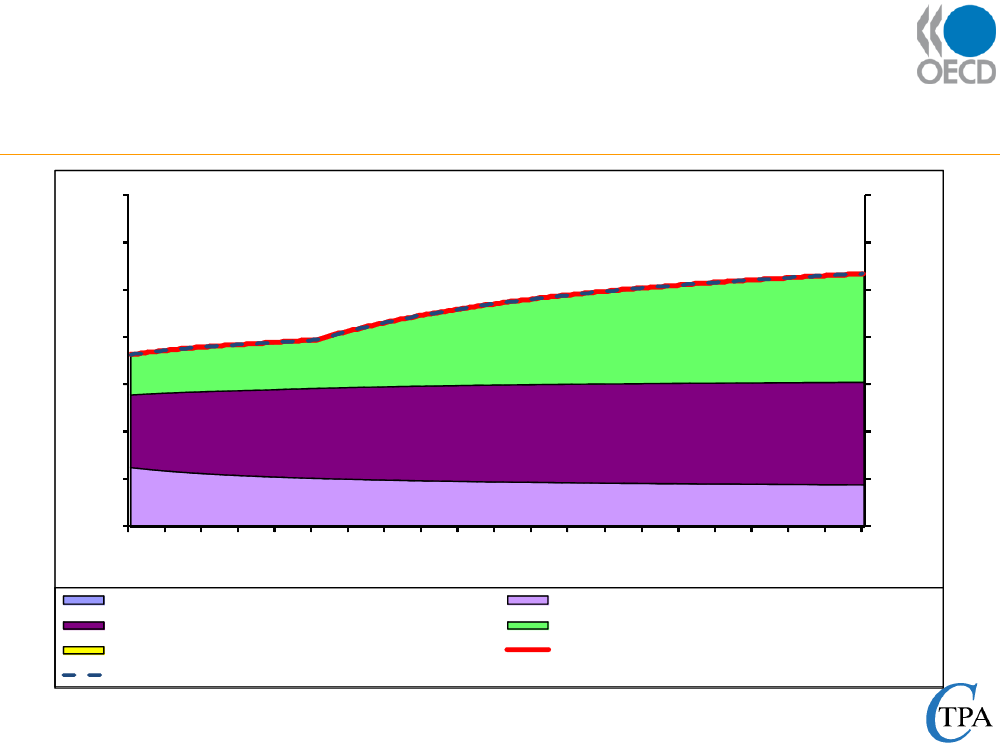
10
Taxes on corporate incomeas % of total tax revenueOECD TotalMedium-sized OECD countriesLarge-sized OECD countriesSmall-sized OECD countries
1514131211109876528913891489158916891789189189109191291391491591691791891910210202302402502602702
Source: Revenue Statistics11
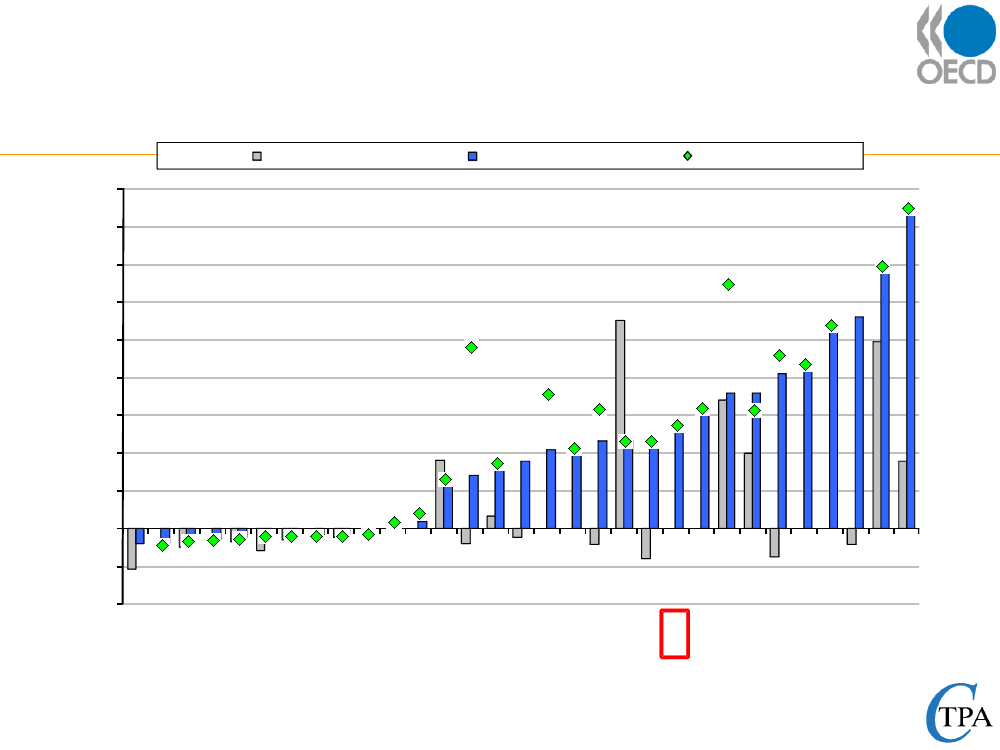
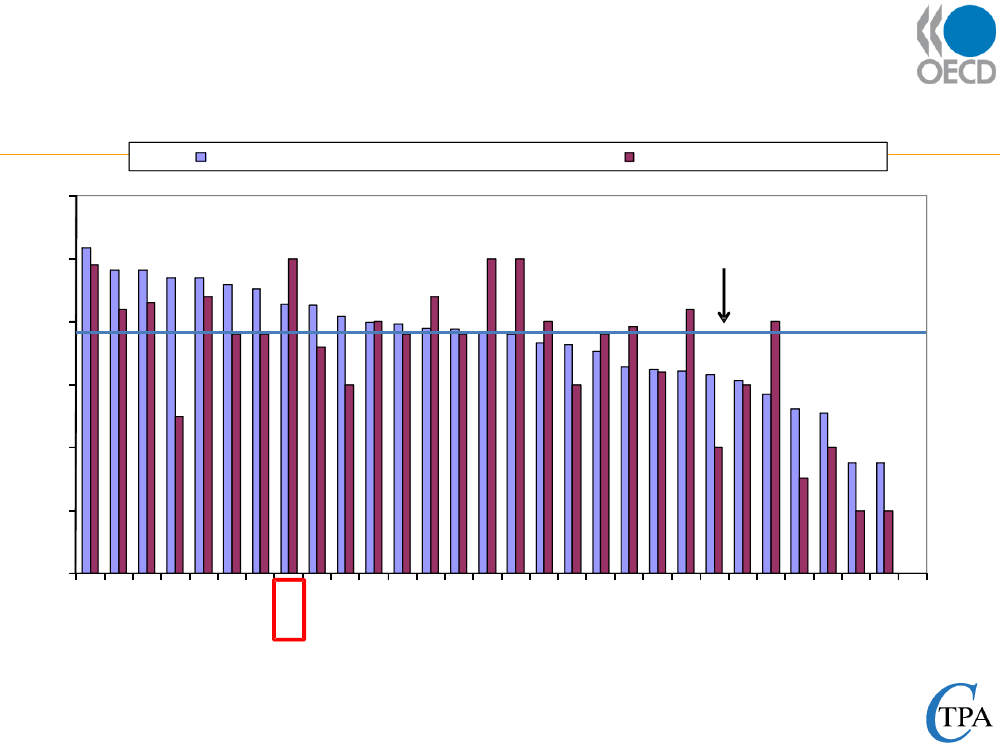
Top statutory marginal tax rates on dividend incomePart of CIT in overall tax rate on dividendsPart of PIT in overall tax rate on dividends
80706050403020100KU
Overall statutory tax rate on dividend income in 2000 and 2010; CIT part in 2000 and 2010
SU
LRI
ATI
NIF
XUL
IWS
NPJ
LZN
LEB
LOP
APS
ARF
DLN
TUA
TRP
LHC
SUA
RUT
EZC
LCI
EWS
RON
Source: OECD Tax Database: www.oecd.org/ctp/taxdatabase12
CRG
XEM
REG
ROK
KND
NAC
NUH
KVS
Trend towards more R&D tax incentiveslarge firms 1990large firms 2008SMEs 2008
0.450.400.350.300.250.200.150.100.050.00-0.05-0.10SULCIKULRINIFLZNIWSXULLOPNPJLEBATILHCDLNTUAEZCTRPAPSEWSXEMSUAREGCRGROKKNDNUHNACRONRUTARFKVS
13
Labour income taxation
14
15
100
10
20
30
40
50
60
70
80
90
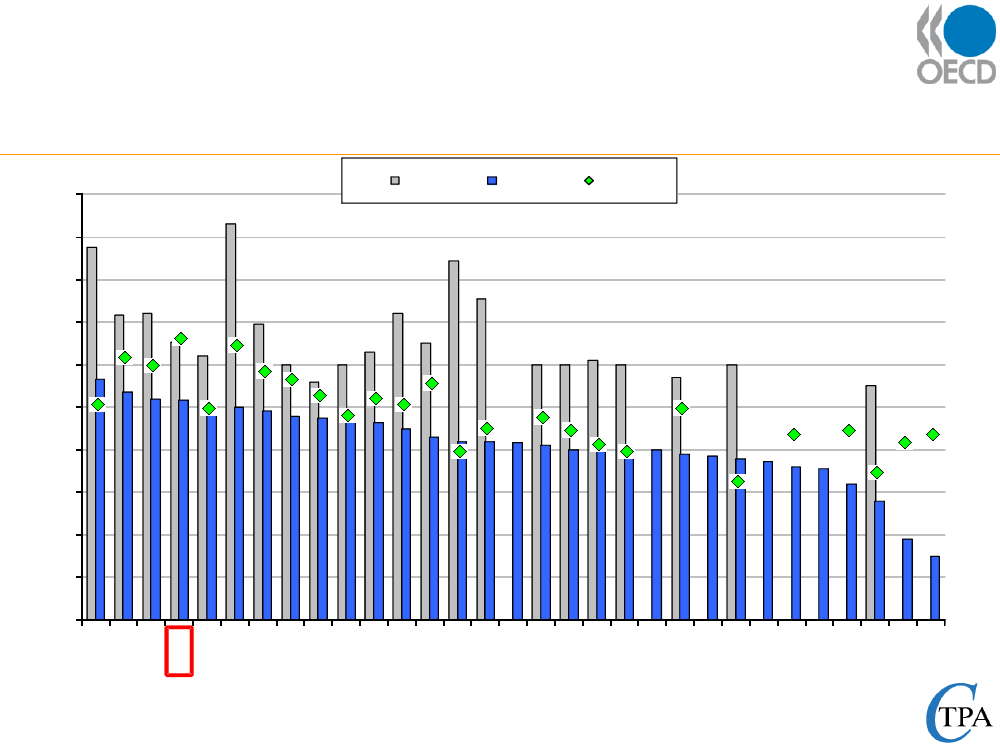
0EWSLEBDLNKNDTUANPJNIFARFREGSUANACATIAPSTRPSU20091981
IWSLRICRGRONKULHCXULROKLZNLCINUHRUTLOPXEMKVSEZC
Top statutory personal income tax rates1994
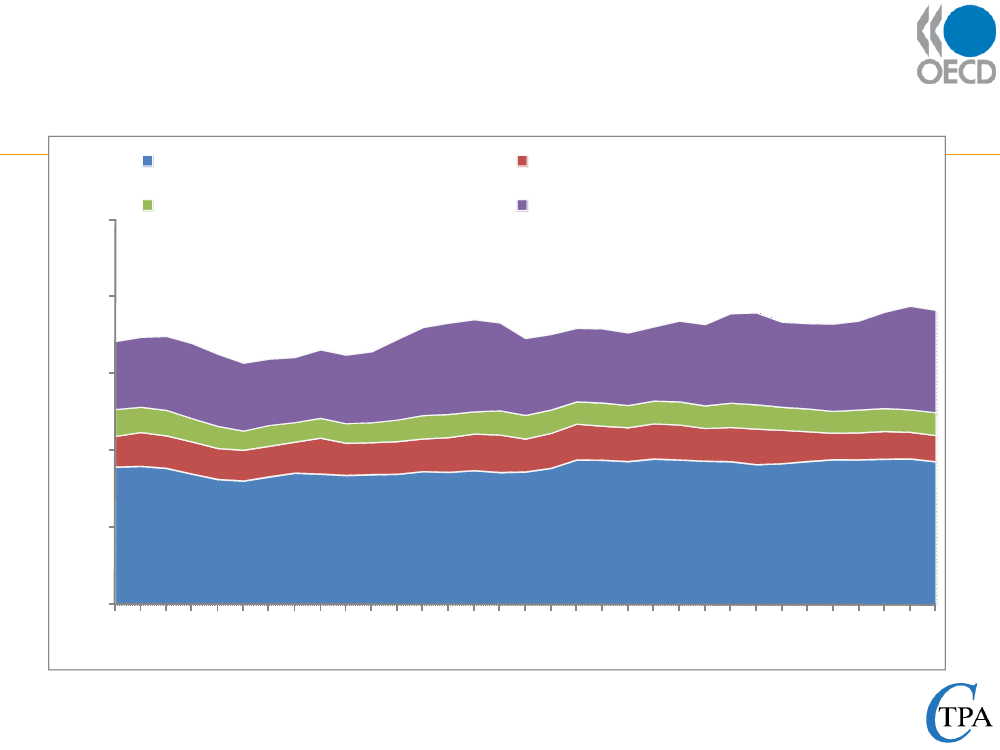
Average tax wedge for single workers without childrenin Denmark (income from 50-250% of the AW) in 200970%60%50%40%30%20%10%0%050607080901010210310410510610710810910201202032042052
70%60%50%40%30%20%10%0%
em ployer SSC as % of total labour costsaverage local incom e tax as % of total labour costsfam ily benefits as % of total labour costsnet personal average tax rate as % of gross wage earnings
em ployee SSC as % of total labour costsaverage central incom e tax as % of total labour costsaverage tax wedge (sum of the com ponents)
16
Consumption taxes
17
VAT revenues (2007) and rates (2009)VAT revenue as % of total tax revenues (2007)VAT standard rate (2009)
302520151050KULCILRINIFATIIWSLZNLOPTRPDLNTUAEZCRUTARFXULAPSEWSXEMREGROKKNDSUAKVSNPJLEBCRGNUHRONNACSU
OECD average VAT revenue as % of totaltax revenue (net of US) in 2007: 18.6%
Source:18
Revenue Statistics (OECD)OECD Tax Database: www.oecd.org/ctp/taxdatabase
Property taxesrecurrent taxes on immovable property2.5%estate, inheritance and gift taxesrecurrent taxes on net wealthtaxes on financial and capital transactions
2.0%
1.5%
1.0%
0.5%
0.0%579167917918791791089189128913891489158916891789189189109191291391491591691791891910210202302402502602702
19
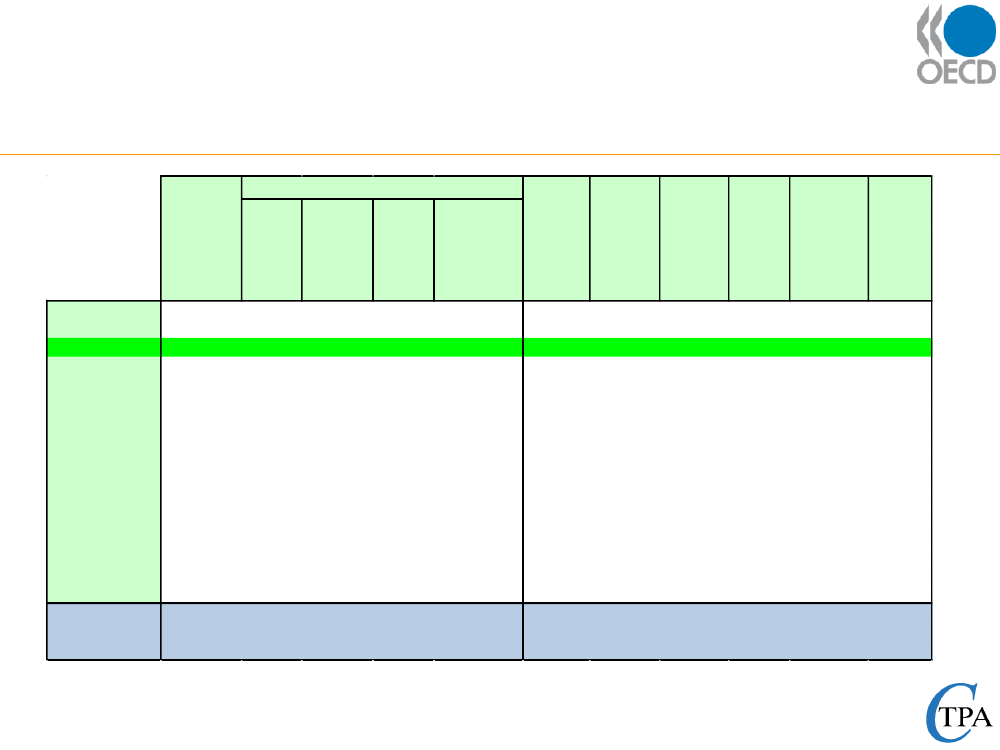
How does Denmark compare to otherOECD countries: overviewTopTop% OF TOTAL TAX REVENUESStatutory CorporateTAX / GDP Personal Corporate Social ConsumptionPersonal IncomeIncomeSecurityTaxTaxesIncome Tax RateTaxContrib.Tax Rate2008200720072007200720092010provisionalBelgiumCanadaDenmarkFinlandFranceGermanyIrelandItalyJapanNetherlandsNorwaySpainSwedenSwitzerlandUnited KingdomUnited StatesOECD averageG7 averageEU15 average
AverageEffectiveTaxCorporate W edgeTax Rate200526.428.4--20.725.431.510.926.031.725.124.226.120.925.123.929.0--28.0--200955.230.839.442.449.250.928.646.529.238.037.438.243.229.332.529.436.438.441.6
Top Rate StandardonVATDividendsRate20102009
44.332.248.342.843.136.428.343.228.3 (**)37.5 (**)42.133.047.129.435.726.935.8 (**)35.1 (**)39.7 (**)
29.337.451.730.317.025.128.425.619.620.422.119.830.935.330.138.125.327.625.5
8.211.07.49.06.86.110.98.816.88.726.012.47.910.69.411.010.810.09.0
31.014.42.027.737.036.615.430.036.436.220.832.626.123.318.423.425.228.028.2
25.223.633.630.124.729.336.125.218.029.928.425.526.622.629.216.630.923.829.5
53.746.451.649.147.847.541.044.950.052.040.043.056.541.750.0 (*)41.941.545.546.5
34.029.525.026.034.43 (#)30.212.527.539.5425.5 (#)28.030.026.321.228.0 (**)39.226.2 (#)32.6 (#)26.9 (#)
43.921.048.25.056.525.040.522.055.9 (#)19.648.619.048.421.536.620.045.65.044.125 (#)19.048.225.042.616.048.425.036.97.654.020.0(***)49.5-41.7 (#)17.648.3 (#)13.945.3 (#)19.9
20