Skatteudvalget 2009-10
SAU Alm.del Bilag 291
Offentligt
The climate changechallenge and fossil fuelsubsidies reformHelen MountfordClimate, Biodiversity & Development DivisionOECD Environment Directorate1
Presentation Outline•••••••The Copenhagen Accord pledges: what do they add up to? Howmuch will they cost? What are the potential revenues?The G20 fossil fuel subsidies initiativeIEA, OPEC, OECD & World Bank Joint Report on fossil fuelsubsidiesMeasuring fossil fuel subsidies: OECD & IEA analysis & thechallengesThe effects of fossil fuel subsidy removalLessons learned from subsidy reform effortsIEA & OECD further work2
3
CPH Accord targets & actionsDeclared targets and actionsAustralia & NZCanadaEU27 & EFTAAUS -5% to -25% from 2000;NZ -10% to - 20% from 1990-17% from 2005EU27, Lichtenstein, Switzerland -20% to -30%;Norway -30% to -40%; Iceland -30%;Monaco -30%; all from 1990-25% from 1990Ukraine -20%; Belarus -5% to -10%;Croatia -5%; all from 1990-15% to -25% from 1990-17% from 2005-36% to -39% from BAUCarbon intensity of -40% to -45% from 2005Carbon intensity of -20% to -25% from 2005Indonesia -26% from BAU;Israel -20% from BAUKorea -30% from BAU; Mexico -30% from BAU;many other pledges (incl. Costa Rica, Maldives, South Africa)…Model assumptions20% offsets.10% offsets.20% offsets.1
JapanNon-EU E EuropeRussiaUSBrazilChinaIndiaOil Exporters &Middle EastROW
20% offsets.20% offsets.lower bound = no offsets;upper bound = 20%.20% offsets.
1.Emissions from IEA and US-EPA; reductions are excluding LULUCF; offset assumptions in line withOECD (2009); many countries have specified pre-conditions for their targets.
4
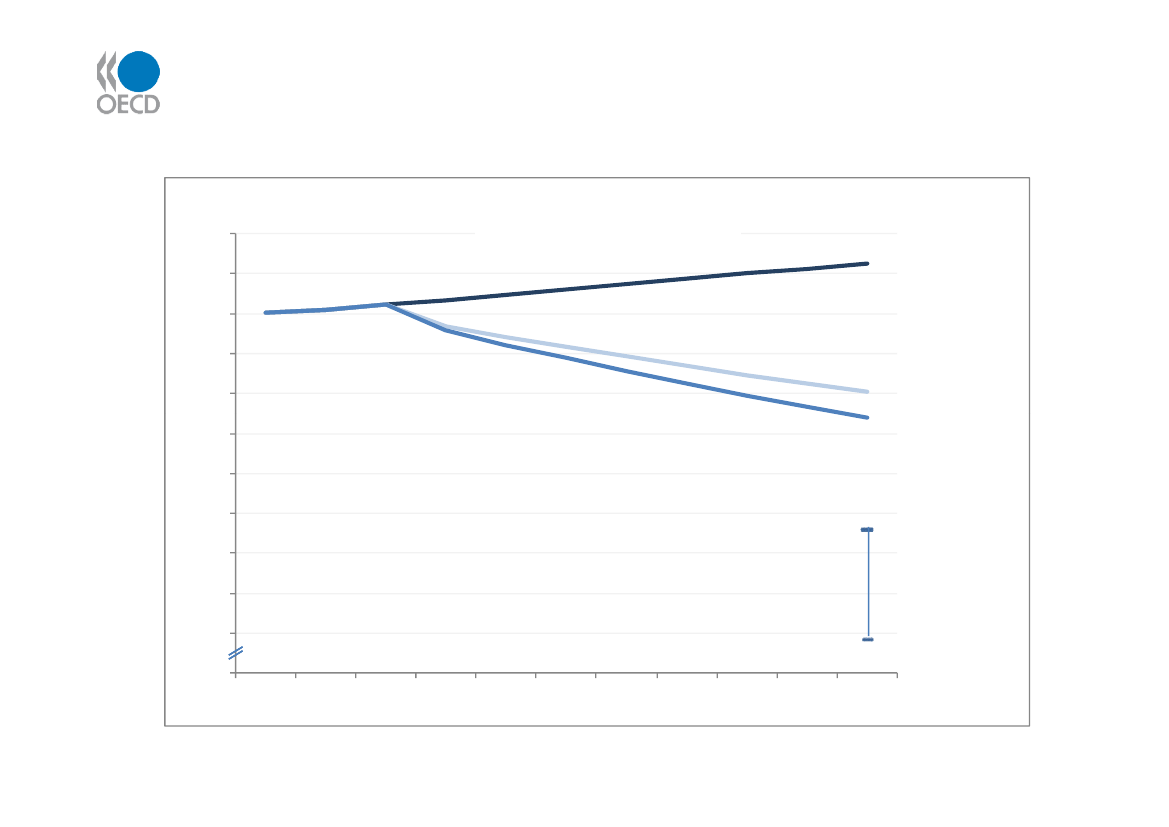
How do Annex I emission targets in theCopenhagen Accord add up?GHG emissions (GtCO2e)21201918171615141312110 -1020102011201220132014201520162017201820192020
Panel A: Annex IBaseline
Low & FragmentedHigh & Linked
Trajectory to 2oCaccording toIPCC(2007)
Low & Fragmented scenario : lower end of pledges; no linking; 20% offsets;High & Linked scenario: higher end of pledges; Annex I linking; 20% offsets
5
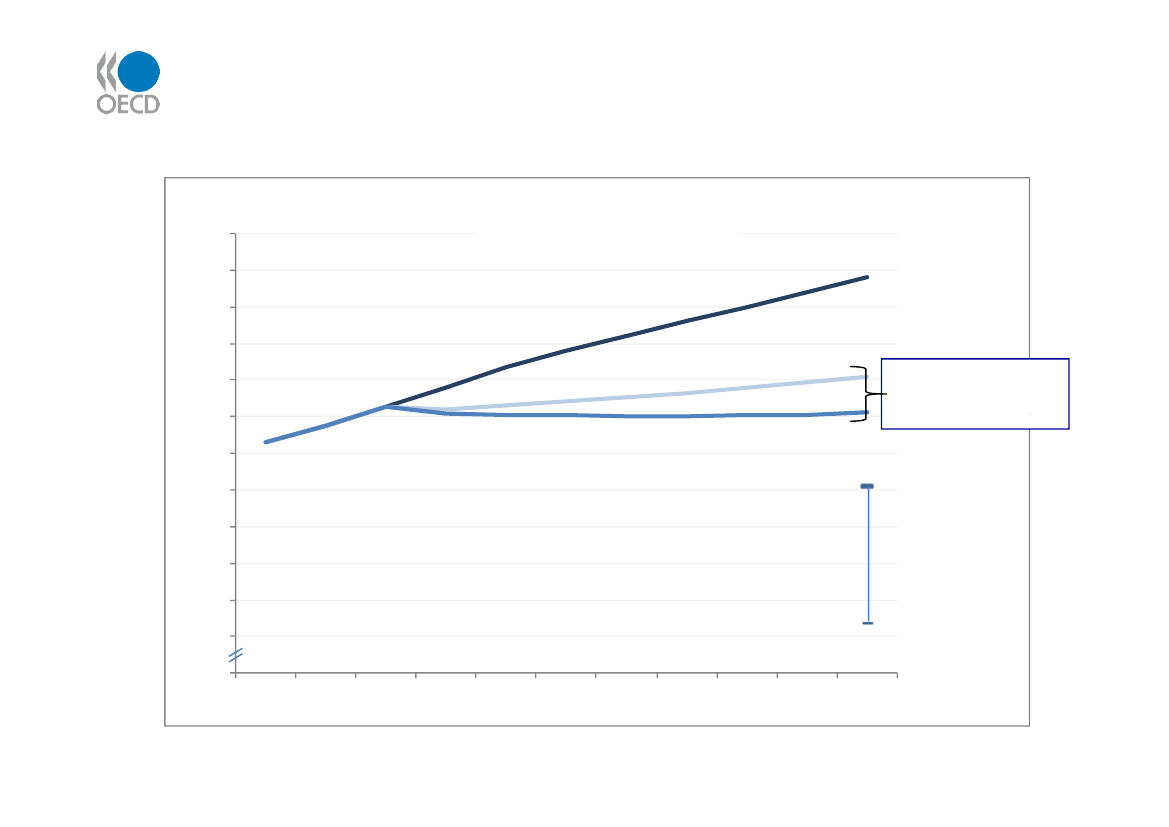
How do all targets and actions in theCopenhagen Accord add up globally?GHG emissions (GtCO2e)5452504846444240383634320 -3020102011201220132014201520162017201820192020
Panel C: WorldBaseline
Low & FragmentedConsistent with
about 3oCHigh & Linked
Trajectory to 2oCaccording toIPCC(2007)
Low & Fragmented scenario : lower end of pledges; no linking; 20% offsets;High & Linked scenario: higher end of pledges; Annex I linking; 20% offsets
6
Ambitious scenario (High & Linked):what costs & revenues?Emissions target(change in 2020 from 1990)GDP in 2020(change from baseline)-0.6%-0.3%-0.3%-0.1%-1.5%-1.9%-0.2%-1.9%-0.3%0.0%-0.9%-0.1%-0.3%-0.3%-0.3%
2020 revenues(if taxes/auctioned permits)1.9% of GDP1.3% of GDP0.9% of GDP0.6% of GDP6.0% of GDP7.4% of GDP1.0% of GDP9.9% of GDP0.3% of GDP0% of GDP1.8% of GDP0.3% of GDP1.1% of GDP0.9% of GDP1.0% of GDP
Australia & NZCanadaEU27 & EFTAJapanNon-EU E EuropeRussiaUSBrazilChinaIndiaOil ExportingROWAnnex Inon Annex IWorld
-11.5%3%-30%-25%-16.5%-25%-3.5%-39% from BAU-8.5% from BAU+36% from BAU-8.5% from BAU-6% from BAU-17%+42% from 2005(-7% from baseline)+13% from 2005(-14% from baseline)
Source:OECD, 2010; Dellink et al.,OECD ENV Working Paper 22.
G20 Fossil Fuel Subsidy InitiativeG20 Leaders’ Summit – September 2009, Pittsburgh•••Agreed to “rationalizeand phase out over the medium term inefficient fossilfuel subsidies that encourage wasteful consumption”.Asked theirEnergy and Finance Ministersto “develop implementationstrategies and timeframes, and report back to Leaders at the next Summit” .Requested that “relevant institutions, such as theIEA, OPEC, OECD, and WorldBank,provide an analysis of the scope of energy subsidies and suggestions forthe implementation of this initiative and report back at the next summit.”
G20 Finance Ministers – November, St Andrews; April, DC; June, Busan••G20 Energy Expert Group to work on implementation strategies & timeframes.Asked that the 4 tasked IOs produce ajoint report.
G20 Leaders’ Summit – 26-27 June 2010, Toronto••Received reports from G20 Energy Experts Group & Joint Report from the 4 IOsPara 42. Welcomed reports and “Wealso encourage continued and fullimplementation of country-specific strategies and will continue to review7progress towards this commitment at upcoming summits.”
Joint report by OECD, IEA,World Bank, OPECI.II.IntroductionIdentifying and quantifying subsidiesa.b.c.Taxonomy of energy subsidiesSummary of measurement approaches and challengesReview of subsidy estimates
III. Reforming and phasing-out energy subsidiesa.b.Impact of subsidies and reform on sustainable developmentModelling the reform of energy subsidies
IV. Suggestions for implementationa.b.c.d.Political economy of energy subsidies reformPolicy tools to address distributional issuesOperational initiatives to reach the poorLessons learned from country experiences8
Statutory or Formal Incidence (to whom and what a transfer is first given)Direct consumptionUnit cost of Household orconsumptionenterpriseincomeOutputreturnsEnterpriseincomeCost ofintermediateinputsCosts ofProductionFactors1
Directtransfer offunds
Unit subsidy
Government-Per-tonnesubsidized life- subsidy forline electricity metallurgicalratecoal
Capital grantOperatingInput subsidylinked togrant to coal-for electricity acquisition ofminingused in mining mining-relatedcompanycapitalGovernmentlimit onproducerliability forminingaccidentsCreditguaranteeSecuritylinked toguarantee foracquisition ofcoal trainsmining-relatedcapital
Transfer Mechanism (how a transfer is created)
Transfer ofrisk togovernment
GovernmentMeans-testedPrice-triggeredexpenditurecold-weathersubsidyon coal buffergrantstock
Tax deductionrelated toReduction inProductionReduced rateExcise-taxenergyexcise tax ontax credit for of income taxTax revenueconcession onpurchasesfuel used bymaking liquid on coal-miningforegonefuelthat exceedminingfuels from coal companiesgiven share ofmachinesincomeUnder-pricingUnder-pricingReducedof a good,of access to aOtherroyaltygovernmentnaturalgovernmentpayments onservice orresourcerevenueaccess toaccess to aharvested byforegonecoal depositsnaturalfinal consumerresourceInducedtransfersRegulatedprice; crosssubsidyMandated life-line electricityrate
Tax credit forinvestment inminingequipment
Under-pricingof access togovernmentland used forstorage ofcoal
Import tariff orExportMonopolyWageexportrestriction onconcession tocontrols onsubsidy ondomesticallycoal companymining labour9coalproduced coal
1. Labour, land, capital, knowledge.
Examples of OECD taxexpenditures: consumption•Low tax rates or exemptions on diesel for agriculture & fisheries:US$ 8 billion for agriculture sector in OECD countriesUS$ 1.1 billion for fisheries sector in OECD countries
•
Reduced VAT rates and VAT exemptions, eg for heating fuels:e.g. Italy, Korea, UK
•
Automatic tax cuts and subsidies when fuel prices rise:in Mexico – with low oil prices, leads to net revenues, but with high oilprices in 2008 led to subsidies amounting to 1.8% of GDP.
•
Tax exemptions to fuel used by public sector:e.g. France had excise duty exemptions for natural gas used for heatingby public agencies and fuel used by military, but recently been stopped.
10
Examples of OECD taxexpenditures: production•Tax deductions for depletion of oil and gas fields and coal deposits:e.g. producers in US can deduct a fixed percentage of gross revenue;amounted to US$ 0.6 billion. Termination proposed in 2011 budget.
•
Accelerated tax depreciation allowances for capital equipment:depending on the royalty and tax regime for fossil fuel production, taxdeduction of depreciation at a faster rate than that at which equipmentbecomes economically obsolete can represent an indirect subsidy.e.g. for oil sands in Canada annual cost of tax advantage is 0.02% of GDP.Phased-out by 2015.
•
Tax exemption for fossil fuel producers’ own energy use:common in most OECD countries for coal mining, oil extraction, refineries, etc.e.g. in Germany estimated to be worth 0.01% of GDP.11
Some challenges with measuringfossil fuel subsidies…Subsidies provided through market transfers:• Identifying domestic prices• Identifying (and agreeing on) appropriate reference prices–––Adjusting for quality differencesAdjusting for transport marginsAdjusting for taxes
••
Accounting for theft and under-paymentsObtaining information on affected volumes
Direct financial transfers and risk transfers:• Identifying programmes and actual expenditure• Estimating risk-related transfers• Establishing market value of transfers for use of government assets• Allocating transfers made to upstream activities to downstream products(e.g., oil products and natural gas)12
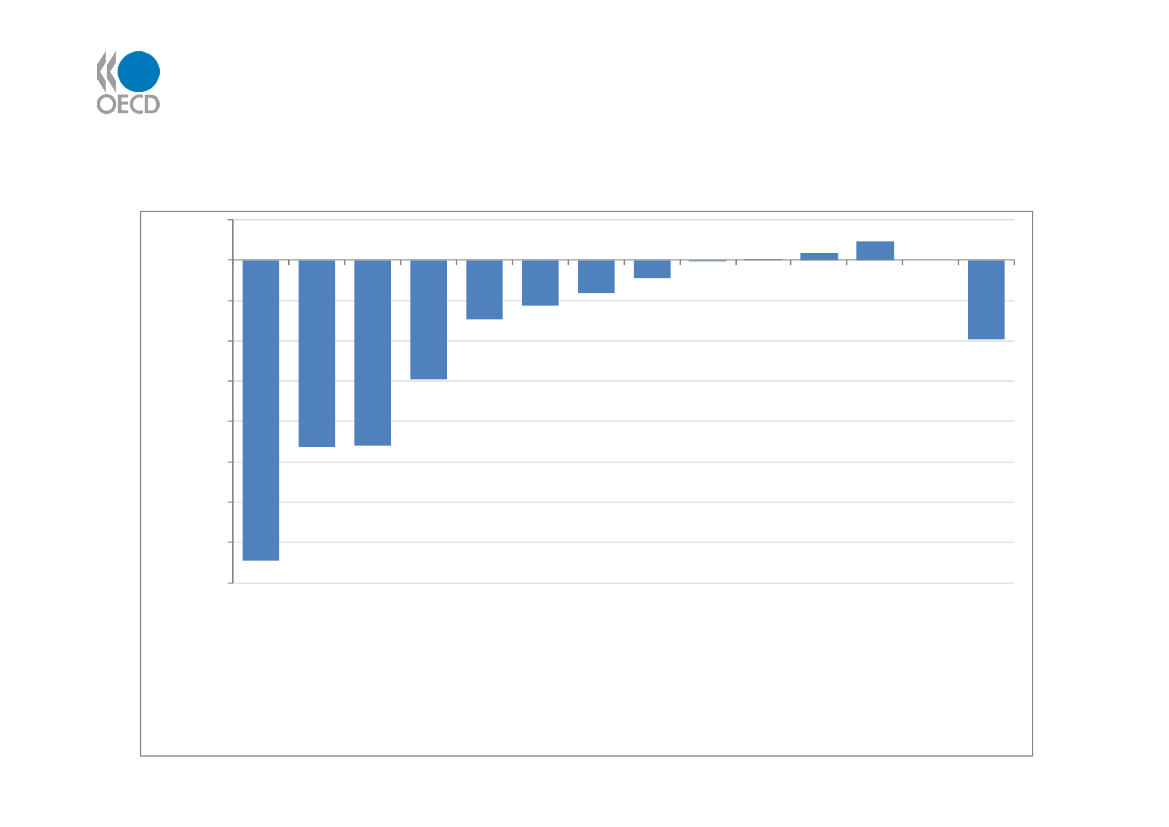
Environmental impact of fossil fuelsubsidies removal% change in GHG emissions w.r.t BAU:Gradual (to 2020) phasing-out of ff subsidiesin 37 countries combined with caps on emissions in developed countries & Brazil5%0%-5%
2050
%deviationfrombaseline
-10%-15%-20%-25%-30%-35%-40%
Oil-exporting
Australia and
NewZealand
EU27 plus EFTA
Rest of the World
Japan
United States
Canada
Russia
Non-EU East Europe (1)
countries (2)
World
India
China
Brazil
Source:OECD ENV-Linkages, based on IEA subsidies data.
13
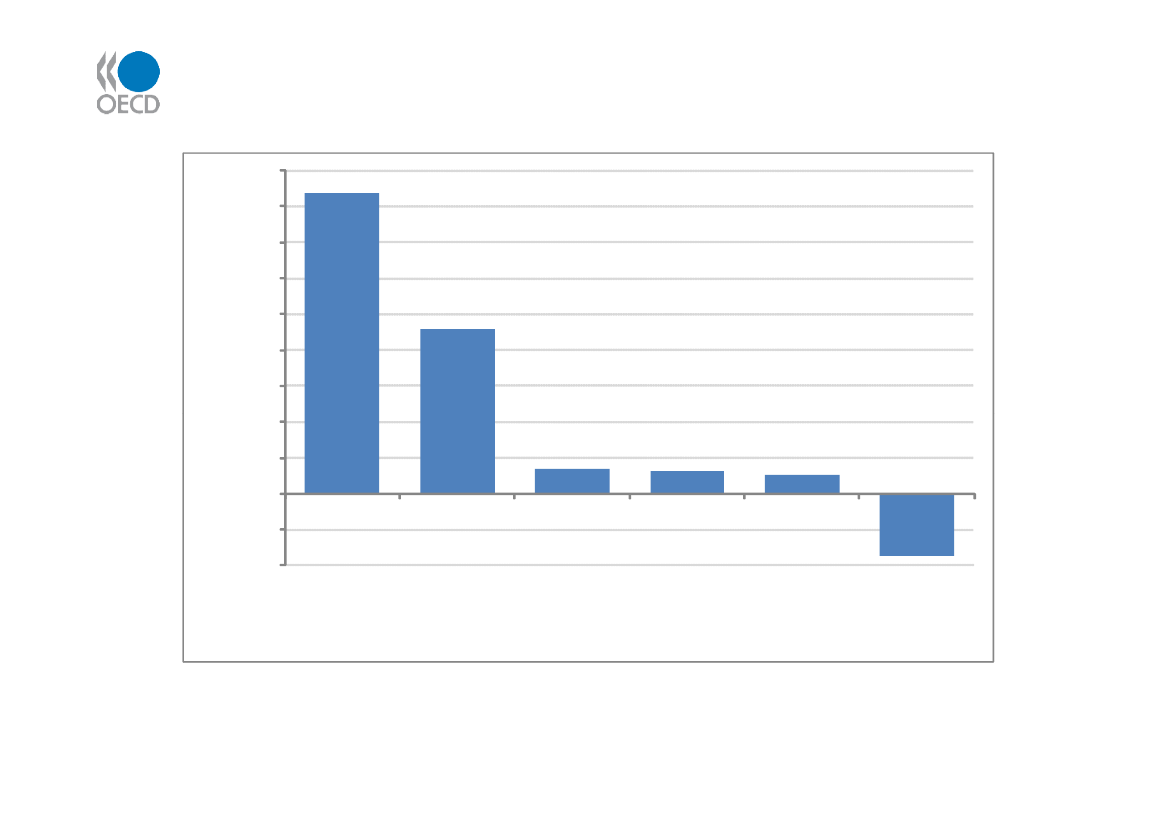
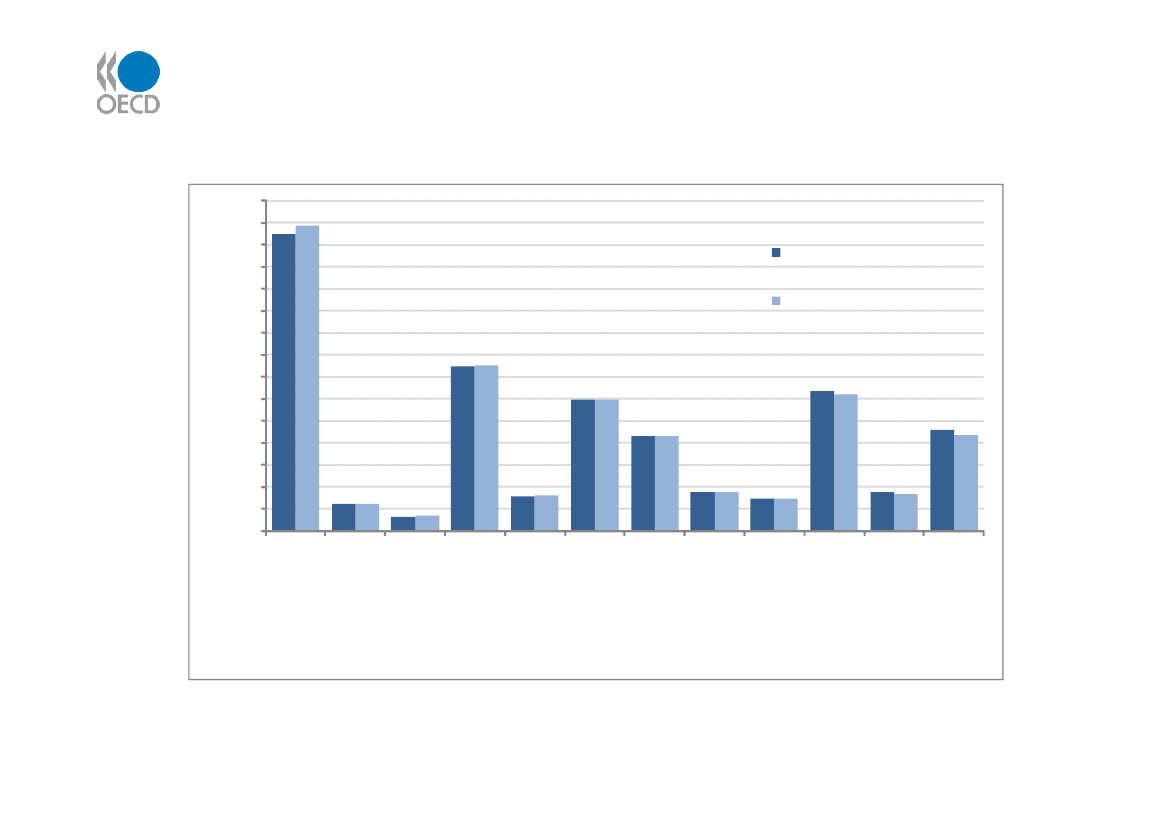
Unilateral removals of energy subsidiesbring real income gainsto theImpact on real income of unilateral fossil fuel subsidy removal, relative…baseline in 2050% deviation relative to the baseline
4.5%4.0%3.5%3.0%2.5%2.0%1.5%1.0%0.5%0.0%-0.5%-1.0%Oil-exportingcountries (2)India
2050
China
Russia
Rest of theWorld
Non-EUEasternEuropeancountries (1)
1.This region includes Croatia and the Rest of Soviet Union (integrated by the following countries: Armenia, Azerbaijan,Belarus, Georgia, Kazakhstan, Kyrgyzstan, Moldova, Tajikistan, Turkmenistan, Ukraine, Uzbekistan) according to thedata aggregation in the GTAP database.2. The region includes the Middle East, Algeria-Lybia-Egypt, Indonesia, and Venezuela.Source: OECD ENV-Linkages model based on IEA data.
14
…with multilateral reform (central scenario) there may belosses, but small compared with projected GDP growth(% deviation relative to 2005 levels)1500%1400%1300%
2.6%
2050Baseline
Projected GDP growth
1200%1100%1000%900%800%700%600%500%400%300%200%100%0%
Multilateral subsidy removaland cap and trade in OECD
0.6%0.2%0.2%0.2%0.7%JapanBrazilChinaRest of the WorldUnited StatesAustralia andNew Zealand
-1.8%-4.7%
0.8%
0.0%
-0.7%
-4.4%
India
Oil-exportingcountries (2)
Canada
Russia
1.This region includes Croatia and the Rest of Soviet Union (integrated by the following countries: Armenia, Azerbaijan, Belarus, Georgia,Kazakhstan, Kyrgyzstan, Moldova, Tajikistan, Turkmenistan, Ukraine, Uzbekistan) according to the data aggregation in the GTAP database.2. The region includes the Middle East, Algeria-Lybia-Egypt, Indonesia, and Venezuela.Source: OECD ENV-Linkages model based on IEA data.
Non-EU EasternEuropean countries(1)
EU27 plus EFTA
15
Energy subsidy reforms have notbeen extensive•There is a limited pool of successful energy subsidy reformsfrom which to draw insights for future reform efforts:– Primarily focused on hard coal mining sector
•Case studies have examined lessons from the reform of:– Poland’s reduced VAT for energy products– Direct subsidies for petroleum products and for electricity prices in Indonesia– Caps on prices for electricity and petroleum products in Malaysia– Consumer price subsidy for natural gas in the US– Partial exemptions from ecotaxes in Germany– Subsidies to coal mining in Germany, Poland, UK, Spain and France
16
Some key insights from subsidyreform experience•Need good quality information on subsidies, their economicand environmental impacts, and distributional outcomes:– Transparency is essential to build support for reform
•Build the arguments for reform, and challenge those against it:– Competitiveness, employment, social equity, energy security impacts
•Build the case for reform:– Strong leadership is needed, broad support across government(finance, industry, energy, environment), engage the opposition
•Well-targeted, time-limited compensation is a key ingredient:– To help address distributional concerns– “Buy” support for reform and reduce opposition
•Package subsidy reform within broader structural reforms:– Flanking policies can address underlying distortions incompetition, pricing, property rights, externalities, etc.17
Further OECD work:•Framework for identifying subsidies according to their incidence& transfer mechanism (based on PSE-CSE approach in AGR).– As described in OECD Background Paper to the Joint Report.– Expert meeting planned for Nov 2010 to make further progress.
•Regularly collecting data on subsidies and tax expenditures tofossil fuel use and production in OECD countries.– To ensure transparency and work towards more harmonised subsidies data.– Expert meeting planned for Nov 2010 to make further progress.
•Country-tailored advice on subsidy reform via country reviews.– 2010 OECD Economic Surveys of Indonesia & South Africa include sections onfossil fuel subsidy reform.– Some OECD Environmental Performance Reviews also discuss.
•Other work proposed in 2011-2012 PWB:– Further modelling-based analysis of the impacts of subsidy reform onGDP, trade, GHG impacts, working together with IEA.– Continued analysis of the political economy of making subsidy reform happen.
www.oecd.org/g20/fossilfuelsubsidies
18