Miljø- og Planlægningsudvalget 2009-10
MPU Alm.del Bilag 417
Offentligt
Emissions and external cost calculationsfor small cargo ships (1000 – 6000 DWT)compared with cargo transport by truck(Euro Norm 4 truck carrying 25 tons cargo)
Technical ReportHans Otto Kristensen19 February 2010
Emissions and external cost calculationsfor small cargo ships (1000 – 6000 DWT)compared with cargo transport by truck(Euro Norm 4 truck carrying 25 tons cargo)
Carried out byHans Otto KristensenDepartment of Mechanical EngineeringTechnical University of Denmark([email protected])
19 February 2010
Table of content
Page
IntroductionCalculation modelShip particularsTruck dataExternal costsSensitivity analysis of external costsConclusions
3334567
Appendix AAppendix BAppendix CAppendix DAppendix EAppendix FAppendix G
3 % S – IMO Tier I NOx level – Normal speed1 % S – IMO Tier I NOx level – Normal speed0.1 % S – IMO Tier I NOx level – Normal speed0.1 % S – IMO Tier I NOx level – 10 % speed reductionShip particulars from computer programTruck emission dataExternal cost factors
2
IntroductionThere is more and more attention on the environmental impact from ship transportcompared with other transport means such as trucks. Especially in the so-called short seashipping segment it is important to know the environmental impact from ships comparedwith transport by trucks as these are often used as alternative transport means – or usedin conjunction with ship transport (intermodal transport chains).In this report are shown results of emission calculations for ships and trucks andfurthermore the external costs due to these two different transport modes are given, togive a more holistic view on the two ransport forms.
Calculation modelA generic calculation model developed by the Department of Mechanical Engineering afThe Technical University of Denmark (DTU) has been used for the calculations includingexhaust gas emissions and the different types of external costs – both for ship and trucktransportation. Based on the capacity of the ship, the DTU program calculates the maindimensions and other important data for the ship, such that the propulsion and auxiliarypower requirement can be calculated. By specifying the sulphur content (in weight percent) in the fuel oil and NOx requirements (Tier I, II and III) which shall be fulfilled theprogram is able to calculate the quantity of the different exhaust gas emissions given ingram per ton payload per km or nautical mile for the ship transport.In a similar way - and using the same units - the energy demand and the exhaust gasemissions are calculated for transport by truck simply by specifying the cargo weight andwhich EURO norm the truck has to fulfil.Based on the calculated exhaust gas emissions the external costs due to the emissionsare calculated using an external cost model developed by DTU‘Transportøkomiskeenhedspriser, Version 1.2 – April 2009’.The energy demand and emissions for trucks are calculated by using values from theTEMA 2000 emission modelfrom the Danish Ministry of Transport) supplemented andupdated with emission data from the National Enviromental Research Institute –University of Aarhus Denmark. (Danmarks Miljøundersøgelser). It is possible to specify 5different EURO Norms, 2 (1996), 3 (2001), 4 (2006), 5 (2011) and 6 (2015) for trucks.
Ship particulars4 different ship sizes have been analysed having a deadweight of 1000, 2000, 4000 and6000 tons respectively. The particulars for these 4 ships are tabled in Appendix E, showingthe output pages from the computer program. It is assumed that the payload todeadweight ratio is 0.90 i.e. the weight of the cargo is 90 % of the deadweight and byspecifying the payload to deadweight ratio of 0.90, the model calculations are customised
3
to be valid for bulk cargo. For container cargo ships the payload to deadweight arenormally lower due to the need for ballast water, some times as low as 0.65.The calculations have been carried out for 4 scenarios as follows:A. 3 % sulphur content in the fuel oil, engines fulfilling IMO Tier I NOx level and normalservice speedB. 1 % sulphur content in the fuel oil, engines fulfilling IMO Tier I NOx level and normalservice speedC. 0.1 % sulphur content in the fuel oil, engines fulfilling IMO Tier I NOx level andnormal service speedD. 0.1 % sulphur content in the fuel oil, engines fulfilling IMO Tier I NOx level and 10 %speed reduction compared to normal service speedThe change of sulphur content alters the SOx and particulate emissions and the change ofexternal costs due to these two emission products have been investigated and the resultsare shown in fig. 2.
Truck dataAs mentioned earlier the energy demand and emission calculations for trucks are anintegrated part of the total emission and external cost program for ships and trucksdeveloped by DTU. The truck data have partly been collected from the TEMA 2000emission model and have been supplemented with latest updated emission data from theNational Enviromental Research Institute – University of Aarhus Denmark. (DanmarksMiljøundersøgelser). The data from TEMA 2000 on energy demand and oil consumptionhave been compared with new truck data and it has been judged that the TEMA 2000 datastill represents modern truck engine technology with respect to energy demand andthereby oil consumption.In the present analysis exhaust gas emission comparisons have been carried out for atruck fulfilling EURO Norm 4, which has been valid from 2006. The cargo load on the truckis 25 tons which is found representative for a typical ‘standard truck load’. The truck dataare given in Appendix F.The results are summarized in fig. 1, showing the CO2emissions per transport unit for twodifferent speed levels for the cargo ships compared with truck transport. It is seen that thelevel of CO2emissions for truck transport is approximately 3 to 3.5 times higher than forship transport at normal speed and approximately 3.5 to 4.5 higher with a speed reductionof 10 % compared to normal speed.
4
50
CO2emissions (g/t payload/km)
40General cargo ship at normal speed30General cargo ship at 10 % speed reductionEURO Norm 4 truck carrying 25 tons cargo20
10
01000
2000
3000
4000
5000
6000
Deadwight [t]
Fig. 1 CO2emissions for ship transport versus truck transportExternal costsThe CO2emissions per transport unit is an environmental indicator which can be used forcomparison between two transport modes as described in this report. However otheremission products are also very important, such as NOx, SOx and particulates - the lastproduct strongly related to the sulphur content in the oil used.To get a total emission overview for comparison purposes it is advisable to calculate thetotal external costs to the society due to all the exhaust gas emissions – and finally tocombine these calculations with the remaining external cost imposed by the two differenttransport modes. These additional costs are due to noise, congestion, accidents,infrastructure and climate change.The external cost factors for all the above mentioned impacts used the computer programare listed in Appendix G according to DTU‘Transportøkomiske enhedspriser, Version 1.2– April 2009’and the results of the calculations are shown in fig. 2 for the differentemission scenarios. It is seen that the influence of the sulphur content is pronounced suchthat the external cost ratio between truck transport and ship transport changes fromapproximately 4 with 3 % sulphur to approximately 8 for 1 % sulphur and 9 to 11 with 0.1% sulphur and even 13 to 15 if the speed at the same time is reduced 10 %.
5
20Total external costs (EURO/t payload per 1000 km)
153 % S - IMO Tier I NOx - Normal speed1 % S - IMO Tier I NOx - Normal speed100.1 % S - IMO Tier I NOx - Normal speed0.1 % S - IMO Tier I NOx - 10 % speed reductionEURO Norm 4 truck carrying 25 tons cargo5
01000
2000
3000
4000
5000
6000
Deadweight [t]
.Fig. 2 Total external costs for different ship scenarios and for truck transport
Sensitivity analysis of external costsThe total external costs in fig. 2 are calculated on basis of mean cost values. To see therobustness of the calculations/comparisons, it is recommended to carry out a sensitivityanalysis for the external cost calculations, using a low cost and a high cost level accordingto the methodology used in the external cost model from DTU:‘Transportøkomiskeenhedspriser, Version 1.2 – April 2009’.The sensitivity analysis has been carried out for the case with 1 % sulphur, Tier I NOxlevel and normal service speed, and the results of this analysis are shown in fig. 3, whichshow that the ratio between total external costs for truck transport and ship transportchanges from approximately 8 to 4.5 and 5.5 with the high and low costs levelrespectively. But the total external costs due to ship transport are still clearly lower than fortruck transport.
6
9Low cost levelMean cost levelHigh cost level6
Total ext. cost ratio (truck/ship)
3Ratio of total external costs for trucktransport compared with ship transport1 % S - Tier I NOX - normal speed01000
2000
3000
4000
5000
6000
Deadweight [t]
Fig. 3 Results of sensitivity analysis of external cost calculations
ConclusionsBased on a combined emission and external cost analysis for transportation with generalcargo ships in the range from 1000 tons deadweight to 6000 tons deadweight comparedwith cargo transportation with trucks carrying 25 tons cargo, following conclusions can bemade:1. CO2emissions per transport unit (ton cargo x km) for truck transport areapproximately 3 to 3.5 times higher than for ship transport at normal speed andapproximately 3.5 to 4.5 at a speed reduction of 10 % compared to normal servicespeed.2. The influence of the sulphur content on the total external costs per transport unit ispronounced. The external cost ratio between truck transport and ship transportchanges from approximately 4 when using oil with 3 % sulphur content toapproximately 8 when using oil with 1 % sulphur and further to approximately 10with only 0.1 % sulphur and even further to approximately 13 if the speedadditionally is reduced by 10 %.
7
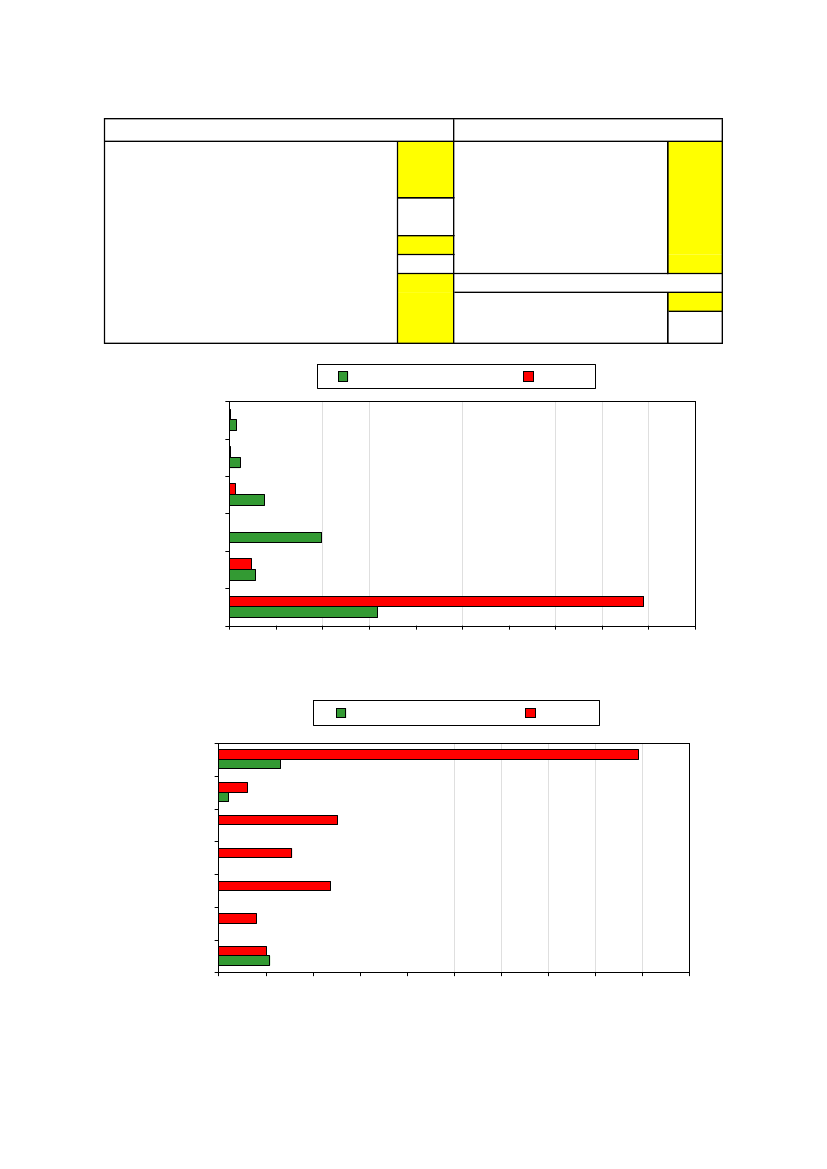
Appendix A3 % S – IMO Tier I NOx level – Normal speed
8
Ship dataDesign deaweight (t)Payload/deadweight at design draught (%)Capacity utilization (pct.)Design payload (t)Normal speed (knots)Speed reduction (pct.)Actual ship speed (knots)Suphur content of oil (%)NOx emissions (IMO TIER 1, 2 or 3)Slow speed (1) or medium speed main engine (2)Sailing percentage in harbour conditions1000901009009,709,73,0122
Truck dataNumber of containers per truckWeight per container (t/TEU)Length of truck - total (m)EURO norm (2, 3, 4, 5 or 6)Suphur content of oil (%)Driving distance (km)Driving percentage in city area212,51840,001400525,5017,8
External cost level1 = Low, 2 = Mean, 3 = HighShip (EURO/t payload/1000 km)Truck (EURO/t truck load/1000 km)
General cargo ship100 x Particulates100 x HC100 x CO100 x SOx10 x NOxCO2051015202530
Truck
35
40
45
50
Emissions [g/t payload/km]
General cargo shipTotal ext. costsClimate changeInfrastructureCongestionAccidentsNoiseEmissions024681012
Truck
14
16
18
20
External costs [EURO/t payload/1000 km]
9
Emissions (g/t payload/km)ShipCO210 x NOx100 x SOx100 x CO100 x HC100 x Particulates15,92,8429,833,791,184,03TruckCO210 x NOx100 x SOx100 x CO100 x HC100 x Particulates44,52,430,030,70,100,14
External costs (EURO/t payload/1000 km)ShipEmissionsNoiseAccidentsCongestionInfrastructureClimate changeTotal ext. costs5,0500000,455,50TruckEmissionsNoiseAccidentsCongestionInfrastructureClimate changeTotal ext. costs2,031,614,783,125,051,2417,8
External costs (EURO/t payload/1000 km)ShipCO2NOxSOxCOHCParticulatesTotalTruckCO20,470,74NOx1,591 SOx0,00001 CO0,008 HC2,24Particulates5,05Total1,310,640,00150,000000,0010,092,03
10
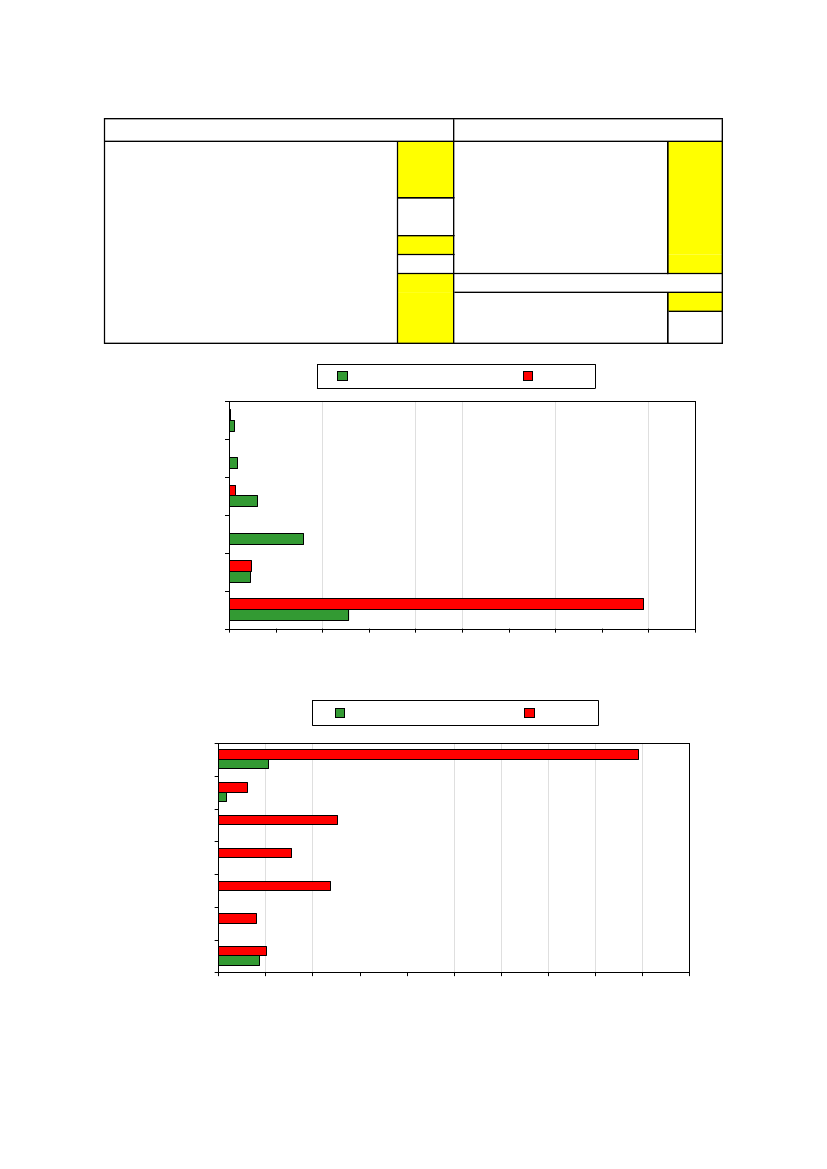
Ship dataDesign deaweight (t)Payload/deadweight at design draught (%)Capacity utilization (pct.)Design payload (t)Normal speed (knots)Speed reduction (pct.)Actual ship speed (knots)Suphur content of oil (%)NOx emissions (IMO TIER 1, 2 or 3)Slow speed (1) or medium speed main engine (2)Sailing percentage in harbour conditions200090100180010,3010,33,0122
Truck dataNumber of containers per truckWeight per container (t/TEU)Length of truck - total (m)EURO norm (2, 3, 4, 5 or 6)Suphur content of oil (%)Driving distance (km)Driving percentage in city area212,51840,001400524,4417,8
External cost level1 = Low, 2 = Mean, 3 = HighShip (EURO/t payload/1000 km)Truck (EURO/t truck load/1000 km)
General cargo ship100 x Particulates100 x HC100 x CO100 x SOx10 x NOxCO2051015202530
Truck
35
40
45
50
Emissions [g/t payload/km]
General cargo shipTotal ext. costsClimate changeInfrastructureCongestionAccidentsNoiseEmissions024681012
Truck
14
16
18
20
External costs [EURO/t payload/1000 km]
11
Emissions (g/t payload/km)ShipCO210 x NOx100 x SOx100 x CO100 x HC100 x Particulates12,92,2924,073,060,963,25TruckCO210 x NOx100 x SOx100 x CO100 x HC100 x Particulates44,52,430,030,70,100,14
External costs (EURO/t payload/1000 km)ShipEmissionsNoiseAccidentsCongestionInfrastructureClimate changeTotal ext. costs4,0800000,364,44TruckEmissionsNoiseAccidentsCongestionInfrastructureClimate changeTotal ext. costs2,031,614,783,125,051,2417,8
External costs (EURO/t payload/1000 km)ShipCO2NOxSOxCOHCParticulatesTotalTruckCO20,380,60NOx1,284 SOx0,00001 CO0,007 HC1,81Particulates4,08Total1,310,640,00150,000000,0010,092,03
12
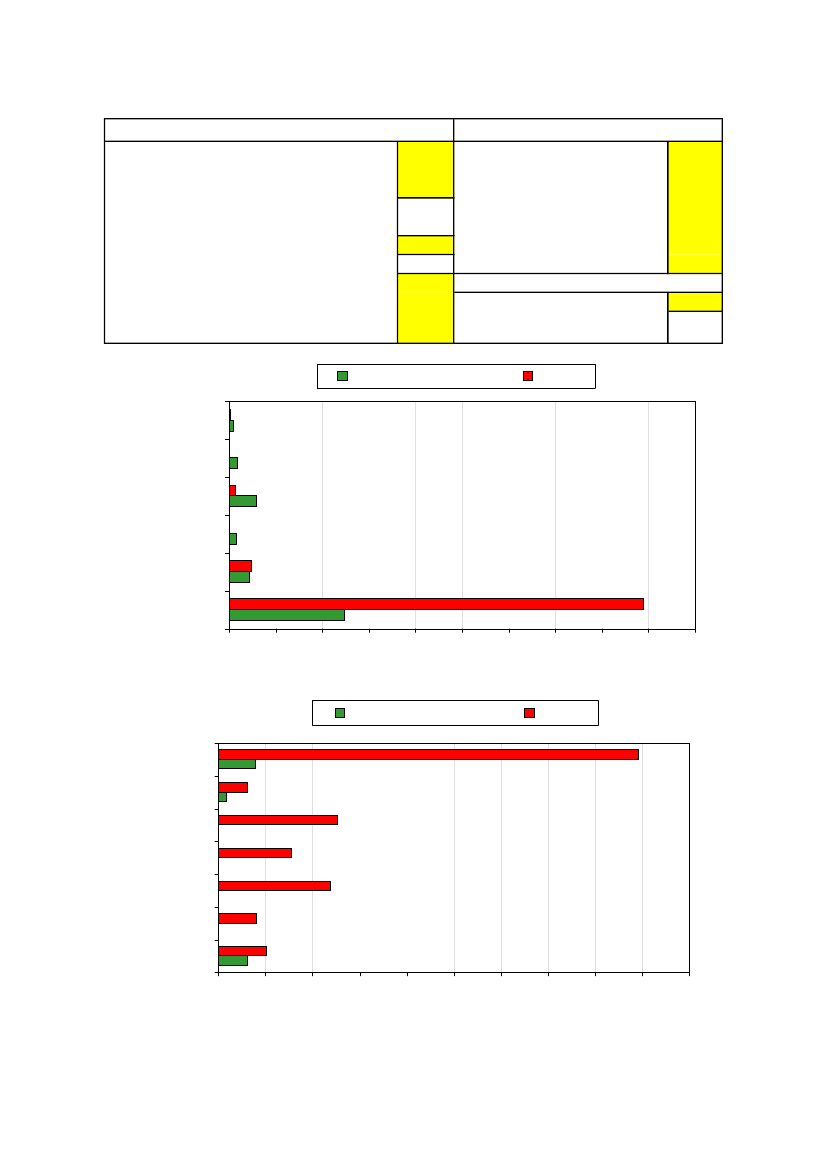
Ship dataDesign deaweight (t)Payload/deadweight at design draught (%)Capacity utilization (pct.)Design payload (t)Normal speed (knots)Speed reduction (pct.)Actual ship speed (knots)Suphur content of oil (%)NOx emissions (IMO TIER 1, 2 or 3)Slow speed (1) or medium speed main engine (2)Sailing percentage in harbour conditions400090100360011,7011,73,0122
Truck dataNumber of containers per truckWeight per container (t/TEU)Length of truck - total (m)EURO norm (2, 3, 4, 5 or 6)Suphur content of oil (%)Driving distance (km)Driving percentage in city area212,51840,001400524,2717,8
External cost level1 = Low, 2 = Mean, 3 = HighShip (EURO/t payload/1000 km)Truck (EURO/t truck load/1000 km)
General cargo ship100 x Particulates100 x HC100 x CO100 x SOx10 x NOxCO2051015202530
Truck
35
40
45
50
Emissions [g/t payload/km]
General cargo shipTotal ext. costsClimate changeInfrastructureCongestionAccidentsNoiseEmissions024681012
Truck
14
16
18
20
External costs [EURO/t payload/1000 km]
13
Emissions (g/t payload/km)ShipCO210 x NOx100 x SOx100 x CO100 x HC100 x Particulates12,42,2123,172,940,923,13TruckCO210 x NOx100 x SOx100 x CO100 x HC100 x Particulates44,52,430,030,70,100,14
External costs (EURO/t payload/1000 km)ShipEmissionsNoiseAccidentsCongestionInfrastructureClimate changeTotal ext. costs3,9300000,354,27TruckEmissionsNoiseAccidentsCongestionInfrastructureClimate changeTotal ext. costs2,031,614,783,125,051,2417,8
External costs (EURO/t payload/1000 km)ShipCO2NOxSOxCOHCParticulatesTotalTruckCO20,360,58NOx1,236 SOx0,00001 CO0,006 HC1,74Particulates3,93Total1,310,640,00150,000000,0010,092,03
14
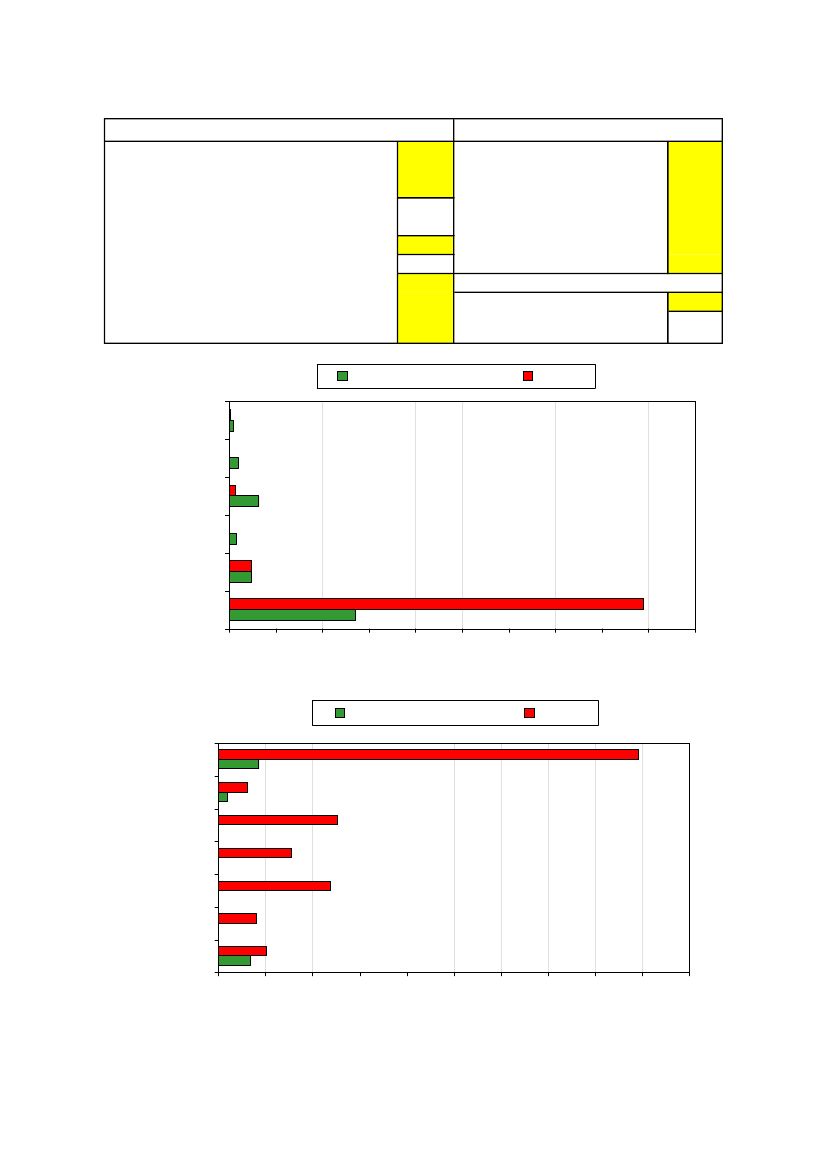
Ship dataDesign deaweight (t)Payload/deadweight at design draught (%)Capacity utilization (pct.)Design payload (t)Normal speed (knots)Speed reduction (pct.)Actual ship speed (knots)Suphur content of oil (%)NOx emissions (IMO TIER 1, 2 or 3)Slow speed (1) or medium speed main engine (2)Sailing percentage in harbour conditions600090100540013,6013,63,0122
Truck dataNumber of containers per truckWeight per container (t/TEU)Length of truck - total (m)EURO norm (2, 3, 4, 5 or 6)Suphur content of oil (%)Driving distance (km)Driving percentage in city area212,51840,001400524,6717,8
External cost level1 = Low, 2 = Mean, 3 = HighShip (EURO/t payload/1000 km)Truck (EURO/t truck load/1000 km)
General cargo ship100 x Particulates100 x HC100 x CO100 x SOx10 x NOxCO2051015202530
Truck
35
40
45
50
Emissions [g/t payload/km]
General cargo shipTotal ext. costsClimate changeInfrastructureCongestionAccidentsNoiseEmissions024681012
Truck
14
16
18
20
External costs [EURO/t payload/1000 km]
15
Emissions (g/t payload/km)ShipCO210 x NOx100 x SOx100 x CO100 x HC100 x Particulates13,52,4225,363,221,013,43TruckCO210 x NOx100 x SOx100 x CO100 x HC100 x Particulates44,52,430,030,70,100,14
External costs (EURO/t payload/1000 km)ShipEmissionsNoiseAccidentsCongestionInfrastructureClimate changeTotal ext. costs4,3000000,384,67TruckEmissionsNoiseAccidentsCongestionInfrastructureClimate changeTotal ext. costs2,031,614,783,125,051,2417,8
External costs (EURO/t payload/1000 km)ShipCO2NOxSOxCOHCParticulatesTotalTruckCO20,400,63NOx1,353 SOx0,00001 CO0,007 HC1,90Particulates4,30Total1,310,640,00150,000000,0010,092,03
16
Appendix B1 % S – IMO Tier I NOx level – Normal speed
17
Ship dataDesign deaweight (t)Payload/deadweight at design draught (%)Capacity utilization (pct.)Design payload (t)Normal speed (knots)Speed reduction (pct.)Actual ship speed (knots)Suphur content of oil (%)NOx emissions (IMO TIER 1, 2 or 3)Slow speed (1) or medium speed main engine (2)Sailing percentage in harbour conditions1000901009009,709,71,0122
Truck dataNumber of containers per truckWeight per container (t/TEU)Length of truck - total (m)EURO norm (2, 3, 4, 5 or 6)Suphur content of oil (%)Driving distance (km)Driving percentage in city area212,51840,001400522,6317,8
External cost level1 = Low, 2 = Mean, 3 = HighShip (EURO/t payload/1000 km)Truck (EURO/t truck load/1000 km)
General cargo ship100 x Particulates100 x HC100 x CO100 x SOx10 x NOxCO2051015202530
Truck
35
40
45
50
Emissions [g/t payload/km]
General cargo shipTotal ext. costsClimate changeInfrastructureCongestionAccidentsNoiseEmissions024681012
Truck
14
16
18
20
External costs [EURO/t payload/1000 km]
18
Emissions (g/t payload/km)ShipCO210 x NOx100 x SOx100 x CO100 x HC100 x Particulates15,92,849,943,791,180,79TruckCO210 x NOx100 x SOx100 x CO100 x HC100 x Particulates44,52,430,030,70,100,14
External costs (EURO/t payload/1000 km)ShipEmissionsNoiseAccidentsCongestionInfrastructureClimate changeTotal ext. costs2,1900000,452,63TruckEmissionsNoiseAccidentsCongestionInfrastructureClimate changeTotal ext. costs2,031,614,783,125,051,2417,8
External costs (EURO/t payload/1000 km)ShipCO2NOxSOxCOHCParticulatesTotalTruckCO20,470,74NOx0,530 SOx0,00001 CO0,008 HC0,44Particulates2,19Total1,310,640,00150,000000,0010,092,03
19
Ship dataDesign deaweight (t)Payload/deadweight at design draught (%)Capacity utilization (pct.)Design payload (t)Normal speed (knots)Speed reduction (pct.)Actual ship speed (knots)Suphur content of oil (%)NOx emissions (IMO TIER 1, 2 or 3)Slow speed (1) or medium speed main engine (2)Sailing percentage in harbour conditions200090100180010,3010,31,0122
Truck dataNumber of containers per truckWeight per container (t/TEU)Length of truck - total (m)EURO norm (2, 3, 4, 5 or 6)Suphur content of oil (%)Driving distance (km)Driving percentage in city area212,51840,001400522,1317,8
External cost level1 = Low, 2 = Mean, 3 = HighShip (EURO/t payload/1000 km)Truck (EURO/t truck load/1000 km)
General cargo ship100 x Particulates100 x HC100 x CO100 x SOx10 x NOxCO2051015202530
Truck
35
40
45
50
Emissions [g/t payload/km]
General cargo shipTotal ext. costsClimate changeInfrastructureCongestionAccidentsNoiseEmissions024681012
Truck
14
16
18
20
External costs [EURO/t payload/1000 km]
20
Emissions (g/t payload/km)ShipCO210 x NOx100 x SOx100 x CO100 x HC100 x Particulates12,92,298,023,060,960,64TruckCO210 x NOx100 x SOx100 x CO100 x HC100 x Particulates44,52,430,030,70,100,14
External costs (EURO/t payload/1000 km)ShipEmissionsNoiseAccidentsCongestionInfrastructureClimate changeTotal ext. costs1,7700000,362,13TruckEmissionsNoiseAccidentsCongestionInfrastructureClimate changeTotal ext. costs2,031,614,783,125,051,2417,8
External costs (EURO/t payload/1000 km)ShipCO2NOxSOxCOHCParticulatesTotalTruckCO20,380,60NOx0,428 SOx0,00001 CO0,007 HC0,35Particulates1,77Total1,310,640,00150,000000,0010,092,03
21
Ship dataDesign deaweight (t)Payload/deadweight at design draught (%)Capacity utilization (pct.)Design payload (t)Normal speed (knots)Speed reduction (pct.)Actual ship speed (knots)Suphur content of oil (%)NOx emissions (IMO TIER 1, 2 or 3)Slow speed (1) or medium speed main engine (2)Sailing percentage in harbour conditions400090100360011,7011,71,0122
Truck dataNumber of containers per truckWeight per container (t/TEU)Length of truck - total (m)EURO norm (2, 3, 4, 5 or 6)Suphur content of oil (%)Driving distance (km)Driving percentage in city area212,51840,001400522,0517,8
External cost level1 = Low, 2 = Mean, 3 = HighShip (EURO/t payload/1000 km)Truck (EURO/t truck load/1000 km)
General cargo ship100 x Particulates100 x HC100 x CO100 x SOx10 x NOxCO2051015202530
Truck
35
40
45
50
Emissions [g/t payload/km]
General cargo shipTotal ext. costsClimate changeInfrastructureCongestionAccidentsNoiseEmissions024681012
Truck
14
16
18
20
External costs [EURO/t payload/1000 km]
22
Emissions (g/t payload/km)ShipCO210 x NOx100 x SOx100 x CO100 x HC100 x Particulates12,42,217,722,940,920,61TruckCO210 x NOx100 x SOx100 x CO100 x HC100 x Particulates44,52,430,030,70,100,14
External costs (EURO/t payload/1000 km)ShipEmissionsNoiseAccidentsCongestionInfrastructureClimate changeTotal ext. costs1,7000000,352,05TruckEmissionsNoiseAccidentsCongestionInfrastructureClimate changeTotal ext. costs2,031,614,783,125,051,2417,8
External costs (EURO/t payload/1000 km)ShipCO2NOxSOxCOHCParticulatesTotalTruckCO20,360,58NOx0,412 SOx0,00001 CO0,006 HC0,34Particulates1,70Total1,310,640,00150,000000,0010,092,03
23
Ship dataDesign deaweight (t)Payload/deadweight at design draught (%)Capacity utilization (pct.)Design payload (t)Normal speed (knots)Speed reduction (pct.)Actual ship speed (knots)Suphur content of oil (%)NOx emissions (IMO TIER 1, 2 or 3)Slow speed (1) or medium speed main engine (2)Sailing percentage in harbour conditions600090100540013,6013,61,0122
Truck dataNumber of containers per truckWeight per container (t/TEU)Length of truck - total (m)EURO norm (2, 3, 4, 5 or 6)Suphur content of oil (%)Driving distance (km)Driving percentage in city area212,51840,001400522,2417,8
External cost level1 = Low, 2 = Mean, 3 = HighShip (EURO/t payload/1000 km)Truck (EURO/t truck load/1000 km)
General cargo ship100 x Particulates100 x HC100 x CO100 x SOx10 x NOxCO2051015202530
Truck
35
40
45
50
Emissions [g/t payload/km]
General cargo shipTotal ext. costsClimate changeInfrastructureCongestionAccidentsNoiseEmissions024681012
Truck
14
16
18
20
External costs [EURO/t payload/1000 km]
24
Emissions (g/t payload/km)ShipCO210 x NOx100 x SOx100 x CO100 x HC100 x Particulates13,52,428,453,221,010,67TruckCO210 x NOx100 x SOx100 x CO100 x HC100 x Particulates44,52,430,030,70,100,14
External costs (EURO/t payload/1000 km)ShipEmissionsNoiseAccidentsCongestionInfrastructureClimate changeTotal ext. costs1,8600000,382,24TruckEmissionsNoiseAccidentsCongestionInfrastructureClimate changeTotal ext. costs2,031,614,783,125,051,2417,8
External costs (EURO/t payload/1000 km)ShipCO2NOxSOxCOHCParticulatesTotalTruckCO20,400,63NOx0,451 SOx0,00001 CO0,007 HC0,37Particulates1,86Total1,310,640,00150,000000,0010,092,03
25
Appendix C0.1 % S – IMO Tier I NOx level – Normal speed
26
Ship dataDesign deaweight (t)Payload/deadweight at design draught (%)Capacity utilization (pct.)Design payload (t)Normal speed (knots)Speed reduction (pct.)Actual ship speed (knots)Suphur content of oil (%)NOx emissions (IMO TIER 1, 2 or 3)Slow speed (1) or medium speed main engine (2)Sailing percentage in harbour conditions1000901009009,709,70,1122
Truck dataNumber of containers per truckWeight per container (t/TEU)Length of truck - total (m)EURO norm (2, 3, 4, 5 or 6)Suphur content of oil (%)Driving distance (km)Driving percentage in city area212,51840,001400522,0317,8
External cost level1 = Low, 2 = Mean, 3 = HighShip (EURO/t payload/1000 km)Truck (EURO/t truck load/1000 km)
General cargo ship100 x Particulates100 x HC100 x CO100 x SOx10 x NOxCO2051015202530
Truck
35
40
45
50
Emissions [g/t payload/km]
General cargo shipTotal ext. costsClimate changeInfrastructureCongestionAccidentsNoiseEmissions024681012
Truck
14
16
18
20
External costs [EURO/t payload/1000 km]
27
Emissions (g/t payload/km)ShipCO210 x NOx100 x SOx100 x CO100 x HC100 x Particulates15,92,840,993,791,180,56TruckCO210 x NOx100 x SOx100 x CO100 x HC100 x Particulates44,52,430,030,70,100,14
External costs (EURO/t payload/1000 km)ShipEmissionsNoiseAccidentsCongestionInfrastructureClimate changeTotal ext. costs1,5900000,452,03TruckEmissionsNoiseAccidentsCongestionInfrastructureClimate changeTotal ext. costs2,031,614,783,125,051,2417,8
External costs (EURO/t payload/1000 km)ShipCO2NOxSOxCOHCParticulatesTotalTruckCO20,470,74NOx0,053 SOx0,00001 CO0,008 HC0,31Particulates1,59Total1,310,640,00150,000000,0010,092,03
28
Ship dataDesign deaweight (t)Payload/deadweight at design draught (%)Capacity utilization (pct.)Design payload (t)Normal speed (knots)Speed reduction (pct.)Actual ship speed (knots)Suphur content of oil (%)NOx emissions (IMO TIER 1, 2 or 3)Slow speed (1) or medium speed main engine (2)Sailing percentage in harbour conditions200090100180010,3010,30,1122
Truck dataNumber of containers per truckWeight per container (t/TEU)Length of truck - total (m)EURO norm (2, 3, 4, 5 or 6)Suphur content of oil (%)Driving distance (km)Driving percentage in city area212,51840,001400521,6417,8
External cost level1 = Low, 2 = Mean, 3 = HighShip (EURO/t payload/1000 km)Truck (EURO/t truck load/1000 km)
General cargo ship100 x Particulates100 x HC100 x CO100 x SOx10 x NOxCO2051015202530
Truck
35
40
45
50
Emissions [g/t payload/km]
General cargo shipTotal ext. costsClimate changeInfrastructureCongestionAccidentsNoiseEmissions024681012
Truck
14
16
18
20
External costs [EURO/t payload/1000 km]
29
Emissions (g/t payload/km)ShipCO210 x NOx100 x SOx100 x CO100 x HC100 x Particulates12,92,290,803,060,960,45TruckCO210 x NOx100 x SOx100 x CO100 x HC100 x Particulates44,52,430,030,70,100,14
External costs (EURO/t payload/1000 km)ShipEmissionsNoiseAccidentsCongestionInfrastructureClimate changeTotal ext. costs1,2800000,361,64TruckEmissionsNoiseAccidentsCongestionInfrastructureClimate changeTotal ext. costs2,031,614,783,125,051,2417,8
External costs (EURO/t payload/1000 km)ShipCO2NOxSOxCOHCParticulatesTotalTruckCO20,380,60NOx0,043 SOx0,00001 CO0,007 HC0,25Particulates1,28Total1,310,640,00150,000000,0010,092,03
30
Ship dataDesign deaweight (t)Payload/deadweight at design draught (%)Capacity utilization (pct.)Design payload (t)Normal speed (knots)Speed reduction (pct.)Actual ship speed (knots)Suphur content of oil (%)NOx emissions (IMO TIER 1, 2 or 3)Slow speed (1) or medium speed main engine (2)Sailing percentage in harbour conditions400090100360011,7011,70,1122
Truck dataNumber of containers per truckWeight per container (t/TEU)Length of truck - total (m)EURO norm (2, 3, 4, 5 or 6)Suphur content of oil (%)Driving distance (km)Driving percentage in city area212,51840,001400521,5817,8
External cost level1 = Low, 2 = Mean, 3 = HighShip (EURO/t payload/1000 km)Truck (EURO/t truck load/1000 km)
General cargo ship100 x Particulates100 x HC100 x CO100 x SOx10 x NOxCO2051015202530
Truck
35
40
45
50
Emissions [g/t payload/km]
General cargo shipTotal ext. costsClimate changeInfrastructureCongestionAccidentsNoiseEmissions024681012
Truck
14
16
18
20
External costs [EURO/t payload/1000 km]
31
Emissions (g/t payload/km)ShipCO210 x NOx100 x SOx100 x CO100 x HC100 x Particulates12,42,210,772,940,920,44TruckCO210 x NOx100 x SOx100 x CO100 x HC100 x Particulates44,52,430,030,70,100,14
External costs (EURO/t payload/1000 km)ShipEmissionsNoiseAccidentsCongestionInfrastructureClimate changeTotal ext. costs1,2300000,351,58TruckEmissionsNoiseAccidentsCongestionInfrastructureClimate changeTotal ext. costs2,031,614,783,125,051,2417,8
External costs (EURO/t payload/1000 km)ShipCO2NOxSOxCOHCParticulatesTotalTruckCO20,360,58NOx0,041 SOx0,00001 CO0,006 HC0,24Particulates1,23Total1,310,640,00150,000000,0010,092,03
32
Ship dataDesign deaweight (t)Payload/deadweight at design draught (%)Capacity utilization (pct.)Design payload (t)Normal speed (knots)Speed reduction (pct.)Actual ship speed (knots)Suphur content of oil (%)NOx emissions (IMO TIER 1, 2 or 3)Slow speed (1) or medium speed main engine (2)Sailing percentage in harbour conditions600090100540013,6013,60,1122
Truck dataNumber of containers per truckWeight per container (t/TEU)Length of truck - total (m)EURO norm (2, 3, 4, 5 or 6)Suphur content of oil (%)Driving distance (km)Driving percentage in city area212,51840,001400521,7317,8
External cost level1 = Low, 2 = Mean, 3 = HighShip (EURO/t payload/1000 km)Truck (EURO/t truck load/1000 km)
General cargo ship100 x Particulates100 x HC100 x CO100 x SOx10 x NOxCO2051015202530
Truck
35
40
45
50
Emissions [g/t payload/km]
General cargo shipTotal ext. costsClimate changeInfrastructureCongestionAccidentsNoiseEmissions024681012
Truck
14
16
18
20
External costs [EURO/t payload/1000 km]
33
Emissions (g/t payload/km)ShipCO210 x NOx100 x SOx100 x CO100 x HC100 x Particulates13,52,420,853,221,010,48TruckCO210 x NOx100 x SOx100 x CO100 x HC100 x Particulates44,52,430,030,70,100,14
External costs (EURO/t payload/1000 km)ShipEmissionsNoiseAccidentsCongestionInfrastructureClimate changeTotal ext. costs1,3500000,381,73TruckEmissionsNoiseAccidentsCongestionInfrastructureClimate changeTotal ext. costs2,031,614,783,125,051,2417,8
External costs (EURO/t payload/1000 km)ShipCO2NOxSOxCOHCParticulatesTotalTruckCO20,400,63NOx0,045 SOx0,00001 CO0,007 HC0,27Particulates1,35Total1,310,640,00150,000000,0010,092,03
34
Appendix D0.1 % S – IMO Tier I NOx level – 10 % speed reduction
35
Ship dataDesign deaweight (t)Payload/deadweight at design draught (%)Capacity utilization (pct.)Design payload (t)Normal speed (knots)Speed reduction (pct.)Actual ship speed (knots)Suphur content of oil (%)NOx emissions (IMO TIER 1, 2 or 3)Slow speed (1) or medium speed main engine (2)Sailing percentage in harbour conditions1000901009009,7108,80,1122
Truck dataNumber of containers per truckWeight per container (t/TEU)Length of truck - total (m)EURO norm (2, 3, 4, 5 or 6)Suphur content of oil (%)Driving distance (km)Driving percentage in city area212,51840,001400521,7017,8
External cost level1 = Low, 2 = Mean, 3 = HighShip (EURO/t payload/1000 km)Truck (EURO/t truck load/1000 km)
General cargo ship100 x Particulates100 x HC100 x CO100 x SOx10 x NOxCO2051015202530
Truck
35
40
45
50
Emissions [g/t payload/km]
General cargo shipTotal ext. costsClimate changeInfrastructureCongestionAccidentsNoiseEmissions024681012
Truck
14
16
18
20
External costs [EURO/t payload/1000 km]
36
Emissions (g/t payload/km)ShipCO210 x NOx100 x SOx100 x CO100 x HC100 x Particulates13,32,370,833,170,990,47TruckCO210 x NOx100 x SOx100 x CO100 x HC100 x Particulates44,52,430,030,70,100,14
External costs (EURO/t payload/1000 km)ShipEmissionsNoiseAccidentsCongestionInfrastructureClimate changeTotal ext. costs1,3300000,371,70TruckEmissionsNoiseAccidentsCongestionInfrastructureClimate changeTotal ext. costs2,031,614,783,125,051,2417,8
External costs (EURO/t payload/1000 km)ShipCO2NOxSOxCOHCParticulatesTotalTruckCO20,390,62NOx0,044 SOx0,00001 CO0,007 HC0,26Particulates1,33Total1,310,640,00150,000000,0010,092,03
37
Ship dataDesign deaweight (t)Payload/deadweight at design draught (%)Capacity utilization (pct.)Design payload (t)Normal speed (knots)Speed reduction (pct.)Actual ship speed (knots)Suphur content of oil (%)NOx emissions (IMO TIER 1, 2 or 3)Slow speed (1) or medium speed main engine (2)Sailing percentage in harbour conditions200090100180010,3109,20,1122
Truck dataNumber of containers per truckWeight per container (t/TEU)Length of truck - total (m)EURO norm (2, 3, 4, 5 or 6)Suphur content of oil (%)Driving distance (km)Driving percentage in city area212,51840,001400521,3217,8
External cost level1 = Low, 2 = Mean, 3 = HighShip (EURO/t payload/1000 km)Truck (EURO/t truck load/1000 km)
General cargo ship100 x Particulates100 x HC100 x CO100 x SOx10 x NOxCO2051015202530
Truck
35
40
45
50
Emissions [g/t payload/km]
General cargo shipTotal ext. costsClimate changeInfrastructureCongestionAccidentsNoiseEmissions024681012
Truck
14
16
18
20
External costs [EURO/t payload/1000 km]
38
Emissions (g/t payload/km)ShipCO210 x NOx100 x SOx100 x CO100 x HC100 x Particulates10,41,850,652,470,770,37TruckCO210 x NOx100 x SOx100 x CO100 x HC100 x Particulates44,52,430,030,70,100,14
External costs (EURO/t payload/1000 km)ShipEmissionsNoiseAccidentsCongestionInfrastructureClimate changeTotal ext. costs1,0300000,291,32TruckEmissionsNoiseAccidentsCongestionInfrastructureClimate changeTotal ext. costs2,031,614,783,125,051,2417,8
External costs (EURO/t payload/1000 km)ShipCO2NOxSOxCOHCParticulatesTotalTruckCO20,310,49NOx0,035 SOx0,00001 CO0,005 HC0,20Particulates1,03Total1,310,640,00150,000000,0010,092,03
39
Ship dataDesign deaweight (t)Payload/deadweight at design draught (%)Capacity utilization (pct.)Design payload (t)Normal speed (knots)Speed reduction (pct.)Actual ship speed (knots)Suphur content of oil (%)NOx emissions (IMO TIER 1, 2 or 3)Slow speed (1) or medium speed main engine (2)Sailing percentage in harbour conditions400090100360011,71010,50,1122
Truck dataNumber of containers per truckWeight per container (t/TEU)Length of truck - total (m)EURO norm (2, 3, 4, 5 or 6)Suphur content of oil (%)Driving distance (km)Driving percentage in city area212,51840,001400521,2117,8
External cost level1 = Low, 2 = Mean, 3 = HighShip (EURO/t payload/1000 km)Truck (EURO/t truck load/1000 km)
General cargo ship100 x Particulates100 x HC100 x CO100 x SOx10 x NOxCO2051015202530
Truck
35
40
45
50
Emissions [g/t payload/km]
General cargo shipTotal ext. costsClimate changeInfrastructureCongestionAccidentsNoiseEmissions024681012
Truck
14
16
18
20
External costs [EURO/t payload/1000 km]
40
Emissions (g/t payload/km)ShipCO210 x NOx100 x SOx100 x CO100 x HC100 x Particulates9,51,690,592,260,710,33TruckCO210 x NOx100 x SOx100 x CO100 x HC100 x Particulates44,52,430,030,70,100,14
External costs (EURO/t payload/1000 km)ShipEmissionsNoiseAccidentsCongestionInfrastructureClimate changeTotal ext. costs0,9500000,271,21TruckEmissionsNoiseAccidentsCongestionInfrastructureClimate changeTotal ext. costs2,031,614,783,125,051,2417,8
External costs (EURO/t payload/1000 km)ShipCO2NOxSOxCOHCParticulatesTotalTruckCO20,280,44NOx0,032 SOx0,00001 CO0,005 HC0,19Particulates0,95Total1,310,640,00150,000000,0010,092,03
41
Ship dataDesign deaweight (t)Payload/deadweight at design draught (%)Capacity utilization (pct.)Design payload (t)Normal speed (knots)Speed reduction (pct.)Actual ship speed (knots)Suphur content of oil (%)NOx emissions (IMO TIER 1, 2 or 3)Slow speed (1) or medium speed main engine (2)Sailing percentage in harbour conditions600090100540013,61012,20,1122
Truck dataNumber of containers per truckWeight per container (t/TEU)Length of truck - total (m)EURO norm (2, 3, 4, 5 or 6)Suphur content of oil (%)Driving distance (km)Driving percentage in city area212,51840,001400521,3117,8
External cost level1 = Low, 2 = Mean, 3 = HighShip (EURO/t payload/1000 km)Truck (EURO/t truck load/1000 km)
General cargo ship100 x Particulates100 x HC100 x CO100 x SOx10 x NOxCO2051015202530
Truck
35
40
45
50
Emissions [g/t payload/km]
General cargo shipTotal ext. costsClimate changeInfrastructureCongestionAccidentsNoiseEmissions024681012
Truck
14
16
18
20
External costs [EURO/t payload/1000 km]
42
Emissions (g/t payload/km)ShipCO210 x NOx100 x SOx100 x CO100 x HC100 x Particulates10,31,840,642,450,760,36TruckCO210 x NOx100 x SOx100 x CO100 x HC100 x Particulates44,52,430,030,70,100,14
External costs (EURO/t payload/1000 km)ShipEmissionsNoiseAccidentsCongestionInfrastructureClimate changeTotal ext. costs1,0200000,291,31TruckEmissionsNoiseAccidentsCongestionInfrastructureClimate changeTotal ext. costs2,031,614,783,125,051,2417,8
External costs (EURO/t payload/1000 km)ShipCO2NOxSOxCOHCParticulatesTotalTruckCO20,300,48NOx0,034 SOx0,00001 CO0,005 HC0,20Particulates1,02Total1,310,640,00150,000000,0010,092,03
43
Appendix EShip particulars from computer program
44
Ship dataContainer capacity (type 1: <4900 TEU type 2: >4900 TEU)Panamax (1) or Postpanamax type (2)Length between ppLength in waterline incl. bulbous bow (= 1,01 Lpp)Length over allBreadth mld.DepthDesign draughtScantling draughtScantling draught - design draughtDesign deadweight/Scantling deadweightDesign deadweightScantling deadweightScantling deadweight/TEULightweight coefficientLightweightDisplacement at design draughtDisplacement at scantling draughtBlock coefficient (based on Lpp) at design draughtBlock coefficient (based on Lpp) at scantling draughtLpp/Displ.vol.Lpp/Displ.vol.2/32/3
UnitsTEU(-)mmmmmmmm%tonstonstons/TEUt/m3
Deafultvalues77167,4968,1773,5112,955,963,523,590,0794,61000105513,780,180940194019950,6150,6205,465,410,980,6270,6320,867
tonstonstons--------mm22
at design draughtat scantling draught
Midship section coefficientPrismatic coefficient at design draughtPrismatic coefficient at scantling draughtWaterplane area coefficientWetted surface at design draughtWetted surface at scantling draughtService speed at design draughtFroude Number at service speedScantling trial speed at 75 % MCR ('reference speed')Froude Number at 'reference speed'Service allowance on resistanceTransmission efficiencyNormal main engine service ratingMain engine power (MCR)Main engine type (slow speed = 1, medium speed = 2)Auxiliary power at sea at design draughtPropeller diameterPropeller loading (MCR)
98810029,70,1949,70,1921096854272212,472
knots-knots-pct.pct.pct. MCRkW-kWmkW/m
89
45
Ship dataContainer capacity (type 1: <4900 TEU type 2: >4900 TEU)Panamax (1) or Postpanamax type (2)Length between ppLength in waterline incl. bulbous bow (= 1,01 Lpp)Length over allBreadth mld.DepthDesign draughtScantling draughtScantling draught - design draughtDesign deadweight/Scantling deadweightDesign deadweightScantling deadweightScantling deadweight/TEULightweight coefficientLightweightDisplacement at design draughtDisplacement at scantling draughtBlock coefficient (based on Lpp) at design draughtBlock coefficient (based on Lpp) at scantling draughtLpp/Displ.vol.Lpp/Displ.vol.2/32/3
UnitsTEU(-)mmmmmmmm%tonstonstons/TEUt/m3
Deafultvalues154174,4675,2180,9214,096,554,154,280,1394,32000212113,770,1731190319033110,7140,7195,105,040,980,7290,7330,865
tonstonstons--------mm22
at design draughtat scantling draught
Midship section coefficientPrismatic coefficient at design draughtPrismatic coefficient at scantling draughtWaterplane area coefficientWetted surface at design draughtWetted surface at scantling draughtService speed at design draughtFroude Number at service speedScantling trial speed at 75 % MCR ('reference speed')Froude Number at 'reference speed'Service allowance on resistanceTransmission efficiencyNormal main engine service ratingMain engine power (MCR)Main engine type (slow speed = 1, medium speed = 2)Auxiliary power at sea at design draughtPropeller diameterPropeller loading (MCR)
1342137010,30,19410,20,1931096857262362,912
knots-knots-pct.pct.pct. MCRkW-kWmkW/m
109
46
Ship dataContainer capacity (type 1: <4900 TEU type 2: >4900 TEU)Panamax (1) or Postpanamax type (2)Length between ppLength in waterline incl. bulbous bow (= 1,01 Lpp)Length over allBreadth mld.DepthDesign draughtScantling draughtScantling draught - design draughtDesign deadweight/Scantling deadweightDesign deadweightScantling deadweightScantling deadweight/TEULightweight coefficientLightweightDisplacement at design draughtDisplacement at scantling draughtBlock coefficient (based on Lpp) at design draughtBlock coefficient (based on Lpp) at scantling draughtLpp/Displ.vol.Lpp/Displ.vol.2/32/3
UnitsTEU(-)mmmmmmmm%tonstonstons/TEUt/m3
Deafultvalues311188,6089,4995,9016,337,725,295,500,2193,64000427413,740,1611801580160750,7400,7454,974,900,980,7550,7600,862
tonstonstons--------mm22
at design draughtat scantling draught
Midship section coefficientPrismatic coefficient at design draughtPrismatic coefficient at scantling draughtWaterplane area coefficientWetted surface at design draughtWetted surface at scantling draughtService speed at design draughtFroude Number at service speedScantling trial speed at 75 % MCR ('reference speed')Froude Number at 'reference speed'Service allowance on resistanceTransmission efficiencyNormal main engine service ratingMain engine power (MCR)Main engine type (slow speed = 1, medium speed = 2)Auxiliary power at sea at design draughtPropeller diameterPropeller loading (MCR)
1970202411,70,20311,60,20110968515912803,702
knots-knots-pct.pct.pct. MCRkW-kWmkW/m
148
47
Ship dataContainer capacity (type 1: <4900 TEU type 2: >4900 TEU)Panamax (1) or Postpanamax type (2)Length between ppLength in waterline incl. bulbous bow (= 1,01 Lpp)Length over allBreadth mld.DepthDesign draughtScantling draughtScantling draught - design draughtDesign deadweight/Scantling deadweightDesign deadweightScantling deadweightScantling deadweight/TEULightweight coefficientLightweightDisplacement at design draughtDisplacement at scantling draughtBlock coefficient (based on Lpp) at design draughtBlock coefficient (based on Lpp) at scantling draughtLpp/Displ.vol.Lpp/Displ.vol.2/32/3
UnitsTEU(-)mmmmmmmm%tonstonstons/TEUt/m3
Deafultvalues4711102,86103,89110,9618,508,896,276,540,2792,96000645313,700,1522566856690190,7000,7075,074,980,980,7140,7210,859
tonstonstons--------mm22
at design draughtat scantling draught
Midship section coefficientPrismatic coefficient at design draughtPrismatic coefficient at scantling draughtWaterplane area coefficientWetted surface at design draughtWetted surface at scantling draughtService speed at design draughtFroude Number at service speedScantling trial speed at 75 % MCR ('reference speed')Froude Number at 'reference speed'Service allowance on resistanceTransmission efficiencyNormal main engine service ratingMain engine power (MCR)Main engine type (slow speed = 1, medium speed = 2)Auxiliary power at sea at design draughtPropeller diameterPropeller loading (MCR)
2565264513,60,21913,40,216109685303421524,392
knots-knots-pct.pct.pct. MCRkW-kWmkW/m
200
48
Appendix FTruck engine dataVersion: 16th November 2009Specific oil consumption (kg/kWh)NOx emission (g/kWh)CO emission (g/kWh)HC emission (g/kWh)Particulate emission (g/kWh)Sulphur content in oil (pct.)SO2emission (g/kWh)CO2emission (g/kg)NOx emission (g/kg)CO emission (g/kg)HC emission (g/kg)Particulate emission (g/kg)SO2emission (g/kg)NOx emission (g/MJ)CO emission (g/MJ)HC emission (g/MJ)Particulate emission (g/MJ)SO2emission (g/MJ)Calorific value for diesel oil (MJ/kg)EURO NORMTEU per truckAverage weight of a container (TEU)Length of truck - totalDriving distanceWeight of truck loadFuel consumption ratio - driving distanceEnergy consumption per TEU per kmEnergy consumption per lanemeter per kmEnergy consumption per ton load per kmOil consumption per TEU per kmOil consumption per lanemeter per kmOil consumption per ton load per kmCO2emissions per TEU per kmCO2emissions per lanemeter per kmCO2emissions per ton load per kmNOx emissions per TEU per kmNOx emissions per lanemeter per kmNOx emissions per ton load per kmHC emissions per TEU per kmHC emissions per lanemeter per kmHC emissions per ton load per kmCO emissions per TEU per kmCO emissions per lanemeter per kmCO emissions per ton load per kmSOx emissions per TEU per kmSOx emissions per lanemeter per kmSOx emissions per ton load per kmParticulate emissions per TEU per kmParticulate emissions per lanemeter per kmParticulate emissions per ton load per kmEU 1996EURO 20,207,01,200,300,150,0010,004320635,06,01,500,750,020,820,140,0350,0180,000542,8TEU/truckt/TEUmkmt/truck(-)MJ/TEU/kmMJ/lm/kmMJ/t/kmg/TEU/kmg/lm/kmg/t/kmg/TEU/kmg/lm/kmg/t/kmg/TEU/kmg/lm/kmg/t/kmg/TEU/kmg/lm/kmg/t/kmg/TEU/kmg/lm/kmg/t/kmg/TEU/kmg/lm/kmg/t/kmg/TEU/kmg/lm/kmg/t/km4212,518,040025,01,0007,40,830,5917419,313,955661,844,53,040,340,240,010,0010,0010,090,0100,0070,0030,00040,00030,0170,00190,0014EU 2001EURO 30,205,01,200,250,100,0010,00320625,06,01,250,500,020,580,140,0290,0120,0005EU 2006EURO 40,203,50,100,0150,020,0010,00320617,50,50,0750,100,020,410,010,001750,0020,0005EU 2011 EU 2015EURO 5 EURO 60,202,00,100,0150,020,0010,00320610,00,50,0750,100,020,230,010,001750,0020,00050,200,40,100,0040,010,0010,0032062,00,50,020,050,020,050,010,00050,0010,0005
49
Appendix GExternal costs 2009 (DTU)CITYCO2ParticulatesNOxSOxCOHCLow0,1556794104DKK/kgMean0,221.82718720,0175DKK/kgMean0,2238820390,0035High0,449.941712200,0348Low0,0196761,225,42200,525EURO/kgMean0,0292442,459,6200,002270,700EURO/kgMean0,029522,625,250,000350,700High0,05913259,4429,3840,004551,049
NON CITYCO2ParticulatesNOxSOxCOHCLow0,15140101604
High0,441.898801770,005825
Low0,0196191,402,1000,525
High0,05925310,6723,610,000701,049
City traffic percentage of total traffic for shipCity traffic percentage of total traffic for truck
Sensitivity analysis (1 = Low cost values, 2 = Mean cost values, 3 = High cost values)AveragedvaluesEURO/kg0,0294562,625,330,00040,700Low140AveragedvaluesEURO/kg0,0294612,615,470,00040,700Mean209High419Low18,6Mean27,9
2
CO2ParticulatesNOxSOxCOHCClimate changeDKK/t CO2
EURO/t
High55,8
16 t truckNoiseAccidentsCongestionInfrastructureLow0,160,190,150,23DKK/kmMean0,300,900,590,95High0,621,171,611,41Low0,02100,02520,01950,0308EURO/kmMean0,04030,1190,0780,126High0,08240,1560,2150,188
50
DTU Mechanical EngineeringSection of Coastal, Maritime and Structural EngineeringTechnical University of DenmarkNils Koppels Allé, Bld. 403DK- 2800 Kgs. LyngbyDenmarkPhone (+45) 45 25 13 60Fax (+45) 45 88 43 25www.mek.dtu.dk