Miljø- og Planlægningsudvalget 2009-10
MPU Alm.del Bilag 248
Offentligt
OVERVIEW SCHEDULEUnited Nations Climate Change ConferenceCopenhagen, Denmark, 7-18 December 2009Fifteenth Session of the Conference of the Parties (COP 15)Fifth Session of the Conference of the Parties serving as themeeting of the Parties to the Kyoto Protocol (CMP 5)Thirty-First Session of the Subsidiary Body for Scientific andTechnological Advice (SBSTA 31)Thirty-First Session of the Subsidiary Body for Implementation(SBI 31)Tenth session of the Ad Hoc Working Group on FurtherCommitments for Annex I Parties under the Kyoto Protocol (AWG-KP 10)Eighth session of the Ad Hoc Working Group on Long-termCooperative Action (AWG-LCA 8)
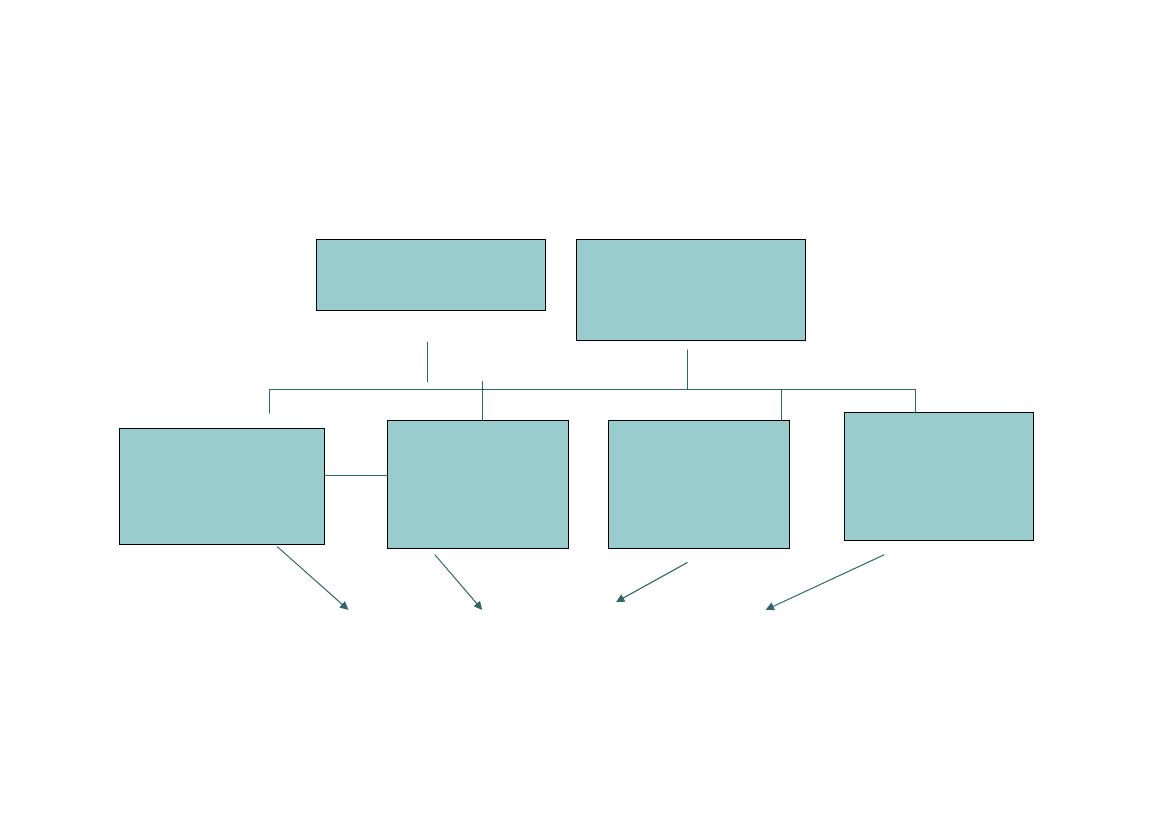
Opbygningen af forhandlingerneCOP (Conferenceof Parties)COP/MOP(Meetings ofParties)
SBI(Subsidiary Bodyfor Implementation)
SBSTA(Subsidiary bodyfor Scientific andTechnologicaladvice)
AWG-LCA (Adhoc workinggroup on longterm cooperativeaction)
AWG (Ad hocworking group onfurthercommitments forAnnex 1)
Contact groupsInformals‘Friends of the Chair’- Informal Informal
Annex 1 pledge overview for 2020Low pledgeAustraliaBelarusCanadaCroatiaEU27IcelandJapanLiechtensteinMonacoNew ZealandNorwayRussiaSwitzerlandTurkeyUkraineUSA-5%-5%-20%6%-20%-15%-25%-20%-20%-10%-30%-20%-20%n/a-20%-17%High Pledge-25%-10%-20%6%-30%-15%-25%-30%-20%-20%-40%-25%-30%n/a-20%-17%Reference year2000199020061990199019901990199019901990199019901990n/a19902005
Note: Turkey has not yet presented a pledge for 2020. Assumed to follow BAU in calculations.Note: Russia’s pledge is the targets announced by Medvedev.Note: Kazakhstan has presented a pledge of 15% compared to 1992. Not yet included in calculations.Note: Australia target of 415Mt does not consider recent adjustment of year 2000 LULUCF emissions
TIL FMPU’SFORTROLIGEORIENTERING. *ForAustraliener både opgørelse i 2020 og omregning til1990 baseret på emissionerinkl. LULUCF,da Australiens basisår er inkl. LULUCF. Derfor stemmersummen for Annex 1 total ikke med summen tallene hver for sig.**Tyrkiethar ikke udmeldt et mål. Her er antaget, at Tyrkiet følger BaU. Kazakhstans mål er ikkemedtaget herCountryAustralia *BelarusCanadaCroatiaEU27IcelandJapanNew ZealandNorwayRussiaSwitzerlandTurkey (2020 = BAU)**170UkraineUSAAI total, ex LULUCF (Gt)9266,08418,7-20%-3%-16%1990 excl. LULUCF454129592315,55731,27062503,31953Target 2020 vs. 1990-33%-10%-3%6%-30%-15%-25%-20%-40%-25%-30%
Preliminary assessment of Annex 1 high pledges for2020
Target 2020304116575333,890395249302,489374737415,87815,7
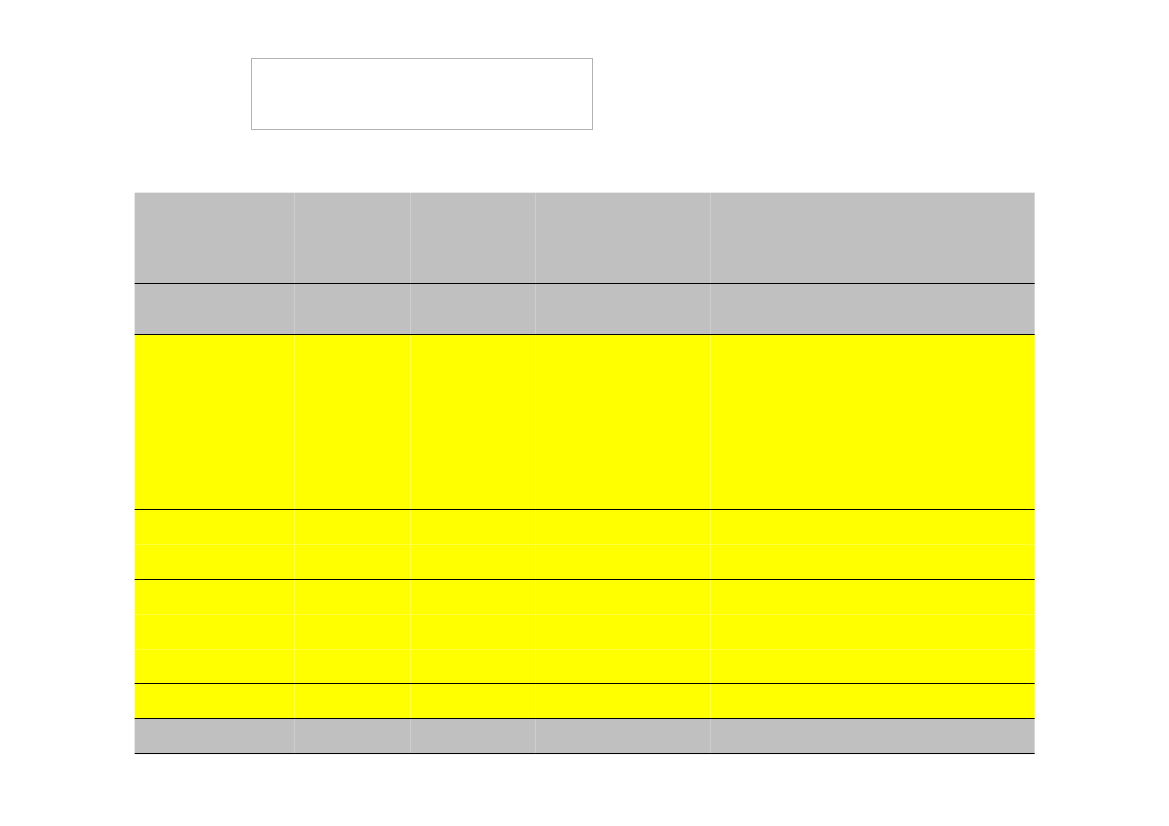
Contributions from dev. countriesTIL FMPU’SFORTROLIGEORIENTERING. ENKELTE TAL (SÆRLIGT I RÆKKEN 2020 BAU) ER VURDERINGER. TAL KAN ÆNDRE SIG.(KINA, INDIEN: Intensitetsmål er forbedringer i 2020 ift. 2005).
Country
2020 BAUMt CO2e
Contribution% Below BAU-39%Carbon intensity (40-45%)Carbon intensity (20-25%)-21%-30%-41%-34%-16%-100%-100%
ReductionsMt CO2e-1,1??-0,2-0,2-1,2-0,3-0,01
Emissions afterreductionsMt CO2e1,7??0,70,61,70,50,0600
BrazilChinaIndiaMexicoSouth KoreaIndonesiaSouth AfricaSingaporeCosta RicaMaldivesRest NAITotal NAI
2,7??0,90,82,80,80,07
??
0%?
??
??
Model resultsTIL FMPU’SFORTROLIGEORIENTERING. ENKELTE TAL (SÆRLIGT I RÆKKEN 2020 BAU SAMT KINA OG INDIENSREDUKTONER UNDER BAU) ER VURDERINGER. TAL KAN ÆNDRE SIG).
Country
2005Mt CO2e
2020 BAUMt CO2e2,813,03,81,00,9
Contribution2020% Below BAU-39%0-5%0%-21%-30%-41%-34%-16%-100%-100%
Reductions2020Mt CO2e-1,10-0,60-0,2-0,3-1,2-0,3-0,01n.a.n.a.YES-3,0
Emissions afterreductionsMt CO2e1,812,4-13,03,80,80,61,60,50,0600YES30,6-31,2
BrazilChinaIndiaMexicoSouth KoreaIndonesiaSouth AfricaSingaporeCosta RicaMaldivesRest NAITotal NAI
2,87,62,30,90,7
YES24,9
YES34,2
0%-9% til -11%


