Miljø- og Planlægningsudvalget 2009-10, Det Energipolitiske Udvalg 2009-10
MPU Alm.del Bilag 173, EPU Alm.del Bilag 85
Offentligt
SUSTAINABLEENERGY SCENARIOS
20092009
Boosting the Top of EuropeEnergy Perspectives for the Baltic Sea Region
Setting an agenda for the future
Ea Energy AnalysesPrepared by:Ea Energy AnalysesFrederiksholms Kanal 1, 1st1220 Copenhagen KDenmarkPhone: +45 88 70 70 83Fax: +45 33 32 16 61Email: [email protected]Web: www.eaea.dkInitiated by:Baltic Development ForumNygade 3, 5th1002 Copenhagen KDenmarkPhone: +45 70 20 93 94Fax: +45 70 20 93 95Email: [email protected]Web: www.bdforum.orgSponsored by:Nordic Council of MinistersNordic CouncilFabrikant Mads Clausens Fond, Danfoss
ENERGY PERSPECTIVES FOR THE BSR SUSTAINABLE ENERGY SCENARIOS
3
Table of contentsForeword and prefacesForewordPreface by the EU Energy Commissioner Andris PiebalgsPreface by the Baltic Sea Energy Cooperation (BASREC)Group of Senior Energy Officials (GSEO)Preface by the Baltic Sea Parliamentary Conference WorkingGroup on Energy and Climate ChangePreface by the Union of Baltic Cities Energy Commission1 Summary and recommendations1.1 Introduction1.2 Scenarios in phase I and phase II1.3 The Baseline scenario1.4 Three alternative policy scenarios1.5 Dialogue with stakeholders1.6 Next steps2 Scenarios and policy targets2.1 One Baseline scenario and three policy scenarios2.2 Existing subsidies and energy taxes3 Modelling tool4 Key assumptions for the scenarios4.1 Fuel prices4.2 Transmission capacity4.3 Electricity demand4.4 Existing generation capacity4.5 New generation capacity5 Scenario analyses5.1 Baseline scenario5.2 Regional RE target5.3 Improved efficiency scenario5.4 30%@COP155.5 Analysis: CO2and RE targets6 Case analysis of Kriegers Flak7 Screening of new interconnectorsAnnex 1: The consultation and presentation process44679101111131724313234373839414142434445555566707478818385
4
ENERGY PERSPECTIVES FOR THE BSR SUSTAINABLE ENERGY SCENARIOS
Foreword and prefacesForewordGlobal attention is firmly directed towards the Baltic Sea Region due to UNClimate Summits in Copenhagen in December 2009 and in Poznan in 2008.The UN Summit in Copenhagen takes place in parallel with the Swedish EUPresidency. These high-level events are unique opportunities for the countriesin the region to illustrate to a broader audience the political importance of theregion by highlighting the Baltic Sea cooperation and regional solutions toglobal challenges.Climate change and energy consumption are challenges that influence almost allaspects of our daily life. Global challenges regarding reduction of green housegasses, increase of renewable energies and energy efficiency need to be tackledon all levels – private households, national, European and global levels. Oftenenergy co-operation onregionalorsub-regionallevels can indeed providevery positive results that leave each country better off when implementing theEU’s or the UN’s targets on climate change and energy, as well as in ensuringgreater security of energy supply. This has been the basic assumption behindthe present report, not least based on the Nordic experience. The Baltic SeaRegion’s specific character in terms of many different energy sources and theindividual countries’ energy-mix supports implicitly such an assumption.The present report discloses some of the advantages of enhanced energy co-operation in the Baltic Sea Region based on facts and data. It illustrates thatthere is a huge potential for cost-efficient energy savings and energy efficiencymeasures through a stronger coordination of the energy policies across theregion.In preparing the report, data on energy generating facilities in all Baltic SeaStates have been collected and used in the open and transparent analyticalmodels – Stream and Balmorel. These models were also used in the preparationof national/regional policies in Denmark and in the European Parliament andthey similarly proved to be useful and interesting in the Baltic Sea Region whenlooking at the region as one integrated energy system. With the different energydata collected a unique database has been created. It can now serve as a platformfor identifying and implementing very specific energy projects in the Baltic SeaRegion.The analytical and empirical results and findings have been presented for anddiscussed with different public and private stakeholders in the region in order toanchor the different energy scenarios, results and recommendations. We hopethat this final report and its recommendations can continue to serve as a keypoint of reference in the further discussions on energy planning in the Baltic
ENERGY PERSPECTIVES FOR THE BSR SUSTAINABLE ENERGY SCENARIOS
5
Sea Region, not least in the framework of BASREC, the Nordic-Baltic energycooperation through the Nordic Council of Ministers as well as initiatives underthe EU strategy for the Baltic Sea region. First and foremost, the report willform the basis for the regional energy discussions at the Baltic DevelopmentForum Summit, 5-6 October in Stockholm. And it will provide an input to theNordic Council’s 61stsession, 27-29 October in Stockholm.The analysis and conclusions of the report are those of the authors and donot necessarily reflect the views of the Nordic Council of Ministers or BalticDevelopment Forum. However, we are convinced that the report will beinspiring. We wish you all good reading.
Copenhagen, 15 September 2009
Halldór ÁsgrímssonSecretary GeneralNordic Council of Minsters
Hans BraskDirectorBaltic Development Forum
6
ENERGY PERSPECTIVES FOR THE BSR SUSTAINABLE ENERGY SCENARIOS
Preface by Mr Andris Piebalgs,Commissioner for EnergyAt the 2007 Baltic Development Forum’s Summit in Tallinn, it was concludedin the session on energy and climate change in which I took part– together withPrime Minister Fredrik Reinfeldt, Prime Minister Matti Vanhanen and CEO ofForum Michael Lilius – that there was a need to draw up a paper that couldhelp the governments realize the vision of closer and more efficient energycooperation in the Baltic Sea Region. The Baltic Sea Region indeed has a hugepotential for implementing energy projects that are of wider importance due totheir potential and diversified energy-mix.I am therefore glad to acknowledge the work and effort that has been investedin elaborating this report on Sustainable Energy Scenarios. I have had thechance to observe the process since the preliminary results were presented tome in connection to the BASREC Ministerial conference in February 2009. Iwas introduced to the two overall scenarios for regional co-operation basedon a “small-tech and big-tech” approach. I find the approach useful to presentdifferent sc enarios as a means of involving different stakeholders in agreeingon the most pressing energy projects and priorities that can be beneficial for alarger group of countries.As I mentioned in February at the Ministerial Conference, we indeed need bothsmall-tech and big-tech solutions if we are to successfully implement the EU’s20-20-20 targets. We must not ignore the importance of small-tech solutions.As it is issued while the discussions on the EU strategy for the Baltic Sea areatake place, the report is very timely. The Baltic Sea Region has the potential toshow to the rest of the world how many of the energy and climate challengescan be solved intelligently. The region could become home of many lighthouseprojects – like the Windmill Park at Krieger’s Flak that the Commission hasdecided to support. In this respect, the present report is an important tool whichI hope will be used by all stakeholders in the region, and beyond.As European Commissioner responsible for Energy, I am very pleased by theinitiative taken to draw up this report and by many results in the report.With every good wish for a successful follow-up,
Andris PiebalgsEU Commissioner for Energy
ENERGY PERSPECTIVES FOR THE BSR SUSTAINABLE ENERGY SCENARIOS
7
Preface by the Bal c Sea Energy Coopera on(BASREC) Group of Senior Energy Officials (GSEO)In spite of the current economic downturn the Baltic Sea Region has a greatpotential for developing into a more coherent and prosperous economic regionin the aftermath of the crisis. It depends on the future policy design and theability of the countries to benefit from closer cooperation on issues that enhancecompetition, green growth and job creation and cater for the climate.Energy is crucial when it comes to designing policies that meet the futurechallenges of developing renewed growth and prosperity in the region,competition and climate friendly new technologies.Keen political interest is taking in the Baltic Sea region in these years providinggreat opportunities for the region to shape its energy policies to develop andobtain prosperity.The ministers of the Baltic Sea Energy Cooperation (BASREC) have recentlyagreed to continue and strengthen the transnational energy cooperation in orderto make contributions to stability, growth and development in the region bypromoting market-based, secure, competitive and sustainable energy systems.The EU has taken initiatives to abolish the energy isolation of the Baltic Sea statesfrom the EU energy markets by the endorsement of the Baltic Energy MarketInterconnector Plan (BEMIP) in June 2009. BEMIP is a plan for the futuredevelopment of the energy markets in the region. The EU has also launched theEU Economic Recovery Plan which gives substantial financial support to someof the essential BEMIP infrastructure projects in the region.The EU will also launch a Strategy for the Baltic Sea Region in 2009. Energyplays a central role in this strategy and the implementation of BEMIP will beone of the essential actions in this energy strategy for the Baltic Sea Region.Past experience has shown that political support is crucial to success indeveloping coherent and common energy policies and strategies for the region.The present report on Sustainable Energy Scenarios for the Baltic Sea regionclarifies the strengths of the region and the opportunities for shaping coordinatedregional energy policies and solutions that can meet the triple challenges ofrenewed growth, energy security of supply and climate change for the region.The report shows that the region has a sufficient potential of renewables, energyefficiency and new efficient technologies to become a low-emission growthregion with secure energy supplies in 2030.The report underlines that strong and dedicated cooperation on achieving theEU 20-20-20 goals will bring substantial economic benefits to the region as willfurther integration of the infrastructure in the region.
8
ENERGY PERSPECTIVES FOR THE BSR SUSTAINABLE ENERGY SCENARIOS
The present report has been initiated by Baltic Development Forum, preparedby Ea Energy Analyses and financed by Nordic Council of Ministers, NordicCouncil, and Fabrikant Mads Clausens Fond, Danfoss. The conclusions arethose of Ea Energy Analyses and do not necessarily represent the opinions ofthe organisations that have initiated the report. The report provides a good anduseful background and shows the great opportunities for designing co-ordinatedenergy strategies and policies to our common urgent challenge for the benefitof the region. In that capacity it will be included in the basis for the future co-operation in BASREC.
Hans Jørgen KochDeputy State SecretaryChairman of the BASREC Group of Senior Energy Officials1 July-30 June 2008-09
ENERGY PERSPECTIVES FOR THE BSR SUSTAINABLE ENERGY SCENARIOS
9
Preface by the Bal c Sea Parliamentary ConferenceWorking Group on Energy and Climate ChangeLife on Earth is impossible without production, conversion and transmission ofenergy in all its diversity. Those who are able to find energy in the environmentand use the resources rationally are better fit to meet the challenges of life andare more likely to survive over long periods of time. Today, energy issues havea higher priority in our daily life than ever before. On one hand, fuels which fedeconomies and countries throughout the last century are becoming scarce dueto intensive and often inefficient use, on the other hand, wasteful use of energyand fuels in just a few human generations have released back to the environmentchemical compounds which cause a warming of the Earth’s atmosphere, leadingto irreversible catastrophic changes in the foreseeable future.Effects on the climate are global and not restricted by national or politicalborders, thus in order to mitigate and stop climate change, our efforts must beglobal, agreements regional and actions - individual. The Baltic Sea Region joinscountries with very different economies and energy resources, but for naturalor historical reasons there are still gaps and barriers between different areas.This report, using transparent analytical instruments, weighs today’s situationand draws scenarios for a common future. The diversity of fuels and energyproduction is seen as an advantage rather than an obstacle, as it has created awide range of practices and know-how in the fields of energy production andsustainable use. With dedication and co-operation this unique opportunity canbe developed into a world-leading concept of energy efficiency supporting ourimminent efforts to stabilize the environment of our overheating planet Earth.As a marine biologist I have learned how delicate the energetic balance of globalenvironment is, and I have seen the consequences of recent developments inhuman energy consumption. This report looks several generations ahead,helping us to plan and secure our energetic future.
Mart Jüssi, MPChairman of the Estonian Parliament Environment CommitteeChairman of the BSPC WG on Energy and Climate Change
10
ENERGY PERSPECTIVES FOR THE BSR SUSTAINABLE ENERGY SCENARIOS
Preface by the Union of Bal c Ci esEnergy CommissionEnergy will be one of the defining issues of this century. A new global revolutionis needed in ways of how energy is used and supplied. We need this energyrevolution not only for stopping the green house gas emissions that cause climatechange, but also for generating jobs and new economic growth. Energy demandis soaring like never before as populations grow and economies start to take offagain. Millions of citizens in the new democracies around the Baltic Sea Region(BSR) are expecting to enjoy a lifestyle that definitely requires more energy.This report outlines how we as municipalities and cities can take concrete actionto meet this challenge. The technology and science is there – what is missingis a strategy and decisive measures on a local political level. The policies in theBSR related to energy and associated big tech infrastructure will increasingly bea national and regional concern. This report is visionary in its BSR integratedmarket approach. But its greatest value is that it defines the importance of theSmall Tech measures that can be taken on a local municipal level in order toimplement a better energy system and the thereby meet global and regionalenvironmental targets. This report definitely puts us citizens back in the driver’sseat and in charge of our own future.
Stefan WindhUBC Energy commission
ENERGY PERSPECTIVES FOR THE BSR SUSTAINABLE ENERGY SCENARIOS
11
1
Summary and recommenda ons1.1 Introduction
Baltic 21 Energy
In 1996-1998 the first comprehensive energy study for the Baltic Sea Region,Baltic 21 Energy, was carried out, investigating a sustainable energy developmentthe Baltic Sea Region. The study, carried out by authorities, non-governmentalorganisations and consultants, concluded, that a sustainable pathway wouldinclude energy savings in all sectors, reduction of losses in energy transformationand increased use of renewable energy and natural gas in the energy system inthe region.
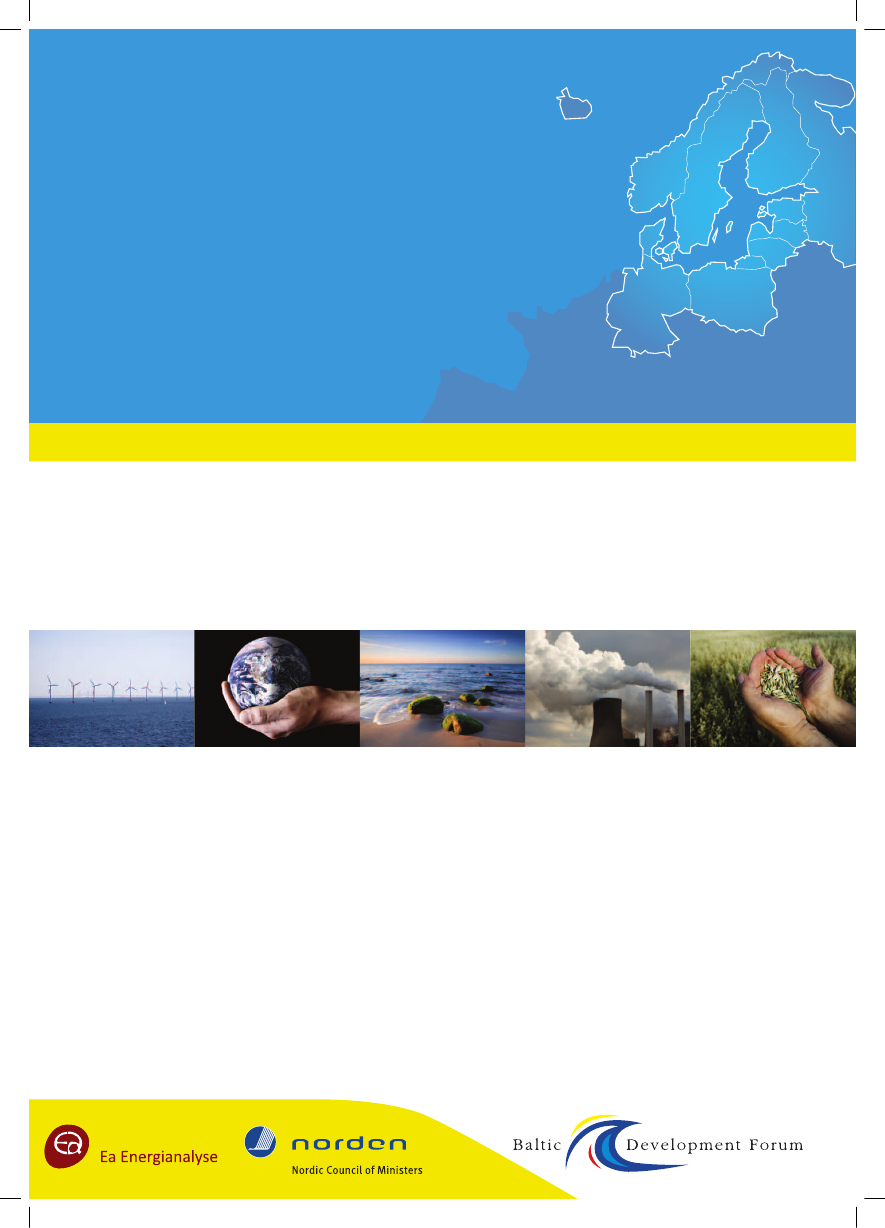
Figure 1: The Baltic Sea Region: Denmark, Estonia, Finland, North East Germany, North West Russia,Kaliningrad, Latvia, Lithuania, Poland, Norway and Sweden.
Baltic Ring I and II
In the same period the electricity sector in the region carried out the first BalticRing study with the purpose of examining the benefits from stronger electricityinterconnectors in the Baltic Sea Region. In 2003, the second Baltic Ring studywas concluded, this time with more focus on market integration. Both studiesconcluded that a stronger cooperation between the stakeholders around theBaltic Sea would benefit the development of the electricity sector.In recent years the energy agenda has changed in Europe. The EU countrieshave placed a strong focus on meeting the challenges from climate change. Theenergy sector has to comply with tough targets for the reduction of greenhousegas emissions, targets for deployment of renewable energy sources and targetsfor energy efficiency improvements. At the same time, security of fuel supplyhas become an even more urgent topic on the energy agenda.
New energy agenda
12
ENERGY PERSPECTIVES FOR THE BSR SUSTAINABLE ENERGY SCENARIOS
This agenda calls for a new basis for strategic decisions and an updated overviewof the possibilities for developing the energy system in the Baltic Sea Region.It is particularly relevant to explore the potential in the region for developingregional solutions to the energy challenges and to identify projects that couldbenefit the region as a showcase for sustainable energy development andbecoming frontrunners in innovative solutions through regional cooperation.BEMIP and the EUBaltic Sea RegionstrategyIn June 2009 the eight Baltic EU member states reached agreement on a BalticEnergy Market Interconnection Plan (BEMIP), underlining the urgent needfor connecting the Baltic region with the EU. The BEMIP is also identifiedas a flagship project in the broader context of the EU Strategy for the BalticSea Region, presented by the EU Commission on 10 June 2009. The plan andstrategy highlight the need for a stronger regional co-operation in the field ofenergy in order to harvest the potential synergies in the region.In this context Baltic Development Forum (BDF) has initiated the study‘Enhanced regional energy cooperation in the Baltic Sea Region. The study isa multi-client study, financed by Nordic Council of Ministers, Nordic Council,Baltic Development Forum and Fabrikant Mads Clausens Fond, Danfoss andcarried out by the consulting company Ea Energy Analyses.The study has two parallel objectives:1) To promote a common energy agenda for the Baltic Sea Region through theinvolvement of key stakeholders;2) To provide a substantial basis for discussion of different energy scenariosfor the region based on an analysis of energy data of all the countries in theregion.The study consists of three phases. The first phase (mid 2008 – ultimo 2008)included an overview of the current energy situation, collection of data forthe region and setting up of scenarios for the future regional energy system.Phase II of the project (beginning of 2009 – mid 2009) includes more detailedscenario analyses of the electricity and district heating markets and a prioritizedlist of regional projects/policies to promote the region as a sustainable region.A vital part of this phase has been to collect data for the whole region, includingNorthwest Russia. A planned phase III will develop strategies for the deploymentof regional projects, identify activities for regional knowledge sharing in the fieldof sustainable energy, and outline the possibilities for the industry to be frontrunners in the development of new energy technologies.Dialogue with the stakeholders on the energy scene in the Baltic Sea Region hasbeen an important part of the study process. Preliminary results from the studyhave been presented and discussed at a number of occasions. See Annex 1 formore details about the stakeholders’ involvement.Phase II of the study is documented in two reports. This summary report gives anoverview of the approach, the results and recommendations from the analyses.More detailed information is provided in the background report.
The present study
Objectives
Three phases
Dialogue with thestakeholders
Summary report andbackground report
ENERGY PERSPECTIVES FOR THE BSR SUSTAINABLE ENERGY SCENARIOS
13
1.2 Scenarios in phase I and phase IIDifferent scenario techniquesIn the study, two different scenario techniques have been used.Phase I scenariosThe scenarios in phase I are inspired by a study for the European Parliament1,where the future composition of technologies in the energy system are based onbest estimates and visions for the development of a sustainable energy system.These estimates are then evaluated and fitted to meet the political targetsregarding CO2, shares of renewable energy and non-quantified objectivesregarding security of supply and different stakeholder involvements in thedecision process. The scenarios comprise the whole energy system includingthe transport sector.The scenarios in phase I were developed with STREAM, a bottom-up basedspread-sheet modeling tool looking at the energy flows of the region on anannual basis2.Phase II scenariosIn phase II, the scenarios focus on detailed analyses of the electricity and districtheating system in the Baltic Sea Region. The future composition of technologiesin the electricity and district heating system are determined by the energy marketmodel Balmorel3, developed as a part of the energy cooperation in the BalticSea Region in the late 1990-ties. The model decides which technologies shouldbe used, based on input of technical and economical data for the individualtechnologies and assumptions about the future fuel prices. The model calculatesa least cost solution for the whole system taking the given constraints regardinge.g. CO2-targets and shares of renewable energy into account.Both scenario techniques have their strengths and in a dialogue process, as thepresent study, the combination of the techniques gives valuable information tothe decision making process between the stakeholders in the region.
Phase I: Big Tech and Small Tech scenariosDataPhase I of the study focused on a description of the current situation in theenergy sector in the Baltic Sea Region and collecting data for the scenarios,including data for relevant new technologies that could be used in the futureenergy system in the region.In order to shed light on different pathways towards achieving the long-termstrategic goals of the region two essentially different developments have beenexplored through a so-called Small-tech scenario and a Big-tech scenario. Bothscenarios aim at achieving two concrete goals for 2030: reducing CO2emissionsby 50 % compared to the 1990 level and reducing oil consumption by 50 %compared to the present level.1 Future energy systems in Europe, STOA-20092 See. www.streammodel.org3 See www.balmorel.com
Targets
14Small-tech scenario
ENERGY PERSPECTIVES FOR THE BSR SUSTAINABLE ENERGY SCENARIOS
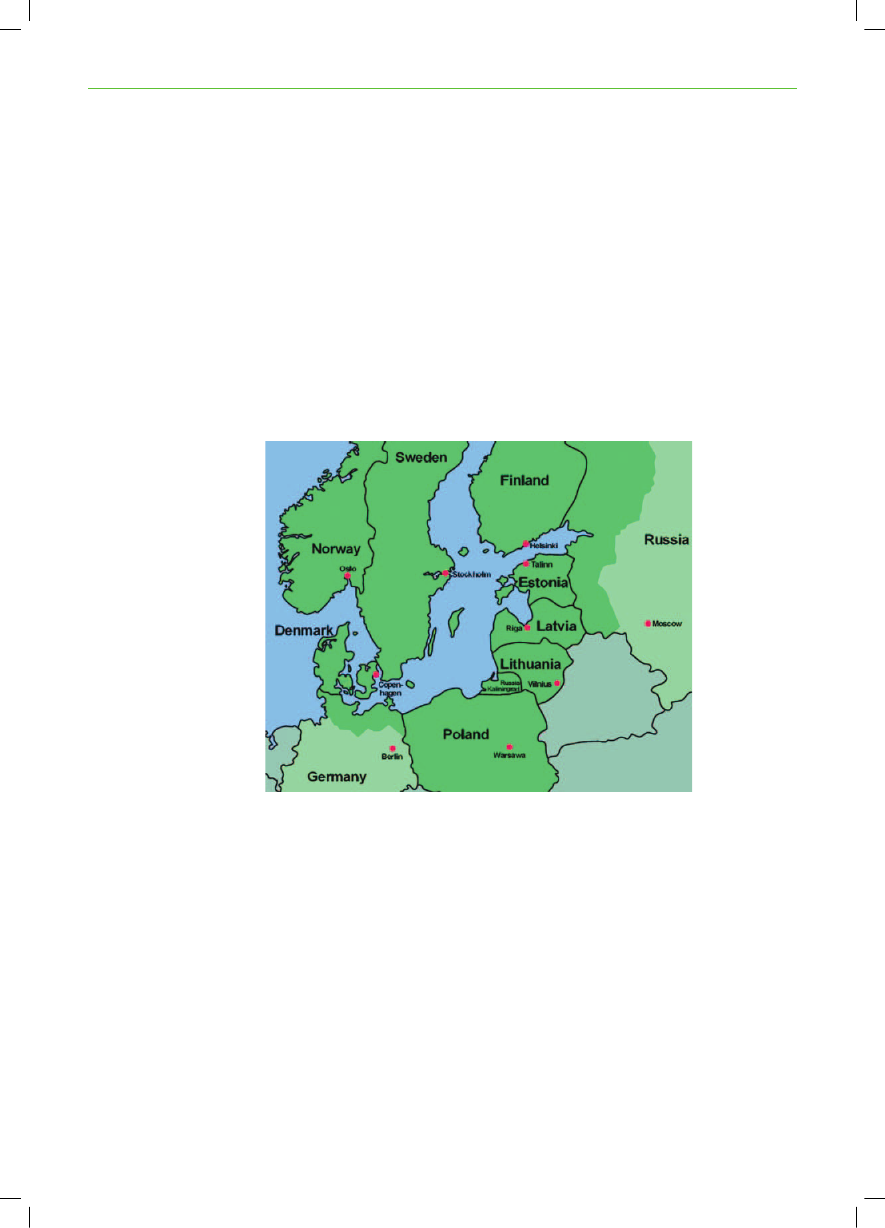
The Small-tech scenario focuses on distributed energy generation, energy savingsand efficient utilisation of energy through combined heat and power generation.This scenario assumes a high level of interconnection of the electricity gridsin the Baltic Sea Region to allow for the integration of a high share of windpower. So-called ‘smart grid technology’ and improved communication betweenthe different parts in the energy system play a key role in providing an optimaldispatch and efficient utilization of the energy infrastructure.The Big-tech scenario explores the opportunities of more centralised solutions.In the Big-tech scenario, almost all new coal and natural gas power plantsestablished from 2020 and onwards will be equipped with carbon capturestorage technologies (CCS). In addition, it is assumed that most new large coalpower plants commissioned in the period 2010-2020 are prepared for CCS andretrofitted in the subsequent decade. The nuclear power capacity will be increasedby 35 % compared to today. New nuclear generation capacity is presumed to bebuilt in Finland, Lithuania and Poland, and existing nuclear power plants inGermany, Sweden and North West Russia will continue generation.In both scenarios the transport sector undergoes fundamental changes in orderto comply with the target of 50 % oil reduction. In both the Small tech andthe Big-tech scenarios it is a critical assumption that the technical potentialsfor improving the fuel economy of conventional vehicles are partly realised.Moreover, in the Small-tech scenario, electric vehicles and plug-in hybridsdisplace oil consumption, and information and communication technologies areput in place to decrease the demand for “physical” transportation. In the Big-techscenario, in addition to the electrification of the transport sector 2ndgenerationbiofuels and natural gas are important means for reducing oil dependence.In the Big-tech scenario, the existing structure of the energy supply systemremains essentially unchanged, and the large suppliers of electricity become themain actors. Hence, the implementation of the Big-tech scenario depends onrelatively few decision-makers. Partnerships for the demonstration of the CCStechnology provide an obvious opportunity for regional cooperation in the Big-tech scenario.In the Small-tech scenario, citizens play an important role as active consumersof energy, changing energy behaviour according to price signals and investingin energy-efficient appliances and buildings; grid owners must develop theirsystems and the suppliers of energy will have to change sources graduallyfrom large power plants to renewables and to distributed units located closerto the consumers. In the Small-tech scenario the integration of fluctuatingenergy sources calls for a high level of cooperation on energy markets and newinfrastructure projects, particularly concerning off-shore wind. Local authoritiesand cities are crucial for the facilitation of district heating grids and sustainabletransport systems – and the need for more efficient supply and demandtechnologies provides business opportunities in many industry branches.
Big-tech scenario
Transport
Key decision makersin the two scenarios
ENERGY PERSPECTIVES FOR THE BSR SUSTAINABLE ENERGY SCENARIOS
15
Figure 2: Key decision makers in the Small-tech and Big-tech scenarios
Results
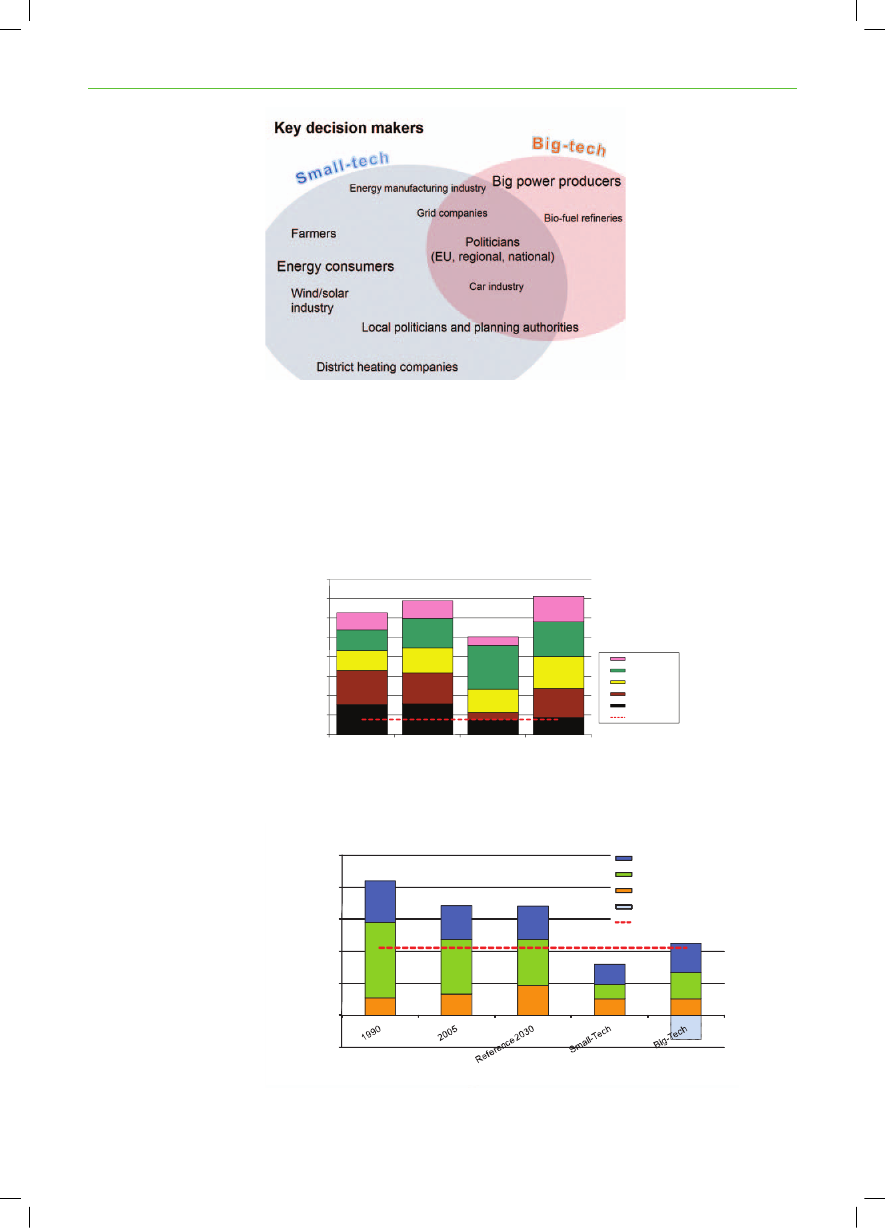
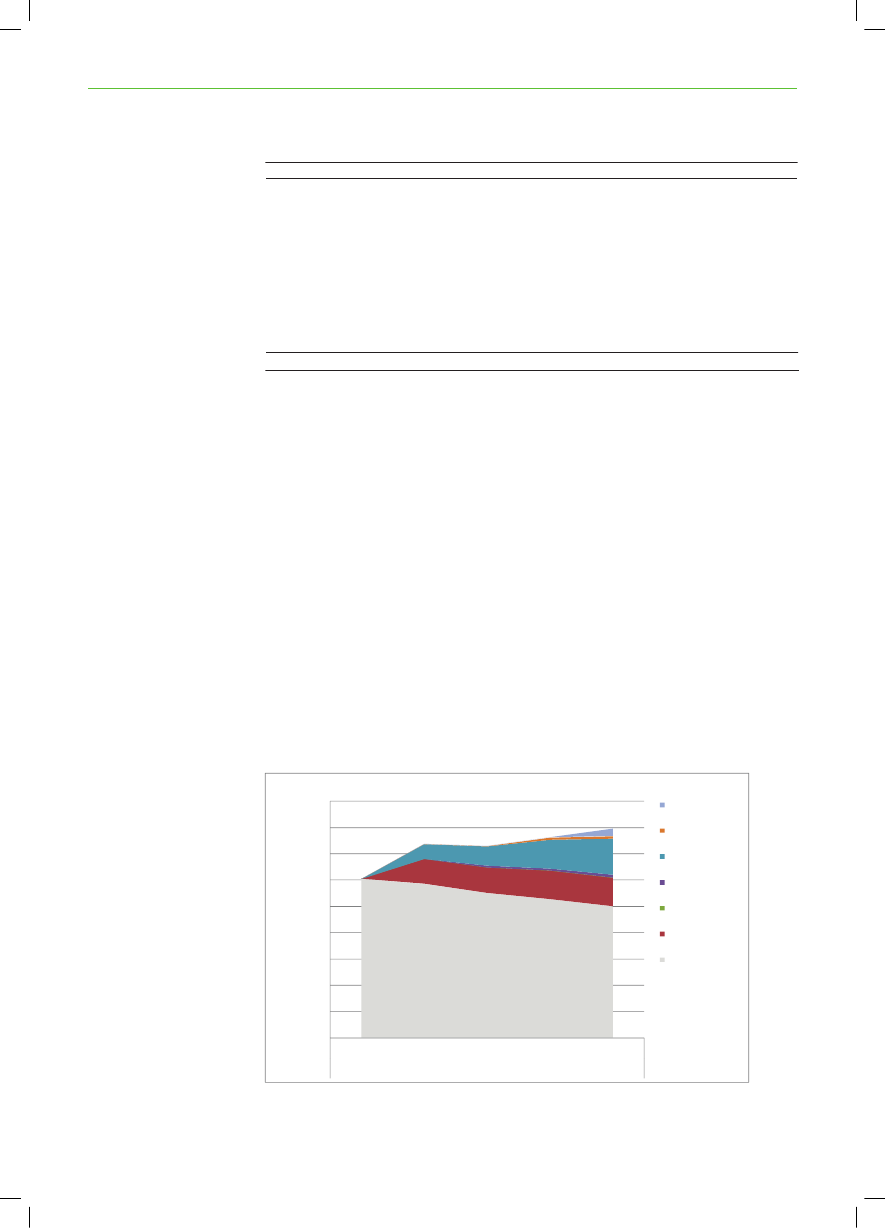
To illustrate the consequences of the two scenarios, the key indicators – thedevelopment in gross energy consumption and the emission of CO2– arecompared with historic data as well as with a reference for 2030 resembling themost recent projection from the European Commission.Gross energy consumptionPJ16.00014.00012.00010.0008.0006.0004.0002.000-NuclearRENatural gasCoalOil50% oil target
2005
Reference 2030
Small-Tech
Big-Tech
Figure 3: Gross energy consumption in 2005 and projections for 2030 (excluding fuels for non-energypurposes). Data is only included for North East Germany and North West Russia.Mt CO2 / year1.000
CO2- emissionsOther energyElectricity and district heat
800
TransportStored CO2
600
50% CO2 target
400200
-
-200
Figure 4: CO2emissions from the energy and transport sectors in 1990, 2005 and projections for2030.“Other energy” includes oil, gas and coal used in households, industry and the trade/service sector. Datais only included for North East Germany and North West Russia.
16
ENERGY PERSPECTIVES FOR THE BSR SUSTAINABLE ENERGY SCENARIOS
The scenarios show that resources and technologies are available to achieve thetargets set out. In the Small-tech scenario, it is foreseen that the gross energyconsumption is reduced by approx. 20 % in 2030 compared to 2005. In the Big-tech scenario, gross energy consumption increases by 13 % compared to 2005.This increase, which is slightly higher than in the 2030 reference projection, ismainly due to increased utilisation of carbon capture and storage technologiesthat are expected to require a considerable expenditure of energy, particularlyfor the capture and transportation of CO2. In the Big-tech scenario, compliancewith the CO2-reduction target is secured by yearly storing almost 150 Mt of CO2underground by 2030.
Phase II: Detailed scenarios for electricity and district heatingIn Phase II of the project detailed scenario analyses have been developed forthe power and district heating sectors in the region. Besides showing a pathwaytowards lower CO2-emissions and an improved security of supply, the scenariosexplore the benefits of closer cooperation around the Baltic Sea on energy policiesand specific projects, as well as shedding light on the value of establishing newinterconnectors in the region.The scenarios in phase II are analysed using the energy market optimisationmodel Balmorel. Data used in the scenarios are publicly available data. Themodel optimises the system as a whole, but the electricity and heating systemare modelled for the individual countries, making it possible to examine thedifferences between regional targets, and targets for the individual countries.The scope of the analyses in phase II is to:examine how the electricity and district heating systems may developin order to comply with medium and long-term policy objectives givendifferent developments in the framework conditions;show the value of establishing new electric interconnectors;assess the costs and benefits of a concerted off-shore wind power planningand interconnection at Kriegers Flak.In Phase II the geographical scope of the analyses has been expanded to comprisethe whole f Germany, whereas Phase I only included the North Eastern part ofGermany bordering the Baltic Sea.
ENERGY PERSPECTIVES FOR THE BSR SUSTAINABLE ENERGY SCENARIOS
17
1.3 The Baseline scenarioThe frameworkScenarios toward 2030A Baseline scenario has been developed to show how the electricity sector inthe Baltic Sea region may develop leading up to 2030. The baseline scenarioseeks to combine measures from the Small- and Big-tech scenarios elaboratedin the project’s Phase I. Three alternative scenarios have been developed. Thesescenarios are described in Chapter 4.TheBaseline scenariodiffers from the traditional passive business as usualprojection by showing a way forward to actually achieving the EU targets ofreducing CO2-emissions by 20 % in 2020 and increasing the share of renewableenergy to 20 %. Moreover, a project target of a 50 % reduction of CO2comparedto 1990 is applied for 2030. Compared to 2005 this corresponds to a reduction ofCO2-emissions by 38 %. The means to achieve the policy targets in the Baselinescenario are to a large extent determined by the modelling tool based on a leastcost analyses of supply side measures.CO2targets 2005 2030 (Mt)700600500400300200100
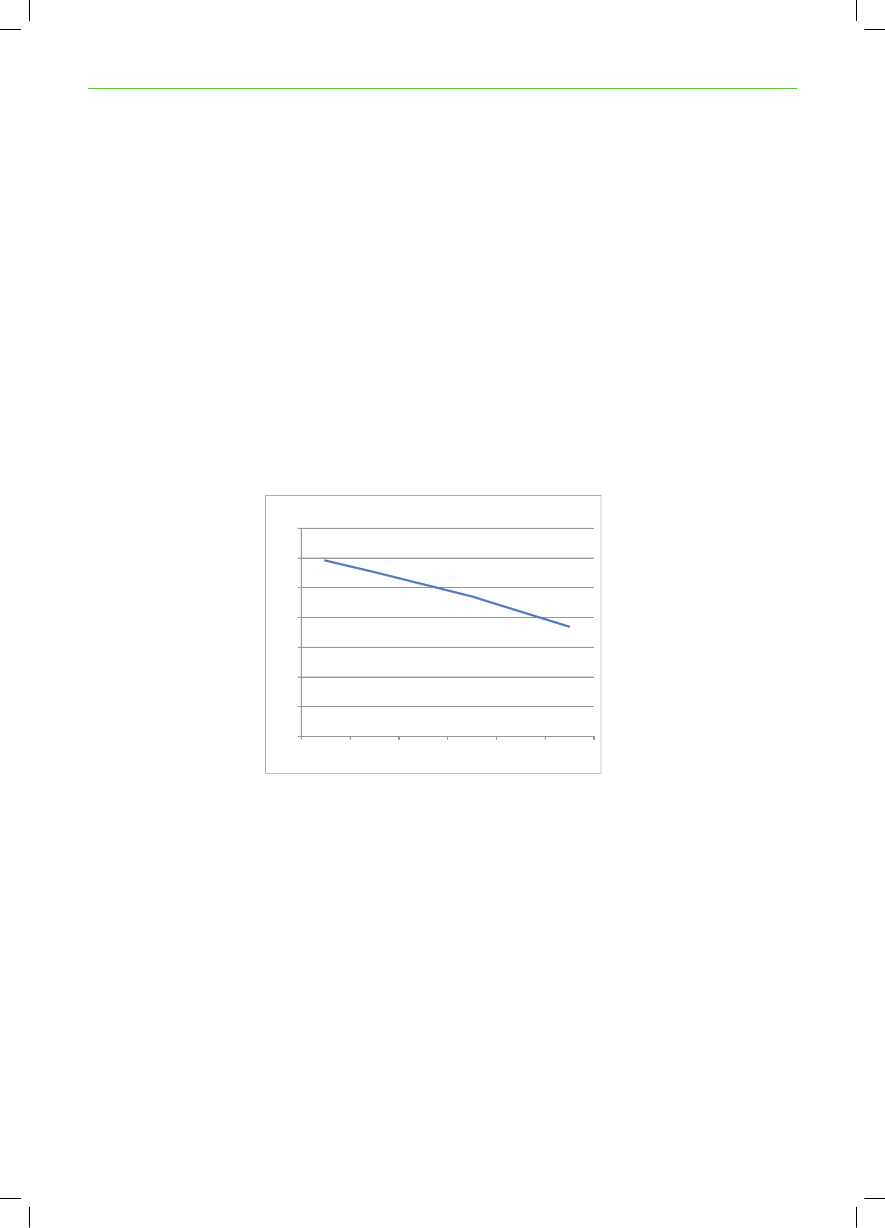
CO2-emission targets
2005
2010
2015
2020
2025
2030
Figure 5: Modelled targets for reducing CO2emissions from the electricity and district heating sectorsin the period 2005-2030 for the Baltic Sea Region. In 2020 CO2emissions from the electricity generatorsin the region are to be reduced by 21 % compared to 2005 as this is the general requirement for thecompanies encompassed by the EU CO2emissions trading system. In 2030, the target is to comply witha 50 % reduction of CO2compared to 1990 - compared to 2005 the target corresponds to a reduction by38 %. A linear development is assumed between 2005 and 2020 and between 2020 and 2030
EU renewableenergy targets
The targets for renewable energy are set in accordance with the renewableenergy directive endorsed at the EU Council Summit in December 2008. Therenewable energy directive provides a target for the share of RE of final energyin each member state, but not a separate target for the electricity sector.The level of renewable energy that will have to be introduced in the electricitysector will, among other things, depend on the economical and technicalopportunities compared to increasing renewables in other sectors such as thetransport sector and the industry. In the present analyses it is chosen to operatewith a target for the electricity sector corresponding to: RE share of electricityin 2005 + 1.5 * required increase in RE in overall final energy demand in thedirective.
18
ENERGY PERSPECTIVES FOR THE BSR SUSTAINABLE ENERGY SCENARIOS
As an example, 28 % of electricity consumed in Denmark in 2005 was suppliedfrom renewable energy. The RE directive requires Denmark to increase its shareof RE in final energy demand by 13 percentage points from 17 % in 2005 to 30% in 2020. Hence, the RE target for the Danish electricity sector is set at 48 %in 2020 (i.e. 28 % + 1.5 * 13 %).For the Baltic Sea Region as a whole renewable energy electricity correspondedto 26 % of total electricity supply in 2005. For 2020 the target for the region is37 % based on the approach outlined above. The targets are shown in Table 1.Russia has no target for RE.Final energy2005 RE share2020 targetIncrease 2005-2020Electricity2005 RE shareExpectedincrease inelectricitysector2020 targetGermany Denmark Estonia Finland Lithuania Latvia Poland Sweden Norway6%18%12%0%11%18%29%17%30%13%0%28%20%48%18%25%7%0%1%11%12%29%38%10%0%27%14%41%15%23%8%0%4%12%16%35%42%7%0%48%11%59%7%15%8%0%3%12%15%40%49%9%0%54%14%68%60%60%0%0%100%0%100%NWRussia3%0%0%0%19%NANAREGION14%25%11%0%26%15%37%
Table 1: Renewable energy targets. No renewable energy target has been included for North WestRussia
Fuel prices
The development in prices of fossil fuels is based on the latest forecast fromInternational Energy Agency’s (IEA) World Energy Outlook 2008 (WEO-2008).According to this projection the price of crude oil will increase from an expected100 $/bbl in 2010 to 122 $/bbl in 2030. The price of natural gas is expected torise from just above 5 €/GJ in 2010 to slightly over 10 €/GJ in 2010.Phase II of the present study focuses on the least-cost ways of achieving thetargets from a socio economic point of view. Hence, the existing country specificpolicy measures for promoting renewable energy are not considered in thecalculations as they would tend to divert investments in renewable energytechnologies to the countries with the most favourable support scheme, ratherthan the countries with the best renewable energy resources.The model has a data catalogue with a set of new power station technologies thatit can invest in according to the input data. The investment module allows themodel to invest in a range of different technologies including (among others)coal power, gas power (combined cycle gas turbines and gas engines), straw andwood based power plant, power plants with CCS and wind power (on and off-shore). Assumptions regarding technology data are presented in the backgroundreport.Regarding nuclear power, it has been chosen to model the development basedon best available information about the future role of nuclear in the differentcountries in the region as opposed to letting the model make the “optimalinvestments”. The nuclear forecast is made with the intention to form acompromise between the strong views (pro and against) towards nuclear poweramong politicians and other stakeholders in the region. In Sweden for example,
Existingsupport-schemes
Technology data
Nuclear
ENERGY PERSPECTIVES FOR THE BSR SUSTAINABLE ENERGY SCENARIOS
19
the nuclear capacity is assumed to remain at the existing level whereas a delayedphase-out is anticipated in Germany.MWDenmarkSwedenFinlandNorwayGermany2005-9,3722,656-20,2642010-9,3722,656-20,2642015-9,3724,256-20,2642020-9,3724,256-20,2642025-9,3724,256-17,8702030-9,3724,256-9,256
PolandLithuaniaEstoniaLatviaNW RussiaTotal
-1,200--5,76039,252---5,76038,052
----5,76039,652
-1,500--5,76041,152
2,0891,500--5,76040,847
4,3851,500--5,76034,529
Table 2: Assumed development in nuclear capacity in the Baltic Sea Region. This development is appliedin all scenarios.
With the exception of nuclear power and hydro power the investments in newpower producing units are determined by the model, based on informationabout the technical and economical data for each technology.A number of assumptions on the rate of decommissioning of existing plants areassumed. These assumptions are based on, among other things, the expectedtechnical life time of power plants, and in certain cases information about theconditions of specific power plants.
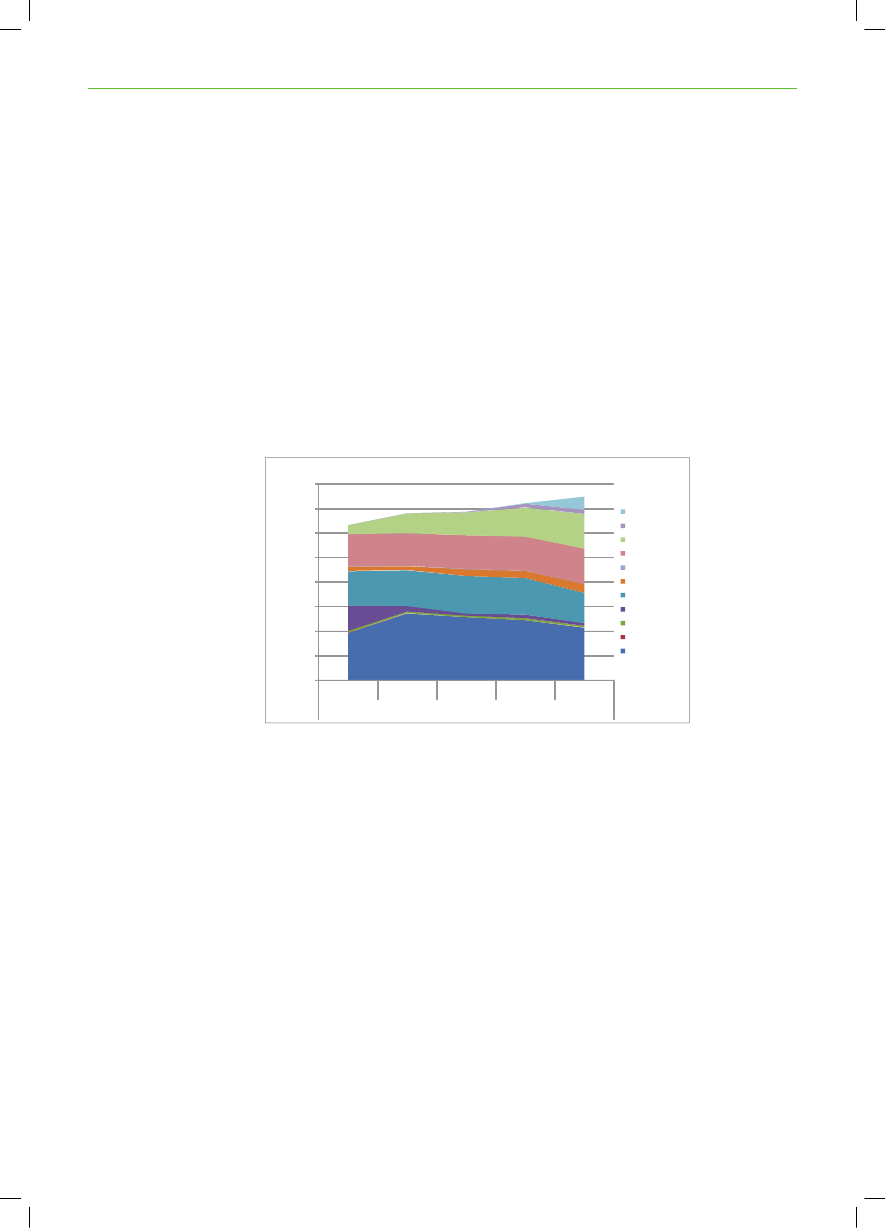
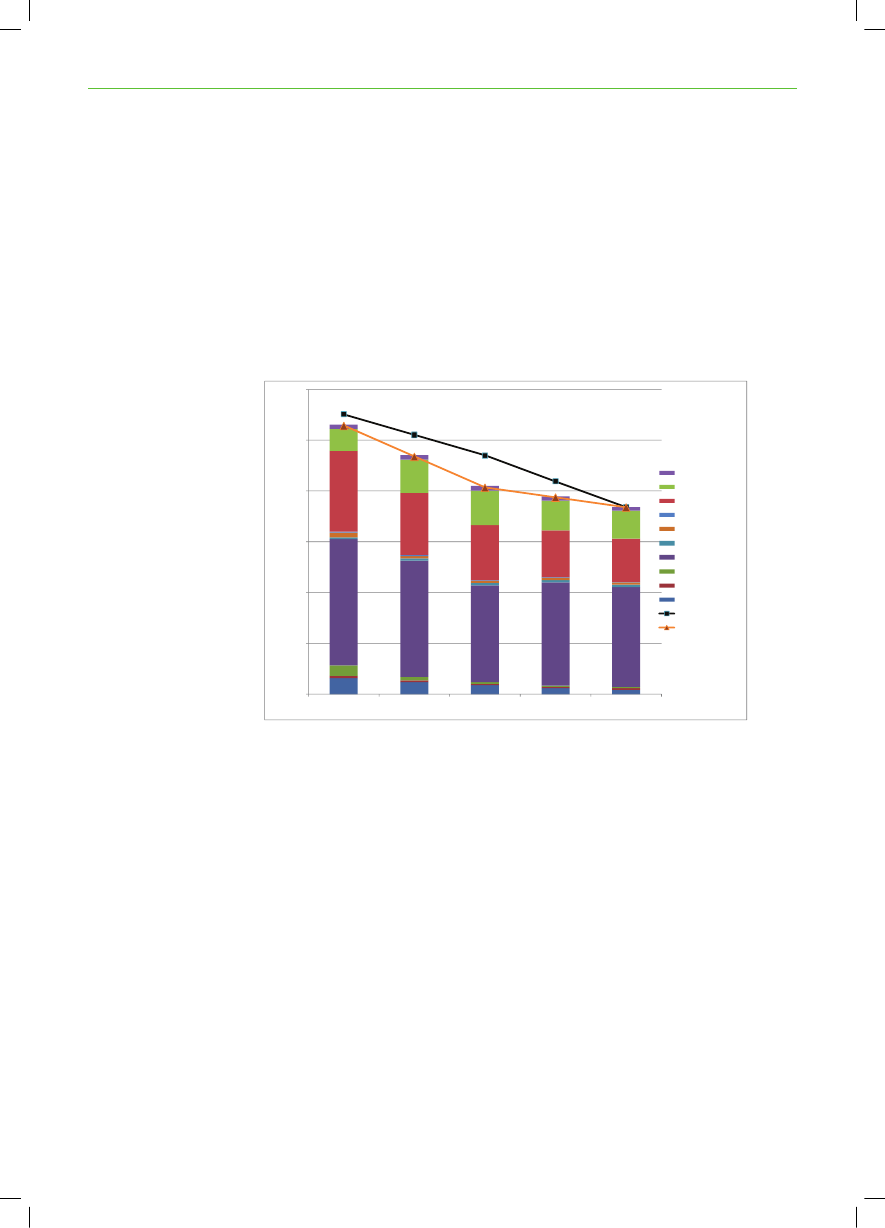
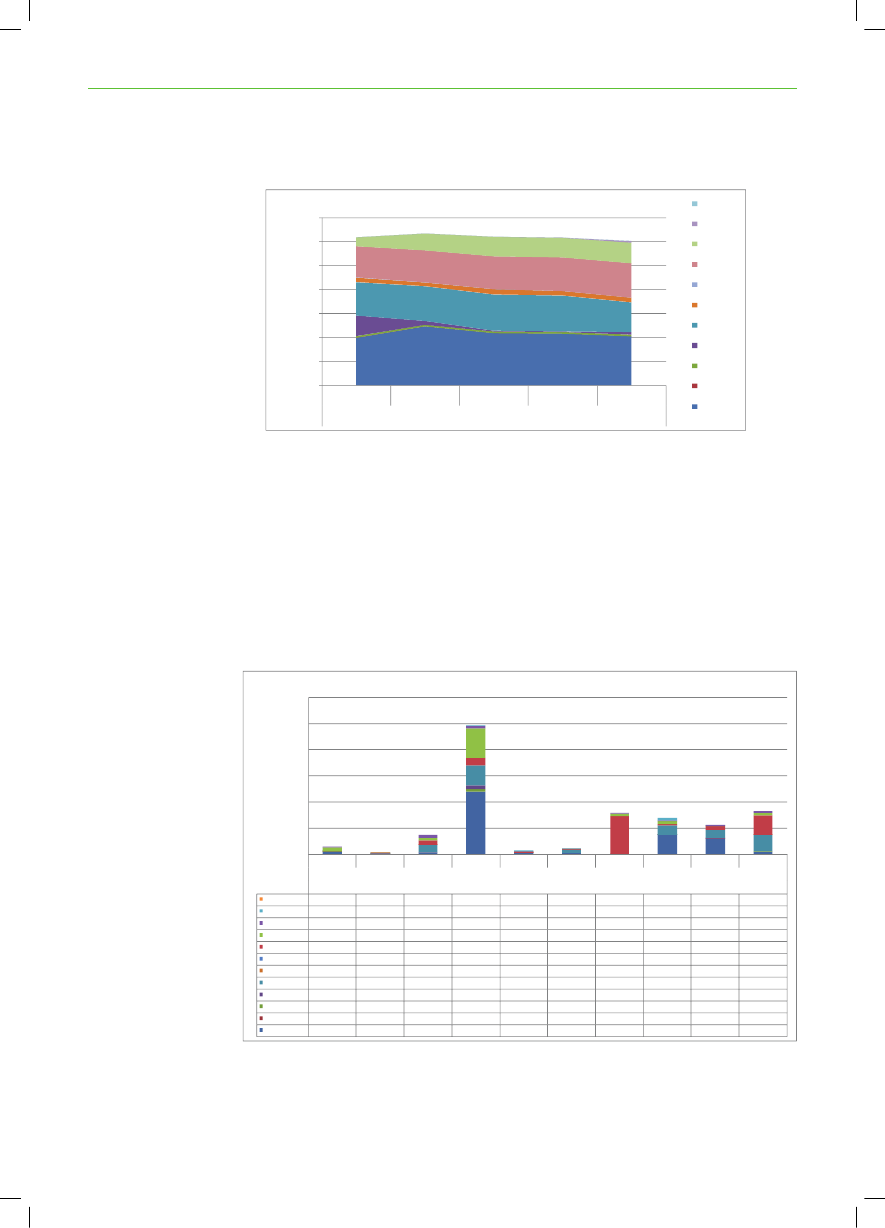
ResultsNew generation capacityFigure 6 shows the development in new generation capacity for the whole region– as determined by the model. Investments in new capacity are only allowedfrom 2015 due to the lead time of new generation facilities.Capacity by fuel450.000400.000350.000300.000250.000New - Coal CCSNew - BiogasNew - WindNew - Bio massNew - Natural gasNew - Coal and ligniteExisting capacity andplanned capacity
MW200.000150.000100.00050.000-201020152020Baseline scenario20252030
Figure 6: Total electrical capacity (MW) for Baseline scenario distributed on new and existing capacities
20Wind and coal
ENERGY PERSPECTIVES FOR THE BSR SUSTAINABLE ENERGY SCENARIOS
In the Baseline scenario it appears that the economically most attractivetechnologies are wind power and coal power. The coal fired power plants thatthe model chooses to invest in use new highly efficient technology with electricefficiencies of 48 % when running in condensing mode. The coal fired powerplants are primarily established in the beginning of the period while the windpower plants are established more evenly during the whole period from 2015 to2030.The model also invests in new biogas based generation capacity, new biomassfired capacity and coal fired power plants with CCS. The majority of theseinvestments are made in the period 2020-2030. Though the level of investmentsis fairly small compared to the investments in e.g. wind power, it indicates thatthese technologies are competitive.
Biogas and biomass
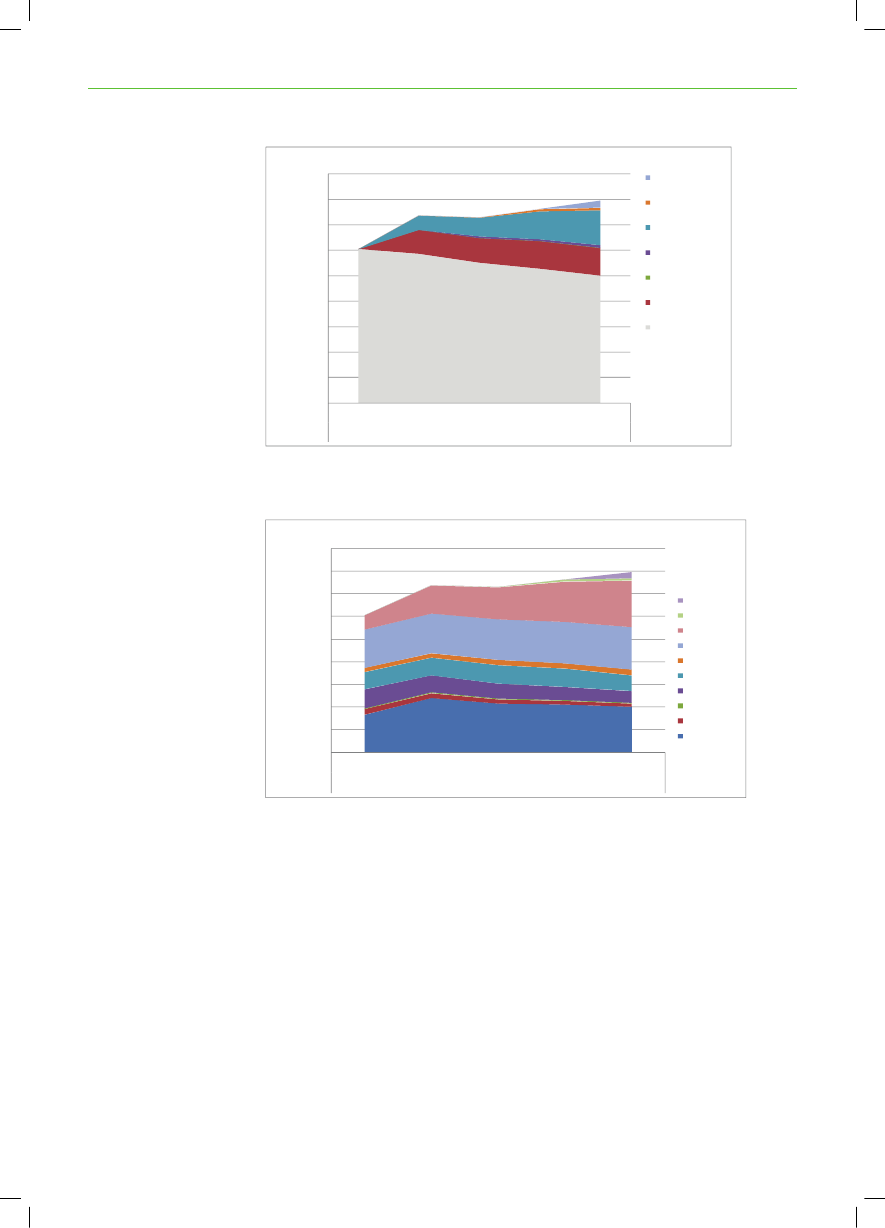
FuelsElectricity generation by fuel for all countries is shown in Figure 7 .Electricity generationElectricity genera on1.6001.4001.2001.000Coal CCSBiogasWindWaterOilshaleBiomassNuclearNatural gasWasteOilCoal and lignite
TWh
hW800T600400200-201020152020Baseline scenario20252030
Figure 7: Total electricity generation (TWh) by fuel for Baseline scenario.
Natural gasconsumption decreases
The utilisation of natural gas decreases very significantly between 2010 and 2015as a result of the investments in wind power and new efficient coal power plants.This development is particularly profound in Russia where approximately halfof the electricity is produced from natural gas in the 2010 simulation. It shouldbe mentioned that such a significant decrease in the demand for natural gas islikely to result in a drop in the regional natural gas price, which will to someextent moderate the overall impact. This correlation has not been quantified inthe model.The role of wind power is gradually increased over the period and by 2030 windpower is the largest source of electricity next to coal power and hydro. Biomassand biogas only gain some significance by the end of the period.
ENERGY PERSPECTIVES FOR THE BSR SUSTAINABLE ENERGY SCENARIOS
21
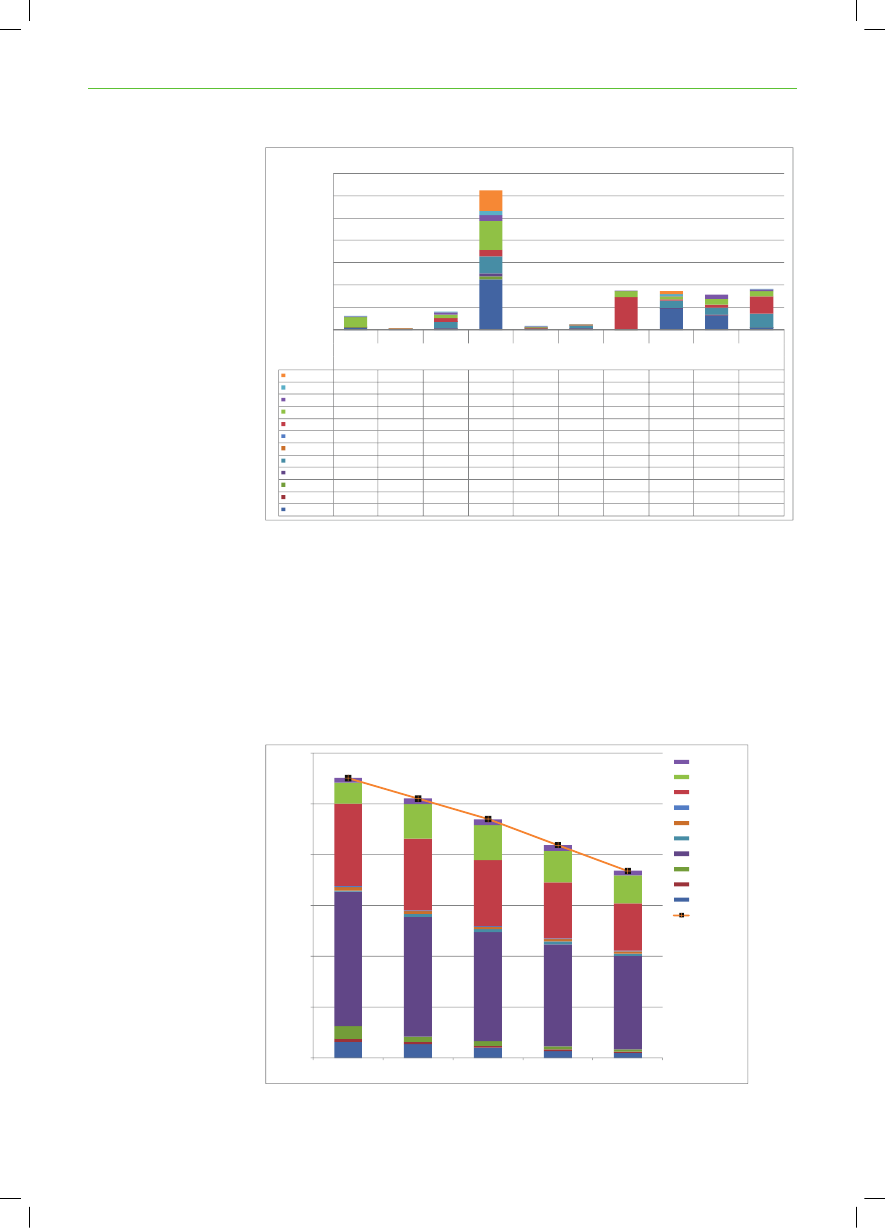
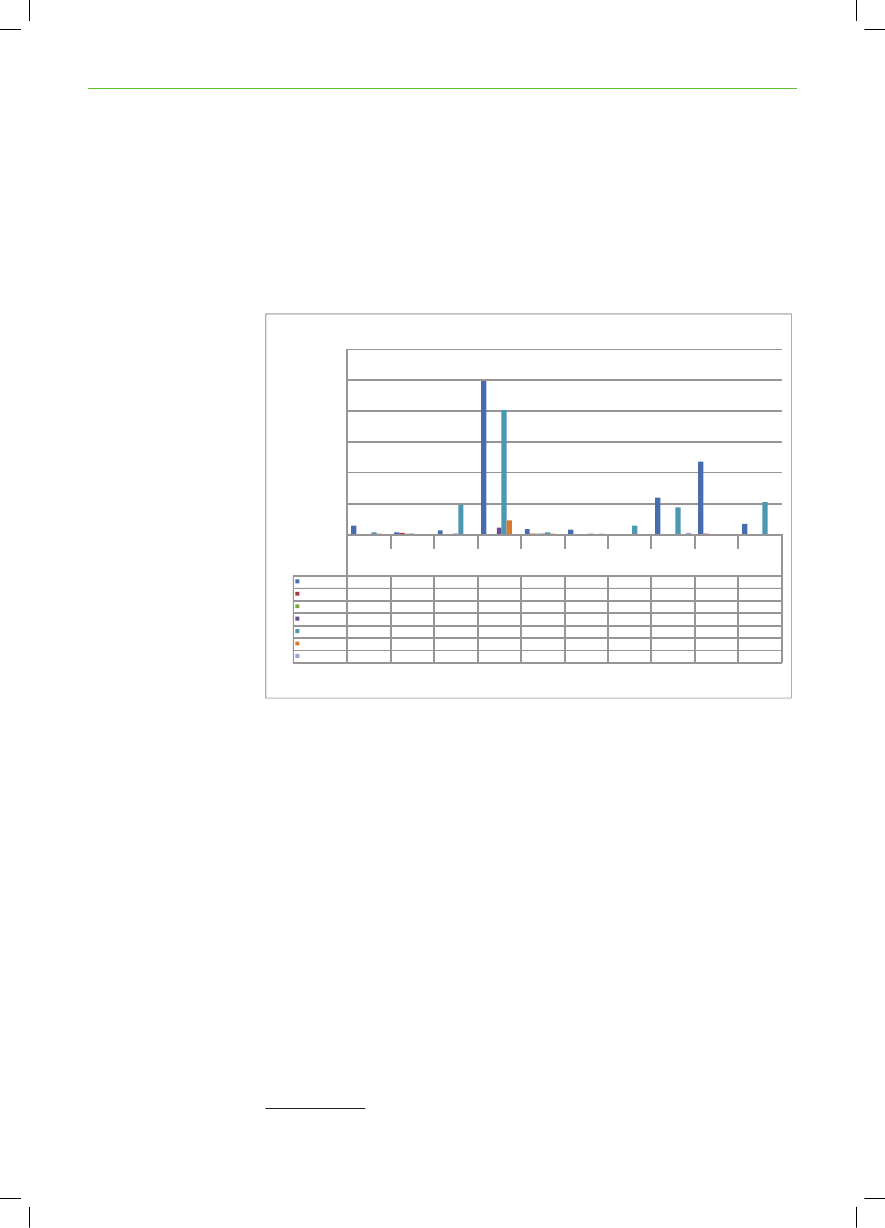
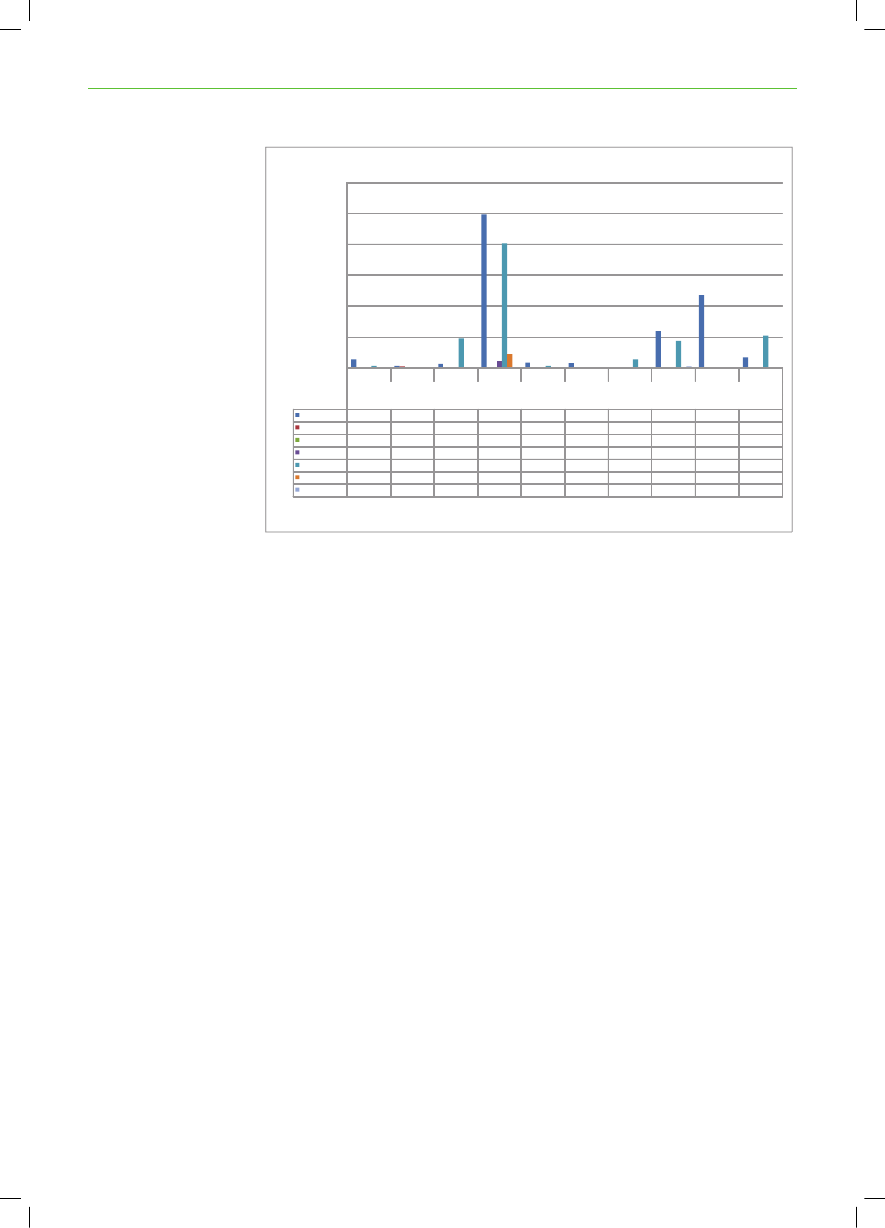
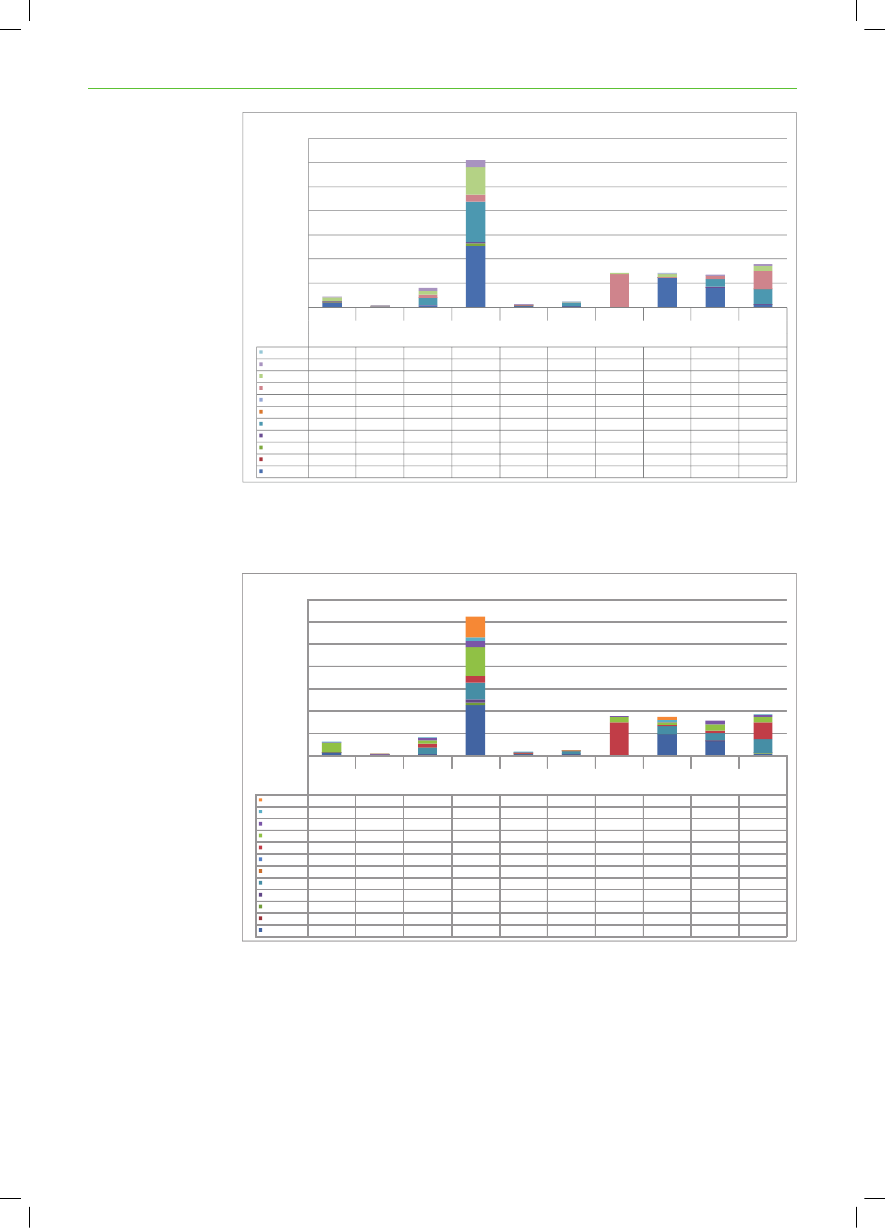
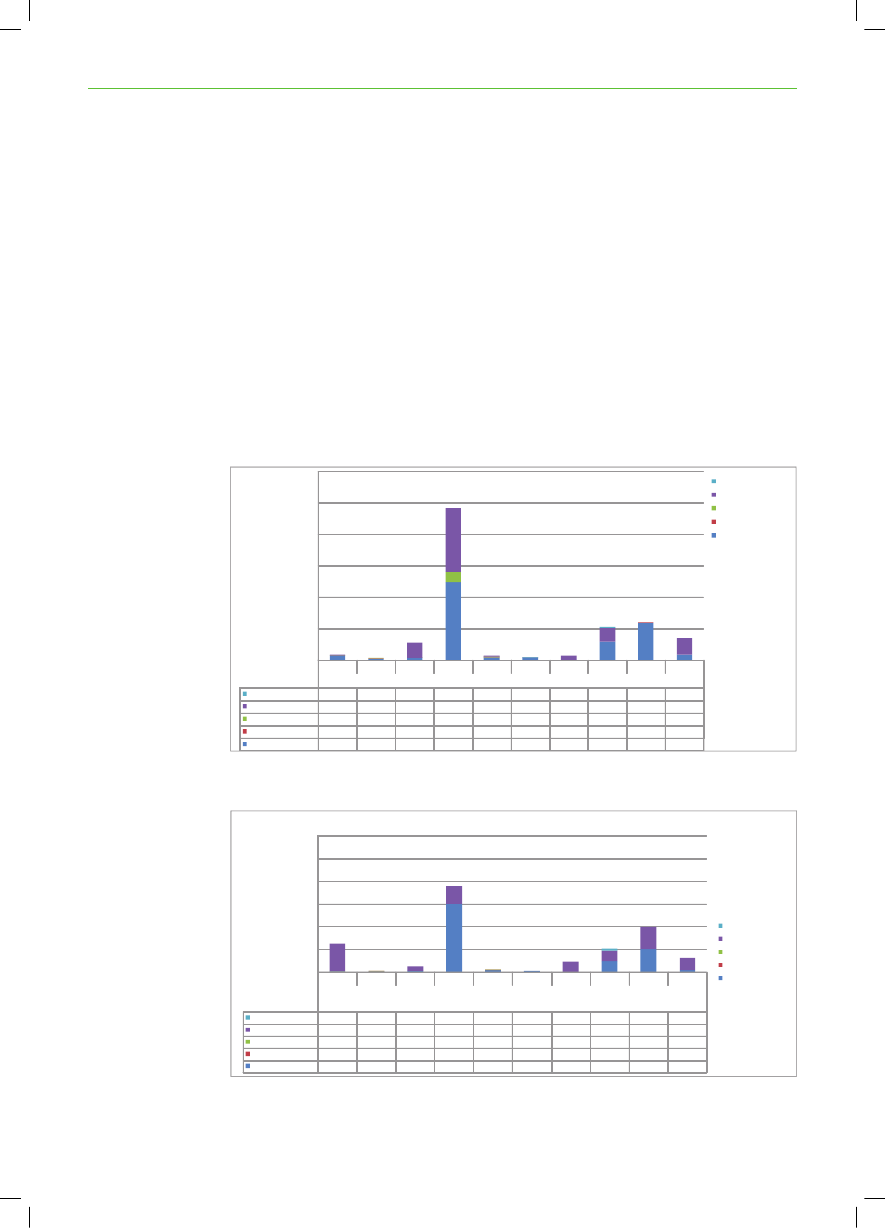
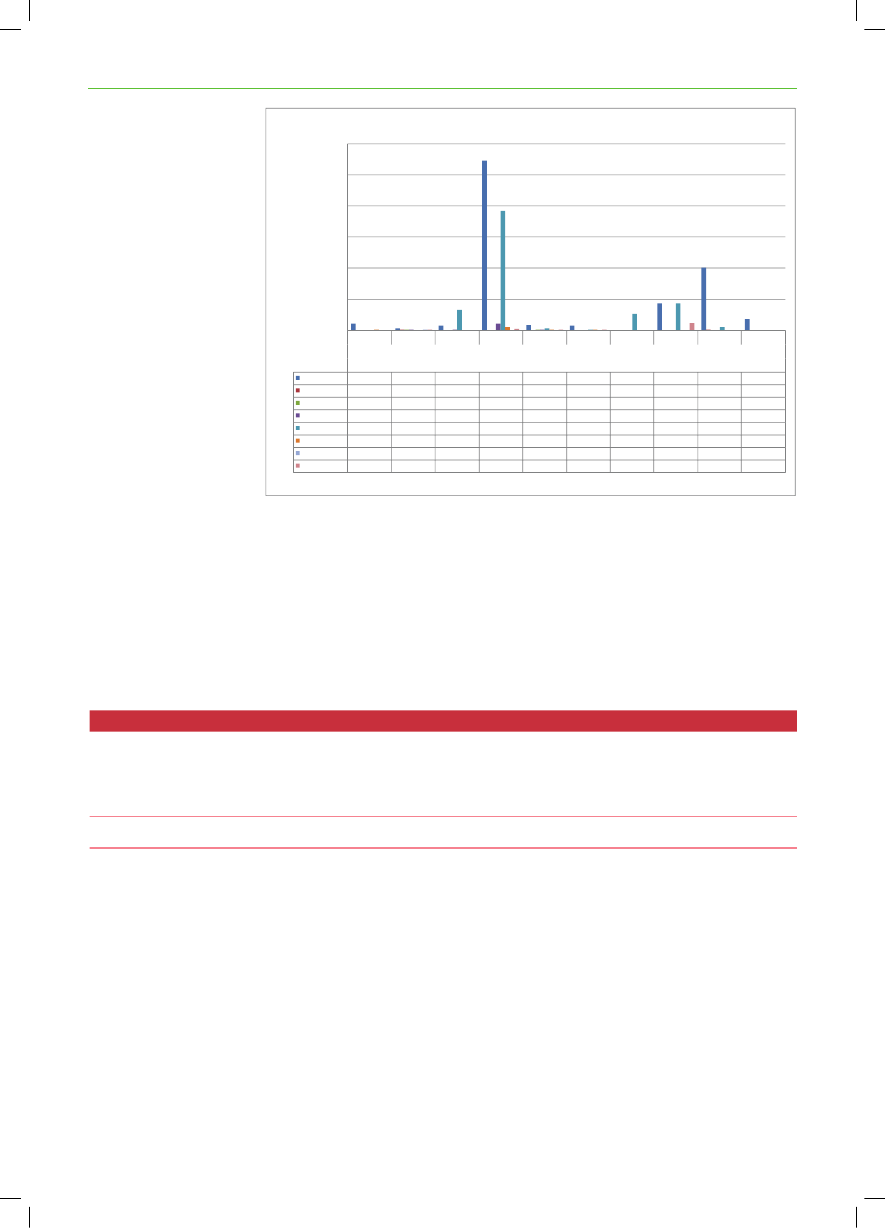
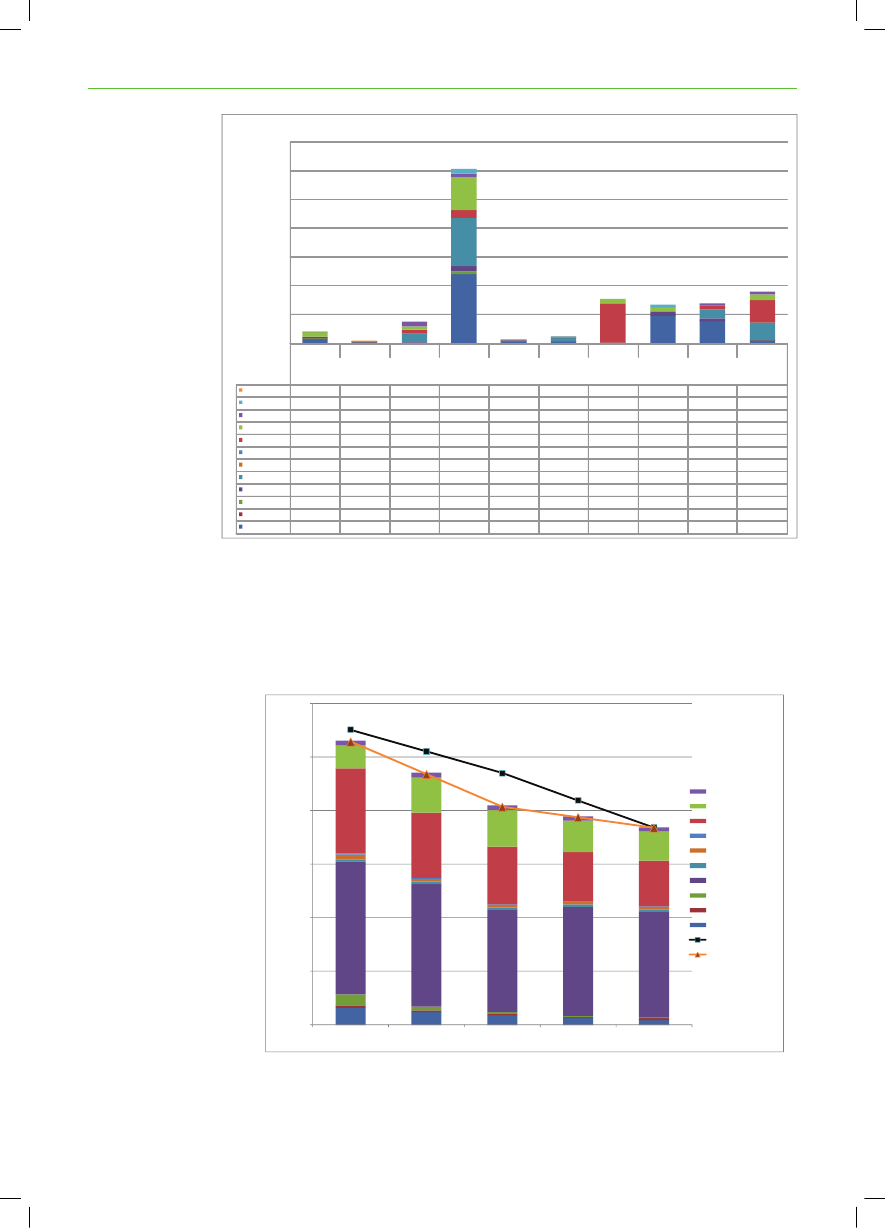
Figure 8 gives an overview of the electricity generation (TWh) for each countryin 2030 grouped byvfuel in the Baseline scenario.Electricity generationby countryElectricity genera onby country700600500400TWh
300200100-
DENMARK
ESTONIA
FINLAND
GERMANY
LATVIA
LITHUANIA2030
NORWAY
POLAND
RUSSIA
SWEDEN
Baseline scenarioC CSoal CBiogasBiomassWindWaterShalePeatNuclearNatural gasWasteOilC and ligniteoal120103100522760002917613111005950120103610065103146301224421112111616921826129301223110010251471492134172812192475
Figure 8: Electricity generation (TWh) for each country in 2030 grouped by fuel for Baseline scenario.
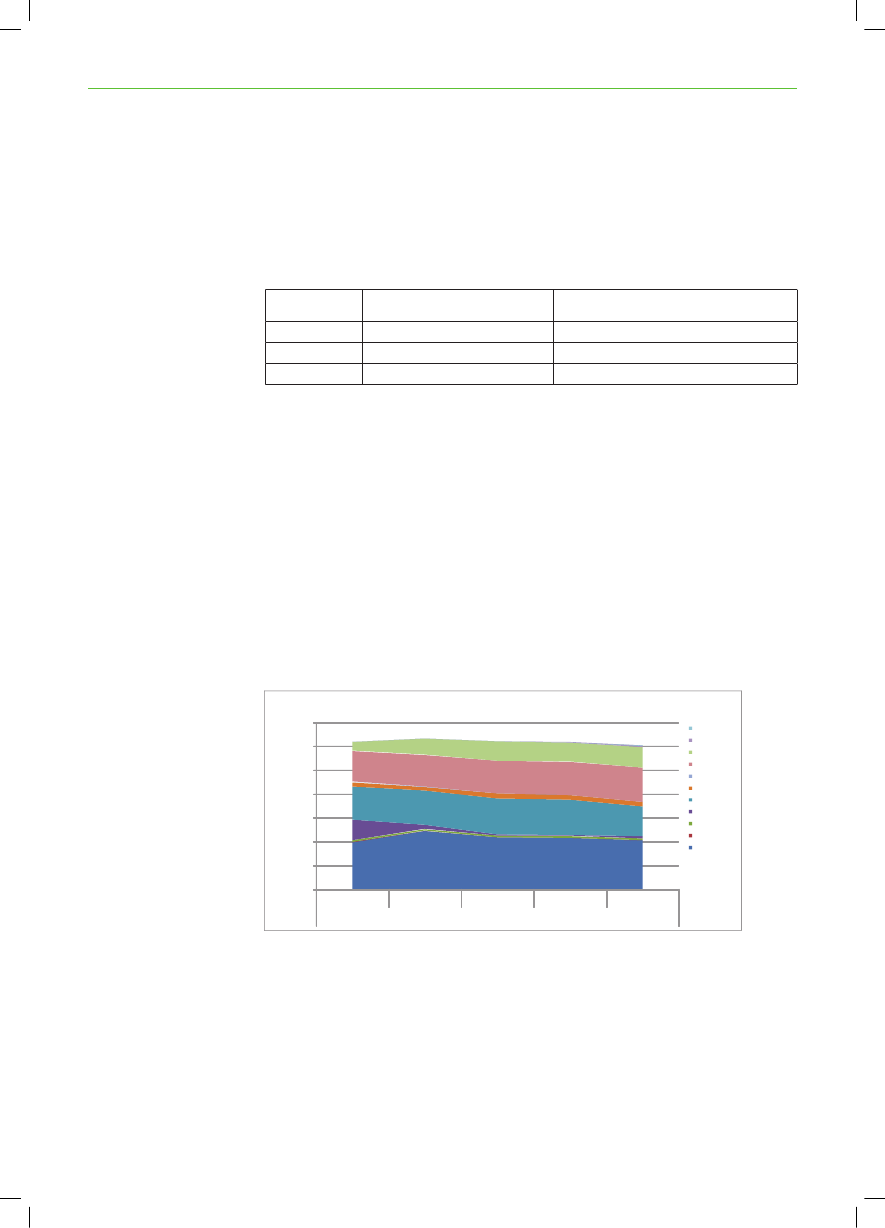
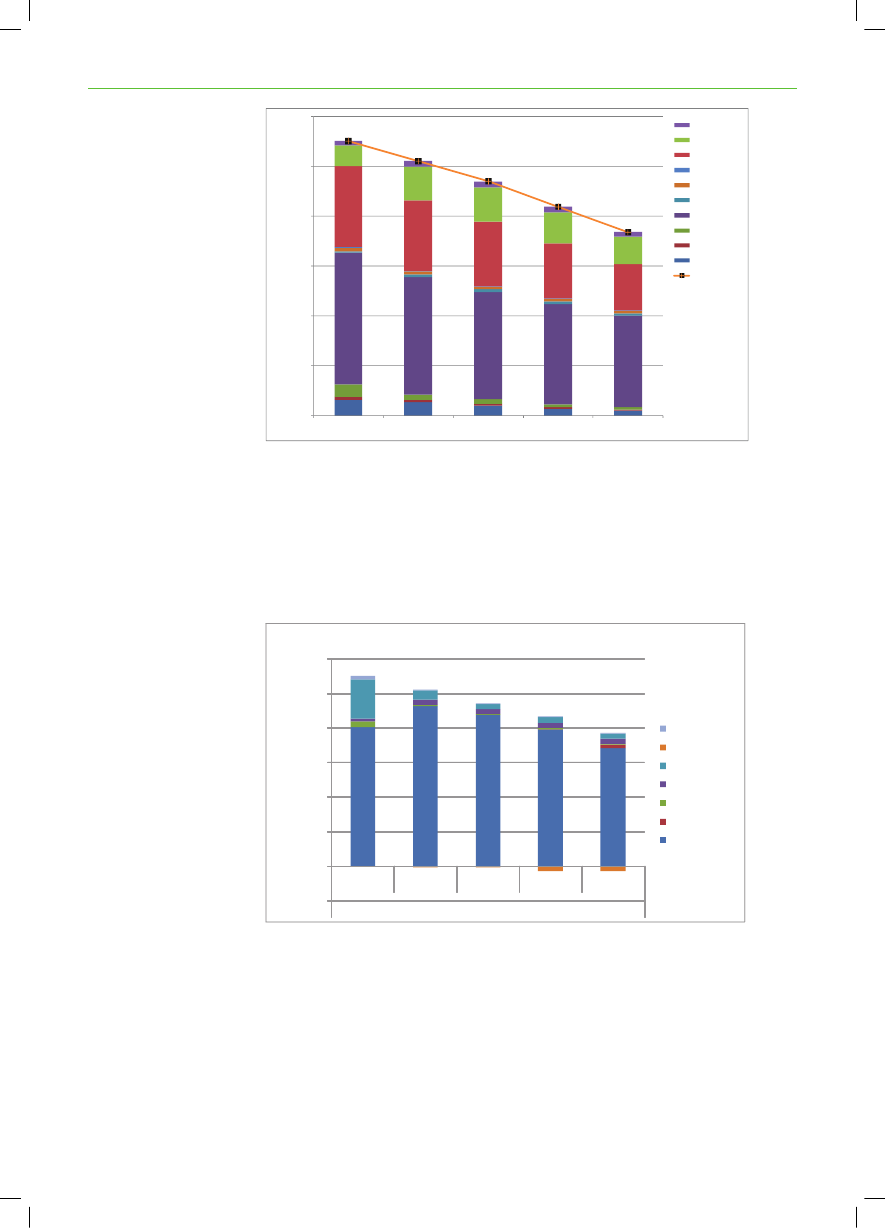
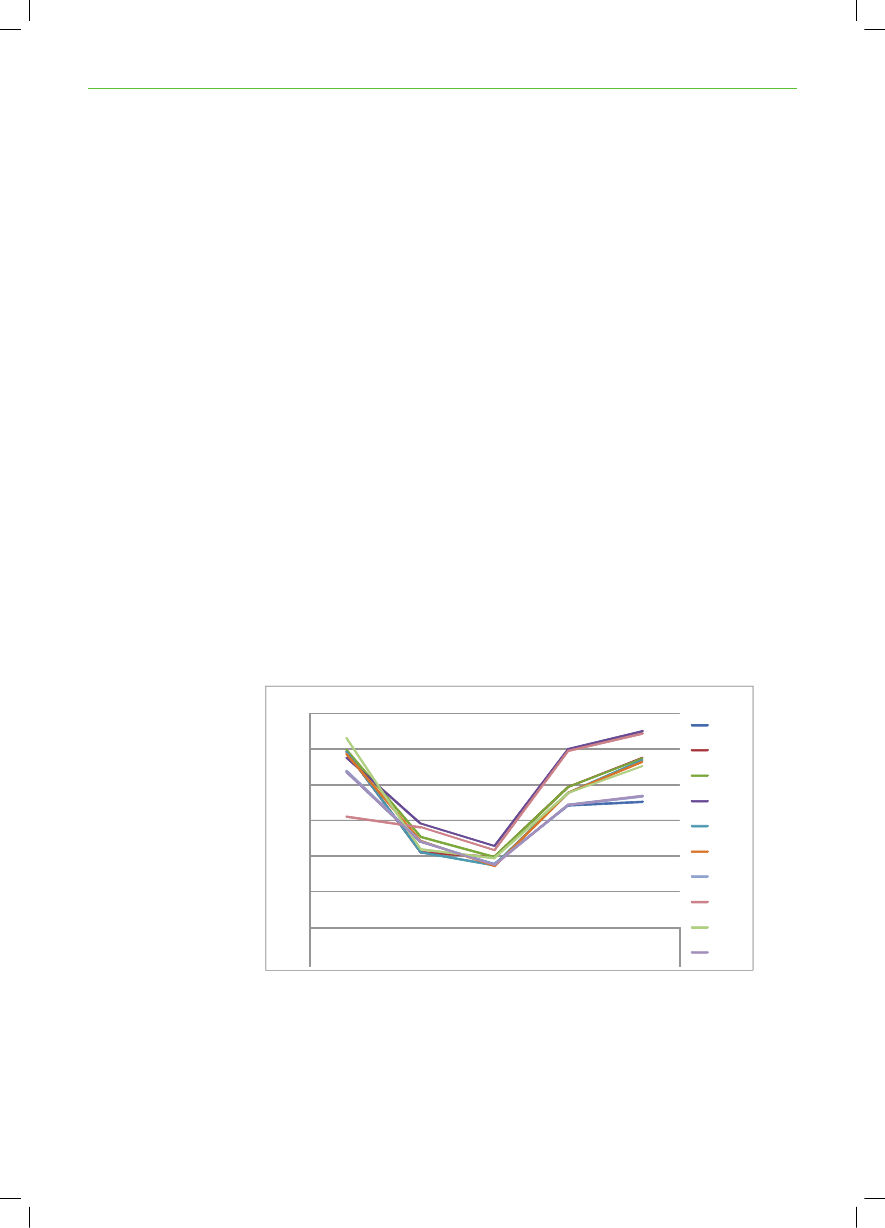
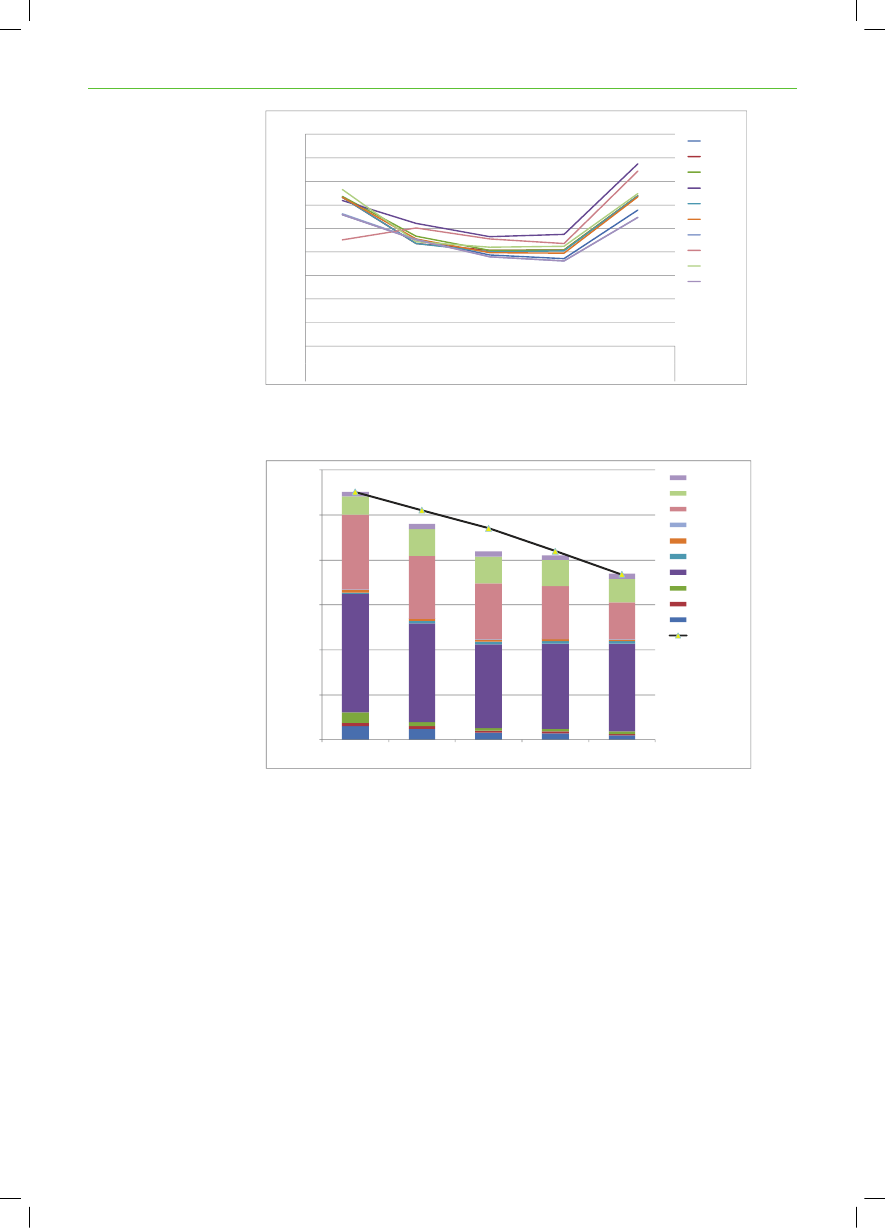
Figure 9 illustrates the development in CO2-emissions in the Baseline scenariocountry by country. The emissions are capped by the regional target indicatedby the yellow line.The simulations show that the marginal cost of abating CO2is approx. 7 € perton in 2020 and approx. 60 € per ton in 2030 for the electricity and heatingsector.Mt
CO2-emissions
600
S DEWE NRUS IASPOLAND
500
NORWAYLITHUANIALATVIA
400
GERMANYFINLANDE TONIAS
300
DENMARKRegional target
200
100
-20102015202020252030
Figure 9: Development in CO2-emissions (Mt) for the electricity and district heating sector by country inthe Baseline scenario
22
ENERGY PERSPECTIVES FOR THE BSR SUSTAINABLE ENERGY SCENARIOS
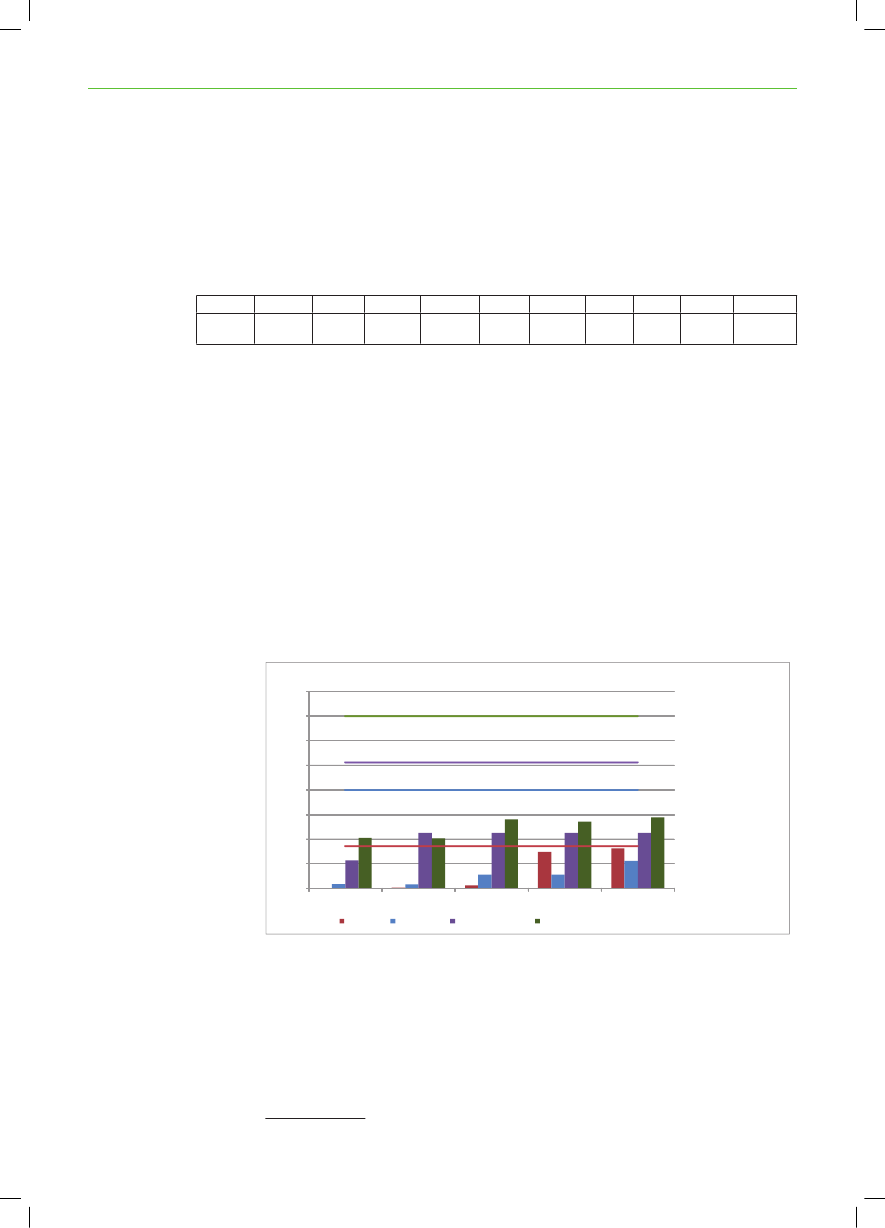
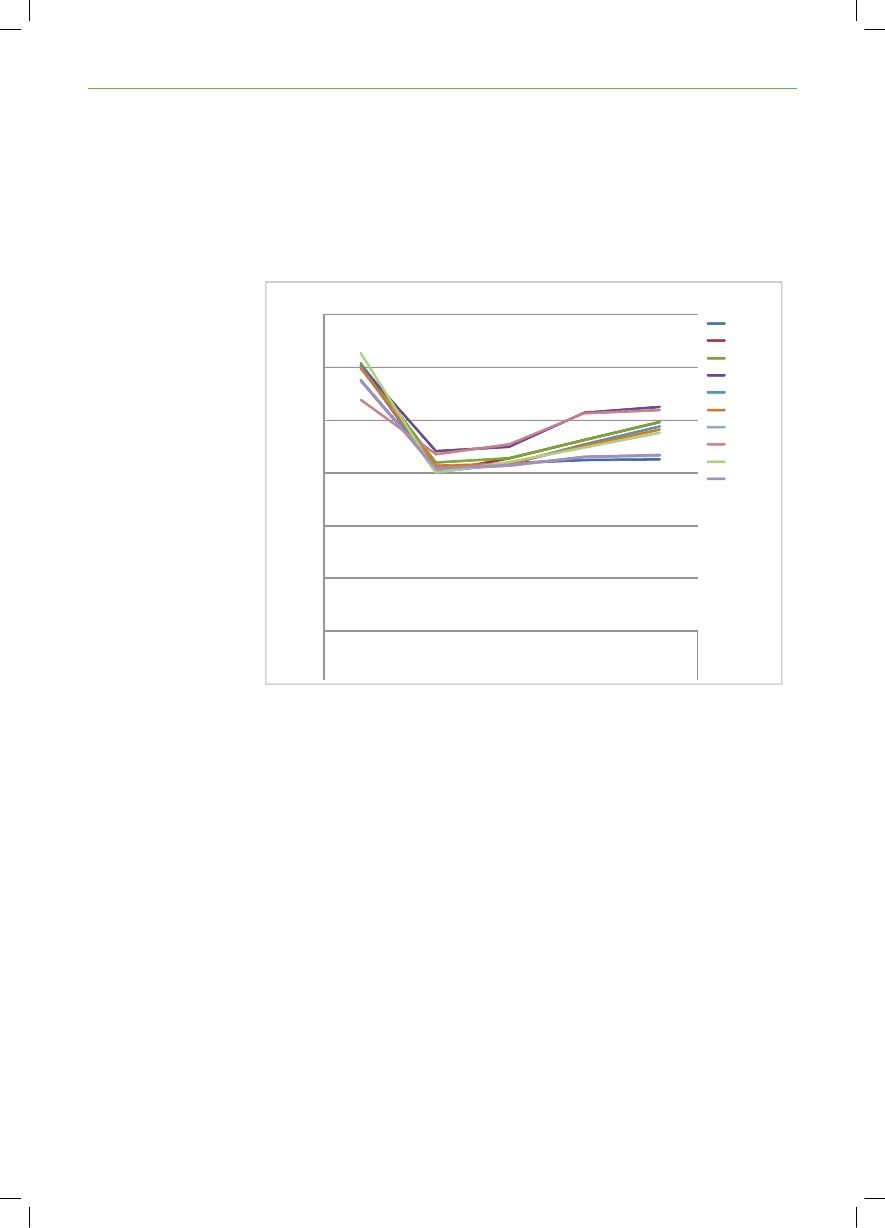
Renewable targetsAll countries succeed in complying with their national target, but the marginalcost of fulfilling the targets differs between the countries. In Russia there isno price of renewable energy because no national renewable energy target isassumed. In Norway the price of renewable energy is zero, because the expecteddevelopment of new hydro power leads to compliance with the national renewableenergy target. Lithuania, Latvia and Germany have the highest marginal costs ofexpanding renewable energy electricity generation in 2020, see Table 3.CountryBaselinescenarioDenmark16Estonia16Finland29Germany30Latvia31Lithuania Norway Poland Sweden NW Russia31-2416-
Table 3: Shadow prices for RE targets in 2020 in the different scenarios (EUR/MWhel)
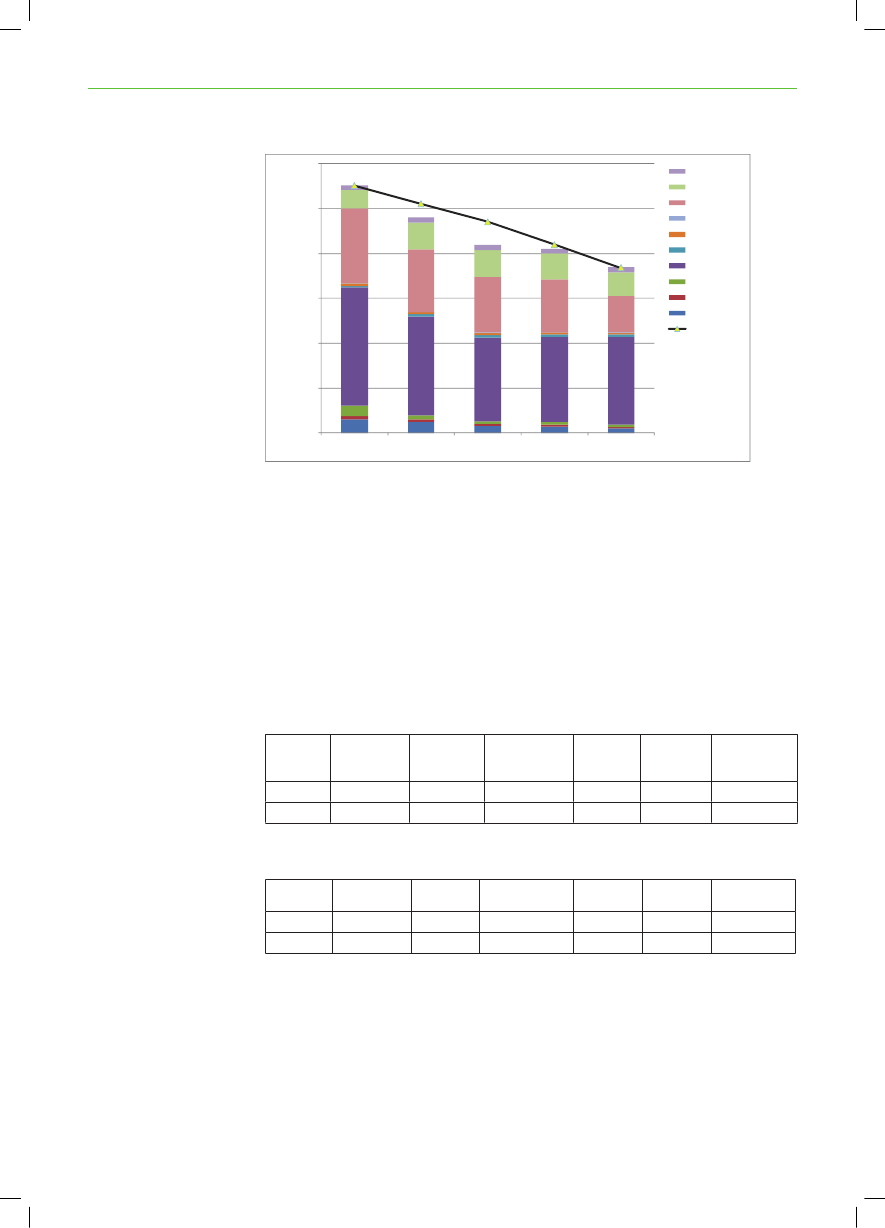
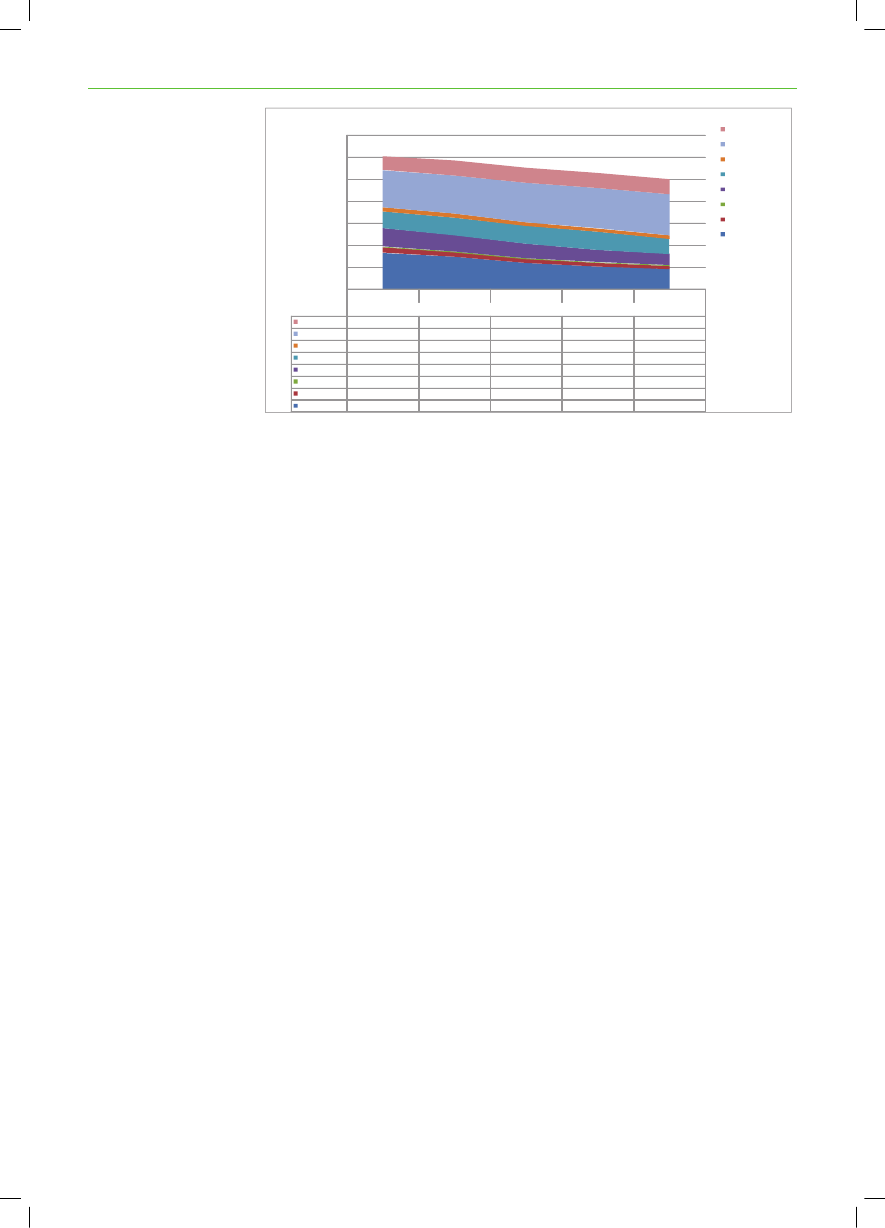
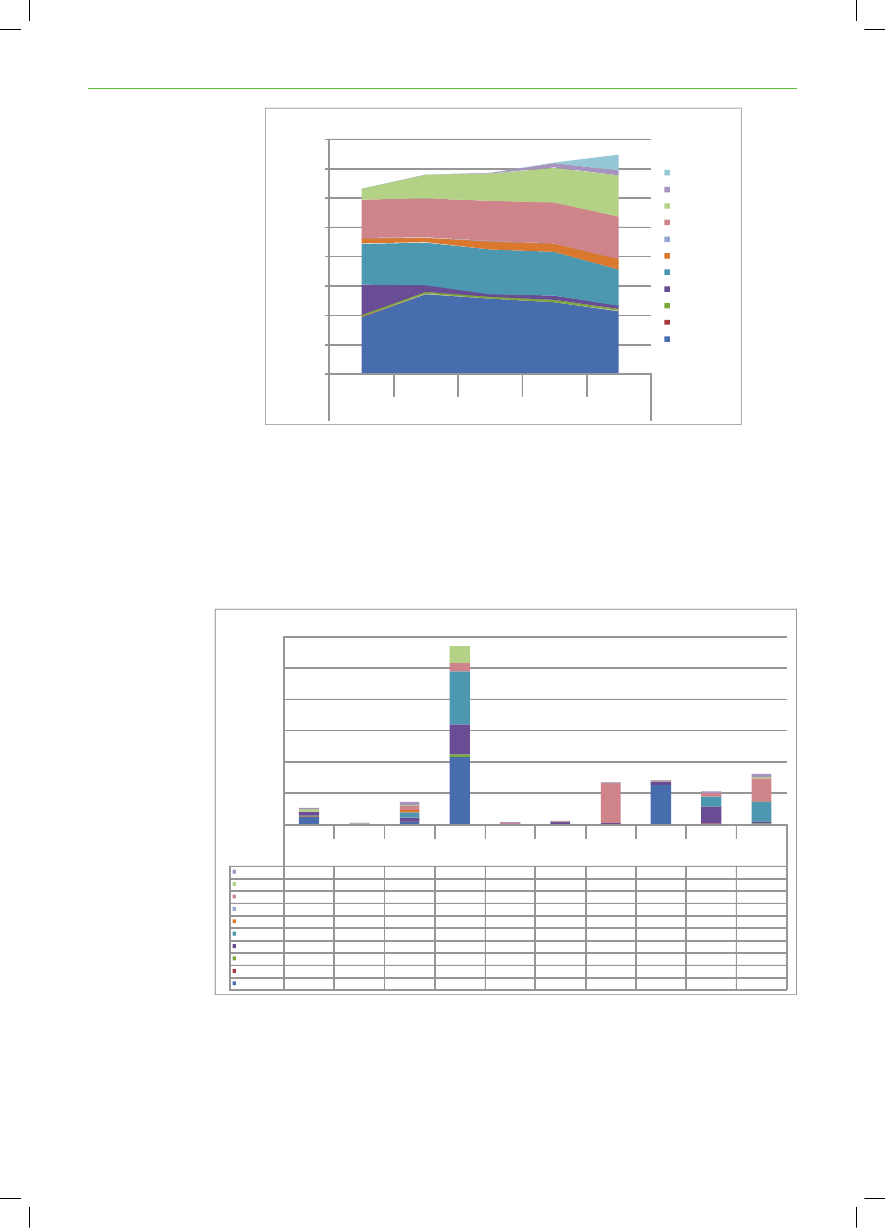
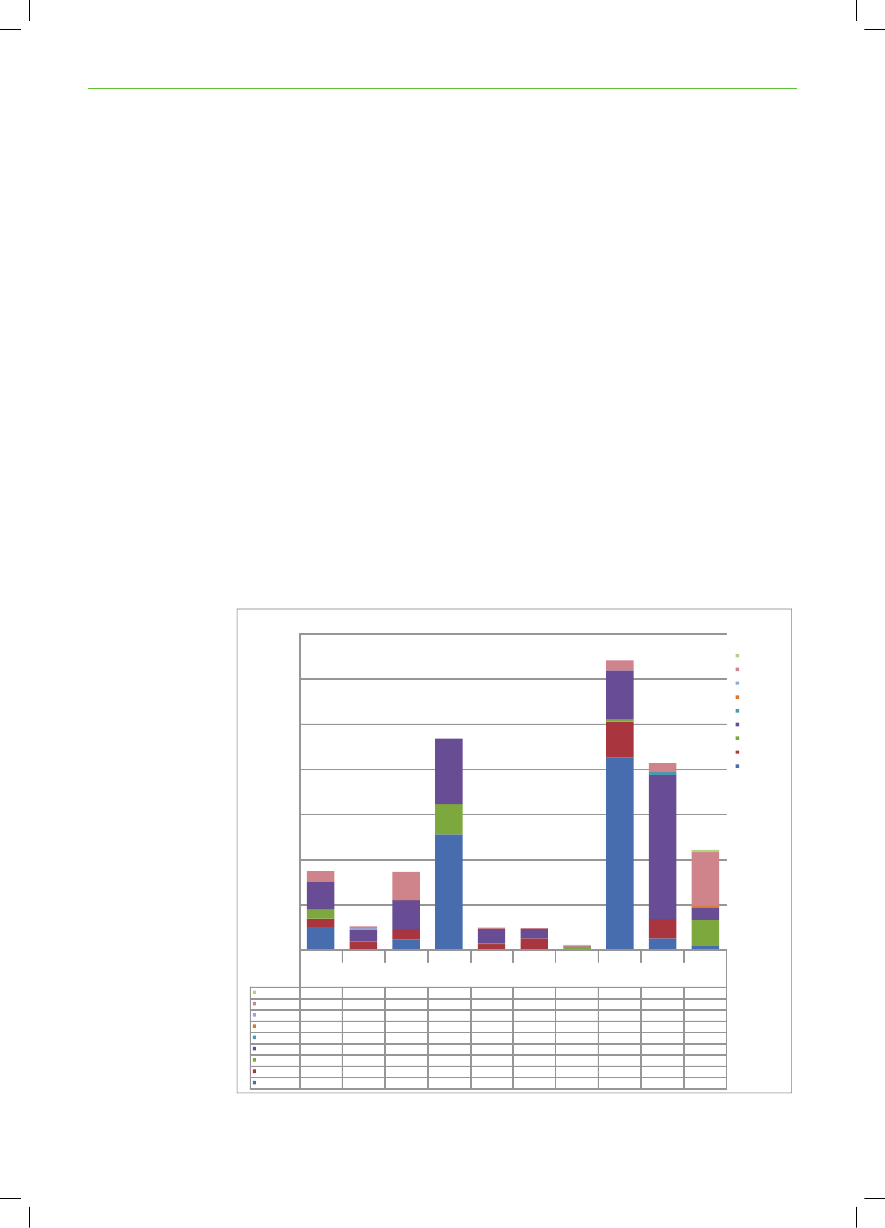
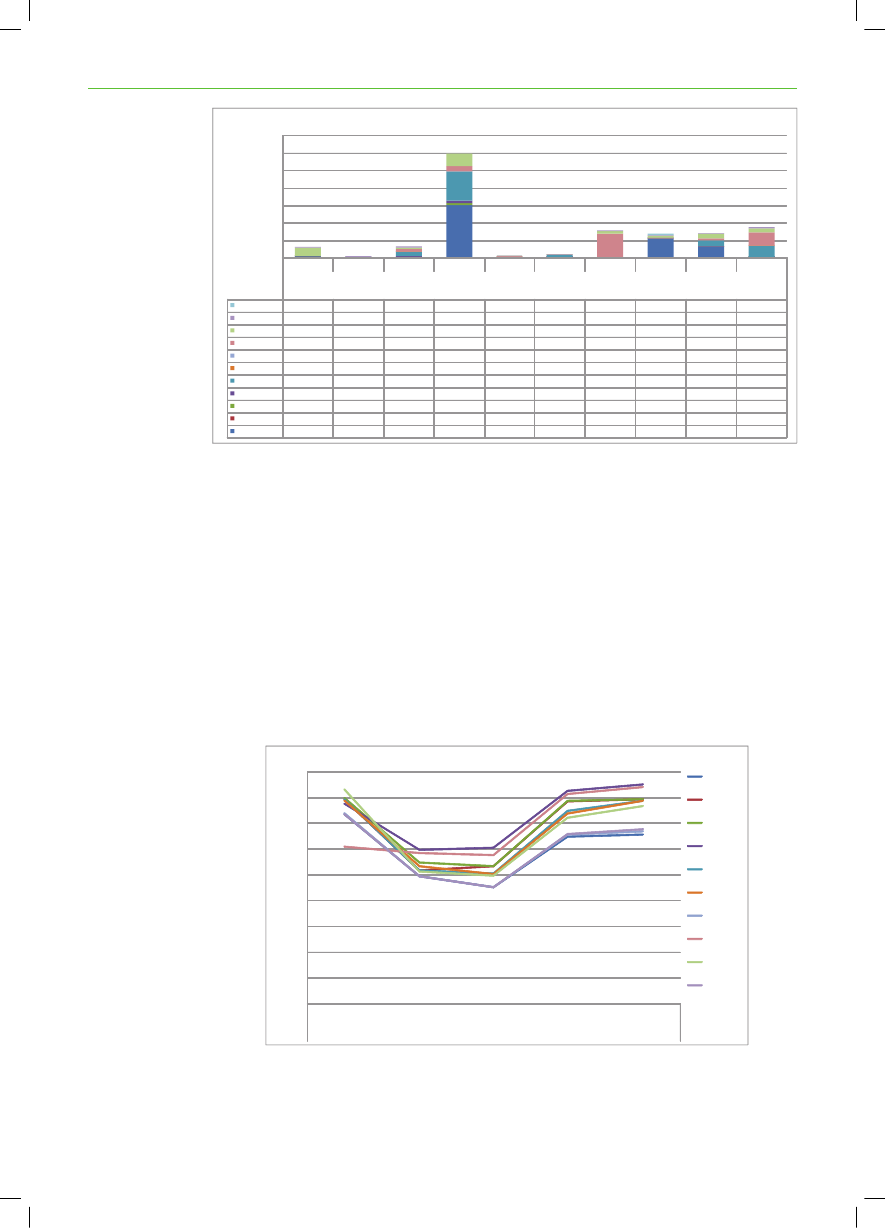
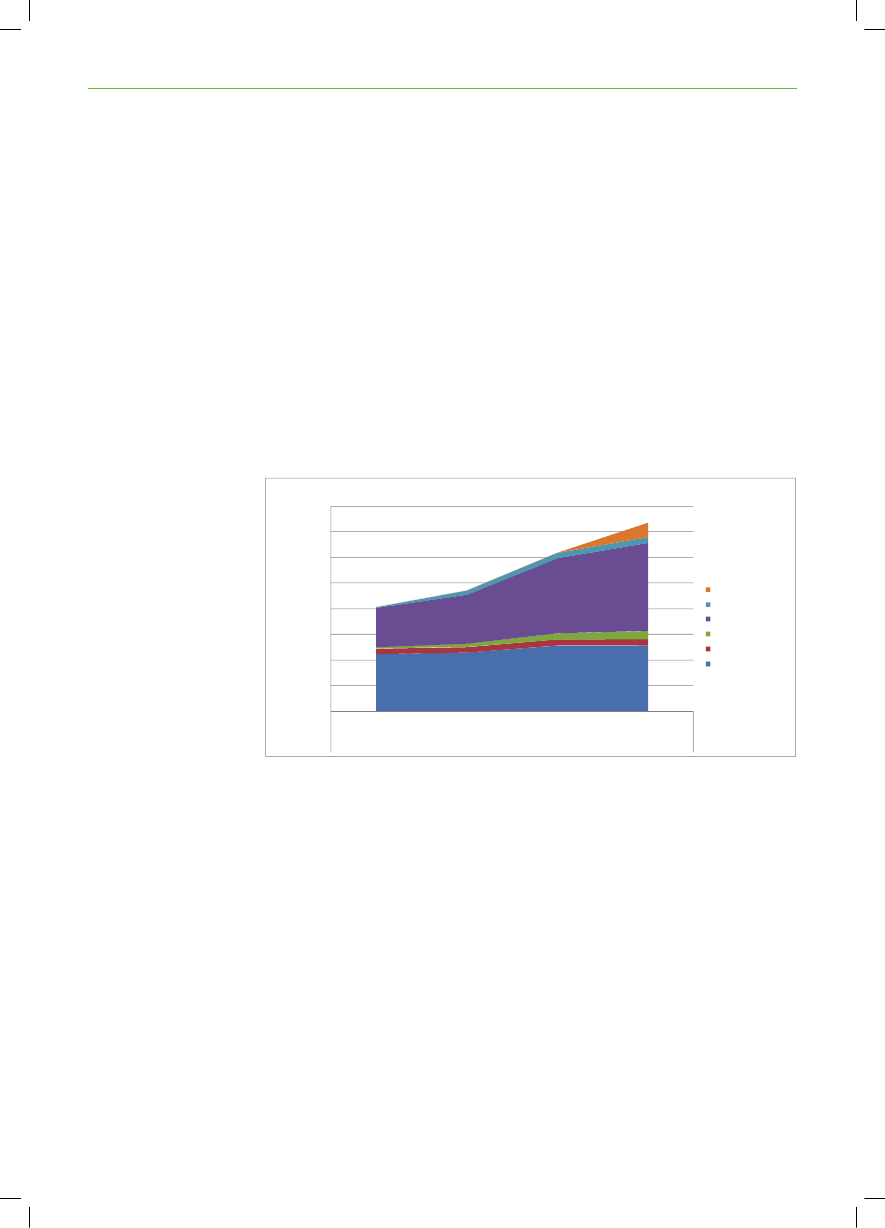
The difference in compliance costs reflects the costs of new renewable energygeneration in each of the countries compared to the value of new renewableenergy electricity in the electricity markets.Bioenergy resourcesTo determine the potential and costs of expanding renewable energy generation,wind, biomass and hydro power resources have been mapped for each countryin the region4. Assumptions about potentials are available in the backgroundreport. Figure 10 shows the utilisation of biomass resources (columns) in thebaseline scenario (2010 to 2030) in the whole region compared to the long termpotentials (lines).By 2030, when CO2emissions have been reduced by 50 % compared to 1990,a very significant potential remains for further increasing the use biomass andwaste for electricity and heat generation.Utilization of biomass resources1.6001.4001.2001.000J800PLong term municipal wastepotentialLong term biowaste potentialLong term potential for forestryresidues and energy crops
PJ600400200-2010Biogas2015Biowaste2020Municipal waste20252030
Long term biogas potential
Forestry residuesand energy crops
Figure 10: Utilisation of biomass resources (columns) in the baseline scenario compared to the longterm bioenergy potentials available for power generation and district heating (lines). It has beenassumed that only 60 % of the total bioenergy resource in the region will be available for the power anddistrict heating sector, leaving 40 % to be used in industries, households and the transport sector. Themunicipal waste resource also includes the non-renewable energy fraction of the waste.
Of the different bioenergy fractions considered, biogas is the most attractive touse with an utilisation factor close to 100 % in 2030. The reason for this is thatthe utilisation of biogas for energy production leads to supplementary reduction4 Data on bioenergy potential is lacking for North West Russia.
ENERGY PERSPECTIVES FOR THE BSR SUSTAINABLE ENERGY SCENARIOS
23
of fugitive emissions (methane and nitrous-oxide) in the agricultural sector –related to the alternative use of the manure. Hence, a negative CO2emissionfactor (-43 kg/GJ) is used for biogas in the model making it a very attractiveCO2-reduction measure.
Conclusions from the Baseline scenarioThe Baseline scenario shows the following conclusions:The targets for reducing CO2and increasing the share of renewables can bemet given the resources and technologies available. The scenarios do notassume any technological leaps.Wind power is an economically viable technology that contributesconsiderable to reaching the renewable energy targets and to reducing CO2-emissions.The region has a number of old power plants with low efficiency. In theshort run, the model chooses to replace these old power plants with newcoal-fired power plants or combined heat and power plants with very highefficiency. This strategy could be reasonable to meet the CO2-targets in theshort run, but it may not be the most viable in the long run with more strictCO2-targets.New biomass-fired power plants, biogas plants and coal fired power plantswith CCS are close to being competitive with new conventional coal-firedpower plants. These technologies could be part of the region’s focus on newenergy technologies with a strong global potential. Further use of biomassin existing coal-fired power plants should be investigated further.Natural gas based power generation generally becomes uncompetitivegiven the assumed development in fossil fuel price and the policy targetsincluded. This issue deserves further investigation, specifically theconnection between regional gas demand and gas prices.Even in 2030, when CO2emissions are reduced by 50 % compared to 1990,there is a significant unexploited bioenergy and wind potential, signifyingthat further reductions of CO2emissions are possible.
24
ENERGY PERSPECTIVES FOR THE BSR SUSTAINABLE ENERGY SCENARIOS
1.4 Three alternative policy scenariosIn addition to the Baseline scenario, three scenario variations have beeninvestigated. These variations differ in the way policy targets are complied withand whether common solutions or national solutions are put in play.The scenario variations comprise:a scenario withregional targetsfor increasing the share of renewable energyinstead of national targetsanImproved efficiency scenariowhere electricity consumption is expectedto be reduced considerably compared to the baseline projectiona30%@COP15 scenarioshowing a situation where CO2-emissions from thepower and district heating sectors are reduced by an additional 10 percentagepoints in 2020The latter scenario variation reflects a situation where an ambitious internationalagreement is obtained at the Copenhagen Climate summit in December 2009committing the EU Member States to cut their overall CO2-emissions by 30 %in 2020.
Regional renewable energy target scenarioRelocation of windIn theRegional RE Target scenariothe model still chooses to invest mainlyin wind and coal power, but a large share of the investments in wind poweris relocated from Germany, Sweden and Finland to Denmark and particularlyNorway, where wind conditions are assumed to be somewhat better. Transferringthe national targets to a regional target thus means a better utilisation of theinvestments in wind power.The simulations show that the benefit of this relocation of investments is approx.5 billion € in net present value. However, this figure should be interpreted withcaution, because the country specific estimates of renewable energy potentialsand costs are associated with a significant degree of uncertainty, particularlyin the long-term. Moreover, it should be stressed, that the total generation ofrenewable energy in the Baltic Sea Region is approx. 8 TWh lower in the regionalrenewable energy scenario compared to the Baseline scenario. This may appearsurprising since the renewable target is the same in the two scenarios. Thereason for this is that, due to the expected development of new hydro powerplants, Norway over-complies in the Baseline scenario. In the scenario with aregional renewable target Norway’s over-compliance contributes to achieve theregional renewable target.In the situa on with a common RE target the cost of increasing renewable energy be-comes the same in all countries in the region, 19 € per MWh of renewable energyelectricity in 2020.The EU Directive on renewable energy, endorsed by the European Parliament inRE directive opens upfor regional cooperation December 2008, is built on national targets. However, Member States may agreeon the statistical transfer of specified amounts of renewable energy between
ENERGY PERSPECTIVES FOR THE BSR SUSTAINABLE ENERGY SCENARIOS
25
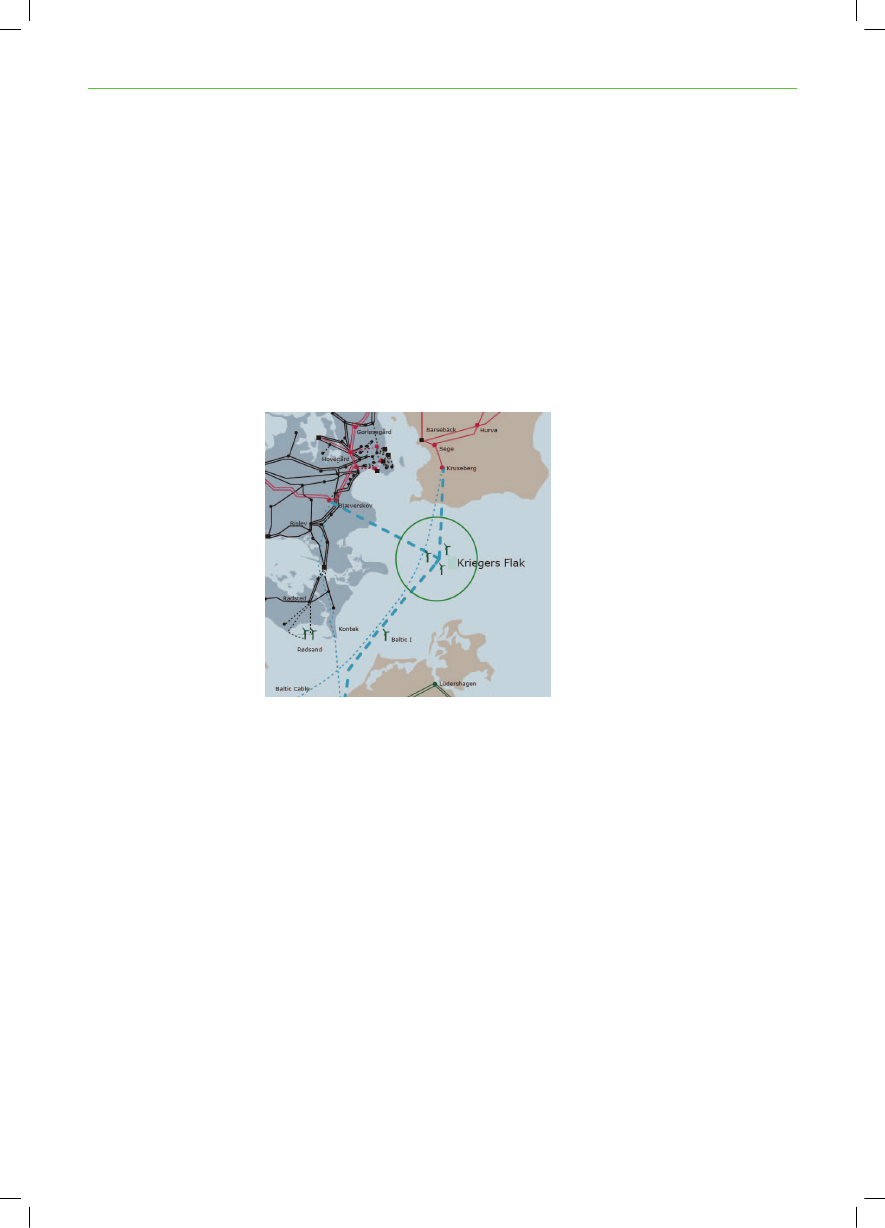
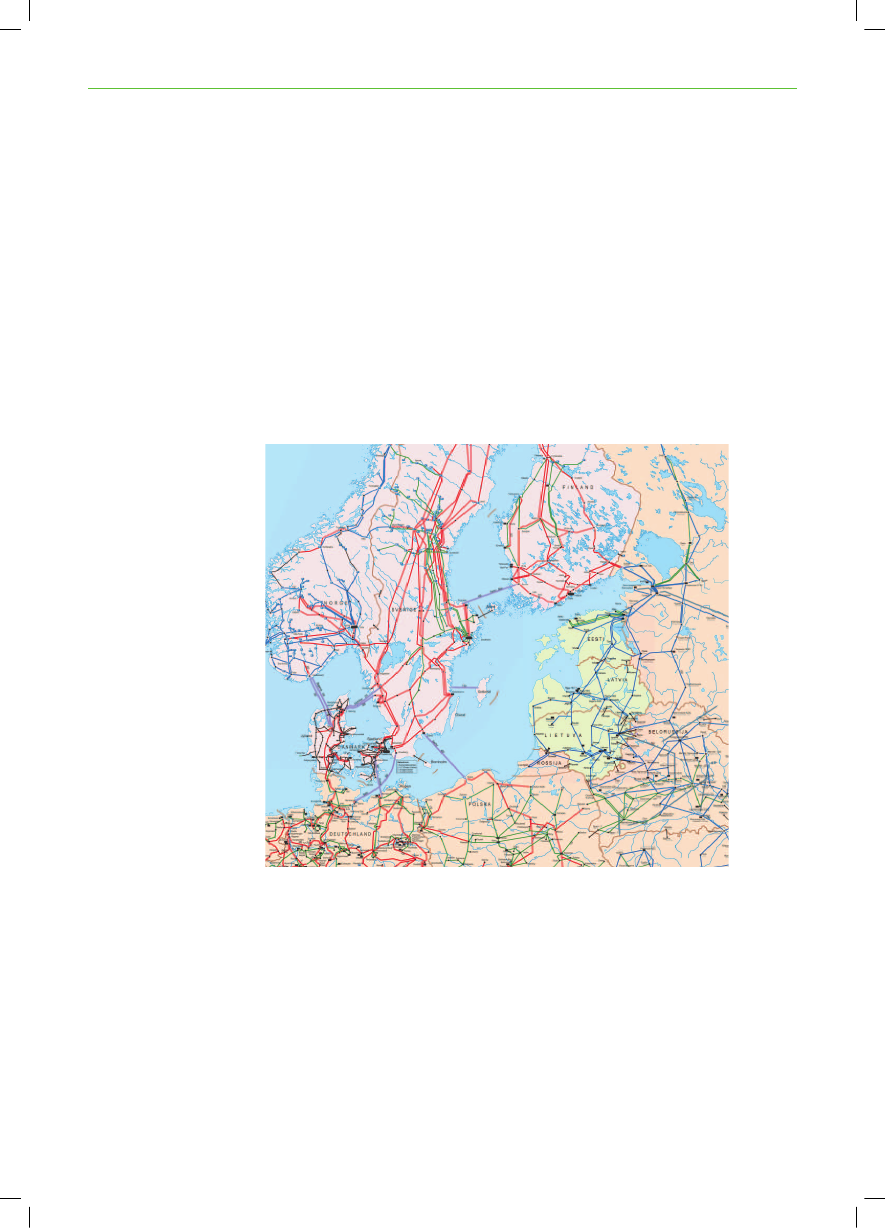
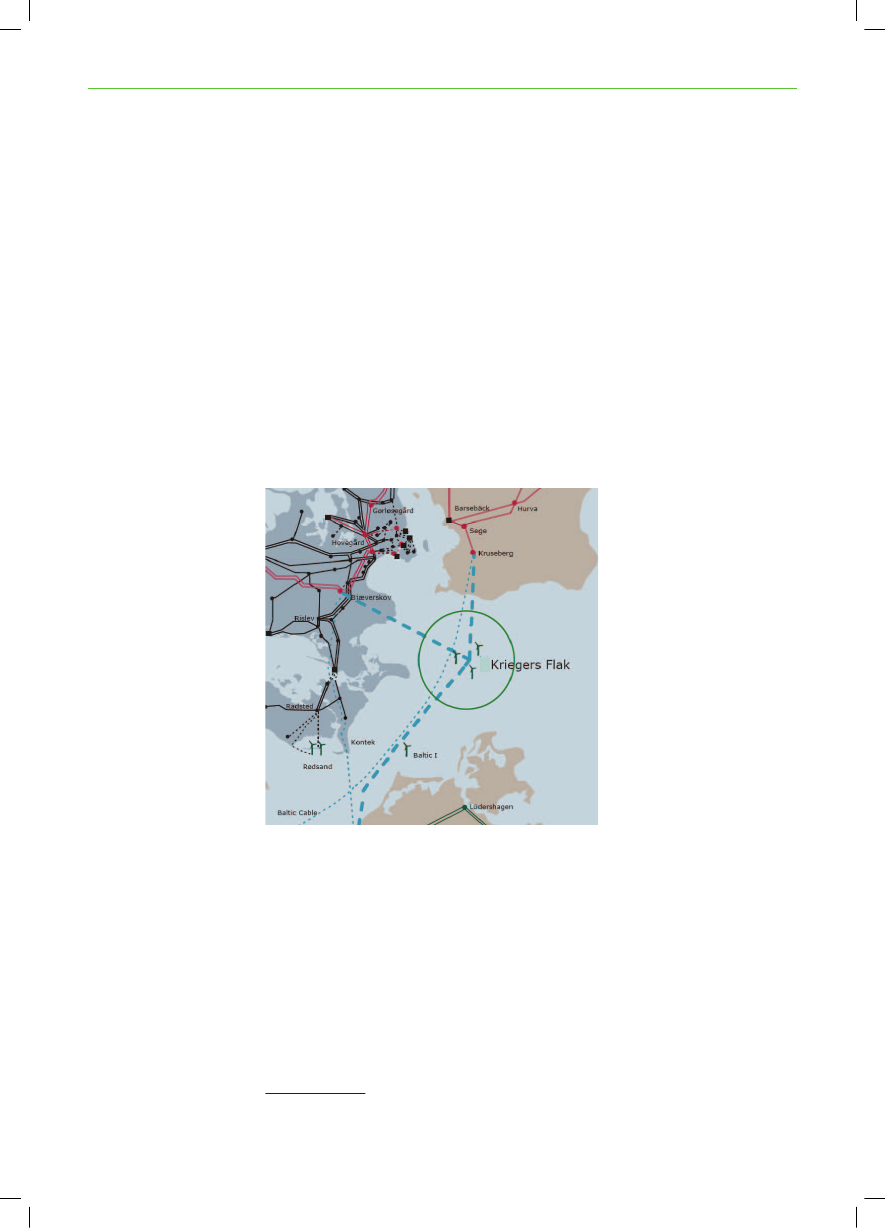
themselves and they may cooperate on any type of joint project relating to theproduction of renewable energy. Finally, Member States have the opportunityto join or coordinate their national support schemes in order to help achievetheir targets.Case: Kriegers FlakIn addition to the overall scenarios a case analysis has been made to illustrate thecosts and benefits of a concerted planning for wind power plants in the shallowwaters of Kriegers Flak in the Baltic Sea. Germany, Sweden and Denmark areall planning to build off-shore wind farms at Kriegers Flak (400, 600 and 600MW respectively).The case explores the consequences of a developing a common integrated off-shore grid, which could also serve as link between the Nordic and Germanelectricity markets. The area and a possible common international connectionare sketched in Figure 11.
Figure 11: Location and sketched connection of Kriegers Flak. The thinner dashed lines indicate theexisting connections between Denmark and Germany (Kontek) and Sweden and Germany (BalticCable). Source: Energinet.dk
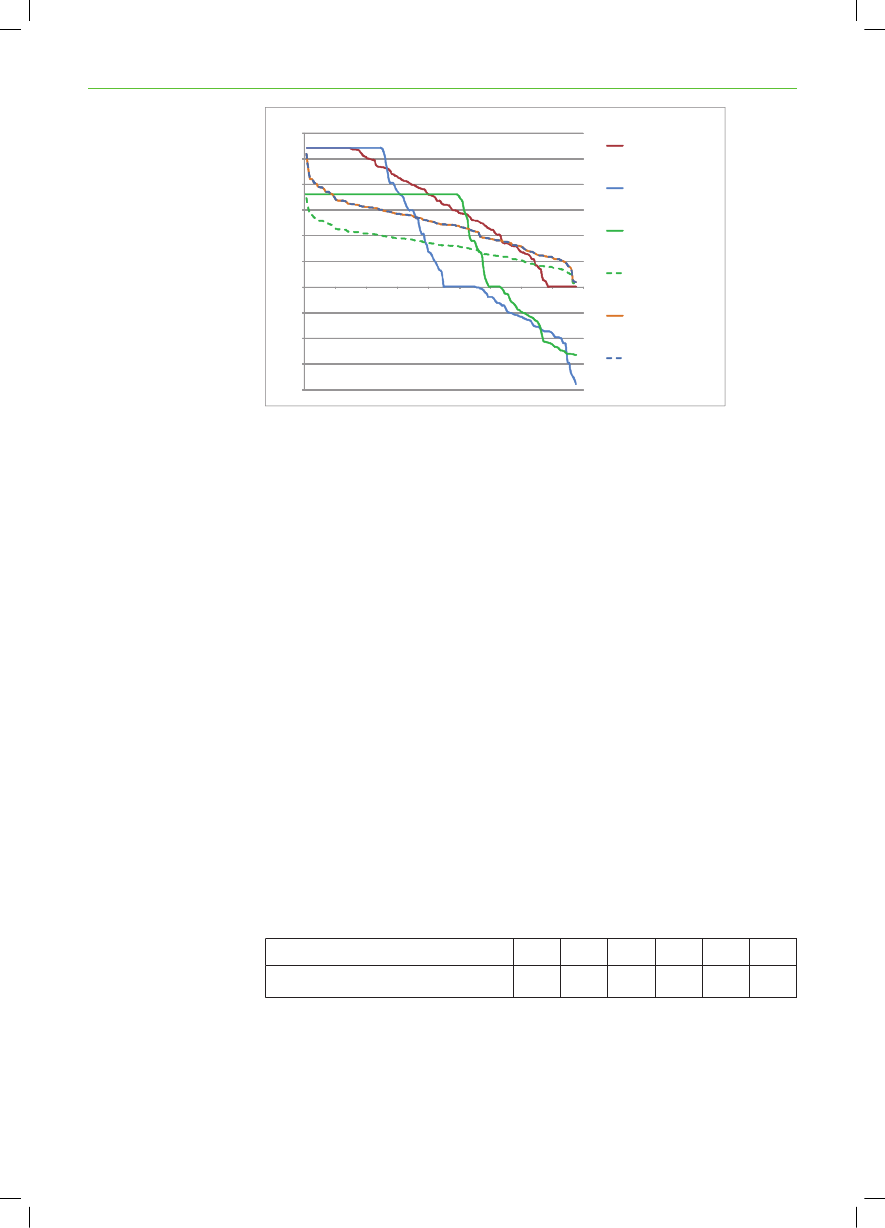
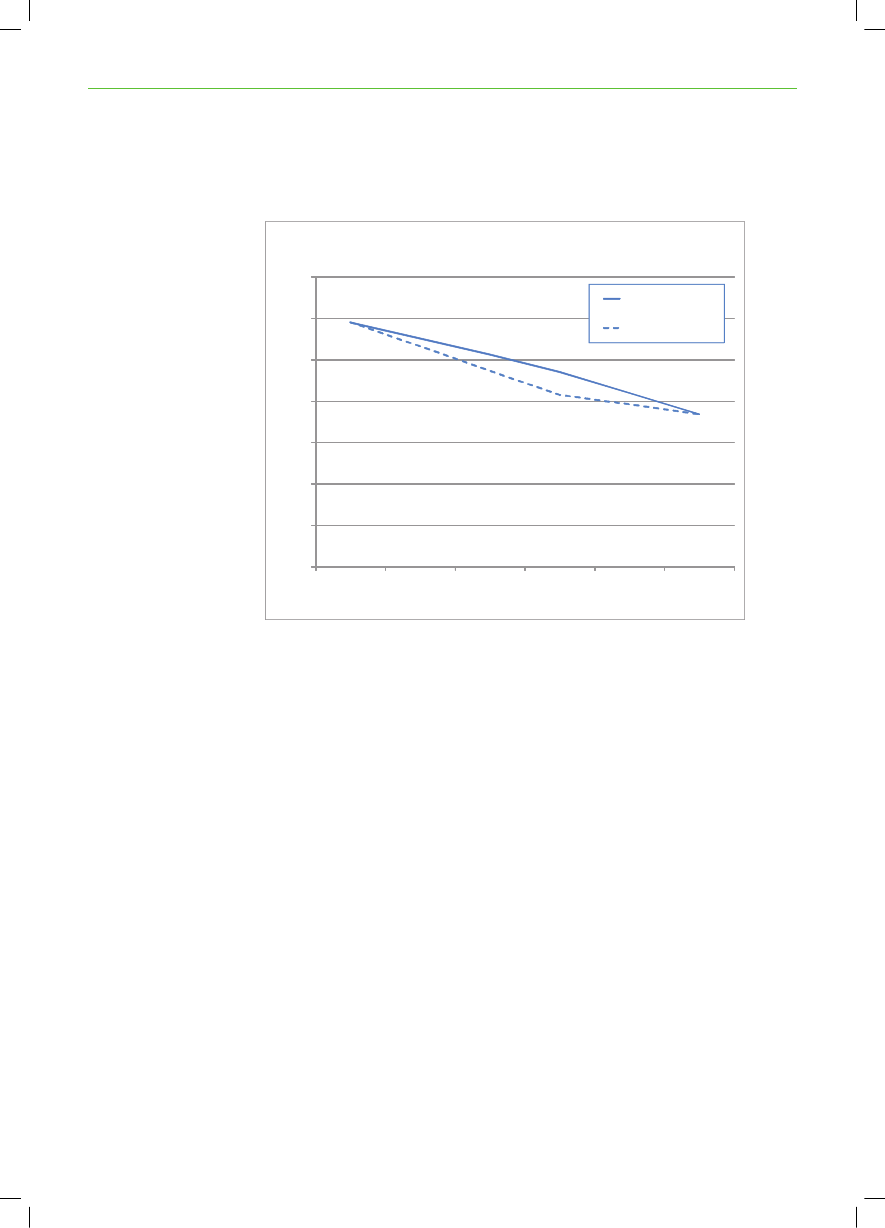
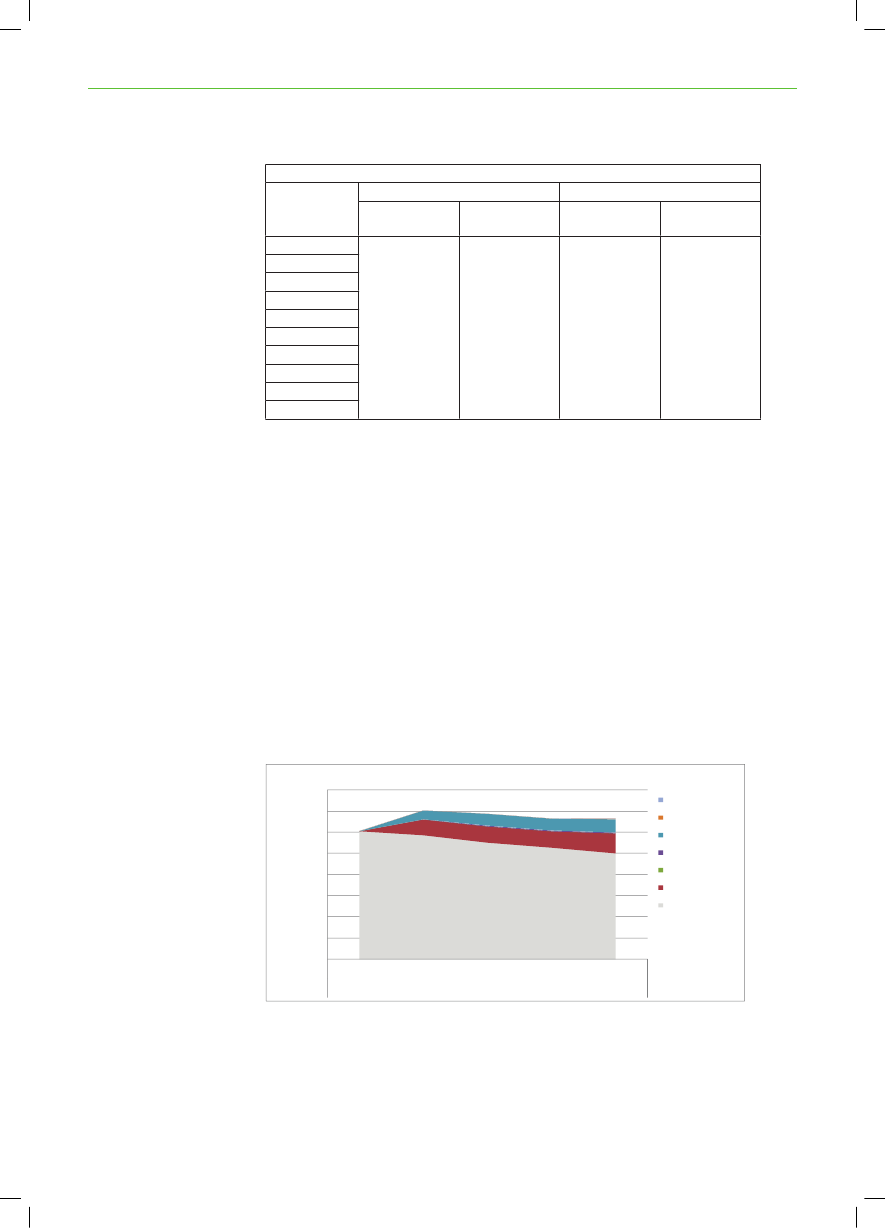
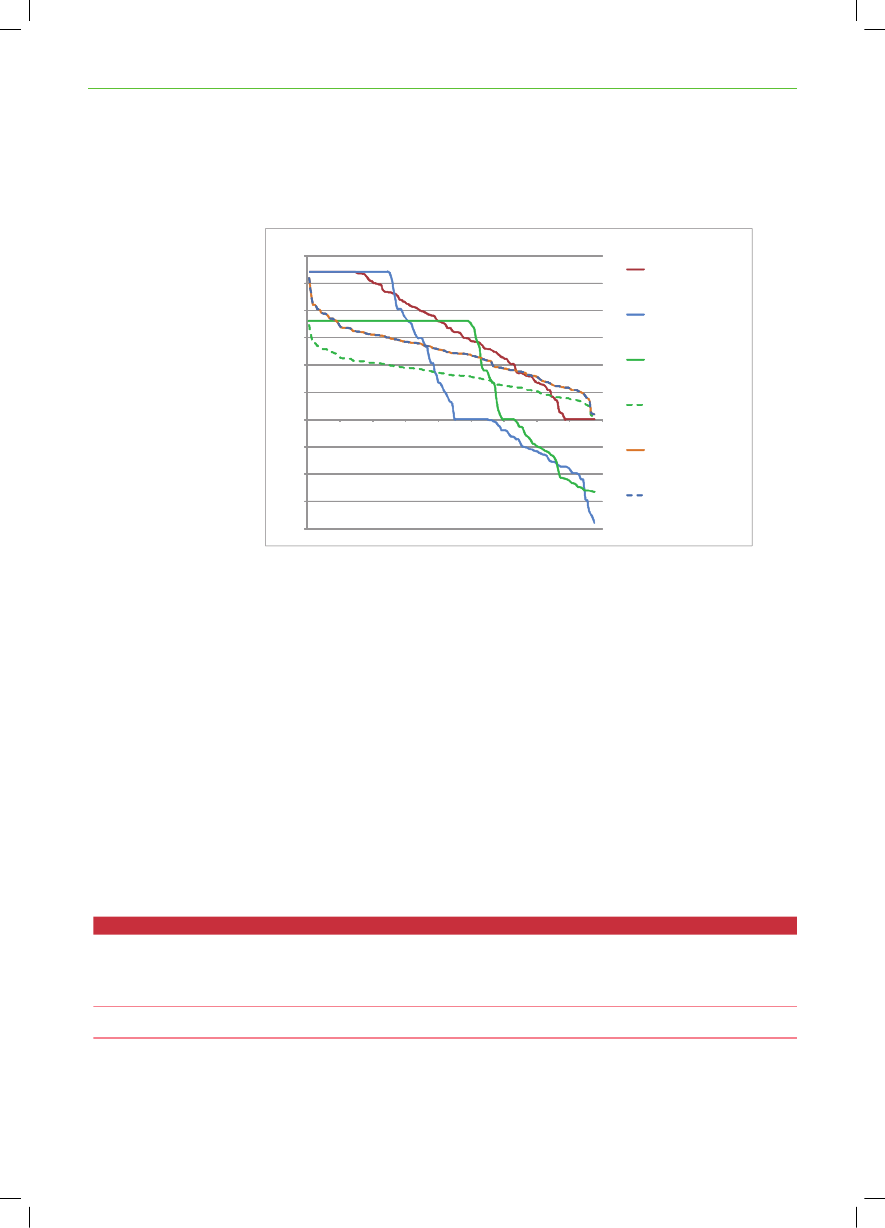
An integrated off-shore wind grid could serve a twofold purpose by connectingthe wind farms to the transmission grid at shore, as well as by linking theelectricity markets in the region. Kriegers Flak could serve as a pilot project foran integrated offshore grid.Transmission of powerat Kriegers FlakFigure 12 shows a duration curve of the transmission between the off-shore windfarms in Kriegers Flak and their respective countries in the Baseline situationwithout a common international connection (dotted lines) and a situation withcommon interconnection (full lines). In the first situation the cables are onlyused to transmit power from the wind farms to land. In the second case, the off-shore grid is also used as a mean to transport electricity to and from the threecountries. This leads to a significant higher utilisation of the cables.
26600
ENERGY PERSPECTIVES FOR THE BSR SUSTAINABLE ENERGY SCENARIOSDuration curve for transmission at Krieger'sFlakKriegersFlak Sce. : Krieger -Denmark
500
400
KriegersFlak Sce. : Krieger- Sweden
300
200
KriegersFlak Sce. : Krieger -Germany
MW
W100M
Baseline: Krieger - Germany--1.0002.0003.0004.0005.0006.0007.0008.0009.000
-100
Baseline: Krieger - Denmark
-200
-300
Baseline: Krieger - Sweden
-400
Timestep
Figure 12: Duration curves showing the utilisation of the connections to Kriegers Flak in the BaselineScenario with individual on-shore connection and in the situation with a common interconnection atKriegers Flak.
The common interconnection at Kriegers Flak compared to a situation with nocommon interconnection shows a benefit a Net Present Value of €17 million.This figure does not include the possible higher capital cost associated with thecommon solution.The above calculation assumes only 400 MW of transmission capacity betweenGermany and Kriegers Flak. This is sufficient to connect the 400 MW of expectedwind power capacity at the German part of Kriegers Flak; however in connectionwith an integrated offshore grid it may appear more economic to establish astronger connection to Germany, particularly considering that the connectionsfrom Kriegers Flak to Denmark and Sweden are 600 MW each.
Improved efficiency scenarioElectricity savingsIn the “Improved efficiency scenario” electricity consumption is expected to bereduced considerably compared to the Baseline projection. This is a result ofstringent policies to make consumers use electricity in a more rational manner.In 2030 the general electricity consumption is approximately 20 % below theBaseline level. The same relative level of electricity savings is assumed to takeplace in all countries across the region.All countriesSavings in general electricity consumptionrelative to baseline2005020102%20157%202010 %202515 %203020 %
Reduced electricitydemand for heating
In addition to the general effort to reduce electricity consumption, a specificfocus is put on reducing electricity demand for conventional electric heating- through improved insulation of buildings and by converting to other forms ofheating with lower marginal CO2-emissions, such as electric heat pumps, districtheating, solar heating and boilers fuelled by biomass or natural gas.
ENERGY PERSPECTIVES FOR THE BSR SUSTAINABLE ENERGY SCENARIOS
27
Particularly in Norway, Sweden and Finland, electricity is a very importantsource of heating. Today’s high consumption of electricity in these countriesshould be seen in relation to the history of the energy systems, particularlythe access to cheap hydro power and base-load nuclear power. However, asthe electricity markets have been opened, and considering that the electricitymay alternatively be exported to neighbouring countries where the marginalgeneration comes from thermal power plants, using electricity for direct heatingbecomes expensive and unsustainable.CountryFinlandNorwaySwedenElectricity demand for heating2005, approx.9 TWh30 TWh21 TWhShare of total final electricity demand in200511%27%16%
Table 4: Electricity demand for heating in Finland, Norway and Sweden
In the “Improved efficiency scenario” it is assumed that the demand for electricityfor heating in Finland, Norway and Sweden is reduced by 50 % towards 2030.When including the additional effort to reduce electricity demand for directelectric heating, the total electricity savings in 2030, in the improved efficiencyscenario are 22 % for the region as a whole compared to the Baseline scenario.In theImproved Efficiency Scenariowind power and coal power are still thepreferred choices by the model, but the level of investments is significantlylower than in the Baseline scenario.Electricity generation by Figure 13 shows the development in total generation in the improved efficiencyscenario. It appears that electricity generation (and hence demand) in this casefuelis more or less constant during the course of time.Electricity genera onElectricity generation1.4001.2001.000800600400200-201020152020Improved efficiency20252030Coal CCSBiogasWindWaterOilshaleBiomassNuclearNatural gasWasteOilCoal and lignite
Figure 13: Total electricity generation (TWh) by fuel for Baseline scenario
The lower demand for electricity, in combination with the targets for increasingthe share of renewable energy, results in an overachievement of the CO2targetsin the period 2015 - 2025. Only by 2030 the target on CO2becomes binding.At that time the marginal cost of reducing CO2emissions is 38 € per ton in thescenario compared to 52 € per ton in the Baseline scenario.This reflects that cheaper abatement measures are put into play at the supplyside in this scenario. By combining demand and supply side measures it will be
TWh
hWT
28
ENERGY PERSPECTIVES FOR THE BSR SUSTAINABLE ENERGY SCENARIOS
possible to achieve stronger CO2targets in the longer term when the most cost-efficient supply side measures will be used up.Mt600S DEWE NRUS IAS500POLANDNORWAYLITHUANIA400LATVIAGERMANYFINLAND300E TONIASDENMARKRegional target200
100
-20102015202020252030
Figure 14: Development in CO2-emissions (Mt) by country in the Improved efficiency scenario
The scenario 30%@COP15The scenario explores a situation where CO2-emissions from the power anddistrict heating sectors are reduced by an additional 10 percentage points in2020. This reflects a situation where an ambitious international agreement isobtained at the Copenhagen Climate Summit in December 2009 committingthe EU Member States to cut their overall CO2-emissions by 30 % in 2020.The target for 2030 is s ll 50 %. The tables below shows accumulated investments inthe 30%@COP15 scenario compared to the baseline.30%@COP15MW20202030Coal andlignite45.99251.473Naturalgas4.0584.694BiomassWindBiogasCoal CCS
2.7806.623
38.10268.364
3.2584.512
3311.196
Table 5: Accumulated Investments in new electricity generation capacity in 30%@COP15 scenario
BaselineMW20202030
Coal andlignite48.26054.195
Naturalgas310541
Biomass3.6535.506
Wind36.67368.710
Biogas3064.455
Coal CCS
13.651
Table 6: Accumulated Investments in new electricity generation capacity the Baseline scenario
The stricter CO2target in 2020 leads to fewer investments in new coal firedpower plants in 2020, but more investments in natural gas fired capacity, windpower and biogas based capacity. The investments in biogas capacity are tosome extent made at the expense of a smaller amount of investments in biomassfired capacity.Biogas is more attractive in the 30%@COP15 scenario, because the negativeCO2-emissions factor of biogas becomes a greater benefit with the tougher CO2-
ENERGY PERSPECTIVES FOR THE BSR SUSTAINABLE ENERGY SCENARIOS
29
target. This should be viewed in the light of the CO2-price, which is 30 €/tonin the 30%@COP15 scenario in 2020 compared to only 7 €/ton in the Baselinescenario.The cumulated investments by 2030 also differ between the two scenarios eventhough the 2030-target is the same. The main difference is that higher level ofinvestments in natural gas up to 2020 in the 30%@COP15 scenario leads tofewer investments in new coal power and coal power with CCS in the subsequentdecade.CO2-emissionsAs intended, the CO2-emissions in the scenario follow a lower trajectory than inthe Baseline. Figure 44 displays CO2-emissions distributed on countries between2010 and 2030.Mt600
500
S DEWE N400RUS IASPOLANDNORWAYLITHUANIA300LATVIAGERMANYFINLAND200E TONIASDENMARKBaseline target30%@COP15 target100
-20102015202020252030
Figure 15: Development in CO2-emissions (Mt) by country in the scenario 30%@COP15. The scenariospecific CO2targets are shown by the orange line and the CO2target in the baseline by the black line.
Economicconsequences
Electricity generators have their profits increased as the higher CO2-prices leadto higher prices in the electricity markets, whereas the energy costs of electricityconsumers are increased considerably. The total cost for the region of followingthe lower CO2-emission path is estimated to be approx. €16 billion, measuredas net present value (2009).
Screening of new interconnectorsThe study considers the existing interconnectors in the Baltic Sea Region. Inaddition, it is assumed that all five prioritized Nordic cross sections have beenestablished by 2015.The model takes into account the most important bottlenecks in the electricitysystems and is able to assess the utility to the electricity market (includingthe different stakeholders in the market) of expanding transmission capacity
30
ENERGY PERSPECTIVES FOR THE BSR SUSTAINABLE ENERGY SCENARIOS
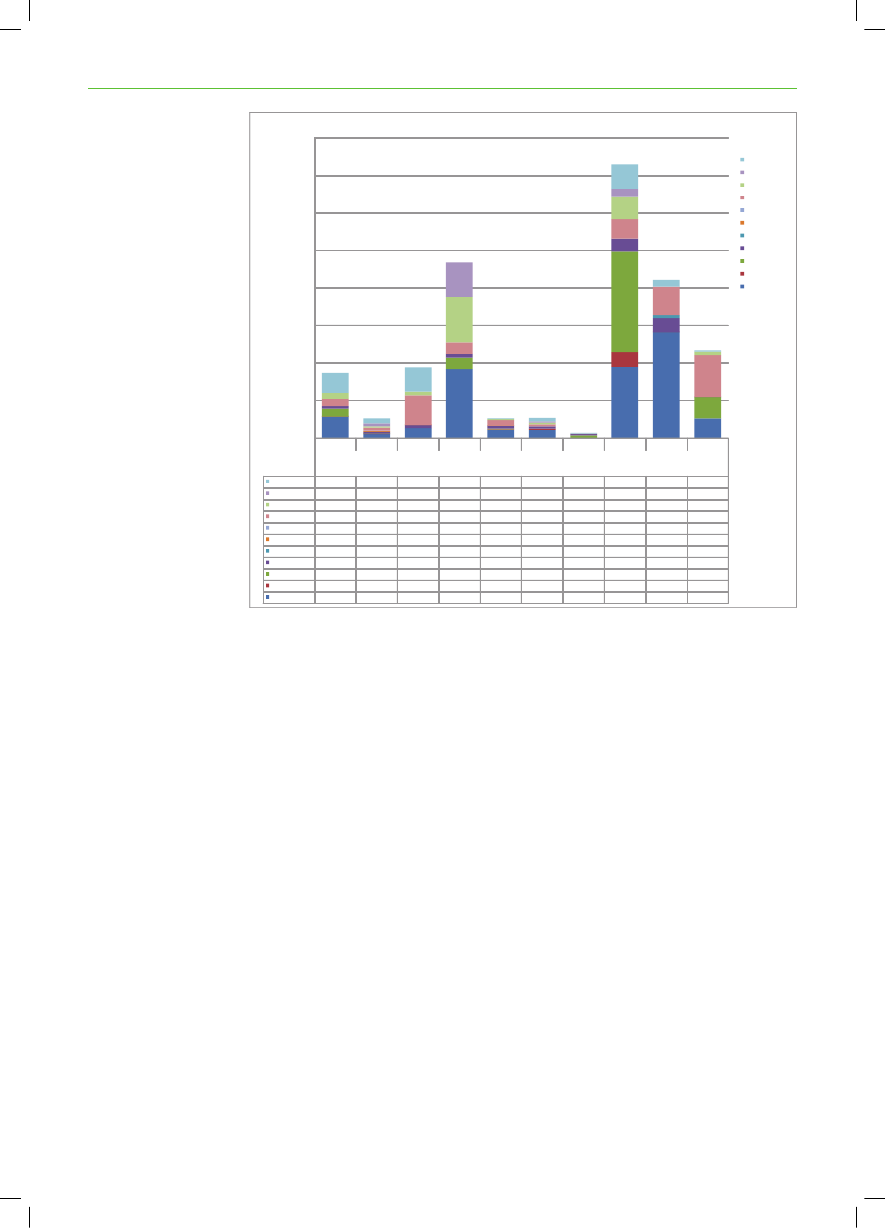
between the different electrical areas. As part of the study a screening has beenmade to identify the most attractive new interconnectors.The simulations indicate that there will be benefits of strengthening theelectricity transmission grid in the region, particularly connections linking thethermal power based systems in Poland and Germany, and the Nordic powersystem dominated by hydro power. Strengthening connections between theBaltic countries and the Nordic countries may also be attractive.Selected results from the screening of new interconnectors:BaselinescenarioIn 2020In 2030Lithuania toSweden M36,000118,000Latvia toSweden M42,000105,000Germany NWto Norway S103,000223,000Germany NWto Denmark W94,000168,000Poland toSweden S50,000271,000Poland toKaliningrad54,000153,000
Table 7: Screening of new interconnectors. The table shows the total socio-economic benefit of adding1 MW of transmission capacity between the different transmission areas in the model
These results are based on marginal benefits in the electricity market ofincreasing the capacity on interconnectors linking the different electric areasin the model in the Baseline scenario in 2020 and 2030. It should be noted,that an expansion of the existing transmission capacities in the region has beenincluded in the Baseline scenario (see the Background Report).The value of new interconnectors increases significantly between 2020 and2030.The benefits indicated in the table above should be compared to the capital costsof the connections. These costs are site specific and have not been quantifiedas part of the present study. For comparison it could be mentioned that theannual capital cost of Skagerrak IV linking Denmark West and Norway havebeen estimated to be approx. 35,000 €/MW and for NordBalt linking Lithuaniaand Sweden costs have been projected to be approx. 70,000 €/MW.More comprehensive analyses are required to properly assess the value of newinterconnectors to the general electricity system.
ConclusionsThe alternative policy scenarios indicate some of the advantages of cooperationbetween the countries and between the stakeholders in the Baltic Sea Region:- Regional RE-targets instead of national targets reduce the costs of complyingwith the EU targets for RE in 2020.- Regional planning for new interconnectors and regional development ofenergy markets would ensure the most efficient use of the available energyresources and energy infrastructure in the region.- Joint planning for wind farms would ensure the best utilisation of thewind farms and the transmission lines connecting the wind farms to theelectricity grid.
ENERGY PERSPECTIVES FOR THE BSR SUSTAINABLE ENERGY SCENARIOS
31
- Biomass should be treated as a regional resource and a regional market forbiomass for energy purposes would be an advantage for the whole region.Furthermore the analyses illustrate that a long term planning horizon wouldbe needed in order to ensure sustainable investments in relation to the long-term CO2-targets. This includes the right timing in investments in e.g. coal firedpower plants.Finally the scenario analyses show that savings in the electricity consumptionwould reduce the costs of meeting the CO2target in the region.
1.5 Dialogue with stakeholdersThe dialogue processThe use of scenario technique in strategic policy formulation is very fruitful,particularly if the scenarios are developed via dialogue with the policy makersand the main stakeholders. The scenarios quantify the visions of the politiciansand illustrate how the targets could be fulfilled in the most efficient way.Dialogue with the stakeholders on the energy scene in the Baltic Sea Region hasbeen an important part of the study process. Preliminary results from the studyhave been presented and discussed at a number of occasions, comprising:Energy conference: “Energy and Climate Change: Global Challenges,Regional Solutions”, 21 May 2008 in Warsaw;Meeting of the Baltic Sea Parliamentary Conference’s Working Group onEnergy and Climate Change, 22 May 2008 in Tallinn;Dinner-debate hosted by the Baltic Sea Parliamentary Conference, 20October 2008 in Copenhagen;Meeting of the Joint Platform on Energy and Climate5, 22 October 2008 inCopenhagen;Baltic Development Forum’s Summit, 2 December 2008 in CopenhagenMeeting of the Group of Senior Energy Officials of BASREC, 3 December2008 in Copenhagen;Baltic Sea Region Energy Cooperation (BASREC) Energy Ministersconference, 17 – 18 February 2009 in Copenhagen with the participation ofthe European Commissioner Andris Piebalgs;Meeting of the Baltic Sea Parliamentary Conference’s Working Group onEnergy and Climate Change, 18 May 2009 in Berlin;Energy seminar and joint meeting with the Ministers of Foreign Affairs inthe Baltic Sea Region, 4 June 2009 in Elsinore;Energy workshop, 10 – 11 June 2009 in Kaliningrad.The dialogue process is described in details in Annex 1.5 Representing Baltic Development Forum (BDF), Baltic Sea Parliamentary Committee (BSPC),Council of the Baltic Sea States (CBSS), Union of Baltic Cities (UBC), Baltic Sea StatesSubregional Co-operation (BSSSC), Nordic Council (NC), Nordic Council of Ministers (NCM),CPMR Baltic Sea Commission Energy Workgroup, Baltic Metropoles (BaltMet), Baltic IslandsNetwork B7 and Baltic Assembly (BA).
32
ENERGY PERSPECTIVES FOR THE BSR SUSTAINABLE ENERGY SCENARIOS
Recommendations from stakeholders’ discussionsThis involvement of various stakeholders on different levels contributes to abetter shared understanding of the possibilities and interests in the region.The discussions have resulted in general recommendations on how to developthe Baltic Sea Region as a frontrunner on energy and climate issues:Develop a shared vision ‘A Green Valley of Europe’ in order to mobilize thestrong traditions in the region for public-private co-operation.Establish an energy stakeholders’ forum that includes different cross-border, cross-sector and cross-level actors. Not least the private sectorneeds a larger international platform in order to go beyond small markets.Develop regional projects that could benefit the region as a showcasefor comprehensive and sustainable energy systems including R&D anddemonstration activities.Develop a common interconnector strategy for the region to allow for ahigher level of renewable energy penetration including that from offshorewind power.Launch an action plan for efficient and sustainable heating, involving thelarger cities in the region and the district heating companies.Establish a common regional training program to strengthen the capacitiesin energy planning. Such a program should aim at developing the exchangeof experiences and best practices among officials at local and nationallevels.
1.6 Next stepsAs a key outcome of Phase II, the foundation has been laid for more comprehen-sive analyses and stakeholders’ discussions on the future development of theenergy systems in the Baltic Sea Region.Questions to be answered:The present analyses provide many answers as to how the energy sector inthe region may evolve in the future. However, it also raises new questions,includingHow will the energy systems develop if fuel prices or technology costs evolvedifferently than anticipated? This calls for sensitivity analyses in relation tothe existing analyses.How ambitious targets can be achieved in the region in the long-term if allmeasures are put into play? This calls for an analysis where the scope isexpanded to 2050 in order to show how the region can comply with long-term objectives of the reduction of CO2emissions by 80 %.How can the Nordic countries assist the other countries in the region inmeeting their policy targets? The results indicate that the Nordic countrieshave a potential in becoming large exporters of green electricity to othercountries in the region and potentially to other countries outside the BalticSea region, for example the United K and the Netherlands. How can the
ENERGY PERSPECTIVES FOR THE BSR SUSTAINABLE ENERGY SCENARIOS
33
energy systems and the regulation of the energy markets evolve to enjoy thepossible benefits?Next steps:Improve the quality of Russian data used in the model. A contact has beenestablished with the Energy Forecasting Agency in St. Petersburg.Develop analyses of different concepts for a common interconnection atKriegers Flak and for other regional offshore wind farms.Develop analyses of how to ensure the most efficient use of the heatproduction from the new power plants in the region, including a dialoguewith the central and local decision makers.Evolve the energy markets in the Baltic Sea Region.Evolve the markets for biomass in the Baltic Sea Region.Conducting the study on Energy perspectives for the Baltic Sea Region has beenan ongoing dialogue process. The establishment of the energy database by usingmodeling tools STREAM and Balmorel enables a further dialogue between thestakeholders with possibilities to detail the above-mentioned questions as wellas other questions related to the development of a sustainable energy system inthe Baltic Sea Region.
34
ENERGY PERSPECTIVES FOR THE BSR SUSTAINABLE ENERGY SCENARIOS
2 Scenarios and policy targetsOne Baseline scenario and three alternative policy scenarios are put together toshed light on the future energy situation in the Baltic Sea Region.TheBaseline scenariois developed in order to comply with the EuropeanUnion’s targets of reducing CO2-emissions by 20 % in 2020 and increasing theshare of renewable energy to 20 %.The scenario variations comprise:a scenario withregional targetsfor increasing the share of renewableenergy instead of national targetsanImproved efficiency scenariowhere electricity consumption is expectedto be reduced considerably compared to the baseline projectiona30%@COP15 scenarioshowing a situation where the EU commits itselfto additional CO2-reductions at the COP 15 meeting in December 2009.The means of achieving the policy targets are to a large extent determined by themodelling tool based on a least cost analysis of supply side measures.CO2-targetsThe targets mean that in 2020 CO2-emissions from the electricity generators inthe region should be reduced by 21 % compared to 2005 as this is the generalrequirement for the companies encompassed by the EU Emissions TradingScheme (ETS).The EU ETS covers the majority of fossil fuel power plants in the EU as wellas the energy intensive industry. Because of the significant biomass and windpower potentials in the Baltic Sea Region it is expected that on average theCO2abatement cost in the electricity sector in the region is lower than forcompanies encompassed by the EU ETS. This would give incentives to reduceCO2-emissions in the region beyond the targets. On the other hand, the EU ETSallows companies to import carbon credits from CDM projects6as a means tocomply with the targets. All things considered, it was chosen to apply 21 % as arealistic reduction target for 2020 for the electricity and district heating sectorin the Baltic Sea Region.For 2030 a project target to reduce 50 % of CO2-emissions compared to 1990 wasimplemented. However, compared to 2005 the target is only a 38 % reductionbecause of the significant reduction in CO2-emissions that took place in theEastern part of the region following the transition to democracy after 1990.RE targetsIn addition to the CO2-targets a RE target is included for the electricity sectortowards 2020. In all scenario variations, except “Regional RE target”, the RE6 The Clean Development Mechanism (CDM) is an arrangement under the KyotoProtocol allowing industrialised countries with a greenhouse gas reduction commitment(called Annex A countries) to invest in projects that reduce emissions in developing countriesas an alternative to more expensive emission reductions in their own countries.
ENERGY PERSPECTIVES FOR THE BSR SUSTAINABLE ENERGY SCENARIOS
35
targets are treated as individual targets for each of the countries in the region.The RE targets are set in line with the RE directive endorsed at the summit inDecember 2008.The RE directive provides a target for the share of RE of final energy in eachmember state, but not a separate target for the electricity sector.Renewable energy inthe electricity sectorThe level of renewable energy that will have to be introduced in the electricitysector will, among other things, depend on the economical and technicalopportunities compared to increasing renewables in other sectors such as thetransport sector and the industry. The EU Commission’s renewable energy roadmap7foresees that the penetration of renewable energy in the electricity sectorwill have to increase to 34 % in 2020 in order to comply with a general target of20 % renewable energy in energy consumption. Compared to 2005 this meansa 20 percentage point increase in the share of RE in electricity generation (from14 % in 2005) compared to only a 13 percentage point increase of renewableenergy in overall energy consumption (from 7 % in 2005). In other words, theabsolute share of renewable energy in electricity consumption should increase1.5 times more than the overall share of renewable energy.In the present analyses we chose to operate with a target for the electricity sectorcorresponding to: RE share of electricity in 2005 + 1.5 * required increase in REin overall final energy demand in the directive. As an example, 28 % of electricityconsumed in Denmark in 2005 was supplied from renewable energy. The REdirective requires Denmark to increase its share of RE in final energy demandby 13 percentage point from 17 % in 2005 to 30 % in 2020. Hence, we set the REtarget for the Danish electricity sector at 48 % in 2020 (i.e. 28 % + 1.5 * 13 %).For the Baltic Sea Region as a whole renewable energy electricity correspondedto 26 % of total electricity supply in 2005. For 2020 the target for the region is38 % based on the approach outlined above (see Table 8).Pertaining to the modelling of the energy systems it is assumed that the RE targetsdo not become binding until after 2010. Moreover, to simplify the analyses inthe model, the renewable energy targets do not apply to district heating.Final energy2005 RE share2020 targetIncrease 2005-2020Electricity2005 RE shareExpected increase inelectricity sector2020 targetGermany6%18%12%0%11%18%29%Denmark17%30%13%0%28%20%48%Estonia18%25%7%0%1%11%12%Finland Lithuania Latvia Poland Sweden Norway29%38%10%0%27%14%41%15%23%8%0%4%12%16%35%42%7%0%48%11%59%7%15%8%0%3%12%15%40%49%9%0%54%14%68%60%60%0%0%100%0%100%NWRussia3%0%0%0%19%NANAREGION14%25%11%0%26%15%37%
Table 8: Renewable energy targets. No renewable energy target has been included for North WestRussia; it assumed though that the present renewable generation will continue at least the same leveltowards 2030
In Table 9, the renewable energy targets are expressed in TWh of renewableenergy electricity generation.7 http://www.europa-kommissionen.dk/upload/application/89eba319/03_renewable_energy_roadmap_en.pdf (2009-02-04), see p. 11.
36TWh200520102015202020252030Germany Denmark5710971314016177191821918620Estonia001111
ENERGY PERSPECTIVES FOR THE BSR SUSTAINABLE ENERGY SCENARIOSFinland233036414344Lithuania012223Latvia346678Poland3815202325Sweden Norway761188812798135105135108142109147Russia171717171717REGION308386465525546562
Table 9: Renewable energy requirements (TWh of electricity generation) in the Baseline scenario. In thesensitivity scenario with improved energy efficiency the absolute values are lower because the RE targetis measured as a share of final energy consumption.
Norway
Even though Norway is not a part of the EU, the renewable energy directive willalso be applicable to Norway by virtue of the 1994 European Economic Area(EEA) Agreement, to which Norway is a party8. The electricity generation fromrenewables was 108 % of domestic electricity consumption in Norway in 2005,because of a greater than usual inflow to the Norwegian hydro power plants.However, for the present analyses it was chosen to use 100 % RE share in theelectricity as the starting point for Norway and it is assumed that Norway willstay at this level until 2030.The policy framework in Russia is very different compared to the other countriesin the region, which are all members of the European Union, except Norway.Obviously the EU targets on renewable energy and the EU ETS regulation donot apply to Russia. However, Russia is a party to the Kyoto Protocol and thisprovides Russia with incentives to reduce greenhouse gas emissions. Russia’scommitment under the Kyoto Protocol is to stabilise its emissions at 1990 levelsduring the five year period from 2008 to 2012. The economic recession afterthe break-up of the Soviet Union, as well as structural changes to the economy,have resulted in a massive reduction of Russia’s energy-related CO2-emissions.Therefore it is expected that Russia will have considerable surplus of quotas(so-called AAU) in the period from 2008-2012. Potentially, this surplus couldbe exported to other countries under the Kyoto framework. Moreover, studiesshow that Russia has a large cost-effective potential for further reducing energyrelated CO2-emissions mainly through energy-efficiency improvements in arange of industrial activities and end-use sectors9.For North West Russia we have included a target of 10 % CO2reduction in2020 and a 30 % reduction in 2030. These targets assume that an internationalagreement is reached at COP15 in December 2009, which will provide incentivesfor ambitious reductions. Because of the lack of statistical data on CO2emissions,the targets are measured against a model based on the simulation of North WestRussia in 2005 using the available data set.It is assumed that from 2015 a market for CO2-quotas will be formed allowingRussian power and heat producers to trade quotas with their counterparts inthe rest of the Baltic Sea Region.
Russia
8 “Europe agrees on much-anticipated renewable energy deal”, http://www.bellona.org/articles/articles_2008/europe_energy_deal,10/12-20089 http://www.iea.org/textbase/nppdf/free/2006/russiangas2006.pdf, 2009-03-17. IEA, 2006:“Optimising Russian Natural Gas - Reform and Climate Policy”
ENERGY PERSPECTIVES FOR THE BSR SUSTAINABLE ENERGY SCENARIOS
37
2.1 One Baseline scenario and three policyscenariosIn addition to the Baseline scenario a number of scenario variations are prepared.These variations differ in the way policy targets are complied with and whethercommon solutions or national solutions are put in play.By examining the results of the various scenario variations it is possible toexamine the costs and benefits of pursuing different policies. Moreover, thevalue of implementing specific projects in the region can be examined underdifferent scenarios for the future development of the sector.The table below shows the policy targets for the scenario, the variations, aswell as key assumptions with regard to interconnectors and development inelectricity demand.Regional CO2-target forelectricity sector(compared to 2005)20202030- 21 %- 38 %REtarget2020CountryspecificInter-con-nections2005-2030BAUElectricitydemand2005-2030BAU
New Generation2005-2030Modeldecides(-nuclear, hydro)
ScenarioBaselineScenariovariationsRegional REtargetImprovedefficiency30%@COP15
- 21 %- 21 %- 31 %
- 38 %- 38 %- 38 %
RegionalCountryspecificCountryspecific
BAUBAUBAU
BAU- 22 % in2030BAU
Model(-nuclear, hydro)Model(-nuclear, hydro)Model(-nuclear, hydro)
Table 10: Scenarios and variations towards 2030
Further description of the scenario variations:Regional RE targetThe EU has set out national targets for increasing the share of renewable energyin final energy consumption towards 2020. However, the renewable energydirective allows Member States that are in surplus to sell renewable energycredits to other countries. These so-called ‘statistical transfers’ of RE can alsobe applied in cases where member states cooperate on joint projects. Thissensitivity scenario explores a situation where the countries around the BalticSea cooperate on achieving their national targets.In the Baseline scenario a business-as-usual projection of the development inthe electricity demand is used based on data from the European Commission(EU, 2008). This projection reflects existing policies at the EU level and in thedifferent Member States. In the “Improved efficiency scenario”, as a result offirmer policies, electricity consumption is expected to be reduced considerablycompared to the Baseline projection. As such in 2030 the general electricityconsumption is approximately 20 % below the Baseline level. Moreover, theuse of electricity for heating is reduced, resulting in total electricity savings at22 %.
Improved efficiency
3830%@COP15
ENERGY PERSPECTIVES FOR THE BSR SUSTAINABLE ENERGY SCENARIOS
A separate scenario variation, “30%@COP15”, is developed showing an additionalreduction of CO2emissions by 10 percentage point from the power sector in 2020.This variation reflects a situation where an ambitious international agreementis obtained at the Copenhagen summit in December 2009 committing the EUMember States to cut their overall CO2-emissions by 30 % in 2020.CO2 targets 2005-2030 (Mt)700Baseline600500400300200100-200520102015202020252030Copenhagen 30%
Figure 16: Targets for reducing CO2 emissions from the electricity and district heating sectors in theperiod 2005-2030 for the Baltic Sea Region. A linear development is assumed between 2005 and 2020and between 2020 and 2030.
2.2 Existing subsidies and energy taxesMany countries in the region are already supporting renewable energytechnologies through feed-in tariffs, premiums to the electricity market price,certificate systems, favourable taxation etc.The present study focuses on the least-cost ways of achieving the targets from asocio economic point of view. The existing policy measures for promoting RE arenot considered in the study, because they would tend to divert investments inrenewable energy technologies to the countries with the most favourable supportscheme, rather than the countries with the best renewable energy resources.
ENERGY PERSPECTIVES FOR THE BSR SUSTAINABLE ENERGY SCENARIOS
39
3 Modelling toolThe Balmorel modelThe analyses are carried out by the use of the Balmorel model, which is aneconomic/technical partial equilibrium model that simulates the power andheat markets.The model optimises the production at existing and planned production units(chosen by the user) and allows new investments in the scenarios, chosen by themodel on a cost minimising basis.More information about the model can be found on the model’s website,10www.balmorel.com11.
Figure 17: Map of the transmissions grid in the Baltic Sea Region (Source: Nordel)
40Geographical scope
ENERGY PERSPECTIVES FOR THE BSR SUSTAINABLE ENERGY SCENARIOS
The original version of this model contains data for the electricity and CombinedHeat and Power (CHP) system in the Nordic countries (Denmark, Finland,Norway and Sweden), the Baltic countries (Estonia, Latvia and Lithuania),Poland and Germany.The model considers the most important bottlenecks in the electricity systems.Norway consists of four electric areas with capacity constraints between themSweden consists of three areas, Denmark two and Germany three whereasPoland, the Baltic countries and Finland consist of one area each.Data collected for this study and used in the simulations include data fromNorth West Russia. To be specific, the following regions were included:Republic of Karelia, Kola Peninsula, Pskov Region, Kaliningrad, ArkhangelskRegion, Leningrad Region incl. St. Petersburg, Novgorod Region and Republicof Komi.Due to the lack of exact data about the Russian electricity and heating systemscrude approximations have been made in some cases10.
10 The main sources of information are the reports “Distributed Energy Production in theNorth-West Region of Russia” (Efimov, A, 2007) and “Scenarios for electricity power sectordevelopment in the North-West of Russia” (Abdurafikov R., 2007).
ENERGY PERSPECTIVES FOR THE BSR SUSTAINABLE ENERGY SCENARIOS
41
4 Key assump ons for the scenariosThe following section describes the most important assumptions underlying theanalyses, including:Fuel pricesCO2priceElectricity and heat demand prognosesTechnology costs and investmentsRenewable energy potentials
4.1 Fuel pricesThe development in prices of fossil fuels is based on the latest forecast fromInternational Energy Agency’s (IEA) World Energy Outlook 2008 (WEO-2008).According to this projection the real term price of crude oil will increase from anexpected 100 $/bbl in 2010 to 122 $/bbl in 2030.The prices of different types of biomass are based on information from theDanish Energy Agency. The biomass prices represent the marginal prices ofbiomass delivered at a large power plant. These prices are not necessarily equalto the cost of procurement, because the market price of biomass is defined incompetition with other fuels.For municipal waste a negative cost, - 3 € per GJ -, is used to represent thealternative costs of treatment.(Euro08/GJ)CoalLigniteFuel oilLight oilNuclearNatural gasBiogasWood WasteStrawWoodWood pelletsImport BiomassMunicipal Waste20102.41.56.611.60.75.60.40.65.55.88.77.2-3.120153.72.39.717.00.78.70.40.66.26.49.47.9-3.120203.62.210.518.60.79.50.40.66.36.79.88.2-3.120253.52.111.119.60.710.00.40.66.46.910.18.5-3.120303.42.111.720.60.710.60.40.66.67.210.58.8-3.1
Table 11: Fuel price assumptions used in the study (real terms).
42Gas prices in Norwayand Russia
ENERGY PERSPECTIVES FOR THE BSR SUSTAINABLE ENERGY SCENARIOS
Because Norway and Russia are located closer to large gas reserves than any ofthe other countries in the region, it is assumed that gas can be bought at a lowerprice here. In Norway a 10 % discount is assumed. In Russia it was included a 6 %discount plus a deduction of 0.4 €/GJ from the forecasted European gas importprice. This relationship between European and Russian gas market prices hasbeen estimated based on the correlation between the so-called netback price atthe Russian-Ukrainian border and the price at the EU border11. The differencerepresents transport costs through Ukraine, Slovakia and the Czech Republic inthe period 2004-2007.Currently the gas prices in Russia are state-capped; however the Russiangovernment is planning to increase gradually local gas prices until 2011 inorder to achieve a level of equal profitability of sales on both local and exportmarkets.12
CO2-price
No external CO2-price is applied in the calculations. In its place the model findsoptimal solutions for reducing the emissions of CO2to the targets includedin the scenarios, i.e. a 21 % reduction in 202013(compared to 2005) and a 50% reduction in 2030 (compared to 1990). The model is able to compute themarginal cost of reducing CO2in each scenario. This can be interpreted as theprice of CO2-quotas if the Baltic Sea Region formed a closed market for CO2.With the EU Emissions Trading Scheme as it is implemented today, it ispossible to trade quotas across the whole EU and to import credits from CleanDevelopment Mechanism (CDM) projects as a means to comply with the targetsset out. This will of course have an impact on the price of CO2-quotas in theBaltic Sea Region. However, to simplify the interpretation of the results no linkis assumed to the rest of the EU ETS.
4.2 Transmission capacityThe starting point of the analyses is the existing interconnectors in the BalticSea Region.In addition, it is assumed:Five prioritizedNordic cross sectionsThat the five prioritized Nordic cross sections have all been established by 2015.The five prioritized Nordic cross sections are:•••••Fenno - Skan II linking Finland and Sweden (800 MW)Great Belt in Denmark (600 MW)Nea - Järpströmmen between Sweden and Norway (750 MW)South Link in Sweden (600 MW)Skagerrak IV between Denmark and Norway (600 MW)
11 Russian Analytical Digest 53/0912 See, Reuters article from November 6, 2009. http://www.reuters.com/article/rbssEnergyNews/hidUSL628742520081106 “Russia clears 20 pct domestic gas price rise in ‘09”13 Except in the Copenhagen 30% scenario where the target for 2020 is 31 % reduction. This isnot clear
ENERGY PERSPECTIVES FOR THE BSR SUSTAINABLE ENERGY SCENARIOS
43
Reinforcement ofGerman grid
That a significant reinforcement of the internal grid between the North West andCentral parts of Germany will take place (7000 MW) to accommodate for theplanned expansion of wind power in the northern parts of Germany particularlyoff-shore.That by 2020 Poland and Lithuania are connected by a 1000 MW connection.That a second connection between Estonia and Finland at 650 MW will beimplemented by 2020.
Poland-Lithuania andEstonia-Finland
Norway-NorwayNorway-Sweden
That connections between the central part of Norway and neighbouring areas inSouth and North Norway and North Sweden are upgraded by 1200 MW.No further interconnectors are assumed to be established in the Baselinescenario.
4.3 Electricity demandIn all scenarios except the scenario called “improved efficiency” the demandfor electricity develops as anticipated in the most recent projection from theEuropean Commission14. Table 12 shows the development in electricity demandin the business as usual projection.TWh200520102015202020252030Denmark35,336,938,538,539,840,8Sweden141,9151,4157,6157,6161,0163,0Finland89,098,1104,0104,0108,5111,5Norway118,0127,4134,5134,5141,7147,3Germany575,0615,4649,6649,6667,1682,1Poland113,9130,0149,6149,6170,4185,1Lithuania9,711,713,613,615,417,1Estonia7,28,810,210,211,412,5Latvia6,68,610,210,211,713,2NW Russia90,9102,4110,9120,0129,9140,7
Table 12: The BAU development in electricity demand, 2010-2030, including grid losses.
Improved efficiencyscenario
According to the EU Baseline projection, in the short-term electricityconsumption is projected to increase at a rate similar to that observed in therecent past. In the longer term the Baseline scenario “takes the view that energyefficiency improvements in appliance design and the housing stock are exertinga downward pressure on demand which is moderating the growth of electricityconsumption in all sectors” (EU Commission, 2008, p. 58).In the “Improved efficiency scenario” electricity consumption is expected to bereduced considerably compared to the Baseline projection. This is a result ofstringent policies to make consumers use electricity in a more rational manner.In 2030 the general electricity consumption is approximately 20 % below thebaseline level. The same relative level of energy savings is assumed to take placein all countries across the region.
14 EUROPEAN ENERGY AND TRANSPORTTRENDS TO 2030 — UPDATE 2007, European Commission 2008.
44
ENERGY PERSPECTIVES FOR THE BSR SUSTAINABLE ENERGY SCENARIOSAll countriesSavings in general electricityconsumption relative to baseline20050%20102%20157%202010 %202515 %203020 %
Reducing electricityfor direct heating
In addition to the general effort to reduce electricity consumption, a specificfocus is put on reducing electricity demand for conventional electric heating- through improved insulation of buildings and by converting to other forms ofheating with lower marginal CO2-emissions, such as electric heat pumps, districtheating, solar heating and boilers fuelled by biomass or natural gas.Particularly in Norway, Sweden and Finland, electricity is a very important sourceof heating. Today’s high consumption of electricity in these countries should beseen in relation to the history of the energy systems, particularly the access tocheap hydro power and base-load nuclear power. However, as the electricitymarkets are opened, and considering that the electricity may alternatively beexported to neighbouring countries where the marginal generation comes fromthermal power plants, using electricity for direct heating becomes relativelyexpensive. In the “Improved efficiency scenario” it is assumed that the demandfor electricity for heating in Finland, Norway and Sweden is reduced by 50 %towards 2030.CountryFinlandNorwaySwedenElectricity demand for heating20059 TWh30 TWh21 TWhShare of total final electricity demand200511%27%16%
Table 13: Electricity demand for heating in Finland, Norway and Sweden.
When including the additional effort to reduce electricity demand for directelectric heating, the total electricity savings in 2030, in the improved efficiencyscenario are 22 % for the region as a whole compared to the baseline scenario.
4.4 Existing generation capacityThe Balmorel model holds an inventory of the existing power plants in theBaltic Sea Region. In some countries like the Baltic Countries and Denmarkall large power plants are modelled individually, whereas a more aggregatedrepresentation is used for others, e.g. Germany and Poland.This inventory forms the starting point for the analyses. However, as time movesforward existing plants are commissioned and new sources of generation willhave to be brought online.A number of assumptions on the rate of decommissioning of existing plants areassumed for the individual countries. These assumptions are based on, amongother things, the expected technical life time of power plants, and in certaincases information about the conditions of specific power plants.
ENERGY PERSPECTIVES FOR THE BSR SUSTAINABLE ENERGY SCENARIOS
45
4.5 New generation capacityApart from investments in new nuclear and hydro power, and a minimum levelof investments in wind power and some thermal power plants (power plantsthat will be commissioned with a very level of certainty within the comingyears), investments in new generation capacity are decided upon by the model’sinvestment module.Investment approachThe Balmorel model is myopic in its investment approach, and thereby doesnot explicitly consider revenues beyond the year of installation. This means thatinvestments are undertaken in a given year if the annual revenue requirement(ARR) in that year is satisfied by the market. A balanced risk and rewardcharacteristic of the market are assumed, which means that the same ARRis applied to all technologies, specifically 11.75%, which is equivalent to 10%internal rate for 20 years. In practice, this rate is contingent on the risks andrewards of the market, which may be different from technology to technology.For instance, unless there is a possibility to hedge the risk without too highrisk premium, capital intensive investments such as wind or nuclear powerinvestments may be more risk prone. This hedging could be achieved via, feed-in tariffs, power purchase agreements or a competitive market for forwards/futures on electricity, etc.The model has a data catalogue with a set of new power station technologies thatit can invest in according to the input data. The investment module allows themodel to invest in a range of different technologies including (among others)coal power, gas power (combined cycle plants and gas engines), straw and woodbased power plant, power plants with CCS and wind power (on and off-shore).Thermal power plants can be condensing unit – producing only electricity, orcombined and power plants. The model may also invest in heat generationcapacity such as coal, biomass and gas boilers, as well as large-scale electricheat pumps and electric boilers.Basic technical and economic data for the power generation technologies thatthe model may invest in can be viewed in the table below. The same technologyassumptions are used throughout the period from 2010 to 2030; however theCCS technology is not assumed to be commercially available until 2020.Wave power and solar power technologies are not considered in the analysis,because – without special subsidies – they are not expected to be competitivewith wind power and biomass technologies within the time-frame of the study.However, the technological development may evolve differently than assumedhere. This is one of the questions that are foreseen to address in connection withfuture sensitivity analyses.
Technology datacatalogue
46Investmentcost(mil. €/MW)
ENERGY PERSPECTIVES FOR THE BSR SUSTAINABLE ENERGY SCENARIOS
Technology
FixedO&M(€1000/MW)11130922483229323450313429531641
VariableO&M (€/MWh)
ElectricefficiencyCondensingmodeNA60%NANANA39%45%48%39%41%48%48%47%45%NANA
ElectricefficiencyCHP mode
Totalefficiency(Elec. + heat)
Natural Gas fired BackPressure CCNatural Gas firedExtraction CCBiogas fired BackPressure CHPStraw fired BackPressure CHPMunicipal Waste firedBack Pressure CHPCoal fired CondensingPower with CCSWood firedCondensing PowerCoal fired CondensingPowerCoal fired ExtractionPower Plant CCSLignite firedExtraction CHPNatural Gas firedExtraction CHPCoal fired ExtractionCHPStraw fired ExtractionCHPWood fired ExtractionCHPWind Turbine, On-shoreWind Turbine, Off-shore
0.80.63.52.66.22.01.51.22.11.21.21.41.91.91.32.0
32292241532152225323
49%55%39%30%32%0%0%0%32%34%40%41%39%38%NANA
94%90%90%90%95%39%45%48%74%82%92%85%90%87%100%100%
Table 14: Electricity generation technologies, which the model can invest in.
Nuclear powerAs opposed to letting the model make “optimal” investments in nuclear power, ithas been chosen to describe a development based on best available informationabout the future role of nuclear power in the different countries in the region.The reason for this approach is twofold: first of all the direct costs of new nuclearpower plants are associated with a high degree of uncertainty. For example, the5thFinish nuclear reactor of 1600 MW, which is currently under construction,was projected to cost EUR 3.2 billion, but a EUR 2.3 billion cost overrun isreported15. Secondly, a number of environmental externalities are related tonuclear power including the risk of nuclear accidents, radio-active emissions frommine-tailings, long-term storage of radioactive waste and the decommissioningof the power plants. These externalities are extremely difficult to monetize andtherefore in reality decisions on nuclear power are based as much on politicalassessments and risk assessments as on financial calculations.15 Danish Newspaper ”Information” 09 09 05.
ENERGY PERSPECTIVES FOR THE BSR SUSTAINABLE ENERGY SCENARIOS
47
The table below shows the expected development of nuclear power in theindividual countries in the Baltic Sea Region towards 2030.Nuclear outlookThe nuclear Baseline scenario is made with the intention to form a compromisebetween the very strong views against or in favour of nuclear power.MWDenmarkSwedenFinlandNorwayGermany2005-9,3722,656-20,2642010-9,3722,656-20,2642015-9,3724,256-20,2642020-9,3724,256-20,2642025-9,3724,256-17,8702030-9,3724,256-9,256
PolandLithuaniaEstoniaLatviaNW RussiaTotal
-1,200--5,76039,252---5,76038,052
----5,76039,652
-1,500--5,76041,152
2,0891,500--5,76040,847
4,3851,500--5,76034,529
Table 15: Expected development in nuclear capacity in the Baltic Sea Region. This development isapplied in all scenarios.
In Germany and Sweden nuclear power has been high on the political agendafor a long time, with continuing debates about whether or not the technologyshould be phased out or advanced.Nuclear in SwedenIn Sweden the Parliament decided in 1980 that no further nuclear power plantsshould be built, and that a nuclear power phase-out should be completed by2010. In 1999 Barsebäck block 1 was shut down, and in 2005 block 2 was shutdown. However, the energy production from the remaining nuclear powerplants has been considerably increased in recent years to compensate for theshutting down of Barsebäck. The current conservative-led coalition is positivetowards nuclear power and has decided to cancel the Nuclear Phase-Out Act. Inaddition, it will be possible to grant permits for successively replacing currentreactors as they reach the end of their technological and economical life. Forthe present analyses we assume that the existing nuclear power plants eitherremain operational to 2030, or are replaced by new nuclear power plants of thesame capacity.In Germany a decision was made in 2000 on the gradual shut down of thecountry’s nineteen nuclear power plants. This decision was based on a 32 yearlife-time of the existing plants. However, the current German chancellor AngelaMerkel is opposing a phase-out, and therefore depending on the outcome ofthe next German federal election it is not unlikely that the nuclear phase-outwill be postponed or abandoned. For the present analyses it has been assumedthat the life-time is increased 50 years on average. This means that in 2020 allexisting plants are operating, but in the period between 2020 and 2030 morethan 50 % of the nuclear capacity is taken out. No new nuclear power plants areanticipated in Germany.In Lithuania a new nuclear power plant is foreseen to come online in 2020 as asubstitution for the Ignalina power plant, which is assumed to be taken out of
Nuclear in Germany
Lithuania
48
ENERGY PERSPECTIVES FOR THE BSR SUSTAINABLE ENERGY SCENARIOS
operation by 2010 in accordance with the agreement between Lithuania and theEU.PolandIn Poland the government sees nuclear power as part of the solution to reduceCO2-emissisons and diversify energy sources. In accordance with the Baselineprojection from the EU Directorate - General Energy and Transport (DG TREN)scenario, 2.1 GW of nuclear power capacity is expected to be commissioned by2025, and a further 2.4 GW by 203016.In Finland the 5threactor is expected to be producing by 2015. No furtherexpansion with nuclear power is assumed in Finland in the scenario despitecurrent discussions about the 6threactor.In 2007 16% of total Russian electricity demand was supplied by nuclear power.Rosatom, the State Atomic Energy Corporation running all nuclear assets of theRussian Federation, announced in 2006 a target for nuclear power providing23% of electricity by 2020 and 25% by 2030, but since then plans have beenscaled back by the government17.Almost 6,000 MW of nuclear power capacity is installed in North West Russiaand a number of new nuclear power stations are being proposed, includingplants in Kaliningrad and St. Petersburg. On the other hand the existing plants,among others in St. Petersburg, are scheduled to be closed or renovated withinthe next 15 years.Because of the uncertainty related to the future policy decisions about newnuclear capacity in this part of Russia it has been assumed to keep the nuclearcapacities in NW Russia unchanged towards 2030.Denmark, Estonia,Latvia, NorwayIn Denmark, Estonia, Norway and Latvia it is assumed that there will not bebuilt any nuclear power plants.
Finland
Russia
Hydro powerA number of countries around the Baltic Sea Region hold a significant potentialto increase the generation of electricity from hydro power. To a higher degreemany other sources of electricity generation, the costs of and possible barriers tohydro power projects are site specific. Hence, investments in new hydro powercapacity are not decided by the model’s investment module.In the analyses it is assumed that the generation from hydro power is increasedsomewhat beyond today’s production. However, the full technical economicalpotential, as identified in various studies, is not utilised.The greatest potential for expanding hydro power generation is in Norway.According, to the Norwegian Water Resources and Energy Directorate (NVE)16 http://www.world-nuclear.org/info/inf102.html(2009-02-03).17 http://www.world-nuclear.org/info/inf45.html, 25 June 2009.
ENERGY PERSPECTIVES FOR THE BSR SUSTAINABLE ENERGY SCENARIOS
49
the total potential for large-scale hydro power in Norway is approx. 205 TWh18,including 18.5 TWh from small-scale hydro power. These numbers should becompared to today’s generation, i.e. the current utilization of the potential,which in a year is 122 TWh of average inflow.Around 46 TWh of the total hydropower potential is located in protectedwatercourses, which gives remaining potential of around 56 TWh per year thatis not protected against the development of power stations. However, it shouldbe noted that the potential for small-scale hydro power is based on a theoreticalassessment that does not take into consideration environmental impacts andother factors that reduce development opportunities.For the present analyses it is assumed that the total generation from Norwegianhydro power is increased by 1 TWh annually, leading to a 25 TWh increase from122 TWh in the base year 2005 to 147 TWh in 2030. This development includesa higher level of generation from existing power plants due to expected climatechange.The table below shows the assumed development in annual generation fromhydro power, country by country in the period 2005-2030.TWh200520102015202020252030Denmark0.00.00.00.00.00.0Sweden72.573.074.075.075.075.0Finland13.813.813.814.015.016.0Norway121.8126.8131.8136.8141.8146.8Germany26.726.928.428.529.229.9Poland2.02.12.53.03.23.5Lithuania0.80.80.80.80.80.8Estonia0.00.00.00.00.00.0Latvia3.33.33.33.33.33.3Russia12.012.012.012.012.012.0Table 16: Assumed development in annual generation from hydro power, country by country, 2005-2030. Note that no division is made between small and large-scale hydro power.
Wind powerA minimum development in investments in wind power is assumed in all scenarios.This mainly reflects wind power plants that are already under construction,and projects where firm decisions have been made. National objectives likethe Swedish target to expand to 30 TWh of wind power production in 2020,or the Danish target to increase wind power generation to 50 % of electricityconsumption in 2025 are not reflected in the minimum development.The table below shows the minimum wind power development country bycountry in the period 2005-2030. In some countries the DG TREN forecast for2010 is used as the minimum. No wind power expansion is included in Russiain the minimum development.18 NVE (2008): “Facts 2008. Energy and Water Resources in Norway”, p 24ff.
50
ENERGY PERSPECTIVES FOR THE BSR SUSTAINABLE ENERGY SCENARIOSTable 17: Minimum wind power development. No wind power expansion is included in Russia in theminimum development.Onshore200520102015202020252030Denmark2.6002.7503.1003.1003.1003.100Sweden4931.6121.6121.6121.6121.612Finland822505001.5001.7502.000Norway2745089401.3801.6001.990Germany18.42824.35124.35124.35124.35124.351Poland83600600600600600Lithuania698204210225230Estonia32201203220230235Latvia24171180195198200
OffshoreDenmarkSwedenFinlandNorwayGermanyPolandLithuaniaEstoniaLatvia
2005423------
201060050060-140
20151.20050060-800
20201.20050060-800
20251.20050060800
20301.20050060-800
The model’s investment module can choose to invest in additional wind powercapacity based on the technical/economical potentials in each country. Theseare not the theoretical potentials for wind, but an estimate of a possible potentialtaking into consideration constraints related to access to sites, the economics ofdeveloping different sites and the available wind resources.These potentials have mainly been deduced from the EU financed projectTradeWind, “Wind Power Scenarios”19. In some cases however, the data hasbeen supplemented by other sources of information. The values for 2030 are abest estimate of a long-term technical/economical potential. The model is notallowed to invest beyond the long-term potential.Table 18: Technical/economical wind power potential (total cumulative maximum).Onshore200520102015202020252030Denmark2.6002.7503.5003.5003.5003.500Sweden4931.6124.8068.0008.0008.000Finland822805009002.1002.100Norway2273.0005.0007.0007.0007.000Germany18.42826.78630.13432.02933.60033.630Poland831.5004.0007.00011.00014.000Lithuania62506501.0501.2001.370Estonia323078009351.5001.805Latvia27140400550800800
OffshoreDenmarkSwedenFinlandNorwayGermanyPolandLithuaniaEstoniaLatvia
200542323--165--
2010600550500-1.680-
20153.0002.6002.5002.50012.4791.000200500150
20206.0005.5006.5005.00024.6112.0002001.500150
20259.00010.00010.0007.30027.2842.0002002.000150
203012.00011.00010.0007.30029.9572.0002002.000150
19 http://www.trade-wind.eu/fileadmin/documents/publications/D2.1_Scenarios_of_installed_wind_capacity__WITH_ANNEXES.pdf, (2009-02-04)
ENERGY PERSPECTIVES FOR THE BSR SUSTAINABLE ENERGY SCENARIOS
51
With respect to Russia a crude estimate has been made that the total long-termpotential for on-shore wind power in the North West region is 14,500 MW(including 3000 MW in reach of the areas Karelia, Komi Peninsula, Arkhangelskand Komi and 625 MW each in Pskov, Kaliningrad, Leningrad Region andNovgorod).Full load hoursThe table below shows the assumed number of full load hours for wind powerin each country. 1 MW wind turbine with 2600 full load hours will produce2600 MWh of electricity during one year – this corresponds to a 30 % capacityfactor.Table 19: Number of full load hours for wind power.
GermanyDenmark, EastEstoniaFinlandLatviaLithuaniaPolandSwedenRussiaDenmark, WestNorway
Onshore2200
Offshore
35002600
3000
4145
Existing and planned capacity by fuelFigure 18 summarizes the so-called exogenously specified power generationcapacity for all countries in the years 2010-2030, i.e. the existing power plants –which are gradually phased out – as well as planned investments in new nuclearpower, wind power and hydro power as described above.The total existing and planned capacity decreases from approx. 300,000 MW in2010 to 250,000 MW in 2030. The capacity of the thermal power plants firedwith coal, oil, natural gas or biomass is reduced from approx. 150,000 MW in2010 to 90,000 MW in 2030.
52
ENERGY PERSPECTIVES FOR THE BSR SUSTAINABLE ENERGY SCENARIOS
Existing and planned capacity350.000300.000250.000200.000
WindWaterBiomassNuclearNatural gas
MW
WM
WasteOilCoal and lignite
150.000100.00050.000-
201031.74784.5299.40738.05141.5691.96212.75082.514
201534.29887.5559.03639.65136.8051.96910.48873.201
2020Baseline scenario34.29789.4197.99941.15132.1961.9769.19559.339
202534.29791.6027.81740.84727.9891.9768.04651.238
203034.29593.7967.63934.52924.8121.9767.06046.209
WindWaterBiomassNuclearNatural gasWasteOilCoal and lignite
Figure 18: Existing and planned capacity by fuel for all countries [MW]
Biomass resourcesExpansion with biomass fired power plants and boilers may to some extent belimited by the availability of resources locally.The table below provides an overview of possible biomass resources in 2030 ineach of the countries in the region divided into five general categories:•••••Energy crops and grass cuttingsForestry residues from felling and complementary fellingBiogas from manureBiowaste (mainly agricultural residues)Municipal waste
The municipal waste resource also includes the non-renewable energy fractionof the waste.
ENERGY PERSPECTIVES FOR THE BSR SUSTAINABLE ENERGY SCENARIOS
53Total22501734116071114221111820217
PJGermanyDenmarkFinlandSwedenEstoniaLithuaniaLatviaPolandNorway
Energy crops and Forestry Biogas from Biowaste (mainlyMunicipalgrass cuttings residuesmanure agricultural residues)waste98045459543316312730201407510081725501601903915225969302234023436434542150176575032629111525440
BALTICSEA2818677379111711306121Table 20: Available bioenergy resources in the Baltic Sea Region. The figures are derived from the report“How much bioenergy can Europe produce without harming the environment?” (EEA 2008), the Green-X database on dynamic cost-resource curves and a projection of the municipal waste resource fromRISØ DTU20. Data for Russia is lacking. For the purpose of modelling no limitation has been implementedon the access to biomass resources in Russia.
The total identified bioenergy potential will not be to the disposal of theelectricity and district heating sector as the bioenergy will also be used inindustry, households and for the transport sector. Previous long-term scenariostudies for the EU suggest that it is reasonable to assume that roughly 60 % ofthe total bioenergy resource will be available for the power and district heatingsector. This assumes that the share of bioenergy used for transportation fuels israther low (approx. 5%).The table below gives an estimate of the bioenergy resource available for thepower and district heating sectors. It is assumed, that 90 % of municipal waste,manure and biowaste is used here – since these fuels are the most difficult tohandle and incinerate - whereas only 40 % of energy crops and forestry residueswill be used for power and district heating generation. In total, for the Baltic SeaRegion, this means that 61 % of the total bioenergy resource is available for thepower and district heating sectors.PJGermanyDenmarkFinlandSwedenEstoniaLithuaniaLatviaPolandNorwayBALTICSEAEnergy crops andgrass cuttings39222223221322550901127Forestryresidues8016304037102064271Biogas fromBiowaste (mainlyMunicipalmanureagricultural residues)waste171351420585840341200362113273149113515100559145295681014229361017Total143513330546768206569771153762
Table 21: Available bioenergy resources in the Baltic Sea Region for the electricity sector and for districtheating. Data for Russia is lacking. For the purpose of modelling no limitation has been implemented onthe access to biomass resources in Russia.20 Norwegian data is based on the following source,http://www.fornybar.no/imagecache/43.OriginalImageData.20070320085549.jpghttp://www.fornybar.no/sitepageview.aspx?articleID=37http://www.avfallnorge.no/fagomraader/energiutnyttelse/nyheter/energiutnyttelse_2008,22.05.2009
54
ENERGY PERSPECTIVES FOR THE BSR SUSTAINABLE ENERGY SCENARIOS
Interpretation of the biomass categories to the modelFor the purpose of modelling, the two biomass categories “Energy crops andgrass cuttings” and “Forestry residues” are merged into one fuel category termed“Wood”.The domestic wood is limited according to the available resources, whereasthere is not assumed any limit on the possibilities for using imported biomass.For domestic wood a price of wood chips is used. For imported biomass a higherprice is applied, reasoned upon higher transportation and handling costs (seeprevious section). Wood pellets are more expensive than wood chips, but easierto transport and handle.For all other types of biomass only the domestic resources can be used.The biowaste resource is generally termed “Straw” in the model. It is recognizedthat part of this resource is cheaper “Wood waste” used at existing power plantsin Sweden and Finland. For this fraction a price close to zero is used.For the purpose of modelling it is assumed that biogas may be used inconnection with all local district heating schemes. This is a simplification of theactual possibilities for utilization of biogas. A negative CO2-factor (-43 kg/GJ) isused for biogas in order represent the abated fugitive emissions (methane andnitrous-oxide) related to the alternative use of the manure in the agriculturalsector.
ENERGY PERSPECTIVES FOR THE BSR SUSTAINABLE ENERGY SCENARIOS
55
5 Scenario analysesThis section presents the results from the simulation of the Baseline scenario aswell as the three scenario variations:•Regional RE target.Cooperation on achieving EU renewable energytargets.•Improved efficiency.Lower demand for electricity than in the Baselinescenario.•30%@COP15.Stricter CO2-reduction target in 2020.The Baseline scenario is described with a quite high level of details, whereasthe presentation of the scenario variations mainly focuses on the differencescompared to the Baseline scenario.
5.1 Baseline scenarioAs previously mentioned, the Baseline scenario is developed to comply withthe EU targets for 2020, as well as the target of 50 % CO2reduction in 2030compared to 1990.Investments in newgeneration capacityThe investments in new technologies for all countries are shown in Figure 19. Inthe figure the investments in new generation capacity are also compared to thedevelopment in existing and planned capacity, thus providing an outlook of thedevelopment in the total generation portfolio.It appears that the mainly chooses to invest in wind power plants and new coalpower plants.The coal power plants that the model invests in are a new very efficienttechnology with electric efficiencies of 48 % when running in condensing mode.The coal fired power plants are primarily established in the beginning of theperiod – where the targets for reducing CO2emissions and increasing the shareof renewable are not so strong – while the wind power plants are establishedmore evenly during the whole period from 2015 to 2030.The model also chooses to make some investment in new biogas basedgeneration capacity; new biomass fired capacity and by the end of the period incoal fired capacity equipped with CCS. Though the level of investments is fairlysmall compared to the investments in e.g. wind power, it indicates that thesetechnologies are competitive.No investments are made in electricity generation capacity based on municipalsolid waste. This may reflect that the alternative cost of treatment, estimated to
56
ENERGY PERSPECTIVES FOR THE BSR SUSTAINABLE ENERGY SCENARIOS
be -3.1 €/GJ, is too low. This is an issue that deserves attention in connectionwith further analyses.Capacity by fuel450.000400.000350.000300.000250.000MW
New - Coal CCSNew - BiogasNew - WindNew - Bio massNew - Natural gasNew - Coal and ligniteExisting capacity andplanned capacity
200.000150.000100.00050.000-201020152020Baseline scenario20252030
Figure 19: Total electrical capacity (MW) for Baseline scenario distributed on new and existingcapacities.
Total generation capacity450.000400.000350.000300.000250.000200.000150.000100.00050.000-201020152020Baseline scenario20252030Coal CCSBIOGASWindWaterBiomassNuclearNatural gasWasteOilCoal and lignite
Figure 20: Total electrical capacity (MW) for Baseline scenario distributed on fuels.
In the followingfigures the cumula ve investments for each country (grouped by fuel)are shown for the years 2020 and 2030. It should be remembered that these invest-ments are in addi on to exis ng and planned capaci es.Investments in new efficient coal power plants are made in all countries exceptNorway. It can of course be questioned if these investments will be politicallyacceptable. However, according to the model simulation, and given the inputassumptions used, they are attractive from an investor point of view. Thisfinding points to the fact that considering the assumed development in fuelprices and the need for CO2-reductions, the existing portfolio of power plantsis not sufficiently energy efficient. Moreover, the investment in new coal poweris a result of the relationship between the projected coal and natural gas prices,which favour the former fuel. This fuel price link also explains why the modelchooses to make only very few investment in new natural gas fired capacity inspite of the target to reduce CO2-emissions.Towards 2020 wind power is increased significantly in all countries except
MW
ENERGY PERSPECTIVES FOR THE BSR SUSTAINABLE ENERGY SCENARIOS
57
in Russia, Lithuania and Estonia. The most notable expansion takes place inGermany, where total installed wind power capacity is increased to almost45,000 MW, of which 20,000 MW is commissioned in the period 2010-2020.The majority of this investment, 12,000 MW, is in off-shore capacity.The relatively moderate wind expansion in Denmark should be seen in the lightof the 800 MW off-shore capacity already scheduled to come online 2010-2015 inthe Baseline development. These are plants that are already under constructionor have been approved by the authorities21.Cumulated invested capacity30.000
25.000
20.000
MW
W15.000M
10.000
5.000
-
DENMARK
E TONIAS
FINLAND
GERMANY
LATVIA
LITHUANIA2020
NORWAY
POLAND
RUS IAS
S DEWE N
Baseline scenarioCoal and ligniteNatural gasPeatStrawWindWoodBiogas34271.385312195802614.8131.12520.1582.20671124.81883662461029911676231261.4374.4005.1987695.92411.767531.767
Figure 21: Cumulated invested capacity (MW) from 2010-2020 for Baseline scenario.
Between 2020 and 2030 considerable investments are made in biogas capacityand coal power plants with CCS. Most of the new coal power plants with CCS arelocated in Germany, whereas the investments in biogas capacity are distributedmore evenly across the region consistent with the identified fuel potentials.Both technologies become more attractive by the end of the period where thecommitment to reduce CO2-emissions turn out to be increasingly importantrelative to the obligation on new renewable energy. In the case of biogas becausethe model takes into account the additional reduction of greenhouse gases (CO2-equivalents) in the agricultural sector.More than 10,000 MW of wind power capacity is installed in both North WestRussia and Denmark between 2020 and 2030. The investments in Denmarkmainly concern off-shore wind power, whereas the investments in North WestRussia are in on-shore capacity. In this respect it should be mentioned thatthe model does not include a limitation on the amount of generation that canbe installed within a given time period. In practice there may be bottlenecksin the manufacturing industry or in relation to planning or grid connection,21 Horns Rev II and Rødsand II (200 MW each), which are currently being developed, as well asAnholt (400 MW), which is undergoing a tender procedure.
58
ENERGY PERSPECTIVES FOR THE BSR SUSTAINABLE ENERGY SCENARIOS
which could defer a rapid development in installed capacity over a short periodof time.Cumulated invested capacity30.000
25.000
20.000
MW
W15.000M
10.000
5.000
-
DENMARK
E TONIAS
FINLAND
GERMANY
LATVIA
LITHUANIA2020
NORWAY
POLAND
RUS IAS
S DEWE N
Baseline scenarioCoal and ligniteNatural gasPeatStrawWindWoodBiogas34271.385312195802614.8131.12520.1582.20671124.81883662461029911676231261.4374.4005.1987695.92411.767531.767
Figure 22: Cumulated invested capacity (MW) from 2010-2030 in the Baseline scenario.
Electricity generationby fuel
The electricity generation by fuel for all countries is shown in Figure 23. Theutilisation of natural gas decreases dramatically between 2010 and 2015 as aresult of the investments in wind power and new efficient coal power plants.This development is particularly profound in Russia where approximately halfof the electricity is produced from natural gas in the 2010 simulation. It shouldbe mentioned that such a sharp drop in the demand for natural gas is likely toresult in a drop in the regional natural gas price. A drop in the gas price will tosome extent cancel out the reduction in gas demand. However, this relationshiphas not been quantified in the simulation.The role of wind power is gradually increased over the period and by 2030 windpower is the largest source of electricity next to coal power and hydro power.Biomass and biogas only gain significance by the end of the period. Co-firing ofbiomass at existing coal fired power plants is not considered an option in themodel. Therefore the model may underestimate the use of biomass.
ENERGY PERSPECTIVES FOR THE BSR SUSTAINABLE ENERGY SCENARIOSElectricity generation1.6001.4001.2001.000hW800T600400200-201020152020Baseline scenario20252030Coal CCSBiogasWindWaterOilshaleBiomassNuclearNatural gasWasteOilCoal and lignite
59
Figure 23: Total electricity generation (TWh) by fuel for Baseline scenario.
The distribution of electricity generation for each country grouped by fuel isshown in Figure 24, Figure 25 and Figure 26 for the years 2010, 2020 and 2030,respectively.
TWh
Electricity generaby countryElectricity generationon by country600,0
500,0
400,0
TWh
hWT
300,0
200,0
100,0
-
DENMARK
E TONIAS
FINLAND
GERMANY
LATVIA2010
LITHUANIA
NORWAY
POLAND
RUS IAS
S DEWE N
Baseline ScenarioBiomassWindWaterShalePeatNuclearNatural gasWasteOilCoal and lignite12,41,90,726,00,70,11,09,73,26,818,011,8166,895,89,90,0215,32,30,10,4126,88,65,20,29,70,31,92,34,531,253,30,163,35,40,92,89,40,40,510,80,913,854,126,80,30,43,30,10,30,80,11,5126,80,91,62,15,10,012,310,55,673,0
Figure 24: Electricity generation (TWh) for each country in 2010 grouped by fuel in the Baselinescenario.
60
ENERGY PERSPECTIVES FOR THE BSR SUSTAINABLE ENERGY SCENARIOS
Electricity generation byby countryElectricity genera oncountry700,0600,0500,0400,0TWh
300,0200,0100,0-
DENMARK
E TONIAS
FINLAND
GERMANY
LATVIA2020
LITHUANIA
NORWAY
POLAND
RUS IAS
S DEWE N
Baseline ScenarioBiogasBiomassWindWaterShalePeatNuclearNatural gasWasteOilCoal and lignite2,41,90,020,82,38,2254,66,10,90,10,90,50,328,81,4166,85,810,80,60,10,25,6120,90,212,30,41,00,20,10,30,081,110,831,24,90,063,30,50,91,915,80,60,510,916,014,026,8115,728,41,11,53,30,60,30,30,85,8136,81,91,913,03,05,10,012,38,721,274,9
Figure 25: Electricity generation (TWh) for each country in 2020 grouped by fuel in the Baselinescenario.
EElectricity generaby countrylectricity generationon by country700,0600,0500,0400,0300,0200,0100,0-
TWh
hWT
DENMARK
E TONIAS
FINLAND
GERMANY
LATVIA2030
LITHUANIA
NORWAY
POLAND
RUS IAS
S DEWE N
Baseline ScenarioCoal CCSBiogasBiomassWindWaterShalePeatNuclearNatural gasWasteOilCoal and lignite0,91,90,010,42,70,50,10,05,4227,25,80,20,10,228,81,476,213,311,21,40,10,25,394,70,112,30,50,80,236,11,10,30,064,69,531,23,863,30,10,92,52,343,61,80,50,70,51,510,916,016,092,318,526,5128,729,80,52,01,93,20,70,90,50,40,80,224,8146,813,99,12,313,03,516,627,812,31,48,824,374,9
Figure 26: Electricity generation (TWh) for each country in 2030 grouped by fuel for Baseline scenario.
District heatinggeneration
In Figure 28 the generation of district heating for all countries can be seen forthe years 2010 and 2030. The generation of district heating is grouped by fuelIn Russia there is a notable change from gas to coal based heat production.The coal based heat is surplus heat from the coal fired power plants, which themodel choses to invest in in 2015.
ENERGY PERSPECTIVES FOR THE BSR SUSTAINABLE ENERGY SCENARIOS
61
In Germany the district heat is mainly generated from coal and natural gas in2010. By 2030 surplus heat from biogas and biomass gains increasing importancetaking the role of natural gas, which is most completely phased out.In Finland heat supply is changed to a high degree of electric based heating fromheat pumps and very small share from electric boilers. The share of biogas andbiomass based heating are increased as well. In Denmark a similar pattern isobserved.Coal is the dominant fuel in Poland in 2010. By 2030 municipal waste burnedat heat only boilers becomes the most important source of district heating incombination with sizeable shares of biomass and biogas based heating as wellas electric heating. The results illustrate, that from an economic point of view itis more attractive to treat the municipal waste at heat only boilers as opposed tousing it at combined heat and power facilities.In Estonia, Latvia and Lithuania natural gas and oil based heating are replacedwith surplus heat from coal and biomass power plants as well as electric heatpumps.The competiveness of heat pumps using electric compressors should be seenin relation to the expansion with wind power, which has very low short runmarginal costs. A Coefficient-Of-Performance (COP) of 3.0 is assumed for theheat pumps.District hea ng generacountryDistrict heatinggeneration byon by country140,0ElectricityBiomass120,0SHALEPEATNuclear100,0Natural gasWasteOil80,0Coal and lignite
TWh60,040,020,0-
hWT
DENMARK
E TONIAS
FINLAND
GERMANY
LATVIA
LITHUANIA2010
NORWAY
POLAND
RUS IAS
S DEWE N
Baseline scenarioElectricityBiomassSHALEPEATNuclearNatural gasWasteOilCoal and lignite12,44,13,99,95,00,33,44,64,551,212,629,013,46,50,22,44,94,30,21,20,121,41,216,085,08,35,11,64,50,70,80,21,464,05,611,50,512,70,60,30,00,34,73,90,924,0
Figure 27: Total heat generation (TWh) for each country grouped by fuel in 2010 for baseline scenario.SHALE: Oil shale.
62
ENERGY PERSPECTIVES FOR THE BSR SUSTAINABLE ENERGY SCENARIOS
District heatinggeneration by countrycountryDistrict hea ng genera on by160,0Electricity140,0Coal CCSBiogasBiomass120,0SHALEPEATNuclear100,0Natural gasWasteOil
TWh
hWT
80,0
Coal and lignite
60,0
40,0
20,0
-
DENMARK
E TONIAS
FINLAND
GERMANY
LATVIA
LITHUANIA2030
NORWAY
POLAND
RUS IAS
SWEDEN
Baseline scenarioElectricityCoal CCSBiogasBiomassSHALEPEATNuclearNatural gasWasteOilCoal and lignite1,44,10,111,41,00,30,12,15,136,81,61,86,11,60,20,14,40,74,21,30,61,36,953,97,837,80,056,310,33,33,910,82,51,50,71,70,20,20,10,31,47,60,111,52,015,813,118,524,36,10,72,70,31,90,61,10,90,40,413,04,211,910,315,31,922,43,80,8
Figure 28: Total heat generation (TWh) for each country grouped by fuel in 2030 for baseline scenario.SHALE: Oil shale.
CO2and RE prices
The model is able to compute the cost of tightening the CO2-target by oneadditional ton of CO2as well as the cost of additionally increasing RE generationby one MWh. Respectively, these values can be interpreted as estimates of theCO2-price in the emissions trading scheme, and the marginal level of supportneed for renewable energy.It is assumed that CO2can be traded across all countries including North WestRussia; consequently there is one common price of CO2for the whole region.Renewables, on the other hand, are taken care of by national policies in theBaseline scenario and therefore the prices are different for each country in theregion.As can be seen from Table 22 the simulations show that the marginal cost ofabating CO2is approx. 7 € per ton in 2020 and approx. 50 € per ton in 2030.The RE prices differ between the countries. In Russia there is no price of REbecause there is not assumed any national RE target. In Norway the price ofRE is zero because the expected development of new hydro power easily leadsto compliance with the national RE target. In 2020, Finland, Lithuania, Latviaand Germany have the highest marginal costs of expanding renewable energyelectricity generation.
ENERGY PERSPECTIVES FOR THE BSR SUSTAINABLE ENERGY SCENARIOS
63
The difference in compliance costs reflects the costs of new renewable energygeneration in each of the countries compared to the value of new renewableenergy electricity in the electricity marketsBetween 2020 and 2030 the target for RE is kept constant, whereas the CO2-target is tightened from a 21% to 38 % reduction compared to 2030. Therefore,in 2030 the CO2-target becomes binding, whereas the RE target only binds inLatvia and Lithuania.The simulations show that the shadow price of CO2is approx. 50 € per ton in2030. The impact of investors banking quotas over the period to profit fromfluctuations, as well as trading outside the region or with other sectors is notconsidered in the modelling. Therefore, the CO2shadow prices cannot be directlyviewed as an estimate of the future CO2-price.
Shadow prices for CO2target and RE target2020CountryRECO2EUR/tonEUR/MWhelDenmark16Estonia16Finland29Germany30Latvia317Lithuania31Norway-Poland24Sweden16NW Russia-
2030CO2EUR/ton
52
REEUR/MWhel----112----
Table 22: Shadow prices for CO2target and RE target for Baseline scenario.
CO2-emissions
Figure 31 below shows the total CO2emissions in each country from 2010 to2030. It appears that the CO2emissions are highest in Germany and Poland;however both countries see large decreases from 2020 to 2030.Emissions in North West Russia increase significantly between 2010 and 2020.This is consequence of investments in new coal power plants substitutingexisting natural gas fired capacity. Between 2020 and 2030 emissions in NorthWest Russia decrease somewhat as new wind generation and biomass firedpower plants come online.
64Mt600
ENERGY PERSPECTIVES FOR THE BSR SUSTAINABLE ENERGY SCENARIOS
S DEWE NRUS IASPOLAND
500
NORWAYLITHUANIALATVIA
400
GERMANYFINLANDE TONIAS
300
DENMARKRegional target
200
100
-20102015202020252030
Figure 29: Total CO2-emission (megatons) by country from 2010 to 2030 for Baseline scenario.
Figure 30 shows the total CO2emissions for all countries grouped by fuel. Coal isby far the greatest source of emissions. The emissions from biogas are negativedue to the abated methane and nitrous oxide emissions in the agriculturalsector.
CO2 emission by fuel600500400s300notageM200100-2010-10020152020Baseline scenario20252030OtherBIOGASNatural gasWasteOilCoal CCSCoal and lignite
Figure 30: Total CO22-emission (megatons) from 2010 to 2030 grouped by fuel for Baseline scenario.
Electricity marketprices
The following figure shows the development in the annual electricity pricesfrom 2010 to 2030 for each country as computed by the model. The notabledecline in prices between 2010 and 2015 must be viewed in light of the massiveinvestments in new wind and coal based generation capacity. These new powerplants have relatively low marginal generation costs and hence push electricitymarket prices down.
Megatons
ENERGY PERSPECTIVES FOR THE BSR SUSTAINABLE ENERGY SCENARIOS
65
Between 2020 and 2030 electricity market prices increase as the CO2-target becomes an increasing constraint causing the CO2-price to increasesignificantly.Poland has the lowest annual electricity market prices in 2010 according to thesimulation, but this picture changes during the course of time and by 2030 pricesin Poland and Germany are 10-15 € per MWh higher than in the other countries.This reflects the large share of coal power generation in these countries – atechnology which has relatively high short run marginal costs when CO2-pricesare high.It should be mentioned however, that the electricity market prices do not includethe subsidies needed for supporting renewable energy in order to comply withthe national RE targets.To the consumer electricity prices should be added the costs of RE subsidies(assuming that the expansion with renewable energy is financed by the electricityconsumers). In a situation with a market based RE certificate system the addedcost to the consumer electricity price is the product of the price of a RE certificateand the share of RE. For example, in the case of Denmark in 2020, to the marketprice should be added: 48 % (RE share) * 16 €/MWh (RE price) = 7.7 €/MWh.If only new renewable technologies are supported the RE share (and the costs toconsumers) will be smaller. Other types of support schemes, for example feed-in-tariffs, where the support for renewables is tailored to the requirements ofthe individual technologies (or even to the individual power plants) may alsolead to lower costs to the consumer if the support is customised well.Electricity market prices90DENMARK80E TONIASFINLAND
Euro 08 per MWh
hWMrep6080oruE50
70GERMANYLATVIALITHUANIANORWAY40POLAND30201020152020Baseline scenario20252030S DEWE NRUS IAS
Figure 31: Annual electricity market price (EUR08/MWh) for Baseline scenario. The marginal power prices do notinclude the subsidies needed for supporting renewable energy targets
66Exchange of electricityGWh
ENERGY PERSPECTIVES FOR THE BSR SUSTAINABLE ENERGY SCENARIOS
The following table displays the total import and export from each country:E TONIASFINLANDGERMANYLATVIALITHUANIANORWAYPOLANDRUS IASS DEWE N
DENMARK
2010ExportImportNet export21.2745.59215.6821.0845.324-4.24094722.099-21.1524.84019.266-14.4251.5864.521-2.9344.4906.215-1.72424.23917.8876.35215.937-15.93715.66423.308-7.64431.91817.76814.150
2020ExportImportNet export15.79714.3241.4732.4878.328-5.8412.54826.120-23.5728.91915.551-6.6334.3482.7571.59111.0944.7526.34225.36916.2729.0962.94911.795-8.84513.93612.8971.04039.03113.67925.352
2030ExportImportNet export25.0018.14216.8591.1697.726-6.5561.49031.803-30.3131.82824.527-22.6994.3163.96235310.2836.4923.79136.79811.50825.2903.38311.779-8.39717.33818.591-1.25341.03618.10822.927
Table 23: Exchange of electricity between the countries in the region.
Sweden and Norway are net exporters of electricity in the beginning of theperiod and remain so until 2030, whereas Estonia, Finland and Germany arenet-importers during the course of the period.Poland starts out as net exporter but eventually become importer. Latvia,Lithuania and Russia follow more mixed patterns.In the end of the period a significant export of electricity, approx. 64 TWh takesplace from Scandinavia (Denmark, Norway and Sweden) toward the thermalbased systems in Germany, Poland, where coal is still dominant, and to Finland.This reflects the relative high costs of coal based electricity in a situation witha high price of CO2– as well as the easier access to competitive RE sources inScandinavia.
5.2 Regional RE targetIn this sensitivity scenario the RE targets from every country are aggregatedinto one common target for the region. The total target for RE to be produced isthe same as in the Baseline scenario.This change in approach has rather significant implications for the investmentmade in new electricity generation capacity between 2010 and 2020, as indicatedin Figure 32 and Figure 33 below.The model still chooses to invest mainly in wind and coal power, but a largeshare of the investments in wind power are moved from Germany, Swedenand Finland to Denmark and particularly Norway, where wind conditions areanticipated to be somewhat better. Investments are moved to North West Russiaas well because in the regional RE scenario Russia gets the same incentives todevelop renewables as the other countries in the Baltic Sea Region.Lower RE generationThe total generation of renewable energy in the region is 8 TWh lower in theregional RE scenario compared to the Baseline scenario. This may appearsurprising since the RE target is the same in the two scenarios. The reason is that
ENERGY PERSPECTIVES FOR THE BSR SUSTAINABLE ENERGY SCENARIOS
67
Norway over-complies in the Baseline scenario, due to the expected developmentof new hydro power plants. In the scenario with Regional RE target Norway’sover-compliance contributes to achieving the Regional RE target.Investments in new biomass fired capacity are reduced very considerably in theRegional Target Scenario compared to the Baseline scenario. This is because 1)Total RE generation decreases 2) Wind power becomes more attractive, becausethe RE target removes the geographical constraints related to the deploymentof RE.Figure 34 shows the electricity generation from all power plants in 2020 groupedby fuel.In the situation with a common RE target the cost of increasing renewable energybecomes the same in all countries in the region, 19 € per MWh of renewableenergy electricity in 2020.60.000
New generation capacity by fuel
New - BiogasNew - WindNew - BiomassNew - Natural gasNew - Coal and lignite
50.000
40.000
MW
WM
30.000
20.000
10.000
-
DENMARK ESTONIA
FINLAND
GERMANY
LATVIA
LITHUANIA NORWAY76
POLAND231
RUS IAS
SWEDEN
Baseline scenarioNew - BiogasNew - WindNew - BiomassNew - Natural gasNew - Coal and lignite1.38534278219531271124.8184.8136120.1583.331299173628367695.9245311.7671.767261.4374.4005.198
Figure 32: Cumulated invested capacity from 2010 to 2020 grouped by fuel for the Baseline scenario
New generation capacity by fuel60.00050.00040.000WM30.00020.00010.000-New - BiogasNew - WindNew - Bio massNew - Natural gasDENMARKE TONIASFINLANDGERMANYLATVIALITHUANIA2020Regional RETargetNew - BiogasNew - WindNew - Bio massNew - Natural gasNew - Coal and lignite37612.21568920030276229.9001.8507.949167917907374.98610.1119844.6959854.4009.8475.456NORWAYPOLANDRUS IASS DEWE NNew - Coal and lignite
MW
Figure 33: Cumulated invested capacity (MW) from 2010 to 2020 grouped by fuel in the Regional REtarget scenario.
68
ENERGY PERSPECTIVES FOR THE BSR SUSTAINABLE ENERGY SCENARIOSElectricity generation by country700,0600,0500,0
TWh
hWT
400,0300,0200,0100,0-DENMARKE TONIASFINLANDGERMANYLATVIA2020Regional REtargetLITHUANIANORWAYPOLANDRUS IASS DEWE N
BiogasBiomassWindWaterShalePeatNuclearNatural gasWasteOilCoal and lignite0,81,90,09,12,27,7301,95,70,80,10,70,20,328,81,5166,816,010,80,70,10,25,30,512,30,40,40,22,746,61,00,510,45,714,073,028,40,80,43,30,20,30,80,115,6136,8
7,81,913,03,05,125,612,38,921,974,90,031,20,40,30,0112,063,76,24,363,30,00,9
Figure 34: Electricity generation (TWh) grouped by fuel in 2030 for Regional RE target scenario.
Electricity marketprices
The average electricity market prices from 2010 to 2030 can be seen in theFigure 35 below.The marginal cost of reducing CO2is 14 €/ton in the Regional RE target scenarioin 2020 compared to 7 €/ton in the Baseline scenario. The reason for this isthat the RE targets are met with less efforts in the Regional RE target scenario;hence the CO2target is a more binding constraint than in the Baseline scenario.As a result the electricity market prices are also slightly higher in 2020 in somecountries than in the Baseline scenario; this is particularly the case in Germanand Poland where the cost of CO2has a high impact on the short run marginalgeneration costs due to the high shares of coal power in the generation mix.Electricity market price90807060DENMARKE TONIASFINLANDGERMANYLATVIALITHUANIANORWAYPOLAND20RUSSIA10-201020152020Regional REtarget20252030S DEWE N
Euro 08 per MWh
hWM50rep8040oruE30
Figure 35: Average electricity price Euro 08 per MWh for each country from 2010 to 2030 in the regionalRE target scenario.
As explained in the previous section, to the consumer electricity prices shouldbe added the costs of RE subsidies assuming that the expansion with renewable
ENERGY PERSPECTIVES FOR THE BSR SUSTAINABLE ENERGY SCENARIOS
69
energy is financed by the electricity consumers. With a market based REcertificate system the added cost to the consumer electricity price is the productof the price of a RE certificate (19 €/MWh) and the share of RE.EconomicconsequencesThe economic consequences of the regional RE target scenario variation areshown in the table below. All figures are compared to the Baseline scenario. Theeconomics are distributed based on:•Generators.Revenues from electricity and heat sales, minus fuel costs,CO2, O&M and capital costs related to new investments.•Consumers.Expenses for electricity and heat.•TSOs(transmission system operators). Income from bottlenecks oninterconnectors.•Public profit.Expenses for support of RE.The sum of these figures is the total socio-economic benefit.Note, that in the economic calculations it is assumed the public (the state)supports the development of renewable energy. In many countries thiscommitment lies with the electricity consumers.The simulations show that the benefit of this relocation of investments isapprox. 5 billion € in net present value (2009). However, this figure should beinterpreted with caution, because the country specific estimates of renewableenergy potentials and costs are associated with a significant degree of uncertainty,particularly in the long-term.From a socio-economic point of view Germany and Finland are the greatestbeneficiaries from the common RE target. The main benefit here stems fromimproved public profit due to lower subsidies for renewable energy.A 6 % discount rate is used to convert future revenue streams to Net PresentValue.Mill. €, NPVGenerator profits:Consumer surplus:TSO profit:Public profit:Socio economicbenefit:DENMARK ESTONIA FINLAND GERMANY LATVIA LITHUANIA NORWAY POLAND RUSSIA SWEDEN-9062195512.609-15942111.3721.9071.805-1.439871-364-2.766-14.659-320-2982.759-3.062-1.4172.89125747576-33129135091337691-3.934-3.712-134-2323.4451.31015.53113.15085440498222-14.912-431-665-1.729-3.641-2.916-2.844-701Total:25.883-16.3652.048-6.2025.364
Table 24: Socio-economic consequences of the Regional RE target scenario compared to the Baselinescenario; expressed in min. € as Net Present Value (2009).
70
ENERGY PERSPECTIVES FOR THE BSR SUSTAINABLE ENERGY SCENARIOS
Table 25displays the shadow prices for the CO2targets and the RE targets in 2020and 2030.Shadow prices for CO2target and RE target2020CountryCO2REEUR/tonEUR/MWhelDenmarkEstoniaFinlandGermanyLatvia1419LithuaniaNorwayPolandSwedenRussia
2030CO2EUR/ton
REEUR/MWhel
53
0
Table 25: Shadow prices for CO2target and RE target for Regional RE target scenario.
5.3 Improved efficiency scenarioThis scenario assumes a lower level of demand for electricity compared to theBaseline scenario. This development is assumed to take place as a result of activepolicies for reducing the demand for electricity, particularly electricity used fordirect heating. However, it can also be interpreted as the result of lower thananticipated economic growth resulting in a reduced demand for electricity.Figure 36 shows the investments in new generation capacity grouped by fuel,as well as the development in existing capacity. Wind and coal power are stillthe preferred choices by the model, but the level of investments is significantlylower than in the Baseline scenario.Investmentsby fuel400.000New - Coal CCS350.000300.000250.000New - BiogasNew - WindNew - Bio massNew - Natural gasNew - Coal and ligniteExisting capacity100.00050.000-201020152020Improved efficiency20252030
MW
200.000150.000
Figure 36: Development in existing capacity and investments in new generation capacity in theImproved efficiency scenario.
The development in electricity generation is shown for the period 2010-2030 inFigure 37, and in detail for each country for 2030 in Figure 38.
ENERGY PERSPECTIVES FOR THE BSR SUSTAINABLE ENERGY SCENARIOS
71
The development in total generation in the region remains more or lessconstant during the course of time, because of the demand side measures thatare anticipated.Electricity generation1.4001.2001.000800600400200-201020152020Improved efficiency20252030Coal CCSBiogasWindWaterOilshaleBiomassNuclearNatural gasWasteOilCoal andlignite
Figure 37: Electricity generation (TWh) grouped by fuel (2010-2030) in the Improved efficiencyscenario.
Investments in coal fired power plants with CCS are no longer economicallyattractive because the cost of only reaches 38 €/ton by the end of period.Investments in new biogas and biomass capacity are also reduced verysignificantly compared to the baseline, leaving wind power as the only newrenewable energy technology with a considerable role in 2030. Nevertheless, nonew investments are made in wind power in either Sweden or Denmark until2030.Electricity generation by country600,0
TWh
TWh-
500,0
400,0
300,0
200,0
100,0
DENMARK
E TONIAS
FINLAND
GERMANY
LATVIA2030
LITHUANIA
NORWAY
POLAND
RUS IAS
S DEWE N
Improved efficiencyCoal CCSBiogasBiomassWindWaterShalePeatNuclearNatural gasWasteOilCoal and lignite0,61,90,09,92,16,0238,94,90,30,10,20,30,128,80,976,214,010,80,30,10,24,774,00,412,30,40,30,236,10,40,30,059,610,331,23,60,90,063,31,914,90,90,50,50,511,010,816,01,98,7112,429,80,31,01,63,20,80,10,80,80,19,6146,89,11,513,03,55,01,512,38,27,774,9
Figure 38: Electricity generation (TWh) grouped by fuel in 2030 for the Improved efficiency scenario.
72
ENERGY PERSPECTIVES FOR THE BSR SUSTAINABLE ENERGY SCENARIOS
Cumulated invested capacity30.000
25.000
20.000
MW
15.000
10.000
5.000
-
DENMARK
E TONIAS
FINLAND
GERMANY
LATVIA
LITHUANIA2030
NORWAY
POLAND
RUS IAS
S DEWE N
Improved efficiencyCoal and ligniteNatural gasPeatStrawWindWoodCoal CCSBiogas1412664235421001.1721.051353678041053.3161.05619.207515116103309215402.6914.40057673527.2238377374.41510.10691.819
Figure 39: Cumulated invested capacity (MW) from 2010 to 2030 grouped by fuel for Improved efficiencyscenario.
The economic benefits of the Improved efficiency variation scenario comparedto the Baseline are very considerable, as shown in Table 25. The Net PresentValue of the scenario compared to the Baseline scenario is more than €100billion higher. This amount should be compared to the cost of implementingthe needed energy savings during the same course of time. It has been possibleto make an assessment of these costs within the scope of the present study.Mill. €, NPVGenerator profits:Consumer surplus:TSO profit:Public profit:Socio economicbenefit:DENMARK ESTONIA FINLAND GERMANY-7.1478.459-176001.895-7632.647-6051.829-10.10822.472-68-92211.375-80.169137.467-434-3.40153.463LATVIA-9462.762-45-3881.383LITHUANIA NORWAY POLAND-2.0143.325-55-339917-24.04030.524-40-56.440-20.91234.418-53-88912.564RUSSIA-17.92027.742-113-3369.373SWEDEN34.595-391.0307.446Total:304.411-923-4.644106.683
-28.140 -192.160
Table 26: Socio-economic consequences of the Improved efficiency scenario vs. the Baseline scenario,expressed in min. € as Net Present Value (2009).
The average electricity market prices from 2010 to 2030, as computed by themodel, can be seen in Figure 40.Electricity market prices are around 10 € per MWh lower in the efficiency scenariothan in the Baseline scenario, because the marginal generation technologieshave lower short run marginal cost.
ENERGY PERSPECTIVES FOR THE BSR SUSTAINABLE ENERGY SCENARIOS
73Electricity market price
90807060
DENMARKESTONIAFINLANDGERMANYLATVIALITHUANIA
Euro 08 per MWh
5040302010-201020152020Improved efficiency20252030
NORWAYPOLANDRUS IASSWEDEN
Figure 40: Average electricity market prices (Euro08 per MWh) for each country from 2010 to 2030 in theImproved efficiency scenario.
Mt
600
S DEWE NRUS IAS
500
POLANDNORWAYLITHUANIA
400
LATVIAGERMANYFINLAND
300
E TONIASDENMARKRegional target
200
100
-20102015202020252030
Figure 41: Total CO2-emission (Megatons) by country in the Improved efficiency scenario.
The lower demand for electricity, in combination with the targets for increasingthe share of renewable energy, results in an overachievement of the CO2targetsin the period 2015 - 2025. Only by 2030 the target on CO2becomes binding.At that time the marginal cost of reducing CO2emissions is 38 € per ton in thescenario compared to 52 € per ton in the Baseline scenario.This reflects that cheaper abatement measures are put into play at the supplyside in this scenario. By combining demand and supply side measures it will bepossible to achieve stronger CO2targets.Denmark, Estonia and Norway over-comply with respect to the RE target,and hence there are no costs of RE. For the remaining countries the costs ofcompliance are between 20 and 40 €/MWh. As in the Baseline scenario, notarget applies to Russia.
74
ENERGY PERSPECTIVES FOR THE BSR SUSTAINABLE ENERGY SCENARIOSShadow prices for CO2target and RE target2020CountryDenmarkEstoniaFinlandGermanyLatviaLithuaniaNorwayPolandSwedenRussia0CO2EUR/tonREEUR/MWhel--38363839-2521-382030CO2EUR/tonREEUR/MWhel----12-----
Table 27: Shadow prices for CO2target and RE target in the Improved efficiency scenario.
5.4 30%@COP15The 30%@COP15 scenario explores a situation where CO2-emissions from thepower and district heating sectors are reduced by an additional 10 percentagepoints in 2020, in other words the target for reducing CO2-emissions in 2020 is31 % instead of 21 %. This reflects a situation where an ambitious internationalagreement is obtained at the Copenhagen Climate Summit in December 2009committing the EU Member States to cut their overall CO2-emissions by 30 %in 2020.The target for 2030 remains at 50 % reduction compared to 1990 (38 % comparedto 2005).The two tables below show accumulated investments in the 30%@COP15scenario and in the baseline.30%@COP15MW20202030Coal and lignite45.99251.473Naturalgas4.0584.694Biomass2.7806.623Wind38.10268.364Biogas3.2584.512Coal CCS3311.196
Table 28: Accumulated Investments in new electricity generation capacity (MW) in 30%@COP15scenarioBaselineMW20202030Coal and lignite48.26054.195Naturalgas310541Biomass3.6535.506Wind36.67368.710Biogas3064.45513.651Coal CCS
Table 29: Accumulated Investments in new electricity generation capacity (MW) in the Baselinescenario
The stricter CO2target in 2020 leads to fewer investments in new coal firedpower plants in 2020, but more investments in natural gas fired capacity, windpower and biogas based capacity. The investments in biogas capacity are tosome extent made at the expense of a smaller amount of investments in biomassfired capacity.
ENERGY PERSPECTIVES FOR THE BSR SUSTAINABLE ENERGY SCENARIOS
75
Biogas is more attractive in the 30%@COP15 scenario, because the negativeCO2-emission factor of biogas becomes a greater benefit with the stronger CO2-target. This should be viewed in the light of the CO2-price, which is 30 €/tonin the 30%@COP15 scenario in 2020 compared to only 7 €/ton in the Baselinescenario.The cumulated investments by 2030 also differ between the two scenarios eventhough the 2030-target is the same. The main difference is that higher level ofinvestments in natural gas up to 2020 in the 30%@COP15 scenario leads tofewer investments in new coal power and coal power with CCS in the subsequentdecade.Figure 42 illustrates the cumulated investments in the region from 2015 to2030.Figure 43 displays the electricity generation by fuel for each country in theregion.Capacity by fuel160.000140.000120.000100.000
New - Coal CCSNew - BiogasNew - WindNew - Bio massNew - Natural gasNew - Coal and lignite
MW
80.00060.00040.00020.000-2015202030COP15 scenario20252030
Figure 42: Cumulated invested capacity from 2010 to 2030 grouped by fuel for 30%@COP15 scenario.
76
ENERGY PERSPECTIVES FOR THE BSR SUSTAINABLE ENERGY SCENARIOS
Electricity generation by country700,0
600,0
500,0
400,0
TWh
hWT
300,0
200,0
100,0
-
DENMARK
E TONIAS
FINLAND
GERMANY
LATVIA2020
LITHUANIA
NORWAY
POLAND
RUS IAS
S DEWE N
30COP15 scenarioCoal CCSBiogasBiomassWindWaterShalePeatNuclearNatural gasWasteOilCoal and lignite4,31,90,016,62,42,4239,64,81,40,10,40,028,81,9166,817,310,90,90,10,25,495,112,30,71,50,212,50,30,077,28,231,210,00,063,31,40,92,515,20,20,50,70,514,612,414,015,413,9113,128,40,51,70,53,30,80,20,30,815,6136,89,11,913,03,05,11,712,39,120,874,9
Figure 43: Electricity generation (TWh) grouped by fuel in 2020 for the 30%@COP15 scenario.
As intended, the CO2-emissions in the scenario follow a lower trajectory than inthe Baseline. Figure 44 shows how CO2-emissions are distributed on countriesbetween 2010 and 2030.Mt600
500
S DEWE N400RUS IASPOLANDNORWAYLITHUANIA300LATVIAGERMANYFINLAND200E TONIASDENMARKBaseline target30%@COP15 target100
-20102015202020252030
Figure 44: Development in CO2-emissions (Mt) by country in the scenario 30%@COP15. The scenariospecific CO2targets are shown by the orange line and the CO2target in the baseline by the black line
ENERGY PERSPECTIVES FOR THE BSR SUSTAINABLE ENERGY SCENARIOS
77
The average annual electricity market prices in the 30%@COP15 scenario aresignificantly higher between 2010 and 2020 compared to the baseline. Thismust be viewed in the light of the higher marginal CO2-price. In 2025 and 2030electricity market prices are at the same level as in the Baseline scenario.The additional costs to electricity consumers for subsidising renewables will belower in the 30%@COP15 scenario between 2010 and 2020, because the higherCO2-price provides a great economic incentive for renewables.Electricity market price120DENMARKESTONIA100FINLANDGERMANYLATVIA80LITHUANIANORWAYPOLANDRUS IASSWEDEN
Euro 08 per MWh
hWMre60p80oruE40
20
-20102015202030COP15 scenario20252030
Figure 45: Average electricity price (Euro 08 per MWh) for each country from 2010 to 2030 for 30%@COP15 scenario.
The total economic consequences for the region of following the lower CO2-emission path are estimated to be approx. €16 billion, measured as net presentvalue (2009).Table 30 shows how the economic consequences are distributed on countriesand stakeholders. The pattern is the same in almost all countries: generatorshave their profits increased as the higher CO2-prices lead to higher electricitymarket prices; the costs of consumers are increased considerably as a resultsof the higher electricity prices; TSO profits (changes in bottleneck income oncongested transmission lines) increase slightly; and public profits are improved,because the need for special support to renewables are reduced.Looking across the different stakeholder groups, the scenario results in a netbenefit for Denmark, Lithuania, Norway and Sweden, whereas the result is a netcost for the remaining countries in the region.
78
ENERGY PERSPECTIVES FOR THE BSR SUSTAINABLE ENERGY SCENARIOSTable 30: Socio-economic consequences of the 30%@COP15 scenario compared to the Baselinescenario
Mill. €, NPVGenerator profits:Consumer surplus:TSO profit:Public profit:Socio economicbenefit:
DENMARK ESTONIA FINLAND GERMANY4.8912566.18070.231-4.90285535610-1.40716-54-1.189-13.4101242.517-4.589-87.0802219.072-7.557
LATVIA588-1.4475468-385
LITHUANIA NORWAY POLAND1.88917.67514.587-1.716-13272431-16.43713831.379-21.25335-302-6.933
RUSSIA Sweden Total:15.688 14.469 146.454-15.856463-119-19.5021376.8861.989-183.01179519.399-16.363
The marginal cost of reducing CO2is significantly higher than in the Baselinein 2020. In 2030 it is slightly lower. The costs of new renewable energy issignificantly lower than in the Baseline by 2020; in Denmark, Estonia, Norwayand Poland there is no additional costs associated with new renewables becauseof the relatively high CO2-price.Table 31: Shadow prices for CO2target and RE target for the 30%@COP15 scenario.
Shadow prices for CO2target and RE target2020CO2RECountryEUR/tonEUR/MWhelDenmarkEstoniaFinlandGermanyLatviaLithuaniaNorwayPolandSwedenRussia0013131520020
2030CO2EUR/ton
REEUR/MWhel0000930000
30
51
5.5 Analysis: CO2and RE targetsMarginal costs to reachthe targetsThe scenarios are set up to meet both the CO2-targets and the RE targets forthe region. But what are the marginal costs of these targets, and which of thetargets are the most binding in 2020 and 2030? These questions have beenillustrated by letting the model calculate the cost of tightening the CO2-targetby one additional ton of CO2as well as the cost of additionally increasing REgeneration by one MWh (the shadow prices). Respectively, these values can beinterpreted as estimations of the CO2-price in the emissions trading scheme andthe marginal level of support needed for renewable energy.It is assumed that CO2can be traded across all countries including NW Russia;consequently there is one common price of CO2for the whole region. Renewableenergy targets, on the other hand, are national targets in the Baseline scenario,and therefore the prices are different for each country in the region.Table 32 gives an overview the shadow prices for CO2-targets for 2020 and 2030for the different scenarios.
ENERGY PERSPECTIVES FOR THE BSR SUSTAINABLE ENERGY SCENARIOSTable 32: Shadow prices for CO2targets in EUR/tonScenarioBaselineRegional RE TargetImproved Efficiency30% CO2@COP152020714030203052533851
79
CO2-targets in 2020
The table indicates that the CO2-targets for the region in 2020 can be met atcosts between zero and 30 € per tonnes depending on the reduction ambitionsand the efforts to implement energy savings and to cooperate on the integrationand implementation of renewable energy. In the Improved Efficiency scenariothe CO2-target can be met without additional costs. The reason for this is thatthe national renewable energy requirements become binding, but not thetargets for CO2. The findings show that the targets on renewable energy andon reducing CO2are to a very high complimentary. The target on renewableenergy contributes to keeping the price of CO2down and the similar the targetsto reduce CO2lower the direct cost of complying with the RE targets.It should be stressed that the present analyses do not consider the possibilitiesfor trading CO2quotas between the electricity companies in the region andcompanies in other sectors and/or countries. In practice, the Baltic Sea Regionis part of the EU ETS and the cost of CO2quotas will be determined by themarginal reduction costs among all companies included in the EU market aswell as by the price of credits from CDM projects. However, the means anddynamics in the EU market can be expected to resemble those modelled for theBaltic Sea Region in the present study.Between 2020 and 2030 the target for RE is kept constant, whereas the CO2-target is tightened from 21% to 38 % reduction compared to 2005. Therefore,in 2030 the CO2-target becomes binding in all scenario variations and the CO2reductions costs are significantly higher. The RE target on the other hand is onlybinding in Latvia and Lithuania in the Baseline scenario.The simulations show that the shadow price of CO2is just above 50 € per tonfor all scenarios in 2030 except for the Improved Efficiency scenario that has ashadow price of 38 € per ton.
Trading outside theregion
RE-prices
The shadow prices for the RE-targets are shown in Table 2 and 3.Table 33: Shadow prices for RE targets in 2020 in the different scenarios (EUR/MWhel).CountryBaselinescenario161629303131-2416-Regional RETarget sce-nario19Improved Efficiencyscenario--38363839-2521-30%@COP15scenario--32264913--2
DenmarkEstoniaFinlandGermanyLatviaLithuaniaNorwayPolandSwedenNW Russia
80
ENERGY PERSPECTIVES FOR THE BSR SUSTAINABLE ENERGY SCENARIOSTable 34: Shadow prices for RE targets in 2030 in the different scenarios (EUR/MWhel).CountryBaselinescenario----112----Regional RETarget sce-nario-Improved Efficiencyscenario----12-----30%@COP15scenario----93---
DenmarkEstoniaFinlandGermanyLatviaLithuaniaNorwayPolandSwedenNW Russia
In the Baseline scenario the RE prices differ quite substantially between thecountries. In Russia there is no price of RE because no national RE target isassumed. In Norway the price of RE is zero, because the expected developmentof new hydro power easily leads to compliance with the national RE target. In2020 Finland, Germany, Latvia, Lithuania and Poland and have the highestmarginal costs of expanding renewable energy electricity generation.In the Regional RE Target scenario the price of RE is common for the region. In2020 it is 19 € per MWh of renewable electricity.The total generation of renewable energy in the Baltic Sea Region is 8 TWh lowerin the regional RE scenario compared to the Baseline scenario. This may appearsurprising since the RE target is the same in the two scenarios. The reason forthis is that due to the expected development of new hydro power plants, Norwayover-complies in the Baseline scenario. In the scenario with Regional RE targetNorway’s over-compliance contributes to achieve the Regional RE target.In the Improved Efficiency scenario Denmark, Estonia and Norway over-complywith respect to the RE target in 2020, and hence the marginal cost of increasingthe RE target is zero. For the remaining countries the costs of compliance is upto 10 €/MWh higher than in the baseline scenario. This may appear surprisingsince the requirement for renewables – measured in absolute energy - is lowerin the efficiency scenario compared to the Baseline scenario, because the REtargets are measured as a percentage of final energy consumption. The reasonis that in 2020 electricity market prices are around 10 € per MWh lower inthe efficiency scenario than in the Baseline scenario, because the marginalgeneration technologies have lower short run marginal cost. Therefore, the needto subsidise new renewable energy increases similarly.
ENERGY PERSPECTIVES FOR THE BSR SUSTAINABLE ENERGY SCENARIOS
81
6 Case analysis of Kriegers FlakIn addition to the overall scenarios a case analysis has been made to illustratethe costs and benefits of concerted planning for wind power plants in the shallowwaters of Kriegers Flak in the Baltic Sea. Germany, Sweden and Denmark areall planning to build off-shore wind farms at Kriegers Flak (400, 600 and 600MW respectively).The case explores the consequences of a developing a common integrated off-shore grid, which could also serve as a link between the Nordic and Germanelectricity markets.The area and a possible common international connection are sketched in thefigure below.
Figure 46: Location and sketched connection of Kriegers Flak. The thinner dashed lines indicate theexisting connections between Denmark and Germany (Kontek) and Sweden and Germany (BalticCable). Source: Energinet.dk
An integrated off-shore wind grid could serve a twofold purpose by connectingthe wind farms to the transmission grid at shore, as well as by linking theelectricity markets in the region. Kriegers Flak could serve as a pilot project foran integrated offshore grid.
The figure below shows a duration curve of the transmission between the off-shore wind farms in Kriegers Flak and their respective countries in the Baselinescenario22without a common international connection (dotted lines) and a22 A few minor changes have been made to the Baseline scenario since the Kriegers Flak analysiswas carried out. However, these changes are not expected to have noteworthy influence on theresults.
82
ENERGY PERSPECTIVES FOR THE BSR SUSTAINABLE ENERGY SCENARIOS
situation with common interconnection (full lines). In the first situation thecables are only used to transmit power from the wind farms to land. In thesecond case, the off-shore grid is also used as a mean to transport electricity toand from the three countries. This leads to a significant higher utilisation of thecables.Duration curve for transmission at Krieger'sFlak600
500
KriegersFlak S : Krieger -ce.Denmark
400
KriegersFlak S : Krieger- Sce.weden
300
200
KriegersFlak S : Krieger -ce.Germany
MW
W100M
Baseline: Krieger - Germany---1001.0002.0003.0004.0005.0006.0007.0008.0009.000
Baseline: Krieger - Denmark
-200
-300
Baseline: Krieger - Sweden
-400
Timestep
Figure 47: Duration curves showing the utilisation of the connections to Kriegers Flak in the BaselineScenario with individual on-shore connection and in the situation with a common interconnection atKriegers Flak.
The common interconnection at Kriegers Flak compared to a situation with nocommon interconnection shows a benefit a Net Present Value of €17 millionfor the region. This figure does not include the possible higher capital costassociated with the common solution.The above calculation assumes only 400 MW of transmission between Germanyand Kriegers Flak. This is sufficient to connect the 400 MW of expected windpower capacity at the German part of Kriegers Flak; however in connection withan integrated offshore grid it may appear more economic to establish a strongerconnection to Germany, particularly considering that the connections fromKriegers Flak to Denmark and Sweden are 600 MW each.It will be relevant to carry out further analyses explore the costs and benefits ofdifferent concepts for a common interconnection at Kriegers Flak.Mill. €, NPVGenerator profits:Consumer surplus:TSO profit:Public profit:Socio economicbenefit:DENMARK ESTONIA FINLAND GERMANY-331556-2613-0-2-3-0-640-298-145-65-92-1268110LATVIA0-8-01-7LITHUANIA NORWAY POLAND RUSSIA SWEDEN7-1221-2-5959-100-1074-9210-16-2422-701-5-52111547-172-10Total:-12-1171093717
Table 35: Socio-economic consequences of a common interconnection at Kriegers Flak compared toindividual interconnections. Min. €, Net Present Value.
ENERGY PERSPECTIVES FOR THE BSR SUSTAINABLE ENERGY SCENARIOS
83
7 Screening of new interconnectorsA screening has been made of the most attractive new interconnectors in theelectricity system in the Baltic Sea area.The model considers the most important bottlenecks in the electricity systemsand is able to assess the utility to the electricity market (including the differentstakeholders in the market) of expanding transmission capacity between thedifferent electrical areas in models.Socio-economicbenefit of adding oneMW of transmissioncapacityThe table below shows the total socio-economic benefit of adding one MW oftransmission capacity between the different transmission areas in the modelin the Baseline scenario for 202023. With regards to Russia only two areas havebeen included: Ru_STP (St. Petersburg area) and Ru_Kal (Kaliningrad Area).The table includes all possible direct connections, including connections that donot make sense in the real world (e.g. between Norway and Kaliningrad).It should be stressed, that an expansion of the existing transmission capacitiesin the region has been included in the Baseline scenario (see Chapter 4.2). Theexpansions, which are examined here, are therefore in addition to this assumedbaseline development.Linking thermal andhydro system is mostattractiveConnections linking the thermal power based systems in Germany and Polandand the Nordic power system dominated by hydro power have the highest value,as well as internal connections in Germany. Linking the Baltic countries / Russiawith Scandinavia also appears attractive.The table only serves as a screening of the benefits of the interconnections.A satisfactory evaluation of the different interconnection requires moresimulations, taking into consideration for example the impact of situationswith high/low hydro inflow as well as simulations with higher time resolution.Moreover, the capacities should be evaluated according to their full possiblecapacity, for example 600 MW or 1000 MW, and not the marginal change (1MW).Furthermore, the tables only show the value for the electricity market. Tothat, additional benefits can be derived from improved security of supply,improved competition and saved costs of auxiliary services. These benefits canbe significant.The benefits indicated in the table should be compared to the capital costs ofthe connections. These costs are site specific and have not been quantified aspart of the present study. However, for comparison it could be mentioned thatthe capital cost of the 600 MW Great Belt connection linking Denmark East and23 A few minor changes have been made to the Baseline scenario since the transmission screeningwas carried out. However, these changes are not expected to have noteworthy influence on theresults.
84
ENERGY PERSPECTIVES FOR THE BSR SUSTAINABLE ENERGY SCENARIOS
Denmark West has been projected to be approx. 20,000 €/MW per year. Forthe 600 MW Skagerrak IV between Denmark and Norway the capital cost havebeen estimated to be approx. 35,000 €/MW and for NordBalt linking Lithuaniaand Sweden the costs are anticipated to be between 60,000 €/MW and 80.000€/MW depending on the capacity of the interconnector (500/1000 MW). Thesecost estimates assume an economical lifetime of 30 years and a real interest rateof 6 %.DE_CS DE_NE DE_NW DK_EDE_CS-DE_NE 37.422DK_EEE_RFI_RLT_RLV_RNO_NNO_SPL_R-DK_WEE_RFI_RLT_RLV_RNO_MNO_NNO_ONO_SPL_R RU_KAL RU_STP SE_MSE_NSE_S
37.422 65.737 87.810 87.064 73.717 73.882 81.810 80.531 93.407 93.496 90.175 91.085 62.473 80.218 82.226 90.332 92.913 90.12628.330 69.981 69.307 73.861 73.834 78.736 80.653 75.620 75.660 77.248 78.052 73.901 78.930 82.187 72.587 75.086 72.303-94.216 93.605 98.272 98.246 101.504 102.877 98.984 98.986 102.059 102.799 100.658 101.718 102.408 95.970 98.453 95.705-1.1731.173-21.432 21.243 37.526 43.15021.468 21.258 37.527 43.274-414414-5.7336.5245.8296.6739.5378.49610.204 47.680 38.999 46.1119.24046.713 38.993 46.2582.6673.4815.2326.0442.4863.295
DE_NW 65.737 28.330
87.810 69.981 94.216
DK_W 87.064 69.307 93.605
73.717 73.861 98.272 21.432 21.46873.882 73.834 98.246 21.243 21.258
25.588 22.793 23.653 23.776 24.544 25.356 38.141 27.209 26.219 20.563 23.183 20.51725.853 23.052 23.439 23.607 24.324 25.202 38.142 27.439 26.249 20.306 23.046 20.300-6.0046.004-39.059 39.059 39.977 40.725 54.43844.581 44.575 45.749 46.486 60.435-278278-1.8377.8159.5573.58836.274 38.804 36.17941.824 44.331 41.7503.1623.3485716543.3753.466
81.810 78.736 101.504 37.526 37.527 25.588 25.85380.531 80.653 102.877 43.150 43.274 22.793 23.0525.7335.8296.5246.6738.4969.24093.496 75.660 98.986
NO_M 93.407 75.620 98.984
23.653 23.439 39.059 44.58123.776 23.607 39.059 44.575
13.068 12.070 52.931 40.614 46.65513.246 12.300 53.098 40.614 46.630-1.1501.150-
NO_O 90.175 77.248 102.059 9.53791.085 78.052 102.799 10.204
24.544 24.324 39.977 45.749 13.068 13.24625.356 25.202 40.725 46.486 12.070 12.3001.8379.5577.8153.588
44.681 41.401 48.462 10.093 12.711 10.16445.735 42.173 49.155 10.688 11.924 10.882-52.689 63.995 49.813 52.549 49.780-11.389 37.824 40.368 37.724-44.336 46.801 44.316-2.7603462.760-2.8243462.824-
62.473 73.901 100.658 47.680 46.713 38.141 38.142 54.438 60.435 52.931 53.098 44.681 45.735
RU_KAL 80.218 78.930 101.718 38.999 38.993 27.209 27.439RU_STP 82.226 82.187 102.408 46.111 46.258 26.219 26.249SE_MSE_NSE_S90.332 72.587 95.97092.913 75.086 98.45390.126 72.303 95.7052.6675.2322.4863.4816.0443.295
40.614 40.614 41.401 42.173 52.6893.1625713.3753.3486543.466
46.655 46.630 48.462 49.155 63.995 11.389
20.563 20.306 36.274 41.82423.183 23.046 38.804 44.33120.517 20.300 36.179 41.750
10.093 10.688 49.813 37.824 44.33612.711 11.924 52.549 40.368 46.80110.164 10.882 49.780 37.724 44.316
Table 36: Screening of new interconnectors.Baseline scenario, 2020.The table shows the total socio-economic benefit of adding one MW of transmission capacity between the different transmission areasin the model. For Russia only two areas have been included: Ru_STP (St. Petersburg area and Ru_Kal(Kaliningrad Area).DE_CS DE_NE DE_NW DK_EDE_CS-DE_NE 87.112-DK_WEE_RFI_RLT_RLV_RNO_MNO_NNO_ONO_SPL_R RU_KAL RU_STP SE_MSE_NSE_S
87.112 135.118 243.613 261.336 173.874 182.330 156.486 162.861 285.194 285.264 256.046 277.117 90.753 156.162 182.085 261.264 281.008 260.98748.160 171.946 179.430 136.141 135.680 145.695 141.045 213.611 213.620 191.906 212.774 153.559 145.631 135.852 189.811 209.450 189.408-183.106 168.309 162.596 160.426 174.777 169.979 223.233 223.197 202.373 223.075 200.623 174.837 160.774 199.541 219.125 199.144-18.560 80.377 71.301 104.518 91.961 41.682 41.715 20.876 41.560 254.042 104.951 72.585 17.876 37.526 17.492-98.314 89.202 121.783 109.899 55.101 55.127 34.551 54.844 271.765 122.244 90.500 31.693 51.143 31.333-9.3099.309-28.926 12.294 116.207 116.270 92.283 113.227 182.948 29.49438.099 21.547 106.956 107.018 83.550 104.488 192.036 38.617-16.771 142.203 142.265 114.751 135.741 154.022--421421-29.378-5788.8871.45292.277 112.007 91.98783.004 102.755 82.719
DE_NW 135.118 48.160
DK_E 243.613 171.946 183.106
DK_W 261.336 179.430 168.309 18.560FI_RLT_R
EE_R 173.874 136.141 162.596 80.377 98.314182.330 135.680 160.426 71.301 89.202
156.486 145.695 174.777 104.518 121.783 28.926 38.099
37.743 118.272 138.002 117.9824.2144.27025.22224.25724.3135.731
LV_R 162.861 141.045 169.979 91.961 109.899 12.294 21.547 16.771
128.420 128.461 103.822 124.779 170.783 17.301 21.067 104.505 124.219 104.2159.722 295.624 142.725 107.428 23.95921.071 266.475 115.202 84.055--5.72829.458 10.114 295.693 142.787 107.464 24.015
NO_M 285.194 213.611 223.233 41.682 55.101 116.207 106.956 142.203 128.420NO_N 285.264 213.620 223.197 41.715 55.127 116.270 107.018 142.265 128.461
NO_O 256.046 191.906 202.373 20.876 34.551 92.283 83.550 114.751 103.822 29.378 29.458NO_S 277.117 212.774 223.075 41.560 54.844 113.227 104.488 135.741 124.779 9.722PL_RRU_KAL 156.162 145.631 174.837 104.951 122.244 29.494 38.617RU_STP 182.085 135.852 160.774 72.585 90.5008.8871.452578
10.114 21.071
287.546 136.207 104.971 26.098 12.068 26.389153.481 191.754 271.693 291.437 271.416-38.311 118.773 138.524 118.488-83.519 103.233 83.257-49119.751-20.04249120.042-
90.753 153.559 200.623 254.042 271.765 182.948 192.036 154.022 170.783 295.624 295.693 266.475 287.546
17.301 142.725 142.787 115.202 136.207 153.4815.7285.731
37.743 21.067 107.428 107.464 84.055 104.971 191.754 38.3114.270
SE_M 261.264 189.811 199.541 17.876 31.693 92.277 83.004 118.272 104.505 23.959 24.015SE_N 281.008 209.450 219.125 37.526 51.143 112.007 102.755 138.002 124.219 4.214SE_S260.987 189.408 199.144 17.492 31.333 91.987 82.719 117.982 104.215 24.257 24.313
26.098 271.693 118.773 83.51926.389 271.416 118.488 83.257
25.222 12.068 291.437 138.524 103.233 19.751
Table 37: Screening of new interconnectors.Baseline scenario, 2030.The table shows the total socio-economic benefit of adding one MW of transmission capacity between the different transmission areasin the model. For Russia only two areas have been included: Ru_STP (St. Petersburg area and Ru_Kal(Kaliningrad Area).
ENERGY PERSPECTIVES FOR THE BSR SUSTAINABLE ENERGY SCENARIOS
85
Annex 1: The consulta on and presenta on processAn important part of the study is a consultation and presentation process wherethe most relevant stakeholders were involved in formulating relevant topics anddiscussing preliminary results of the analyses.This annex gives a short description of the process from May 2008 to June2009.
Energy conference: Energy and Climate change:Global Challenges, Regional Solu ons, 21 May 2008in Warsaw, PolandThe conference was organised together with demosEUROPA – Centre forEuropean Strategy and the Royal Danish Embassy in Poland. Over 250participants, representing stakeholders from the private and public sector andinternational organisations were participating at the conference. Polish Ministerof the Environment Maciej Nowicki and the EU Commissioner Danuta Hübnerwere among the speakers. The outline of the study and approach of developingtwo main scenarios for the energy system in the Baltic countries were presented.Furthermore, an article on current situation and future opportunities for theenergy sector in the Baltic Sea Region (BSR) was distributed.It was agreed that the BSR has the potential to become a showcase in energyefficiency for the rest of the world. The region should show leadership andintegrity by setting and following examples. The aim is to look at the challengesand opportunities of the Region’s energy market and define the added value ofregional co-operation. The climate and energy challenges need to be addressedjointly in the region and globally. And the BSR is in a unique position right nowto set the agenda and outline solutions as regards to the COP -14 in Poznan andCOP-15 in Copenhagen.
2ndmeeting of the Baltic Sea ParliamentaryConference (BSCP) Working Group on Energy andClimate Change (WG), 22 May 2008 in TallinnAt this meeting the scope and approach of the study were presented.During the presentation, the parliamentarians called for closer Baltic Searegional energy cooperation and supported further development of the scenariosof the Energy Perspectives for the BSR. There was unanimous decision that theregion will benefit from the enhanced energy cooperation and it was agreedthat concrete scenarios have to be presented during the next meeting of theWorking Group. The Working Group encouraged Nordic Council to support thefirst phase of the study financially as a supplement to the funding from BalticDevelopment Forum and Fabrikant Mads Clausens Fond, Danfoss.
86
ENERGY PERSPECTIVES FOR THE BSR SUSTAINABLE ENERGY SCENARIOS
3dmeeting of the Baltic Sea Parliamentary Conference(BSPC) WG on Energy and Climate Change and DinnerDebate on the Baltic Sea Region Scenarios for theTransformation to Renewable Energy Sources, co-hosted20 October 2008 by Nordic Council (NC) and BSPC in theDanish Parliament.At the meeting the Working Group and specially invited guests, including Mr.Ferreira of the European Parliament welcomed preliminary findings from phaseI and expressed a strong support for the further development of scenarios forenhanced energy cooperation in the BSR.The conclusion of the debate was that in order to become the number oneregion in the world in energy efficiency, there is a need to have a commonunderstanding, reliable data and trust, as essential preconditions for the energycooperation in the BSR. Through closer cooperation, the BSR will be able toshow how it is possible to provide greater security of energy supply, better use ofenergy capabilities, greater energy efficiency, more integrated and competitiveenergy markets, lower CO2emissions and more renewable energy.
Meeting of the Joint Platform on Energy andClimate (JPEC), 22 October 2008 in CopenhagenJPEC was created in 2008 and represents 11 organisations in the BSR such asBaltic Development Forum (BDF), Baltic Sea Parliamentary Committee (BSPC),Council of the Baltic Sea States (CBSS), Union of Baltic Cities (UBC), Baltic SeaStates Sub-regional Co-operation (BSSSC), Nordic Council (NC), Nordic Councilof Ministers (NCM), CPMR Baltic Sea Commission Energy Workgroup, BalticMetropoles (BaltMet), Baltic Islands Network B7 and Baltic Assembly (BA)with a view to endorse a joint coordination of activities in the field of energyand climate in the BSR. At the meeting preliminary findings from phase I waspresented and discussed.JPEC supported the ongoing study and the development of different scenarios asa basis for finding ways to improve regional cooperation on Energy and Climateissues in the BSR. According to the views expressed among the members ofJPEC, this region is heterogeneous in terms of energy-mix and energy resources.If the different competences and resources are exploited and combined in aclever way the region has a huge energy potential. The study is an instrumentfor mobilizing different stakeholders to agree on a common agenda. The studycan also serve as a tool for strengthening co-operation and implementation ofspecific projects. It is solid testing ground in providing a common understandingof the challenges, possibilities and added value of the cooperation in the BSR.
ENERGY PERSPECTIVES FOR THE BSR SUSTAINABLE ENERGY SCENARIOS
87
BDF Summit Copenhagen-Malmö, 30 November – 2December 2008During the BDF 2008 Summit the results from phase I of the study wasdiscussed at the workshop:Future scenarios of energy cooperation: combiningintelligent regional solutions.The analyses were presented as two differentscenarios for the development of the energy system in the BSR – a Small-tech scenario and a Big-tech scenario. The Small-tech scenario focuses ondistributed energy generation, energy savings and efficient utilisation of energythrough combined heat and power generation, whereas the Big-tech scenarioexplores the opportunities of more centralised solutions such as nuclear powerand carbon capture and storage (CCS). Wind power is an important part of theenergy production in both scenarios and both scenarios comprise a more energyefficient transport sector.The representatives from the European Commission, Baltic Sea Region EnergyCooperation (BASREC) (represented by the Danish Energy Agency), UBC, BSPC,Vestas, Gasunie, Eestia Energia and Swedbank took part in the discussions.There was an overall agreement that deepening regional cooperation and energyplanning can provide a wide range of benefits from technology development,transfer of best practice and benchmarking. The BSR has a potential in becominga testing ground and frontrunner in innovative solutions and thus to serve as ahelpful benchmark for multi-stakeholders in identifying the added value fromenhanced regional cooperation. The efficiency improvement and savings, theneed to map the potential renewable sources and setting binding targets are veryimportant. The existing, skills, complementarities and resources in the BSR,make this region one of the best regions regarding energy issues and in reachingthe 20/20/20 targets. The Danish Prime Minister, Anders Fogh Rasmussenproposed at the Summit that the vision for regional cooperation should be todevelop a “Green Valley” of Europe.
Meeting of the Baltic Sea Region Energy Cooperation(BASREC) Group of Senior Energy Officials (GSEO), 3December 2009 in Copenhagen.The focus of this meeting was the discussions about two developed scenarios:Small-tech and Big-tech.The GSEO called for a combination of small- and big-tech scenarios thattake into consideration the policies of different countries around the region.By including existing measures the scenarios could contribute to show whatadditional measures may be needed. The GSEO also emphasised the importanceof showing possible benefits of closer regional cooperation within areas such aswind power planning, interconnectors, demonstration of new technologies andenergy markets.
88
ENERGY PERSPECTIVES FOR THE BSR SUSTAINABLE ENERGY SCENARIOS
Baltic Sea Region Energy Cooperation (BASREC)Energy Ministers conference, 17 - 18 February 2009in Copenhagen.During the conference it was agreed that energy cooperation in the BSR shouldbe strengthened in order to contribute to the growth and stability in the region,by promoting a sustainable and competitive energy system. In his speech, theSecretary General of the NCM, Mr. Halldor Asgrimsson, informed the energyministers about the ongoing study on enhanced energy cooperation, which waspositively welcomed among the participants. BDF’s proposal to convene a multistakeholders energy conference in the region was favourably received by thechair.
Breakfast meeting with the EuropeanCommissioner for Energy, Mr. Piebalgs, 18 February2009 in CopenhagenA short memo on the results of phase I of the study and an outline of phase IIwas distributed to the Commissioner before the meeting.Commenting on the study, the Commissioner saw the most interesting regionalperspective in the small tech scenario. Still, Carbon Capture and Storage - thatis part of the Big Tech scenario - might be necessary in order to utilise the fossilfuel reserves without jeopardising the climate. Mr. Piebalgs expressed his hopethat the ongoing work on the study would continue. The positive experienceand the best practice of the BSR could even be transferred to other regions inEurope, the Commissioner mentioned.
The last (5th) meeting of the Baltic SeaParliamentary Conference (BSPC) WG on Energyand Climate Change, 18 May in BerlinAt the meeting the preliminary results from phase II of the study was presentedand discussed.The final report of the WG states that strengthening the capacity to supportand coordinate the Baltic Sea regional energy cooperation, as well as developingof an integrated and optimized regional approach to energy issues is morethan needed. It is important to take into account the various energy mix of therespective countries and the possibilities for developing cross-border powerlinks.The final report refers to the study on Energy Perspectives for the BSR andsupports the achieved progress. On the basis of the comprehensive hearingof experts and parliamentary discussions, the BSPC WG recommends thefollowing initiatives and measures: Develop a Coherent Energy Strategy for theBSR, launch Action Plans for CHP and Housing Innovation, use the EconomicCrisis as an Opportunity, and establish a Regional Educational Approach.
ENERGY PERSPECTIVES FOR THE BSR SUSTAINABLE ENERGY SCENARIOS
89
Energy and Climate seminar:Creating a “Green
Valley” on top of Europe - Different Scenarios
with participation of regional ministers, 4 June2009, ElsinoreThe Energy and Climate seminar was organized in connection with the CBSSMinisterial meeting that attracted different stakeholders from the privatesector, including energy companies, such as Vestas, Gasunie, E.ON, DongEnergy, consultancy companies: Nidab, Grontmij Carl/Bro and internationalorganisations: NCM, Nordic Energy Research, UBC Energy Commission,BASREC, Nordic Investment Bank.The preliminary results from phase II of the study was presented anddiscussed.Ministers for Foreign Affairs of Denmark, Norway, Finland and Ukraine activelyparticipated in the discussions and gave a strong support for the ongoingstudy.The overall conclusion and recommendation of the energy study were that the BSRcould benefit both economically and environmentally from closer co-operationin energy planning. Development of a common interconnector strategy for theregion would be important to harvest the potential benefits. Similarly, an actionplan for efficient and sustainable heating would be important since there weremany benefits within these areas. Regional projects in R&D and demonstrationprojects could also benefit the region as a global showcase. Finally there is aneed to establish a common regional training programme in order to promotelearn to benefits from better regional energy planning.A shared regional energy agenda is not easily set and the benefits are not easilyexploited. Most stakeholders in the region share, however, the same objectivesregarding reduction of Green House Gasses, increase of renewable energies andenergy efficiency, as well as the promotion of clean tech solutions. There is a needto develop a shared vision of a Green Valley of Europe and the establishment ofan energy stakeholders’ forum that includes different cross-border, cross-sectorand cross-level actors could be a useful way to proceed.
Energy workshop:Energizing Sustainable Growth,
10-11 June 2009 in Kaliningrad, Russian FederationThe workshop was organised together with BASREC, NCM Information Officein Kaliningrad and the Government of the Kaliningrad Region of the RussianFederation. Energy Commission of the UBC, as well as Gasunie, took activepart in the workshop. Following authorities and companies were representingRussian Federation at the workshop: Ministry of Infrastructure Developmentof the Kaliningrad Region, Kaliningrad Regional Centre for Energy Efficiency,Administration of the city district of Kaliningrad, State Technical University,INTER RAO (leading exporter and importer of electric power in Russia) andEnergy Forecasting Agency in St. Petersburg.The preliminary results from phase I and phase II of the study were presented.The workshop welcomed the study as a very useful instrument for a dialogue on
90
ENERGY PERSPECTIVES FOR THE BSR SUSTAINABLE ENERGY SCENARIOS
future possibilities for enhanced energy system in the BSR. The UBC representativepointed out the importance of common framework for the dialogue between thecities and found the Small-tech scenario very interesting in that context. Closerco-operation in energy planning and in energy grid development was needed.The framework of the EU’s BEMIP provided very useful reference for specificprojects that included Russia and Kaliningrad Region. Furthermore it cameout clearly that there was a need for more information and data on the powergenerating facilities on the Russian side and energy consumption in Russianregions. This could be a topic in the third phase of the study. It also transpiredthat there was a need for a common methodology on energy data, including dataon CO2emissions. During the workshop it was proposed to improve expert talksin order to exchange the views in collecting energy data from the North Regionof the Russian Federation and common training sessions in energy planningwere suggested.
Meeting of the Baltic Sea Region EnergyCooperation (BASREC) GSEO, 29 June 2009 inCopenhagen.At the meeting, the results from phase II were presented and a draft report fromphase II was distributed for hearing. As a follow up of the meeting and as aninput to the future BASREC working plan the following recommendations forphase III of the study have been disseminated to the members of the GSEO:1. Scenario analyses2. Baltic Ring of wind3. Case analyses: Nuclear in the Baltic Sea Region, offshore wind etc.4. Statistical data for the region5. Show case Kaliningrad6. District heating and CHP strategy7. Financing8. Education of new energy planners for region9. Green jobs for the Baltic Sea Region
Baltic Development ForumThe leading high-level network fordecision-makers from business,politics, academia and mediain the Baltic Sea Region.
Nygade 3, 5thfloorP.O. Box 58DK-1002 Copenhagen KDenmarkTelephone +45 70 20 93 94Fax +45 70 20 93 95[email protected]www.bdforum.org