Miljø- og Planlægningsudvalget 2009-10
MPU Alm.del Bilag 148
Offentligt
Greenhouse Gas Emissionsfrom the Danish Economy
TemaPubl2009:3
Greenhouse Gas Emissionsfrom theDanish Economy
Ole GravgårdThomas OlsenPeter Rørmose
Greenhouse Gas Emissionsfrom the Danish EconomyTemaPubl 2009:3Statistics DenmarkNovember 2009
Pdf-version:Are free available onwww.dst.dk/publ/GreenhouseGasISBN 978-87-501-1809-1
Address:Statistics DenmarkSejrøgade 11DK- 2100 København ØPhone: +45 39 17 39 17e-mail: [email protected]www.dst.dk
Authors:Ole GravgårdBorn 1956Chief AdviserWith the National Accounts Division since 1993M.Sc. in Economics from the University of Copenhagen 1987Thomas OlsenBorn 1976Senior AdviserWith the National Accounts Division since 2002M.Sc. in Economics from the University of Copenhagen 2003Peter Rørmose JensenBorn 1963Senior AdviserWith the National Accounts Division since 2005M.Sc. in Economics from the University of Copenhagen 1992
� Statistics Denmark 2009All rights reserved. No part of this book may be reproduced or transmitted in any formor by any means without permission in writing from the publisher according to the Danish Copyright Act.Excepted from this is the quotation-right, which gives the right to use quotationswith an indication of this publication as source in accordance with good customand to the extent determined by the purpose.
PrefaceThe purpose of this publicationGreenhouseGasEmissions from the Danish Economy,which is based on Statistics Denmark’sEnvironmental Accounts for Denmark,is todescribe the emissions of greenhouse gases caused by Danish economic activities. Thepublication describes the extent of emissions from the industries and the households.Furthermore, the publication contains analytical results on the relationship betweenthe structural characteristics of the Danish economy and the emissions of greenhousegases.In addition to information on the greenhouse gas emissions, theEnvironmentalAccounts for Denmarkinclude information on other types of air emissions, the use ofenergy and water, material flows, the Danish reserves of oil and natural gas in theNorth Sea and environmental taxes and subsidies. All information in the accounts islinked consistently with the Danish national accounts and the so-called input-outputtables through common classifications and definitions. The link facilitates, as shownin this publication, analyses of the interaction between the economic activities andthe environment.TheEnvironmental Accounts for Denmarkare available free of charge on the Internet.Firstly, www.statbank.dk offers the possibility of extracting either complete tables orsections of the tables in the same way as other data are extracted from StatBankDenmark. Secondly, www.dst.dk/inputoutput provides users with the possibility ofdownloading entire sets of energy and emissions accounts as well as input-outputtables.This publication has been prepared in the National Accounts Division of StatisticsDenmark by Chief Adviser Ole Gravgård, Senior Adviser Thomas Olsen and SeniorAdviser Peter Rørmose. Poul Erik Olesen, Head of Section, has assisted with thetranslation of the text into English.Statistics Denmark, November 2009Jan Plovsing
/
Ole Berner
4
ContentsSummary. . . . . . . . . . . . . . . . . . . . . . . . . . . . . . . . . . . . . . . . . . . . . . . . . . . . . . . . . . . . . .1. Climate change and greenhouse gases. . . . . . . . . . . . . . . . . . . . . . . . . . . . . . . . .2. Greenhouse gas emissions from the Danish economy. . . . . . . . . . . . . . . . . .3. Greenhouse gas emissions from industries and households. . . . . . . . . . . .4. Economic growth and CO2emissions. . . . . . . . . . . . . . . . . . . . . . . . . . . . . . . . . . .5. Production or consumption approach to measuring CO2emissions. . . . .6. The UN Climate Convention and the Kyoto ProtocolReferences...................
581013182329333434364143
............................................................
Annex 1 - Methodology. . . . . . . . . . . . . . . . . . . . . . . . . . . . . . . . . . . . . . . . . . . . . . . .A.1 Environmental Accounting Principles. . . . . . . . . . . . . . . . . . . . . . . . . . . . . . . . . .A.2 Energy Accounts. . . . . . . . . . . . . . . . . . . . . . . . . . . . . . . . . . . . . . . . . . . . . . . . . . . . .A.3 Air Emission Accounts. . . . . . . . . . . . . . . . . . . . . . . . . . . . . . . . . . . . . . . . . . . . . . .Annex 2 - Detailed tables. . . . . . . . . . . . . . . . . . . . . . . . . . . . . . . . . . . . . . . . . . . . . .
Thematic publications from Statistics Denmark. . . . . . . . . . . . . . . . . . .
66
Explanation of symbols00,0......-*
}Less than 0.5 of the unit appliedCategory not applicableData too uncertainData not availableNilProvisional or estimated figures
5
Summary130 million tonnes ofgreenhouse gasses and117 million tonnes of CO2
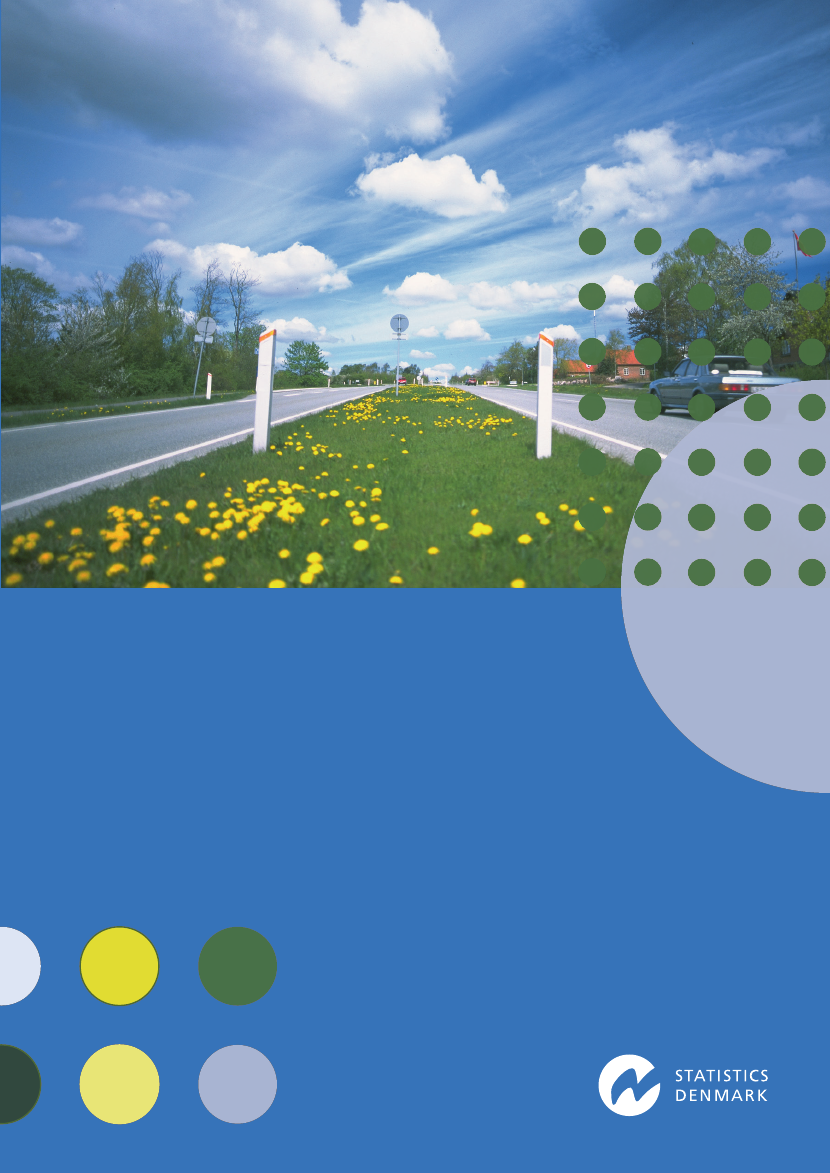
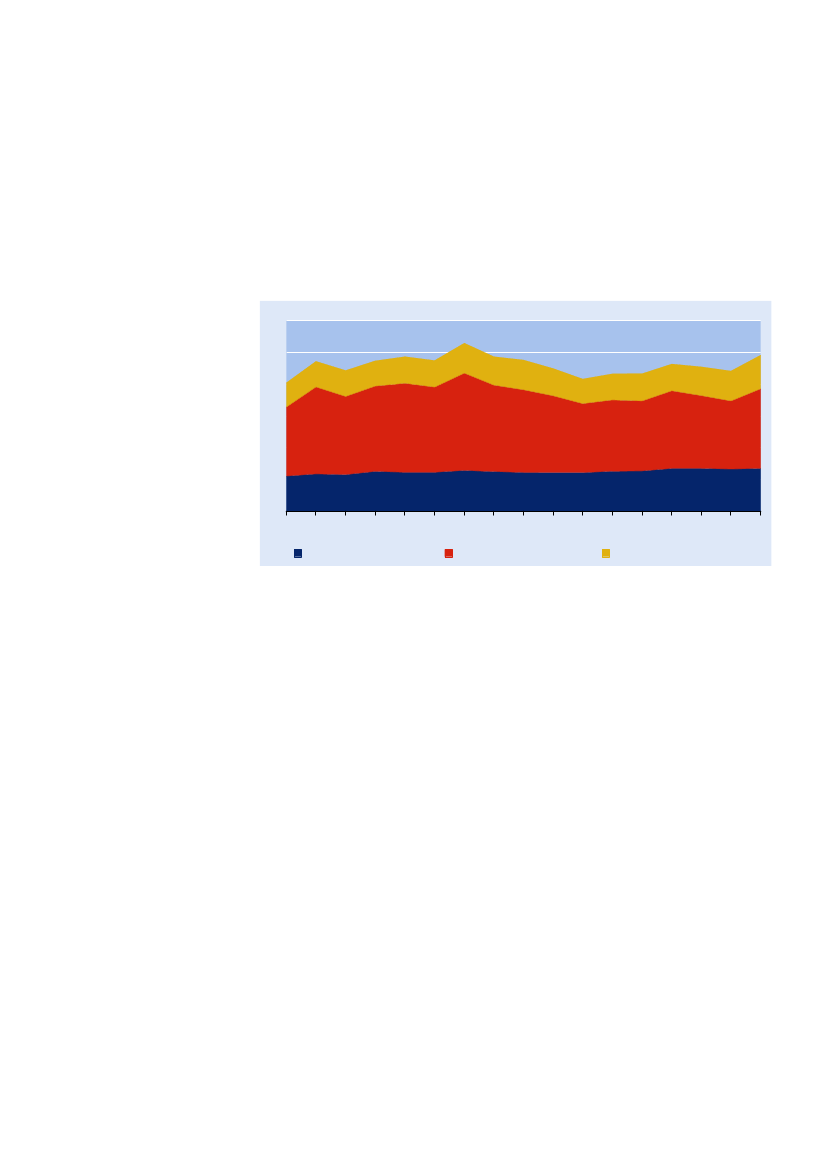
The emissions of greenhouse gases from the Danish economy were 130 milliontonnes in 2007, when the emissions of nitrous oxides and methane are converted intoCO2equivalents and added to the emissions of CO2. CO2is the predominantgreenhouse gas, and the CO2emissions alone were 117 million tonnes, correspondingto 21 tonnes per Dane.These estimates include emissions from international sea and air transport as well asemissions from biomass used as fuel. If the latter categories are excluded, by usingthe principles for reporting to the Kyoto Protocol, the Danish emissions of allgreenhouse gas emissions were 66 million tonnes CO2equivalents with CO2alonecontributing 52 million tonnes. The latter figure corresponds to 10 tonnes per Dane.Thus, the reporting to the Kyoto protocol only accounts for less than half of the totalemissions from the Danish economy.Emissions of CO2from Danish economic activities140120100806040200199019931996199920022005Biomass2007*Million tonnes CO2
Only half of the emissionsfrom the Danish economyare relevant forthe Kyoto Protocol
Covered by the Kyoto Protocol
International transport
CO2emissions increased by62 percentfrom 1990 to 2007
From 1990 to 2007, total emissions of CO2from Danish economic activities increasedby 62 percent from 72 million tonnes to 117 million tonnes. This increase results, to agreat degree, from an increase in Danish shipping activities. In 2007, the emissionscaused by Danish sea transport in international waters accounted for more than 40percent of the total CO2emissions.Almost 90 percent of the overall greenhouse gas emissions from 1990 to 2007 camefrom Danish industries and the remaining 10 percent from Danish households. Threeindustry groups stand out.Transport, post and telecommunicationsis the greatestcontributor (43 percent), not the least due to the large shipping activities.Electricity,gas and water supplyaccounts for approximately one fourth of all emissions (23percent) due to the production of electricity and district heating, whileAgriculture,fishing and quarryingcontributes around 12 percent. Agriculture is the only industrygroup for which nitrous oxide and methane are of significant magnitude.For the industry groups and for the Danish economy as a whole, emissions from theuse of oil products, is most dominant. Oil products account for 62 percent of the totalCO2emissions.Electricity, gas and water supplyis the only industry for which oilproducts do not dominate, and instead emissions from the use of coal make up themain part of the emissions. Emissions from combustion of natural gas are, generallyrelatively small, 10 percent of all CO2emissions.The use of biomass fuels by households and the energy supplying industries hasincreased since 1990, and the CO2emissions from the use of biomass haveconsequently gone up, implying that they contributed with 10 per cent of all CO2
90 percent of emissionscame from the industries
Predominantly emissionsfrom use of oil products
Increase in biomass use
6emissions in 2007. Frequently, these emissions from combustion of biomass are seenas neutral in relation to the greenhouse effect.Decoupling of economicgrowth and emissions
From 1990 to 2007, Denmark experienced a period of considerable economic growthwith GDP at constant prices rising by 40 percent. While the total CO2emissions,including the emissions from international transport activities rose even more,economic growth and CO2emissions are no longer linked together for most of theDanish industries. If emissions from international transport are excluded from thetotals, the increase in CO2emissions was only 8 percent from 1990 to 2007, i.e. muchlower than the economic growth. And if also emissions from biomass are excluded onthe grounds that they are neutral to the greenhouse effect, emissions show a 4percent decrease over the period.The reason that some decoupling have taken place is that most Danish industrieshave become more effective when they use energy, and they choose energy productswith lower carbon content per unit of energy used. In addition, a relative larger shareof service activities contributes to cutting the link between economic growth and CO2emissions. Model calculations show that if these CO2reducing developments had nottaken place, the energy related CO2emissions from Danish industries would havebeen 23 million tonnes larger in 2007 than they really were. However, 8 milliontonnes CO2alone were saved due to the use of energy products with less or no CO2emissions associated. This includes an increased use of biomass. 4 million tonnes ofCO2were saved due to a more effective use of the energy, and changes in thestructure of the economy (e.g. more service activities) saved another 11 milliontonnes of CO2.Exports and private consumption by households are the two main drivers behind theeconomic activity in Denmark and therefore also behind the CO2emissions. Theimportance of export in relation to Danish CO2emissions has been increasing. In1990, exports were responsible for 37 percent of total emissions, rising to 56 percentin 2006. The growing importance of exports is, in part, connected with the increase inexports of transport services by Danish shipping companies.Consumption of electricity and district heating by households does not directlygenerate CO2emissions, but when coal, oil, or natural gas are used by power stations,etc. to produce electricity and district heating CO2is indirectly emitted as a result ofthe household consumption. The same is the case when households consume otherproducts, which are purchased from the industries. Typically, they are associatedwith emissions from the production processes.In 2006, combustion of energy products for heating, cooking, and driving cars, etc. inhouseholds caused the release of 14 million tonnes of CO2emissions. However, it can,based on model calculations, be estimated that households prompted an additional25 million tonnes of CO2emissions in the Danish industries as a result of theproduction of electricity, district heating, private and public transport services, foodproducts, restaurant visits, refuse disposal and sewage treatment services, and a greatmany other products and services used by the households.Private consumption did not only prompt an estimated 25 million tonnes of CO2inthe Danish industries, but also an estimated 11 million tonnes of CO2in industries inother countries through imports from these countries to Denmark.However, it is not only the consumption by households, which gives rise to emissionsin other countries. For all imports to Denmark, we estimate 40 million tonnes ofemissions generated abroad. Adding this number to all Danish emissions, we obtain atotal of 154 million tonnes of CO2generated globally as a result of the Danisheconomic activity in 2006.Since part of these emissions are, in actual fact, prompted because Danish industriesproduce goods and services for exports, a so-called consumption based estimate of
Increased energyefficiency, cleaner energyand structural changessave CO2emissions
Exports and consumptionby households arebehind the emissions
Consumption promptsemissions in thephase of production
14 million tonnes directlyfrom households, and25 million tonesindirectly in Denmark
11 million tonnes abroadfrom households’consumption40 million tonnesabroad in total
Consumption basedestimate of emissions ...
7the Danish emissions may be derived by subtracting that part of the globally inducedemissions that are related to the Danish exports. It is called consumption basedbecause it corresponds to all emissions in Demark and abroad caused by the domesticDanish final consumption, i.e. the consumption by Danish households, governmentconsumption and the investments, etc. taking place in Denmark. The consumptionbased estimate can be compared with the traditional production based, i.e. the totalemissions from Danish industries and households.… are smaller than theproduction basedestimates
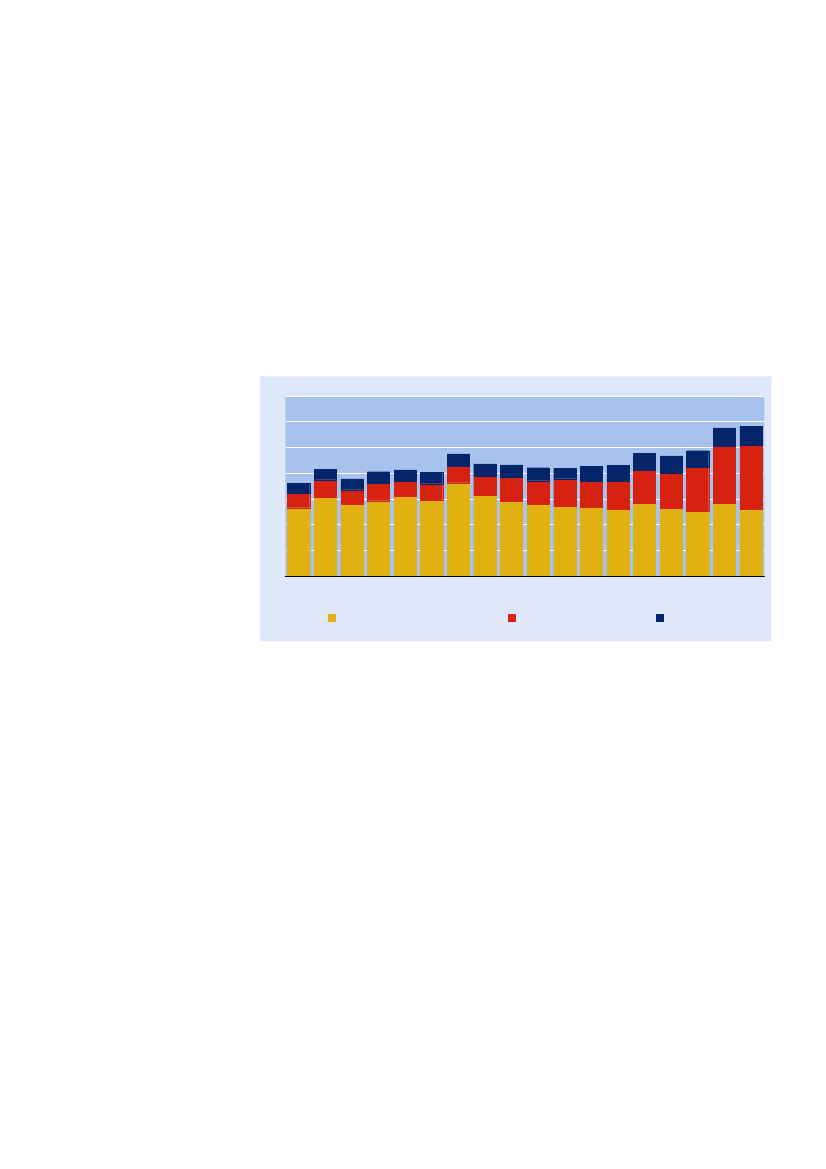
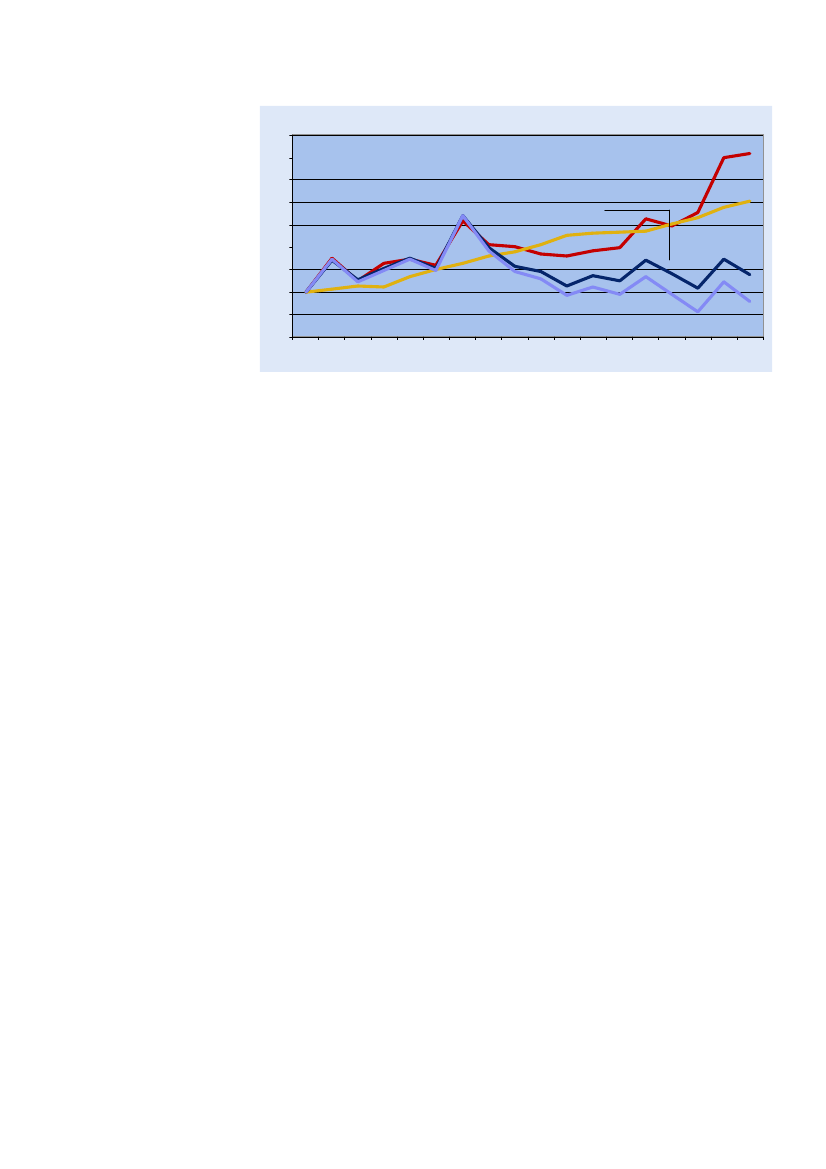
For the period 1990 to 2006 the consumption based CO2emissions have beenestimated to be smaller than the production based CO2emissions. Another way toexpress this is to say that Denmark has been emitting more CO2on behalf of othercountries (due to exports from Denmark) than other countries have been emitting onbehalf of Denmark (due to imports).The magnitude of the gap between the production and the consumption basedestimate depends heavily on whether international transport is included in theproduction based estimate or not, since inclusion of the emissions from internationalsea transport gives, as already demonstrated, rise to a great increases in theemissions. If the emissions from international transport are excluded, the gapbetween the two measures has been diminishing over time, and it is almostinsignificant in 2006.Production and consumption based measures of Danish CO2emissions1201101009080706050403020100Million tonnes CO2
The gap diminishes wheninternational transportis excluded
1990 1991 1992 1993 1994 1995 1996 1997 1998 1999 2000 2001 2002 2003 2004 2005 2006Consumption basedProduction based, otherProduction based, international transport
EnvironmentalAccounting principles
The data and analytical results presented in the main part of this publication is basedon the Environmental Accounting principles, which are internationally agreedprinciples for describing the link between the economy and the environment, butwhich at the same time, in some respects, deviate from the principles used forestimating emissions in relation to the Kyoto Protocol.In order to put the emissions into the perspective of the Kyoto Protocol, thepublication is rounded off by presenting the Protocol’s reduction targets forindividual countries as well as the development of their emissions from 1990 to 2007.CO2permits and other schemes under the Kyoto Protocol are also mentioned.The publication includes an annex presenting further information on the environ-mental accounting principles, energy accounts and emissions accounts. Detailedtables for greenhouse gas emissions by industries and by households are alsoincluded.
The Kyoto Protocol
Annexes and tables
8
1. Climate change and greenhouse gasesClimate change
With great probability, human activity has had an effect on climate change. Over thelast 100 years, the mean global temperature has risen by 0.7 degrees1- quite asizeable increase in climate terms. Other signs of climate change are record heatwaves, melting glaciers and Arctic ice, rising sea levels and changes in precipitationpatterns.The composition of the atmosphere is affected by emissions of various gases.Changes in the composition contribute to the so-called ‘greenhouse effect’ in which anincreasing amount of the sun’s heat does not escape from earth again. According tothe UN-based Intergovernmental Panel on Climate Change, the IPCC , it is most likelythat emissions of man-made greenhouse gases are affecting the atmosphere and areresponsible for most of the increase in mean global temperature, which has beenthtaking place since the middle of the 20 Century.Since 1970 global emissions of man-made greenhouse gases such as CO2,, methane,nitrous oxide and halocarbons have increased considerably. Taking into conside-ration that each of them has a different effect on the atmosphere, i.e. a differentglobal warming potential, the increase has been 70 percent. Over a 100-year period,the global warming potential from methane is 21 times higher than that of CO2whilstthat of nitrous oxide is 310 times higher.Greenhouse gases and the greenhouse effectGreenhouse gases are gas types which are able to absorb part of the long-wave infra-red radiation fromthe earth and send it back in the form of heat. Greenhouse gases occur both naturally and as a result ofhuman activity.The way in which individual gases contributes to the greenhouse effect depends on their concentrationand ability to absorb heat radiation. Global warming potential (GWP) is used to evaluate the relativeeffect of the various emitted gases. Global warming potential is the effect one kilo of a given gas hascompared with a kilo of CO2. The length of time the effect is measured over is also important - usually100 years is the time span used. When the effect of the greenhouse gas is taken into account themeasuring unit is CO2equivalents or GWP.
Man-madegreenhouse effect
Great increase in emissionsof greenhouse gases
CO2from fossil fuels ...
On a global scale over two thirds of the global warming potential from greenhousegas emissions in 2005 came from CO2emissions as a result of burning of fossil fuels,e.g. coal, oil products and natural gas.CO2is also released when biomass is burned or broken down as a result of activitiessuch as forestry and forest clearing. When this is taken into account, global CO2emissions count for more than 75 percent of the global warming potential from man-made emissions of greenhouse gases.
… forestryand land use
1 IPCC/DMI, 2007/08 (cf. the References) gives a rise of 0.74 degrees Celsius with a 90 percentpercent uncertainty interval of between 0.56 and 0.92 degreesCelsius.
9Figure 1
Global man-made emissions of greenhouse gases5045403530252015105019701975198019851990199520002005Billion tonnes CO2equivalents (GWP)
CO2 from combustion of fossil fuels etc.Methane
CO2 from deforestation and soils etc.Nitrous oxide
Source: European Commission (EC), Joint Research Centre (JRC)/Netherlands Environmental Assessment Agency(PBL).EC-JRC/PBL. EDGAR version 4.0. (http://edgar.jrc.ec.europa.eu/, 2009). See also IPCC/DMI, 2007/08
Methane and Nitrousoxidefrom agriculture, etc
Almost 25 percent of the global warming potential comes from methane, nitrousoxide and halocarbons. Emissions of methane originate from production and use ofenergy as well as from rice cultivation and livestock. Nitrous oxide comes from anumber of sources, including nitrogen rich agricultural fertilizer, burning of biomassand various industrial activities.Emissions of halocarbons make up only around 1 percent of the total contribution tothe global warming potential. Halocarbons denote a collective term for artificiallyproduced gases, e.g., for industrial use. These are powerful greenhouse gasesalthough they are only released in relatively small amounts.Important greenhouse gasesCarbon dioxide (CO2) is formed by burning fossil fuels and biomass as well as the breaking down oforganic material. A large part of CO2emissions is absorbed by the oceans, woods and other eco-systems, while the rest stays in the atmosphere. From 1750 to the present day, the concentration of CO2in the atmosphere has risen by up to 33 percent and is now at its highest for 420 000 years.Methane (CH4)is primarily of organic origin. Natural emissions come from wet areas, ruminants andinsects. Man-made emissions come from coal deposits, the extraction and transport of natural gas andlandfill sites, the burning of biomass, rice cultivation and livestock. The GWP of methane is calculated asbeing 21 times greater than CO2over a period of 100 years.Nitrous oxide (N2O)comes naturally from the oceans and from the breaking down of organic material.Man-made emissions come from nitrogen rich fertilisers in agriculture, the burning of biomass andindustrial activities. The GWP of nitrous oxide is calculated as being 310 times greater than CO2over a100 year period.Halocarbons (CFC-gases, HCFCs, HFCs, PFCs' and SF6)are artificially manufactured carboncompounds which contain fluor, chlorine, bromine or iodine. The use of CFC (Freon) in, for example,refrigerators has been considerably limited by international agreements because, as well as being agreenhouse gas, it also breaks down the ozone layer. CFC's have been replaced by other halocarbonssuch as HFC's. HFCs PFC's and SF6are powerful greenhouse gases. For example, the GWP of SF6is22 800 greater than CO2over a 100 year period.Source: The Danish Meteorological Institute and the Danish Energy Agency
Halocarbons used inindustrial processes etc
10
2. Greenhouse gas emissions from the Danish economyIPCC definition and theKyoto assessment …
When calculating a country’s emission of greenhouse gases, it is necessary to defineprecisely which emissions are to be included. In most cases, the accepted definition oftotal emissions is the one decided upon by the IPCC (the UN climate panel) for theassessment of whether the Kyoto Protocol is adhered to (see Chapter 6). However,this definition does not include all emissions. International sea and air transport is,for example, not included. Neither is the burning of biomass.Following the IPCC definition, the Danish National Environmental Research Institute(NERI) has assessed the Danish greenhouse gases emissions as 66 million tonnesconverted to CO2(GWP). In 2007, this was an estimated 12 tonnes per Dane. CO2alone represents 52 million tonnes of the total emissions, or around 10 tonnes perDane.A more comprehensive idea of the total emissions caused by a country’s economicactivities can be gained by using the principles of the so-called EnvironmentalAccounts, cf. annex 1. Statistics Denmark’sEnvironmental Accounts for Denmarktakesinto accountallthe economic activities underlying the GDP (Gross Domestic Product)as described by the Danish National Accounts. TheEnvironmental Accounts forDenmarkalso include the emissions from the burning of biomass and the fuel used inconnection with international air transport and shipping carried out by Danishcompanies. Further, these calculations include and show separately emissions fromburning of biomass. Using these principles, total Danish emissions of greenhousegases were 130 million tonnes converted to CO2in 2007. This is equivalent to 24tonnes per Dane.Environmental accountsEnvironmental accounts (Integrated environmental-economic accounts) are so-called satellite accountsto the System of National Accounts (SNA), which is the international standard framework for organisingeconomic information and for calculating for instance GDP (the gross domestic product). Therefore, theenvironmental accounts share common definitions and classifications with the national accounts. Itprovides an integrated set of aggregate environmental and economic information from which indicatorsof economic-environmental performance can be derived. These can be at the sectoral andmacroeconomic level, as well as at more detailed levels.The basic principles on environmental accounting are embodied in the handbookIntegratedEnvironmental and Economic Accounting 2003(United Nationset al., 2003), commonly referred to asSEEA 2003.The integration of information on the economy and the environment adds substantial analytical value,because the different data sets can be linked and compared directly. It allows decisions and policies tobe designed, analysed and reviewed for effectiveness. In the case of energy and air emissions, theaccounts provide, for instance, an information basis for informing policy makers on which economicactivities are behind the air emissions and what the likely economic consequences of implementing airemissions reduction policies are.See Annex 1 for more information on environmental accounts.
… calculates Danishemissions at 66 milliontonnes
The EnvironmentalAccounts calculateDanish emissions at130 million tonnes
CO2also principalDanish greenhouse gas
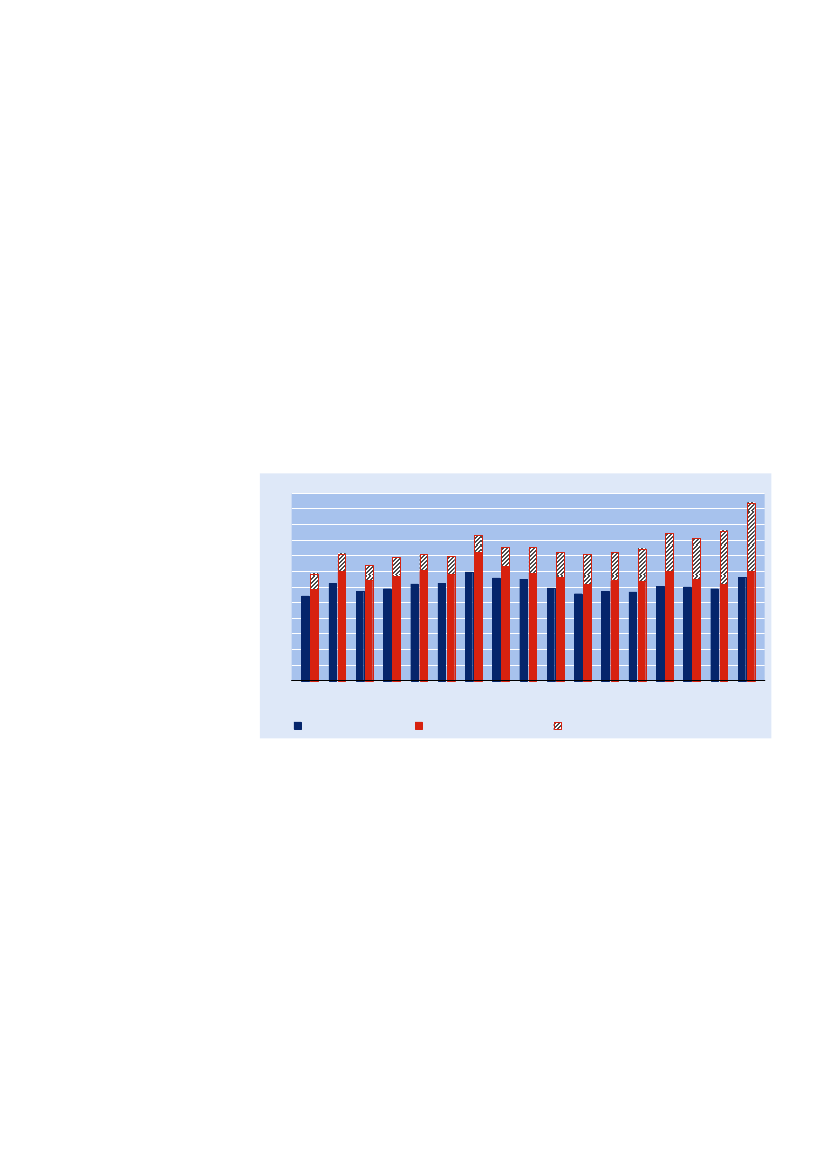
89 percent of the global warming potential from Danish greenhouse gases comesfrom CO2. Nitrous oxide contributes 6 percent, methane accounts for 4 percent, whileemissions from halocarbons constitute 1 percent of the total Danish global warmingpotential.
11Figure 2
Emissions of greenhouse gases from Danish economic activities1401201008060402001990 1991 1992 1993 1994 1995 1996 1997 1998 1999 2000 2001 2002 2003 2004 2005 2006*2007*CO2Nitrous oxideMethaneHalocarbonsMillion tonnes CO2equivalents (GWP)
117 million tonnesof CO2in 2007
From 1990 to 2007, figures for CO2alone show that emissions from Danish economicactivities constitute an increase of 62 percent, from 72 million tonnes to 117 milliontonnes, or from 14 to 21 tonnes per Dane.In 2007, total CO2emissions from Danish economic activities were more than twice aslarge as the emissions accounted for in the principles laid down by the IPCC and theKyoto Protocol. This is partly due to the fact that, as mentioned previously, the KyotoProtocol does not include emissions from international transport carried out byDanish companies, including shipping between international ports. In 2007, CO2emissions alone from Danish-operated ships in international waters were 47 milliontonnes, which is more than 40 percent of all Danish CO2emissions.Emissions of CO2from Danish economic activities140120100806040200199019931996199920022005Biomass2007*Million tonnes CO2
International transporthas great influence onthe whole pictureof emissions
Figure 3
Covered by the Kyoto Protocol
International transport
Due to an increase in international shipping by Danish companies in recent years,emissions from Danish shipping have also increased. In 1990, emissions from Danish-operated ships in international waters were 9 million tonnes, increasing to 47 milliontonnes in 2007. The gap between the IPCC-defined emissions and the results of theDanish Environmental accounts has thus also widened.Biomass
Biomass is another area in which IPCC and Environmental Accounting methodsdiffer. In contrast to the accounts, the IPCC does not include emissions from theburning of biomass in their final result. Although these emissions actually take place,
12they are considered as being neutral in that a comparable amount of CO2is alsoabsorbed during the growth of the biomass. The IPCC also subtract the amount of CO2associated with an increase in the total biomass, for example in the growth of newforests.Increase in CO2emissions from biomass
There has been a large increase in the use of biomass as fuel, resulting in an increasein the related CO2emissions. From 1999 to 2007, these emissions rose from 5 millionto 12 million tonnes CO2. So while this type of emission from the use of biomassrepresented 6 percent of the total CO2emission of 72 million tonnes in 1990, in 2007it represented 10 percent of the total of 117 million tonnes.The further annual binding (sequestration) of CO2by plants and trees which occurswith the growth of biomass through the planting of new areas of forest has, inDenmark’s case, been more or less constant at 3 million tonnes CO2since 1990.From the total CO2-emissions to the Kyoto-protocolStatistics Denmark’sEnvironmental Accounts for Denmarkare based on a description of all economicactivities, including those carried out abroad by Danish companies in relation to transport. The UNClimate Panel, the IPCC and the Kyoto Protocol (see Chapter 6) on the other hand, see it in terms ofDenmark as a geographical area.The following adjustments are used to get from the total figures from the Environmental Accounts to thefigures for total Danish emissions according to IPCC and the Kyoto Protocol.••CO2emissions from Danish operated ships and aeroplanes are subtracted as the emissionsoccurred outside of Denmark.CO2emissions from the burning of biomass are also subtracted as these emissions are seen ascounterbalanced by a comparable binding of CO2during the biomass growth. Binding of CO2,which occurs, for example, due to planting of new forests, is also subtracted since the bindingof CO2means less CO2in the atmosphere.A further deduction is made because the IPCC and the Kyoto Protocol defines certain othertransport emissions, e.g. those related to cross border trade of petrol, in a different waycompared to the Environmental Accounts.
Binding of CO2by planting new forest, etc
•
Bridge table19902007*
Million tonnes
Total CO2emissions from the Danish economy (Environmental Accounts). . . . . . . .- CO2related to biomass. . . . . . . . . . . . . . . . . . . . . . . . . . . . . . . . . . . . . . . . . . . . . . . . . . . .Of which biomass used as fuels. . . . . . . . . . . . . . . . . . . . . . . . . . . . . . . . . . . . . . . . . . . .Further binding of CO2(new forest, etc.). . . . . . . . . . . . . . . . . . . . . . . . . . . . . .- CO2emissions from international transport (bunkering abroad). . . . . . . . . . . . . . . . . . .Of which ships. . . . . . . . . . . . . . . . . . . . . . . . . . . . . . . . . . . . . . . . . . . . . . . . . . . . . . . . . . .Planes. . . . . . . . . . . . . . . . . . . . . . . . . . . . . . . . . . . . . . . . . . . . . . . . . . . . . . . . . .- Other differences related to transport and cross border trade. . . . . . . . . . . . . . . . . . . . .
72.27.54.62.89.49.20.32.0
116.815.112.13.049.647.21.80.5
Total emissions accounted for in the Kyoto Protocol (IPCC). . . . . . . . . . . . . . . . . . . .
53.3
52.1
13
3. Greenhouse gas emissions from industries and householdsAlmost 90 percent of allemissions come fromindustries
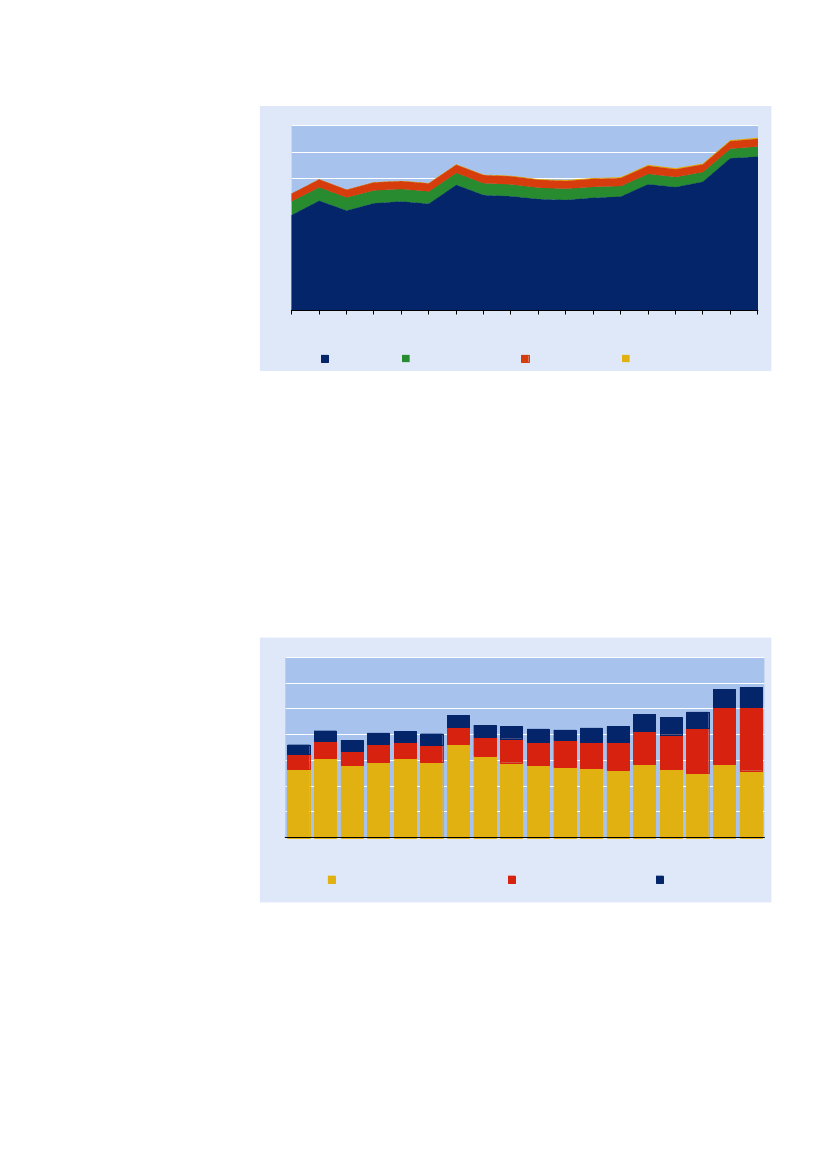
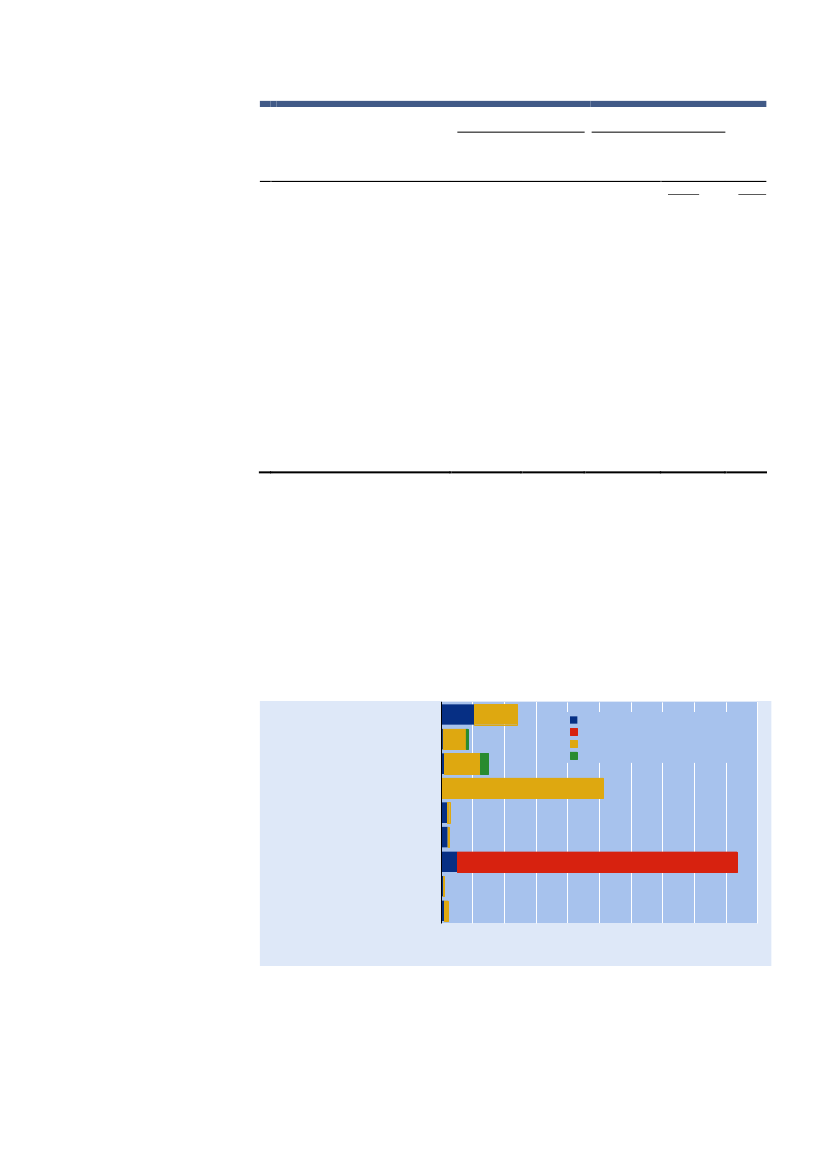
Most of the man-made greenhouse gases are produced in connection with theindustries’ production of goods and services. When CO2, methane and nitrous oxideemissions are taken as one and assessed in relation to their global warming potential,between 1990 and 2007, the industries have contributed 90 percent of all Danishman-made emissions, with households making up the remaining 10 percent.Three industry groups contribute especially to the greenhouse gas emissions (Figure4). In 2007,Agriculture, fishing and quarryingcontributed 12 percent,Electricity, gasand water supply 23 percent and Transport, post and telecommunications43 percent ofthe total global warming potential.Greenhouse gas emissions from industries and households. 2007*HouseholdsAgriculture, fishing and quarryingManufacturingElectricity, gas and water supplyConstructionWholesale and retail tradeTransport, post and telecommunicationFinance and business activitiesPublic and personal services0CO251015202530354045Percent
Three industriescontribute 78 percent
Figure 4
Nitrous oxide
Methane
Methane and nitrous oxide emissions are given as CO2–equivalents (GWP)
Agriculture
The global warming potential of emissions fromAgriculture, fishing and quarryingislargely due to emissions of methane and nitrous oxide and to a lesser extent to CO2.As a result of changes in fertilizing practice, emissions of nitrous oxide fromagriculture and thus their contribution to the global warming potential have fallensince 1990.The global warming potential of emissions fromTransport, post and telecommuni-cationis mainly caused by theCO2emission. 46 percent of allCO2emissions comefrom this industry (Figure 5 and Table 1). The industry includes all businesses thatcarry out transport as a service to other businesses and households. On the otherhand, it does not include transport activities carried out by businesses and householdsfor themselves.As previously mentioned, emissions from international shipping have increasedsubstantially, which is reflected in the fact that emissions fromTransport post andtelecommunicationwere more than three and a half times larger in 2007 than in 1990.In 2007,Electricity, gas and water supplycontributed almost 23 percent of the globalwarming potential from greenhouse gases. The sector showed actual emissions of 30million tonnes from CO2alone, corresponding to 25 percent of all Danish CO2emissions. This includes all Danish production of electricity and district heating. Allemissions in connection with electricity and district heating production come fromthis area, while the use of electricity and district heating in the industries andhouseholds cause no direct emissions.
Transport
International shipping
Energy supply
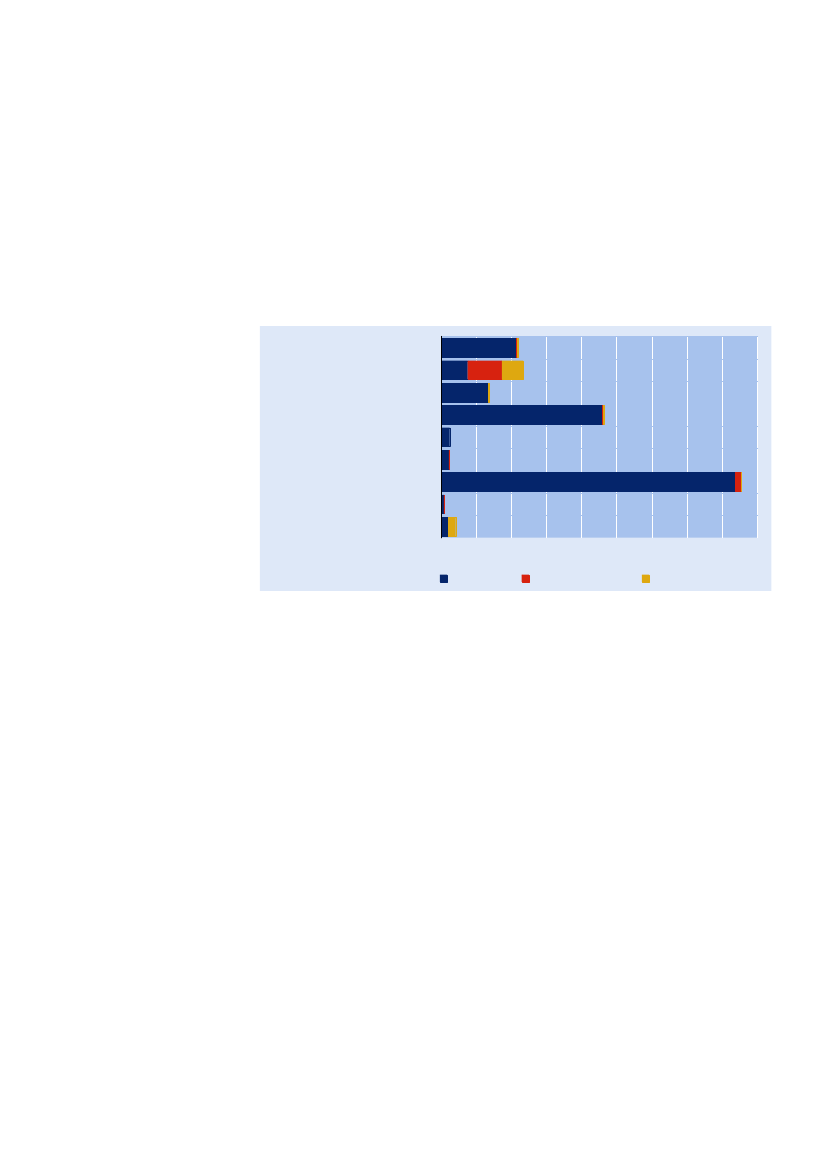
14Attributing emissionsfrom energy producersto energy users
However, it may be argued that it is the use of the electricity and district heatingwhich, in actual fact, causes the emissions. Therefore, it is, based on theEnvironmental Accounts,useful to supplement the accounts for actual emissions byadjusted accounts in which the allocation of emissions caused by generation ofelectricity and district heating is reallocated in a simple way to the users of theenergy. Such adjusted emissions are presented in the box below. Further analyticalresults, including more sophisticated model based re-allocations of the emissions arepresented in Chapter 5.Emissions of CO2from the Danish energy supply change considerably from year toyear as the production of electricity and district heating varies. The reason for this isthat temperatures change year by year and there are significant variations in importand export of electricity. Emissions were consequently high in 1996 and 2003 when alot of electricity was produced for export.CO2emissions from industries and households1401201008060402001990 1991 1992 1993 1994 1995 1996 1997 1998 1999 2000 2001 2002 2003 2004 2005 2006*2007*HouseholdsManufacturingOther industriesAgriculture, fishing and quarryingElectricity, gas and water supplyTransport, post and telecommunicationMillion tonnes CO2
Major variations inemissions fromenergy supply
Figure 5
15Adjusted CO2emissionsAdjusted CO2emissions are a simple analytical result based on the air emission accounts. Theadjustment entails that emissions caused by theElectricity, gas and water supplyindustry in relation totheir production of electricity, district heat and town gas are attributed to end users, i.e. the industriesand the households using those products. At the same time, the emissions caused by external trade withthose products are adjusted for by assuming that the net imports entail the same emissions as theDanish production.Adjusted CO2emissions from industries and from households1401201008060402001990 1991 1992 1993 1994 1995 1996 1997 1998 1999 2000 2001 2002 2003 2004 2005 2006*2007*HouseholdsAgriculture, fishing and quarryingManufacturingElectricity, gas and water supplyOther industriesTransport, post and telecommunicationMillion tonnes CO2
It proves that especially the households and theManufacturingandOther industriesinclusive of retailtrade and the private and public services now account for a much bigger proportion of the CO2emissions. TheElectricity, gas and water supplyindustry accounts for less than one percent.Furthermore, the peaks caused by extraordinarily big exports of electricity no longer appear in the figure.It is important to emphasise that the figures, due to the adjustment for the external trade, do notcorrespond to actual emissions. Furthermore, the adjustment only involves the energy supply industries.Therefore, the adjusted CO2emissions shown here should not be confused with the so-called direct andindirect emissions presented in Chapter 5.
16Table 1
Danish CO2emission 1990 and 2007*1990EmissionsShare of thetotalemissionspercent6113712201279155100130666-4
2007*Emissions
Increase1990Share of thetototal2007emissionspercent4725114601871211004021045-31411991-02713377724- 6262415575161105
mill. tonnes
mill. tonnes4.88.629.51.51.453.90.51.2101.513.81.5116.847.21.812.152.5-3.0
1Agriculture, fishing and quarrying2345678
......
Manufacturing. . . . . . . . . . . . . . . . . . . . . .Electricity, gas and water supply. . . . . . . .Construction. . . . . . . . . . . . . . . . . . . . . . .Wholesale and retail trade. . . . . . . . . . . .Transport, post and telecommunication. .Finance and business activities. . . . . . . . .Public and personal services. . . . . . . . . . .Total industries. . . . . . . . . . . . . . . . . . . .Households. . . . . . . . . . . . . . . . . . . . . . . .Other. . . . . . . . . . . . . . . . . . . . . . . . . . . . .Total emissions. . . . . . . . . . . . . . . . . . . .Of which ships bunkering abroad. . . . .planes bunkering abroad. . . .emissions from biomass. . . . .Total industries excl. of bunkering abroadCO2binding. . . . . . . . . . . . . . . . . . . . . . . .
4.27.727.10.81.414.50.41.257.311.13.872.29.20.34.647.8-2.8
CO2emissionsby purpose
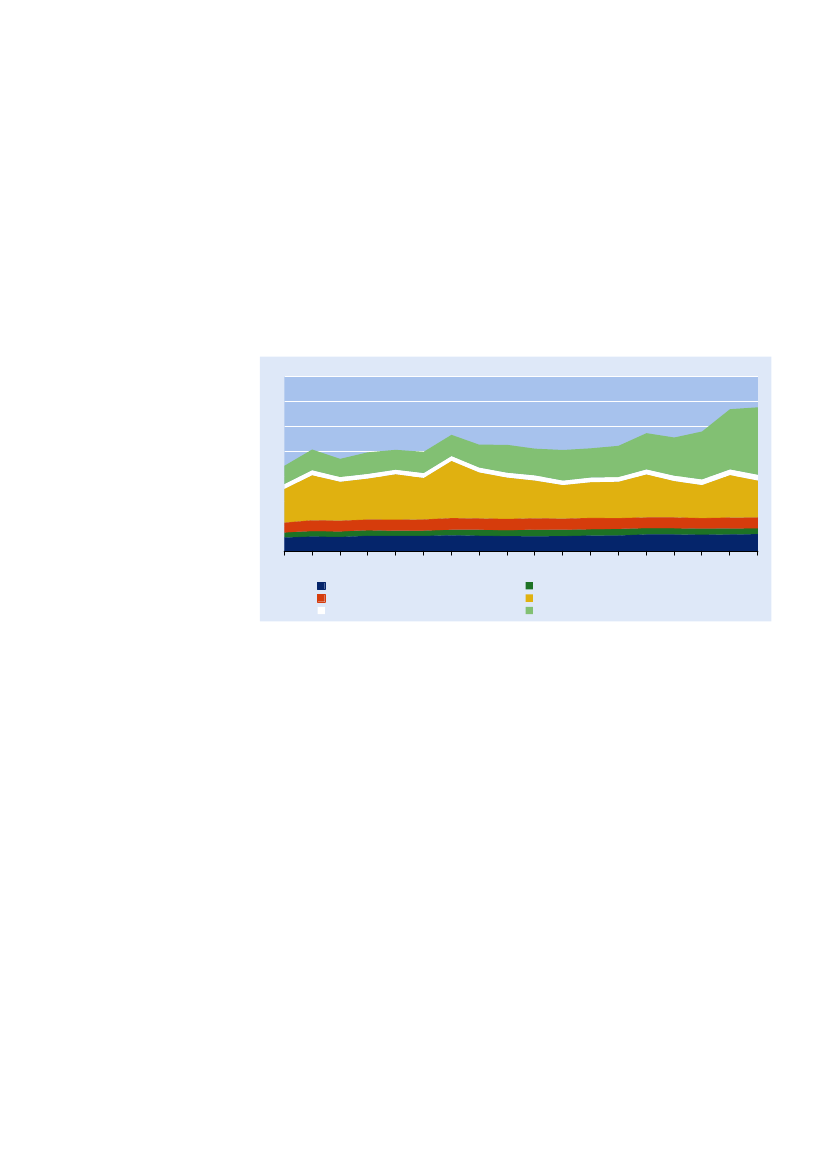
Figure 6 presents the CO2emissions by purpose. Emissions from road transport madeup a substantial part of the emissions from households, although the emissionsrelated to heating and cooking, etc. were dominant. Emissions from road transportare relatively important forConstructionandWholesale and retail trade,while it isother types of transport, especially sea transport, which is entirely predominant forTransport, post and telecommunication.Emissions from road transport constituted 11percent of all Danish CO2emissions in 2007, while emissions related to other types oftransport accounted for 44 percent. Non-energy related emissions from industrialprocesses inManufacturingandAgriculture, fishing and quarryingaccounted for 2percent of total CO2emissions.CO2emissions from industries and households by purpose. 2007*HouseholdsAgriculture, fishing and quarryingManufacturingElectricity, gas and water supplyConstructionWholesale and retail tradeTransport, post and telecommunicationFinance and business activitiesPublic and personal services05101520253035404550PercentRoad transportOther transportProduction / heatingIndustrial processes (non-energy)
Figure 6
CO2emissions bytype of energyOil productspredominant
Figure 7 presents CO2emissions broken down by economic activity and type of energyused.It shows that CO2emissions caused by combustion of oil products are predominantfor most industry groups,Electricity, gas and water supplybeing the most obviousexception. For the Danish economy as a whole, emissions related to the combustion
17of oil products account for 62 percent of the total emissions. This large proportion ispartly explained by the fact that international transport is included. If we do notinclude emissions caused by Danish operated ships and planes abroad, then oilproducts accounted for 34 percent of the total CO2emissions.Coal emissions from theenergy supply industry
TheElectricity, gas and water supplyrelies to a large extent on the use of coal, which isreflected in large emissions from this type of energy product. In total coal represents16 per cent of all Danish emissions.Emissions from combustion of natural gas are generally relatively small, 10 percent oftotal emissions.As mentioned, the combustion of biomass fuels has increased in recent years.EspeciallyHouseholdsand theElectricity, gas and water supplyare using the biomass.The CO2emissions caused by the combustion of biomass accounted for 11 percent oftotal emissions in 2007.CO2emissions from industries and households by type of energy. 2007*HouseholdsAgriculture, fishing and quarryingManufacturingElectricity, gas and water supplyConstructionWholesale and retail tradeTransport, post and telecommunicationFinance and business activitiesPublic and personal services05101520253035404550PercentOil productsCoalNatural Gas etc.BiomassIndustrial processes (non-energy)
Relatively small emissionsfrom natural gasBiomass
Figure 7
18
4. Economic growth and CO2emissionsEconomic growth andemissions of CO2
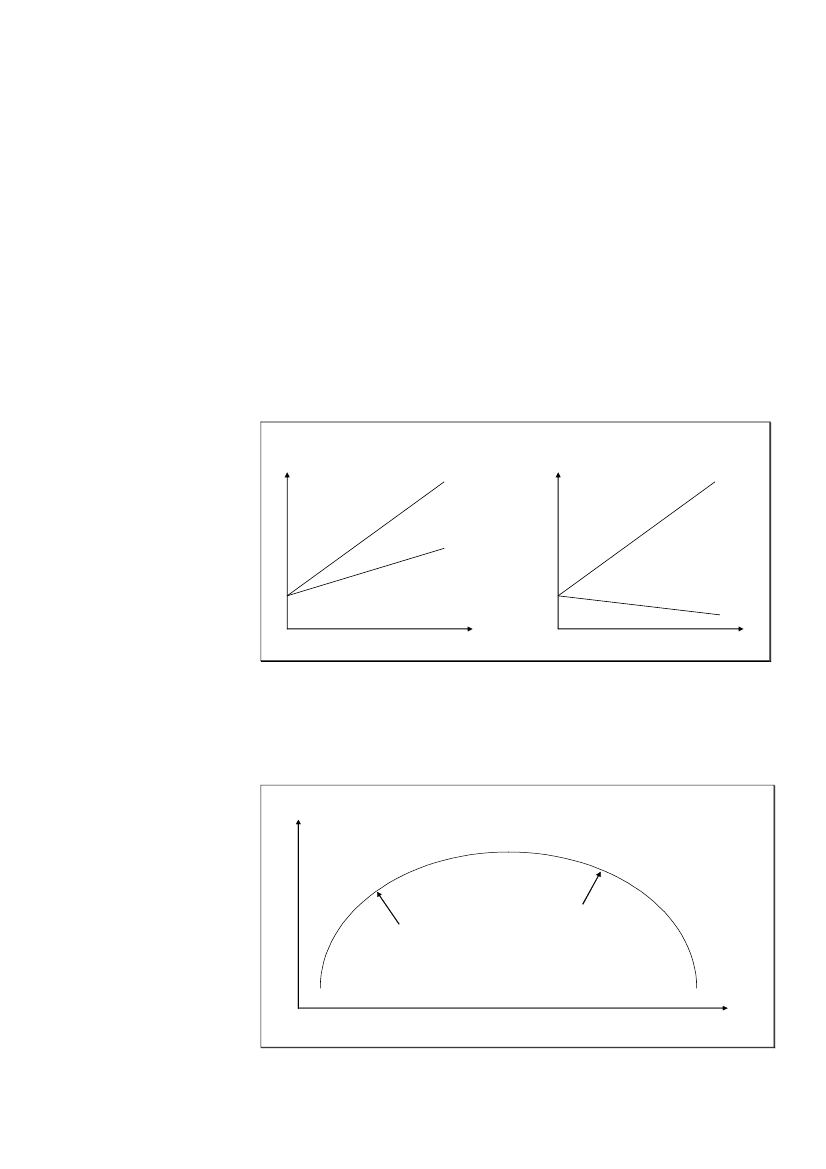
Economic development and high environmental quality is often regarded asconflicting goals. The apparent conflict is linked to the conception that the so-calledscale effect implies that economic growth in itself increases pollution, whileprevention or abatement of environmental degradation is too costly to implementand will eventually lead to decreasing production and growth. However, other effectsthan scale effects are involved, some of which actually reduces environmentalpressures without hampering economic growth.Many economies in the world have actually experienced emissions of CO2that did notgrow at the same pace as the economy. In some countries there has even been adecline in emissions side by side with an incline in economic growth measured byGDP (gross national product). The term ‘decoupling’ is used for this type ofphenomenon. Decoupling isrelativeif both GDP and emissions are increasing withthe latter at a smaller pace than the former. Decoupling isfullif emissions decline,while GDP grows. Thus, decoupling does not necessarily require decreasingemissions. Only in the case of full decoupling emissions actually fall.The principles of relative and full decouplingA) Relative decouplingIndex
Decoupling
Figure 8
B) Full decouplingIndex
Level of GDP
Level of GDP
Level ofemissions
Level ofemissions
Time
Time
Environmental KuznetsCurve (EKC)
Empirical studies have concluded that decoupling of growth and CO2emissions isobserved mostly in richer developed economies and this phenomenon has moregenerally been seen as a representation of the so-called “Environmental KuznetsCurve”.The theoretical Environmental Kuznets CurveEnvironmental degradation(emissions of CO2)
Figure 9
High income per capitaLow income per capita
Income or GDP per capita
19Decoupling mostly inricher countries
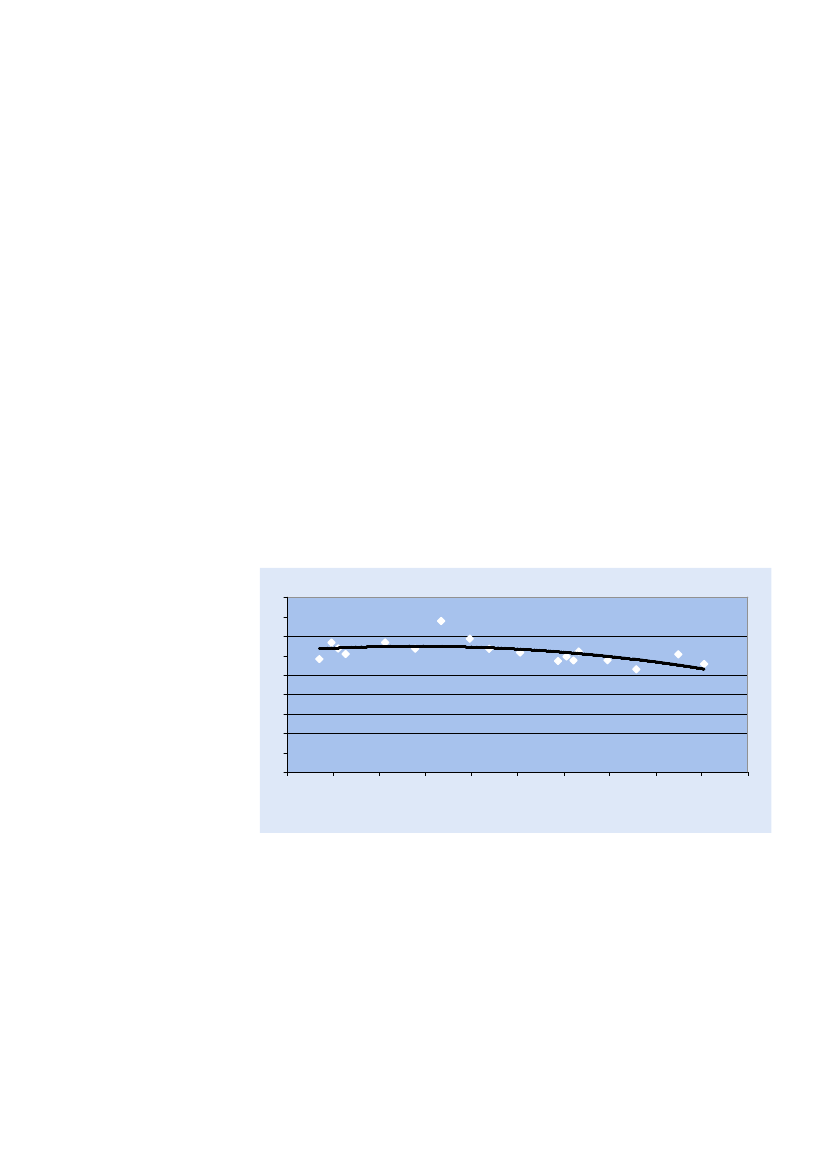
The shape of the Environmental Kuznets Curve is like an inverted U with income orGDP per capita on the first axis and environmental degradation on the second.Emissions of CO2can be seen as a proxy for environmental degradation under theassumption that the higher the level of emissions the more severe environmentaldegradation is. The curve indicates that environmental degradation worsens as theGDP per capita increases until a turning point is reached. Increasing income percapita above this point will tend to benefit the quality of the environment. Thus, inless developed economies, economic growth tends to worsen a number of environ-mental problems, while in some economies, e.g. the Danish economy, growth willimprove at least some aspects of the environment.The rationale behind this theory is that in developing economies, less weight is givento environmental concerns. In contrast, when a certain standard of living in terms ofincome per capita has been obtained the focus is changed and more emphasis is givento environmental concerns and cleaner production methods.In the period from 1990 to 2007 Denmark experienced an economic growth of 40percent and the scale effect suggests that the emissions should have grown at thesame pace. Fortunately, there were other effects present in the economy thatdecreased the level of emissions per unit of production. Consequently, emissions inmost industries did not increase as much as the scale effect suggested. Theseoffsetting effects will be discussed below based on actual data and model calculationsfor the Danish economy.Figure 10 below shows for the period 1990 to 2007 a scatter diagram of the size ofGDP and the size of the Danish CO2emissions, where the size of GDP is a proxy forincome per capita.Relationship between the level of economic growth and CO2emissions in DenmarkMillion tonnes CO290807060504030201001 0001 0501 1001 1501 2001 2501 3001 3501 4001 4501 500
EKC explained
Growth in emissions andoffsetting effects
Empirical evidence for aDanish EnvironmentalKuznets Curve?Figure 10
GDP, billions DKK, fixed pricesEmissions from biomass and international transport are not included in the emission figures.The curve is a second order polynomial fitted to the observations.
The data show a tendency to decreasing emissions concurrently with increasing GDP.This may be seen as an indication that Danish emissions are on the downward slopeof the Environmental Kuznets Curve
20Figure 11
Development in the Danish CO2emissions and in the Danish economic growthIndex 1990=10017016015014013012011010090801990199319961999200220052007*CO2emissions excl. of CO2from biomass and international transportCO2emissions, excl. of CO2frominternational transportGDPCO2emissions from the Danish economy
Decoupling
It is also evident from Figure 11 that there has been a decoupling between economicgrowth and CO2-emissions. From 1990 to 2007, Denmark experienced a period ofconsiderable economic growth with GDP at constant prices rising by 40 percent.While the total CO2emissions, including the emissions from international transportactivities rose even more, economic growth and CO2emissions are no longer linkedtogether for most of the Danish industries. If emissions from international transportare excluded from the totals, the increase in CO2emissions was only 8 percent from1990 to 2007, i.e. much lower than the economic growth. And if also emissions frombiomass are excluded on the grounds that they are neutral to the greenhouse effect,emissions show a 4 percent decrease over the period. Thus, there is a clear andincreasing gap between economic growth and the CO2emissions when internationaltransport is excluded.However, the international transport is an increasingly important part of the Danisheconomy in terms of contribution to the gross national product. In the economicaccounts, gross value added and exports, etc. prompted by international transport areconsidered in line with value added and exports, etc. from any other industries. Aconsistent inclusion of the associated emissions leads to an increase in total Danishemissions of CO2by more than 60 percent since 1990. It means that when alleconomic activities are considered there is, in actual fact, no apparent decoupling andno evidence that the Danish economy was on the downward slope of theEnvironmental Kuznets Curve in the period 1990 to 2007.But decoupling can be observed in most Danish industries at a more disaggregatedlevel, and the increasing gap between GDP and emissions, once internationaltransport is excluded, indicates that decoupling is certainly present in many singleindustries.Different factors lay behind the decoupling for many industries: Danish industrieshave become more effective when energy is used, and energy products with loweremissions per unit of energy used are chosen by the industries. In addition, a relativelarger share of service activities contributes to cutting the link between economicgrowth and CO2emissions once international transport is excluded. Service industriesare normally less polluting per unit of production than manufacturing industries.However, it should be observed that shipping is one of the largest service industries inDenmark, and although transport by sea is an effective form of transportation it stillhas high emissions per unit of output.
No evidence of EKC ordecoupling wheninternational transport isincluded
Decoupling is found inmost single industries
Increased energyefficiency, cleaner energyand structural changessave CO2emissions
21Factors underlying thedecoupling
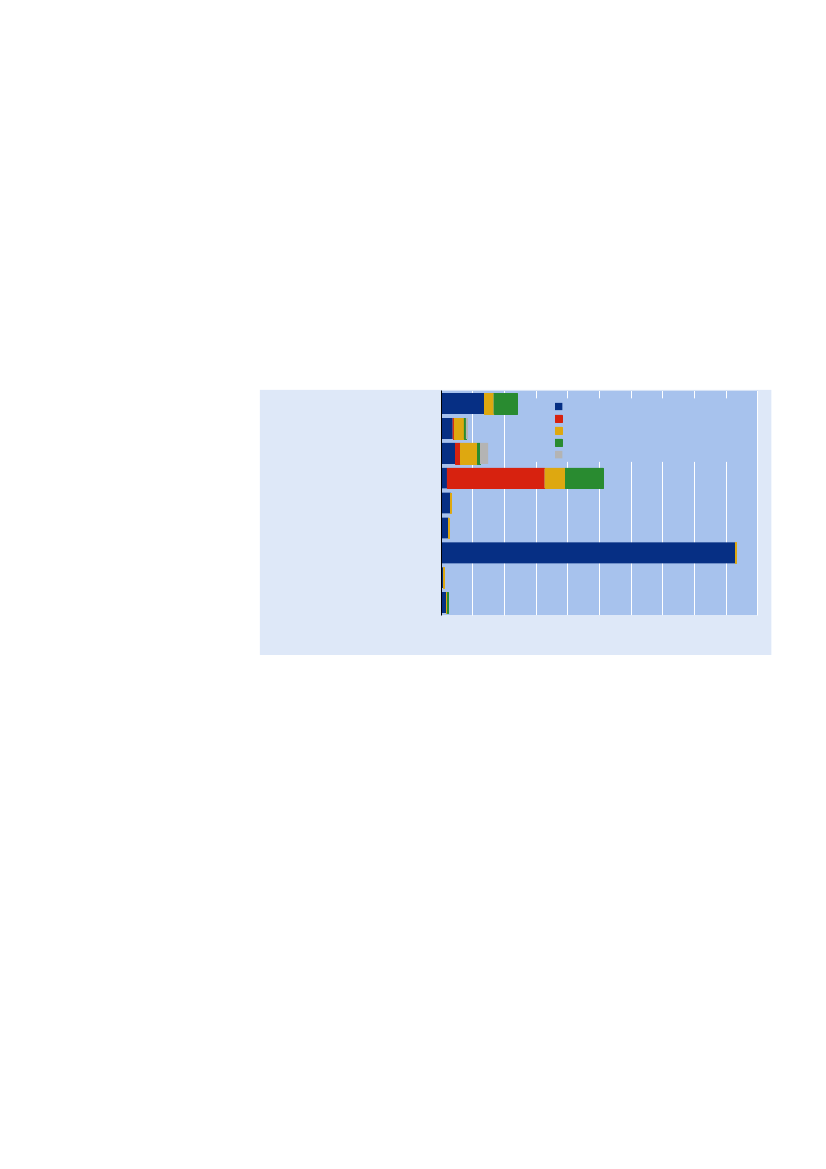
In the following, it is quantified how much these factors have contributed to keepingoverall emissions of CO2lower than indicated by the scale factor during the periodfrom 1990 – 2007. Model calculations make it possible to assess how great an effectthe better energy effectiveness and transfer to other forms of energy has had onemissions. At the same time, the effect of the structural changes in the economy, e.g.the relative growth in the service industries is quantified.The actual emissions from industries fell by 0.7 million tonnes between 1990 and2007 when emissions from international transport and biomass are excluded. Theupper bar in Figure 12 represents this development, while the other bars quantify thefactors responsible for this development.Changes in energy - related CO2emissions from Danish industries from 1990 to 2007
Fall in CO2emissionsdivided into underlyingfactors
Figure 12
- 0,7Calculated effect of economicgrowth on CO2-emissions
Actual change in emissions from 1990 to 2007
+ 22.6Calculated effect of structural changeson CO2-emissionsCalculated effect of changes in energyefficiency on CO2-emissionsCalculated effect of shifting to other types ofenergy on CO2-emissions0510152025
- 11.5
- 4.2
- 7.6-15-10-5
Million tonnes CO2
Emissions are calculated omitting emissions from international transport and burning of biomass.
Economic growthincreases emissions
The scale effect is presented by the second bar from the top. It shows that if CO2emissions had simply followed the development in production and consumption from1990 to 2007, Danish emissions would have been 22.6 million higher in 2007.Due to structural changes between 1990 and 2007, both production and consumptionhave gradually been reorganised in a less CO2intensive way. The service industryshare is now relatively larger, and this tends to pull in the opposite direction of thescale effect when international transport is excluded. At the same time, imports haveincreased when compared with domestic production, and this also offsets part of thescale effect. The result of the structural changes is a decrease of CO2emissions of 11.5million tonnes.One possible explanation of the decrease in emissions due to structural changes and,more generally, the downward slope of the Environmental Kuznets Curve is that thepolluting industries are moving to developing countries, while traditional industrialproduction is substituted for service and knowledge based production in thedeveloped countries. Thus, by letting other countries take over the dirtiest part ofproduction and importing the goods afterwards the total emissions will not decline. Itwill just be shifted from the developed countries to the less developed countries (cf.Stern (2003). The extent to which Denmark is shifting emissions to other countries isanalysed in Chapter 5.
Structural changesin the economy
Improved energyeffectiveness
The industries also used energy more efficiently in 2007 than was the case in 1990.The same production could therefore be achieved with less energy consumption thanpreviously. It has been calculated that this effectively reduced emissions by 4.2million tonnes in 2007. It is important to note that energy effectiveness here ismeasured in relation to the economic result of the industries. This can differ from
22technical energy effectiveness, e.g. energy consumption for each item produced, oreach kilometre driven.Changes tonew forms of energy
During the period from 1990 to 2007, the industries have gradually changed theirenergy consumption towards cleaner forms of energy. Firstly there has been a shiftaway from oil and coal towards natural gas and wind energy, as well as the use of bio-fuels such as wooden pellets and hay. According to the model calculations, changes inthe composition of energy consumption between 1990 and 2007 altogether saved theatmosphere from an emission of 7.6 million tonnes CO2. Included in thesecalculations is the assumption that bio-fuels are neutral in relation to the greenhouseeffect, implying that an increased use of bio-fuels has contributed to lower emission.
23
5. Production or consumption approach to measuringCO2emissionsProduction andconsumption in nationalaccounts
An important distinction in national accounts is the one between production on theone side and final demand, e.g. consumption by households and government,exports, investments (capital formation), etc., on the other side. Thus, the totalamount of goods and services produced domestically by the economy in question(output) can be looked at from two angles: It has been produced by a variety ofindustries, and it is being used by different final users either as consumption (privateor government), for capital formation or export.Emissions are generated primarily in the production processes by burning fossil fuels.Consequently, in an accounting framework it is obvious to ascribe the emissions tothe production processes that created it. However, if there were no consumersdemanding the goods and services produced, they would never be produced, andthere would be no emissions. Therefore, it is almost just as obvious in an accountingframework to ascribe all emissions to categories of final demand that are responsiblefor them in the end.
AnalyticalpossibilitiesFigure 13
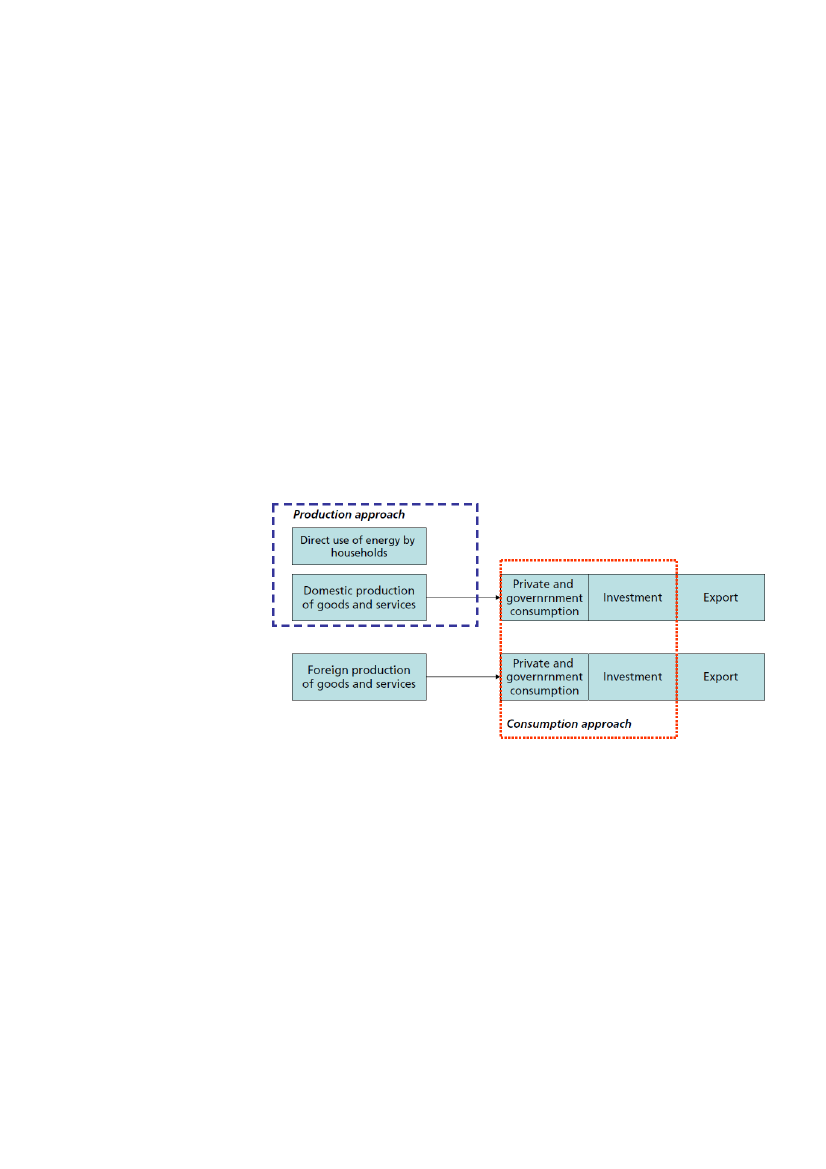
Figure 13 presents the differences and the connections between the two approachesfor accounting for the emissions.Production and consumption approaches to emission accounting
Productionapproach
The most common approach to measuring emissions is the production approach. Thisis the approach, on which the presentation in the previous parts of this publicationrelies. Emissions are measured by the industries and households that actuallygenerate them. This is a pure statistical measurement that involves observation ofenergy consumption by industries and the use of emission coefficients to calculate thecorresponding emissions. For households it is also a statistical measurement of thedirect emissions related to the direct energy consumption among these heating fromburning of fossil fuels and gasoline and diesel for private cars.The production approach records emissions according to where they actually takeplace irrespective of whether the intended use of the products is destined forintermediate consumption in other industries or for any kind of final demand. Thescope of emissions according to the production approach is indicated by the bluedotted line in Figure 13.
Consumptionapproach
The emissions generated on the production side can be completely mirrored on thefinal demand side by applying the so-called consumption approach. This, however,requires the use of an input-output model to ascribe all the emissions from theproduction approach to exactly the categories of final demand that are “responsible”
24for them. One example is emissions from electrical power and district heating used byindustries and households. According to the production approach, these are recordedas emissions from the power plants. At the same time, there are no emissionsrecorded from the use of electricity and district heating by final demand categories(i.e. households). However, an input-output model is capable of reallocating theemissions from electricity measured on the production side to every single item offinal demand that is ultimately responsible for them. The main focus of theconsumption approach is emissions generated by the demand of products andservices within the red dotted line in Figure 13. From this demand, the productionactivities by industries and corresponding emissions are traced. A complete tracing ofall emissions related to the final demand includes also an estimation of emissionstaking place abroad as a result of imports.Input-output model
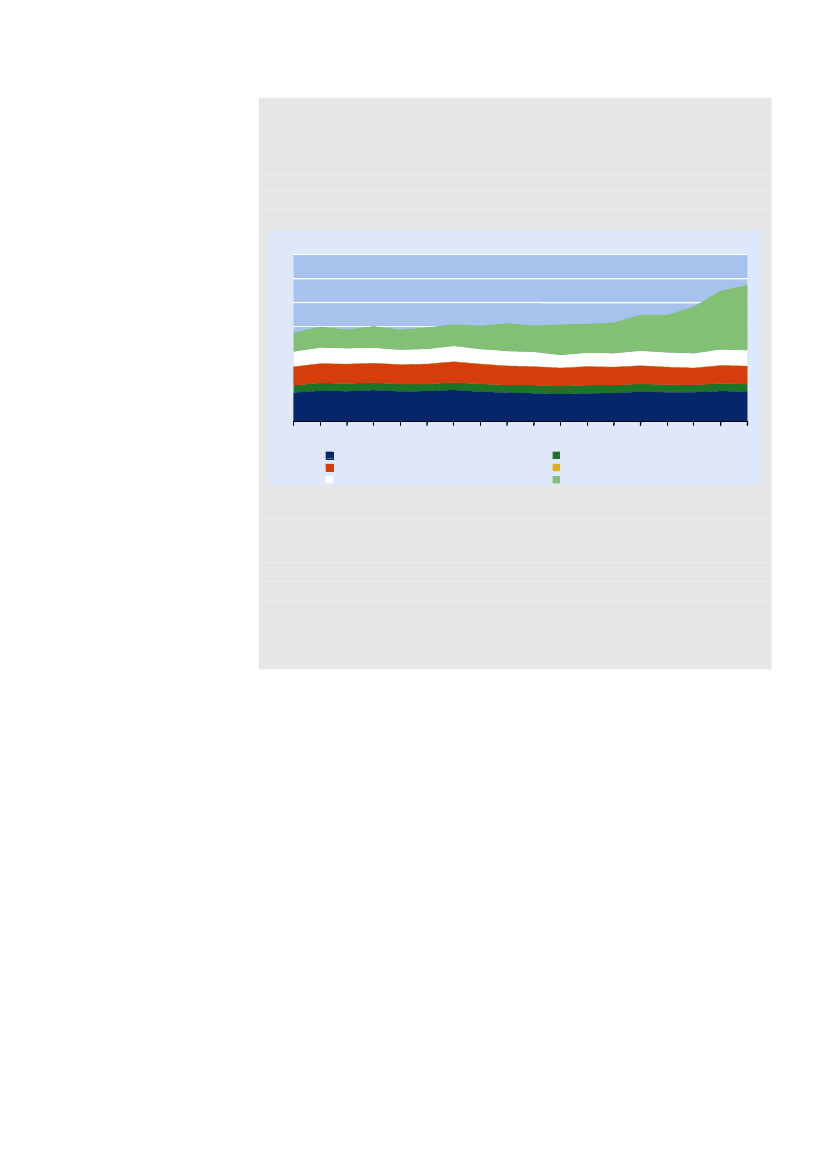
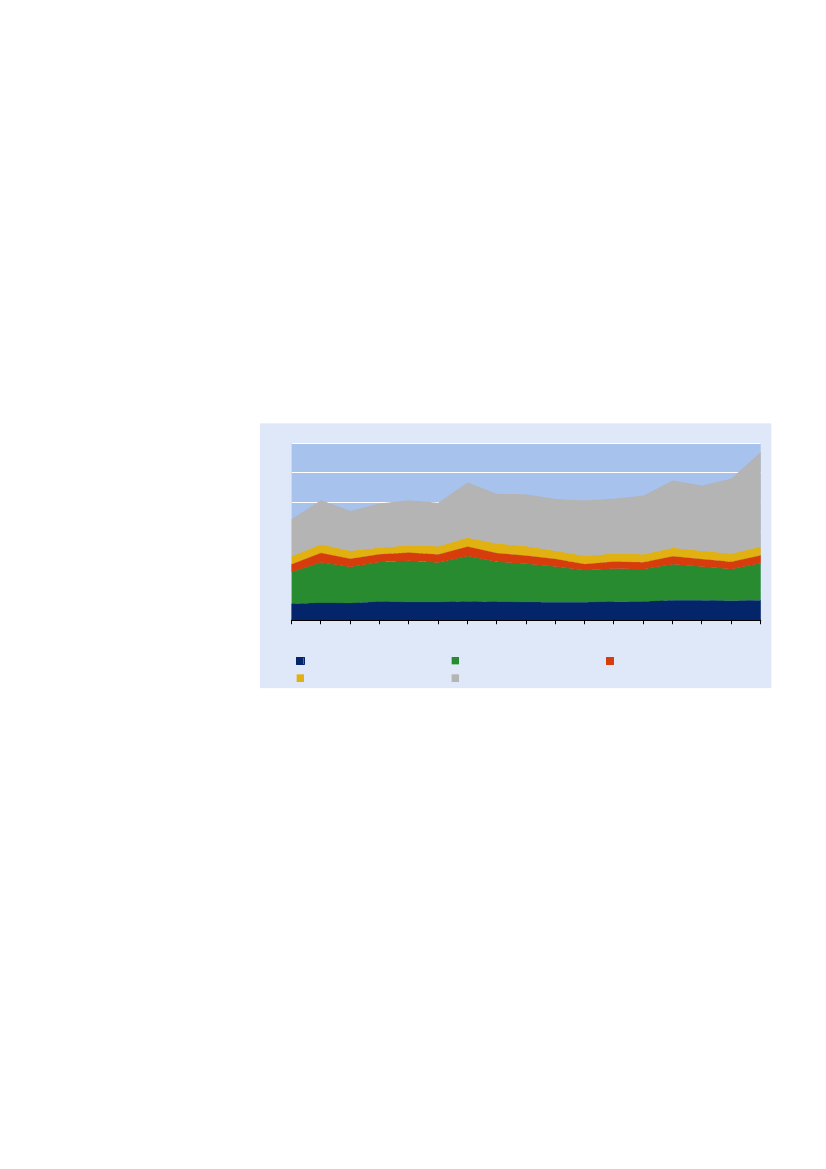
The model used for reallocating the emissions from the production approach to theconsumption approach is a so-called input-output model. It is a mathematicalextension of the detailed input-output tables that are compiled and published on anannual basis by Statistics Denmark. These tables give a very detailed picture of inter-industry deliveries of goods and services as well as deliveries to final demand.CO2emissions by Danish industries indirectly caused by various types of final demand1201008060402001990 1991 1992 1993 1994 1995 1996 1997 1998 1999 2000 2001 2002 2003 2004 2005 2006Private consumption, directGross fixed capital formation etc.Private consumption, indirectExportsGovernment consumptionMillion tonnes CO2
Figure 14
Private consumptionand export carrythe greatest burden
Model calculations carried out on the basis of data for the period 1990 to 2006 showsthat the Danish CO2emissions are primarily created by the private consumption andexports. Together, these two forms of demand make up 90 percent of total CO2emissions.On the other hand, demand by government consumption and investments (fixedcapital formation) in buildings, machinery and transport equipment etc. onlycontributes 10 percent of total CO2emissions, more or less equally spread betweenthese two groups.
Export hasincreasing importance
The importance of exports has been increasing. In 1990, exports were responsible for37 percent of total emissions, rising to 56 percent in 2006. The growing importanceof exports during this period is, in part, connected with the increase in Danishshipping, which is demanded by companies abroad and therefore linked to exports.In 2006, private consumption was responsible for almost 39 million tonnes of DanishCO2-emissions. Of this, a little more than one third - 14 million tonnes – as shown inChapter 3, was related to the households’ use of fuel for heating, etc., as well as petroland diesel for cars. About two thirds - 25 million tonnes - was indirect emissions inDanish industries as a consequence of the production necessary in order to meet thedemands of the consumers.
Private consumption
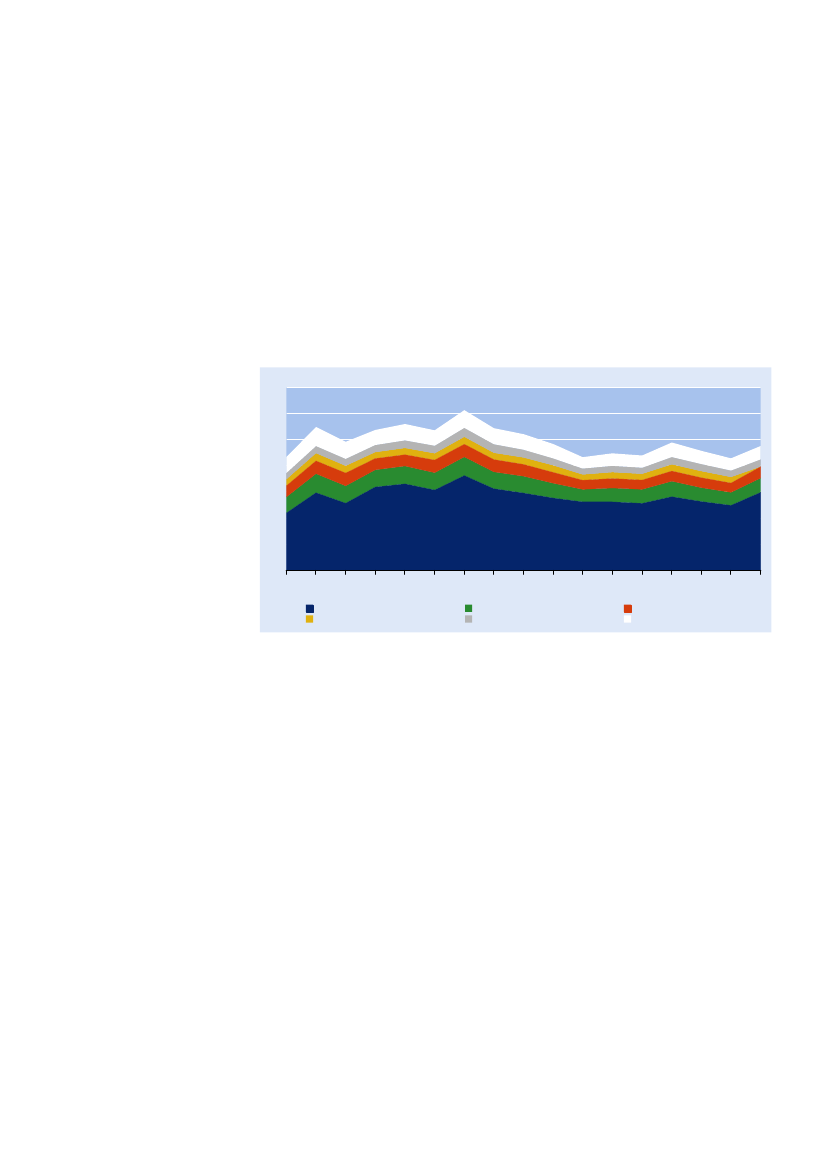
25Private consumption,indirect CO2emissions
The emissions created by private consumption by industries in Denmark are veryclosely related to households’ energy consumption. Consumption of electricity anddistrict heating does not involve direct CO2emissions, but when coal, oil, or naturalgas is used by power stations, CO2is indirectly emitted.Besides the use of electricity and district heating, households’ consumption of food,restaurant visits, private and public transport and housing prompts CO2emissions inDanish industries. Housing includes maintenance of buildings, administration, refusedisposal, water supply and sewage treatment.The relative significance of the individual consumer categories for emissions has beenmore or less stable since 1990 although emissions from electricity generation havebeen heavier in certain years. This is due to a great deal of electricity export in thoseyears, which made it necessary to bring in older and less CO2effective power stations.
Figure 15
CO2emissions by Danish industries indirectly caused by various types of privateconsumption353025201510501990 1991 1992 1993 1994 1995 1996 1997 1998 1999 2000 2001 2002 2003 2004 2005 2006Electricity, gas and other fuelsHousingFoodRecreation and cultureTransportOther private consumptionMillion tonnes CO2
What is the responsibilityof domestic final demand?
In an economy like the Danish, a lot of imported products are used in production andimports are used directly by households and other final demand categories as well.At the same time Denmark has a very large export sector. Some of the goods andservices imported have been produced in countries similar to Denmark in terms ofenergy efficiency and energy supply, but some come from economies that are verydifferent with various patterns of emissions. Normally, these foreign emissions areregistered by the countries where the products are produced, despite the fact thatDanish final consumption is actually responsible for this. The duality of this is that allDanish emissions, which are generated when Danish exports are produced, areaccounted for in the Danish emissions accounts and not in the accounts of thecountries demanding the Danish export goods.It is difficult to know precisely how great an emission Danish final demand causes inother countries, although model calculations with an input-output model can give anindication. The model is the same as in the previous calculation, except that theimported part of intermediate consumption and final demand is now added to thedomestically produced part. Emissions calculated with this model are “global” in thesense that they cover effects of Danish final demand in all countries. The calculationsshow how great direct and indirect emissions from Danish industries would be if allgoods and services used by the Danish Economy were produced in Denmark, i.e. ifalso all the imported goods and services were to be produced in Denmark, instead ofbeing imported. Thus, in this calculation it is assumed that Danish and foreigncompanies produce in more or less the same way and with the same CO2emission perproduced unit. In certain instances, the calculations will overestimate the foreign
Model calculations cangive an indication
26emissions, for instance, in the case of the import of hydro-power based electricity. Inother instances, calculations will underestimate the emissions, for example theimport of consumer goods from countries where energy effectiveness is generallylower than in Denmark, or where fuel causing greater emissions is used.Almost 11 million tonnesCO2abroad as aconsequence ofprivate consumption
If we start with the private consumption part of the consumption approachcalculations alone, results show that Danish private consumption through importresulted in a foreign CO2emission of 9 million tonnes in 2006 (Figure 16) In otherwords, emissions that were caused in other countries as a consequence of Danishprivate consumption, correspond to around 28 percent of the direct and indirectemissions from domestic consumption.Total direct and indirect CO2emissions from private consumption60504030201001990 1991 1992 1993 1994 1995 1996 1997 1998 1999 2000 2001 2002 2003 2004 2005 2006Direct Danish CO2 emissionsIndirect Danish CO2 emissionsIndirect CO2 emissions abroadMillion tonnes CO2
Figure 16
How to get fromproduction based toconsumption based?
However, it is not only Danish private consumption that results in emissions in othercountries. Emissions are also prompted abroad as a result of imports to Denmark dueto public consumption, exports and investments, etc. (capital formation, etc.) Inorder to shed light on these emissions and to the overall emissions according to theconsumption approach a consistent adjustment for emissions embedded in importsand exports are presented in Table 2.The first column shows the direct CO2emissions by Danish industries and households.This is the pure production approach where emissions generated by Danishproduction and households are recorded according to where they occur.This column is a listing of the emissions from international transport, i.e. thebunkering of Danish operated ships and planes outside Denmark. The numbers areneeded for adjustments in other rows.The third column displays direct CO2emissions by Danish industries and householdsexcluding international transport (bunkering abroad by Danish ships and planes).This column shows the total direct and indirect global emissions of CO2caused byDanish final demand. Thus, these numbers include emissions in other countries thatare generated producing the import goods required by Danish final demand. It alsoincludes emissions in Denmark tied to export on behalf of economies in othercountries. Emissions abroad are measured under the assumption that the importgoods have been produced with the exact same technology as if they had beenproduced in Denmark.This column shows the total direct and indirect global emissions of CO2caused byDanish exports. Thus, these numbers include emissions in other countries that aregenerated producing the import goods required for the production of Danish export
Column (1)
Column (2)
Column (3)
Column (4)
Column (5)
27goods. It also includes emissions in Denmark tied to this production. Emissionsabroad are measured under the assumption that the import goods have beenproduced with the exact same technology as if they had been produced in Denmark.
Table 2.
Danish CO2emissions under the production and consumption approachProduction based methodConsumption based methodExcessExcessemissions inemissions inproductionproductionapproach over approach excl.consumption bunkering overapproachconsumptionapproach(7)=(1)-(6)14 16819 20716 62820 21119 35517 10023 75019 72320 32322 78925 37225 02127 65134 10731 02937 01547 565(8)=(3)-(6)4 7207 7627 0848 1619 0075 72712 6057 3743 6236 8265 9066 9027 1509 9285 2183 0964 056
Direct CO2- Emissions fromDirect CO2-Direct andDirect andDirect andemissions bybunkeringemissions by indirect global indirect global indirect globalDanishabroad byDanish CO2- emissions CO2- emissions CO2- emissionsindustries andDanish ships industries andcaused bycaused bycaused byhouseholdsand planes households excl.Danish final Danish export Danish domesticemissions fromdemandfinal demandbunkering(1)1990199119921993199419951996199719981999200020012002200320042005200668 41981 46274 05979 19981 29279 60393 36885 55585 36982 17181 15982 46084 52994 69691 19896 007113 892(2)9 44811 4469 54412 05010 34811 37311 14512 34916 70015 96319 46618 11920 50124 17825 81133 92043 509(3)=(1)-(2)58 97070 01664 51567 14970 94568 23082 22373 20668 66966 20861 69364 34164 02870 51865 38762 08770 383(4)1 000 tonnes
(5)36 86044 47740 44142 88944 07542 92152 57747 47449 85549 85052 43353 13857 08462 35860 98968 77787 954
(6)=(4)-(5)54 25162 25557 43158 98761 93862 50369 61865 83265 04659 38255 78757 43956 87860 58960 16958 99166 327
91 110106 73297 872101 876106 012105 424122 195113 306114 902109 232108 220110 577113 962122 947121 159127 768154 281
Column (6)
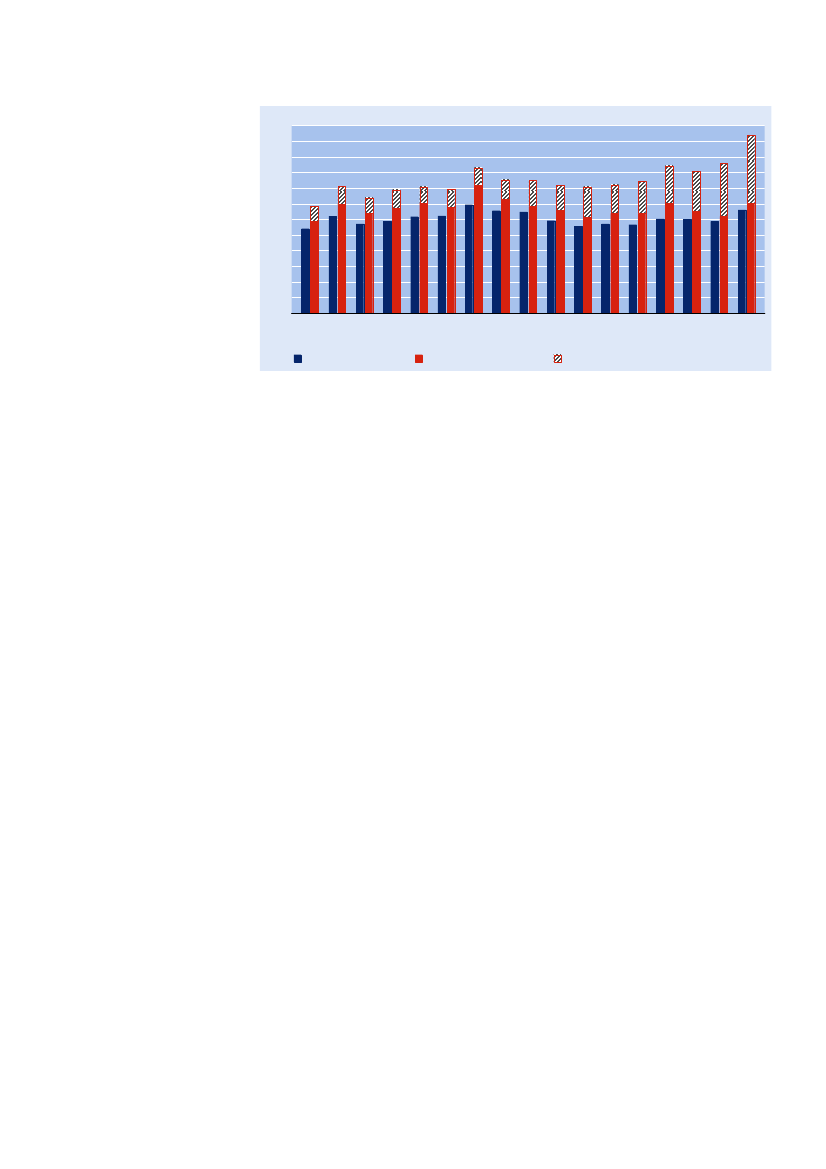
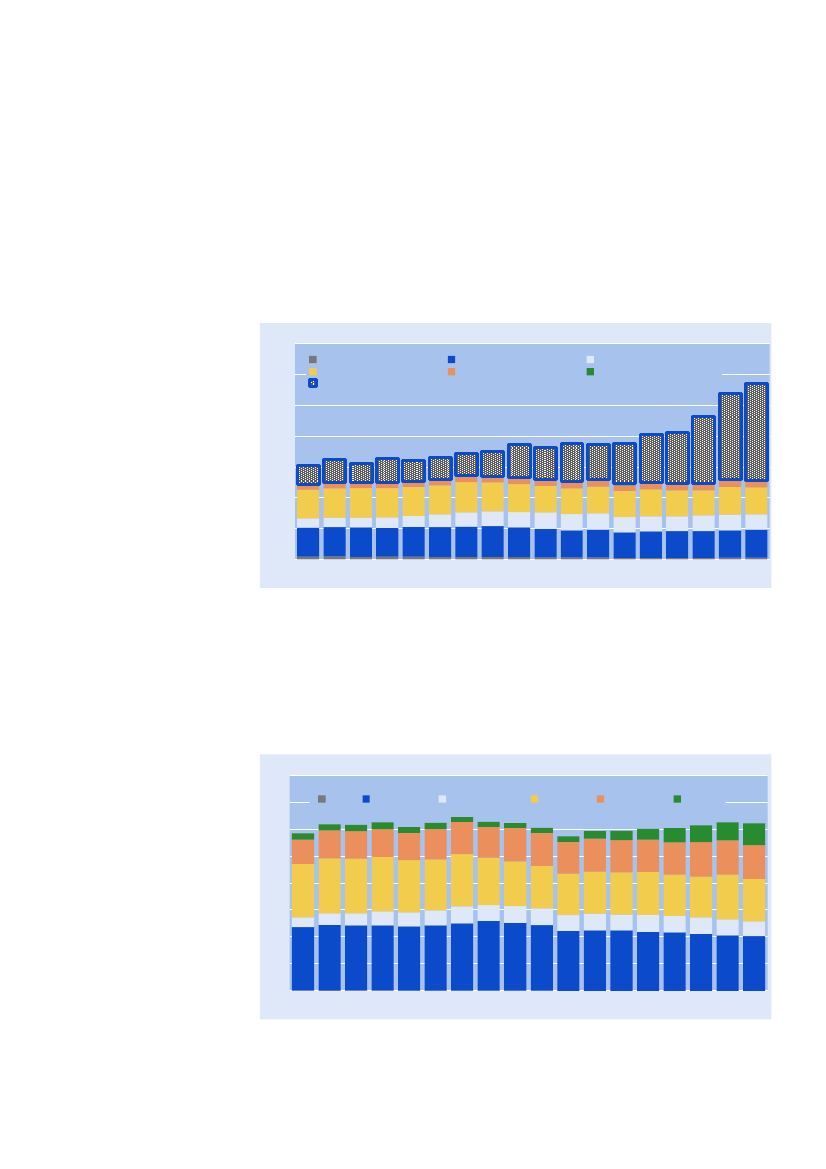
This column shows the total direct and indirect global emissions of CO2caused bydomestic Danish final demand i.e. private and government consumption as well asinvestment. All global emissions related to Danish export are excluded. This is theconsumption based measure of Danish emissions. In this case “consumption” is abroad concept meaning private and government consumption as well as investmenti.e. final demand minus export. The numbers are calculated by subtracting column(3) from column (2). What is left then is all emissions in Denmark and abroad relatedto Danish consumption in the broad sense.This column shows the emissions accounted for under the production approachincluding emissions related to bunkering abroad by Danish operated ships and planesminus the emissions accounted for under the consumption approach.The last column shows the emissions accounted for under the production approachexcluding emissions related to bunkering abroad by Danish operated ships and planesminus the emissions accounted for under the consumption approach.Figure 17 summarises the data from Table 2, and shows the difference betweenemissions according to the production approach and the consumption approach.Danish CO2-emissions from 1990 to 2006 according to the consumption approach arelower than emissions according to the production approach, no matter if emissionsfrom bunkering are included or not. In other words, Denmark emits more CO2onbehalf of other countries than other countries emit on behalf of Denmark.
Column (7)
Column (8)
Denmark emits more onbehalf of other countriesthan they emit of behalfof Denmark
28Figure 17
Production and consumption based measures of Danish CO2emissions1201101009080706050403020100Million tonnes CO2
1990 1991 1992 1993 1994 1995 1996 1997 1998 1999 2000 2001 2002 2003 2004 2005 2006Consumption basedProduction based, otherProduction based, international transport
Consequences ofincreasing world trade
At the same time it shows that over the last years there is a tendency that the gapbetween emissions measured by the consumption approach and emissions measuredby the production approach is gradually closing when international transport isexcluded. It is an evidence of the still increasing world trade. Thus, the share ofimported input in Danish industries compared to domestically produced input isincreasing.At the same time the gap between emissions based on the consumption approach andemissions based on the production approach is increasing over time wheninternational transport is included. It is an evidence of the still increasing share thatthe shipping industry constitutes of the total production and emissions by Danishindustries.
Consequences ofincreasing activity in theDanish shipping industry
29
6. The UN Climate Convention and the Kyoto ProtocolThe UN ClimateConventionand the Kyoto Protocol
Since 1992, in the attempt to reduce global warming and alleviate the effects of theincrease in global temperature, 192 countries have joined the UN Climate Convention(United Nations Framework Convention on Climate Change, UNFCCC). Furthermore,since 1997, 18 countries have joined the Kyoto Protocol. One of the requirements ofthe Protocol is that 41 industrialised countries (Annex 1 countries) altogether must inthe period from 2008 to 2012 bring down their annual emissions by 5.2 percentmeasured in relation to base emissions, which for most countries and types ofgreenhouse gases can be taken to be the emissions in 1990.In measuring the extent of individual countries emissions and how far they are fromthe target, the UNFCCC and the Kyoto Protocol uses the principles laid down by theIPCC (UN Climate Panel). As mentioned previously, the figures do not include allemissions, such as those from international transport.There is a significant difference in each country’s commitments to the protocol. The15 countries that were members of the EU in 1990 (including Denmark) mustaltogether cut 8 percent of their emissions, although this covers up the fact thatwithin the EU, various reduction agreements for individual countries exist. Denmarkis committed to reducing emissions by 21 percent in relation to 1990 and is thusamong those countries, which must carry out the largest reductions in theiremissions. Countries such as Canada and Japan must reduce their emissions by 6percent, while Australia is allowed to increase its emissions by 8 percent and Icelandby 10 percentWhether countries maintain their limitations for emissions as laid down by the KyotoProtocol for the period from 2008 to 2012 will not only be assessed on the basis ofemissions from energy production and consumption, industry and transport etc. Thenet emissions of greenhouse gases from land use changes will also be taken intoaccount. A country can, for example, by planting new forests to fulfil part of theirKyoto target. Conversely, the felling of a forest will increase requirements for furtherreduction.
Not all emissions areincluded in theKyoto Protocol
Reduction targets
Changes in Kyoto targetsthrough altered land useand Kyoto Mechanisms
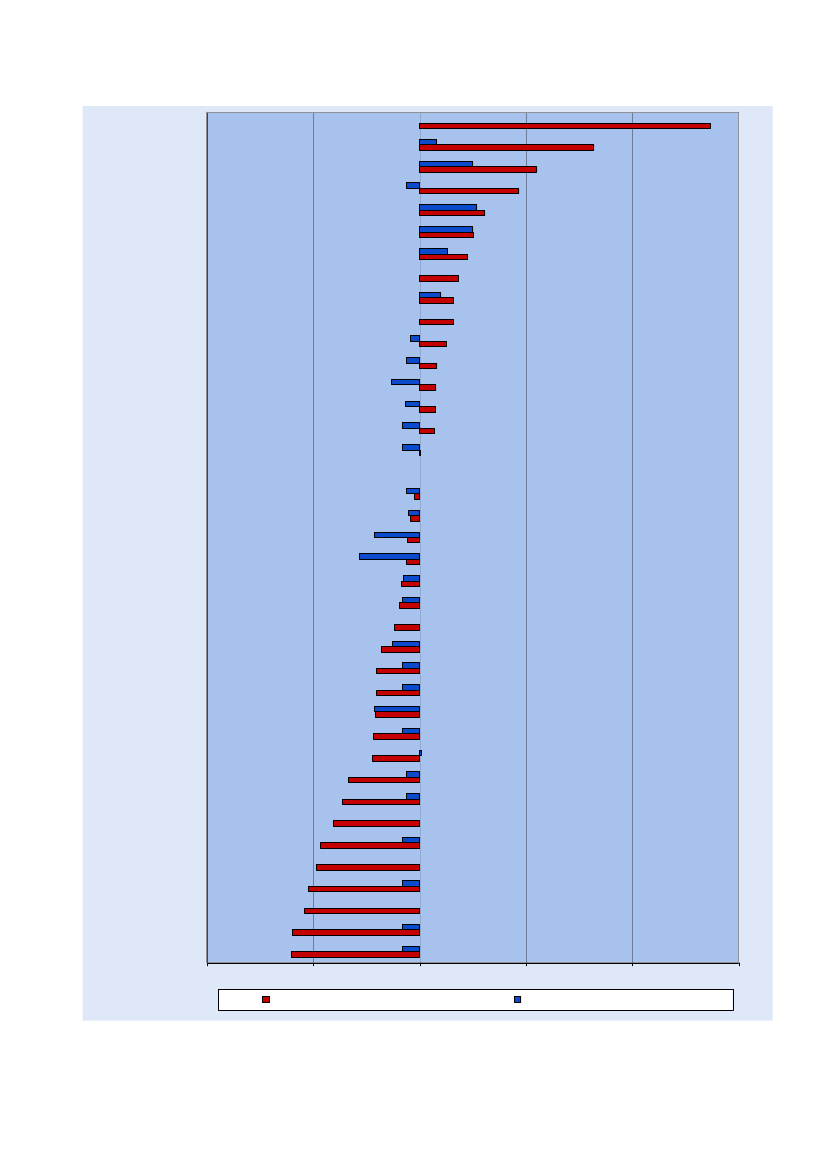
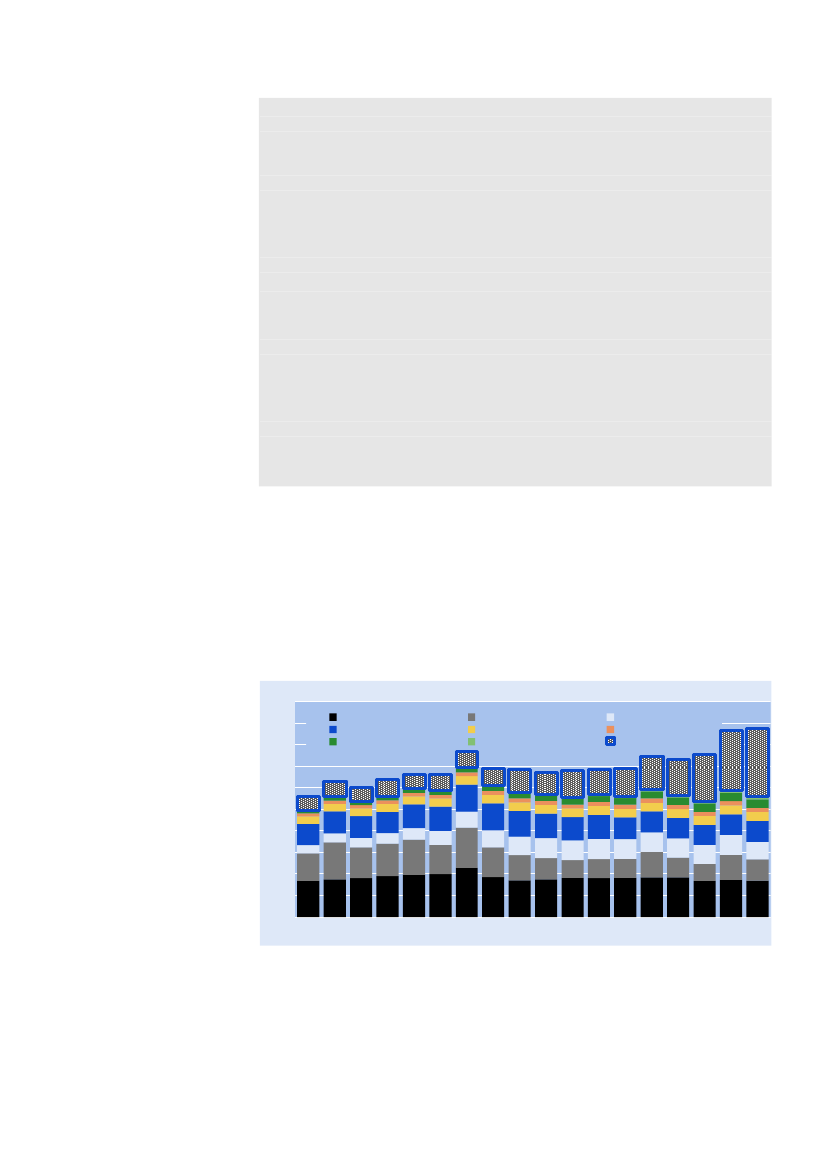
30Figure 18.Kyoto targets and development in emissions of greenhouse gases, 1990 - 2007TurkeyAustralia (8)Spain (25)Canada (-6)Portugal (27)Greece (25)Ireland (13)New Zealand (0)Iceland (10)United StatesSweden (-4)Japan (-6)Austria (-13)Italy (-6.5)Liechtenstein (-8)Switzerland (-8)Finland (0)Netherlands (-6)Croatia (-5)Denmark (-21)Luxembourg (-28)Belgium (-7.5)Monaco (-8)France (0)United Kingdom (-12.5)Slovenia (-8)Slovakia (-8)Germany (-21)Czech Republic (-8)Norway (1)Poland (-6)Hungary (-6)Russian Federation (0)Bulgaria (-8)BelarusRomania (-8)Ukraine (0)Lithuania (-8)Estonia (-8)-100-2,1-4,1-5,6-6,0-8,5-9,3-11,8-17,8-20,3-20,3-20,8-21,6-22,0-33,2-36,4-40,3-46,4-48,6-52,4-54,0-59,7-60,3-5005010015030,825,222,618,316,115,812,78,27,67,47,10,50,055,346,782,0136,7
Change 1990 to 2007, percent.
Kyoto target (percent in brackets)
Note: The numbers for the changes from 1990 to 2007 includes net-emissions from land use changes, etc. (LULUCF)Please notice that Latvia has been left out of the figure due to an extreme value. Latvia’s Kyoto target is -8 percent the change however, is -478.3 percent.Source: UNFCCC, 2008 and http://unfccc.int/resource/docs/2009/sbi/eng/12.pdf.
31Development1990-2007
Figure 18 shows the development in the emission of greenhouse gases calculated andevaluated in accordance with the Kyoto Protocol. Account is taken for the netemissions, i.e. emissions less binding (removals by sinks) of CO2, related to land usechanges, including changes in the forest areas. The figure also shows the reductiontargets for the individual countries. There are no reduction targets for countries thatdo not have binding targets, for example, because they have not ratified the KyotoProtocol.On the evidence of the development in emissions between 1990 and 2007, manycountries are still some way off achieving their reduction targets and in particular thewestern industrialised countries, including Denmark. On the other hand, diminishingeconomic activity in countries such as the former Soviet Union has meant that manyof these countries have been able to reduce their emissions much further than theywere committed to under the Kyoto Protocol.Overall, the 41 industrialised countries (Annex 1 countries) reduced their emissionsby 3.9 percent before the net effect of emissions from land use changes, etc. is takeninto account. However, the inclusion of the net effect from land use changes, etc.gives a more positive evaluation of development. The reduction of the industrialisedcountries’ emissions from 1990 to 2007 will increase to 5.2 percent, when land usechanges, etc. is taken into consideration.Overall, Denmark’s emissions of greenhouse gases were somewhat lower in 2007,compared to 1990. In 2007, the Danish Kyoto-related emissions of greenhouse gaseswere 3.3 and 5.6 percent below the base year emissions before and after, respectivelyaccount is taken for the emissions and bindings due to land use changes.As well as the fact that by reducing emissions of greenhouse gases by planting newforests and other types of land changes, a country can fulfil its reduction targets forthe 2008 – 2012 period by using one of the three so-called Kyoto Mechanisms;Emissions trading (“emissions permits”), JI (Joint Implementation) and CDM (CleanDevelopment Mechanism).Annex 1 countries that have emissions below their Kyoto target are able to sell theiremissions permits to other Annex 1 countries. The permit system does not affect thetotal permitted emissions altogether, but makes it possible for a changed allocation ofreduction targets between countries.In addition to the permit-trading system under the Kyoto Protocol, the EU has inaddition introduced an emission trading scheme (ETS) in order to undertake theoverall EU settlement of emission. The EU ETS includes almost 12,000 energy-intensive businesses. As far as Denmark is concerned this means that during the 2008– 2012 period, approximately 380 businesses are included in the system. They areonly allowed an annual emission of 24 million tonnes of CO2in total. If emissionsfrom a permit-regulated business exceed the quantity allowed by the number ofpermits it has been assigned for free or has bought from other companies, then itmust in following year earn the missing permits and pay a fine of 100 Euro per tonneof emitted CO2.The maximum yearly emissions of 24 million tonnes CO2accounts for approximately55 percent of CO2emissions from industries in 2007 when emissions frominternational transport and biomass are excluded. In addition to energy supply,permits are primarily given to companies extracting oil and cement manufacturers,etc. See Figure 19.The Joint Implementation Mechanism (JI) is based on projects aimed at reducing orremoving emissions of greenhouse gases in Annex 1 countries. An Annex 1 countryinvesting in an approved project that reduce or remove emissions from anothercountry, earns a reduction credit which contributes to fulfilment of the investingcountry’s target. The host country receiving the foreign investment is not credited the
Big variationsamong countries
5.2 percent decrease inemissions fromindustrialised countriesunder the Kyoto Protocol
Denmark
Kyoto Mechanisms
Trading ofemissions permits
Denmark part of theEU trading system
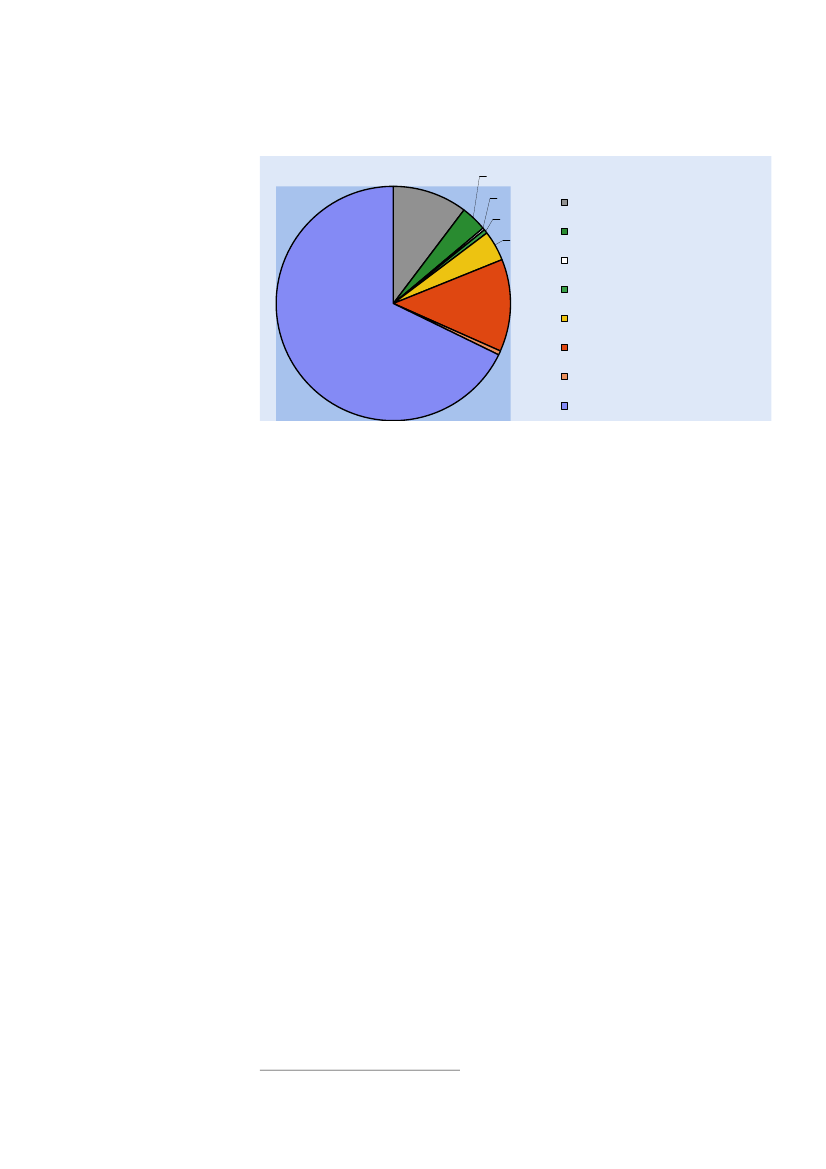
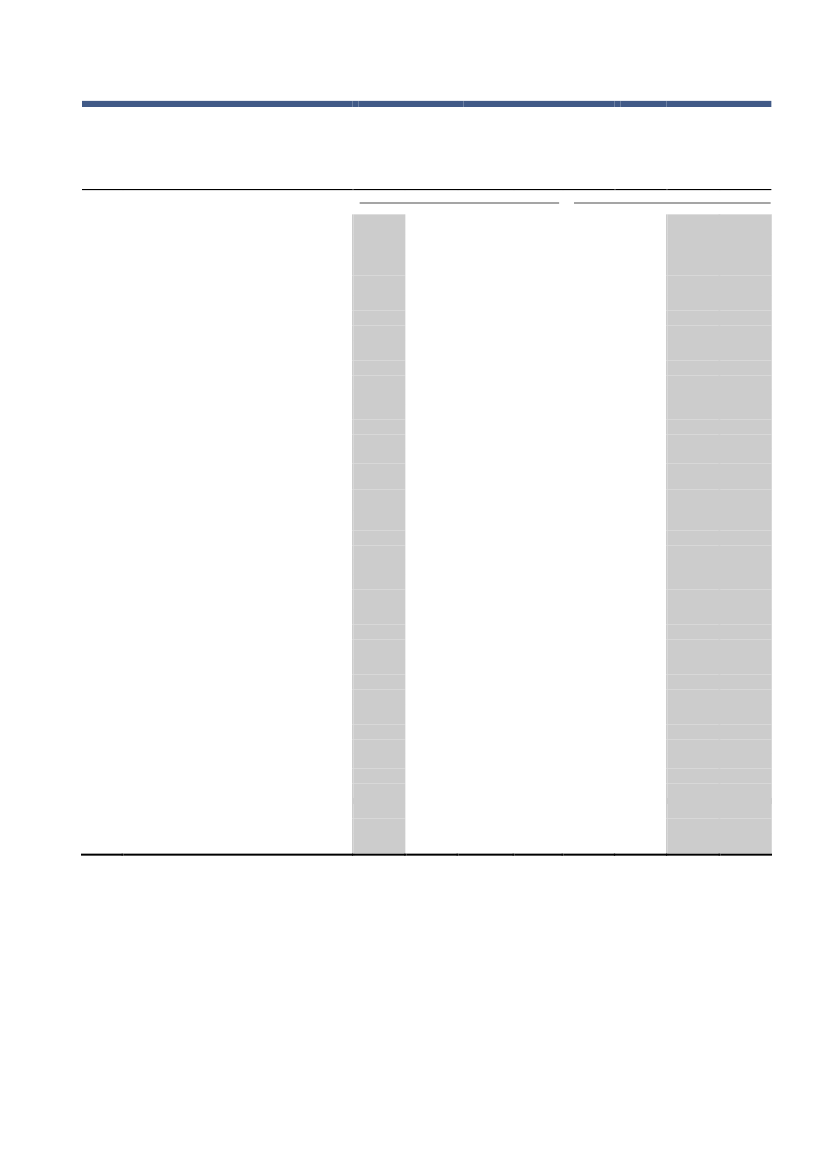
Half of the industrial CO2emissions are included inthe permit system
JI
32emission reduction, and the Annex 1 countries total reduction commitment is thusnot affected.Figure 19
Share of CO2permits among Danish businesses 2008Million CO2permits2,40,90,00,21,0Mfr. of food, beverages and tobaccoMfr. of textiles and leatherMfr. of wood products, printing and publ.Mining and quarrying
3,1Mfr. of chemicals, plastic products etc.Mfr. of other non-metallic mineral products
0,116,2Mfr. of basic metals and fabr. metal prod.Electricity, gas and water supply
Rep. One CO2permit gives permission to emit one ton of CO2
CDM
With the CDM (Clean Development Mechanism), Annex 1 countries can throughprojects in developing countries earn emission reduction credits if the projects resultin emission reductions or binding of greenhouse gases. Each credit, whichcorresponds to one tonne of CO2,, can be traded. By earning emission reductioncredits, industrialised countries can supplement their efforts to reduce emissions andthereby meet a part of their reduction commitment. In contrast to the EU ETS and theJI Mechanism, the CDM extends the total quantity of allowed emissions for Annex 1countries. From its inception in 2006, more than 1650 projects have been registeredand the UN Climate Secretariat expects that it will produce credits worth 2.9 billiontonnes CO2during the period 2008 - 20122. This can be compared with the fact thatthe total global emission of greenhouse gases in 2005 was approximately 48 billiontonnes (see figure 1).
2
Source: http://unfccc.int/kyoto_protocol/mechanismsclean_development_mechanism/items/2718.php.
33
ReferencesEuropean Commission, Joint Research Centre (JRC)/Netherlands EnvironmentalAssessment Agency (PBL). Emission Database for Global Atmospheric Research(EDGAR), release version 4.0. http://edgar.jrc.ec.europe.eu, 2009.European Commission (2009). Manual for Air Emissions Accounts. EurostatMethodologies and Working papers.IPCC/DMI, 2007/08: Climate changes 2007: Synthesis report, summary for decisionmakers. The Intergovernmental Panel on Climate, Fourth Assessment Report.Intergovernmental Panel on Climate. The report can be found in an electronicversion on www.dmi.dk and www.ipcc.chNielsen, O.-K., Lyck, E., Mikkelsen, M.H., Hoffmann, L., Gyldenkærne, S., Winther,M., Nielsen, M., Fauser, P., Thomsen, M., Plejdrup, M.S., Albrektsen, R., Hjelgaard,K., Vesterdal, L., Møller, I.S. & Baunbæk, L. 2009: Denmark’s National InventoryReport 2009. Emission Inventories 1990-2007 - Submitted under the UnitedNations Framework Convention on Climate Change. National EnvironmentalResearch Institute, Aarhus University. 826 pp. – NERI Technical Report. No 724.http://www.dmu.dk/Pub/FR724.pdfStatistics Denmark (2008). Energy Accounts for Denmark 2007. StatisticalInformation, Environment and Energy. 2008:5. Statistics Denmark, 24. November2008. Publication in the Danish language.Statistics Denmark (2009). Environmental Account for Denmark 2007. StatisticalInformation, Environment and Energy. 2009:1. Statistics Denmark, 28. April 2009.Publication in the Danish language.Statistics Denmark (2009). Danish Input-Output Tables and Analyses 2007-Employment, Imports and Environment.Statistics Denmark (2009). National Accounts 2003-2008, November version.Statistical Information, National Accounts and Balance of Payments. 2009:15.Statistics Denmark, 9. November 2009. Publication in the Danish language.Stern, Sir Nick: Stern Review: The Economics of Climate Change. United Kingdom’sEconomics and Finance Ministry (2006).The Danish Ministry of Economic and Business Affairs (2008): Vækst, Klima ogKonkurrenceevne. Publication in the Danish language.UNFCCC 2008: National greenhouse gas inventory data for the period 1990-2006.UNFCCC Subsidiary Body for Implementation, Twenty-ninth session. Poznan 1-10December 2008 (FCCC/SBI/2008/12, 17 November 2008)United Nations et al. (2003): Integrated Environmental and Economic Accounting2003.World Commission on Environment and Development (1987):Our Common Future(also known as the Brundtland report).
34
Annex 1
Methodology
A.1 Environmental Accounting Principles
SEEA 2003The basic principles on environmental accounting are embodied in the handbookIntegrated Environmental and Economic Accounting 2003(United Nationset al.,2003), commonly referred to as SEEA 2003.The SEEA 2003 is a satellite system of the System of National Accounts (SNA), whichis the standard system for organizing economic information. It is from the SNA thateconomic indicators, similar to the gross domestic product (GDP), are derived. As asatellite system the SEEA 2003 has a similar structure to the SNA and shares commondefinitions and classifications.The SEEA 2003 describes the interaction between the economy and the environmentand covers the whole spectrum of natural resources and the environment. It providesa set of definitions, classifications, statistical accounts and tables to analyse theinteractions between the economy and the environment. It also enables to analyzelinks between different environmental domains (e.g. energy, pollution, land, water,etc).The structure of SEEA 2003The SEEA 2003 comprises four types of accounts. The first category of account comprises physical flowand hybrid flow accounts. Physical flow accounts describe the flows of natural resources from theenvironment to the economy, within the economy and back to the environment. Energy accounts and airemissions accounts are part of this category. Hybrid flow accounts link the physical flow accounts withthe standard SNA accounts in monetary terms. They are called “hybrid” because they entail accountsexpressed in different units – i.e. monetary and physical quantity (SEEA 2003, Chapters 3 and 4).The second category of accounts comprises accounts for economic activities and products related to theenvironment and environmental transactions. Accounts in this category explicitly identify thoseeconomic transactions related to the environment such as environmental protection activities (SEEA2003, Chapter 5), accounts for environmental taxes and subsidies and other economic instruments e.g.permits and licences (SEEA 2003, Chapter 6). In the case of energy, the latter category of accounts isparticularly relevant and includes, for example, the cost of extraction, production and distribution ofenergy products, fees paid by the users for the energy products and permits paid by companies toextract mineral and energy resources.The third category comprises asset accounts in physical and monetary terms (SEEA 2003, Chapter 7).Chapter 8 shows how the considerations in chapter 7 can be applied for specific resources, e.g. mineraland energy resources. These accounts describe, in physical and monetary terms, stocks at the beginningand end of the accounting period and changes therein due to natural causes and human intervention(e.g. extraction, discoveries, changes in prices, etc.).The fourth category covers the valuation techniques for measuring environmental depletion of naturalresources, as well as degradation of natural assets (SEEA 2003, Chapter 9). Further, it addresses ways toadjust standard national accounts aggregates (GDP, savings), for depletion and degradation (SEEA2003, Chapter 10).The last chapter of the SEEA 2003 illustrates examples of policy applications of environmental-economicaccounts through country case studies (SEEA 2003, Chapter 11).Source: http://unstats.un.org/unsd/envaccounting/seea.asp
System ofNational Accounts
Interaction betweeneconomy and environment
35Residence principle
Since environmental accounts follow the principles of the System of NationalAccounts, the concepts of resident units and centre of economic interest are used todefine the boundaries and to decide which activities should be included or excludedin the accounts. Using these concepts to define the boundary is different from thepractice normally used in energy and environmental statistics, for instance in theregular energy statistics and energy balances reported to the International EnergyAgency (IEA) and the emission inventory reported to UNFCCC.Resident units of a country are defined as institutional units with residence in theeconomic territory of the country, i.e. those institutional units, which has thestrongest connection (its centre of predominant economic interest) to the economicterritory of the country. The economic territory includes land area, airspace,territorial waters, and territorial enclaves in the rest of the world (e.g. embassies,consulates, military bases, and scientific stations).The use of the resident principle guarantees that the total air emissions can bejuxtaposed consistently with macroeconomic and sectoral aggregates such as grossdomestic product and value added. This is also essential for the correct calculation of,for instance, emissions intensities defined as air emissions by industry over valueadded.Another difference between the emissions accounts and the inventories concerns howactivities are classified. The UNFCCC emissions inventories are, for instance, based ona reporting format presenting the air emissions by sectors at different levels(Agriculture, Forestry, Energy industries, Manufacturing industries, ChemicalIndustry, Metal Production, etc.). While the titles of some of these sectors and sub-sectors, may have similarities with the titles used in the classification used in theenvironmental accounts, it is important to note that the contents are not exactly thesame.Especially, when it comes to the transport, it should be noted that this category in theUNFCCC emissions inventories include all air emissions activated by transportactivities. In contrast, the air emissions accounts allocate air emissions from transportto all the industries and households to the extent that they carry out transportactivities on own-account. It implies that the air emissions of the transportationindustries do include only air emissions from part of the total transport activities.Thus, it is necessary to add all air emissions related to own-account transport fromthe other industries and the households in order to obtain the total transport relatedair emissions as defined by the air emissions accounts.Seehttp://unstats.un.org/unsd/envaccounting/default.aspfor further information on environmental accounts.
Resident units
Accounts ensuresconsistency
Classifications
Transport
Further information
36
A.2 Energy Accounts
Fossil fuels the majorcontributor toglobal warmingOn a global scale, more than two thirds of the global warming potential caused byhuman activity was in 2005 caused by the combustion of fossil fuels like coal, oilproducts and natural gas. Combustion of fossil fuels is also predominant in the Danishcontext even though energy sources like biomass and wind power in recent yearshave come to play a more important role.In order to be able to estimate the greenhouse gas emissions related to the use offossil fuels in the industries and the households, it is important to have informationon the consumption of energy broken down by energy types, industries andhouseholds. This is done in the energy accounts.At the most detailed level, the Danish energy accounts include information on thesupply and use of energy by the 130 industry classification used for the Danishnational accounts. Further, the detailed accounts include a breakdown by 40 differenttypes of energy.Table A.2 in Annex 2 contains aggregated information on every flow of energy relatedto Danish economic activities from the extraction of crude oil and natural gas to theconversion of primary energy into electricity and district heat as well as the use ofwind power and other renewable types of energy.The table shows the energy flows at physical units, tera joules (TJ). In addition, theDanish energy accounts include information on energy flows at various mass andvolume units (tonnes, cubic metres, etc.), and monetary information at various pricelevels (basic prices, trade margins, taxes and subsidies, VAT, and purchasers prices).The accounts also show so-called adjusted energy use figures as presented in the boxin Chapter 3.Danish energy accounts methodologyThe supply side of the energy accounts (production and imports) is based on Statistics Denmark’scommodity statistics and the external trade statistics, both of which are made up in physical as well asmonetary values.The use side of the energy accounts relies on information on the energy sector from the Danish EnergyAgency, Statistics Denmark’s censuses of the energy consumption in the manufacturing industries anddata on reimbursement of energy taxes as well as data on employment.The expenditures related to the bunkering abroad are included in the balance of payments together withother Danish expenditures abroad. The amount of fuel oil and jet petroleum bunkered by Danishoperated ships and planes have been estimated from the expenses and corresponding fuel oil and jetpetroleum prices obtained from the external trade statistics.
Detailed information inthe energy accounts
130 industries and40 types of energy
Flows of energy
Physical and monetaryinformation at variousmeasuring units
Use of energy relevantfor air emissions
When looking at the total flow of energy and the use of energy, it is important to beaware that it is the combustion of the primary energy like coal, natural gas and oilproducts that causes the greenhouse gas emissions. Combustion of biomass alsocauses emissions even though these emissions are often considered neutral in relationto the greenhouse effect. The use of electricity and district heat does not cause anydirect emissions. In Table A.1 below, non-emission relevant energy flows have beenshaded.
37Essential differences between energy accounts and energy balancesEnergy accounts are a satellite of the system of national accounts (SNA), and they follow the principlesof the SNA, and therefore the residence principle is adopted. This implies that all economic activities of aresident unit are within the boundaries of the energy accounts. Energy balances, as presented by, forinstance the International Energy Agency (IEA) and Eurostat, on the other hand, follow the territoryprinciple according to which all activities taking place in the national territory are considered within theboundary. This difference in approach has implications mainly on the treatment of energy consumption,especially for transportation.In energy accounts, production is defined according to the SNA and economic activities are classifiedaccording to the International Standard Classification of All Economic Activities (ISIC) of the primaryproduct of the establishment. In energy balances, activities are mainly classified by sector.The energy products in the energy accounts are those as classified by the Harmonized System (HS), fortrade data, and the Central Product Classification (CPC), for production and consumption data.However, it is important to be aware that energy accounts not only accounts for energy products, whichare traded and thus have an economic value attached to it. Within its boundary, energy accountsaccount for all energy flows also accounted for in the energy balances.In energy balances, all energy consumption for transportation is reported as a total. In energy accounts,it is broken down according to intermediate consumption of industries (transport industries and otherindustries) and final consumption of households. Further, consumption of energy products bunkeredabroad for international sea transport and for international air transport is not included in energybalances, but it is in the energy accounts.
Actual useof energy
Table A.1 and Figure A.1 show the Danish industries’ total actual use of energy. Theuse of energy in the industriesElectricity, gas and water supplyas well as in therefineries are for most parts converted into electricity, district heat as well as refinedinto oil products. The industries’ use of these converted (refined) energy products arealso included in the figure, which in that way includes, to some extent, the sameamount of energy twice. The calculation of the net energy consumption, as shownbelow in Figure A.2, adjusts for this double counting.Figure A.1 Composition of the Danish industries’ actual use of energy2 0001 8001 6001 4001 2001 00080060040020001990199319961999200220052007*Peta jouleCrude oil etc.Oil productsBiomassCoalElectricityWind power etc.Natural gas etc.District heatOil for int. transport
38Table A.1Use of energy caused by Danish economic activities. 2007*Crude oilCoal,and semi- coke, etc.manu-facturedoilOilproductsNatural Other gasgasRenew- ElectricityableenergyresourcesDistrictheating
TJ
Total industries and householdsHouseholds
. . . . . . . . . . . . .338 638
197 510197 5019
923 338 171 576822 773 145 314100 56526 262
19 75618 7281 028
146 098105 95640 142
121 00083 71537 285
97 65937 11560 544
Total industries. . . . . . . . . . . . . . . . . . . . . . . . . . . . . . .338 638..................................
-
10109050010092150917092009230926002709360034550005100520055006600964007650970097209875008000851985399009
Agriculture, fishing, quarrying. . . . . . . . . . . . . . .Agriculture, horticulture, and forestry. . . . . . . . . . . .Fishing. . . . . . . . . . . . . . . . . . . . . . . . . . . . . . . . . . . . . . .Mining and quarrying. . . . . . . . . . . . . . . . . . . . . . . . . .
----
2 3232 230-939 5252 196---7 3254-185 654---------------------
34 56626 2777 0091 27930 3297 5823891 4452 68111 9265 51279313 08219 22716 0743 9128 5782 794790692 984691 9781 0065 4802931 1664 02111 0314 6421 3515271 5452 967605 55625 492
31 5361 897-29 63936 08914 5044023 3395 0265 8286 52446665 0423644 2514451 6821 1389874542162382 1833543031 5265 3966471 2217701 2101 547--
178122183817 2493421012515 9393354653412221101273322482482053-2524336414464-160--
3 5303 286-2445 06949512 0851137842891 30296 463-------------893116286179313---
7 6647 17421527533 8688 1985813 8867 6623 3088 7931 4402 4281 13314 9351 3724 8646 3542 3455 8844 3261 5585 7417985514 39212 0611 3932 7521 7362 7283 453--
1 9941 985-96 0399451561 0931 5101162 04717114-10 0591 0523 9802 6922 3361 0745125635 1668377173 61112 7681 5322 8891 8232 8643 661--
Manufacturing. . . . . . . . . . . . . . . . . . . . . . . . . . . . . . .338 638Mfr. of food, beverages and tobacco. . . . . . . . . . . .-Mfr. of textile and leather. . . . . . . . . . . . . . . . . . . . . .-Mfr. of wood products, printing and publishing. . .-Mfr. of chemicals and plastic products. . . . . . . . . . .338 638Mfr. of other non-metallic mineral products. . . . . .-Mfr. of basic metals and fabr. metal product. . . .-Mfr. of furniture and manufacturing n.e.c.. . . . . . .-Electricity, gas and water supplyConstruction.............
----------------------
................................
Wholesale and retail trade, hotels, restau.. . . .Sale and repair of motor vehic., sale of auto fuel. . .Wholesale, except of motor vehicles. . . . . . . . . . . . .Retail trade and repair work, exc. of m. vehiclesHotels and restaurants. . . . . . . . . . . . . . . . . . . . . . . . .Transport, storage and communication. . . . . .Transport. . . . . . . . . . . . . . . . . . . . . . . . . . . . . . . . . . . . .Post and telecommunications. . . . . . . . . . . . . . . . . . .Finance and business activities. . . . . . . . . . . . . . .Finance and insurance. . . . . . . . . . . . . . . . . . . . . . . . .Letting and sale of real estate. . . . . . . . . . . . . . . . . .Business activities. . . . . . . . . . . . . . . . . . . . . . . . . . . . .Public and personal services. . . . . . . . . . . . . . . . .Public administration. . . . . . . . . . . . . . . . . . . . . . . . . .Education. . . . . . . . . . . . . . . . . . . . . . . . . . . . . . . . . . . . .Human health activities. . . . . . . . . . . . . . . . . . . . . . . .Social institutions etc.. . . . . . . . . . . . . . . . . . . . . . . . . .Associations, culture and refuse disposal. . . . . . . . .
610000 Of which Danish ships bunkering abroad. . . . . . . .620000 Of which Danish planes bunkering abroad. . . . . .
The Danish operated ships’ and planes’ bunkering of oil products abroad (fueloil and JP1 respectively) is part of the input in the industryTransport.*Preliminary figures.For further information visit www.statbank.dk/ene1.
Non-emission relevant uses of energy have been shaded.
39Calculation of theadjusted energyconsumption
The calculation of the adjusted energy consumption or the net energy consumption,which it sometimes is also referred to as, is carried out by breaking down the use ofprimary energy (e.g. coal, crude oil and natural gas) used in the production process atthe electricity plants and district heat plants proportionately on the users of theindividual converted energy commodities. Simultaneously, the use of primary energyin the conversion industries is reset to zero. However, at first the consumption ofenergy at the electricity production plants is adjusted for the net imports of electricityso that the net import of electricity is also converted into primary energy. In additionto this, the waste and cable losses of the individual types of energy are broken downby the users of the respective energy products. This implies that increased efficiencyin the conversion industries results in a lower consumption of energy at the finalusers, even though their consumption of electricity and district heat is constant.Figure A.2 Composition of the Danish industries’ net energy consumption1 4001 2001 00080060040020001990199319961999200220052007*Peta jouleCoalElectricityOil for international transportOil productsDistrich heatNatural gas etc.Biomass
Constantnet consumptionof energyin the industries …
It appears from the figure that whereas oil products bunkered by Danish operatedships and planes abroad have increased dramatically since 1990, the net consumptionof energy in the other industries is more or less at the same level. It is important toemphasise that the figures are adjusted for the external trade with electricity.Therefore, the figures cannot be observed and do not correspond to the actualconsumption of energy.Figure A.3 Composition of the Danish households’ net energy consumption4003503002502001501005001990199319961999200220052007*Peta jouleCoalOil productsNatural gas etc.ElectricityDistrict heatBiomass
40… and in the households
The households’ net energy consumption has been more or less at the same level since1990. The composition has changed though. The use of oil products has decreased,whereas biomass has become more important.Seehttp://www.dst.dk/declarations/052916for further information on the Danish energy accounts.The Danish energy accounts are available on the Internet.Firstly,www.statbank.dk/ene1offers the possibility of extracting either complete tables or sections of the tables inthe same way as other data are extracted from StatBank Denmark.Secondly,www.dst.dk/inputoutputprovides users with the possibility of downloading entire sets of energy accounts.
Further information
Data availablefree of charge
41
A.3 Air Emission Accounts
Eight typesof air emissionsThe Danish air emission accounts comprise not only greenhouse gases, but also othersubstances. Overall, eight substances, CO2, SO2, NOx, CH4, N2O, NMVOC, NH3, andCO, are distinguished in the accounts.For energy related emissions, the Danish air emission accounts include a breakdownof the emissions by the same 40 types of energy, which are included in the Danishenergy accounts, cf. Annex A.2. Furthermore, all information on emissions is brokendown by 130 industries and households.The primary sources used to compile the Danish air emissions accounts are theDanish energy accounts and emission factors and emission inventories obtained fromthe Danish National Environmental Research Institute (NERI).Generally, the air emissions are estimated at a detailed level (i.e. for each type ofenergy and each industry and households) by multiplying the energy use by atechnical emissions factor. The general procedure is described in the box.Danish air emission accounts methodologyCalculations of air emissions from energy use and emissions factors can mathematically be described inthe following way:Let Eijbe the total amount (in GJ) of energy typeiused in industryjor households and let ehijbekilograms of emissions of pollutanthper GJ of energy typeiused in sectorj. The total emission ofpollutanthconnected to the use of energy typeiin sectorjis then EMhijgiven by:EMhij= Eijehijh = CO2, SO2, NOx, CO, NH3, N2O, CH4, and NMVOCi = 1,..,40 (types of energy)j = 1,..,130 industries + householdsEijis taken directly from the Danish energy accounts, while ehijgenerally corresponds to the emissionfactors obtained from the Danish National Environmental Research Institute (NERI).The number of different ehijis limited as the emissions of a single type,h, caused by use of energy type,i,in most cases (but not all), are the same for different industries/households,j. The emission, forexample, of CO2per unit of gasoline is the same whatever industry the gasoline is used.This calculation gives a breakdown of the emissions on the industries and households and types ofenergy products. This breakdown of the emissions is afterwards supplemented with additionalinformation in order to meet some of the emission totals in the emission inventories submitted by NERIto the United Nations Framework Convention on Climate Change (UNFCCC) and the United NationsEconomic Commission for Europe (UNECE) and the European Union.The reason for supplementing with this additional information to meet the level in NERI’s emissioninventories is to make the air emissions accounts fully consistent with NERI’s reports to the UNFCCC,UNECE and the EU in areas where the definitions and boundaries of the accounts and emissioninventories are the same. An important argument for the balancing is to ensure that account is takenfor different abatement technologies in use. This is the case for SO2and NOxfrom power plants, whereemissions to a large extent are measured by monitoring equipment at the power plants (by Governmentregulation and control).Thus, for main areas, the data for air emissions in the air emissions accounts correspond to theemissions, which are also reported to the international conventions. However, as explained elsewhere,in some areas, e.g. for international transport, different definitions entail different estimates ofemissions.
Energy relatedair emissions
42Road transport
For the use of LPG, motor gasoline and diesel oil the calculation of emissions iscarried out at an even more detailed level than described in the box. The calculationfor these three types of energy is based on a breakdown of energy consumption inindustries and households into specific use/purpose categories.For the consumption of LPG, motor gasoline and diesel oil for cars a breakdown by189 different types of cars is included in the calculations. For eachindustry/households and type of car the emissions are estimated, using specificemission factors for the relevant type of car. Calculation of emissions on a detailedlevel like this one gives more reliable estimates for some emission types in caseswhere emission factors vary from one type of car to another type of car. Finally, theemissions from road are adjusted in order to ensure consistency with NERI’sestimates of emissions from road transport.
Cross border trade
Emissions related to cross border trade with motor gasoline and diesel oil arecalculated in the same way as emissions from bunkering. The emission factor used tothe calculations is approximated to the emission factor for a passenger car.Emissions from fuel oil and jet petroleum bunkered by Danish operated ships andplanes in foreign countries are also calculated by multiplying the fuel use obtainedfrom the energy accounts by corresponding emission factors for international sea orair transport.In addition to the energy related emissions, the accounts also include non-energyrelated emissions from, for instance, the use of various types of solvents by industriesand households. The data source used for the accounts for the non-energy relatedemissions is NERI’s emission inventories.It is important to be aware that in relation to air emission accounts, the principle is toattribute the emissions to the industry or the households actually combusting thefossil fuels causing the emissions. This means that in the air emissions accountsemissions are attributed to, e.g., the electricity supply industry and not the industriesor households using the electricity.However, this does not mean, as shown elsewhere in this publication, that theenvironmental accounting approach does not allow to analyse and to focus on thegreenhouse gas emissions caused by, e.g., the Danish consumption activities.Detailed tables showing Danish emissions of greenhouse gases with a breakdown by130 industries are presented in Annex 2.Further, general information on the compilation of air emission accounts can beobtained from Eurostat’s manual on air emissions accounts (European Commission,2009).Seehttp://www.dst.dk/declarations/918for further information on the air emission accounts.The Danish air emission accounts are available on the Internet.Firstly,www.statbank.dk/mreg5offers the possibility of extracting either complete tables or sections of the tables inthe same way as other data are extracted from StatBank Denmark.Secondly,www.dst.dk/inputoutputprovides users with the possibility of downloading entire sets of emission accounts.
Shipsand aeroplanes
Non-energy relatedemissions
Production basedapproach …
… but consumption basedapproach is possible
Detailed tablesin annex 2Manual forair emission accounts
Further information
Data availablefree of charge
43
Annex 2TableDetailed tables
Detailed tablesPage4450545862
A.2 Energy account, heating values 2007*. . . . . . . . . . . . . . . . . . . . . . . . . . . . . . . . . . . . . . . . . . . . . . . .A.3 CO2emissions broken down by industries and by householdsA.5 CH4emissions broken down by industries and by households.........................
A.4 N2O emissions broken down by industries and by households. . . . . . . . . . . . . . . . . . . . . . . . ..........................................
A.6 CO2equivalents (GWP) broken down by industries and by households
44Table A.2Energy account, heating values 2007*Crude oil andsemi-manu-factured oilProduction. . . . . . . . . . . . . . . . . . . . . . . . . . . . . . . . . . . . . . . . . . . . . . . .Imports. . . . . . . . . . . . . . . . . . . . . . . . . . . . . . . . . . . . . . . . . . . . . . . . . . .663 95598 147
Coal, coke,etc.
Oil products
Natural gas
Tera joule (TJ)
-200 995
310 662864 079
352 243-
Total supply (= total use). . . . . . . . . . . . . . . . . . . . . . . . . . . . . . . .Changes in inventories. . . . . . . . . . . . . . . . . . . . . . . . . . . . . . . . . . . . . .Waste and cable losses. . . . . . . . . . . . . . . . . . . . . . . . . . . . . . . . . . . . .Exports. . . . . . . . . . . . . . . . . . . . . . . . . . . . . . . . . . . . . . . . . . . . . . . . . . . .Total industries and households. . . . . . . . . . . . . . . . . . . . . . . . .Total industries. . . . . . . . . . . . . . . . . . . . . . . . . . . . . . . . . . . . . . . . . . . .Households011009011209014000020000050000110000140009151000152000153000154000155000156009158109158120158300159000160000170000180000190000200000210000221200221309222009230000241109241209241500241617242000243000244000245070251122252300252400261126263053266080271000272030274000275000281009286009291000292000293000294009297000300000..............................................Agriculture. . . . . . . . . . . . . . . . . . . . . . . . . . . . . . . . . . . . . . . . . . . . . . . . . .Horticulture, orchards etc.. . . . . . . . . . . . . . . . . . . . . . . . . . . . . . . . . . . . . .Agricultural services; landscape gardeners etc.. . . . . . . . . . . . . . . . . . . . .Forestry. . . . . . . . . . . . . . . . . . . . . . . . . . . . . . . . . . . . . . . . . . . . . . . . . . . .Fishing. . . . . . . . . . . . . . . . . . . . . . . . . . . . . . . . . . . . . . . . . . . . . . . . . . . . .Extr. of oil and natural gas. . . . . . . . . . . . . . . . . . . . . . . . . . . . . . . . . . . . .Extr. of gravel and clay etc.. . . . . . . . . . . . . . . . . . . . . . . . . . . . . . . . . . . . .Production etc. of meat and meat products. . . . . . . . . . . . . . . . . . . . . . . .Processing and preserving of fish and fish products. . . . . . . . . . . . . . . . . .Processing and preserving of fruit and vegetables. . . . . . . . . . . . . . . . . . .Mfr. of vegetable and animal oils and fats. . . . . . . . . . . . . . . . . . . . . . . . .Mfr. of dairy products. . . . . . . . . . . . . . . . . . . . . . . . . . . . . . . . . . . . . . . . .Mfr. of starch, chocolate and sugar products. . . . . . . . . . . . . . . . . . . . . . .Mfr. of bread, cakes and biscuits. . . . . . . . . . . . . . . . . . . . . . . . . . . . . . . .Bakers shops. . . . . . . . . . . . . . . . . . . . . . . . . . . . . . . . . . . . . . . . . . . . . . . .Manufacture of sugar. . . . . . . . . . . . . . . . . . . . . . . . . . . . . . . . . . . . . . . . .Manufacture of beverages. . . . . . . . . . . . . . . . . . . . . . . . . . . . . . . . . . . . . .Manufacture of tobacco products. . . . . . . . . . . . . . . . . . . . . . . . . . . . . . . .Mfr. of textiles. . . . . . . . . . . . . . . . . . . . . . . . . . . . . . . . . . . . . . . . . . . . . .Mfr. of wearing apparel. . . . . . . . . . . . . . . . . . . . . . . . . . . . . . . . . . . . . . . .Mfr. of leather and footwear. . . . . . . . . . . . . . . . . . . . . . . . . . . . . . . . . . . .Mfr. of wood and wood products. . . . . . . . . . . . . . . . . . . . . . . . . . . . . . . .Mfr. of pulp, paper and paper products. . . . . . . . . . . . . . . . . . . . . . . . . . .Publishing of newspapers. . . . . . . . . . . . . . . . . . . . . . . . . . . . . . . . . . . . . .Publishing activities, excluding newspapers. . . . . . . . . . . . . . . . . . . . . . . .Printing activities. . . . . . . . . . . . . . . . . . . . . . . . . . . . . . . . . . . . . . . . . . . . .Mfr. of refined petroleum products etc.. . . . . . . . . . . . . . . . . . . . . . . . . . .Mfr. of industrial gases and inorganic basic chemicals. . . . . . . . . . . . . . .Mfr. of dyes, pigments and organic basic chemicals. . . . . . . . . . . . . . . . .Manufacture of fertilizers. . . . . . . . . . . . . . . . . . . . . . . . . . . . . . . . . . . . . .Mfr. of plastics and synthetic rubber. . . . . . . . . . . . . . . . . . . . . . . . . . . . . .Manufacture of pesticides and other agro-chemical products. . . . . . . . . .Mfr. of paints, varnishes and similar coatings, printing ink and mastics.Mfr. of pharmaceuticals etc.. . . . . . . . . . . . . . . . . . . . . . . . . . . . . . . . . . . .Mfr. of detergents and other chemical products. . . . . . . . . . . . . . . . . . . . .Mfr. of rubber products and plastic packing goods etc.. . . . . . . . . . . . . . .Mfr. of builders ware of plastic. . . . . . . . . . . . . . . . . . . . . . . . . . . . . . . . . .Manufacture of other plastic products n.e.c.. . . . . . . . . . . . . . . . . . . . . . .Mfr. of glass and ceramic goods etc.. . . . . . . . . . . . . . . . . . . . . . . . . . . . .Mfr. of cement, bricks, tiles, flags etc.. . . . . . . . . . . . . . . . . . . . . . . . . . . .Mfr. of concrete, cement, asphalt and rockwool products. . . . . . . . . . . . .Mfr. of basic iron and steel and of ferro alloys. . . . . . . . . . . . . . . . . . . . . .First processing of iron and steel. . . . . . . . . . . . . . . . . . . . . . . . . . . . . . . . .Mfr. of basic non-ferrous metals. . . . . . . . . . . . . . . . . . . . . . . . . . . . . . . . .Casting of metal products. . . . . . . . . . . . . . . . . . . . . . . . . . . . . . . . . . . . . .Mfr. of building materials of metal. . . . . . . . . . . . . . . . . . . . . . . . . . . . . . .Mfr. of various metal products. . . . . . . . . . . . . . . . . . . . . . . . . . . . . . . . . .Mfr. of marine engines and compressors. . . . . . . . . . . . . . . . . . . . . . . . . .Mfr. of ovens and cold-storage plants. . . . . . . . . . . . . . . . . . . . . . . . . . . .Mfr. of agricultural machinery. . . . . . . . . . . . . . . . . . . . . . . . . . . . . . . . . .Mfr. of machinery for industries. . . . . . . . . . . . . . . . . . . . . . . . . . . . . . . . .Mfr. of domestic appliances. . . . . . . . . . . . . . . . . . . . . . . . . . . . . . . . . . . .Mfr. of office machinery and computers. . . . . . . . . . . . . . . . . . . . . . . . . . .
762 102-2 3853 396422 453338 638338 638---------------------------338 638--------------------------
200 995- 6812 1332 033197 510197 50192012 029----93-257---932--1 007-----------------------4 7892 536----4-------
1 174 741-46 9032 474295 831923 339822 773100 56519 3701 2894 9386807 009101 2695384631981 0546351 1514322431 6101 244132371262656033088183283851734530131851247253487861507810 3241 523167896461 6964602557234145424921
352 24311 008119169 540171 576145 31426 2628141 04043--27 8321 8071 4921 5796953894 2553 364579--2 02912131569184162 26784225347-3546914161 48193882898891262221 2751 9552 5971 60733131851 1527952933532163016723
45Energy account, heating values 2007*Other gasRenewableenergyresourcesTera joule (TJ)
Table A.2
Electricity District heating
24 156222
129 86618 699
132 82637 534
122 111-
ProductionImports
24 378692144 33919 75618 7281 02811111--18-3826472-1186472226191-2010101315 91600-4030361550330217121224552834171510
148 565527331 681146 098105 95640 1423 23650----244016-6224409---11--2 05232--1------449001240400383----183173220102-
170 359-8 40240 957121 00083 71537 2856 02894716039215112641 8737722812378832 4474353447773111950862111 0901 0203503551 0721 1024841 22741332791001 3046491 482898097221 5591 0281982492914181 2551 0331 21853719654613623
122 111-24 452-97 65937 11560 544-1 985----9471332752131184-15360438670-4239335215111405550-10-308722034127152-6421521144978625713031176204
Total supply (= total use)Changes in inventoriesWaste and cable lossesExportsTotal industries and householdsTotal industriesHouseholdsAgricultureHorticulture, orchards etc.Agricultural services; landscape gardeners etc.ForestryFishingExtr. of oil and natural gasExtr. of gravel and clay etc.Production etc. of meat and meat productsProcessing and preserving of fish and fish productsProcessing and preserving of fruit and vegetablesMfr. of vegetable and animal oils and fatsMfr. of dairy productsMfr. of starch, chocolate and sugar productsMfr. of bread, cakes and biscuitsBakers shopsManufacture of sugarManufacture of beveragesManufacture of tobacco productsMfr. of textilesMfr. of wearing apparelMfr. of leather and footwearMfr. of wood and wood productsMfr. of pulp, paper and paper productsPublishing of newspapersPublishing activities, excluding newspapersPrinting activitiesMfr. of refined petroleum products etc.Mfr. of industrial gases and inorganic basic chemicalsMfr. of dyes, pigments and organic basic chemicalsManufacture of fertilizersMfr. of plastics and synthetic rubberManufacture of pesticides and other agro-chemical productsMfr. of paints, varnishes and similar coatings, printing ink and masticsMfr. of pharmaceuticals etc.Mfr. of detergents and other chemical productsMfr. of rubber products and plastic packing goods etc.Mfr. of builders ware of plasticManufacture of other plastic products n.e.c.Mfr. of glass and ceramic goods etc.Mfr. of cement, bricks, tiles, flags etc.Mfr. of concrete, cement, asphalt and rockwool productsMfr. of basic iron and steel and of ferro alloysFirst processing of iron and steelMfr. of basic non-ferrous metalsCasting of metal productsMfr. of building materials of metalMfr. of various metal productsMfr. of marine engines and compressorsMfr. of ovens and cold-storage plantsMfr. of agricultural machineryMfr. of machinery for industriesMfr. of domestic appliancesMfr. of office machinery and computers
46Table A.2. (cont.)Energy account, heating values 2007*Crude oil and Coal, coke, etc.semi-manu-factured oil310000320000330000340000351000352050361000362060370000401000402000403000410000450001450002450003450004501009502000505000510000521090522990523000524190524490551009553009601000602100602223602409610000620000631130634000640000651000652000660102660300670000701109702009702040710000721009722000730001730002741100741200742009744000747000748009751100751209751300752000Mfr. of other electrical machinery and apparatus. . . . . . . . . . . . . . . . . . . .Mfr. of radio and communication equipment. . . . . . . . . . . . . . . . . . . . . . . .Mfr. of medical and optical instruments. . . . . . . . . . . . . . . . . . . . . . . . . . . .Manufacture of motor vehicles etc.. . . . . . . . . . . . . . . . . . . . . . . . . . . . . . .Building and repairing of ships and boats. . . . . . . . . . . . . . . . . . . . . . . . . .Mfr. of transport equipment excl. ships, motor vehicles etc.. . . . . . . . . . . .Mfr. of furniture. . . . . . . . . . . . . . . . . . . . . . . . . . . . . . . . . . . . . . . . . . . . . . .Mfr. of toys, gold and silver articles etc.. . . . . . . . . . . . . . . . . . . . . . . . . . . .Recycling of waste and scrap. . . . . . . . . . . . . . . . . . . . . . . . . . . . . . . . . . . .Production and distribution of electricity. . . . . . . . . . . . . . . . . . . . . . . . . . .Manufacture and distribution of gas. . . . . . . . . . . . . . . . . . . . . . . . . . . . . .Steam and hot water supply. . . . . . . . . . . . . . . . . . . . . . . . . . . . . . . . . . . . .Collection and distribution of water. . . . . . . . . . . . . . . . . . . . . . . . . . . . . . .Construction of new buildings. . . . . . . . . . . . . . . . . . . . . . . . . . . . . . . . . . .Repair and maintenance of buildings. . . . . . . . . . . . . . . . . . . . . . . . . . . . . .Civil engineering. . . . . . . . . . . . . . . . . . . . . . . . . . . . . . . . . . . . . . . . . . . . . .Construction materials for own-account repair. . . . . . . . . . . . . . . . . . . . . .Sale of motor vehicles and motorcycles. . . . . . . . . . . . . . . . . . . . . . . . . . . .Maintenance and repair of motor vehicles. . . . . . . . . . . . . . . . . . . . . . . . .Retail sale of automotive fuel. . . . . . . . . . . . . . . . . . . . . . . . . . . . . . . . . . . .Wholesale except of motor vehicles. . . . . . . . . . . . . . . . . . . . . . . . . . . . . . .Retail trade of food. . . . . . . . . . . . . . . . . . . . . . . . . . . . . . . . . . . . . . . . . . .Department stores. . . . . . . . . . . . . . . . . . . . . . . . . . . . . . . . . . . . . . . . . . . . .Re. sale of phar. goods, cosmetic art.. . . . . . . . . . . . . . . . . . . . . . . . . . . . . .Re. sale of clothing and footwear. . . . . . . . . . . . . . . . . . . . . . . . . . . . . . . . .Other retail sale, repair work. . . . . . . . . . . . . . . . . . . . . . . . . . . . . . . . . . . .Hotels. . . . . . . . . . . . . . . . . . . . . . . . . . . . . . . . . . . . . . . . . . . . . . . . . . . . . . .Restaurants. . . . . . . . . . . . . . . . . . . . . . . . . . . . . . . . . . . . . . . . . . . . . . . . . .Transport via railways. . . . . . . . . . . . . . . . . . . . . . . . . . . . . . . . . . . . . . . . . .Other scheduled passenger land transport. . . . . . . . . . . . . . . . . . . . . . . . . .Taxi operation and coach services. . . . . . . . . . . . . . . . . . . . . . . . . . . . . . . .Freight transport by road and via pipelines. . . . . . . . . . . . . . . . . . . . . . . . .Water transport. . . . . . . . . . . . . . . . . . . . . . . . . . . . . . . . . . . . . . . . . . . . . . .Air transport. . . . . . . . . . . . . . . . . . . . . . . . . . . . . . . . . . . . . . . . . . . . . . . . .Cargo handling, harbours etc., travel agencies. . . . . . . . . . . . . . . . . . . . . .Activities of other transport agencies. . . . . . . . . . . . . . . . . . . . . . . . . . . . . .Post and telecommunications. . . . . . . . . . . . . . . . . . . . . . . . . . . . . . . . . . . .Financial institutions. . . . . . . . . . . . . . . . . . . . . . . . . . . . . . . . . . . . . . . . . . .Mortgage credit institutions. . . . . . . . . . . . . . . . . . . . . . . . . . . . . . . . . . . . .Life insurance and pension funding. . . . . . . . . . . . . . . . . . . . . . . . . . . . . . .Non-life insurance. . . . . . . . . . . . . . . . . . . . . . . . . . . . . . . . . . . . . . . . . . . . .Activities auxiliary to finance. . . . . . . . . . . . . . . . . . . . . . . . . . . . . . . . . . . .Real estate agents etc.. . . . . . . . . . . . . . . . . . . . . . . . . . . . . . . . . . . . . . . . .Dwellings. . . . . . . . . . . . . . . . . . . . . . . . . . . . . . . . . . . . . . . . . . . . . . . . . . . .Letting of non-residential buildings. . . . . . . . . . . . . . . . . . . . . . . . . . . . . . .Renting of transport equipment and machinery. . . . . . . . . . . . . . . . . . . . . .Computer activities exc. software consultancy and supply. . . . . . . . . . . . .Software consultancy and supply. . . . . . . . . . . . . . . . . . . . . . . . . . . . . . . . .Research and development (market). . . . . . . . . . . . . . . . . . . . . . . . . . . . . .Research and development (other non-market). . . . . . . . . . . . . . . . . . . . . .Legal activities. . . . . . . . . . . . . . . . . . . . . . . . . . . . . . . . . . . . . . . . . . . . . . . .Accounting, book-keeping, auditing. . . . . . . . . . . . . . . . . . . . . . . . . . . . . .Consulting engineers, architects. . . . . . . . . . . . . . . . . . . . . . . . . . . . . . . . .Advertising. . . . . . . . . . . . . . . . . . . . . . . . . . . . . . . . . . . . . . . . . . . . . . . . . . .Building-cleaning activities. . . . . . . . . . . . . . . . . . . . . . . . . . . . . . . . . . . . . .Other business activities. . . . . . . . . . . . . . . . . . . . . . . . . . . . . . . . . . . . . . . .General (overall) public service activities. . . . . . . . . . . . . . . . . . . . . . . . . . .Administration of public sectors exc. for business. . . . . . . . . . . . . . . . . . . .Regulation of and contribution to more efficient operation of business. . .Defence, police and administration of justice. . . . . . . . . . . . . . . . . . . . . . . .---------------------------------------------------------------------166 866-18 788------------------------------------------------
Oil products
Natural gas
Tera joule (TJ)38010218516222265542197559 832773 148246 5628 7853 880-2 4111 3961048 57865336831721 8511456453 1093 8372 83427 045614 72238 5296381 2641 006147581738331522175872111153562569761687213031 0911 0953613079513 02337916218139130749364101130 89445933 684613118152-147221771 682422156511283812477407135157219057238210461169175418030395614417777012036611722034115910929351
47Energy account, heating values 2007*Other gasRenewableenergyresourcesTera joule (TJ)11181990331--1--7711927-471731-001517-4611070--40-----0011-0----52---1213481126572-1 2948-51 660-44 803-----------------------------------------------116857367415696287701 171143126704671 078579407563163-6673903154 8643 2101 160985531 3337721 57284943312185101792 4372301 5584741042615638599730095512359381731572701 3562634967683572456672523442197862594113553---14----3475231823 9809993681203039015851 750173113351751214135563498109271634012842770921323404018216528386527652180637525869830Mfr. of other electrical machinery and apparatusMfr. of radio and communication equipmentMfr. of medical and optical instrumentsManufacture of motor vehicles etc.Building and repairing of ships and boatsMfr. of transport equipment excl. ships, motor vehicles etc.Mfr. of furnitureMfr. of toys, gold and silver articles etc.Recycling of waste and scrapProduction and distribution of electricityManufacture and distribution of gasSteam and hot water supplyCollection and distribution of waterConstruction of new buildingsRepair and maintenance of buildingsCivil engineeringConstruction materials for own-account repairSale of motor vehicles and motorcyclesMaintenance and repair of motor vehiclesRetail sale of automotive fuelWholesale except of motor vehiclesRetail trade of foodDepartment storesRe. sale of phar. goods, cosmetic art.Re. sale of clothing and footwearOther retail sale, repair workHotelsRestaurantsTransport via railwaysOther scheduled passenger land transportTaxi operation and coach servicesFreight transport by road and via pipelinesWater transportAir transportCargo handling, harbours etc., travel agenciesActivities of other transport agenciesPost and telecommunicationsFinancial institutionsMortgage credit institutionsLife insurance and pension fundingNon-life insuranceActivities auxiliary to financeReal estate agents etc.DwellingsLetting of non-residential buildingsRenting of transport equipment and machineryComputer activities exc. software consultancy and supplySoftware consultancy and supplyResearch and development (market)Research and development (other non-market)Legal activitiesAccounting, book-keeping, auditingConsulting engineers, architectsAdvertisingBuilding-cleaning activitiesOther business activitiesGeneral (overall) public service activitiesAdministration of public sectors exc. for businessRegulation of and contribution to more efficient operation of businessDefence, police and administration of justice
Table A.2 (cont.)
Electricity District heating
48Table A.2 (cont.)Energy account, heating values 2007*Crude oil andsemi-manu-factured oil801000802000803000804001804002851100851209853109853209900010900020900030910000920001920002930009950000Primary education. . . . . . . . . . . . . . . . . . . . . . . . . . . . . . . . . . . . . . . . . . . . . . .Secondary education. . . . . . . . . . . . . . . . . . . . . . . . . . . . . . . . . . . . . . . . . . . . .Higher education. . . . . . . . . . . . . . . . . . . . . . . . . . . . . . . . . . . . . . . . . . . . . . . .Adult and other education (market). . . . . . . . . . . . . . . . . . . . . . . . . . . . . . . . .Adult and other education (other non-market). . . . . . . . . . . . . . . . . . . . . . . .Hospital activities. . . . . . . . . . . . . . . . . . . . . . . . . . . . . . . . . . . . . . . . . . . . . . .Medical, dental and veterinary activities. . . . . . . . . . . . . . . . . . . . . . . . . . . . .Social institutions etc. for children. . . . . . . . . . . . . . . . . . . . . . . . . . . . . . . . . .Social institutions etc. for adults. . . . . . . . . . . . . . . . . . . . . . . . . . . . . . . . . . .Sewage removal and purifying plants. . . . . . . . . . . . . . . . . . . . . . . . . . . . . . .Refuse collection and sanitation. . . . . . . . . . . . . . . . . . . . . . . . . . . . . . . . . . .Refuse dumps and refuse disposal plants. . . . . . . . . . . . . . . . . . . . . . . . . . . .Activities of membership organizations. . . . . . . . . . . . . . . . . . . . . . . . . . . . . .Recreational, cultural, sporting activities (market). . . . . . . . . . . . . . . . . . . . .Recreational, cultural, sporting activities (other non-market). . . . . . . . . . . . .Other service activities. . . . . . . . . . . . . . . . . . . . . . . . . . . . . . . . . . . . . . . . . . .Private households with employed persons. . . . . . . . . . . . . . . . . . . . . . . . . . .Of which Danish operated ships bunkering abroad. . . . . . . . . . . . .Of which Danish operated planes bunkering abroad. . . . . . . . . . . .For further information visitwww.statbank.dk/ene1-----------------
Coal, coke,etc.
Oil products
Natural gas
Tera joule (TJ)-----------------3793911381113321963304531 0923951 05778144606231456-605 55625 492866972534-5432272689424803913253429988-
--
--
--
49Energy account, heating values 2007*Other gasRenewableenergyresourcesTera joule (TJ)1031230--64---10516643639---286----179--313----------1 9532205718-1 2245126052 123465324272991 204675352---2 0502316009-1 2855376352 2291 1368213141 265708209---Primary educationSecondary educationHigher educationAdult and other education (market)Adult and other education (other non-market)Hospital activitiesMedical, dental and veterinary activitiesSocial institutions etc. for childrenSocial institutions etc. for adultsSewage removal and purifying plantsRefuse collection and sanitationRefuse dumps and refuse disposal plantsActivities of membership organizationsRecreational, cultural, sporting activities (market)Recreational, cultural, sporting activities (other non-market)Other service activitiesPrivate households with employed personsOf which Danish operated ships bunkering abroadOf which Danish operated planes bunkering abroad
Table A.2 (cont.)
Electricity
District heating
50Table A.3CO2emissions broken down by industries and by households199019951996199719981999
1 000 tonnes CO2
Total emissions
.............................................
72 23211 1273 813
80 83612 3261 233
95 21812 9101 850
87 54912 5431 994
86 68212 2531 313
84 44512 1872 274
Households. . . . . . . . . . . . . . . . . . . . . . . . . . . . . . . . . . . . . . . . . . . . . . . . . . .Other emissions. . . . . . . . . . . . . . . . . . . . . . . . . . . . . . . . . . . . . . . . . . . . . . . .
Total industries011009011209014000020000050000110000140009151000152000153000154000155000156009158109158120158300159000160000170000180000190000200000210000221200221309222009230000241109241209241500241617242000243000244000245070251122252300252400261126263053266080271000272030274000275000281009286009291000292000293000294009297000300000310000320000330000340000351000352050361000362060370000401000402000403000410000
.............................................
57 2911 52158018922834803284220162311112732915922417273101231910487350613468988105357112107203857131011 7784559519202104985459385130454201931296211261020 644986 3251
67 2771 501628241316021 09829423627036682484515342302218993169478181412481 372811859211098196797171002 5574949313201141846361404721439201631412019720625 983707 2602
80 4581 439635236386691 267250240197421372773115823313218898177472208413431 39781217110212108196889201012 72952993121821471096966464619340282140421221528438 123727 6332
73 0121 432592230356161 694270241227431052912725824358219890155483210412331 094696819112117195921018982 98447497112011361006277424619341273237481320022429 297607 4982
73 1171 426587236356261 6772602532124211231326858253642318911354862354133395256687811214517710312181072 852484102132011371016379474419239293237461420323425 174577 9442
69 9841 351502261346272 261301276226361213262396224355214897155557212718389817587371051210919110711261232 7385471001415151641046678414814444282134321118923322 309557 8762
Agriculture. . . . . . . . . . . . . . . . . . . . . . . . . . . . . . . . . . . . . . . . . . . . . . . . . . . .Horticulture, orchards etc.. . . . . . . . . . . . . . . . . . . . . . . . . . . . . . . . . . . . . . . .Agricultural services; landscape gardeners etc.. . . . . . . . . . . . . . . . . . . . . . .Forestry. . . . . . . . . . . . . . . . . . . . . . . . . . . . . . . . . . . . . . . . . . . . . . . . . . . . . .Fishing. . . . . . . . . . . . . . . . . . . . . . . . . . . . . . . . . . . . . . . . . . . . . . . . . . . . . . .Extr. of oil and natural gas. . . . . . . . . . . . . . . . . . . . . . . . . . . . . . . . . . . . . . .Extr. of gravel and clay etc.. . . . . . . . . . . . . . . . . . . . . . . . . . . . . . . . . . . . . . .Production etc. of meat and meat products. . . . . . . . . . . . . . . . . . . . . . . . . .Processing and preserving of fish and fish products. . . . . . . . . . . . . . . . . . .Processing and preserving of fruit and vegetables. . . . . . . . . . . . . . . . . . . . .Mfr. of vegetable and animal oils and fats. . . . . . . . . . . . . . . . . . . . . . . . . . .Mfr. of dairy products. . . . . . . . . . . . . . . . . . . . . . . . . . . . . . . . . . . . . . . . . . .Mfr. of starch, chocolate and sugar products. . . . . . . . . . . . . . . . . . . . . . . . .Mfr. of bread, cakes and biscuits. . . . . . . . . . . . . . . . . . . . . . . . . . . . . . . . . .Bakers shops. . . . . . . . . . . . . . . . . . . . . . . . . . . . . . . . . . . . . . . . . . . . . . . . . .Manufacture of sugar. . . . . . . . . . . . . . . . . . . . . . . . . . . . . . . . . . . . . . . . . . .Manufacture of beverages. . . . . . . . . . . . . . . . . . . . . . . . . . . . . . . . . . . . . . .Manufacture of tobacco products. . . . . . . . . . . . . . . . . . . . . . . . . . . . . . . . . .Mfr. of textiles. . . . . . . . . . . . . . . . . . . . . . . . . . . . . . . . . . . . . . . . . . . . . . . .Mfr. of wearing apparel. . . . . . . . . . . . . . . . . . . . . . . . . . . . . . . . . . . . . . . . .Mfr. of leather and footwear. . . . . . . . . . . . . . . . . . . . . . . . . . . . . . . . . . . . .Mfr. of wood and wood products. . . . . . . . . . . . . . . . . . . . . . . . . . . . . . . . . .Mfr. of pulp, paper and paper products. . . . . . . . . . . . . . . . . . . . . . . . . . . . .Publishing of newspapers. . . . . . . . . . . . . . . . . . . . . . . . . . . . . . . . . . . . . . . .Publishing activities, excluding newspapers. . . . . . . . . . . . . . . . . . . . . . . . .Printing activities. . . . . . . . . . . . . . . . . . . . . . . . . . . . . . . . . . . . . . . . . . . . . . .Mfr. of refined petroleum products etc.. . . . . . . . . . . . . . . . . . . . . . . . . . . . .Mfr. of industrial gases and inorganic basic chemicals. . . . . . . . . . . . . . . . .Mfr. of dyes, pigments and organic basic chemicals. . . . . . . . . . . . . . . . . . .Manufacture of fertilizers. . . . . . . . . . . . . . . . . . . . . . . . . . . . . . . . . . . . . . . .Mfr. of plastics and synthetic rubber. . . . . . . . . . . . . . . . . . . . . . . . . . . . . . .Manufacture of pesticides and other agro-chemical products. . . . . . . . . . . .Mfr. of paints, varnishes and similar coatings, printing ink and mastics. . .Mfr. of pharmaceuticals etc.. . . . . . . . . . . . . . . . . . . . . . . . . . . . . . . . . . . . . .Mfr. of detergents and other chemical products. . . . . . . . . . . . . . . . . . . . . .Mfr. of rubber products and plastic packing goods etc.. . . . . . . . . . . . . . . . .Mfr. of builders ware of plastic. . . . . . . . . . . . . . . . . . . . . . . . . . . . . . . . . . . .Manufacture of other plastic products n.e.c.. . . . . . . . . . . . . . . . . . . . . . . . .Mfr. of glass and ceramic goods etc.. . . . . . . . . . . . . . . . . . . . . . . . . . . . . . .Mfr. of cement, bricks, tiles, flags etc.. . . . . . . . . . . . . . . . . . . . . . . . . . . . . .Mfr. of concrete, cement, asphalt and rockwool products. . . . . . . . . . . . . .Mfr. of basic iron and steel and of ferro alloys. . . . . . . . . . . . . . . . . . . . . . . .First processing of iron and steel. . . . . . . . . . . . . . . . . . . . . . . . . . . . . . . . . .Mfr. of basic non-ferrous metals. . . . . . . . . . . . . . . . . . . . . . . . . . . . . . . . . . .Casting of metal products. . . . . . . . . . . . . . . . . . . . . . . . . . . . . . . . . . . . . . . .Mfr. of building materials of metal. . . . . . . . . . . . . . . . . . . . . . . . . . . . . . . . .Mfr. of various metal products. . . . . . . . . . . . . . . . . . . . . . . . . . . . . . . . . . . .Mfr. of marine engines and compressors. . . . . . . . . . . . . . . . . . . . . . . . . . .Mfr. of ovens and cold-storage plants. . . . . . . . . . . . . . . . . . . . . . . . . . . . . .Mfr. of agricultural machinery. . . . . . . . . . . . . . . . . . . . . . . . . . . . . . . . . . . .Mfr. of machinery for industries. . . . . . . . . . . . . . . . . . . . . . . . . . . . . . . . . . .Mfr. of domestic appliances. . . . . . . . . . . . . . . . . . . . . . . . . . . . . . . . . . . . . .Mfr. of office machinery and computers. . . . . . . . . . . . . . . . . . . . . . . . . . . . .Mfr. of other electrical machinery and apparatus. . . . . . . . . . . . . . . . . . . . .Mfr. of radio and communication equipment. . . . . . . . . . . . . . . . . . . . . . . . .Mfr. of medical and optical instruments. . . . . . . . . . . . . . . . . . . . . . . . . . . . .Manufacture of motor vehicles etc.. . . . . . . . . . . . . . . . . . . . . . . . . . . . . . . .Building and repairing of ships and boats. . . . . . . . . . . . . . . . . . . . . . . . . . .Mfr. of transport equipment excl. ships, motor vehicles etc.. . . . . . . . . . . . .Mfr. of furniture. . . . . . . . . . . . . . . . . . . . . . . . . . . . . . . . . . . . . . . . . . . . . . . .Mfr. of toys, gold and silver articles etc.. . . . . . . . . . . . . . . . . . . . . . . . . . . .Recycling of waste and scrap. . . . . . . . . . . . . . . . . . . . . . . . . . . . . . . . . . . . .Production and distribution of electricity. . . . . . . . . . . . . . . . . . . . . . . . . . . .Manufacture and distribution of gas. . . . . . . . . . . . . . . . . . . . . . . . . . . . . . .Steam and hot water supply. . . . . . . . . . . . . . . . . . . . . . . . . . . . . . . . . . . . . .Collection and distribution of water. . . . . . . . . . . . . . . . . . . . . . . . . . . . . . . .
51CO2emissions broken down by industries and by households2000200120022003200420052006*2007*
Table A.3
1 000 tonnes CO2
83 77712 2282 61968 9311 446461274406562 04232924822639122310309602130420289513555120561738989661606107111121891059241172 7034819714181916093656742481034528232830919421319 259467 5493
85 46612 6143 00769 8461 476477285436152 050353232224401273033976321267204894125505206719401 010666497112121192011068221172 763446951720201658765674551834729242733720022320 796457 7973
86 42912 7431 90071 7861 564432268366242 05533322021141119286384582024419189111550119881839972663476108121142151037221112 757428431518191638664684353834929252731719621421 376447 6932
95 75713 5391 06181 1571 606360258406072 06931122113848129282226582031322210801672352111326471 01476254310914942051061028982 6664507612162117794687447601236031293729821828426 663437 7852
93 57013 5372 37177 6621 443324254405362 17431322014347132280229582232822110791672362091326489908624310619932021051128962 8984707412162118196687648601236131293729821928421 262447 8892
97 711 115 486 116 778 Total emissions13 328 13 534 13 797 Households1 7041 5951 460 Other emissions82 678 100 357 101 522 Total industries1 5701 5091 515 Agriculture344337314 Horticulture, orchards etc.266260279 Agricultural services; landscape gardeners etc.444246 Forestry523497455 Fishing2 0432 0571 985 Extr. of oil and natural gas296268241 Extr. of gravel and clay etc.188175132 Production etc. of meat and meat products129152160 Processing and preserving of fish and fish products444956 Processing and preserving of fruit and vegetables102106108 Mfr. of vegetable and animal oils and fats329325303 Mfr. of dairy products335369430 Mfr. of starch, chocolate and sugar products707272 Mfr. of bread, cakes and biscuits181819 Bakers shops292281230 Manufacture of sugar217220218 Manufacture of beverages888 Manufacture of tobacco products535138 Mfr. of textiles121314 Mfr. of wearing apparel233 Mfr. of leather and footwear252276279 Mfr. of wood and wood products214214169 Mfr. of pulp, paper and paper products111112 Publishing of newspapers252527 Publishing activities, excluding newspapers424343 Printing activities929968972 Mfr. of refined petroleum products etc.888 Mfr. of industrial gases and inorganic basic chemicals666364 Mfr. of dyes, pigments and organic basic chemicals211 Manufacture of fertilizers222 Mfr. of plastics and synthetic rubber989889 Manufacture of pesticides and other agro-chemical products101010 Mfr. of paints, varnishes and similar coatings, printing ink and mastics868372 Mfr. of pharmaceuticals etc.185164147 Mfr. of detergents and other chemical products828191 Mfr. of rubber products and plastic packing goods etc.11109 Mfr. of builders ware of plastic342825 Manufacture of other plastic products n.e.c.808082 Mfr. of glass and ceramic goods etc.2 7892 8942 992 Mfr. of cement, bricks, tiles, flags etc.467522593 Mfr. of concrete, cement, asphalt and rockwool products829096 Mfr. of basic iron and steel and of ferro alloys779 First processing of iron and steel91115 Mfr. of basic non-ferrous metals121110 Casting of metal products161197234 Mfr. of building materials of metal858788 Mfr. of various metal products928739 Mfr. of marine engines and compressors747782 Mfr. of ovens and cold-storage plants374046 Mfr. of agricultural machinery576062 Mfr. of machinery for industries898 Mfr. of domestic appliances233 Mfr. of office machinery and computers575754 Mfr. of other electrical machinery and apparatus192021 Mfr. of radio and communication equipment262526 Mfr. of medical and optical instruments343537 Manufacture of motor vehicles etc.313236 Building and repairing of ships and boats678 Mfr. of transport equipment excl. ships, motor vehicles etc.163172197 Mfr. of furniture232122 Mfr. of toys, gold and silver articles etc.444 Recycling of waste and scrap18 095 25 768 21 181 Production and distribution of electricity373433 Manufacture and distribution of gas8 4868 3978 332 Steam and hot water supply222 Collection and distribution of water
52Table A.3 (cont.)CO2emissions broken down by industries and by households1990450001450002450003450004501009502000505000510000521090522990523000524190524490551009553009601000602100602223602409610000620000631130634000640000651000652000660102660300670000701109702009702040710000721009722000730001730002741100741200742009744000747000748009751100751209751300752000801000802000803000804001804002851100851209853109853209900010900020900030910000920001920002930009950000Construction of new buildings. . . . . . . . . . . . . . . . . . . . . . . . . . . . . . . . . . . .Repair and maintenance of buildings. . . . . . . . . . . . . . . . . . . . . . . . . . . . . . .Civil engineering. . . . . . . . . . . . . . . . . . . . . . . . . . . . . . . . . . . . . . . . . . . . . . .Construction materials for own-account repair. . . . . . . . . . . . . . . . . . . . . . .Sale of motor vehicles and motorcycles. . . . . . . . . . . . . . . . . . . . . . . . . . . . .Maintenance and repair of motor vehicles. . . . . . . . . . . . . . . . . . . . . . . . . .Retail sale of automotive fuel. . . . . . . . . . . . . . . . . . . . . . . . . . . . . . . . . . . . .Wholesale except of motor vehicles. . . . . . . . . . . . . . . . . . . . . . . . . . . . . . . .Retail trade of food. . . . . . . . . . . . . . . . . . . . . . . . . . . . . . . . . . . . . . . . . . . .Department stores. . . . . . . . . . . . . . . . . . . . . . . . . . . . . . . . . . . . . . . . . . . . . .Re. sale of phar. goods, cosmetic art.. . . . . . . . . . . . . . . . . . . . . . . . . . . . . . .Re. sale of clothing and footwear. . . . . . . . . . . . . . . . . . . . . . . . . . . . . . . . . .Other retail sale, repair work. . . . . . . . . . . . . . . . . . . . . . . . . . . . . . . . . . . . .Hotels. . . . . . . . . . . . . . . . . . . . . . . . . . . . . . . . . . . . . . . . . . . . . . . . . . . . . . . .Restaurants. . . . . . . . . . . . . . . . . . . . . . . . . . . . . . . . . . . . . . . . . . . . . . . . . . .Transport via railways. . . . . . . . . . . . . . . . . . . . . . . . . . . . . . . . . . . . . . . . . . .Other scheduled passenger land transport. . . . . . . . . . . . . . . . . . . . . . . . . . .Taxi operation and coach services. . . . . . . . . . . . . . . . . . . . . . . . . . . . . . . . .Freight transport by road and via pipelines. . . . . . . . . . . . . . . . . . . . . . . . . .Water transport. . . . . . . . . . . . . . . . . . . . . . . . . . . . . . . . . . . . . . . . . . . . . . . .Air transport. . . . . . . . . . . . . . . . . . . . . . . . . . . . . . . . . . . . . . . . . . . . . . . . . .Cargo handling, harbours etc., travel agencies. . . . . . . . . . . . . . . . . . . . . . .Activities of other transport agencies. . . . . . . . . . . . . . . . . . . . . . . . . . . . . . .Post and telecommunications. . . . . . . . . . . . . . . . . . . . . . . . . . . . . . . . . . . . .Financial institutions. . . . . . . . . . . . . . . . . . . . . . . . . . . . . . . . . . . . . . . . . . . .Mortgage credit institutions. . . . . . . . . . . . . . . . . . . . . . . . . . . . . . . . . . . . . .Life insurance and pension funding. . . . . . . . . . . . . . . . . . . . . . . . . . . . . . . .Non-life insurance. . . . . . . . . . . . . . . . . . . . . . . . . . . . . . . . . . . . . . . . . . . . . .Activities auxiliary to finance. . . . . . . . . . . . . . . . . . . . . . . . . . . . . . . . . . . . .Real estate agents etc.. . . . . . . . . . . . . . . . . . . . . . . . . . . . . . . . . . . . . . . . . .Dwellings. . . . . . . . . . . . . . . . . . . . . . . . . . . . . . . . . . . . . . . . . . . . . . . . . . . . .Letting of non-residential buildings. . . . . . . . . . . . . . . . . . . . . . . . . . . . . . . .Renting of transport equipment and machinery. . . . . . . . . . . . . . . . . . . . . . .Computer activities exc. software consultancy and supply. . . . . . . . . . . . . .Software consultancy and supply. . . . . . . . . . . . . . . . . . . . . . . . . . . . . . . . . .Research and development (market). . . . . . . . . . . . . . . . . . . . . . . . . . . . . . .Research and development (other non-market). . . . . . . . . . . . . . . . . . . . . . .Legal activities. . . . . . . . . . . . . . . . . . . . . . . . . . . . . . . . . . . . . . . . . . . . . . . . .Accounting, book-keeping, auditing. . . . . . . . . . . . . . . . . . . . . . . . . . . . . . .Consulting engineers, architects. . . . . . . . . . . . . . . . . . . . . . . . . . . . . . . . . .Advertising. . . . . . . . . . . . . . . . . . . . . . . . . . . . . . . . . . . . . . . . . . . . . . . . . . .Building-cleaning activities. . . . . . . . . . . . . . . . . . . . . . . . . . . . . . . . . . . . . . .Other business activities. . . . . . . . . . . . . . . . . . . . . . . . . . . . . . . . . . . . . . . . .General (overall) public service activities. . . . . . . . . . . . . . . . . . . . . . . . . . . .Administration of public sectors exc. for business. . . . . . . . . . . . . . . . . . . . .Regulation of and contribution to more efficient operation of business. . . .Defence, police and administration of justice. . . . . . . . . . . . . . . . . . . . . . . .Primary education. . . . . . . . . . . . . . . . . . . . . . . . . . . . . . . . . . . . . . . . . . . . . .Secondary education. . . . . . . . . . . . . . . . . . . . . . . . . . . . . . . . . . . . . . . . . . . .Higher education. . . . . . . . . . . . . . . . . . . . . . . . . . . . . . . . . . . . . . . . . . . . . . .Adult and other education (market). . . . . . . . . . . . . . . . . . . . . . . . . . . . . . . .Adult and other education (other non-market). . . . . . . . . . . . . . . . . . . . . . .Hospital activities. . . . . . . . . . . . . . . . . . . . . . . . . . . . . . . . . . . . . . . . . . . . . .Medical, dental and veterinary activities. . . . . . . . . . . . . . . . . . . . . . . . . . . .Social institutions etc. for children. . . . . . . . . . . . . . . . . . . . . . . . . . . . . . . . .Social institutions etc. for adults. . . . . . . . . . . . . . . . . . . . . . . . . . . . . . . . . . .Sewage removal and purifying plants. . . . . . . . . . . . . . . . . . . . . . . . . . . . . .Refuse collection and sanitation. . . . . . . . . . . . . . . . . . . . . . . . . . . . . . . . . . .Refuse dumps and refuse disposal plants. . . . . . . . . . . . . . . . . . . . . . . . . . . .Activities of membership organizations. . . . . . . . . . . . . . . . . . . . . . . . . . . . .Recreational, cultural, sporting activities (market). . . . . . . . . . . . . . . . . . . .Recreational, cultural, sporting activities (other non-market). . . . . . . . . . . .Other service activities. . . . . . . . . . . . . . . . . . . . . . . . . . . . . . . . . . . . . . . . . .Private households with employed persons. . . . . . . . . . . . . . . . . . . . . . . . . .Of which Danish operated ships bunkering abroad. . . . . . . . . . . . .Of which Danish operated planes bunkering abroad. . . . . . . . . . .Of which emissions from biomass. . . . . . . . . . . . . . . . . . . . . . . . . .Total industries excl. of bunkering abroad. . . . . . . . . . . . . . . . . . . . . . . . . . .CO2binding (sequestration). . . . . . . . . . . . . . . . . . . . . . . . . . . . . . . . . . . . . .262367179-1318722759857623152301023331492171 4049 9762 2553252983392103953251851441092045194442302146349111332841384434010148421219564043-9 1762724 64147 843- 2 8311995294397229-1401001770377962114539763212472241 47612 0392 3694778932161531237271113162571646184843241748567642419415353629786756816502926-10 9474265 86955 904- 2 993199619971998359527206-100971369370961914221772572722181 69116 8082 9383178982052631130361181535715472057512620524566233205183737339142632514573044-15 9557466 49256 417- 3 3201999409601235-1461001672267982014022702542412011 66616 0642 699338112221526311233211112036714502166553024574056633216223732391034766815602937-15 2776866 85754 021- 3 320
1 000 tonnes CO2320336468493185197--1391441009419167457007977129762220148143372878693113012572552192231 5821 55511 79112 7652 6133 0672931767810810526266622773312123632374012116717163366881717524619215458485229302021485043840983843434252645161846474142343692947940586031251718606135364743--10 7144316 29669 313- 3 06911 8115386 54260 663- 3 162
53CO2emissions broken down by industries and by households2000353497226-129881363762881713120652442422191 52519 8742 1123376115215263122443109233671548226557282149265672921619384135974159915622935-18 9515147 16949 465- 6642001372524242-132911463764961813520702282562381 64418 4112 37635801071852531224421810273571554226761242751248593519720343734935164614622637-17 4896307 90251 727- 3 5512002407574258-159951162061961712821722122451581 49420 5602 08642767220626313213914103028816622475823124562166433216203632401084359915622837-19 8466558 43051 285- 3 827200320042005449634271-1731021166661861713920732342851891 79933 0062 66447897919626313214215103128817672684903326665286630217233833431154471616683036-32 3091 61010 89348 759- 1 7972006*474670282-18310911709671071915023812293072051 94342 4302 841519585217263142443161132299187228909635287030710432248246236461564976818743438-41 7091 79911 33556 849- 2 7832007*512724303-1921131172767981815821772303342252 13947 9312 776531028818625314234516113328817722792963427763689131209265433441474883616672937-Construction of new buildingsRepair and maintenance of buildingsCivil engineeringConstruction materials for own-account repairSale of motor vehicles and motorcyclesMaintenance and repair of motor vehiclesRetail sale of automotive fuelWholesale except of motor vehiclesRetail trade of foodDepartment storesRe. sale of phar. goods, cosmetic art.Re. sale of clothing and footwearOther retail sale, repair workHotelsRestaurantsTransport via railwaysOther scheduled passenger land transportTaxi operation and coach servicesFreight transport by road and via pipelinesWater transportAir transportCargo handling, harbours etc., travel agenciesActivities of other transport agenciesPost and telecommunicationsFinancial institutionsMortgage credit institutionsLife insurance and pension fundingNon-life insuranceActivities auxiliary to financeReal estate agents etc.DwellingsLetting of non-residential buildingsRenting of transport equipment and machineryComputer activities exc. software consultancy and supplySoftware consultancy and supplyResearch and development (market)Research and development (other non-market)Legal activitiesAccounting, book-keeping, auditingConsulting engineers, architectsAdvertisingBuilding-cleaning activitiesOther business activitiesGeneral (overall) public service activitiesAdministration of public sectors exc. for businessRegulation of and contribution to more efficient operation of businessDefence, police and administration of justicePrimary educationSecondary educationHigher educationAdult and other education (market)Adult and other education (other non-market)Hospital activitiesMedical, dental and veterinary activitiesSocial institutions etc. for childrenSocial institutions etc. for adultsSewage removal and purifying plantsRefuse collection and sanitationRefuse dumps and refuse disposal plantsActivities of membership organizationsRecreational, cultural, sporting activities (market)Recreational, cultural, sporting activities (other non-market)Other service activitiesPrivate households with employed persons
Table A.3 (cont.)
1 000 tonnes CO2423444596626263275--167172101101121164465463631091161918137137212176742202182592721691801 6021 70924 256 25 9962 3311 94745468286767822217622763313132221424017171110313122889817176765262680828989343326266063235463737033302323772122424035344443122118444463671271717696932313937--23 5146649 45356 979- 3 54725 35146010 14251 850- 3 465
47 233Of which Danish operated ships bunkering abroad1 835Of which Danish operated planes bunkering abroad12 110Of which emissions from biomass52 453 Total industries excl. of bunkering abroad- 2 977 CO2binding (sequestration)
54Table A.4N2O emissions broken down by industries and by households199019951996Tonnes N2O199719981999
Total emissions. . . . . . . . . . . . . . . . . . . . . . . . . . . . . . . . . . . . . . . . . . . . . . .Households. . . . . . . . . . . . . . . . . . . . . . . . . . . . . . . . . . . . . . . . . . . . . . . . . . .Other emissions. . . . . . . . . . . . . . . . . . . . . . . . . . . . . . . . . . . . . . . . . . . . . . . .011009011209014000020000050000110000140009151000152000153000154000155000156009158109158120158300159000160000170000180000190000200000210000221200221309222009230000241109241209241500241617242000243000244000245070251122252300252400261126263053266080271000272030274000275000281009286009291000292000293000294009297000300000310000320000330000340000351000352050361000362060370000401000402000403000410000
34 568297- 3134 30229 103229128269641388211380310181000131033 365000322003281421104322121021111081017611570
30 922390- 2730 55925 574221212034967126122196021017500247032 917000332012411420105222121011111171025501670
29 741412- 2429 35324 48021121224086514782196031017500148032 693000332013461520005322121011111081039101830
29 521406- 2129 13624 235191112053866137721116021018500138022 738000332012481420105323121011111071031501740
29 502396- 2229 12824 144191112055876138721116020018600133022 604000433013461420105323211011111081027401790
28 462389- 1028 08322 692161312068876138621106031022501134013 067020333013431620006323120011111071025601740
Total industries. . . . . . . . . . . . . . . . . . . . . . . . . . . . . . . . . . . . . . . . . . . . . . .Agriculture. . . . . . . . . . . . . . . . . . . . . . . . . . . . . . . . . . . . . . . . . . . . . . . . . . . .Horticulture, orchards etc.. . . . . . . . . . . . . . . . . . . . . . . . . . . . . . . . . . . . . . . .Agricultural services; landscape gardeners etc.. . . . . . . . . . . . . . . . . . . . . . .Forestry. . . . . . . . . . . . . . . . . . . . . . . . . . . . . . . . . . . . . . . . . . . . . . . . . . . . . .Fishing. . . . . . . . . . . . . . . . . . . . . . . . . . . . . . . . . . . . . . . . . . . . . . . . . . . . . . .Extr. of oil and natural gas. . . . . . . . . . . . . . . . . . . . . . . . . . . . . . . . . . . . . . .Extr. of gravel and clay etc.. . . . . . . . . . . . . . . . . . . . . . . . . . . . . . . . . . . . . . .Production etc. of meat and meat products. . . . . . . . . . . . . . . . . . . . . . . . . .Processing and preserving of fish and fish products. . . . . . . . . . . . . . . . . . .Processing and preserving of fruit and vegetables. . . . . . . . . . . . . . . . . . . . .Mfr. of vegetable and animal oils and fats. . . . . . . . . . . . . . . . . . . . . . . . . . .Mfr. of dairy products. . . . . . . . . . . . . . . . . . . . . . . . . . . . . . . . . . . . . . . . . . .Mfr. of starch, chocolate and sugar products. . . . . . . . . . . . . . . . . . . . . . . . .Mfr. of bread, cakes and biscuits. . . . . . . . . . . . . . . . . . . . . . . . . . . . . . . . . .Bakers shops. . . . . . . . . . . . . . . . . . . . . . . . . . . . . . . . . . . . . . . . . . . . . . . . . .Manufacture of sugar. . . . . . . . . . . . . . . . . . . . . . . . . . . . . . . . . . . . . . . . . . .Manufacture of beverages. . . . . . . . . . . . . . . . . . . . . . . . . . . . . . . . . . . . . . .Manufacture of tobacco products. . . . . . . . . . . . . . . . . . . . . . . . . . . . . . . . . .Mfr. of textiles. . . . . . . . . . . . . . . . . . . . . . . . . . . . . . . . . . . . . . . . . . . . . . . .Mfr. of wearing apparel. . . . . . . . . . . . . . . . . . . . . . . . . . . . . . . . . . . . . . . . .Mfr. of leather and footwear. . . . . . . . . . . . . . . . . . . . . . . . . . . . . . . . . . . . .Mfr. of wood and wood products. . . . . . . . . . . . . . . . . . . . . . . . . . . . . . . . . .Mfr. of pulp, paper and paper products. . . . . . . . . . . . . . . . . . . . . . . . . . . . .Publishing of newspapers. . . . . . . . . . . . . . . . . . . . . . . . . . . . . . . . . . . . . . . .Publishing activities, excluding newspapers. . . . . . . . . . . . . . . . . . . . . . . . .Printing activities. . . . . . . . . . . . . . . . . . . . . . . . . . . . . . . . . . . . . . . . . . . . . . .Mfr. of refined petroleum products etc.. . . . . . . . . . . . . . . . . . . . . . . . . . . . .Mfr. of industrial gases and inorganic basic chemicals. . . . . . . . . . . . . . . . .Mfr. of dyes, pigments and organic basic chemicals. . . . . . . . . . . . . . . . . . .Manufacture of fertilizers. . . . . . . . . . . . . . . . . . . . . . . . . . . . . . . . . . . . . . . .Mfr. of plastics and synthetic rubber. . . . . . . . . . . . . . . . . . . . . . . . . . . . . . .Manufacture of pesticides and other agro-chemical products. . . . . . . . . . . .Mfr. of paints, varnishes and similar coatings, printing ink and mastics. . .Mfr. of pharmaceuticals etc.. . . . . . . . . . . . . . . . . . . . . . . . . . . . . . . . . . . . . .Mfr. of detergents and other chemical products. . . . . . . . . . . . . . . . . . . . . .Mfr. of rubber products and plastic packing goods etc.. . . . . . . . . . . . . . . . .Mfr. of builders ware of plastic. . . . . . . . . . . . . . . . . . . . . . . . . . . . . . . . . . . .Manufacture of other plastic products n.e.c.. . . . . . . . . . . . . . . . . . . . . . . . .Mfr. of glass and ceramic goods etc.. . . . . . . . . . . . . . . . . . . . . . . . . . . . . . .Mfr. of cement, bricks, tiles, flags etc.. . . . . . . . . . . . . . . . . . . . . . . . . . . . . .Mfr. of concrete, cement, asphalt and rockwool products. . . . . . . . . . . . . .Mfr. of basic iron and steel and of ferro alloys. . . . . . . . . . . . . . . . . . . . . . . .First processing of iron and steel. . . . . . . . . . . . . . . . . . . . . . . . . . . . . . . . . .Mfr. of basic non-ferrous metals. . . . . . . . . . . . . . . . . . . . . . . . . . . . . . . . . . .Casting of metal products. . . . . . . . . . . . . . . . . . . . . . . . . . . . . . . . . . . . . . . .Mfr. of building materials of metal. . . . . . . . . . . . . . . . . . . . . . . . . . . . . . . . .Mfr. of various metal products. . . . . . . . . . . . . . . . . . . . . . . . . . . . . . . . . . . .Mfr. of marine engines and compressors. . . . . . . . . . . . . . . . . . . . . . . . . . .Mfr. of ovens and cold-storage plants. . . . . . . . . . . . . . . . . . . . . . . . . . . . . .Mfr. of agricultural machinery. . . . . . . . . . . . . . . . . . . . . . . . . . . . . . . . . . . .Mfr. of machinery for industries. . . . . . . . . . . . . . . . . . . . . . . . . . . . . . . . . . .Mfr. of domestic appliances. . . . . . . . . . . . . . . . . . . . . . . . . . . . . . . . . . . . . .Mfr. of office machinery and computers. . . . . . . . . . . . . . . . . . . . . . . . . . . . .Mfr. of other electrical machinery and apparatus. . . . . . . . . . . . . . . . . . . . .Mfr. of radio and communication equipment. . . . . . . . . . . . . . . . . . . . . . . . .Mfr. of medical and optical instruments. . . . . . . . . . . . . . . . . . . . . . . . . . . . .Manufacture of motor vehicles etc.. . . . . . . . . . . . . . . . . . . . . . . . . . . . . . . .Building and repairing of ships and boats. . . . . . . . . . . . . . . . . . . . . . . . . . .Mfr. of transport equipment excl. ships, motor vehicles etc.. . . . . . . . . . . . .Mfr. of furniture. . . . . . . . . . . . . . . . . . . . . . . . . . . . . . . . . . . . . . . . . . . . . . . .Mfr. of toys, gold and silver articles etc.. . . . . . . . . . . . . . . . . . . . . . . . . . . .Recycling of waste and scrap. . . . . . . . . . . . . . . . . . . . . . . . . . . . . . . . . . . . .Production and distribution of electricity. . . . . . . . . . . . . . . . . . . . . . . . . . . .Manufacture and distribution of gas. . . . . . . . . . . . . . . . . . . . . . . . . . . . . . .Steam and hot water supply. . . . . . . . . . . . . . . . . . . . . . . . . . . . . . . . . . . . . .Collection and distribution of water. . . . . . . . . . . . . . . . . . . . . . . . . . . . . . . .
55N2O emissions broken down by industries and by households2000200120022003200420052006*2007*
Table A.4
Tonnes N2O
28 007394- 327 61621 88815132216696613892195020022501135023 239030333013431420016322120021111071023101650
27 049390- 526 66421 3961614220651066138112185020020501135022 857030333013451321116322120021111081025001710
26 061391- 925 67920 651141211967966137112175020021501134022 498030333013441210016323120021111081025901730
25 937393- 1625 56119 89411121186896414762110602109501136022 887030243012461320016323220021111091028401740
25 174390- 1824 80220 242111211771964147621106021010501135021 712031243012501420016323220021111091023101740
23 8423862923 42820 16412122166995413992196020010601133020030242012511420006333120021111061018401820
23 61337910523 13019 174121211670854139102196010011601134020020232012531620007333120021111071025901870
24 918 Total emissions392 Households101 Other emissions24 42520 189111321466744138122176010011501134020020222012551920008313220021111081020501830Total industriesAgricultureHorticulture, orchards etc.Agricultural services; landscape gardeners etc.ForestryFishingExtr. of oil and natural gasExtr. of gravel and clay etc.Production etc. of meat and meat productsProcessing and preserving of fish and fish productsProcessing and preserving of fruit and vegetablesMfr. of vegetable and animal oils and fatsMfr. of dairy productsMfr. of starch, chocolate and sugar productsMfr. of bread, cakes and biscuitsBakers shopsManufacture of sugarManufacture of beveragesManufacture of tobacco productsMfr. of textilesMfr. of wearing apparelMfr. of leather and footwearMfr. of wood and wood productsMfr. of pulp, paper and paper productsPublishing of newspapersPublishing activities, excluding newspapersPrinting activitiesMfr. of refined petroleum products etc.Mfr. of industrial gases and inorganic basic chemicalsMfr. of dyes, pigments and organic basic chemicalsManufacture of fertilizersMfr. of plastics and synthetic rubberManufacture of pesticides and other agro-chemical productsMfr. of paints, varnishes and similar coatings, printing ink and masticsMfr. of pharmaceuticals etc.Mfr. of detergents and other chemical productsMfr. of rubber products and plastic packing goods etc.Mfr. of builders ware of plasticManufacture of other plastic products n.e.c.Mfr. of glass and ceramic goods etc.Mfr. of cement, bricks, tiles, flags etc.Mfr. of concrete, cement, asphalt and rockwool productsMfr. of basic iron and steel and of ferro alloysFirst processing of iron and steelMfr. of basic non-ferrous metalsCasting of metal productsMfr. of building materials of metalMfr. of various metal productsMfr. of marine engines and compressorsMfr. of ovens and cold-storage plantsMfr. of agricultural machineryMfr. of machinery for industriesMfr. of domestic appliancesMfr. of office machinery and computersMfr. of other electrical machinery and apparatusMfr. of radio and communication equipmentMfr. of medical and optical instrumentsManufacture of motor vehicles etc.Building and repairing of ships and boatsMfr. of transport equipment excl. ships, motor vehicles etc.Mfr. of furnitureMfr. of toys, gold and silver articles etc.Recycling of waste and scrapProduction and distribution of electricityManufacture and distribution of gasSteam and hot water supplyCollection and distribution of water
56Table A.4 (cont.)N2O emissions broken down by industries and by households1990450001450002450003450004501009502000505000510000521090522990523000524190524490551009553009601000602100602223602409610000620000631130634000640000651000652000660102660300670000701109702009702040710000721009722000730001730002741100741200742009744000747000748009751100751209751300752000801000802000803000804001804002851100851209853109853209900010900020900030910000920001920002930009950000Construction of new buildings. . . . . . . . . . . . . . . . . . . . . . . . . . . . . . . . . . . .Repair and maintenance of buildings. . . . . . . . . . . . . . . . . . . . . . . . . . . . . . .Civil engineering. . . . . . . . . . . . . . . . . . . . . . . . . . . . . . . . . . . . . . . . . . . . . . .Construction materials for own-account repair. . . . . . . . . . . . . . . . . . . . . . .Sale of motor vehicles and motorcycles. . . . . . . . . . . . . . . . . . . . . . . . . . . . .Maintenance and repair of motor vehicles. . . . . . . . . . . . . . . . . . . . . . . . . .Retail sale of automotive fuel. . . . . . . . . . . . . . . . . . . . . . . . . . . . . . . . . . . . .Wholesale except of motor vehicles. . . . . . . . . . . . . . . . . . . . . . . . . . . . . . . .Retail trade of food. . . . . . . . . . . . . . . . . . . . . . . . . . . . . . . . . . . . . . . . . . . .Department stores. . . . . . . . . . . . . . . . . . . . . . . . . . . . . . . . . . . . . . . . . . . . . .Re. sale of phar. goods, cosmetic art.. . . . . . . . . . . . . . . . . . . . . . . . . . . . . . .Re. sale of clothing and footwear. . . . . . . . . . . . . . . . . . . . . . . . . . . . . . . . . .Other retail sale, repair work. . . . . . . . . . . . . . . . . . . . . . . . . . . . . . . . . . . . .Hotels. . . . . . . . . . . . . . . . . . . . . . . . . . . . . . . . . . . . . . . . . . . . . . . . . . . . . . . .Restaurants. . . . . . . . . . . . . . . . . . . . . . . . . . . . . . . . . . . . . . . . . . . . . . . . . . .Transport via railways. . . . . . . . . . . . . . . . . . . . . . . . . . . . . . . . . . . . . . . . . . .Other scheduled passenger land transport. . . . . . . . . . . . . . . . . . . . . . . . . . .Taxi operation and coach services. . . . . . . . . . . . . . . . . . . . . . . . . . . . . . . . .Freight transport by road and via pipelines. . . . . . . . . . . . . . . . . . . . . . . . . .Water transport. . . . . . . . . . . . . . . . . . . . . . . . . . . . . . . . . . . . . . . . . . . . . . . .Air transport. . . . . . . . . . . . . . . . . . . . . . . . . . . . . . . . . . . . . . . . . . . . . . . . . .Cargo handling, harbours etc., travel agencies. . . . . . . . . . . . . . . . . . . . . . .Activities of other transport agencies. . . . . . . . . . . . . . . . . . . . . . . . . . . . . . .Post and telecommunications. . . . . . . . . . . . . . . . . . . . . . . . . . . . . . . . . . . . .Financial institutions. . . . . . . . . . . . . . . . . . . . . . . . . . . . . . . . . . . . . . . . . . . .Mortgage credit institutions. . . . . . . . . . . . . . . . . . . . . . . . . . . . . . . . . . . . . .Life insurance and pension funding. . . . . . . . . . . . . . . . . . . . . . . . . . . . . . . .Non-life insurance. . . . . . . . . . . . . . . . . . . . . . . . . . . . . . . . . . . . . . . . . . . . . .Activities auxiliary to finance. . . . . . . . . . . . . . . . . . . . . . . . . . . . . . . . . . . . .Real estate agents etc.. . . . . . . . . . . . . . . . . . . . . . . . . . . . . . . . . . . . . . . . . .Dwellings. . . . . . . . . . . . . . . . . . . . . . . . . . . . . . . . . . . . . . . . . . . . . . . . . . . . .Letting of non-residential buildings. . . . . . . . . . . . . . . . . . . . . . . . . . . . . . . .Renting of transport equipment and machinery. . . . . . . . . . . . . . . . . . . . . . .Computer activities exc. software consultancy and supply. . . . . . . . . . . . . .Software consultancy and supply. . . . . . . . . . . . . . . . . . . . . . . . . . . . . . . . . .Research and development (market). . . . . . . . . . . . . . . . . . . . . . . . . . . . . . .Research and development (other non-market). . . . . . . . . . . . . . . . . . . . . . .Legal activities. . . . . . . . . . . . . . . . . . . . . . . . . . . . . . . . . . . . . . . . . . . . . . . . .Accounting, book-keeping, auditing. . . . . . . . . . . . . . . . . . . . . . . . . . . . . . .Consulting engineers, architects. . . . . . . . . . . . . . . . . . . . . . . . . . . . . . . . . .Advertising. . . . . . . . . . . . . . . . . . . . . . . . . . . . . . . . . . . . . . . . . . . . . . . . . . .Building-cleaning activities. . . . . . . . . . . . . . . . . . . . . . . . . . . . . . . . . . . . . . .Other business activities. . . . . . . . . . . . . . . . . . . . . . . . . . . . . . . . . . . . . . . . .General (overall) public service activities. . . . . . . . . . . . . . . . . . . . . . . . . . . .Administration of public sectors exc. for business. . . . . . . . . . . . . . . . . . . . .Regulation of and contribution to more efficient operation of business. . . .Defence, police and administration of justice. . . . . . . . . . . . . . . . . . . . . . . .Primary education. . . . . . . . . . . . . . . . . . . . . . . . . . . . . . . . . . . . . . . . . . . . . .Secondary education. . . . . . . . . . . . . . . . . . . . . . . . . . . . . . . . . . . . . . . . . . . .Higher education. . . . . . . . . . . . . . . . . . . . . . . . . . . . . . . . . . . . . . . . . . . . . . .Adult and other education (market). . . . . . . . . . . . . . . . . . . . . . . . . . . . . . . .Adult and other education (other non-market). . . . . . . . . . . . . . . . . . . . . . .Hospital activities. . . . . . . . . . . . . . . . . . . . . . . . . . . . . . . . . . . . . . . . . . . . . .Medical, dental and veterinary activities. . . . . . . . . . . . . . . . . . . . . . . . . . . .Social institutions etc. for children. . . . . . . . . . . . . . . . . . . . . . . . . . . . . . . . .Social institutions etc. for adults. . . . . . . . . . . . . . . . . . . . . . . . . . . . . . . . . . .Sewage removal and purifying plants. . . . . . . . . . . . . . . . . . . . . . . . . . . . . .Refuse collection and sanitation. . . . . . . . . . . . . . . . . . . . . . . . . . . . . . . . . . .Refuse dumps and refuse disposal plants. . . . . . . . . . . . . . . . . . . . . . . . . . . .Activities of membership organizations. . . . . . . . . . . . . . . . . . . . . . . . . . . . .Recreational, cultural, sporting activities (market). . . . . . . . . . . . . . . . . . . .Recreational, cultural, sporting activities (other non-market). . . . . . . . . . . .Other service activities. . . . . . . . . . . . . . . . . . . . . . . . . . . . . . . . . . . . . . . . . .Private households with employed persons. . . . . . . . . . . . . . . . . . . . . . . . . .Of which Danish operated ships bunkering abroad. . . . . . . . . . . . .Of which Danish operated planes bunkering abroad. . . . . . . . . . .Total industries excl. of bunkering abroad. . . . . . . . . . . . . . . . . . . . . . . . . . .12168-54127300161395105361679124100000211000001212211212311002113284201211-576933 716199513179-6412630016139795373382234100000110010001212211218211011113276201211-6881529 85619961997199816248-441263001613777601 037102134100000120010001213211215211011113214210212-1 0022628 099199919289-7412930017137665899394136100000110010001213211214211011114201201211-9602427 100
Tonnes N2O1415212277--664411272733000011771132987788575671577991107113344110000000000112200001100000011221123221111221413221111001111111133226211221111221122--6731528 6657421928 375
57N2O emissions broken down by industries and by households200016239-640243001612767521 2337413510000012001000121321129211011113212200211-1 1911826 4082001172410-641243001612667531 1428313510000012101000121321128211011113186200211-1 0992225 5442002192710-740242001612664471 2777313310000012101000121431127211011113189200211-1 2472324 409200320042005202911-740242001612664522 05893234100000121010001314311218211011114164201211-2 0305621 3422006*213012-740253001713665552 65299234100001121010001314411210311012125163201211-2 6206320 4472007*233212-840253001713665592 99997234000001121010001314311212211011114154200211-Construction of new buildingsRepair and maintenance of buildingsCivil engineeringConstruction materials for own-account repairSale of motor vehicles and motorcyclesMaintenance and repair of motor vehiclesRetail sale of automotive fuelWholesale except of motor vehiclesRetail trade of foodDepartment storesRe. sale of phar. goods, cosmetic art.Re. sale of clothing and footwearOther retail sale, repair workHotelsRestaurantsTransport via railwaysOther scheduled passenger land transportTaxi operation and coach servicesFreight transport by road and via pipelinesWater transportAir transportCargo handling, harbours etc., travel agenciesActivities of other transport agenciesPost and telecommunicationsFinancial institutionsMortgage credit institutionsLife insurance and pension fundingNon-life insuranceActivities auxiliary to financeReal estate agents etc.DwellingsLetting of non-residential buildingsRenting of transport equipment and machineryComputer activities exc. software consultancy and supplySoftware consultancy and supplyResearch and development (market)Research and development (other non-market)Legal activitiesAccounting, book-keeping, auditingConsulting engineers, architectsAdvertisingBuilding-cleaning activitiesOther business activitiesGeneral (overall) public service activitiesAdministration of public sectors exc. for businessRegulation of and contribution to more efficient operation of businessDefence, police and administration of justicePrimary educationSecondary educationHigher educationAdult and other education (market)Adult and other education (other non-market)Hospital activitiesMedical, dental and veterinary activitiesSocial institutions etc. for childrenSocial institutions etc. for adultsSewage removal and purifying plantsRefuse collection and sanitationRefuse dumps and refuse disposal plantsActivities of membership organizationsRecreational, cultural, sporting activities (market)Recreational, cultural, sporting activities (other non-market)Other service activitiesPrivate households with employed persons
Table A.4 (cont.)
Tonnes N2O192028291111--77440025243200001166113266664549511 5081 620816822334411000000001011221100110000001133114433111122815221111001111112144162173220011221111--1 4772324 0601 5931623 194
2 967Of which Danish operated ships bunkering abroad64Of which Danish operated planes bunkering abroad21 394 Total industries excl. of bunkering abroad
58Table A.5CH4emissions broken down by industries and by households199019951996Tonnes CH4199719981999
Total emissions
.............................................
271 6505 119169
285 4405 999- 52
290 8946 219- 32
285 7416 076- 23
287 0795 728- 34
281 2775 65324
Households. . . . . . . . . . . . . . . . . . . . . . . . . . . . . . . . . . . . . . . . . . . . . . . . . . .Other emissions. . . . . . . . . . . . . . . . . . . . . . . . . . . . . . . . . . . . . . . . . . . . . . . .
Total industries011009011209014000020000050000110000140009151000152000153000154000155000156009158109158120158300159000160000170000180000190000200000210000221200221309222009230000241109241209241500241617242000243000244000245070251122252300252400261126263053266080271000272030274000275000281009286009291000292000293000294009297000300000310000320000330000340000351000352050361000362060370000401000402000403000410000
.............................................
266 363191 795100152221003816142617295257211931141391291 56915200268812812851721011104746317333215450207248640
279 493191 2305942521513933233344295763341911221124211282 3071880027161112131896613120151087463154344347304 780416 9840
284 707191 4089322931714833464710871811213735224311326013112 4891172210314232424282368830230242316108851885810358506 930488 4240
279 688186 8501 264313181473547551067872121424522231130621282 7621152510314222523272368631230202114107851877711353407 281487 5710
281 385188 5421 580353181453552541178775121435122431139721382 8371112810319212924312339234240222315108851888811357408 240507 8540
275 599182 0041 48239226186525551958254121365322631159612493 1991122313331824272534227953123325221511683187478349508 585447 4530
Agriculture. . . . . . . . . . . . . . . . . . . . . . . . . . . . . . . . . . . . . . . . . . . . . . . . . . . .Horticulture, orchards etc.. . . . . . . . . . . . . . . . . . . . . . . . . . . . . . . . . . . . . . . .Agricultural services; landscape gardeners etc.. . . . . . . . . . . . . . . . . . . . . . .Forestry. . . . . . . . . . . . . . . . . . . . . . . . . . . . . . . . . . . . . . . . . . . . . . . . . . . . . .Fishing. . . . . . . . . . . . . . . . . . . . . . . . . . . . . . . . . . . . . . . . . . . . . . . . . . . . . . .Extr. of oil and natural gas. . . . . . . . . . . . . . . . . . . . . . . . . . . . . . . . . . . . . . .Extr. of gravel and clay etc.. . . . . . . . . . . . . . . . . . . . . . . . . . . . . . . . . . . . . . .Production etc. of meat and meat products. . . . . . . . . . . . . . . . . . . . . . . . . .Processing and preserving of fish and fish products. . . . . . . . . . . . . . . . . . .Processing and preserving of fruit and vegetables. . . . . . . . . . . . . . . . . . . . .Mfr. of vegetable and animal oils and fats. . . . . . . . . . . . . . . . . . . . . . . . . . .Mfr. of dairy products. . . . . . . . . . . . . . . . . . . . . . . . . . . . . . . . . . . . . . . . . . .Mfr. of starch, chocolate and sugar products. . . . . . . . . . . . . . . . . . . . . . . . .Mfr. of bread, cakes and biscuits. . . . . . . . . . . . . . . . . . . . . . . . . . . . . . . . . .Bakers shops. . . . . . . . . . . . . . . . . . . . . . . . . . . . . . . . . . . . . . . . . . . . . . . . . .Manufacture of sugar. . . . . . . . . . . . . . . . . . . . . . . . . . . . . . . . . . . . . . . . . . .Manufacture of beverages. . . . . . . . . . . . . . . . . . . . . . . . . . . . . . . . . . . . . . .Manufacture of tobacco products. . . . . . . . . . . . . . . . . . . . . . . . . . . . . . . . . .Mfr. of textiles. . . . . . . . . . . . . . . . . . . . . . . . . . . . . . . . . . . . . . . . . . . . . . . .Mfr. of wearing apparel. . . . . . . . . . . . . . . . . . . . . . . . . . . . . . . . . . . . . . . . .Mfr. of leather and footwear. . . . . . . . . . . . . . . . . . . . . . . . . . . . . . . . . . . . .Mfr. of wood and wood products. . . . . . . . . . . . . . . . . . . . . . . . . . . . . . . . . .Mfr. of pulp, paper and paper products. . . . . . . . . . . . . . . . . . . . . . . . . . . . .Publishing of newspapers. . . . . . . . . . . . . . . . . . . . . . . . . . . . . . . . . . . . . . . .Publishing activities, excluding newspapers. . . . . . . . . . . . . . . . . . . . . . . . .Printing activities. . . . . . . . . . . . . . . . . . . . . . . . . . . . . . . . . . . . . . . . . . . . . . .Mfr. of refined petroleum products etc.. . . . . . . . . . . . . . . . . . . . . . . . . . . . .Mfr. of industrial gases and inorganic basic chemicals. . . . . . . . . . . . . . . . .Mfr. of dyes, pigments and organic basic chemicals. . . . . . . . . . . . . . . . . . .Manufacture of fertilizers. . . . . . . . . . . . . . . . . . . . . . . . . . . . . . . . . . . . . . . .Mfr. of plastics and synthetic rubber. . . . . . . . . . . . . . . . . . . . . . . . . . . . . . .Manufacture of pesticides and other agro-chemical products. . . . . . . . . . . .Mfr. of paints, varnishes and similar coatings, printing ink and mastics. . .Mfr. of pharmaceuticals etc.. . . . . . . . . . . . . . . . . . . . . . . . . . . . . . . . . . . . . .Mfr. of detergents and other chemical products. . . . . . . . . . . . . . . . . . . . . .Mfr. of rubber products and plastic packing goods etc.. . . . . . . . . . . . . . . . .Mfr. of builders ware of plastic. . . . . . . . . . . . . . . . . . . . . . . . . . . . . . . . . . . .Manufacture of other plastic products n.e.c.. . . . . . . . . . . . . . . . . . . . . . . . .Mfr. of glass and ceramic goods etc.. . . . . . . . . . . . . . . . . . . . . . . . . . . . . . .Mfr. of cement, bricks, tiles, flags etc.. . . . . . . . . . . . . . . . . . . . . . . . . . . . . .Mfr. of concrete, cement, asphalt and rockwool products. . . . . . . . . . . . . .Mfr. of basic iron and steel and of ferro alloys. . . . . . . . . . . . . . . . . . . . . . . .First processing of iron and steel. . . . . . . . . . . . . . . . . . . . . . . . . . . . . . . . . .Mfr. of basic non-ferrous metals. . . . . . . . . . . . . . . . . . . . . . . . . . . . . . . . . . .Casting of metal products. . . . . . . . . . . . . . . . . . . . . . . . . . . . . . . . . . . . . . . .Mfr. of building materials of metal. . . . . . . . . . . . . . . . . . . . . . . . . . . . . . . . .Mfr. of various metal products. . . . . . . . . . . . . . . . . . . . . . . . . . . . . . . . . . . .Mfr. of marine engines and compressors. . . . . . . . . . . . . . . . . . . . . . . . . . .Mfr. of ovens and cold-storage plants. . . . . . . . . . . . . . . . . . . . . . . . . . . . . .Mfr. of agricultural machinery. . . . . . . . . . . . . . . . . . . . . . . . . . . . . . . . . . . .Mfr. of machinery for industries. . . . . . . . . . . . . . . . . . . . . . . . . . . . . . . . . . .Mfr. of domestic appliances. . . . . . . . . . . . . . . . . . . . . . . . . . . . . . . . . . . . . .Mfr. of office machinery and computers. . . . . . . . . . . . . . . . . . . . . . . . . . . . .Mfr. of other electrical machinery and apparatus. . . . . . . . . . . . . . . . . . . . .Mfr. of radio and communication equipment. . . . . . . . . . . . . . . . . . . . . . . . .Mfr. of medical and optical instruments. . . . . . . . . . . . . . . . . . . . . . . . . . . . .Manufacture of motor vehicles etc.. . . . . . . . . . . . . . . . . . . . . . . . . . . . . . . .Building and repairing of ships and boats. . . . . . . . . . . . . . . . . . . . . . . . . . .Mfr. of transport equipment excl. ships, motor vehicles etc.. . . . . . . . . . . . .Mfr. of furniture. . . . . . . . . . . . . . . . . . . . . . . . . . . . . . . . . . . . . . . . . . . . . . . .Mfr. of toys, gold and silver articles etc.. . . . . . . . . . . . . . . . . . . . . . . . . . . .Recycling of waste and scrap. . . . . . . . . . . . . . . . . . . . . . . . . . . . . . . . . . . . .Production and distribution of electricity. . . . . . . . . . . . . . . . . . . . . . . . . . . .Manufacture and distribution of gas. . . . . . . . . . . . . . . . . . . . . . . . . . . . . . .Steam and hot water supply. . . . . . . . . . . . . . . . . . . . . . . . . . . . . . . . . . . . . .Collection and distribution of water. . . . . . . . . . . . . . . . . . . . . . . . . . . . . . . .
59CH4emissions broken down by industries and by households2000200120022003200420052006*2007*
Table A.5
Tonnes CH4
281 024 287 299 285 966 285 149 276 156 271 223 268 906 274 887 Total emissions6 0326 4796 5377 0877 2757 9708 4559 569 Households41162- 15- 19- 19- 29- 36 Other emissions274 951 280 804 279 427 278 078 268 900 263 272 260 480 265 354 Total industries182 686 186 975 184 662 182 840 179 542 177 340 175 464 183 507 Agriculture1 3481 2521 0871 0951 067694480258 Horticulture, orchards etc.3940343341393427 Agricultural services; landscape gardeners etc.3223333 Forestry32618171415141412 Fishing168153177153179193185185 Extr. of oil and natural gas6780737069584431 Extr. of gravel and clay etc.60556059453420 Production etc. of meat and meat products585964593334263125 Processing and preserving of fish and fish products111211161613129 Processing and preserving of fruit and vegetables67688898 Mfr. of vegetable and animal oils and fats97899492988153 Mfr. of dairy products887696886263907962 Mfr. of starch, chocolate and sugar products141716151413129 Mfr. of bread, cakes and biscuits11111111 Bakers shops3526232931262421 Manufacture of sugar5866607473635029 Manufacture of beverages33233322 Manufacture of tobacco products3330262615125 Mfr. of textiles302233222 Mfr. of wearing apparel312122000 Mfr. of leather and footwear1511496567626877 Mfr. of wood and wood products1816877718079745929 Mfr. of pulp, paper and paper products3344322 Publishing of newspapers245476654 Publishing activities, excluding newspapers10111013131196 Printing activities3 4803 4343 6403 7284 4194 4435 7525 841 Mfr. of refined petroleum products etc.11111211 Mfr. of industrial gases and inorganic basic chemicals131514151514107 Mfr. of dyes, pigments and organic basic chemicals2119232100 Manufacture of fertilizers2211100000 Mfr. of plastics and synthetic rubber3947434645362918 Manufacture of pesticides and other agro-chemical products34444321 Mfr. of paints, varnishes and similar coatings, printing ink and mastics27242626262012 Mfr. of pharmaceuticals etc.222933303334272012 Mfr. of detergents and other chemical products3136333433242013 Mfr. of rubber products and plastic packing goods etc.21122221 Mfr. of builders ware of plastic66688654 Manufacture of other plastic products n.e.c.3945413939282316 Mfr. of glass and ceramic goods etc.237221235248223230249 Mfr. of cement, bricks, tiles, flags etc.2539994859496848382 Mfr. of concrete, cement, asphalt and rockwool products3439163231302719 Mfr. of basic iron and steel and of ferro alloys33322111 First processing of iron and steel5444322 Mfr. of basic non-ferrous metals445555321 Casting of metal products2833313434262928 Mfr. of building materials of metal2223212524191713 Mfr. of various metal products182119212118135 Mfr. of marine engines and compressors111211121211109 Mfr. of ovens and cold-storage plants89899665 Mfr. of agricultural machinery10121111111097 Mfr. of machinery for industries32233221 Mfr. of domestic appliances11111000 Mfr. of office machinery and computers101211151512107 Mfr. of other electrical machinery and apparatus899109543 Mfr. of radio and communication equipment7677664 Mfr. of medical and optical instruments67871010876 Manufacture of motor vehicles etc.89888765 Building and repairing of ships and boats22222111 Mfr. of transport equipment excl. ships, motor vehicles etc.5857556667384049 Mfr. of furniture56577542 Mfr. of toys, gold and silver articles etc.00000000 Recycling of waste and scrap8 9358 8988 8908 4086 6516 0874 065 Production and distribution of electricity7 99449563939142629788 Manufacture and distribution of gas7 2327 5607 5257 2226 7026 4695 2535 039 Steam and hot water supply00000000 Collection and distribution of water
60Table A.5 (cont.)CH4emissions broken down by industries and by households1990450001450002450003450004501009502000505000510000521090522990523000524190524490551009553009601000602100602223602409610000620000631130634000640000651000652000660102660300670000701109702009702040710000721009722000730001730002741100741200742009744000747000748009751100751209751300752000801000802000803000804001804002851100851209853109853209900010900020900030910000920001920002930009950000Construction of new buildings. . . . . . . . . . . . . . . . . . . . . . . . . . . . . . . . . . . .Repair and maintenance of buildings. . . . . . . . . . . . . . . . . . . . . . . . . . . . . . .Civil engineering. . . . . . . . . . . . . . . . . . . . . . . . . . . . . . . . . . . . . . . . . . . . . . .Construction materials for own-account repair. . . . . . . . . . . . . . . . . . . . . . .Sale of motor vehicles and motorcycles. . . . . . . . . . . . . . . . . . . . . . . . . . . . .Maintenance and repair of motor vehicles. . . . . . . . . . . . . . . . . . . . . . . . . .Retail sale of automotive fuel. . . . . . . . . . . . . . . . . . . . . . . . . . . . . . . . . . . . .Wholesale except of motor vehicles. . . . . . . . . . . . . . . . . . . . . . . . . . . . . . . .Retail trade of food. . . . . . . . . . . . . . . . . . . . . . . . . . . . . . . . . . . . . . . . . . . .Department stores. . . . . . . . . . . . . . . . . . . . . . . . . . . . . . . . . . . . . . . . . . . . . .Re. sale of phar. goods, cosmetic art.. . . . . . . . . . . . . . . . . . . . . . . . . . . . . . .Re. sale of clothing and footwear. . . . . . . . . . . . . . . . . . . . . . . . . . . . . . . . . .Other retail sale, repair work. . . . . . . . . . . . . . . . . . . . . . . . . . . . . . . . . . . . .Hotels. . . . . . . . . . . . . . . . . . . . . . . . . . . . . . . . . . . . . . . . . . . . . . . . . . . . . . . .Restaurants. . . . . . . . . . . . . . . . . . . . . . . . . . . . . . . . . . . . . . . . . . . . . . . . . . .Transport via railways. . . . . . . . . . . . . . . . . . . . . . . . . . . . . . . . . . . . . . . . . . .Other scheduled passenger land transport. . . . . . . . . . . . . . . . . . . . . . . . . . .Taxi operation and coach services. . . . . . . . . . . . . . . . . . . . . . . . . . . . . . . . .Freight transport by road and via pipelines. . . . . . . . . . . . . . . . . . . . . . . . . .Water transport. . . . . . . . . . . . . . . . . . . . . . . . . . . . . . . . . . . . . . . . . . . . . . . .Air transport. . . . . . . . . . . . . . . . . . . . . . . . . . . . . . . . . . . . . . . . . . . . . . . . . .Cargo handling, harbours etc., travel agencies. . . . . . . . . . . . . . . . . . . . . . .Activities of other transport agencies. . . . . . . . . . . . . . . . . . . . . . . . . . . . . . .Post and telecommunications. . . . . . . . . . . . . . . . . . . . . . . . . . . . . . . . . . . . .Financial institutions. . . . . . . . . . . . . . . . . . . . . . . . . . . . . . . . . . . . . . . . . . . .Mortgage credit institutions. . . . . . . . . . . . . . . . . . . . . . . . . . . . . . . . . . . . . .Life insurance and pension funding. . . . . . . . . . . . . . . . . . . . . . . . . . . . . . . .Non-life insurance. . . . . . . . . . . . . . . . . . . . . . . . . . . . . . . . . . . . . . . . . . . . . .Activities auxiliary to finance. . . . . . . . . . . . . . . . . . . . . . . . . . . . . . . . . . . . .Real estate agents etc.. . . . . . . . . . . . . . . . . . . . . . . . . . . . . . . . . . . . . . . . . .Dwellings. . . . . . . . . . . . . . . . . . . . . . . . . . . . . . . . . . . . . . . . . . . . . . . . . . . . .Letting of non-residential buildings. . . . . . . . . . . . . . . . . . . . . . . . . . . . . . . .Renting of transport equipment and machinery. . . . . . . . . . . . . . . . . . . . . . .Computer activities exc. software consultancy and supply. . . . . . . . . . . . . .Software consultancy and supply. . . . . . . . . . . . . . . . . . . . . . . . . . . . . . . . . .Research and development (market). . . . . . . . . . . . . . . . . . . . . . . . . . . . . . .Research and development (other non-market). . . . . . . . . . . . . . . . . . . . . . .Legal activities. . . . . . . . . . . . . . . . . . . . . . . . . . . . . . . . . . . . . . . . . . . . . . . . .Accounting, book-keeping, auditing. . . . . . . . . . . . . . . . . . . . . . . . . . . . . . .Consulting engineers, architects. . . . . . . . . . . . . . . . . . . . . . . . . . . . . . . . . .Advertising. . . . . . . . . . . . . . . . . . . . . . . . . . . . . . . . . . . . . . . . . . . . . . . . . . .Building-cleaning activities. . . . . . . . . . . . . . . . . . . . . . . . . . . . . . . . . . . . . . .Other business activities. . . . . . . . . . . . . . . . . . . . . . . . . . . . . . . . . . . . . . . . .General (overall) public service activities. . . . . . . . . . . . . . . . . . . . . . . . . . . .Administration of public sectors exc. for business. . . . . . . . . . . . . . . . . . . . .Regulation of and contribution to more efficient operation of business. . . .Defence, police and administration of justice. . . . . . . . . . . . . . . . . . . . . . . .Primary education. . . . . . . . . . . . . . . . . . . . . . . . . . . . . . . . . . . . . . . . . . . . . .Secondary education. . . . . . . . . . . . . . . . . . . . . . . . . . . . . . . . . . . . . . . . . . . .Higher education. . . . . . . . . . . . . . . . . . . . . . . . . . . . . . . . . . . . . . . . . . . . . . .Adult and other education (market). . . . . . . . . . . . . . . . . . . . . . . . . . . . . . . .Adult and other education (other non-market). . . . . . . . . . . . . . . . . . . . . . .Hospital activities. . . . . . . . . . . . . . . . . . . . . . . . . . . . . . . . . . . . . . . . . . . . . .Medical, dental and veterinary activities. . . . . . . . . . . . . . . . . . . . . . . . . . . .Social institutions etc. for children. . . . . . . . . . . . . . . . . . . . . . . . . . . . . . . . .Social institutions etc. for adults. . . . . . . . . . . . . . . . . . . . . . . . . . . . . . . . . . .Sewage removal and purifying plants. . . . . . . . . . . . . . . . . . . . . . . . . . . . . .Refuse collection and sanitation. . . . . . . . . . . . . . . . . . . . . . . . . . . . . . . . . . .Refuse dumps and refuse disposal plants. . . . . . . . . . . . . . . . . . . . . . . . . . . .Activities of membership organizations. . . . . . . . . . . . . . . . . . . . . . . . . . . . .Recreational, cultural, sporting activities (market). . . . . . . . . . . . . . . . . . . .Recreational, cultural, sporting activities (other non-market). . . . . . . . . . . .Other service activities. . . . . . . . . . . . . . . . . . . . . . . . . . . . . . . . . . . . . . . . . .Private households with employed persons. . . . . . . . . . . . . . . . . . . . . . . . . .Of which Danish operated ships bunkering abroad. . . . . . . . . . . . .Of which Danish operated planes bunkering abroad. . . . . . . . . . .Total industries excl. of bunkering abroad. . . . . . . . . . . . . . . . . . . . . . . . . . .303518-24134115132252351717182841424149592062121283214122411479546301735121386155 991563 5804965-2225266 1351995293519-2920716727931034143915252269329153813311531414134347234720714161388605271612301916438 455661 964928198-2658279 219199619971998314216-25257192321041039185011261832740762101231173152414535724482371720161085761919133822216112 065756 64510382210-38714280 9841999334416-32257199331141138195113221535238958101332174152413544934482581822161185365920133922226811 318757 8451041239-37013275 216
Tonnes CH4313140411515--3033212288178183283010104410113536161743451413252520183723962853095865891313343517183311552245141455333388224444882122771517181915169108848556065891819113335382123182049529 65211 8476661 50158 627101031342123910--2608284 43928610279 391
61CH4emissions broken down by industries and by households2000313817-312582003411411392054122715309481471012301841625146441035582691824171274570921124224247210 384657 87511442410-2001293717-2624718433124113718551128153754465110122817415251364515345825102029121964666920123920236911 074657 5741045229-2002293616-2624717935124113719589251026649846111124184162514545141651030102131151174170921124220238014 815554 9921145259-200320042005293616-232261583010493317539261133580055101121153151513534121559289192913975259818123617206912 490651 2731040228-2006*293716-2119514027938301545927113681 028579101813314141143411154824817251187571057151266151711811 854651 486834187-2007*303817-1917412824837271340926112401 16156810161131414104331014472271623976581016131263131511312 206650 621729166-Construction of new buildingsRepair and maintenance of buildingsCivil engineeringConstruction materials for own-account repairSale of motor vehicles and motorcyclesMaintenance and repair of motor vehiclesRetail sale of automotive fuelWholesale except of motor vehiclesRetail trade of foodDepartment storesRe. sale of phar. goods, cosmetic art.Re. sale of clothing and footwearOther retail sale, repair workHotelsRestaurantsTransport via railwaysOther scheduled passenger land transportTaxi operation and coach servicesFreight transport by road and via pipelinesWater transportAir transportCargo handling, harbours etc., travel agenciesActivities of other transport agenciesPost and telecommunicationsFinancial institutionsMortgage credit institutionsLife insurance and pension fundingNon-life insuranceActivities auxiliary to financeReal estate agents etc.DwellingsLetting of non-residential buildingsRenting of transport equipment and machineryComputer activities exc. software consultancy and supplySoftware consultancy and supplyResearch and development (market)Research and development (other non-market)Legal activitiesAccounting, book-keeping, auditingConsulting engineers, architectsAdvertisingBuilding-cleaning activitiesOther business activitiesGeneral (overall) public service activitiesAdministration of public sectors exc. for businessRegulation of and contribution to more efficient operation of businessDefence, police and administration of justicePrimary educationSecondary educationHigher educationAdult and other education (market)Adult and other education (other non-market)Hospital activitiesMedical, dental and veterinary activitiesSocial institutions etc. for childrenSocial institutions etc. for adultsSewage removal and purifying plantsRefuse collection and sanitationRefuse dumps and refuse disposal plantsActivities of membership organizationsRecreational, cultural, sporting activities (market)Recreational, cultural, sporting activities (other non-market)Other service activitiesPrivate households with employed persons
Table A.5 (cont.)
Tonnes CH4303037381717--26252423661761683433111144111037361919575798262610112843015876305043111011112423181744116522551414554455131311665510930291010212030301514101077425369669920201122413920192322797514 342 13 1225656 082 51 60411114544242499--
4594244815706147831 0111 145Of which Danish operated ships bunkering abroad101212139313435Of which Danish operated planes bunkering abroad274 482 280 369 278 933 277 495 268 277 262 458 259 435 264 174 Total industries excl. of bunkering abroad
62Table A.6CO2equivalents (GWP) broken down by industries and by households199019951996199719981999
1 000 tonnes CO2equivalents (GWP)
Total emissions. . . . . . . . . . . . . . . . . . . . . . . . . . . . . . . . . . . . . . . . . . . . . . .CO2sequestration. . . . . . . . . . . . . . . . . . . . . . . . . . . . . . . . . . . . . . . . . . . . . .Households. . . . . . . . . . . . . . . . . . . . . . . . . . . . . . . . . . . . . . . . . . . . . . . . . . .Other emissions. . . . . . . . . . . . . . . . . . . . . . . . . . . . . . . . . . . . . . . . . . . . . . . .011009011209014000020000050000110000140009151000152000153000154000155000156009158109158120158300159000160000170000180000190000200000210000221200221309222009230000241109241209241500241617242000243000244000245070251122252300252400261126263053266080271000272030274000275000281009286009291000292000293000294009297000300000310000320000330000340000351000352050361000362060370000401000402000403000
81 181- 2 8319 8543 80770 35014 22558319323843813287222163321122762906022423276101242010763496134294181051 0797112108204856131021 789460961920210698556039513045517193229671181020 662994 236
87 555- 2 99310 9181 22478 40613 190643245326091 1112972382723668250453544230422099416993182412431 4358117964211099197807171012 573499941320114284636241472143915163142207120625 606714 638
101 182- 3 06911 3771 84291 03212 806655241386761 28225324319942138280312592331522189917793210413381 464812190610212109198899201022 7475359513182146108706646472034022224142128227437 789734 805
92 997- 3 16210 9391 98783 23212 627617235356231 714273244230431062952755924363222891155102212412301 1646969309112118197941118993 003480981220113699637843471934122323749137421428 943614 416
92 044- 3 32010 8381 30583 22112 636578240366321 697263256214421143172715826369234892135103237413301 022666895811214617810411191092 87049010313211137100648047441924023323747147522424 443585 143
88 998- 3 32010 7122 27279 33411 974521266346332 28630427922237122330230622435721789815597212718381 0587591 02471061211119310910261242 755552101141515159103677942481444524223431127723321 490564 905
Total industries. . . . . . . . . . . . . . . . . . . . . . . . . . . . . . . . . . . . . . . . . . . . . . .Agriculture. . . . . . . . . . . . . . . . . . . . . . . . . . . . . . . . . . . . . . . . . . . . . . . . . . . .Horticulture, orchards etc.. . . . . . . . . . . . . . . . . . . . . . . . . . . . . . . . . . . . . . . .Agricultural services; landscape gardeners etc.. . . . . . . . . . . . . . . . . . . . . . .Forestry. . . . . . . . . . . . . . . . . . . . . . . . . . . . . . . . . . . . . . . . . . . . . . . . . . . . . .Fishing. . . . . . . . . . . . . . . . . . . . . . . . . . . . . . . . . . . . . . . . . . . . . . . . . . . . . . .Extr. of oil and natural gas. . . . . . . . . . . . . . . . . . . . . . . . . . . . . . . . . . . . . . .Extr. of gravel and clay etc.. . . . . . . . . . . . . . . . . . . . . . . . . . . . . . . . . . . . . . .Production etc. of meat and meat products. . . . . . . . . . . . . . . . . . . . . . . . . .Processing and preserving of fish and fish products. . . . . . . . . . . . . . . . . . .Processing and preserving of fruit and vegetables. . . . . . . . . . . . . . . . . . . . .Mfr. of vegetable and animal oils and fats. . . . . . . . . . . . . . . . . . . . . . . . . . .Mfr. of dairy products. . . . . . . . . . . . . . . . . . . . . . . . . . . . . . . . . . . . . . . . . . .Mfr. of starch, chocolate and sugar products. . . . . . . . . . . . . . . . . . . . . . . . .Mfr. of bread, cakes and biscuits. . . . . . . . . . . . . . . . . . . . . . . . . . . . . . . . . .Bakers shops. . . . . . . . . . . . . . . . . . . . . . . . . . . . . . . . . . . . . . . . . . . . . . . . . .Manufacture of sugar. . . . . . . . . . . . . . . . . . . . . . . . . . . . . . . . . . . . . . . . . . .Manufacture of beverages. . . . . . . . . . . . . . . . . . . . . . . . . . . . . . . . . . . . . . .Manufacture of tobacco products. . . . . . . . . . . . . . . . . . . . . . . . . . . . . . . . . .Mfr. of textiles. . . . . . . . . . . . . . . . . . . . . . . . . . . . . . . . . . . . . . . . . . . . . . . .Mfr. of wearing apparel. . . . . . . . . . . . . . . . . . . . . . . . . . . . . . . . . . . . . . . . .Mfr. of leather and footwear. . . . . . . . . . . . . . . . . . . . . . . . . . . . . . . . . . . . .Mfr. of wood and wood products. . . . . . . . . . . . . . . . . . . . . . . . . . . . . . . . . .Mfr. of pulp, paper and paper products. . . . . . . . . . . . . . . . . . . . . . . . . . . . .Publishing of newspapers. . . . . . . . . . . . . . . . . . . . . . . . . . . . . . . . . . . . . . . .Publishing activities, excluding newspapers. . . . . . . . . . . . . . . . . . . . . . . . .Printing activities. . . . . . . . . . . . . . . . . . . . . . . . . . . . . . . . . . . . . . . . . . . . . . .Mfr. of refined petroleum products etc.. . . . . . . . . . . . . . . . . . . . . . . . . . . . .Mfr. of industrial gases and inorganic basic chemicals. . . . . . . . . . . . . . . . .Mfr. of dyes, pigments and organic basic chemicals. . . . . . . . . . . . . . . . . . .Manufacture of fertilizers. . . . . . . . . . . . . . . . . . . . . . . . . . . . . . . . . . . . . . . .Mfr. of plastics and synthetic rubber. . . . . . . . . . . . . . . . . . . . . . . . . . . . . . .Manufacture of pesticides and other agro-chemical products. . . . . . . . . . . .Mfr. of paints, varnishes and similar coatings, printing ink and mastics. . .Mfr. of pharmaceuticals etc.. . . . . . . . . . . . . . . . . . . . . . . . . . . . . . . . . . . . . .Mfr. of detergents and other chemical products. . . . . . . . . . . . . . . . . . . . . .Mfr. of rubber products and plastic packing goods etc.. . . . . . . . . . . . . . . . .Mfr. of builders ware of plastic. . . . . . . . . . . . . . . . . . . . . . . . . . . . . . . . . . . .Manufacture of other plastic products n.e.c.. . . . . . . . . . . . . . . . . . . . . . . . .Mfr. of glass and ceramic goods etc.. . . . . . . . . . . . . . . . . . . . . . . . . . . . . . .Mfr. of cement, bricks, tiles, flags etc.. . . . . . . . . . . . . . . . . . . . . . . . . . . . . .Mfr. of concrete, cement, asphalt and rockwool products. . . . . . . . . . . . . .Mfr. of basic iron and steel and of ferro alloys. . . . . . . . . . . . . . . . . . . . . . . .First processing of iron and steel. . . . . . . . . . . . . . . . . . . . . . . . . . . . . . . . . .Mfr. of basic non-ferrous metals. . . . . . . . . . . . . . . . . . . . . . . . . . . . . . . . . . .Casting of metal products. . . . . . . . . . . . . . . . . . . . . . . . . . . . . . . . . . . . . . . .Mfr. of building materials of metal. . . . . . . . . . . . . . . . . . . . . . . . . . . . . . . . .Mfr. of various metal products. . . . . . . . . . . . . . . . . . . . . . . . . . . . . . . . . . . .Mfr. of marine engines and compressors. . . . . . . . . . . . . . . . . . . . . . . . . . .Mfr. of ovens and cold-storage plants. . . . . . . . . . . . . . . . . . . . . . . . . . . . . .Mfr. of agricultural machinery. . . . . . . . . . . . . . . . . . . . . . . . . . . . . . . . . . . .Mfr. of machinery for industries. . . . . . . . . . . . . . . . . . . . . . . . . . . . . . . . . . .Mfr. of domestic appliances. . . . . . . . . . . . . . . . . . . . . . . . . . . . . . . . . . . . . .Mfr. of office machinery and computers. . . . . . . . . . . . . . . . . . . . . . . . . . . . .Mfr. of other electrical machinery and apparatus. . . . . . . . . . . . . . . . . . . . .Mfr. of radio and communication equipment. . . . . . . . . . . . . . . . . . . . . . . . .Mfr. of medical and optical instruments. . . . . . . . . . . . . . . . . . . . . . . . . . . . .Manufacture of motor vehicles etc.. . . . . . . . . . . . . . . . . . . . . . . . . . . . . . . .Building and repairing of ships and boats. . . . . . . . . . . . . . . . . . . . . . . . . . .Mfr. of transport equipment excl. ships, motor vehicles etc.. . . . . . . . . . . . .Mfr. of furniture. . . . . . . . . . . . . . . . . . . . . . . . . . . . . . . . . . . . . . . . . . . . . . . .Mfr. of toys, gold and silver articles etc.. . . . . . . . . . . . . . . . . . . . . . . . . . . .Recycling of waste and scrap. . . . . . . . . . . . . . . . . . . . . . . . . . . . . . . . . . . . .Production and distribution of electricity. . . . . . . . . . . . . . . . . . . . . . . . . . . .Manufacture and distribution of gas. . . . . . . . . . . . . . . . . . . . . . . . . . . . . . .Steam and hot water supply. . . . . . . . . . . . . . . . . . . . . . . . . . . . . . . . . . . . . .
63CO2equivalents (GWP) broken down by industries and by households2000200120022003200420052006*2007*
Table A.6
1 000 tonnes CO2equivalents (GWP)
90 527- 66410 4062 61878 16711 856480279416632 06633325122240123314302612130620599613596206718381 0736621 0646108121141911068251192 720486981518191579366684249103452423293097521318 453474 551
88 431- 3 55110 3883 00578 59011 838496290446212 07435823522241128308393642126820799512578207719411 0936669356114121212031077221182 73545296172020162876667455283472525273277522319 597474 910
88 257- 3 82710 5631 89779 62411 462447273366302 08033722320942120290380592124619489211574198818401 0596648226110131162171057221122 72843344161820160856569435383492525273077121419 895454 703
96 785- 3 54710 7131 05588 56411 237378262406132 0933092241364913028722958203112261081137782101327471 1048639503110129520610711281002 614450771216211799269754860123602829383087826424 818444 561
93 565- 3 46510 6272 36584 03911 279342259405422 2003082231394813228423258223272241080137792061327461 094863535310816942041061128982 812466751316211829269774861123602829373087926418 913474 411
98 108 114 335 115 188 Total emissions- 1 797 - 2 783 - 2 977 CO2sequestration10 413 10 1469 885 Households1 7131 6271 490 Other emissions87 779 105 346 106 790 Total industries11 235 10 855 11 304 Agriculture356346318 Horticulture, orchards etc.270264283 Agricultural services; landscape gardeners etc.444347 Forestry528502460 Fishing2 0682 0822 009 Extr. of oil and natural gas292262220 Extr. of gravel and clay etc.190177134 Production etc. of meat and meat products129153160 Processing and preserving of fish and fish products444957 Processing and preserving of fruit and vegetables102107109 Mfr. of vegetable and animal oils and fats334330304 Mfr. of dairy products336360398 Mfr. of starch, chocolate and sugar products707272 Mfr. of bread, cakes and biscuits191819 Bakers shops294283232 Manufacture of sugar220223220 Manufacture of beverages888 Manufacture of tobacco products545138 Mfr. of textiles111214 Mfr. of wearing apparel233 Mfr. of leather and footwear778275 Mfr. of wood and wood products214214168 Mfr. of pulp, paper and paper products111112 Publishing of newspapers252628 Publishing activities, excluding newspapers424343 Printing activities1 0321 0991 105 Mfr. of refined petroleum products etc.888 Mfr. of industrial gases and inorganic basic chemicals676465 Mfr. of dyes, pigments and organic basic chemicals211 Manufacture of fertilizers222 Mfr. of plastics and synthetic rubber1009990 Manufacture of pesticides and other agro-chemical products101010 Mfr. of paints, varnishes and similar coatings, printing ink and mastics878472 Mfr. of pharmaceuticals etc.186165141 Mfr. of detergents and other chemical products838292 Mfr. of rubber products and plastic packing goods etc.1098 Mfr. of builders ware of plastic352825 Manufacture of other plastic products n.e.c.818183 Mfr. of glass and ceramic goods etc.2 7032 8692 976 Mfr. of cement, bricks, tiles, flags etc.463517564 Mfr. of concrete, cement, asphalt and rockwool products839197 Mfr. of basic iron and steel and of ferro alloys779 First processing of iron and steel91115 Mfr. of basic non-ferrous metals121210 Casting of metal products159194218 Mfr. of building materials of metal858787 Mfr. of various metal products938839 Mfr. of marine engines and compressors747781 Mfr. of ovens and cold-storage plants384047 Mfr. of agricultural machinery576062 Mfr. of machinery for industries888 Mfr. of domestic appliances233 Mfr. of office machinery and computers555553 Mfr. of other electrical machinery and apparatus161719 Mfr. of radio and communication equipment262525 Mfr. of medical and optical instruments333537 Manufacture of motor vehicles etc.313236 Building and repairing of ships and boats778 Mfr. of transport equipment excl. ships, motor vehicles etc.636469 Mfr. of furniture232121 Mfr. of toys, gold and silver articles etc.444 Recycling of waste and scrap15 678 23 437 18 736 Production and distribution of electricity383735 Manufacture and distribution of gas4 3534 2454 158 Steam and hot water supply
64Table A.6 (cont.)CO2equivalents (GWP) broken down by industries and by households1990410000450001450002450003450004501009502000505000510000521090522990523000524190524490551009553009601000602100602223602409610000620000631130634000640000651000652000660102660300670000701109702009702040710000721009722000730001730002741100741200742009744000747000748009751100751209751300752000801000802000803000804001804002851100851209853109853209900010900020900030910000920001920002930009950000Collection and distribution of water. . . . . . . . . . . . . . . . . . . . . . . . . . . . . . . .Construction of new buildings. . . . . . . . . . . . . . . . . . . . . . . . . . . . . . . . . . . .Repair and maintenance of buildings. . . . . . . . . . . . . . . . . . . . . . . . . . . . . . .Civil engineering. . . . . . . . . . . . . . . . . . . . . . . . . . . . . . . . . . . . . . . . . . . . . . .Construction materials for own-account repair. . . . . . . . . . . . . . . . . . . . . . .Sale of motor vehicles and motorcycles. . . . . . . . . . . . . . . . . . . . . . . . . . . . .Maintenance and repair of motor vehicles. . . . . . . . . . . . . . . . . . . . . . . . . .Retail sale of automotive fuel. . . . . . . . . . . . . . . . . . . . . . . . . . . . . . . . . . . . .Wholesale except of motor vehicles. . . . . . . . . . . . . . . . . . . . . . . . . . . . . . . .Retail trade of food. . . . . . . . . . . . . . . . . . . . . . . . . . . . . . . . . . . . . . . . . . . .Department stores. . . . . . . . . . . . . . . . . . . . . . . . . . . . . . . . . . . . . . . . . . . . . .Re. sale of phar. goods, cosmetic art.. . . . . . . . . . . . . . . . . . . . . . . . . . . . . . .Re. sale of clothing and footwear. . . . . . . . . . . . . . . . . . . . . . . . . . . . . . . . . .Other retail sale, repair work. . . . . . . . . . . . . . . . . . . . . . . . . . . . . . . . . . . . .Hotels. . . . . . . . . . . . . . . . . . . . . . . . . . . . . . . . . . . . . . . . . . . . . . . . . . . . . . . .Restaurants. . . . . . . . . . . . . . . . . . . . . . . . . . . . . . . . . . . . . . . . . . . . . . . . . . .Transport via railways. . . . . . . . . . . . . . . . . . . . . . . . . . . . . . . . . . . . . . . . . . .Other scheduled passenger land transport. . . . . . . . . . . . . . . . . . . . . . . . . . .Taxi operation and coach services. . . . . . . . . . . . . . . . . . . . . . . . . . . . . . . . .Freight transport by road and via pipelines. . . . . . . . . . . . . . . . . . . . . . . . . .Water transport. . . . . . . . . . . . . . . . . . . . . . . . . . . . . . . . . . . . . . . . . . . . . . . .Air transport. . . . . . . . . . . . . . . . . . . . . . . . . . . . . . . . . . . . . . . . . . . . . . . . . .Cargo handling, harbours etc., travel agencies. . . . . . . . . . . . . . . . . . . . . . .Activities of other transport agencies. . . . . . . . . . . . . . . . . . . . . . . . . . . . . . .Post and telecommunications. . . . . . . . . . . . . . . . . . . . . . . . . . . . . . . . . . . . .Financial institutions. . . . . . . . . . . . . . . . . . . . . . . . . . . . . . . . . . . . . . . . . . . .Mortgage credit institutions. . . . . . . . . . . . . . . . . . . . . . . . . . . . . . . . . . . . . .Life insurance and pension funding. . . . . . . . . . . . . . . . . . . . . . . . . . . . . . . .Non-life insurance. . . . . . . . . . . . . . . . . . . . . . . . . . . . . . . . . . . . . . . . . . . . . .Activities auxiliary to finance. . . . . . . . . . . . . . . . . . . . . . . . . . . . . . . . . . . . .Real estate agents etc.. . . . . . . . . . . . . . . . . . . . . . . . . . . . . . . . . . . . . . . . . .Dwellings. . . . . . . . . . . . . . . . . . . . . . . . . . . . . . . . . . . . . . . . . . . . . . . . . . . . .Letting of non-residential buildings. . . . . . . . . . . . . . . . . . . . . . . . . . . . . . . .Renting of transport equipment and machinery. . . . . . . . . . . . . . . . . . . . . . .Computer activities exc. software consultancy and supply. . . . . . . . . . . . . .Software consultancy and supply. . . . . . . . . . . . . . . . . . . . . . . . . . . . . . . . . .Research and development (market). . . . . . . . . . . . . . . . . . . . . . . . . . . . . . .Research and development (other non-market). . . . . . . . . . . . . . . . . . . . . . .Legal activities. . . . . . . . . . . . . . . . . . . . . . . . . . . . . . . . . . . . . . . . . . . . . . . . .Accounting, book-keeping, auditing. . . . . . . . . . . . . . . . . . . . . . . . . . . . . . .Consulting engineers, architects. . . . . . . . . . . . . . . . . . . . . . . . . . . . . . . . . .Advertising. . . . . . . . . . . . . . . . . . . . . . . . . . . . . . . . . . . . . . . . . . . . . . . . . . .Building-cleaning activities. . . . . . . . . . . . . . . . . . . . . . . . . . . . . . . . . . . . . . .Other business activities. . . . . . . . . . . . . . . . . . . . . . . . . . . . . . . . . . . . . . . . .General (overall) public service activities. . . . . . . . . . . . . . . . . . . . . . . . . . . .Administration of public sectors exc. for business. . . . . . . . . . . . . . . . . . . . .Regulation of and contribution to more efficient operation of business. . . .Defence, police and administration of justice. . . . . . . . . . . . . . . . . . . . . . . .Primary education. . . . . . . . . . . . . . . . . . . . . . . . . . . . . . . . . . . . . . . . . . . . . .Secondary education. . . . . . . . . . . . . . . . . . . . . . . . . . . . . . . . . . . . . . . . . . . .Higher education. . . . . . . . . . . . . . . . . . . . . . . . . . . . . . . . . . . . . . . . . . . . . . .Adult and other education (market). . . . . . . . . . . . . . . . . . . . . . . . . . . . . . . .Adult and other education (other non-market). . . . . . . . . . . . . . . . . . . . . . .Hospital activities. . . . . . . . . . . . . . . . . . . . . . . . . . . . . . . . . . . . . . . . . . . . . .Medical, dental and veterinary activities. . . . . . . . . . . . . . . . . . . . . . . . . . . .Social institutions etc. for children. . . . . . . . . . . . . . . . . . . . . . . . . . . . . . . . .Social institutions etc. for adults. . . . . . . . . . . . . . . . . . . . . . . . . . . . . . . . . . .Sewage removal and purifying plants. . . . . . . . . . . . . . . . . . . . . . . . . . . . . .Refuse collection and sanitation. . . . . . . . . . . . . . . . . . . . . . . . . . . . . . . . . . .Refuse dumps and refuse disposal plants. . . . . . . . . . . . . . . . . . . . . . . . . . . .Activities of membership organizations. . . . . . . . . . . . . . . . . . . . . . . . . . . . .Recreational, cultural, sporting activities (market). . . . . . . . . . . . . . . . . . . .Recreational, cultural, sporting activities (other non-market). . . . . . . . . . . .Other service activities. . . . . . . . . . . . . . . . . . . . . . . . . . . . . . . . . . . . . . . . . .Private households with employed persons. . . . . . . . . . . . . . . . . . . . . . . . . .Of which Danish operated ships bunkering abroad. . . . . . . . . . . . .Of which Danish operated planes bunkering abroad. . . . . . . . . . .Emissions from biomass. . . . . . . . . . . . . . . . . . . . . . . . . . . . . . . . . . . . . . . . .Total industries excl. of bunkering abroad. . . . . . . . . . . . . . . . . . . . . . . . . . .1267373181-1338922770867723154301043361502211 42910 1722 281325210034921139542618514410920461945433021473531123429413854341102243421 34419574144-9 3602754 64160 716199519961997199819992415610238-14910216735691082014323722562432031 69116 3802 72934821242162631223331111213671452226756312457411683422622393340105348671 22315613038-15 5826936 85763 058
1 000 tonnes CO2equivalents (GWP)2222299325342364403476501535233188200209----14214114710210210295991819161471575771270579807972101210977662222201914715114514539372822788071793243143042592492592582742282222252211 5071 6081 5811 71612 27212 01913 01317 1382 3962 6423 1012 971483032327977798095110107100212627216765222257763333121212113837333127384136111211111367817181715233356657887161718164753474818192120495559584449535225293027172021204848515357444441446265858664253435342025262045551517181936474838374243382935363480949693303315355362575961641 3041 3151 2571 21516181814516162592936373027474345----11 1664315 86966 80910 9284366 29679 66812 0475446 54270 64116 2737546 49266 193
65CO2equivalents (GWP) broken down by industries and by households20003359505230-132901364963991813421672472442221 54820 2662 13634771182152631224431110243671649226758292250269693022719404236100325601 22515642936-19 3305207 16958 31720013378533245-1349315648651061913820712312592401 66818 7742 4023581109195253122543181028357155523696224275125161362072035373595341651 21514642738-17 8396377 90260 11420022003200420052006*2482681286-18611011719681071915323822313102061 96843 2732 8735196872272631424441611332991873289198352871301793325825473647130348771 08918763538-42 5431 82011 33560 9842007*2520735307-1951151173768981916121792323362272 16248 8852 80754103901862531424461611332881773289498342877361653121927373345119352841 06916683038-Collection and distribution of waterConstruction of new buildingsRepair and maintenance of buildingsCivil engineeringConstruction materials for own-account repairSale of motor vehicles and motorcyclesMaintenance and repair of motor vehiclesRetail sale of automotive fuelWholesale except of motor vehiclesRetail trade of foodDepartment storesRe. sale of phar. goods, cosmetic art.Re. sale of clothing and footwearOther retail sale, repair workHotelsRestaurantsTransport via railwaysOther scheduled passenger land transportTaxi operation and coach servicesFreight transport by road and via pipelinesWater transportAir transportCargo handling, harbours etc., travel agenciesActivities of other transport agenciesPost and telecommunicationsFinancial institutionsMortgage credit institutionsLife insurance and pension fundingNon-life insuranceActivities auxiliary to financeReal estate agents etc.DwellingsLetting of non-residential buildingsRenting of transport equipment and machineryComputer activities exc. software consultancy and supplySoftware consultancy and supplyResearch and development (market)Research and development (other non-market)Legal activitiesAccounting, book-keeping, auditingConsulting engineers, architectsAdvertisingBuilding-cleaning activitiesOther business activitiesGeneral (overall) public service activitiesAdministration of public sectors exc. for businessRegulation of and contribution to more efficient operation of businessDefence, police and administration of justicePrimary educationSecondary educationHigher educationAdult and other education (market)Adult and other education (other non-market)Hospital activitiesMedical, dental and veterinary activitiesSocial institutions etc. for childrenSocial institutions etc. for adultsSewage removal and purifying plantsRefuse collection and sanitationRefuse dumps and refuse disposal plantsActivities of membership organizationsRecreational, cultural, sporting activities (market)Recreational, cultural, sporting activities (other non-market)Other service activitiesPrivate households with employed persons
Table A.6 (cont.)
1 000 tonnes CO2equivalents (GWP)2222414429451456583606636644261267278275----162170175175971031031041112111163165566567762656463101099611661819181813114014014221222121747876752142222202372472612742881591711821911 5141 6231 7311 82220 966 24 736 26 511 33 6612 1092 3571 9692 6944346474877838790737780802023212067662222676633331313131322222121404341421418171610111111313232312222898889881618171763686669242626277682848684909192313434332527272757616466219238469534667572673434303021242322777820212223384341393336353440454444111125120118413396374357596368711 1641 1901 0901 08316171717647170692933323138403836----20 2436628 43058 71923 9846729 45363 90825 85846510 14257 71632 9551 62810 89353 195
48 177Of which Danish operated ships bunkering abroad1 856Of which Danish operated planes bunkering abroad12 110 Emissions from biomass56 757 Total industries excl. of bunkering abroad
66
Thematic publications from Statistics Denmark2009Greenhouse Gas Emissions from the Danish Economi70 sider, kun som net-publikation, TemaPubl 2009:3Arbejdsløshed - ny analyse af ledighedsforløb58 sider, 65,00 kr., TemaPubl 2009:2Productivity and Quality of the Public Sector67 sider, kun som net-publikation, TemaPubl 2009:12008Turisme - Regionalt, nationalt og internationalt154 sider, 155 kr., TemaPubl 2008:1Børns familier205 sider, 205 kr. TemaPubl 2008:220072006Sundhed og uddannelse. Ny metode i nationalregnskabet54 sider, 55 kr., TemaPubl 2007:1Det nye demografiske danmarkskort52 sider, 130 kr., TemaPubl 2006:4Videre fra grundskolen - de unges uddannelse42 sider, 130 kr., TemaPubl 2006:3Forskning og udvikling - nationalregnskabsmæssigt sattellitregnskab,1990-2003.53 sider, 164 kr., TemaPubl 2006:2Dansk erhvervsliv i internationalt perspektiv.45 sider, 130 kr., TemaPubl 2006:12005Dødelighed og erhverv 1996-2000, Udk. 2005. 65 sider. 126 kr.Familie og arbejdsliv. Udk. 2005. 34 sider, 74 kr.Vielser og skilsmisser - børn i skilsmisser. Udk. 2005. 59 sider, 126 kr.Privatøkonomi og uddannelse. Udk. 2005. 54 sider. 126 kr.Overgang til efterløn. Udk. 2005. 52 sider. 126 kr.Videre i uddannelsessystemet - fra de gymnasiale uddannelser. Udk. 2005.45 sider. 126 kr.Produktivitetsudviklingen i Danmark 1966-2003. Udk. 2005.129 sider. 240 kr.2004Befolkningens uddannelsesniveau. Udk. 2004. 47 sider. 122 kr.De nyuddannede og arbejdsmarkedet. Udk. 2004. 55 sider. 122 kr.De ældre og arbejdsmarkedet. Udk. 2004. 25 sider. 72 kr.Indvandrerne og arbejdsmarkedet. Udk. 2004. 61 sider. 122 kr.Køn og arbejdsliv. Udk. 2004. 45 sider. 122 kr.Produktivitetsudviklingen i Danmark 1988-2000. Udk. 2004.71 sider. 193 kr.Vandmiljøet. Udk. 2004. 42 sider. 115 kr.2003Danske virksomheders samarbejde 2003. Udk. 2004. 43 sider. 122 kr.Helbredsproblemer og arbejdsliv. Udk. 2003. 19 sider. 50 kr.2002Børns levevilkår. Udk. 2002. 177 sider. 196 kr.Skove og plantager 2000. Udk. 2002. 171 sider. 196 kr.
Læs nærmere omtale og bestil publikationerne påwww.dst.dk/boghandel,tlf. 39 17 30 20 eller [email protected]