Finansudvalget 2009-10
FIU Alm.del Bilag 124
Offentligt
DIRECTORATEGENERAL FORINTERNALPOLICIES
POLICYDEPARTMENT ONBUDGETARYAFFAIRS
EU BUDGET AND NATIONAL BUDGETS1998-2008
March 2010
INDEX
Foreward…………………………………………………………………………………………………………………………………………………………… 3Table 1. EU and National budgets 1998 - 2008; EU-27 (billions of Euro)………………………………………………………………………………… 4Table 2. EU and National budgets in 1998 and 2008; Countries currently in Eurozone (billions of Euro)………………………………………… 5Table 3. EU and National budgets in 1998 and 2008; Non-Eurozone countries (billions of Euro)………………………………………………… 5Table 4. EU and National budgets as % of GDP at market prices 1998 - 2008, EU-27………………………………………………………………… 6Table 5. EU and National budgets as % of GDP at market prices in 1998 and 2008, Countries currently in Eurozone………………………… 7Table 6. EU and National budgets as % of GDP at market prices in 1998 and 2008, Non-Eurozone countries…………………………………Chart 1. Growth in EU and National budgets between 1998 and 2008, EU-27 (per cent)……………………………………………………………78
Chart 2. Difference between growth in EU and National budgets between 1998 and 2008, EU-27 (per cent points)…………………………… 9Chart 3. Growth in EU and National budgets between 1998 and 2008, Eurozone countries (per cent)…………………………………………… 10Chart 4. Difference between growth in EU and National budgets between 1998 and 2008, Eurozone countries (per cent points)………… 11Chart 5. Growth in EU and National budgets between 1998 and 2008, Non-Eurozone countries (per cent)………………………………………12Chart 6. Difference between growth in EU and National budgets between 1998 and 2008, Non-Eurozone countries (per cent points) ……13Chart 7. EU budget as % of GDP 1998 - 2008………………………………………………………………………………………………………………… 14Chart 8. National budget as % of GDP at market prices in 1998 and 2008, EU-27…………………………………………………………………… 15Chart 9. National budget as % of GDP at market prices in 1998 and 2008, Eurozone countries…………………………………………………… 16Chart 10. National budget as % of GDP at market prices in 1998 and 2008, Non-Eurozone countries…………………………………………… 17
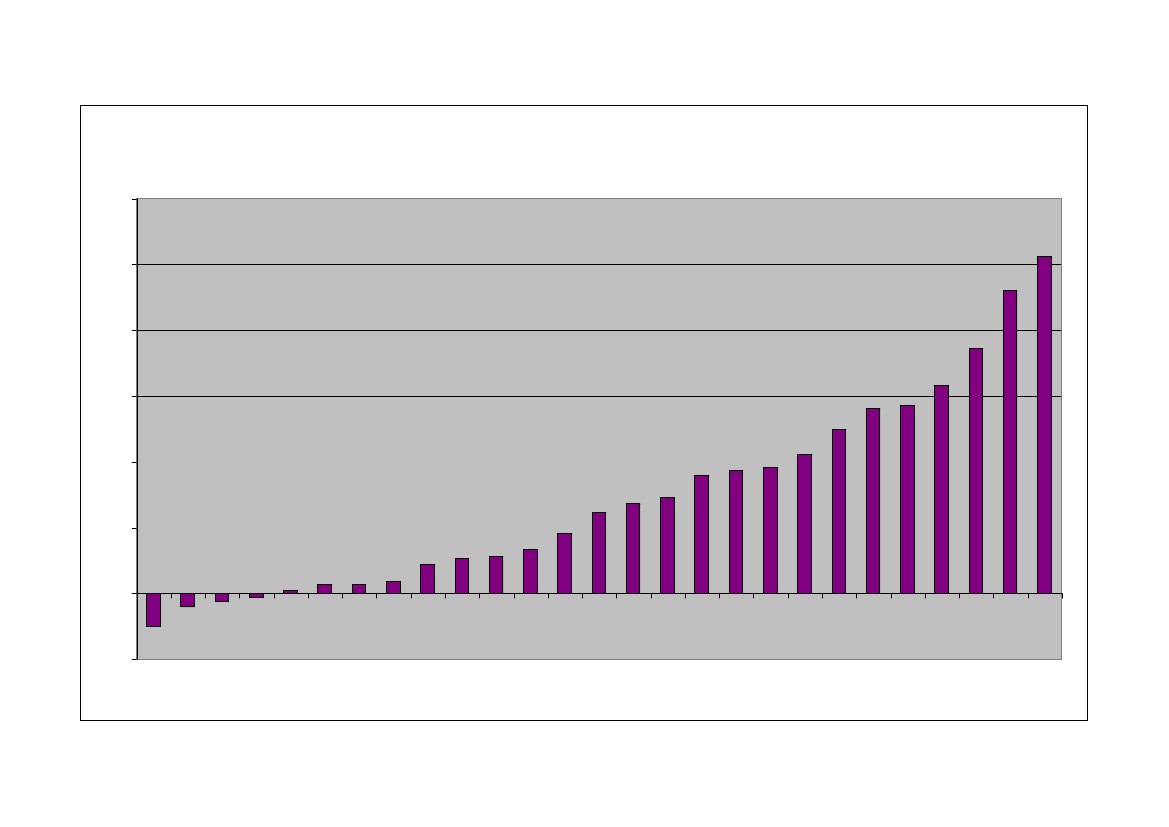
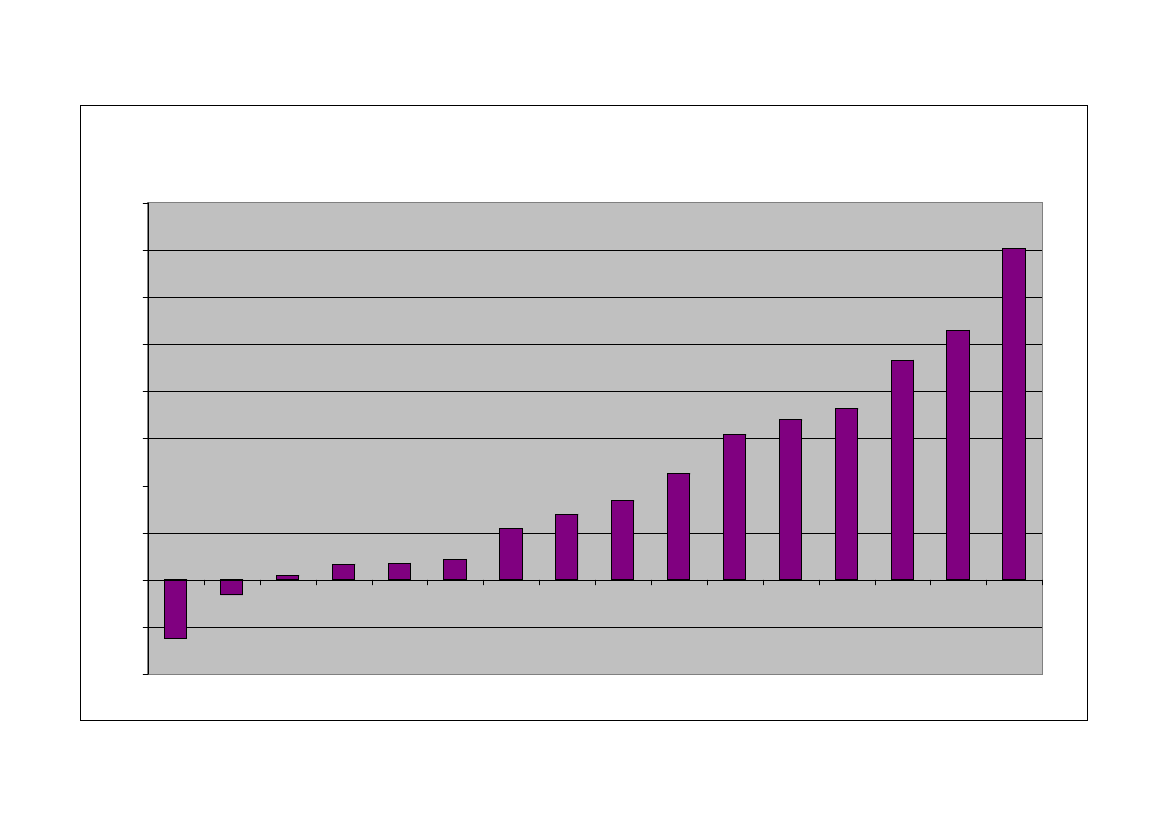
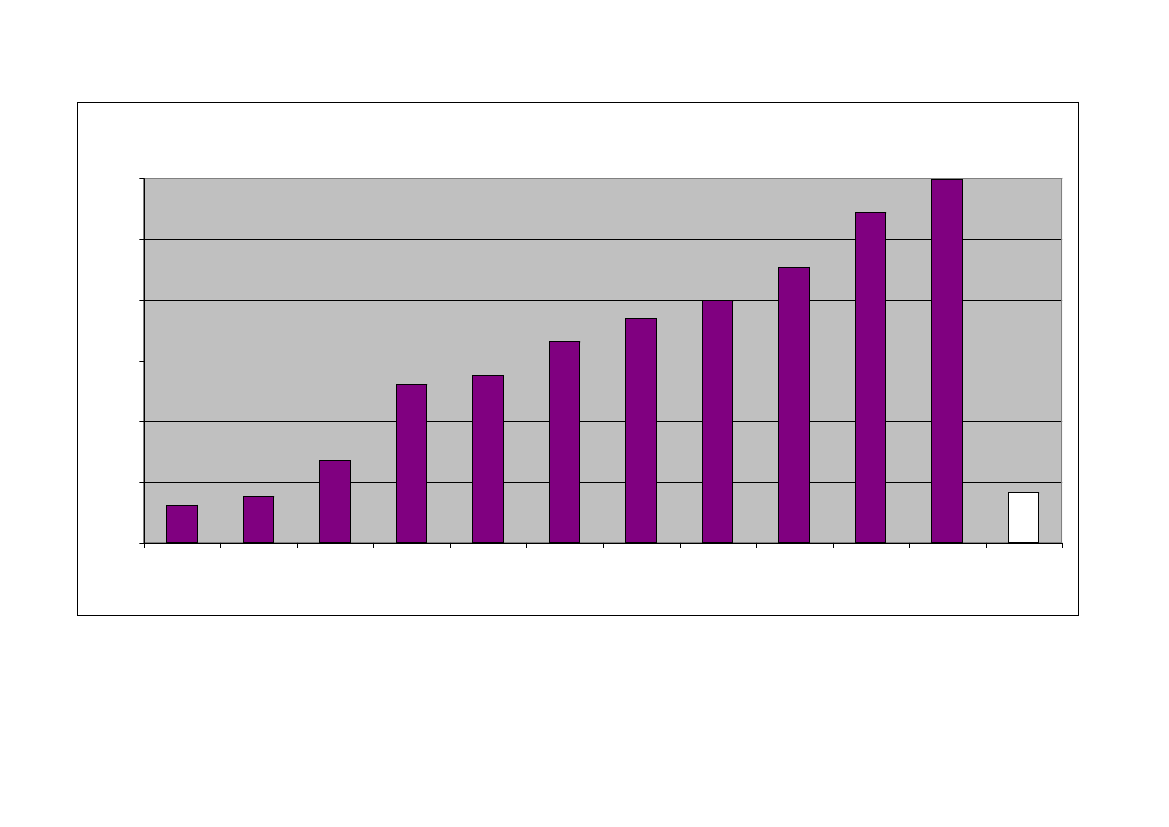
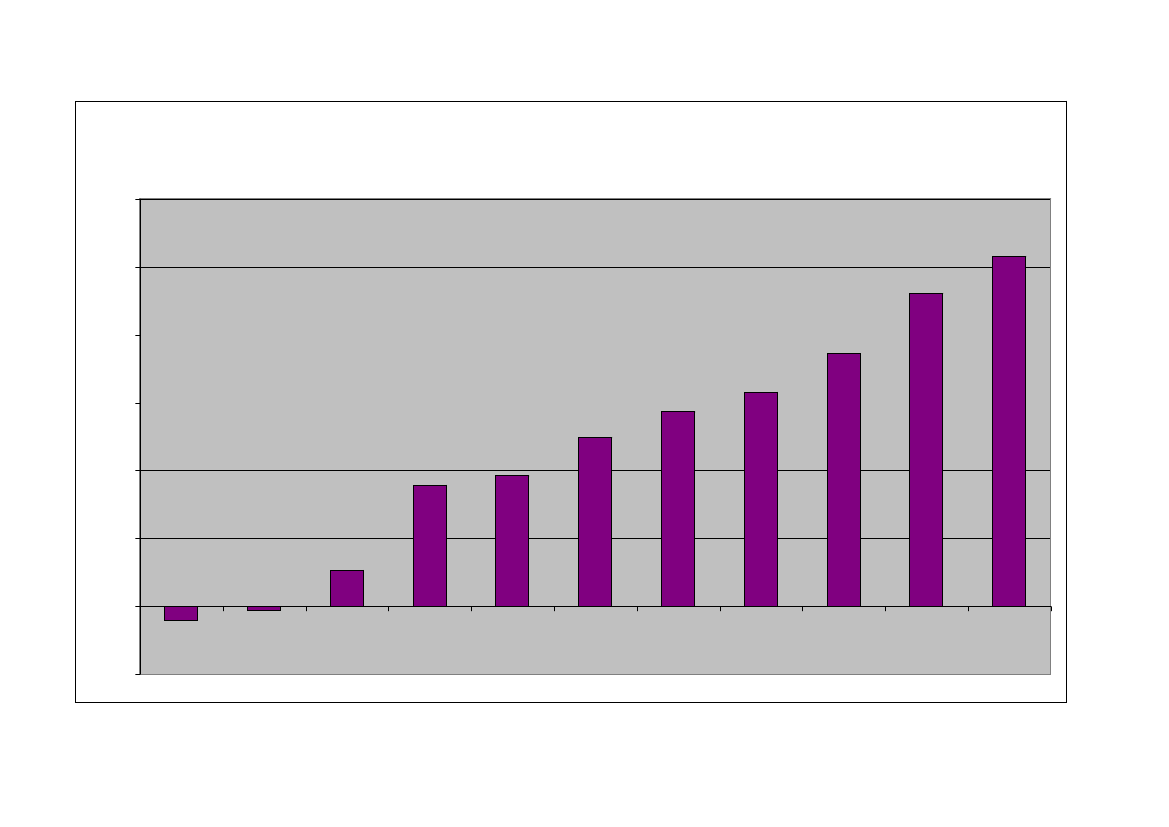
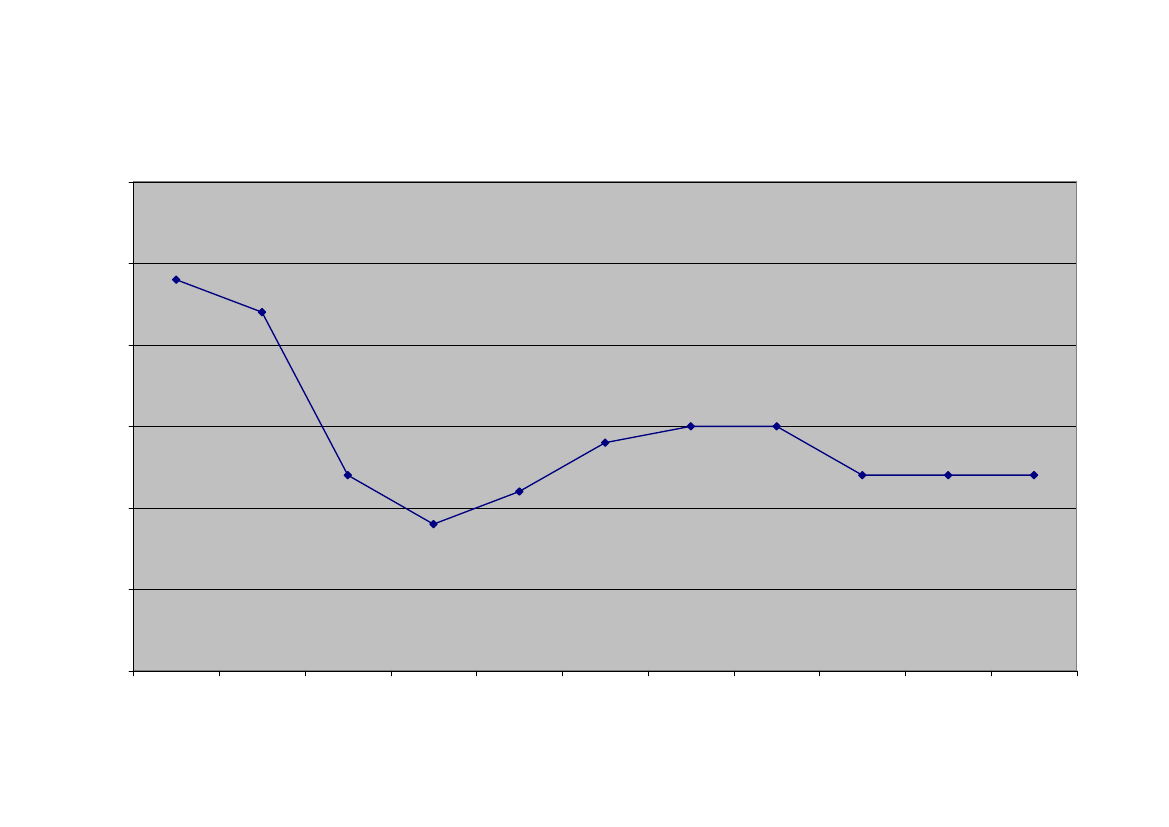
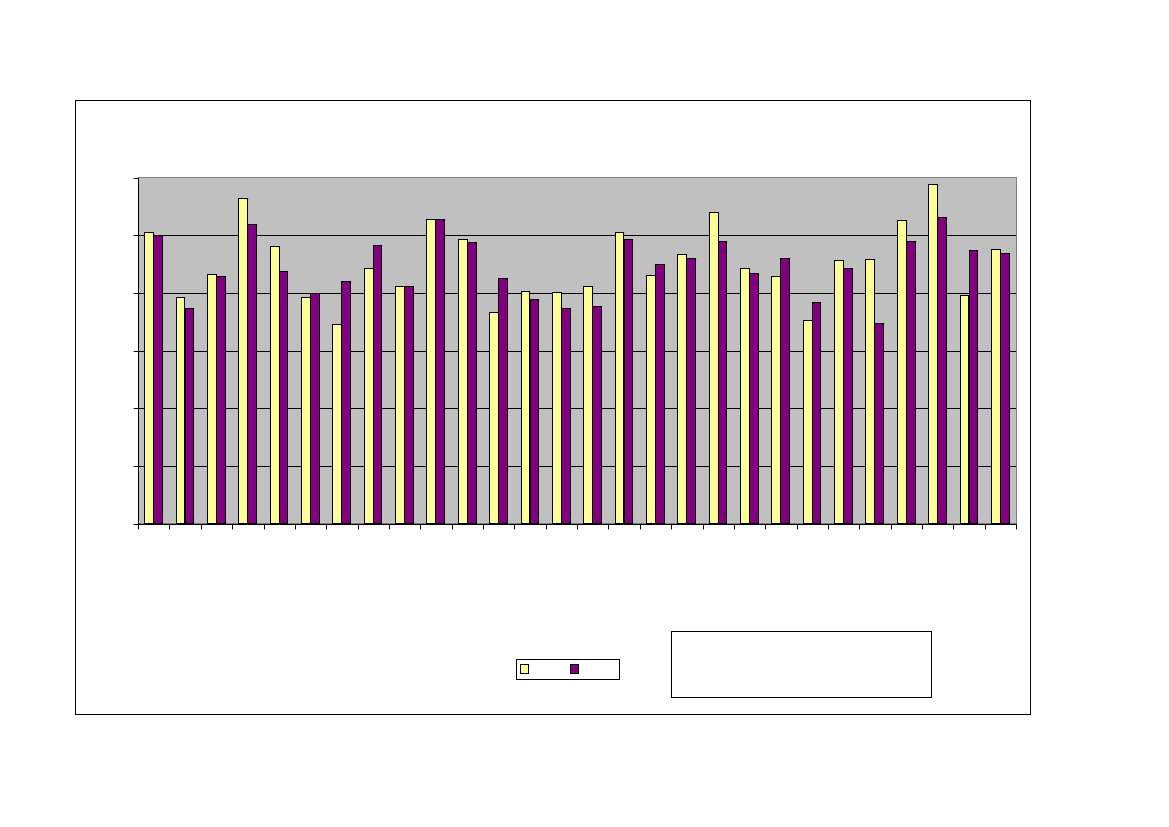
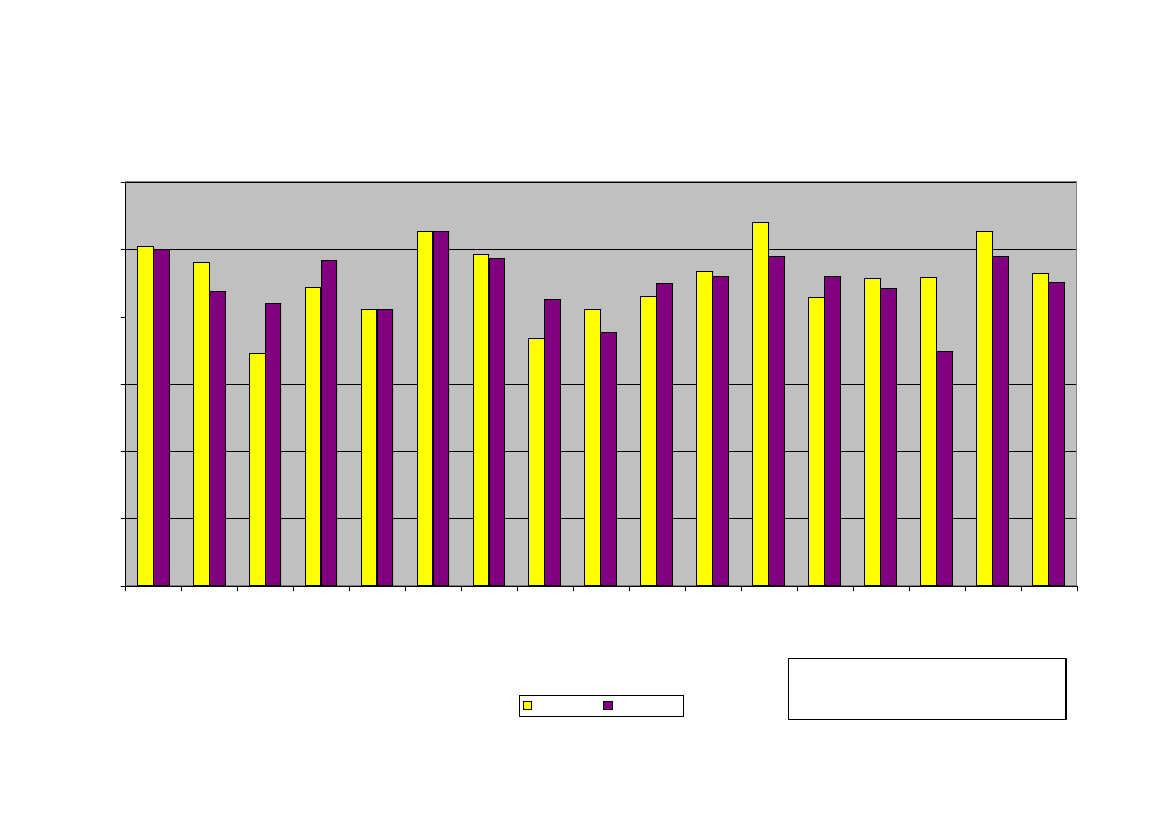
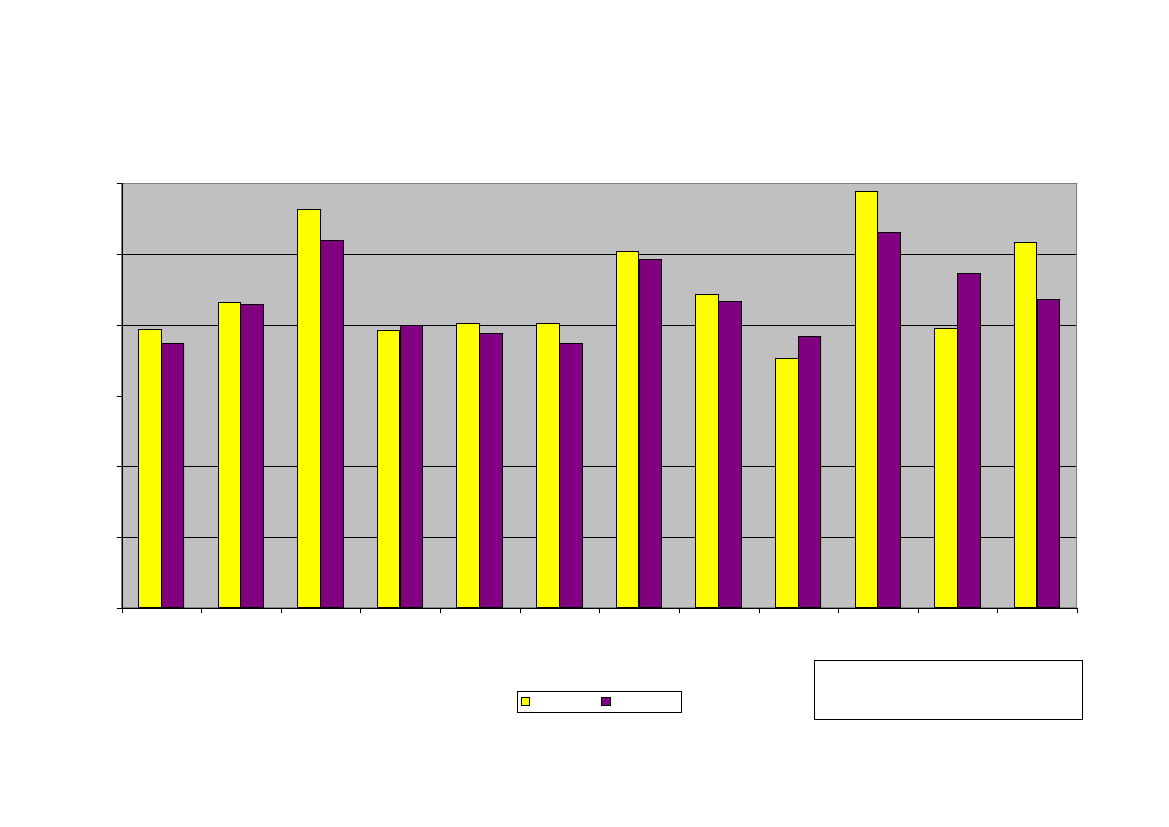
Foreword:This document contains information on EU and National budgets for the period 1998 - 2008.Tables 1 - 6present information on EU and National budgets in billions of Euro and as a per cent of GDP for EU-27,Eurozone and non-Eurozone countries.Charts 1 - 10show growth in EU and National budgets, and the difference between growth in National budgets and the EUbudget for EU-27, Eurozone and non-Eurozone countries.National budgets are defined as general government expenditure which covers central government, state government, localgovernment and social security funds. National budget and GDP figures are from Eurostat. Figures on the EU Budget areextracted from the Commission document "EU budget 2008 Financial report".Over the period 1998 - 2008 the EU budget grew by 41,19 per cent compared to a fall in the average of the budgets ofcountries that were Member States at the time of 12,04 per cent. Growth over the period in the average of countries in theEurozone of 9,67 per cent was more than offset by the fall in the average for non-Eurozone countries of 43,47 per cent.The budgets of 2 Eurozone countries: Austria (34,86%), Germany (16,33%), and 2 non-Eurozone countries: Denmark(38,17%), Sweden (30,98%) grew more slowly than the EU budget (41,19%). National budgets grew by more than 100% in 6Eurozone countries: Ireland (181,52%), Cyprus (117,88%), Luxembourg (109,03%), Greece (113,76%), Slovakia (146,97%)and Spain (102,71%) and 8 non-Eurozone countries: Latvia (271,62%), Estonia (226,98%), Romania (298,74%), the CzechRepublic (165,53%), Hungary (137,19%), Lithuania (198,91%), Bulgaria (184,26%) and Poland (130,44%).The EU budget as a percentage of EU GDP fell from 1,04% in 1998 to 0,92% in 2008. This compares to a decline in theaverage National budget as a percentage of GDP for EU Member States from 47,50% to 46,80%, in Eurozone countries theaverage fell from 46,45% to 45,04% and non-Eurozone from 51,53% to 43,58%. However there was an increase over theperiod in the following countries: Eurozone: Cyprus, Portugal, Ireland, Greece, Malta and non-Eurozone: Estonia, Romaniaand the United Kingdom.
Page 3 of 17
Table 1. EU and National budgets11998 - 2008; EU-27 (billions of Euro)CountryBelgiumBulgariaCzech RepublicDenmarkGermanyEstoniaIrelandGreeceSpainFranceItalyCyprusLatviaLithuaniaLuxembourgHungaryMaltaNetherlandsAustriaPolandPortugalRomaniaSloveniaSlovakiaFinlandSwedenUnited KingdomEU Budget23Average12
1998115,024,4823,9087,41937,641,9627,1454,07220,46692,84535,313,132,424,037,1021,911,46167,96102,2868,0445,3013,198,829,1361,18132,76512,97
1999119,725,0923,8590,57966,892,1530,8358,58231,20719,16543,063,372,854,117,7922,321,57177,73106,2667,2749,3813,249,639,2363,22141,27547,94
2000123,945,8325,7193,18930,402,2332,8464,41246,54744,25550,033,733,174,848,2724,051,73184,61108,1876,2952,7415,6410,0211,5063,87148,13625,68
2001127,606,1430,6297,121005,062,4338,8666,32262,98772,06599,594,123,225,008,6128,161,85203,06109,6592,9157,4316,3210,8010,4866,75139,51658,98
2002133,706,7037,05100,811030,842,7843,6170,61283,60815,14613,734,503,535,239,9636,281,94214,96111,5192,7059,9517,0211,3611,7070,22149,92701,44
2003140,957,1638,29103,801049,213,0446,3877,14300,64849,59645,255,303,475,4710,7936,652,11224,62115,0185,5663,0617,5911,9411,8373,00157,00692,60
2004143,737,8939,84107,511041,213,2949,9684,33327,02883,07664,305,454,006,0511,6840,252,05226,40125,7287,0567,0420,4612,4412,8176,27159,85760,03
2005158,108,6145,07109,471050,253,7654,6585,63349,38921,45688,315,954,636,9612,5744,422,14229,97122,00106,1871,0126,7013,0014,6278,99162,69807,76
2006154,529,2249,74112,841054,484,5060,4790,19377,88952,12723,396,376,128,0513,0946,712,24246,03127,19119,3571,9434,4913,8216,4581,34169,60856,50
2007162,1011,9854,18115,611060,655,4368,76100,46412,75991,20739,956,727,579,9513,5750,332,32258,83132,19131,2074,7044,9714,6718,8784,98173,86900,84
2008172,4312,7363,47120,771090,786,4176,41115,58446,911027,05766,137,358,9812,0514,8451,962,56273,55137,93156,7976,5652,5816,4222,5490,43173,89860,02
80,88246,63
83,49256,91
80,45265,14
80,56280,90
85,77294,00
89,38303,27
99,93197,65
104,00205,96
105,81214,60
112,45209,21
114,19216,93
Total general government expenditure, source: Eurostat.Total Community expenditure, source: EU budget 2008 Financial Report.3Average of countries that were EU Member States at the time.
Page 4 of 17
Table 2. EU and National budgets1in 1998 and 2008; Countries currently in Eurozone(billions of Euro)Country19982008 % increase over Difference betweenthe period 1998- growth in National and2008EU Budgets, per centpoints(c)(d)=(c-b)/b(e)=(d) - EU budget %increase
Table 3. EU and National budgets1in 1998 and 2008; Non-Eurozone countries(billions of Euro)Country19982008 % increase overthe period 1998-2008(c)(d)=(c-b)/b
Difference betweengrowth in Nationaland EU Budgets, percent points(e)=(d) - EU budget %increase
(a)
(b)
(a)
(b)
BelgiumGermanyIrelandGreeceSpainFranceItalyCyprusLuxembourgMaltaNetherlandsAustriaPortugalSloveniaSlovakiaFinlandAverage
115,02937,6427,1454,07220,46692,84535,313,137,101,46167,96102,2845,308,829,1361,18247,19
172,431090,7876,41115,58446,911027,05766,137,3514,842,56273,55137,9376,5616,4222,5490,43271,09
49,91%16,33%181,52%113,76%102,71%48,24%43,12%134,44%109,03%74,70%62,87%34,86%69,01%86,27%146,97%47,80%9,67%
8,71%-24,86%140,33%72,57%61,52%7,04%1,93%93,25%67,84%33,51%21,68%-6,33%27,82%45,07%105,78%6,61%-31,52%
BulgariaCzech RepublicDenmarkEstoniaLatviaLithuaniaHungaryPolandRomaniaSwedenUnited KingdomAverage
4,4823,9087,411,962,424,0321,9168,0413,19132,76512,97244,38
12,7363,47120,776,418,9812,0551,96156,7952,58173,89860,02138,15
184,26%165,53%38,17%226,98%271,62%198,91%137,19%130,44%298,74%30,98%67,66%-43,47%
143,07%124,33%-3,02%185,78%230,42%157,72%95,99%89,25%257,55%-10,21%26,46%-84,66%
1998
2008 % increase overthe period 1998-2008216,93-12,04%
Average of EU countries'national budgets2(billions ofEuro)EU Budget3(billions of Euro)12
246,63
80,88
114,19
41,19%
Total general government expenditure, source: Eurostat.Average of countries that were EU Member States at the time.3Total Community expenditure, source: EU budget 2008 Financial Report.
Page 5 of 17
Table 4. EU and National budgets as % of GDP at market prices11998 - 2008, EU-27CountryBelgiumBulgariaCzech RepublicDenmarkGermanyEstoniaIrelandGreeceSpainFranceItalyCyprusLatviaLithuaniaLuxembourgHungaryMaltaNetherlandsAustriaPolandPortugalRomaniaSloveniaSlovakiaFinlandSwedenUnited KingdomEU BudgetAverage212
199850,4039,3043,2056,3048,0039,2034,5044,3041,1052,7049,2036,7040,2040,1041,1050,4043,0046,7054,0044,3042,8035,2045,7045,8052,6058,8039,501,0447,5
199950,2041,8042,3055,5048,1040,1034,1044,4039,9052,6048,2036,8041,8039,9039,2048,4043,0046,0053,7042,7043,2039,2046,5048,1051,5058,6038,901,0247,0
200049,1042,6041,8053,7045,1036,1031,3046,7039,1051,6046,2037,0037,3039,1037,6046,9041,0044,2052,1041,1043,1038,5046,7052,2048,3055,6039,100,9245,4
200149,2040,3044,4054,2047,6034,8033,2045,3038,6051,6048,0038,2034,6036,8038,1047,3043,1045,4051,6043,8044,4036,0047,6044,5047,8055,5040,100,8946,4
200249,8040,3046,3054,6048,1035,8033,5045,1038,9052,6047,4040,2035,6034,7041,5051,2043,2046,2051,0044,2044,3035,0046,3045,0048,8056,7041,000,9146,8
200351,1040,3047,3055,1048,5034,8033,2044,7038,4053,3048,3045,0034,8033,2041,8049,4047,8047,1051,5044,6045,5033,5046,4040,1050,1057,0042,100,9447,5
200449,4039,7045,1054,6047,1034,0033,5045,4038,9053,2047,7042,8035,8033,3042,6048,7045,6046,1054,0042,6046,5033,5045,8037,6050,1055,6042,900,9546,9
200552,2039,3045,0052,8046,8033,6033,7043,8038,4053,4048,2043,6035,6033,3041,5050,1044,8044,8050,1043,4047,6033,5045,2038,0050,3055,2044,000,9547,0
200648,6036,5043,7051,7045,4034,0034,2042,9038,4052,7048,7043,4038,2033,6038,3052,0043,7045,5049,7043,9046,3035,3044,5036,9048,7054,1044,000,9246,4
200748,4041,5042,5051,0043,7034,8036,2044,4039,2052,3047,9042,2035,9034,8036,2049,8042,5045,5048,8042,2045,8036,0042,4034,4047,3052,5044,100,9245,7
200850,0037,3042,9051,9043,7039,9042,0048,3041,1052,7048,7042,6038,8037,4037,7049,2045,0045,9048,9043,3046,0038,4044,2034,8049,0053,0047,300,9246,8
Source: Eurostat.Average of countries that were EU Member States at the time.
Page 6 of 17
Table 5. EU and National budgets as % of GDPat market prices in 1998 and 2008, Countriescurrently in EurozoneCountryBelgiumGermanyIrelandGreeceSpainFranceItalyCyprusLuxembourgMaltaNetherlandsAustriaPortugalSloveniaSlovakiaFinlandAverage1998 in %50,4048,0034,5044,3041,1052,7049,2036,7041,1043,0046,7054,0042,8045,7045,8052,6046,45
1
Table 6. EU and National budgets as % ofGDP at market prices in 1998 and 2008, non-Eurozone countriesCountryBulgariaCzech RepublicDenmarkEstoniaLatviaLithuaniaHungaryPolandRomaniaSwedenUnited KingdomAverage1998 in %39,3043,2056,3039,2040,2040,1050,4044,3035,2058,8039,5051,53
1
2008 in %50,0043,7042,0048,3041,1052,7048,7042,6037,7045,0045,9048,9046,0044,2034,8049,0045,04
2008 in %37,3042,9051,9039,9038,8037,4049,2043,3038,4053,0047,3043,58
EU budget in relation to Community GDP1(billions of Euro)19982008 % increase overthe period 1998-2008Average EU countries nationalbudgets2(billions of Euro)Community GDP3(billions ofEuro)Average EU countries nationalbudgets2as % of GDPEU Budget4(billions of Euro)EU Budget as % of GDP12
246,63
216,93
-12,04%
7771,4147,50
12589,2546,80
61,99%-0,70
80,881,04%
114,190,91%
41,19%
Source: Eurostat.Average of countries that were EU Member States at the time.3GDP of countries that were EU Member States at the time.4Total Community expenditure, source: EU budget 2008 Financial Report.Page 7 of 17
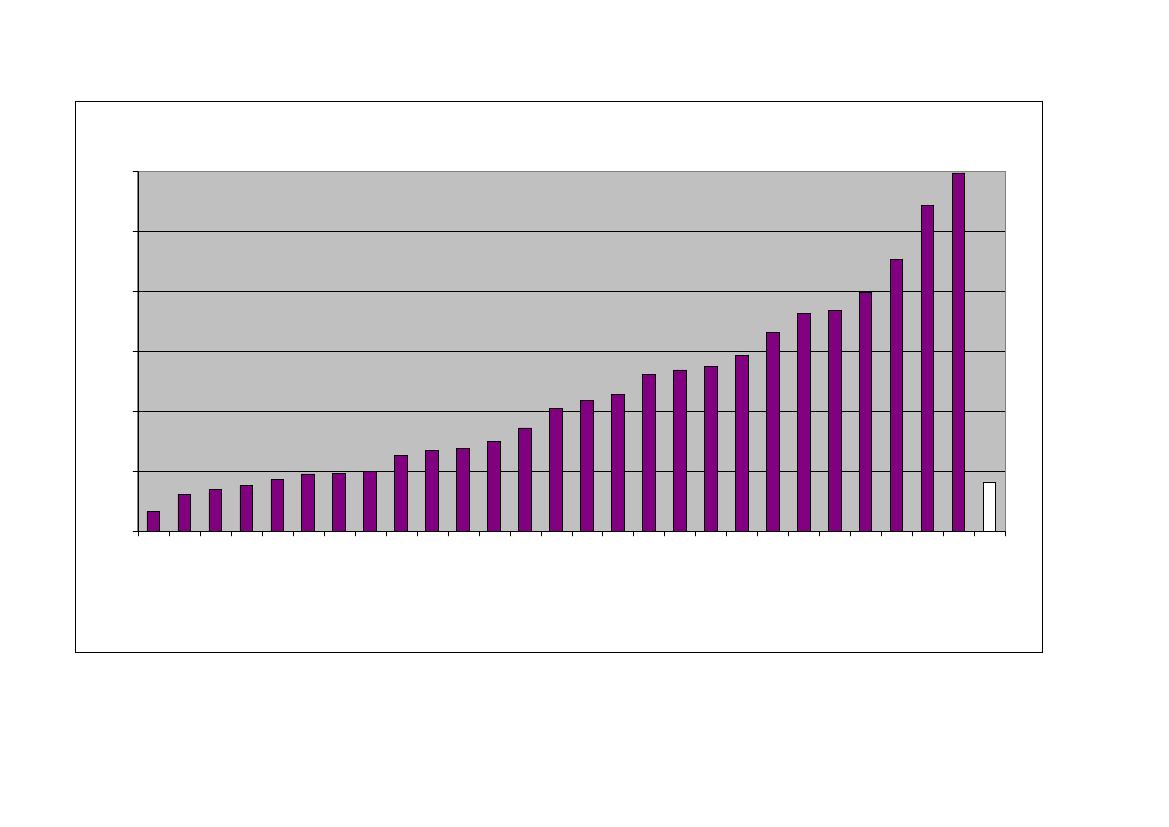
CountryincreaseGermany16,33%Sweden30,98%Austria34,86%Denmark38,17%Italy43,12%Finland47,80%France48,24%Belgium49,91%Netherlands
Chart 1. Growth in EU and National budgets between 1998 and 2008, EU-27 (per cent)
300%
UnitedKingdomPortugalMaltaSloveniaSpainLuxembourg
250%
62,87%67,66%69,01%74,70%86,27%102,71%109,03%113,76%130,44%134,44%137,19%146,97%165,53%181,52%184,26%198,91%226,98%271,62%298,74%41,19%-12,04%
200%
GreecePolandCyprusHungarySlovakiaCzechRepublicIrelandBulgariaLithuaniaEstoniaLatviaRomaniaEU BudgetAverage
150%
100%
50%
0%GermaSw nyedeAu nD striaenmarkItaFi lynlanFr danBe ceNlU eth giumnite erladKi ndsngdPo o mrtugaM lSl altaoveniLu S axe pam inbouG rgreecPo elanC dypH rusungaCze Slo rych vaR ki aepublIre iclaBu ndlgLi ariathuanEs iatoniaLaR tviaomEU anBu iadget
100%
150%
200%
250%
300%
ermaSw nyedeAu nsD triaenmarkItaFi lynlanFr danBe celNe t giuUni her mted lanKi dsngdoPo mrtugalMaSl ltaoveniaLu Spxe a im nbouG rgreecPo elanC dypH rusungCSl aryzech ovaR kiaepublIre iclaBu ndlgLi ariathuanEs iatoniaLaR tviaomania0%
-50%50%
G
Chart 2. Difference between growth in EU and National Budgets between 1998 and 2008, EU-27 (per centpoints)
Country% increase over the period 1998-2008(a)
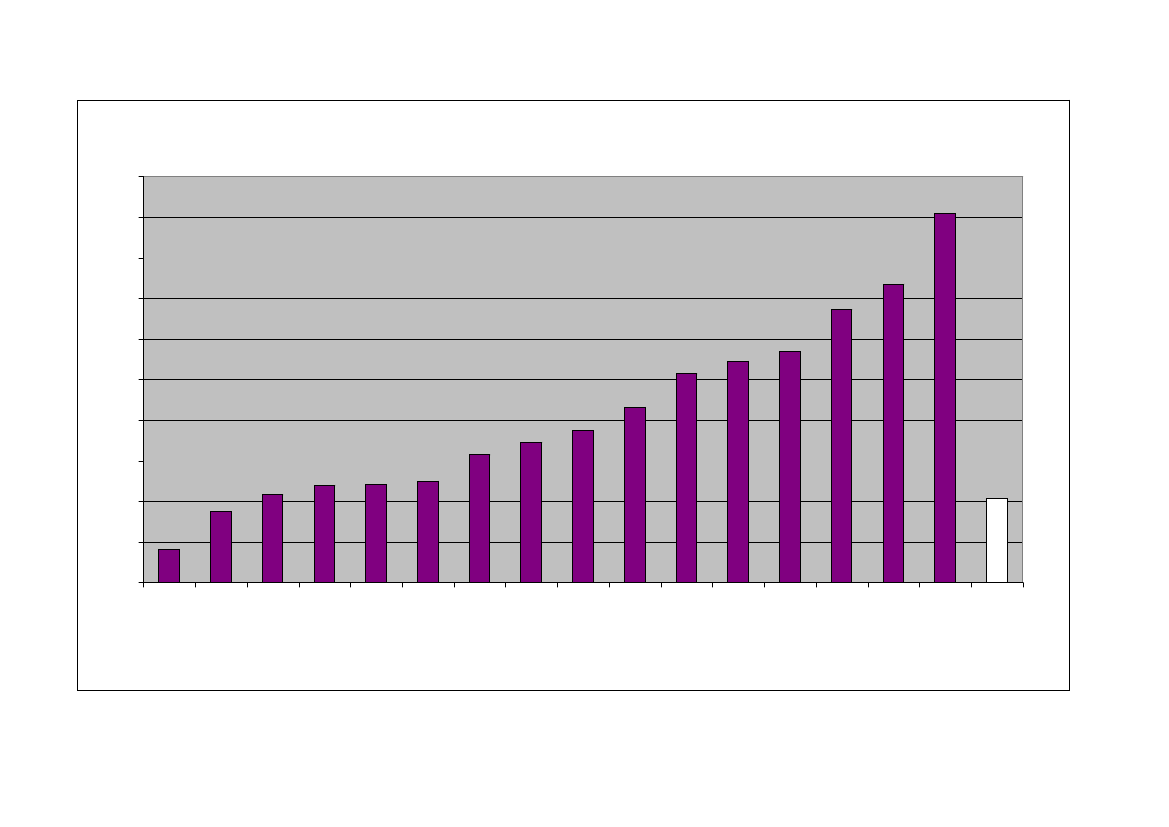
(d)=(c-b)/b16,33%34,86%43,12%47,80%48,24%49,91%62,87%69,01%74,70%86,27%102,71%
GermanyAustria200%ItalyFinlandFrance180%Belgium
Chart 3. Growth in EU and National budgets between 1998 and 2008, Eurozone countries (per cent)
160%NetherlandsPortugal
140%
MaltaSlovenia120%
Spain100%Luxembourg109,03%Greece80%113,76%Cyprus134,44%Slovakia
60%IrelandEU40%Budget
146,97%181,52%41,19%
20%0%ItalyFranceBelgiumNetherlandsPortugalCyprusSlovakiaIrelandEUBudgetanyaltabourgveniaSpainnlandGermGreeceAustriaM
Slo
Fi
Luxem
Chart 4. Difference between growth in EU and National budgets between 1998 and 2008, Eurozonecountries (per cent points)160%140%120%100%80%60%40%20%0%ItalyanySloveniaCyprusSlovakiaAustriaMaltaGreeceeSpainBelgiumNetherlandsPortugalFinlandGerm
-20%-40%
Franc
Luxem
Ireland
bourg
Country% increase over the period 1998-2008(d)=(c-b)/bChart 5. Growth in EU and National budgets between 1998 and 2008, Non-Eurozone countries (per cent)Sweden30,98%(a)
Denmark300%UnitedKingdom250%PolandHungary200%
38,17%
67,66%130,44%137,19%
CzechRepublic150%165,53%Bulgaria184,26%
Lithuani100%a198,91%Estonia226,98%Latvia271,62%50%Romania298,74%
Average0%EUBudget-43,47%Sweden Denmark41,19%
UnitedKingdom
Poland
Hungary
CzechBulgaria LithuaniaRepublic
Estonia
Latvia
Romania
EUBudget
CountryDifference between growth in National and EU Budgets, per cent points(e)=(d)Chart 6. Difference between- EU budget % increaseSweden-10,21%(a)
Denmark-3,02%
growth in EU and National budgets between 1998 and 2008, Non-Eurozonecountries (per cent points)
300%UnitedKingdomPoland250%HungaryCzech200%Republic124,33%26,46%89,25%95,99%
Bulgaria150%LithuaniaEstonia100%LatviaRomania50%143,07%157,72%185,78%230,42%257,55%
0%
Sweden-50%
Denmark
UnitedKingdom
Poland
Hungary
CzechRepublic
Bulgaria
Lithuania
Estonia
Latvia
Romania
Chart 7. EU Budget as % of GDP 1998-20081,10
1,05
1,00
0,95
0,90
0,85
0,80
1998
1999
2000
2001
2002
2003
2004
2005
2006
2007
2008
Table 4. EU and National budgets as % of GDP at market prices 1998 - 2008, EU-27CountryBelgiumBulgaria60,00Czech RepublicDenmarkGermany50,00EstoniaIrelandGreeceSpain40,00FranceItalyCyprusLatvia30,00LithuaniaLuxembourgHungaryMalta20,00NetherlandsAustriaPolandPortugal10,00RomaniaSloveniaSlovakiaFinland0,00SwedenUnited KingdomEU BudgetAverage12
1
Chart 8. National budgets as % of GDP at market prices in 1998 and 2008, EU-27199950,2041,8042,3055,5048,1040,1034,1044,4039,9052,6048,2036,8041,8039,9039,2048,4043,0046,0053,7042,7043,2039,2046,5048,1051,5058,6038,901,0247,0200049,1042,6041,8053,7045,1036,1031,3046,7039,1051,6046,2037,0037,3039,1037,6046,9041,0044,2052,1041,1043,1038,5046,7052,2048,3055,6039,100,9245,4200149,2040,3044,4054,2047,6034,8033,2045,3038,6051,6048,0038,2034,6036,8038,1047,3043,1045,4051,6043,8044,4036,0047,6044,5047,8055,5040,100,8946,4200249,8040,3046,3054,6048,1035,8033,5045,1038,9052,6047,4040,2035,6034,7041,5051,2043,2046,2051,0044,2044,3035,0046,3045,0048,8056,7041,000,9146,8200351,1040,3047,3055,1048,5034,8033,2044,7038,4053,3048,3045,0034,8033,2041,8049,4047,8047,1051,5044,6045,5033,5046,4040,1050,1057,0042,100,9447,5200449,4039,7045,1054,6047,1034,0033,5045,4038,9053,2047,7042,8035,8033,3042,6048,7045,6046,1054,0042,6046,5033,5045,8037,6050,1055,6042,900,9546,9200552,2039,3045,0052,8046,8033,6033,7043,8038,4053,4048,2043,6035,6033,3041,5050,1044,8044,8050,1043,4047,6033,5045,2038,0050,3055,2044,000,9547,0200648,6036,5043,7051,7045,4034,0034,2042,9038,4052,7048,7043,4038,2033,6038,3052,0043,7045,5049,7043,9046,3035,3044,5036,9048,7054,1044,000,9246,4200748,4041,5042,5051,0043,7034,8036,2044,4039,2052,3047,9042,2035,9034,8036,2049,8042,5045,5048,8042,2045,8036,0042,4034,4047,3052,5044,100,9245,7200850,0037,3042,9051,9043,7039,9042,0048,3041,1052,7048,7042,6038,8037,4037,7049,2045,0045,9048,9043,3046,0038,4044,2034,8049,0053,0047,300,9246,8
Source: Eurostat.Average of countries that were EU Member States at the time.
BelgCze B iumch ulgR ariep aD ublen icG mae r rkmaEs nytonIre ialaG ndreecSp eaFr inanceItC alyypruLa sL tvLu ithu iaxe anm iaboH urgungarNM yethe altrla anAu dsstPo riaPo landrR tugaom lSl aniov aSl eniov aakFi ianlUni S ante w dd edKi eng ndAv omerage19982008P.m.EU budget as % of EU GDP 1998: 1,04%.EU budget as % of EU GDP 2008: 0,92%
199850,4039,3043,2056,3048,0039,2034,5044,3041,1052,7049,2036,7040,2040,1041,1050,4043,0046,7054,0044,3042,8035,2045,7045,8052,6058,8039,501,0447,5
Chart 9. National budgets as % of GDP at market prices in 1998 and 2008, Eurozone countries60
50
40
30
20
10
0
BelgiumGermany
Cyprus
ly
altaNetherlands
Luxem
1998 in %
2008 in %
PortugalSloveniaSlovakiaFinlandAverageP.m.P.m.EU budget asas % of EU GDP 1998: 1,04%.EU budget % of EU GDP 1998: 1,04%.EU budget asas % of EU GDP 2008: 0,91%.EU budget % of EU GDP 2008: 0,92%
land
reece
Spain
France
bourg
G
Austri
Ita
Ire
M
a
Chart 10. National budgets as % of GDP at market prices in 1998 and 2008, Non-Eurozone countries60
50
40
30
20
10
0
Bulgaria
Czech DenmarkRepublic
Estonia
Latvia
Lithuania Hungary
Poland
Romania Sweden
United AverageKingdom
1998 in %
2008 in %
P.m.EU budget as % of EU GDP 1998: 1,04%.EU budget as % of EU GDP 2008: 0,92%.


